Embed Size (px)
Citation preview

COSTS AND BENEFITS OF SOOT-FREE ROAD TRANSPORT IN NIGERIAJoshua Miller
AUGUST 2019WHITE PAPER
BEIJING | BERLIN | BRUSSELS | SAN FRANCISCO | WASHINGTON
www.theicct.org

ACKNOWLEDGMENTS
This study was sponsored by the Climate and Clean Air Coalition to Reduce Short-Lived Climate Pollutants (CCAC) and its Initiative on Reducing Emissions from Heavy-Duty Vehicles and Fuels.
ABOUT THE CCACThe CCAC is a voluntary global partnership of governments, intergovernmental organizations, businesses, scientific institutions, and civil society organizations committed to catalyzing concrete, substantial action to reduce short-lived climate pollutants, including methane, black carbon, and many hydrofluorocarbons. The Coalition works through collaborative initiatives to raise awareness, mobilize resources, and lead transformative actions in key emitting sectors.
ABOUT THE CCAC HEAVY-DUTY VEHICLES INITIATIVEThe Coalition’s Heavy-Duty Vehicles and Fuels Initiative works to virtually eliminate fine particle and black carbon emissions from new and existing heavy-duty vehicles and engines. The Initiative supports its international partners to implement a sustained technology modernization pathway toward soot-free and low-carbon solutions.
We define “soot-free” technologies as those capable of meeting Euro 6/VI-equivalent standards and reducing exhaust emissions of black carbon up to 99% compared with uncontrolled levels. For resources on soot-free transport, please visit https://theicct.org/soot-free-transport-resources.
International Council on Clean Transportation 1500 K Street NW, Suite 650Washington, DC 20005 USA
[email protected] | www.theicct.org | @TheICCT
© 2019 International Council on Clean Transportation
ii
COSTS AND BENEFITS OF SOOT-FREE ROAD TRANSPORT IN NIGERIA
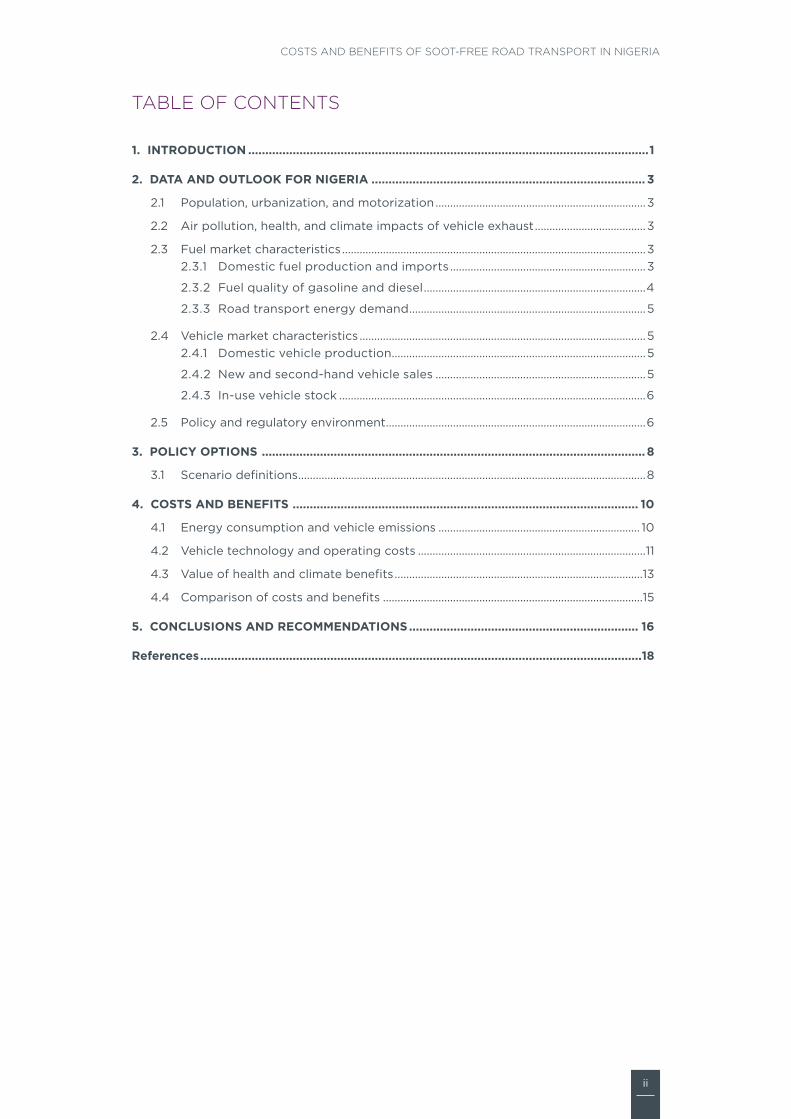
TABLE OF CONTENTS
1. INTRODUCTION .....................................................................................................................1
2. DATA AND OUTLOOK FOR NIGERIA ................................................................................ 3
2.1 Population, urbanization, and motorization ........................................................................3
2.2 Air pollution, health, and climate impacts of vehicle exhaust ......................................3
2.3 Fuel market characteristics ........................................................................................................32.3.1 Domestic fuel production and imports ...................................................................3
2.3.2 Fuel quality of gasoline and diesel ............................................................................4
2.3.3 Road transport energy demand .................................................................................5
2.4 Vehicle market characteristics ..................................................................................................52.4.1 Domestic vehicle production .......................................................................................5
2.4.2 New and second-hand vehicle sales ........................................................................5
2.4.3 In-use vehicle stock .........................................................................................................6
2.5 Policy and regulatory environment .........................................................................................6
3. POLICY OPTIONS ................................................................................................................8
3.1 Scenario definitions .......................................................................................................................8
4. COSTS AND BENEFITS ..................................................................................................... 10
4.1 Energy consumption and vehicle emissions ..................................................................... 10
4.2 Vehicle technology and operating costs ..............................................................................11
4.3 Value of health and climate benefits .....................................................................................13
4.4 Comparison of costs and benefits .........................................................................................15
5. CONCLUSIONS AND RECOMMENDATIONS ................................................................... 16
References .................................................................................................................................18
1
ICCT WHITE PAPER
1. INTRODUCTION
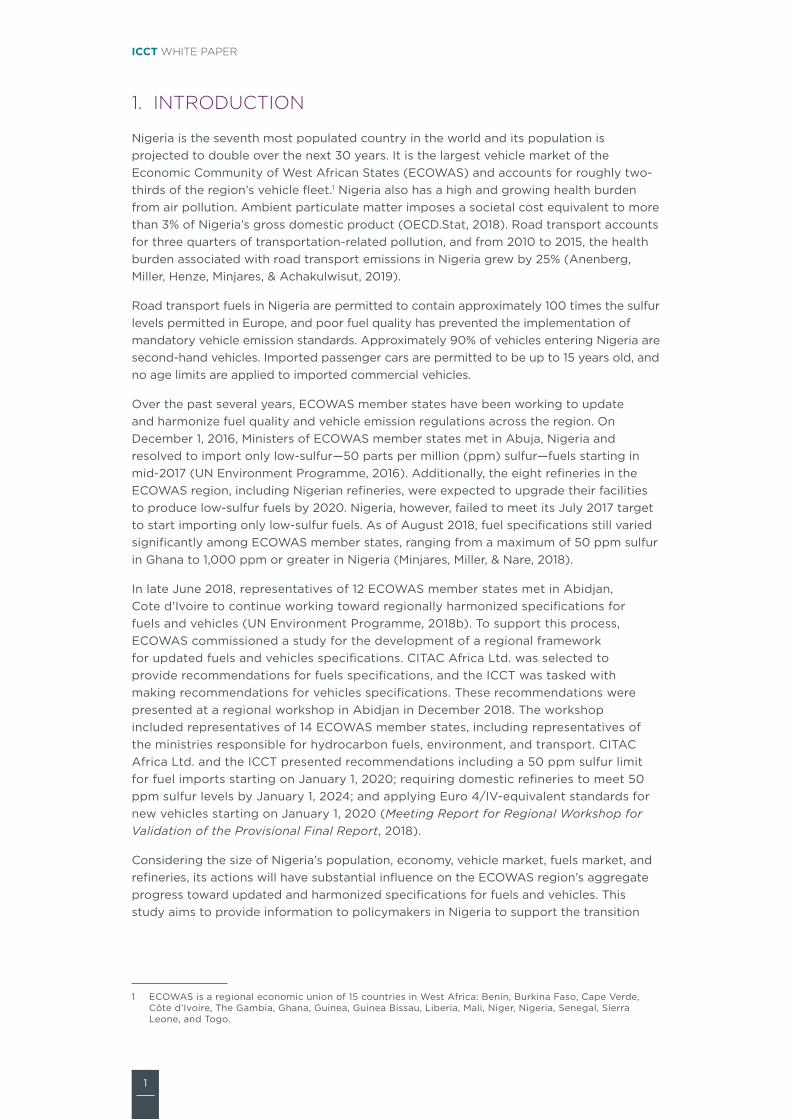
Nigeria is the seventh most populated country in the world and its population is projected to double over the next 30 years. It is the largest vehicle market of the Economic Community of West African States (ECOWAS) and accounts for roughly two-thirds of the region’s vehicle fleet.1 Nigeria also has a high and growing health burden from air pollution. Ambient particulate matter imposes a societal cost equivalent to more than 3% of Nigeria’s gross domestic product (OECD.Stat, 2018). Road transport accounts for three quarters of transportation-related pollution, and from 2010 to 2015, the health burden associated with road transport emissions in Nigeria grew by 25% (Anenberg, Miller, Henze, Minjares, & Achakulwisut, 2019).
Road transport fuels in Nigeria are permitted to contain approximately 100 times the sulfur levels permitted in Europe, and poor fuel quality has prevented the implementation of mandatory vehicle emission standards. Approximately 90% of vehicles entering Nigeria are second-hand vehicles. Imported passenger cars are permitted to be up to 15 years old, and no age limits are applied to imported commercial vehicles.
Over the past several years, ECOWAS member states have been working to update and harmonize fuel quality and vehicle emission regulations across the region. On December 1, 2016, Ministers of ECOWAS member states met in Abuja, Nigeria and resolved to import only low-sulfur—50 parts per million (ppm) sulfur—fuels starting in mid-2017 (UN Environment Programme, 2016). Additionally, the eight refineries in the ECOWAS region, including Nigerian refineries, were expected to upgrade their facilities to produce low-sulfur fuels by 2020. Nigeria, however, failed to meet its July 2017 target to start importing only low-sulfur fuels. As of August 2018, fuel specifications still varied significantly among ECOWAS member states, ranging from a maximum of 50 ppm sulfur in Ghana to 1,000 ppm or greater in Nigeria (Minjares, Miller, & Nare, 2018).
In late June 2018, representatives of 12 ECOWAS member states met in Abidjan, Cote d’Ivoire to continue working toward regionally harmonized specifications for fuels and vehicles (UN Environment Programme, 2018b). To support this process, ECOWAS commissioned a study for the development of a regional framework for updated fuels and vehicles specifications. CITAC Africa Ltd. was selected to provide recommendations for fuels specifications, and the ICCT was tasked with making recommendations for vehicles specifications. These recommendations were presented at a regional workshop in Abidjan in December 2018. The workshop included representatives of 14 ECOWAS member states, including representatives of the ministries responsible for hydrocarbon fuels, environment, and transport. CITAC Africa Ltd. and the ICCT presented recommendations including a 50 ppm sulfur limit for fuel imports starting on January 1, 2020; requiring domestic refineries to meet 50 ppm sulfur levels by January 1, 2024; and applying Euro 4/IV-equivalent standards for new vehicles starting on January 1, 2020 (Meeting Report for Regional Workshop for Validation of the Provisional Final Report, 2018).
Considering the size of Nigeria’s population, economy, vehicle market, fuels market, and refineries, its actions will have substantial influence on the ECOWAS region’s aggregate progress toward updated and harmonized specifications for fuels and vehicles. This study aims to provide information to policymakers in Nigeria to support the transition
1 ECOWAS is a regional economic union of 15 countries in West Africa: Benin, Burkina Faso, Cape Verde, Cote d’Ivoire, The Gambia, Ghana, Guinea, Guinea Bissau, Liberia, Mali, Niger, Nigeria, Senegal, Sierra Leone, and Togo.

2
COSTS AND BENEFITS OF SOOT-FREE ROAD TRANSPORT IN NIGERIA
to soot-free road transport and maximize the net societal benefits of this transition.2 It starts with a review of relevant data and trends related to Nigeria and then evaluates the costs and benefits of two different policy scenarios. Finally, it provides recommendations for a path forward, including considerations for implementation.
2 We define “soot-free” technologies as those capable of meeting Euro 6/VI-equivalent standards and reducing exhaust emissions of black carbon up to 99% compared with uncontrolled levels. For resources on soot-free transport, please visit https://theicct.org/soot-free-transport-resources.

3
ICCT WHITE PAPER
2. DATA AND OUTLOOK FOR NIGERIA
2.1 POPULATION, URBANIZATION, AND MOTORIZATIONMore than half of Nigeria’s people currently live in urban areas, and the urban population is growing at an estimated rate of 4.23% for 2015–2020, faster than the country’s total population growth of 2.6% in 2018 (The World Bank, 2019). Motorization rates in Nigeria are still relatively low at less than 60 vehicles per 1,000 population; this is approximately one-third the global average of 180 vehicles per 1,000 population (International Organization of Motor Vehicle Manufacturers, 2015; The World Bank, 2019). Future increases in motorization are expected to result from growing demand for freight transport, growing population, and rising per-capita incomes. Although not directly considered in this analysis, these factors are expected to drive the projected growth in road transport energy demand (see Section 2.3.3).
2.2 AIR POLLUTION, HEALTH, AND CLIMATE IMPACTS OF VEHICLE EXHAUST
Vehicle exhaust contributes to elevated levels of ambient fine particles (PM2.5) and ground-level ozone, among other pollutants. These have distinct and harmful effects on the health of exposed populations (The Institute for Health Metrics and Evaluation & Health Effects Institute, 2019). In 2015, three-quarters of premature deaths attributable to PM2.5 and ozone from transportation sources in the ECOWAS region were in Nigeria (Anenberg et al., 2019). Transportation-attributable health impacts in Nigeria in 2015 have been conservatively estimated at 1,500 premature deaths, 81,000 years of life lost per year, and $710 million (2015 U.S.$) in welfare costs, and these estimates represent a 25% increase in premature deaths from 2010 levels.3 Among transportation sources in 2015, on-road diesel vehicles were the leading contributor to health impacts in Nigeria (38%), followed by on-road non-diesel vehicles (37%), international shipping (19%), and non-road mobile sources (7%). The Organisation for Economic Co-operation and Development (2016) estimates the societal cost of ambient air pollution from all sources in Nigeria totaled $42 billion (2005 U.S.$) in 2015. Other estimates of the annual cost of air pollution in Nigeria range from $24 billion to $87 billion (2015 U.S.$).4
Transportation sources also emit black carbon (BC), a component of PM2.5 exhaust that is not only harmful to health, but also a potent short-lived climate pollutant. Simultaneously reducing short-lived climate pollutants and long-lived greenhouse gases is critical to achieving global climate goals (Shindell et al., 2017). Older technology diesel engines emit more than 90% of transportation-related BC globally (Minjares, Wagner, & Akbar, 2014), including engines in on-road vehicles, non-road equipment, and ships. The Climate and Clean Air Coalition’s Scientific Advisory Panel has set a target to reduce BC from all sources to 75% below 2010 levels by 2030 (Shindell et al., 2017). A global study conducted by the ICCT in 2018 found that this target is achievable for on-road diesel vehicles, provided all countries adopt filter-forcing Euro 6/VI-equivalent standards and apply them to new and second-hand vehicle sales no later than 2025 (Miller & Jin, 2018).
2.3 FUEL MARKET CHARACTERISTICS
2.3.1 Domestic fuel production and importsNigeria is a major producer and exporter of crude oil. The country produces approximately 2 million barrels of oil (bbl) per day (Central Intelligence Agency, n.d.)
3 The 95% confidence intervals reflecting uncertainty in the concentration-response functions are 500 to 3,100 premature deaths and 29,000 to 165,000 years of life lost. See Anenberg et al. (2019)
4 Based on the estimated number of premature deaths in Lelieveld et al. (2019) and the estimated value of a statistical life in Anenberg et al. (2019).

4
COSTS AND BENEFITS OF SOOT-FREE ROAD TRANSPORT IN NIGERIA
and has three crude oil refineries, all of which are state-owned by the Nigerian National Petroleum Corporation (NNPC; CITAC Africa Ltd., 2019). Although its refineries have a total nameplate capacity of 445,000 bbl/day, disruptions to production have resulted in refineries processing only a fraction of this capacity. Nigeria’s refined petroleum production totaled approximately 35,000 bbl/day in 2017, and this would have met a small fraction of its domestic consumption, which was 325,000 bbl/day in 2016 (Central Intelligence Agency, n.d.). While the NNPC aims to increase refined petroleum production to 60% of capacity by 2020, some analysts forecast that production will be closer to about 48% of capacity by 2020 (CITAC Africa Ltd., 2019). To close the current gap between production and consumption, Nigeria imports roughly $6 billion to $8 billion worth of refined petroleum products each year (Figure 1). Approximately 80% of Nigeria’s refined petroleum product imports are from Europe, and the remainder come from the United States, Asia, and other regions (Observatory of Economic Complexity [OEC], 2016). A new refinery is currently under construction in Nigeria and is expected to open sometime between 2020 and 2022 (De Beaupuy & Wallace, 2019). The refinery will have a much larger capacity than the existing refineries, 650,000 bbl/day, and will export about 35% of its product and deliver 65% to the local market.
0
1
2
3
4
5
6
7
8
9
10
2013 2014 2015 2016 2017
Val
ue o
f im
po
rts
(bill
ion
US$
)
Others
Asia
Africa
United States
Europe
Figure 1. Value of imports of refined petroleum products to Nigeria by exporting region from 2013–2017, in billions of U.S. dollars (OEC, 2016).
2.3.2 Fuel quality of gasoline and dieselSince 2006, the maximum fuel sulfur content in Nigeria has been limited to 1,000 ppm for gasoline and 3,000 ppm for diesel (George, 2018). In 2017, Nigeria issued national cleaner fuels specifications that would have limited gasoline sulfur to 150 ppm and diesel sulfur to 50 ppm (Africa Network for Environment & Economic Justice Nigeria, 2017); however, these standards were suspended in 2017 before taking effect (UN Environment Programme, 2018a). In December 2018, representatives of 14 ECOWAS member states, including Nigeria, met to review recommendations to implement 50 ppm sulfur limits for gasoline and diesel imports by January 1, 2020 and require domestic refineries to meet 50 ppm sulfur levels by January 1, 2024.

5
ICCT WHITE PAPER
2.3.3 Road transport energy demandA direct consumer subsidy system for gasoline was in place until it was replaced in 2016 with a price cap (CITAC Africa Ltd., 2019). Today, the NNPC sells imported gasoline at a loss relative to the international market price, a form of indirect subsidy. As a result, Nigeria’s vehicle market is dominated by demand for gasoline, which accounts for four-fifths of combined gasoline and diesel demand. From 2020 to 2040, Nigeria’s road transport energy demand is projected to grow at an annual rate of 3.8% for gasoline and 2.4% for diesel.
2.4 VEHICLE MARKET CHARACTERISTICS
2.4.1 Domestic vehicle productionIn the 1970s and 1980s, Nigeria’s federal government partnered with international automakers to establish six local vehicle plants with a combined production capacity of 149,000 vehicles per year (Deloitte, 2018). In the decades that followed, deteriorating economic and policy conditions led to a decline in local vehicle production. Estimates of domestic vehicle production in 2015 range from 1,000 passenger vehicles to 4,000 passenger and commercial vehicles combined; the lower estimate is equivalent to about 10%–15% of new vehicle sales (Deloitte, 2018).
2.4.2 New and second-hand vehicle salesFrom 2012 to 2014, approximately 50,000 new vehicles were sold in Nigeria annually. After an economic slowdown and the introduction of substantial duties on vehicle imports, new vehicle sales fell to less than 10,000 vehicles annually in 2017 (Figure 2). Low per-capita incomes, high interest rates, and high vehicle depreciation contribute to the demand for inexpensive second-hand vehicles (Deloitte, 2018). Second-hand vehicles are estimated to account for approximately 90% of vehicles entering Nigeria. The major originating countries of second-hand vehicles in the Nigerian market are estimated to be the United States, Japan, Germany, and Belgium. Legal imports of second-hand vehicles are restricted to shipping ports, including Premiere Port (Lagos), the Tin Can Island Port (Lagos), and the Onne Port in Rivers State (Minjares et al., 2018). The fixed number of legal ports of entry and that most second-hand vehicles originate from countries with well-established emission-control regimes implies that targeted efforts to verify and improve the emissions performance of second-hand vehicles are feasible. Nigeria’s Ministry of Transport already prohibits the import of second-hand passenger vehicles older than 15 years; however, the current lack of a comprehensive, nationwide vehicle registration system and smuggling and corruption activities pose a challenge to enforcement efforts. Estimates of total vehicle sales, including all new and second-hand vehicles, range from approximately 500,000 to 1,000,000 vehicles annually (Deloitte, 2018).

6
COSTS AND BENEFITS OF SOOT-FREE ROAD TRANSPORT IN NIGERIA
0
10,000
20,000
30,000
40,000
50,000
60,000
2005 2006 2007 2008 2009 2010 2011 2012 2013 2014 2015 2016 2017
New
veh
icle
sal
es
Passenger cars
Commercial vehicles
Figure 2. New vehicle sales in Nigeria from 2005–2017 (International Organization of Motor Vehicle Manufacturers, n.d.).
2.4.3 In-use vehicle stockEstimates of Nigeria’s in-use vehicle stock vary widely, from 1.6 million (BMI, 2015) to 11.76 million vehicles (Nigeria National Bureau of Statistics, 2018). Comparison of top-down fuel consumption data (International Energy Agency, 2017) with bottom-up fleet model estimates (Miller & Jin, 2018) produces an estimate of around 10.5 million vehicles operating on Nigeria’s roads in 2019. Consistent with projected increases in gasoline and diesel demand, from 2019 to 2030, Nigeria’s vehicle stock is projected to grow at an average rate of 3%–4% per year (Minjares et al., 2018). Other estimates of short-term stock growth rates are slightly higher, at 4.5%–5.5% per year (Deloitte, 2018).
2.5 POLICY AND REGULATORY ENVIRONMENTAuthority to regulate vehicle emissions, fuel quality, and used vehicle imports is divided among several different agencies in Nigeria. The National Environmental Standards and Regulations Enforcements Agency is the regulatory body responsible for vehicle emissions control. Mandatory, nationwide fuel-quality specifications are set by the Department of Petroleum Resources, and the Standards Organization of Nigeria is tasked with setting requirements for imported goods. The Ministry of Transport has authority to set age limits for second-hand vehicle imports. This distribution of regulatory authority across multiple agencies highlights the importance of inter-agency collaboration for planning, implementation, monitoring, and enforcement of current and future regulations. Recommendations for policy development and implementation in Nigeria, and in the broader ECOWAS region, are provided in Boxes 1 and 2.

7
ICCT WHITE PAPER
BOX 1. REGULATORY PATHWAYS FOR WEST AFRICA
Based on experiences with new vehicle regulations and used import restrictions in major markets, ECOWAS countries are advised to consider the following:
NEW VEHICLE REGULATIONSAll major vehicle markets apply mandatory new-vehicle emission standards as a core component of their motor vehicle emission control programs. In order to sell a new vehicle—defined as an individual vehicle, vehicle model, or engine family—manufacturers must first obtain certification that the vehicle meets all applicable requirements, e.g., maximum emissions limits, on-board diagnostics systems, durability, etc. In all major markets, the same emission standards apply regardless of whether the new vehicle is produced domestically or imported. Additionally, in the United States and Canada, any second-hand vehicle imports must be certified to the same standards that were in place domestically at the time of their manufacture.
USED IMPORT RESTRICTIONSThe vast majority of vehicles entering the ECOWAS region are second-hand vehicles. ECOWAS countries have the opportunity to discriminate from a vast global supply chain to allow only those vehicles with the cleanest emission control systems. The aim of vehicle emission standards in the region should be to deliver the maximum achievable reduction in emissions in the most cost-effective manner, limited only by fuel quality.

8
COSTS AND BENEFITS OF SOOT-FREE ROAD TRANSPORT IN NIGERIA
3. POLICY OPTIONS
Fuels and vehicles operate as a single system. Fuels specifications apply to numerous fuel properties, and among the most important for vehicle emissions performance are the content of sulfur, lead, manganese, and other metal additives. Modern vehicle emissions aftertreatment technologies such as diesel particulate filters (DPF) and gasoline particulate filters are designed to operate with low-sulfur fuel (< 50 ppm sulfur). Selective catalytic reduction systems (SCR), which are used for control of nitrogen oxides (NOx), are designed to operate with ultralow-sulfur fuel (< 10-15 ppm sulfur). In gasoline, the presence of metallic additives such as tetraethyl lead and manganese impedes the function of catalytic converters and undermines the effectiveness of investments in desulfurization needed for these emission control technologies to function properly (Minjares et al., 2018).
Countries usually introduce cleaner fuels either in conjunction with, or a few months before, cleaner vehicle standards. Table 1 shows the progression of fuel sulfur limits and corresponding vehicle emission standards in the European Union. Fuels limited to 50 ppm sulfur for gasoline and diesel permit the introduction of cleaner engine technologies with Euro 4/IV emission performance. Fuels limited to 10 ppm sulfur for gasoline and diesel permit the introduction of Euro 6 for light-duty vehicles, Euro VI for heavy-duty vehicles, and Euro 5 for two- and three-wheelers. The time between implementation of each standard was historically defined in Europe by the limitations of technology availability. Now that Euro 6/VI technologies are widely commercialized, countries like Nigeria can leapfrog to the most advanced vehicles standards, as long as fuel-quality standards are appropriately aligned.
Table 1. Timeline of fuel sulfur limits and equivalent vehicle emission standards in the European Union
Vehicle Standard
Fuel Standard
Fuel StandardEU Directive
Fuel Standard Implementation Date
Fuel Sulfur Limit (ppm)
Euro 1/I n/a — October 1994 2,000
Euro 2/II Euro 2 93/12/EEC October 1996 500 (diesel)
Euro 3/III Euro 3 93/12/EEC January 2000 350 (diesel); 150 (gasoline)
Euro 4/IV Euro 4 98/70/EC January 2005 50*
Euro 5/V Euro 5 2003/17/EC January 2009 10
Euro 6/VI Same sulfur limit as Euro 5 fuel standard
* 10 ppm fuel must be availableSource: TransportPolicy.net
3.1 SCENARIO DEFINITIONSWe evaluated the costs and benefits of updating fuels and vehicles standards in Nigeria for two different scenarios and compared them to a baseline without changes to current standards.
» Baseline: Counterfactual scenario that assumes continuation of 3,000 ppm sulfur diesel and 1,000 ppm sulfur gasoline, a 15-year age limit for second-hand passenger car imports, and no mandatory vehicle emission standards.5
» Euro 4/IV: Reflects recommendations put forward by CITAC Africa Ltd. and the ICCT to ECOWAS member state representatives in December 2018. This scenario includes 50 ppm sulfur limits for fuel imports by 2020 and for domestic refineries
5 Euro 3 standards for light-duty vehicles have been adopted but not implemented due to high fuel sulfur levels.

9
ICCT WHITE PAPER
by 2024, and Euro 4/IV standards for all new and second-hand vehicle sales in 2020. Assumes unleaded gasoline and a limit of 2 milligram (mg)/liter for metallic additives including manganese.
» Euro 6/VI: Assumes that after implementing 50 ppm fuels and Euro 4/IV, Nigeria implements a limit of 10 ppm sulfur in gasoline and diesel by 2025; this is in combination with Euro 6/VI standards for all new and second-hand light-duty and heavy-duty vehicles, and Euro 5 standards for two- and three-wheelers. Assumes unleaded gasoline and a limit of 2 mg/liter for metallic additives.

10
COSTS AND BENEFITS OF SOOT-FREE ROAD TRANSPORT IN NIGERIA
4. COSTS AND BENEFITS
4.1 ENERGY CONSUMPTION AND VEHICLE EMISSIONSRoad transport energy consumption in Nigeria is projected to increase by a factor of 2.3 for diesel and 3.2 for gasoline from 2020 to 2050 (Figure 3), and this is the context for all three scenarios. In the Baseline scenario, absent improvements to fuel quality and vehicle emission controls, vehicle exhaust emissions of PM2.5, BC, NOx, sulfur dioxide (SO2), and other pollutants are, unsurprisingly, projected to increase to a similar extent. In the Euro 4/IV scenario, the introduction of 50 ppm sulfur limits for imports and domestic production would reduce SO2 emissions by greater than 95%, corresponding to the reduction in fuel sulfur content. Additionally, the introduction of Euro 4/IV emission standards for new and used vehicles in 2020 would reduce emissions of PM2.5, BC, and NOx by 80%–90% compared with the Baseline scenario in 2050, with the exception of NOx from diesel vehicles, which would be reduced by approximately 50%.
In the Euro 6/VI scenario, further reduction of fuel sulfur content to a maximum of 10 ppm would nearly eliminate SO2 emissions. Introduction of Euro 6/VI emission standards for new and used vehicles and Euro 5 standards for two- and three-wheelers in 2025 would further reduce PM2.5 and BC by approximately 80% compared with the Euro 4/IV scenario in 2050. The difference between the Euro 4/IV and Euro 6/VI scenarios is most apparent for diesel NOx emissions: In the Euro 4/IV scenario, diesel NOx emissions are greater in 2050 than in 2019, whereas in the Euro 6/VI scenario, diesel NOx emissions are one quarter of 2019 levels in 2050.
Diesel Gasoline
2020 2030 2040 2050Year
2020 2030 2040 2050Year
Energy
PM2.5
BC
NOX
SO2
0
1,000
2,000
0
10
20
30
0
10
20
0200
400
600
800
0
50
153345
623
2,008
14
15
31
42
9
29
9
04
20
14
1 111
169
44188
369
84
261
805
45
120
0
46
4
28
1
90
ScenarioBaselineEuro 4/IVEuro 6/VI
Figure 3. Road transport energy consumption and exhaust emissions by fuel type and scenario, 2019–2050. Energy units are petajoules (1 petajoule [PJ] = 10^15 joules and 1 million tonnes of oil equivalent = 42 PJ). Emissions units are thousand metric tons per year. Data labels are shown for calendar years 2019 and 2050.

11
ICCT WHITE PAPER
4.2 VEHICLE TECHNOLOGY AND OPERATING COSTSThe introduction of new vehicle emission standards compels new vehicle manufacturers to utilize commercially available emission control technologies to comply with the standards. The incremental costs of these new vehicle technologies, such as SCR systems for NOx control and DPFs for particulate matter control, are shown in Figure 4.
The implementation of cleaner fuels specifications would compel a combination of cleaner fuels imports and upgrades to Nigeria’s domestic refineries. The incremental costs of importing or refining cleaner fuels are estimated to be 2.1 U.S. cents (¢) per liter for 50 ppm gasoline, 1¢/liter for 50 ppm diesel (CITAC Africa Ltd., 2019), and 2.9¢/liter for 10 ppm gasoline and diesel (MathPro, 2015).
The incremental costs of diesel exhaust fluid for Euro IV–VI diesel vehicles with SCR systems and filter maintenance for Euro 6/VI diesel vehicles with DPFs were also evaluated. These costs are relatively small compared with the incremental costs of new vehicle technologies and cleaner fuels (Miller & Façanha, 2016).
0
1000
2000
3000
4000
5000
6000
Diesel Gasoline Diesel Gasoline Gasoline
HDV HDV LDV LDV MC
Euro 1 Euro 2 Euro 3 Euro 4 Euro 5 Euro 6 Euro 6d
Figure 4. Estimated technology costs for new vehicles by emission standard. These costs are based on three ICCT studies (Sanchez, Bandivadekar, & German, 2012; Posada, Chambliss, & Blumberg, 2016; and Miller & Minjares, 2013) and have been adjusted to account for differences in average vehicle engine sizes and recent changes in the prices of platinum group metals.
Figure 5 shows how the estimated costs of the Euro 4/IV and Euro 6/VI scenarios compare with the Baseline scenario. Incremental technology costs are a combination of the estimated costs of new vehicle emission control technologies and projected new vehicle sales.6 Incremental operating costs include the costs of cleaner fuels, diesel exhaust fluid, and filter maintenance. The values in Figure 5 are not discounted, in order to isolate the effects of growth in new vehicle sales and fuel consumption on incremental technology and operating costs. For the comparison of cumulative costs and benefits over time in Section 4.4, below, costs are discounted to present value terms using a 7% social discount rate (Minjares et al., 2014; U.S. Environmental Protection Agency, 2010).7
In the Euro 4/IV scenario, incremental vehicle technology costs in Nigeria are estimated to be approximately $107 million in 2020. Undiscounted vehicle technology costs are
6 Because second-hand imported vehicles are already heavily depreciated, the incremental costs to consumers may be positive, negative, or negligible.
7 A 7% real discount rate is chosen to approximate the social discount rate in developing economies. It is by design lower than market interest rates, which include inflation, risk premiums, and taxation effects.
12
COSTS AND BENEFITS OF SOOT-FREE ROAD TRANSPORT IN NIGERIA
projected to grow in subsequent years in line with projected growth in new vehicle sales. Incremental operating costs, primarily to import cleaner fuels, are estimated to be roughly $356 million in Nigeria in 2020, assuming fuel imports meet approximately 90% of demand. The stepwise increase in 2024 reflects the estimated incremental costs incurred by domestic refineries to produce 50 ppm fuels (MathPro, 2015).8
In the Euro 6/VI scenario, incremental vehicle technology costs would be approximately one-third greater in 2025 than in the Euro 4/IV scenario. Estimated incremental operating costs likewise increase starting in 2025 with the introduction of 10 ppm sulfur fuels.
8 These costs reflect the amortized per-liter costs to produce cleaner fuels, including any capital charges for refinery investments, operational costs to replace lost product yield, and any costs to replace lost gasoline octane.

13
ICCT WHITE PAPER
2020
2022
2024
2026
2028
2030
2032
2034
2036
2038
204
020
42
204
420
46
204
8
0
500
1000
1500
2000
Incr
emen
tal t
echn
olo
gy
cost
s (m
illio
n U
.S.$
)
2020
2022
2024
2026
2028
2030
2032
2034
2036
2038
204
020
42
204
420
46
204
8
0
500
1000
1500
2000
Incr
emen
tal o
per
atin
g c
ost
s (m
illio
n U
.S.)
ScenarioBaselineEuro 4/IVEuro 6/VI
Incremental Operating CostsIncremental Technology Costs
Figure 5. Incremental vehicle technology and operating costs compared with the Baseline scenario, 2020–2050. Values are in 2019 U.S.$ and are not discounted (see section 4.4 for discounted results).
4.3 VALUE OF HEALTH AND CLIMATE BENEFITSThe social costs of vehicle emissions and the benefits of emission reductions are evaluated using the economic valuation framework given in Shindell (2015). This framework considers pollutant-specific and time-dependent damages associated with emissions, including direct climate and health impacts, climate-related health damages, and the effects of ozone on reduced agricultural productivity. A limitation of this approach is that it does not account for conditions specific to Nigeria, such as the location of emissions, their proximity to population, population age distribution, projected population growth, urbanization, baseline disease rates, and meteorology. Further research efforts could improve the characterization of societal costs by explicitly accounting for these factors. Nevertheless, when taken in context with the consistent conclusions of more-detailed studies conducted in other countries, the results of this analysis can contribute to understanding the societal implications of transitioning to cleaner fuels and vehicles in Nigeria.
The global mean values for each pollutant from Shindell (2015) were adjusted to account for lower per-capita incomes in Nigeria.9 The social costs of vehicle emissions are the product of the cost-per-tonne values for pollutants, estimated emissions, and discount factors. For consistency with the calculation methods for these cost-per-tonne values in Shindell (2015), we apply a 5% social discount rate to convert these climate, health, and agricultural damages to present value terms. The values shown in Figure 6 are not discounted, so as to show the trends over time as opposed to their present discounted value. The lines show the central damage estimates, whereas the shaded areas correspond to uncertainty estimates.10
9 Specifically, the cost-per-tonne values for the 5% discount rate scenario in Table S2 were converted from 2007$ to 2019$ (factor = 1.24), adjusted to U.S.-specific values (factor = 1.15, using the mean value of the 10%–20% range cited for U.S.-specific values), and then adjusted to Nigeria using the ratio of per-capita incomes in Nigeria and the United States (factor = 0.1). Year-specific values were interpolated using the 2010, 2030, and 2050 estimates.
10 5th and 95th percentile estimates for years after 2010 apply the proportional range of uncertainty in Table S4 in Shindell (2015).

14
COSTS AND BENEFITS OF SOOT-FREE ROAD TRANSPORT IN NIGERIA
According to this approach, the social costs of 2019 vehicle emissions in Nigeria are estimated to be approximately $5.6 billion ($2.5 billion–$9.3 billion).11 Compared with the Baseline scenario, the Euro 4/IV scenario would reduce the societal damages of 2050 emissions by approximately 78%. The Euro 6/VI scenario would reduce the damages of 2050 emissions by 93% compared with the Baseline scenario, and by two-thirds compared with the Euro 4/IV scenario.
11 These estimates are higher than the results of a 2019 study which applied Global Burden of Disease (GBD) 2017 methods to evaluate direct health damages of vehicle emissions in 2010 and 2015. The estimates derived from Shindell (2015) are higher partly due to the inclusion of climate damages and climate-related health damages, the use of a global average population for evaluating health effects, and the use of GBD 2010 methods. GBD 2017 methods likely still undercount the health effects of ambient air pollution, particularly for countries with high pollutant exposures such as Nigeria. For further discussion, see section 4 of Anenberg et al. (2019).

15
ICCT WHITE PAPER
2020
2023
2026
2029
2032
2035
2038
204
1
204
4
204
720
50
0
5
10
15
20
25
Soci
al c
ost
of
vehi
cle
emis
sio
ns (
bill
ion
U.S
.$)
2020
2023
2026
2029
2032
2035
2038
204
1
204
4
204
720
50
0
5
10
15
20
25
Soci
al c
ost
of
vehi
cle
emis
sio
ns (
bill
ion
U.S
.$)
2020
2023
2026
2029
2032
2035
2038
204
1
204
4
204
720
50
0
5
10
15
20
25
Soci
al c
ost
of
vehi
cle
emis
sio
ns (
bill
ion
U.S
.$)
Baseline Euro 4/IV Euro 6/VI
Figure 6. Social cost of vehicle emissions in Nigeria, 2020–2050. Lines indicate central estimates. Shaded areas indicate 5th and 95th percentile values. Values are in 2019 U.S.$ and are not discounted (see the next section for discounted results).
4.4 COMPARISON OF COSTS AND BENEFITSThe cumulative present discounted costs and benefits of the Euro 4/IV and Euro 6/VI scenarios from 2020 to 2050 are compared with the Baseline scenario in Table 2. For each dollar invested in cleaner vehicles and fuels, the Euro 4/IV scenario would yield an estimated 10.1 U.S. dollars ($) ($4.4–$16.7) in societal benefits. Over the period from 2020 to 2050, the Euro 4/IV scenario would yield net societal benefits of $91.9 billion. The Euro 6/VI scenario would yield even greater net societal benefits of $101.9 billion, equivalent to $7.9 in benefits for each $1 invested. Compared with the Euro 4/IV scenario, the Euro 6/VI scenario would incur higher costs, $4.7 billion, but it would also yield higher benefits, $14.7 billion. Compared with the Euro 4/IV scenario, the marginal net benefits of the Euro 6/VI scenario are $10 billion ($1.6 billion–$19.9 billion), equivalent to a marginal benefit-cost ratio of 3.1. The Euro 6/VI scenario is preferred because it produces consistently higher net benefits than the Euro 4/IV scenario. This conclusion is consistent for the central, 5th percentile, and 95th percentile estimates.
Table 2. Present discounted value of costs and benefits from 2020 to 2050 compared with the Baseline scenario, in billion U.S.$. Parentheses indicate 5th and 95th percentile estimates.
Variable Euro 4/IV Euro 6/VI
Incremental Technology Costs 2.1 2.6
Incremental Operating Costs 8.0 12.1
Total Incremental Costs 10.1 14.8
Societal Benefits 102 (44.9, 169.3) 116.7 (51.2, 193.9)
Net Benefits 91.9 (34.8, 159.2) 101.9 (36.4, 179.1)
Benefit-Cost Ratio 10.1 (4.4, 16.7) 7.9 (3.5, 13.1)
Note: Incremental technology and operating costs are discounted using a rate of 7%; societal benefits are discounted using a rate of 5%. For details, see Section 4.2 and Section 4.3.

16
COSTS AND BENEFITS OF SOOT-FREE ROAD TRANSPORT IN NIGERIA
5. CONCLUSIONS AND RECOMMENDATIONS
This study evaluated the costs and benefits of two scenarios for transitioning to cleaner fuels and vehicles in Nigeria. We estimated that annual vehicle emissions in Nigeria impose a substantial societal cost, $5.6 billion, roughly equivalent to the cost of Nigeria’s annual petroleum product imports, $6 billion–$8 billion. Absent the introduction of cleaner fuels and vehicles, vehicle emissions in Nigeria are likely to increase in line with growing motorization and freight activity. From 2010 to 2015, the health impacts of vehicle emissions in Nigeria are estimated to have increased 25%, driven largely by population growth. Therefore, over the next several decades, the societal costs of vehicle emissions are likely to continue to increase as a result of population growth, urbanization, an aging population, and other factors.
Fortunately, Nigeria can take advantage of readily available technologies to cost-effectively reduce vehicle emissions. This analysis demonstrates the importance and cost-effectiveness of requiring 50 ppm sulfur fuel imports by 2020 and domestic production of these fuels no later than 2024, in conjunction with Euro 4/IV standards applied to all new and second-hand vehicle sales. Since second-hand vehicles account for approximately 90% of vehicles imported to Nigeria, these benefits can only be achieved by applying the same emissions performance standards to second-hand vehicles as well as new vehicles.
The analysis also demonstrates that Euro 4/IV and 50 ppm sulfur fuels should only be an intermediate step on the path to Euro 6/VI standards and 10 ppm sulfur fuels. Considering the importance of steep BC mitigation to meet global climate goals and the air quality benefits these controls will deliver (Shindell et al., 2017), we recommend that Nigeria transition to Euro 6/VI vehicles and fuels specifications no later than 2025, in line with the pathway identified to meet that target (Miller & Jin, 2018). We also recommend including these actions in Nigeria’s Nationally Determined Contribution (Minjares, 2018), since they would yield climate benefits internationally in addition to local climate and health benefits. These actions would also contribute to meeting Sustainable Development Goals 3.2, 3.9, 7.a, and 11.6.12
12 These Sustainable Development Goals are: 3.2: Reducing infant mortality from exposure to ambient PM2.5; 3.9: Reducing premature deaths from air pollution; 7.a: Expanding access to advanced and cleaner fossil-fuel technology; 11.6: Reducing adverse per capita impacts on air pollution in cities.

17
ICCT WHITE PAPER
BOX 2. IMPLEMENTATION STRATEGIES FOR CLEANER VEHICLES AND FUELS
After enacting vehicles and fuels policies, Nigeria and other ECOWAS member states should consider adopting supporting procedures:
EMISSION CONTROLS ON NEWLY REGISTERED VEHICLES » A type-approval certificate provided by the vehicle importer and drawn from the
original vehicle manufacturer, or produced directly by the vehicle manufacturer, would demonstrate compliance with emission standards at the time of production.
» A vehicle without evidence of type approval should undergo an emissions test procedure at the expense of the vehicle importer to demonstrate emissions performance equivalent to the established emission requirements.
» A screening procedure should apply to all previously used vehicles consisting of an on-board diagnostics check and visual inspection to ensure no malfunction of the vehicle.
» Information (such as that contained in the vehicle identification number) indicating where the vehicle was built, the manufacturer, the vehicle brand, engine, and size, and the model year of the vehicle should be provided by the vehicle importer or vehicle manufacturer.
REGIONAL COMPLIANCE AND ENFORCEMENT » Implement a common set of vehicle registration and reporting guidelines to be
defined by ECOWAS for tracking vehicles entering the ECOWAS region.
» Guarantee access to fuel that meets the proposed fuel specifications at the retail pump.
» Require any vehicle importers or producers in the region to demonstrate compliance with emission standards, in accordance with licensing guidelines to be prepared by ECOWAS.
» Establish, with the support of ECOWAS, certain enforcement procedures whereby vehicle importers are subject to penalties and revocation of their license upon violations of vehicle emission control regulations.
» Establish, with the support of ECOWAS, a system of independent vehicle testing at ports of entry to conduct random audits of vehicles for compliance with emission standards.
COMPLEMENTARY ACTIONS TO ACCELERATE EMISSION REDUCTIONS » Establish remote sensing programs to screen for high emitters.
» Create scrappage, inspection, and maintenance programs to either repair vehicles or de-register them, including payment of residual value to the vehicle owner, subject to funding availability.

18
COSTS AND BENEFITS OF SOOT-FREE ROAD TRANSPORT IN NIGERIA
REFERENCES
Africa Network for Environment & Economic Justice Nigeria. (2017). SON releases new industrial standards on petroleum products. Retrieved from http://www.aneej.org/son-releases-new-industrial-standards-petroleum-products/
Anenberg, S., Miller, J., Henze, D., Minjares, R., & Achakulwisut, P. (2019). The global burden of transportation tailpipe emissions on air pollution-related mortality in 2010 and 2015. Environmental Research Letters. Advance online publication. doi:10.1088/1748-9326/ab35fc
Beaupuy, F., & Wallace, P. (2019, January 21). Nigeria’s $15 billion oil refinery is on track, Dangote says. Bloomberg.com. Retrieved from https://www.bloomberg.com/news/articles/2019-01-21/dangote-says-on-schedule-to-finish-nigeria-oil-refinery-in-2020
BMI. (2015). Nigeria autos report: Q4 2015. London: BMI Research.
CITAC Africa Ltd. (2019). Study for the development of a regional framework for the harmonization of fuel grade and vehicle emission standards in the ECOWAS region.
Central Intelligence Agency. (n.d.). Africa: Nigeria. Retrieved from https://www.cia.gov/library/publications/the-world-factbook/geos/ni.html
Deloitte. (2018). Deloitte Africa automotive insights. Navigating the African automotive sector: Ethiopia, Kenya and Nigeria. Retrieved from https://www2.deloitte.com/content/dam/Deloitte/za/Documents/manufacturing/za_Africa-Auto-2016-Report-28-May-2018.pdf
George, L. (2018, March 13). Nigeria to cut sulfur in fuels a year after U.N. deadline. Reuters. Retrieved from https://www.reuters.com/article/us-nigeria-fuels-sulphur-idUSKCN1GP1HQ
International Energy Agency. (2017). World energy balances 2017. Retrieved from https://doi.org/10.1787/world_energy_bal-2017-en
International Organization of Motor Vehicle Manufacturers. (2015). Motorization rate 2015–worldwide. Retrieved from http://www.oica.net/category/vehicles-in-use/
International Organization of Motor Vehicle Manufacturers. (n.d.). 2005–2017 sales statistics. Retrieved from http://www.oica.net/category/sales-statistics/
Lelieveld, J., Klingmüller, K., Pozzer, A., Burnett, R. T., Haines, A., & Ramanathan, V. (2019). Effects of fossil fuel and total anthropogenic emission removal on public health and climate. Proceedings of the National Academy of Sciences, 116(15), 7192–7197. doi:10.1073/pnas.1819989116
Malins, C., Dumitrescu, E., Kodjak, D., de Jong, R., Galarza, S., Akumu, J., Chambliss, S., Ruiz-Stannah, V., Minjares, R., Fabian, B. (2016). A global strategy to introduce low-sulfur fuels and cleaner diesel vehicles. Consulting report by The International Council on Clean Transportation and the United Nations Environment Programme. Retrieved from https://ccacoalition.org/sites/default/files/resources/global%20sulphur%20strategy_final_26%20august.pdf
MathPro. (2015). Refining process technology and economics for producing ultra-low sulfur diesel fuel and gasoline. Prepared for the International Council on Clean Transportation.
Meeting Report for Regional Workshop for Validation of the Provisional Final Report. (2018). ECOWAS: Abidjan, Cote d’Ivoire.
Miller, J., & Façanha, C. (2016). Cost benefit analysis of Brazil’s heavy-duty emission standards (P-8). Retrieved from The International Council on Clean Transportation https://theicct.org/sites/default/files/publications/P-8%20White%20Paper_final.pdf

19
ICCT WHITE PAPER
Miller, J., & Jin, L. (2018). Global progress toward soot-free diesel vehicles in 2018. Retrieved from The International Council on Clean Transportation https://theicct.org/sites/default/files/publications/Global_progress_soot_free_diesel_20180702.pdf
Miller, J., & Minjares, R. (2013). The impact of stringent fuel and vehicle standards on premature mortality and emissions: Placing India within the global context. Retrieved from The International Council on Clean Transportation https://theicct.org/sites/default/files/publications/ICCT_Briefing_IndiaHealth_20130926.pdf
Minjares, R. (2018, December 12). Put soot-free transport in your NDC [Blog post]. Retrieved from The International Council on Clean Transportation, https://theicct.org/blog/staff/soot-free-transport-ndc-cop24
Minjares, R., Miller, J., & Nare, H. (2018, December). Analysis for ECOWAS fuels and vehicles study. Presented at the Regional Workshop for Validation of the Provisional Final Report, Abidjan, Cote d’Ivoire.
Minjares, R., Wagner, D. V., & Akbar, S. (2014). Reducing black carbon emissions from diesel vehicles: Impacts, control strategies, and cost-benefit analysis (No. 86485). Retrieved from The World Bank http://documents.worldbank.org/curated/en/329901468151500078/Reducing-black-carbon-emissions-from-diesel-vehicles-impacts-control-strategies-and-cost-benefit-analysis
Nigeria National Bureau of Statistics. (2018). Road transport data (Q2 2018). Retrieved from https://nigerianstat.gov.ng/elibrary?queries[search]=Road%20Transport%20Data
Observatory of Economic Complexity. (2016). Import origins of refined petroleum to Nigeria (2016). Retrieved from https://oec.world/en/visualize/tree_map/hs92/import/nga/show/2710/2016/
OECD.Stat. (2018). Mortality, morbidity and welfare cost from exposure to environment-related risks. [Data set]. Retrieved from https://stats.oecd.org/Index.aspx?DataSetCode=EXP_MORSC
Organisation for Economic Co-operation and Development. (2016). The economic consequences of outdoor air pollution. Retrieved from doi:10.1787/9789264257474-en
Posada, F., Chambliss, S., & Blumberg, K. (2016). Costs of emission reduction technologies for heavy-duty diesel vehicles (p. 39). Retrieved from The International Council on Clean Transportation https://theicct.org/sites/default/files/publications/ICCT_costs-emission-reduction-tech-HDV_20160229.pdf
Sanchez, F. P., Bandivadekar, A., & German, J. (2012). Estimated cost of emission reduction technologies for light-duty vehicles. Retrieved from The International Council on Clean Transportation https://theicct.org/sites/default/files/publications/ICCT_LDVcostsreport_2012.pdf
Shindell, D., Borgford-Parnell, N., Brauer, M., Haines, A., Kuylenstierna, J. C. I., Leonard, S. A., … Srivastava, L. (2017). A climate policy pathway for near- and long-term benefits. Science, 356(6337), 493–494. doi:10.1126/science.aak9521
Shindell, D. T. (2015). The social cost of atmospheric release. Climatic Change, 130(2), 313–326. doi:10.1007/s10584-015-1343-0
The Institute for Health Metrics and Evaluation, Health Effects Institute. (2019). What is the impact on your health? Retrieved from https://www.stateofglobalair.org/health
The World Bank. (2019). World development indicators (WDI) data catalog. Retrieved from https://datacatalog.worldbank.org/dataset/world-development-indicators
TransportPolicy.net. (n.d.). EU: Fuels: Diesel and gasoline. Retrieved from https://www.transportpolicy.net/standard/eu-fuels-diesel-and-gasoline/

20
COSTS AND BENEFITS OF SOOT-FREE ROAD TRANSPORT IN NIGERIA
UN Environment Programme. (2018a, April 24). Nigeria holds a low sulphur fuels and global fuel economy initiative project launch workshop in Abuja, Nigeria. Retrieved from http://www.unenvironment.org/events/workshop/nigeria-holds-low-sulphur-fuels-and-global-fuel-economy-initiative-project-launch
UN Environment Programme. (2018b, July 18). ECOWAS countries to develop harmonized fuel and vehicle emission standards Abidjan, Cote d’Ivoire. Retrieved from https://www.unenvironment.org/news-and-stories/blogpost/ecowas-countries-develop-harmonized-fuel-and-vehicle-emission-standards
UN Environment Programme. (2016, December 1). West African countries adopt low sulphur diesel standards. Retrieved from https://www.unenvironment.org/news-and-stories/blogpost/ecowas-countries-develop-harmonized-fuel-and-vehicle-emission-standards
U.S. Environmental Protection Agency. (2010). Guidelines for preparing economic analyses: Discounting future benefits and costs. Retrieved from https://www.epa.gov/sites/production/files/2017-09/documents/ee-0568-06.pdf