Embed Size (px)
Citation preview
Division 3 / DP 3.2 / WG 3.2117th ETH, CCGN, Andreas Nowak
Validation of Novel Light Scattering Sensors
for Soot Opacity and Soot Mass
A.Nowak
M. Hildebrandt, G. Lindner, A. Jordan-Gerkens, A. Kuntze, S. Pratzler, N. Böse,
V. Ebert
Division 3 / DP 3.2 / WG 3.2117th ETH, CCGN, Andreas Nowak
Outline of presentation
Legal bases and framework for soot opacity
• In Europe and Germany
Research project
• Challenges and objectives
• New method for measurement of soot opacity and soot mass concentration
• Experimental setup for validation and special dilution system
Results of research project
• Correlation for high soot concentration
• Correlation for low soot concentration
Conclusion
217.07.2013
Division 3 / DP 3.2 / WG 3.2117th ETH, CCGN, Andreas Nowak 3
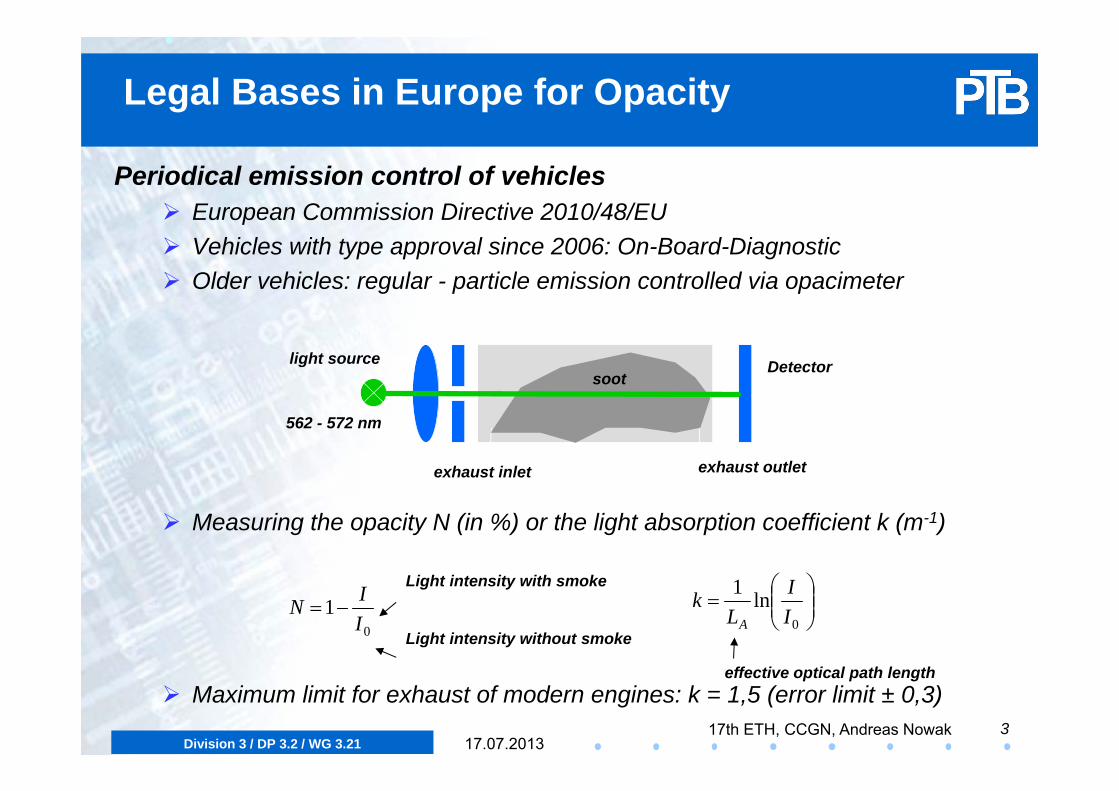
Periodical emission control of vehicles European Commission Directive 2010/48/EU Vehicles with type approval since 2006: On-Board-Diagnostic Older vehicles: regular - particle emission controlled via opacimeter
Measuring the opacity N (in %) or the light absorption coefficient k (m-1)
Maximum limit for exhaust of modern engines: k = 1,5 (error limit ± 0,3)
Legal Bases in Europe for Opacity
Wellenlänge562 - 572 nm
light source
exhaust inlet exhaust outlet
Detectorsoot
effective optical path length
01
IIN
Light intensity without smoke
Light intensity with smoke
0ln1
II
Lk
A
17.07.2013
Division 3 / DP 3.2 / WG 3.2117th ETH, CCGN, Andreas Nowak 4
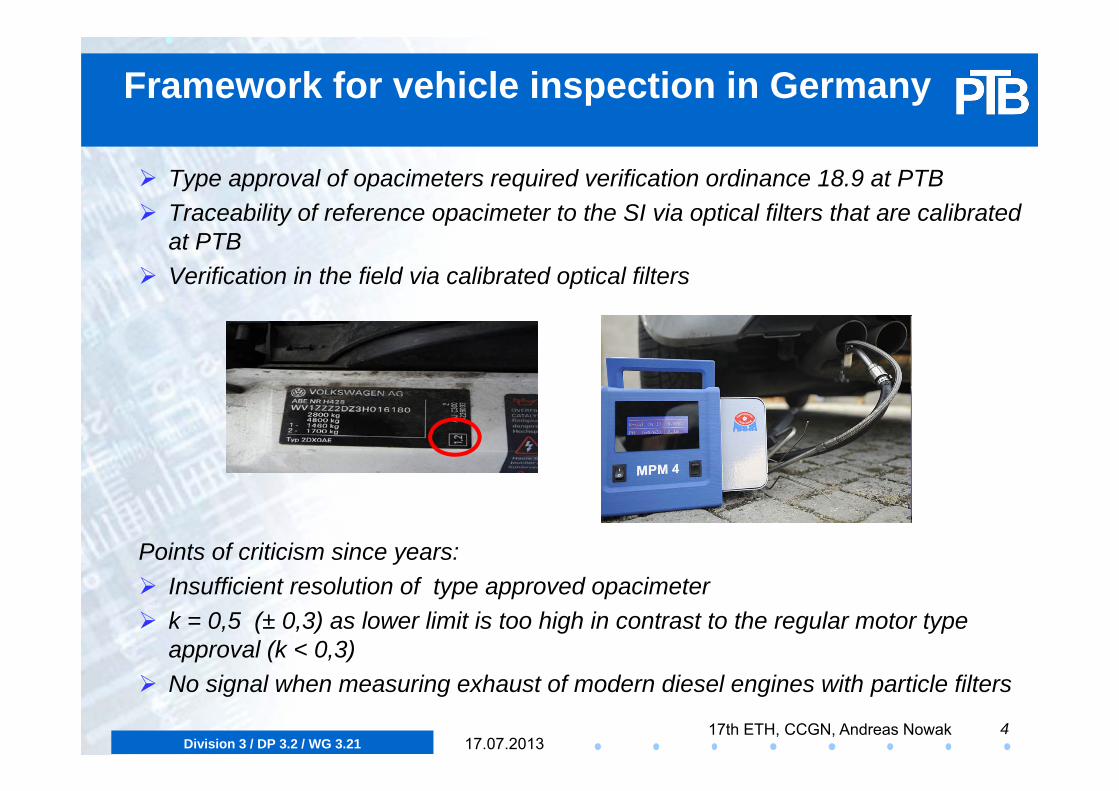
Framework for vehicle inspection in Germany
Type approval of opacimeters required verification ordinance 18.9 at PTB Traceability of reference opacimeter to the SI via optical filters that are calibrated
at PTB Verification in the field via calibrated optical filters
Points of criticism since years: Insufficient resolution of type approved opacimeter k = 0,5 (± 0,3) as lower limit is too high in contrast to the regular motor type
approval (k < 0,3) No signal when measuring exhaust of modern diesel engines with particle filters
17.07.2013
Division 3 / DP 3.2 / WG 3.2117th ETH, CCGN, Andreas Nowak 5
Research project with ASA¹-association
Project duration: 3 years (finished in Nov.2013)
Goal: Development of a metrological background for future type approvals of new soot sensors based on light scattering
Challenges: German verification act requires devices to measure the opacity and the light
absorption coefficient Indication on the screen of devices must be k in m-1 or N in % Verification method in the field should be similar to transmission filters (easy to
use, traceable)
¹ Bundesverband der Hersteller und Importeure von Automobil-Service Ausrüstungen e.V.
17.07.2013
Division 3 / DP 3.2 / WG 3.2117th ETH, CCGN, Andreas Nowak 6
PTB – ASA Research cooperation
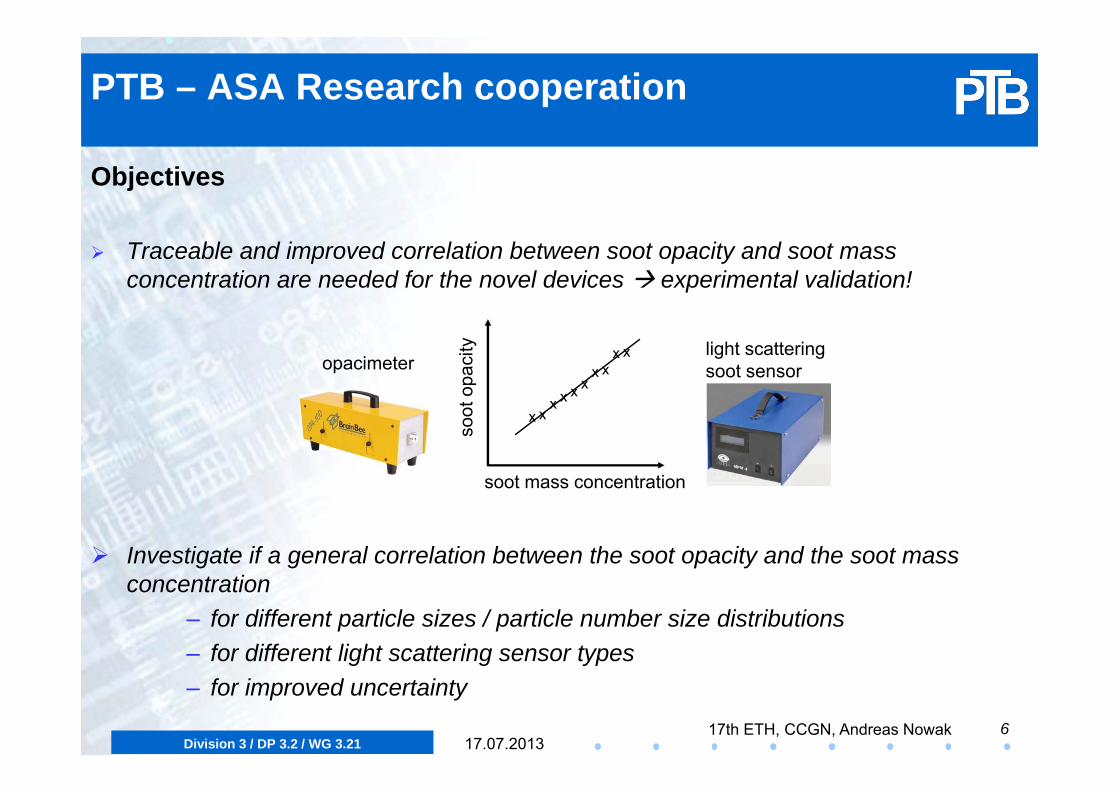
Objectives
Traceable and improved correlation between soot opacity and soot mass concentration are needed for the novel devices experimental validation!
Investigate if a general correlation between the soot opacity and the soot mass concentration
– for different particle sizes / particle number size distributions– for different light scattering sensor types– for improved uncertainty
opacimeter
soot
opa
city
soot mass concentration
light scattering soot sensor
x xx x x x
x xx x
17.07.2013
Division 3 / DP 3.2 / WG 3.2117th ETH, CCGN, Andreas Nowak 7
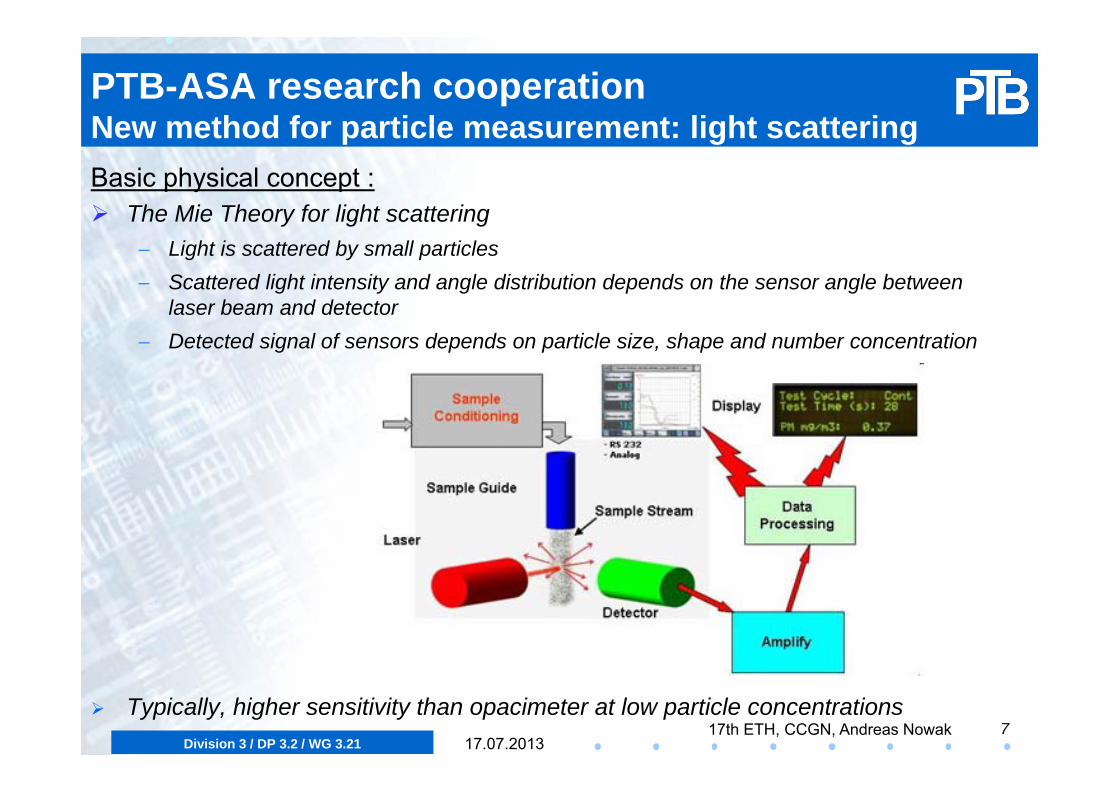
PTB-ASA research cooperationNew method for particle measurement: light scatteringBasic physical concept : The Mie Theory for light scattering
Light is scattered by small particles Scattered light intensity and angle distribution depends on the sensor angle between
laser beam and detector Detected signal of sensors depends on particle size, shape and number concentration
Typically, higher sensitivity than opacimeter at low particle concentrations17.07.2013
Division 3 / DP 3.2 / WG 3.2117th ETH, CCGN, Andreas Nowak
HiMassCAST
HEPA-filter
exhausair
propaneair
electr. magnetvalve
filter for grav. mass
opaci-meter DUT
air RVD1:1000 PASS
heated CVS
SMPSnitrogen
flow rateventuri pressure
°tpressure-, temperature
additionalports (x4)
gillibrator °tU
filter
filter
MFC
filter
heater
°t°t
compressor
°t
controlbydifferentialperssure
room temperatureair pressure
CFM
dilutioncounter flow m
ixer
°t
°t
(AVL 486)compressor
air
(AVL 439)
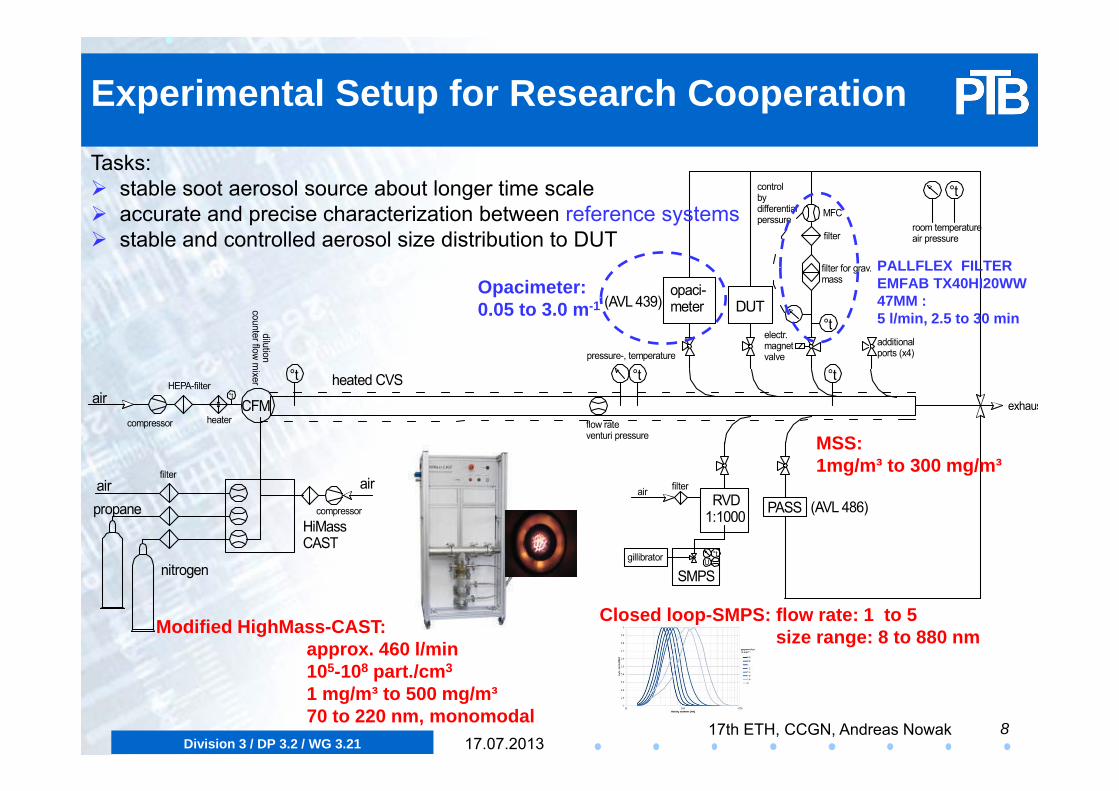
Modified HighMass-CAST:approx. 460 l/min105-108 part./cm3
1 mg/m³ to 500 mg/m³70 to 220 nm, monomodal
Experimental Setup for Research Cooperation
Closed loop-SMPS: flow rate: 1 to 5size range: 8 to 880 nm
PALLFLEX FILTER EMFAB TX40HI20WW 47MM :5 l/min, 2.5 to 30 min
MSS: 1mg/m³ to 300 mg/m³
Opacimeter:0.05 to 3.0 m-1
817.07.2013
Tasks: stable soot aerosol source about longer time scale accurate and precise characterization between reference systems stable and controlled aerosol size distribution to DUT
Division 3 / DP 3.2 / WG 3.2117th ETH, CCGN, Andreas Nowak 9
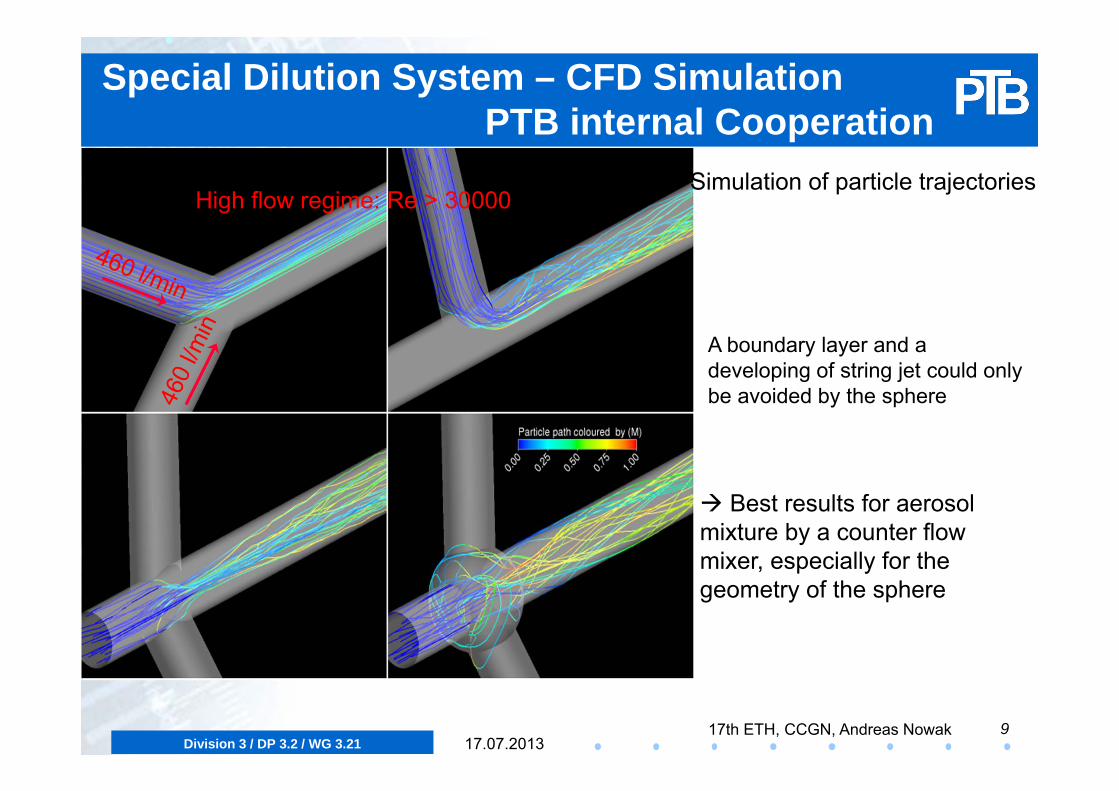
Simulation of particle trajectories
Special Dilution System – CFD Simulation PTB internal Cooperation
A boundary layer and a developing of string jet could only be avoided by the sphere
Best results for aerosol mixture by a counter flow mixer, especially for the geometry of the sphere
17.07.2013
High flow regime: Re > 30000
Division 3 / DP 3.2 / WG 3.2117th ETH, CCGN, Andreas Nowak
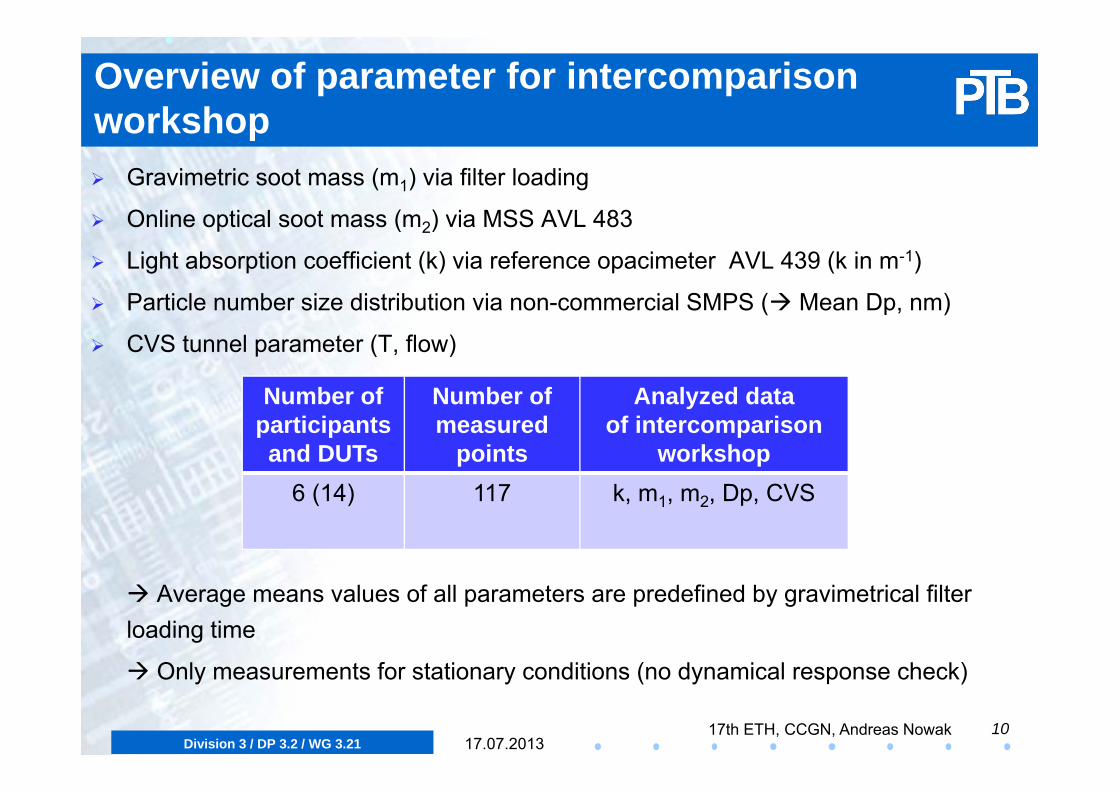
Overview of parameter for intercomparisonworkshop Gravimetric soot mass (m1) via filter loading
Online optical soot mass (m2) via MSS AVL 483
Light absorption coefficient (k) via reference opacimeter AVL 439 (k in m-1)
Particle number size distribution via non-commercial SMPS ( Mean Dp, nm)
CVS tunnel parameter (T, flow)
Average means values of all parameters are predefined by gravimetrical filter loading time
Only measurements for stationary conditions (no dynamical response check)
Number of participants and DUTs
Number of measured
points
Analyzed dataof intercomparison
workshop6 (14) 117 k, m1, m2, Dp, CVS
1017.07.2013
Division 3 / DP 3.2 / WG 3.2117th ETH, CCGN, Andreas Nowak
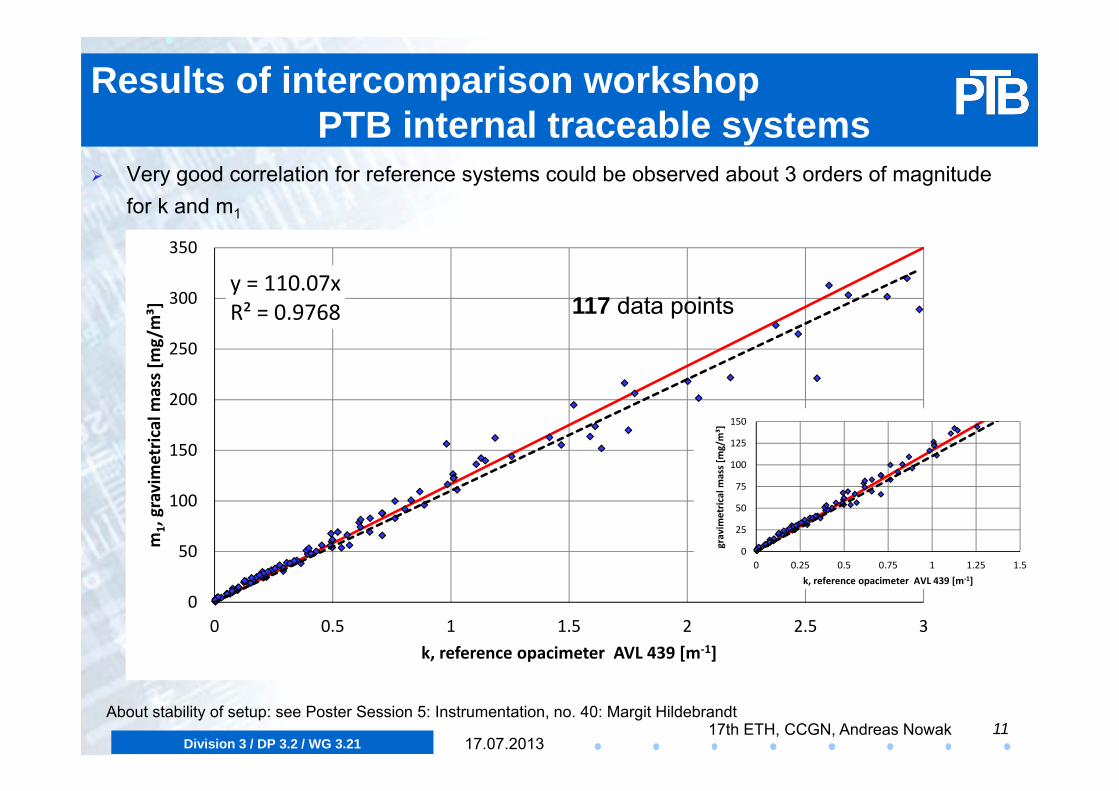
Results of intercomparison workshopPTB internal traceable systems
Very good correlation for reference systems could be observed about 3 orders of magnitude for k and m1
1117.07.2013
y = 110.07xR² = 0.9768
0
50
100
150
200
250
300
350
0 0.5 1 1.5 2 2.5 3
m1, gravim
etric
al m
ass [m
g/m³]
k, reference opacimeter AVL 439 [m‐1]
117 data points
0
25
50
75
100
125
150
0 0.25 0.5 0.75 1 1.25 1.5
gravim
etric
al m
ass [m
g/m³]
k, reference opacimeter AVL 439 [m‐1]
About stability of setup: see Poster Session 5: Instrumentation, no. 40: Margit Hildebrandt
Division 3 / DP 3.2 / WG 3.2117th ETH, CCGN, Andreas Nowak
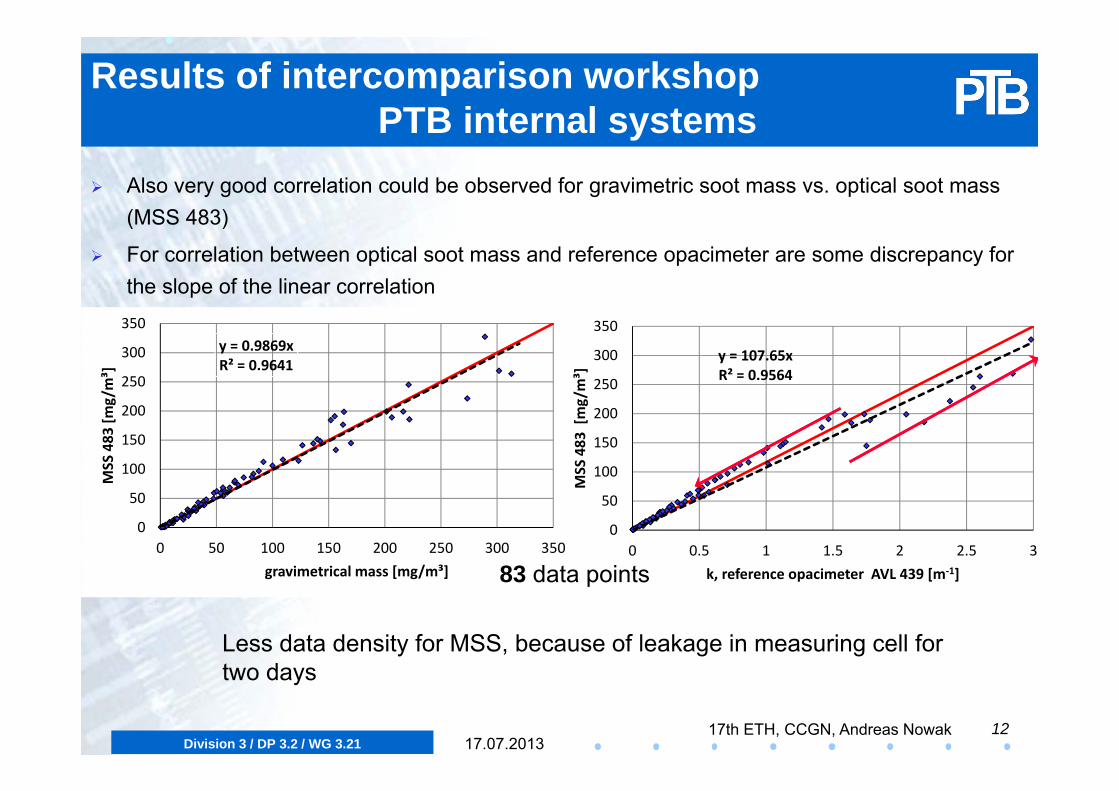
Results of intercomparison workshopPTB internal systems
Also very good correlation could be observed for gravimetric soot mass vs. optical soot mass (MSS 483)
For correlation between optical soot mass and reference opacimeter are some discrepancy for the slope of the linear correlation
1217.07.2013
y = 0.9869xR² = 0.9641
0
50
100
150
200
250
300
350
0 50 100 150 200 250 300 350
MSS 483
[mg/m³]
gravimetrical mass [mg/m³]
y = 107.65xR² = 0.9564
0
50
100
150
200
250
300
350
0 0.5 1 1.5 2 2.5 3
MSS 483
[mg/m³]
k, reference opacimeter AVL 439 [m‐1]83 data points
Less data density for MSS, because of leakage in measuring cell for two days
Division 3 / DP 3.2 / WG 3.2117th ETH, CCGN, Andreas Nowak
Results of intercomparison workshopreference systems vs. new sensors for high soot loading
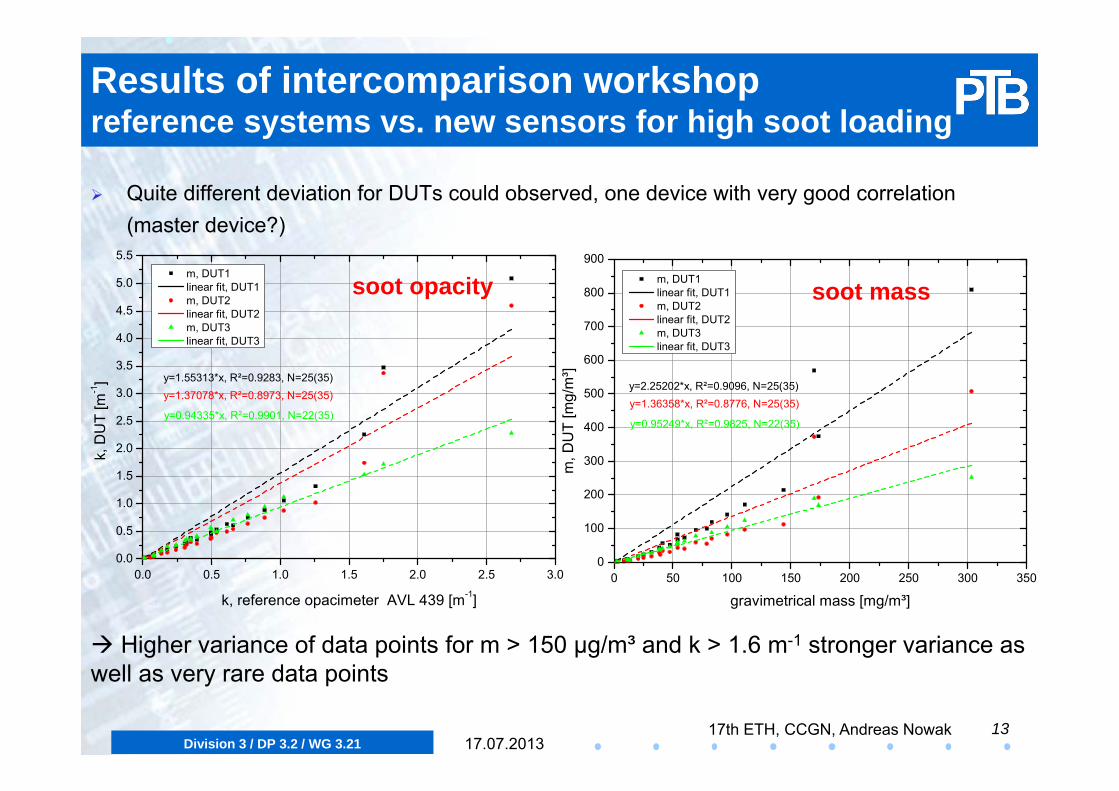
Quite different deviation for DUTs could observed, one device with very good correlation (master device?)
1317.07.2013
Higher variance of data points for m > 150 µg/m³ and k > 1.6 m-1 stronger variance as well as very rare data points
0.0 0.5 1.0 1.5 2.0 2.5 3.00.0
0.5
1.0
1.5
2.0
2.5
3.0
3.5
4.0
4.5
5.0
5.5 m, DUT1 linear fit, DUT1 m, DUT2 linear fit, DUT2 m, DUT3 linear fit, DUT3
k, D
UT
[m-1]
k, reference opacimeter AVL 439 [m-1]
y=0.94335*x, R²=0.9901, N=22(35)
y=1.37078*x, R²=0.8973, N=25(35)y=1.55313*x, R²=0.9283, N=25(35)
0 50 100 150 200 250 300 3500
100
200
300
400
500
600
700
800
900
m, DUT1 linear fit, DUT1 m, DUT2 linear fit, DUT2 m, DUT3 linear fit, DUT3
m, D
UT
[mg/
m³]
gravimetrical mass [mg/m³]
y=0.95249*x, R²=0.9825, N=22(35)
y=1.36358*x, R²=0.8776, N=25(35)y=2.25202*x, R²=0.9096, N=25(35)
soot opacity soot mass
Division 3 / DP 3.2 / WG 3.2117th ETH, CCGN, Andreas Nowak
Results of intercomparison workshopreference systems vs. new sensors for low soot loading
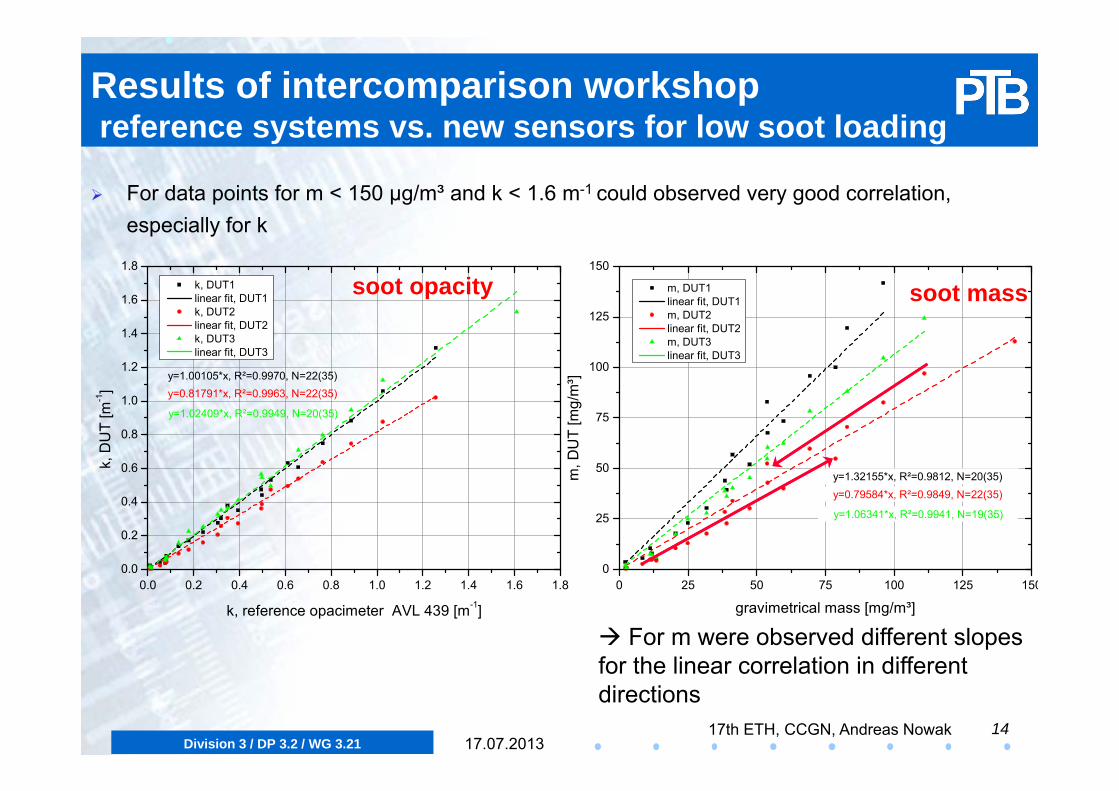
For data points for m < 150 µg/m³ and k < 1.6 m-1 could observed very good correlation, especially for k
1417.07.2013
For m were observed different slopes for the linear correlation in different directions
0.0 0.2 0.4 0.6 0.8 1.0 1.2 1.4 1.6 1.80.0
0.2
0.4
0.6
0.8
1.0
1.2
1.4
1.6
1.8 k, DUT1 linear fit, DUT1 k, DUT2 linear fit, DUT2 k, DUT3 linear fit, DUT3
k, D
UT
[m-1]
k, reference opacimeter AVL 439 [m-1]
y=1.02409*x, R²=0.9949, N=20(35)
y=0.81791*x, R²=0.9963, N=22(35)y=1.00105*x, R²=0.9970, N=22(35)
0 25 50 75 100 125 1500
25
50
75
100
125
150
m, DUT1 linear fit, DUT1 m, DUT2 linear fit, DUT2 m, DUT3 linear fit, DUT3
m, D
UT
[mg/
m³]
gravimetrical mass [mg/m³]
y=1.06341*x, R²=0.9941, N=19(35)
y=0.79584*x, R²=0.9849, N=22(35)y=1.32155*x, R²=0.9812, N=20(35)
soot opacity soot mass
Division 3 / DP 3.2 / WG 3.2117th ETH, CCGN, Andreas Nowak
Conclusion
A new stable soot reference source was installed at PTB for a large range of soot mass concentration
The new light scattering sensors are a 100xmore sensitive than commercial opacimeter on the market for vehicle inspection
In general, the correlations with respect to light absorption coefficient showed for low soot concentration (k < 1.6 m-1) significantly better results than for high soot concentration (k > 1.6 m-1)
For k < 1.6 mostly very good correlation coefficient were determined between 0.98 to 0.99 for all devices
Just few sensors with good correlation for soot mass during these campaign, especially below 150 mg/m³
1517.07.2013
So far, no universal calibration method according to verification ordinance 18.9 is available to validate the sensors during field measurements no type approval
Division 3 / DP 3.2 / WG 3.2117th ETH, CCGN, Andreas Nowak 16
17.07.2013
Thanks for your attention
Division 3 / DP 3.2 / WG 3.2117th ETH, CCGN, Andreas Nowak 17
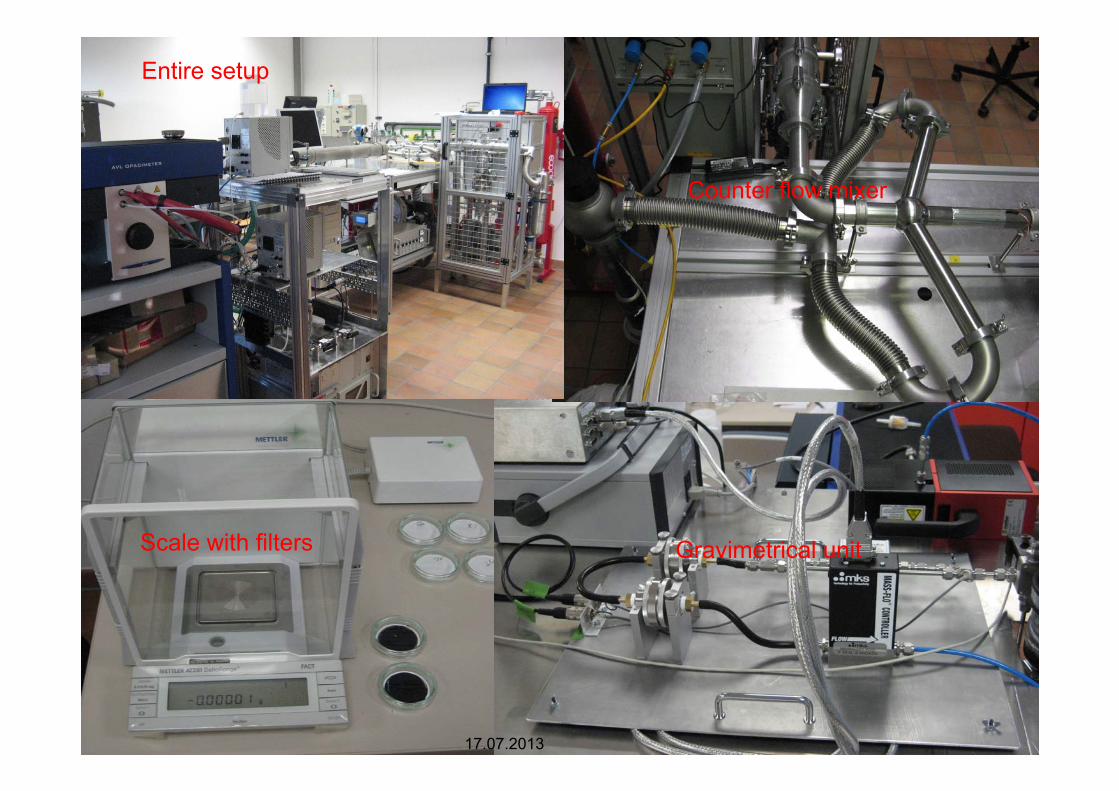
Counter flow mixer
Scale with filters
Entire setup
Gravimetrical unit
17.07.2013
Division 3 / DP 3.2 / WG 3.2117th ETH, CCGN, Andreas Nowak
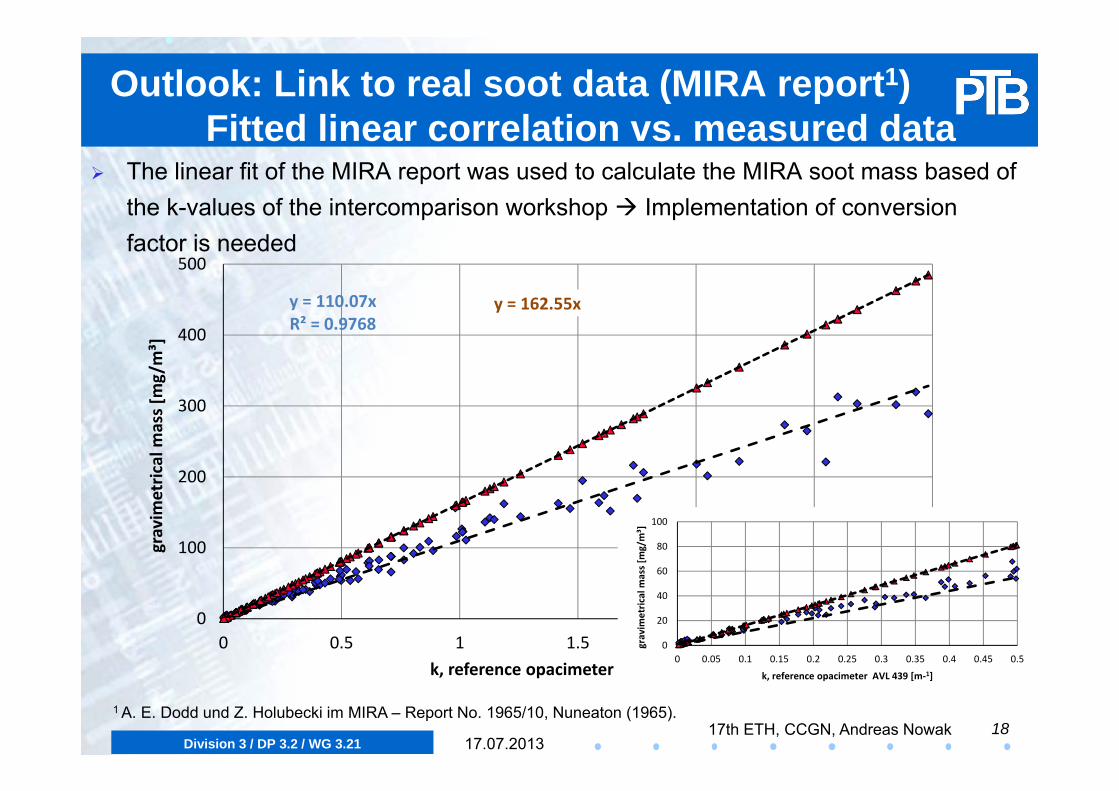
Outlook: Link to real soot data (MIRA report1)Fitted linear correlation vs. measured data
The linear fit of the MIRA report was used to calculate the MIRA soot mass based of the k-values of the intercomparison workshop Implementation of conversion factor is needed
1817.07.2013
1 A. E. Dodd und Z. Holubecki im MIRA – Report No. 1965/10, Nuneaton (1965).
y = 110.07xR² = 0.9768
y = 162.55x
0
100
200
300
400
500
0 0.5 1 1.5 2 2.5 3
gravim
etric
al m
ass [mg/m³]
k, reference opacimeter AVL 439 [m‐1]0
20
40
60
80
100
0 0.05 0.1 0.15 0.2 0.25 0.3 0.35 0.4 0.45 0.5
gravim
etric
al m
ass [m
g/m³]
k, reference opacimeter AVL 439 [m‐1]
Division 3 / DP 3.2 / WG 3.2117th ETH, CCGN, Andreas Nowak
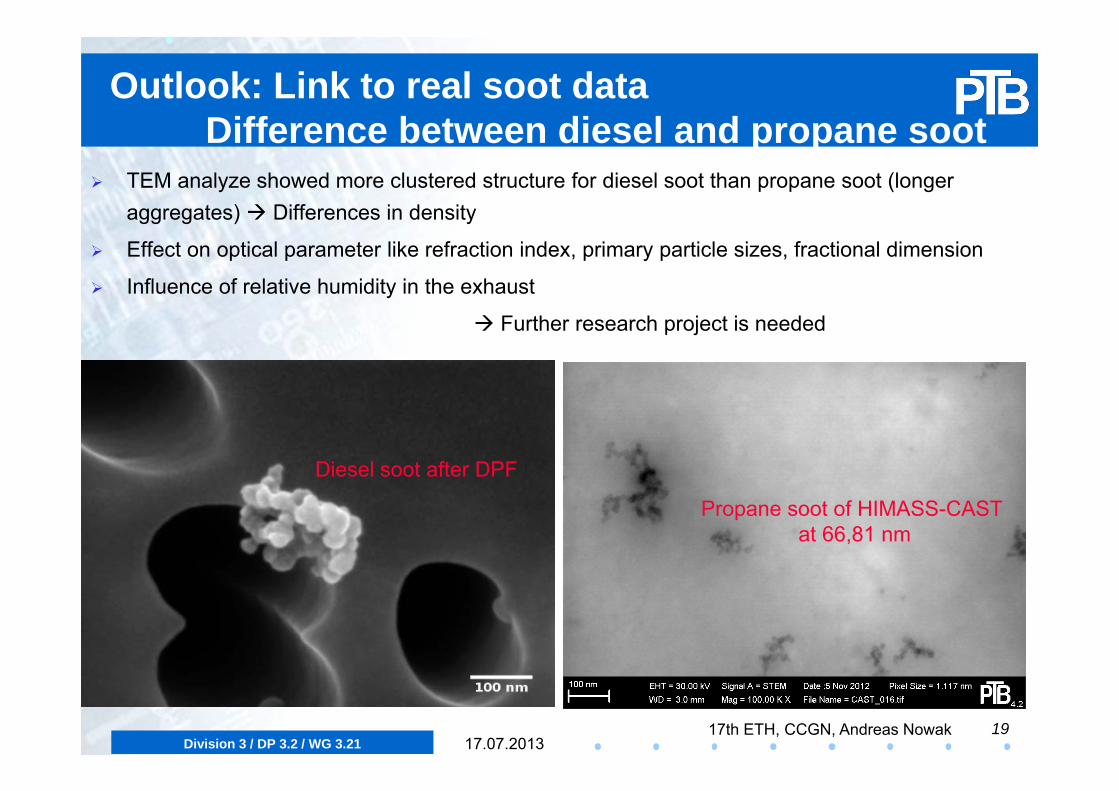
Outlook: Link to real soot data Difference between diesel and propane soot
TEM analyze showed more clustered structure for diesel soot than propane soot (longer aggregates) Differences in density
Effect on optical parameter like refraction index, primary particle sizes, fractional dimension
Influence of relative humidity in the exhaust
Further research project is needed
1917.07.2013
Diesel soot after DPF
Propane soot of HIMASS-CAST at 66,81 nm
Division 3 / DP 3.2 / WG 3.2117th ETH, CCGN, Andreas Nowak
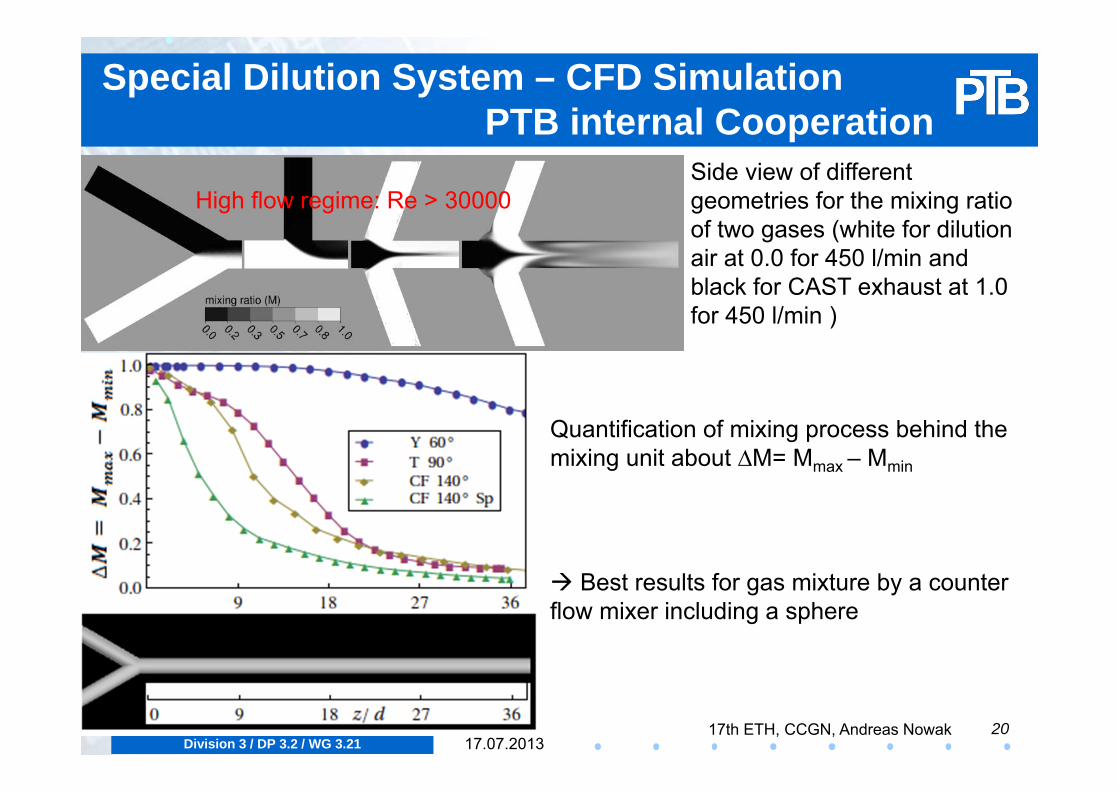
Special Dilution System – CFD Simulation PTB internal Cooperation
20
Quantification of mixing process behind the mixing unit about ∆M= Mmax – Mmin
Best results for gas mixture by a counter flow mixer including a sphere
Side view of different geometries for the mixing ratio of two gases (white for dilution air at 0.0 for 450 l/min and black for CAST exhaust at 1.0 for 450 l/min )
High flow regime: Re > 30000
17.07.2013
Division 3 / DP 3.2 / WG 3.2117th ETH, CCGN, Andreas Nowak
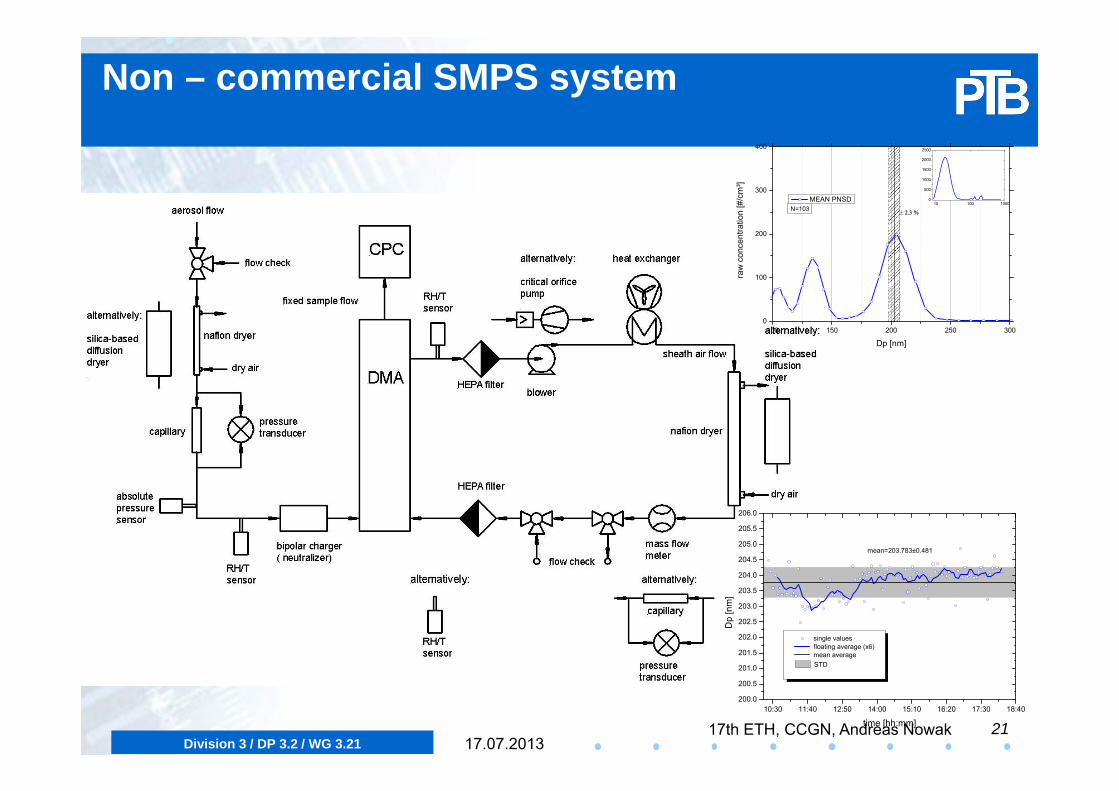
Non – commercial SMPS system
2117.07.2013
100 150 200 250 3000
100
200
300
400
N=103
raw
con
cent
ratio
n [#
/cm
³]
Dp [nm]
MEAN PNSD10 100 1000
0
500
1000
1500
2000
2500
10:30 11:40 12:50 14:00 15:10 16:20 17:30 18:40200.0
200.5
201.0
201.5
202.0
202.5
203.0
203.5
204.0
204.5
205.0
205.5
206.0
mean=203.783±0.481
single values floating average (x6) mean average
STD
Dp
[nm
]time [hh:mm]
Division 3 / DP 3.2 / WG 3.2117th ETH, CCGN, Andreas Nowak
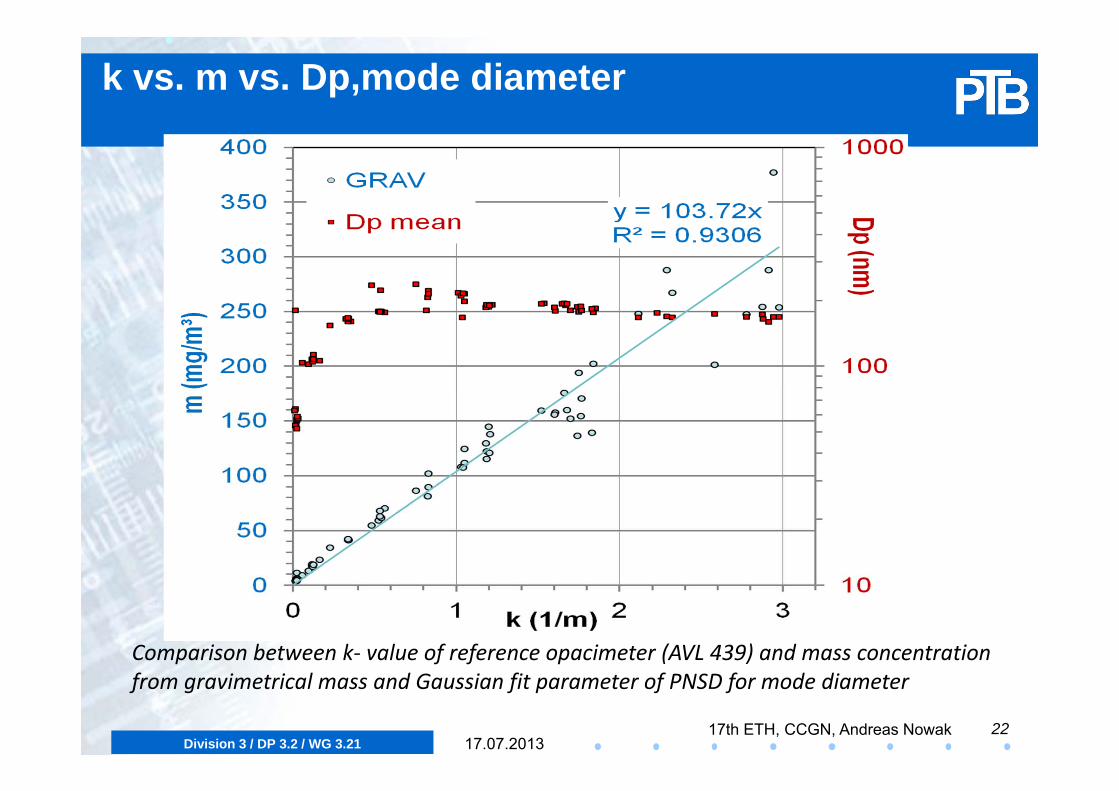
k vs. m vs. Dp,mode diameter
2217.07.2013
Comparison between k‐ value of reference opacimeter (AVL 439) and mass concentration from gravimetrical mass and Gaussian fit parameter of PNSD for mode diameter