Embed Size (px)
Citation preview

1
Corticosteroid receptors involved in stress regulation in common carp, Cyprinus carpio 1
2
Ellen H. Stolte1,2, Aurélia F. de Mazon, Karen M. Leon-Koosterziel, Maria Jęsiak, Nic R. Bury3,3
Armin Sturm3, Huub F.J. Savelkoul2, B.M. Lidy Verburg van Kemenade2, and Gert Flik14
5
1Department of Animal Physiology, Radboud University, 6
Toernooiveld 1, 6525 ED Nijmegen, the Netherlands 7
2Cell Biology and Immunology Group, Wageningen University, 8
Marijkeweg 40, 6709 PG, Wageningen, the Netherlands 9
3King’s College London, Department of Biochemistry 10
Franklin-Wilkins Builiding, 150 Stamford Street, London, SE1 9NH, UK 11
12
Corresponding author: Prof. dr. G. Flik 13 Department of Animal Physiology 14 Radboud University Nijmegen, 15 Heyendaalseweg 135, 6525 AJ Nijmegen, 16 The Netherlands 17 Phone +31 24 365 3242 18 Fax +31 24 365 3229 19 E-mail [email protected] 20
21
22
23
Short title: Corticoid Receptors in carp 24
25
26
27
Keywords: Glucocorticoid receptor, mineralocorticoid receptor, transactivation, glucocorticoid 28
sensitivity, stress response, cortisol, evolution. 29
30
Page 1 of 36 Accepted Preprint first posted on 27 May 2008 as Manuscript JOE-08-0100
2
31
Abstract 32 In higher vertebrates, mineralo- (aldosterone) and glucocorticoids (cortisol/corticosterone) exert their 33
multiple actions via specific transcription factors, glucocorticoid (GR) and mineralocorticoid (MR) 34
receptors. Teleostean fishes lack aldosterone and mineral regulatory processes seem under dominant 35
control by cortisol. Despite the absence of the classical mineralocorticoid aldosterone, teleostean 36
fishes do have a mineralocorticoid receptor (MR) with cortisol and possibly 11-deoxycorticosterone 37
(as alternative for aldosterone) as predominant ligands. We studied corticoid receptors in common 38
carp (Cyprinus carpio L.). Through homology cloning and bio-informatic analysis we found 39
duplicated GR genes and a single MR gene. The GR genes likely result from a major genomic 40
duplication event in the teleostean lineage; we propose that the gene for a second MR was lost. 41
Transactivation studies show that the carp GRs and MR have comparable affinity for cortisol; the MR 42
has significantly higher sensitivity to 11-deoxycorticosterone, and this favors a role for DOC as MR 43
ligand in fish physiology. Messenger RNA of the GRs and the MR is expressed in forebrain (in pallial 44
areas homologous to mammalian hippocampus), in CRH-cells in the preoptic nucleus (NPO) and in 45
the pituitary pars distalis ACTH-cells, three key neural/endocrine components of the stress axis. After 46
exposure to prolonged and strong (not to mild acute) stressors, mRNA levels of both GRs and MR 47
become down-regulated in the brain, but not in the NPO CRH-cells or pituitary ACTH-cells. Our data 48
predict a function in stress physiology for all CRs and suggest telencephalon as a first line cortisol 49
target in stress. 50
Page 2 of 36
3
Introduction 51
The adrenal cortex of mammals produces cortisol (or corticosterone) as glucocorticoid and aldosterone 52
as mineralocorticoid. The function of these steroids is ultimately specified by the transcription factors 53
(glucocorticoid and mineralocorticoid receptors, GRs and MRs, respectively) that mediate their 54
actions in the diverse targets and that define which genes will be activated or repressed. Interrenal 55
cells of teleostean fishes produce cortisol as the major steroid; in addition deoxycorticosterone (DOC, 56
a possible side-product of progesterone conversion by 21-hydroxylase activity in cortisol pathway) is 57
found in fish plasma (Sturm et al., 2005, Colombe et al., 2000). Aldosterone is an evolutionary more 58
recent steroid (Bridgham et al., 2006), believed to be absent in teleostean fishes (Balment & 59
Henderson, 1987). 60
In all vertebrates glucocorticosteroids play a key regulatory role in stress responses, growth 61
and general metabolism, reproduction and immunity (Mommsen et al., 1999), and in terrestrial 62
vertebrates a specific subtask in mineral regulation is given to aldosterone. In fish, cortisol is 63
intimately involved in the regulation of the water and mineral balance (Gilmour, 2005). At least two 64
notions come to mind at the basis of a fundamentally different corticoid endocrinology in fishes: i) 65
cortisol, the main corticosteroid exerts receptor-defined gluco- or mineralocorticoid actions and thus 66
regulation of water and mineral balance in fishes is not necessarily controlled by a mineralocorticoid; 67
ii) the poorly studied DOC could, via a MR, act as a mineralocorticoid in fishes. 68
The corticoid receptors are promiscuous for ligands; cortisol is bound both by the 69
glucocorticoid receptor (GR) and the mineralocorticoid receptor (MR). The evolution of multiple 70
corticosteroid receptors and their signaling pathways in vertebrates was extensively reviewed (Baker 71
et al., 2007, Bridgham et al., 2006, Bury & Sturm, 2007, Prunet et al., 2006). An ancestral 72
corticosteroid receptor (AncCR) is assumed to have been an effective receptor for cortisol; the AncCR 73
may further have transmitted a DOC signal in the ancestors of fishes. Duplication of the AncCR-gene 74
led to separate GR and MR species over 450 million years ago; it is assumed that the MR retained an 75
ancestral phenotype and that the GR lost sensitivity for aldosterone (Bridgham et al., 2006) in favor 76
of cortisol. A second major genomic duplication event took place in teleostean fishes (not in 77
tetrapods), and gave rise to further diversification of the corticosteroid receptor family. In the extant 78
Page 3 of 36

4
teleostean fishes studied so far, two different GR genes and one MR gene are found (Bury & Sturm, 79
2007, Greenwood et al., 2003). The interesting picture arises that in fish a single ligand (cortisol) may 80
steer three different receptors; diversification therefore of receptors rather than of ligands. 81
Physiological research on the role of these fish receptors (combined) in stress and 82
osmoregulation is as yet scarce. Although extensive research effort has been put in aspects of stress 83
handling, smoltification, and reproduction, and the effects of increased cortisol levels on GR 84
expression (Basu et al., 2003, Maule & Schreck, 1991), only a few studies focussed on both GR and 85
MR activity either simultaneously (Greenwood et al., 2003) or within the same species (Bury et al.,86
2003) Sturm et al., 2005). A role for MR activity in fish osmoregulation seems likely (Prunet et al.,87
2006, Sturm et al., 2005) Gilmour, 2005), yet other MR-functionality, for instance in brain function, or 88
stress axis regulation requires far more research. 89
The endocrine stress axis is a pivotal and phylogenetically ancient regulatory system, key in 90
adaptation of vertebrates to their dynamic environment (Wendelaar Bonga, 1997), as well as in stress 91
handling. The teleostean hypothalamic-pituitary-interrenal (HPI) axis is comparable to the mammalian 92
stress axis (Mommsen et al., 1999, Wendelaar Bonga, 1997), a result of convergent evolution. 93
Stressful sensory information is conveyed to the hypothalamic preoptic area (NPO) and results in 94
release of corticotropin releasing hormone (CRH). NPO CRH-cells in fish project directly to the 95
rostral pars distalis adrenocorticotropic hormone (ACTH-) producing cells. ACTH released into the 96
general circulation will then activate interrenal cells of the head kidney to produce and secrete cortisol. 97
This cortisol will redistribute energy flows to deal with the stressor(s) and by doing so guarantees 98
homeostasis (Wendelaar Bonga, 1997). 99
In mammals both GR and MR are involved in regulation of cortisol release and coping with 100
stress (De Kloet et al., 1998). MR activity governs a tonic hippocampal inhibitory control over the 101
hypothalamus-pituitary-adrenal (HPA) axis; GR activity exerts a negative feedback on higher brain 102
centres under conditions of high cortisol. (De Kloet et al., 1998, Reul et al., 2000). Indeed, high 103
cortisol levels, via GR activity, inhibit CRH and ACTH release from hypothalamus and pituitary 104
gland, respectively, to counteract stress imposed (De Kloet et al., 1998). In fish such negative 105
Page 4 of 36

5
feedback has been described (Mommsen et al., 1999, Wendelaar Bonga, 1997), but which receptors 106
are involved is not known nor are the signals precisely defined (i.e. is it cortisol, DOC or maybe both). 107
We therefore investigated which corticosteroid receptors were present in common carp and 108
where these receptors were located in the stress axis and focussed on CRH- and ACTH-cells and 109
higher brain centres (telencephalic pallial neurons). Next we determined mRNA expression of three 110
receptors (GR1, GR2 and MR) and sensitivity for cortisol by transactivation analysis to to assign 111
possible differential functionality under basal or stress conditions (i.e. when plasma cortisol is low and 112
high). Finally we showed that corticosteroid mRNA expression in the stress axis could be manipulated 113
by a chronic stress paradigm suggesting involvement of all three receptors in stress axis regulation. 114
115
Materials and methods 116
Animals 117
Common carp (C. carpio L.) were kept at 23˚C in recirculating UV-treated tap water at “De Haar 118
Vissen” in Wageningen. Fish were fed dry food pellets (Promivi, Rotterdam, The Netherlands) at a 119
daily maintenance ration of 0.7% of their estimated body weight. The cross ‘R3xR8’ is offspring of 120
Hungarian (R8) and Polish (R3) strains (Irnazarow, 1995). Experimental repeats were performed with 121
fish from different batches of eggs. All experiments were performed according to national legislation 122
and were approved by the institutional Ethical Committee. 123
124
Identification of GR1, GR2 and MR genes 125
We screened the Ensembl zebrafish genome database with sequences of mammalian GR and MR 126
genes, using the BLAST (basic local alignment search tool) algorithm. This screen revealed one GR 127
gene and one MR gene. These genes were incorporated in separate multiple sequence alignments, 128
using CLUSTALW (Chenna et al., 2003); for both the GR and MR, genes of several species were used. 129
Primers were designed in regions of high amino acid identity. We obtained partial cDNA sequences 130
from a λZAP cDNA library of carp brain. By RACE (rapid amplification of cDNA ends; Invitrogen, 131
Carlsbad, CA, USA) the corresponding full length sequences were obtained. PCR was carried out as 132
previously described (Huising et al., 2004) and sequences were determined from both strands. 133
Page 5 of 36

6
134
Probe synthesis 135
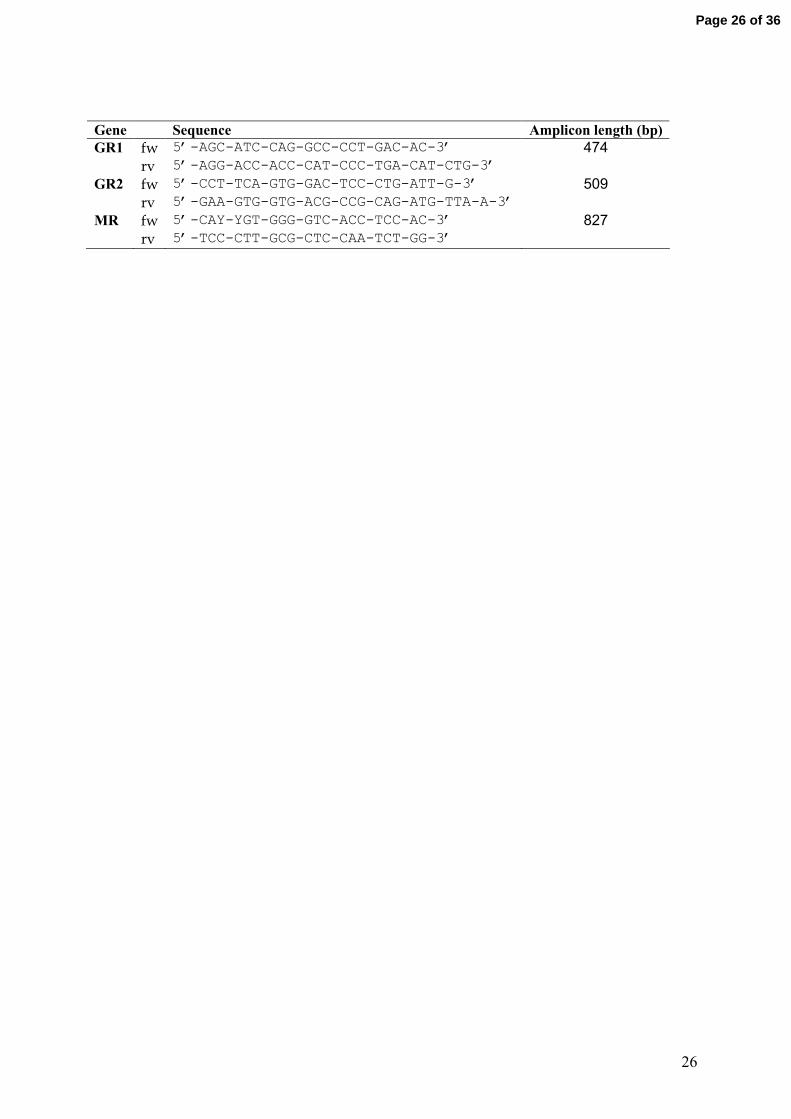
Digoxygenine (DIG) labelled carp GR1, GR2 and MR probes (Table 1) were synthesised from a 136
PGEMTeasy (Promega, Madison, WI, USA) vector with the respective inserts by use of a DIG RNA 137
labelling kit according to the manufacturer’s instructions (Roche, Manheim, Germany). The GR1 138
vector contained a 474 base pairs insert, the GR2 vector a 509 base pairs insert and the MR vector an 139
827 base pairs insert (primers shown in table 1). Proper probe labelling was confirmed by Northern 140
blotting. Probes were constructed in the AB domain, the least conserved region, to avoid cross-141
reactivity between probes (Fig. 1). 142
143
Tissue and section preparation 144
Nine months old carp (150-200 g) were anaesthetised with 0.2 g.L-1 tricaine methane sulfonate (TMS) 145
(Cresent Research Chemicals, Phoenix, AZ, USA) buffered with 0.4 g.L-1 NaHCO3. (Merck, 146
Darmstadt, F.R. Germany). Blood was collected by puncture of the caudal vessels using a heparinised 147
(Leo Pharmaceuticals Products, Ltd, Weesp, The Netherlands) syringe fitted with a 21-Gauge needle. 148
Next, fish were killed by spinal transsection and organs and tissues for RNA extraction were carefully 149
removed, snap frozen in dry ice or liquid N2 and stored at -80˚C. Organs for in-situ hybridisation were 150
removed and fixed overnight in 4% freshly prepared paraformaldehyde (PFA) in phosphate buffered 151
saline (PBS). Next, tissues were transferred to 1.5% agarose in 15% sucrose in PBS, snap frozen in 152
liquid N2 and stored at -80˚C. Serial 7µm cryostat sections were made (Frigocut 2800, Reichert-Jung) 153
and mounted on poly-L-lysine coated microscope slides (BDH Laboratory Supplies, Poole, UK). 154
155
In-situ hybridisation 156
In-situ hybridisation was adapted from (Engelsma et al., 2001)and included a proteinase K (5µg/ml) 157
(Promega, Madison, WI, USA) treatment for 10 min at 37 ºC to improve probe accessibility and a 10 158
min exposure to 0.25% acetic acid anhydride in 0.1M triethanolamine (TEA) to stop RNAse activity. 159
Probes (sense 0.5 ng/µl and antisense 1.5 ng/µl) were dissolved in Hyb+ buffer with 2% blocking 160
reagent (Roche Applied Science, Almere, the Netherlands) and denatured for 5 min at 80 ºC, added to 161
Page 6 of 36

7
every glass slide, covered with parafilm and incubated overnight at 55 ºC. Hyb+ buffer was replaced 162
with 4xSSCT (4xSCC with 0.01% Tween 20) buffer and sections were rinsed (2x 15 min) in 4xSSCT 163
buffer at 60 ºC. An RNAse treatment with 10ug/ml RNAseA (Qiagen, Venlo, the Netherlands) for 30 164
min at 37 ºC removed unbound RNA fragments. Next, slides were washed (2x with 2xSSCT, for 5 165
min) at 60 ºC, once with 1xSSCT for 10 min at 60 ºC, once with 0.5xSSCT for 10 min at 60 ºC and 166
finally once with 0.1xSSCT for 30 min during which the samples were allowed to cool to room 167
temperature. Washing and colour reaction were performed as described before. 168
169
Immunohistochemistry 170
Tissue on glass slides was first fixed in 4% PFA in PBS for 15 min. Slides were washed once with 171
PBST for 5 min and once with aquadest for 5 min. Subsequently they were incubated 10 min with 172
methanol plus 0.3% H2O2, after which the slides were rinsed twice for 10 min in PBST. Subsequently 173
non-specific antigenic sites were blocked with 10% normal goat serum (NGS) in PBS for 30 min. The 174
slides were incubated overnight with polyclonal antiserum against Growth Hormone (1:4000) or 175
ACTH (1:2000) in PBS with 10% NGS. The next day the slides were rinsed twice for 10 min in PBST 176
and incubated for 1 hr with goat anti-rabbit secondary antibody at a dilution of 1:200. 177
178
Imaging 179
Pictures were taken with Zeiss Axiovert tv 135 microscope with a 5.0 Q-imaging colour camera and 180
Leitz orthoplan cool snap colour camera (Roper Scientific). Pictures were edited (cropped and 181
background colour compensation) using Adobe Photoshop. 182
183
Stress experiments 184
Restraint stress. Prolonged restraint (24 hr) was given by netting the fish and suspending the nets with 185
the fish in the tanks (Huising et al., 2004). After 24 hr, the experimental group was transferred all at 186
once to a tank with 0.2 g.L-1 TMS, resulting in rapid (<1 min) and deep anaesthesia prior to blood 187
sampling and killing. A control group was housed in an identical tank but left undisturbed. Control 188
Page 7 of 36
8
fish were sampled following rapid netting and anaesthesia, immediately before sampling of the 189
experimental group. 190
Cold water stress. Fish were netted and transferred from a tank with 23˚C water to an identical tank 191
with 10˚C water, and left there for 15 min, after which they were returned to their original tank. This 192
transfer was repeated three times a day for three days. At day 4, the fish were transferred once more 193
and sampled 30 min after return to their original (warm) tank. For sampling, fish of a tank were all at 194
once transferred to a tank with 0.2 g.L-1 TMS, resulting in rapid anaesthesia. Sham-treated fish were 195
housed in identical tanks and transferred as mentioned above, but to tanks with 23˚C water. Control 196
fish were housed in identical tanks and left undisturbed. The sham and control fish were sampled just 197
before sampling of experimental fish. 198
199
Physiological parameters and plasma hormone determination 200
Freshly collected, heparinised blood was centrifuged for 10 min at 2000 g at 4 ˚C, after which plasma 201
was transferred to a new tube and stored at -20˚C. Cortisol was measured by RIA (Arends et al.,202
1998), with a commercial antiserum (Bioclinical Services Ltd, Cardiff, UK). All constituents were in 203
phosphate-EDTA buffer (0.05 M Na2HPO4, 0.01 M Na2EDTA, 0.003 M NaN3, pH 7.4). Ten-204
microliter samples or standards in RIA buffer (phosphated-EDTA buffer containing 0.1% 8-anilia-1-205
naphthalene sulphonic acid and 0.1% w/v bovine γ-globulin) were incubated with 100 µL antiserum 206
(in RIA buffer containing 0.2% normal rabbit serum) for 4 hr. Samples were incubated overnight with 207
100µL iodinated cortisol approximately 1700 cpm/tube; 125I-labeled cortisol, Amersham; Uppsala, 208
Sweden) and 100µL goat anti-rabbit γ-globulin (in RIA buffer). Bound and free cortisol in the assay 209
were separated by the addition of 1 ml ice-cold precipitation buffer (phosphate-EDTA buffer 210
containing 2% w/v bovine serum albumin and 5% w/v polyethylene glycol). Tubes were centrifuged at 211
4˚C (20 min at 2000 g), the supernatant aspirated and counted in a gamma counter (1272 clinigamma, 212
LKB, Turku, Finland). Plasma glucose and Na+ levels were measured with a Stat Profile® pHOx® Plus 213
L Analyser (Nova Biochemical, Waltham, USA). 214
215
RNA isolation 216
Page 8 of 36

9
RNA was isolated from tissues after extraction in Trizol reagent (Invitrogen, Carlsbad, CA, USA), as 217
suggested by the manufacturer. Total RNA was precipitated in isopropanol, washed with 75% ethanol 218
and dissolved in nuclease-free water. RNA of separated pituitary glands (pars distalis and pars 219
intermedia separate) was isolated as described by the RNeasy Mini Kit (Qiagen, Venlo, the 220
Netherlands) strictly according to the manufacturer’s instructions. RNA concentrations were measured 221
by spectrophotometry and integrity was ensured by analysis on a 1,5% agarose gel before proceeding 222
with cDNA synthesis. 223
224
DNAse treatment and first strand cDNA synthesis 225
For each sample a ‘- RT’ (non reverse transcriptase) control was included. One microliter of 10x 226
Dnase-I reaction buffer and 1 µl Dnase-I (Invitrogen, 18068-015) was added to 1 µg total RNA and 227
incubated for 15 min at room temperature in a total volume of 10 µl. DNase I was inactivated with 1 µl 228
25mM EDTA at 65˚C for 10 min. To each sample, 300 ng random hexamers (Invitrogen, 48190-011), 229
1 µl 10mM dNTP mix, 4 µl 5x First Strand buffer, 2 µl 0,1 M dithiothreitol (DTT) and 40 Units 230
RNAse Out (Invitrogen 10777-019) were added and the mix was incubated for 10 min at room 231
temperature and for and additional 2 min at 37˚C. To each sample (not to the ‘- RT’ controls) 200 U 232
Superscript-II RNase H- Reverese Transcriptase (RT; Invitrogen, 18064-014) was added and reactions 233
were incubated for 50 min at 37˚C . All reactions were filled up with demineralised water to a final 234
volume of 100 µl and stored at -20˚C until further use. 235
236
Real-time quantitative PCR 237
PRIMER EXPRESS (Applied Biosystems, Foster City, CA, USA) and PRIMER3 software was used 238
to design primers for use in real-time quantitative PCR (RQ-PCR) (Table 2). For RQ-PCR 5 µl cDNA 239
and forward and reverse primers (300 nM each) were added to 12,5 µl Quantitect Sybr Green PCR 240
Master Mix (Qiagen, Venlo, the Netherlands) and filled up with demineralised water to a final volume 241
of 25 µl. RQ-PCR (15 min 95˚C, 40 cycles of 15s at 94˚C, 30s at 60˚C, and 30s at 72˚C followed by 1 242
min at 60˚C) was carried out on a Rotorgene 2000 real-time cycler (Corbett Research, Sydney, 243
Australia). Raw data were analysed by use of the comparative quantitation of the Rotor-gene Analysis 244
Page 9 of 36
10
Software V5.0. Basal gene expression in organs and tissues of adult carp was determined as a ratio of 245
target gene vs reference gene and was calculated according to the following equation: Ratio = 246
(Ereference)Ct reference/ (Etarget)Ct target where E is the amplification efficiency and Ct is the number of PCR 247
cycles needed for the signal to exceed a predetermined threshold value. Expression following 24hr of 248
restraint or cold water transfer was determined relative to the expression of non-restraint control fish 249
according to the following equation (Pfaffl, 2001) Ratio = (Etarget)Ct target (control-sample)/ (Ereference)Ct250
reference(control-sample) . Dual internal reference genes (40S ribosomal protein and β-actin) were incorporated 251
in all RQ-PCR experiments; results were similar following standardization to either gene. ‘- RT’-252
controls were included in all experiments and no amplification above background levels was observed. 253
Non-template controls were included for each gene in each run and no amplification above 254
background levels was observed. Specificity of the amplification was ensured by checking the melting 255
temperature and profile of each melting curve. The product of each template was checked at least once 256
by sequencing. 257
258
Transactivation assay 259
Clones encoding full-length open reading frame of common carp GR1 and GR2 were excised from 260
pGEM-Teasy vector by EcoR1 and BamH1 and ligated into pcDNA3 expression vector cut with the 261
same enzymes. Orientation and quality of the insert was confirmed by sequencing. COS-7 cells 262
(derived from African green monkey kidney) were cultured as described previously (Sturm et al.,263
2005). Cells were transiently transfected using a calcium precipitation method (Sambrook & Russell, 264
2001), with cells growing in log phase at 30-50% confluence. Cells were co-transfected with the 265
following plasmids: expression vector with the appropriate hormone receptor cDNA, (1 µg/ 24 well 266
plate), reporter plasmid pFC31Luc, which contains the mouse mammary tumour virus promoter 267
upstream of the luciferase gene (MMTV-LUC) (10 µg/ 24 well plate), and pSVβ (Clontech, Palo Alto, 268
CA, USA), a second reporter plasmid under control of the SV40 promoter and serving as a control for 269
transfection efficiency (2 µg/ 24 well plate) and finally pBluescript (Clontech, Palo Alto, CA, USA) (7 270
µg/ 24 well plate), an irrelevant plasmid to increase transfection. Sixteen hr after transfection, medium 271
was renewed and cortisol added from 1000-fold concentrated stock solution in ethanol. After 36 hr 272
Page 10 of 36

11
incubation, cells were harvested using reporter lysis buffer (Promega, Madison, WI, USA) following 273
the manufacturer’s instructions; luciferase and β-galactosidase activities were determined as described 274
previously (Bury et al., 2003). In addition to solvent controls (receiving only ethanol carrier instead of 275
hormone) cells were transfected with an empty expression vector to control for luciferase activity in 276
absence of hormone receptor DNA. Experiments were repeated three times independently, with 277
triplicate cell cultures per treatment. Luciferase activity was corrected for ‘well-specific’ transfection 278
efficiency (determined by β-galactosidase activity) and then expressed as percentage luciferase 279
activity observed in cells treated with 10-7M cortisol. 280
Half maximum activation concentration of ligand, EC50) in the transactivation assay were 281
assessed by fitting the data to a single ligand binding model using Sigma plot R software. Only 282
converging data were included in data sets presented. Ligands were tested in the range of 10 pM to 1 283
µM. Data were normalised to maximum (100%) response and corrected for blanks prior to kinetic 284
analysis. 285
286
Bioinformatics 287
Sequences were retrieved from the Swissprot, EMBL and GenBank databases using SRS and/or 288
BLAST (basic local alignment search tool)(Altschul et al., 1997). Multiple sequence alignments were 289
carried out using CLUSTALW (Chenna et al., 2003). Calculation of pairwise amino acid identities was 290
carried out using the SIM ALIGNMENT tool (Huang & Miller, 1991). Phylogenetic and molecular 291
evolutionary analyses were conducted using MEGA version 3.1 (S Kumar, 2004). Phylogenetic tree 292
was constructed based on the neighbour-joining method using the Poisson-correction for evolutionary 293
distance (Nei & Kumar, 2000) . Reliability of the tree was assessed by bootstrapping, using 1000 294
bootstrap replications. 295
296
Statistics 297
Statistic analysis was performed with SPSS 12.0.1 software. Following ANOVA, differences between 298
treatments were assessed by Mann-Witney U test, and P < 0.05 was accepted as fiducial limit. For 299
RQ-PCR data, tests were performed for both internal reference genes (β-actin and 40S) and statistical 300
Page 11 of 36

12
significance is only reported if both reference genes showed a significant effect, where * indicates p < 301
0.05 and ** indicates p < 0.01. 302
303
304
Results 305
CR characterisation306
Cloning and characterization of the MR and GR genes. Full-length sequences of one MR and two 307
different GR genes were obtained by homology cloning using a common carp brain cDNA library. 308
The first GR gene (GR1; acc. no. AJ 879149) comprises 2190 nucleotides, and encodes a protein of 309
730 amino acids. The second gene (GR2; acc. no. AM183668) contains an open reading frame of 2235 310
nucleotides, and encodes a protein of 745 amino acids (Fig. 1). The predicted amino acid identity of 311
these two GRs is 57%; both gene products show moderate sequence (45-60%) identity when compared 312
to other teleostean fish and mammalian GR genes (Fig. 2). The MR gene (acc. No. AJ783704) has an 313
open reading frame of 2913 nucleotides, which codes for a 971 amino acids protein. The predicted MR 314
amino acid sequence shows relatively high (65-90%) sequence identity to other teleostean fish MR 315
sequences and moderate (~50%) sequence identity to the African clawed frog (Xenopus laevis) and 316
mammalian MR sequences. 317
When the protein domains of the receptors (GRs and MR) are compared among different 318
species, 85-100% sequence identity is found for the DNA binding domain. For the ligand binding 319
domain (LDB) 50-60% sequence identity is found when GRs are compared to MRs between species, 320
and 70-90% when LDBs of either GRs or MR of individual species are compared (Fig. 2). The N-321
terminal domains of GRs and MRs constitute the most variable region. Alignment of carp GR- and 322
MR-genes yields low sequence conservation (28% for GR1 compared to GR2 and < 15% for MR 323
compared to either of the GRs; Fig.1). 324
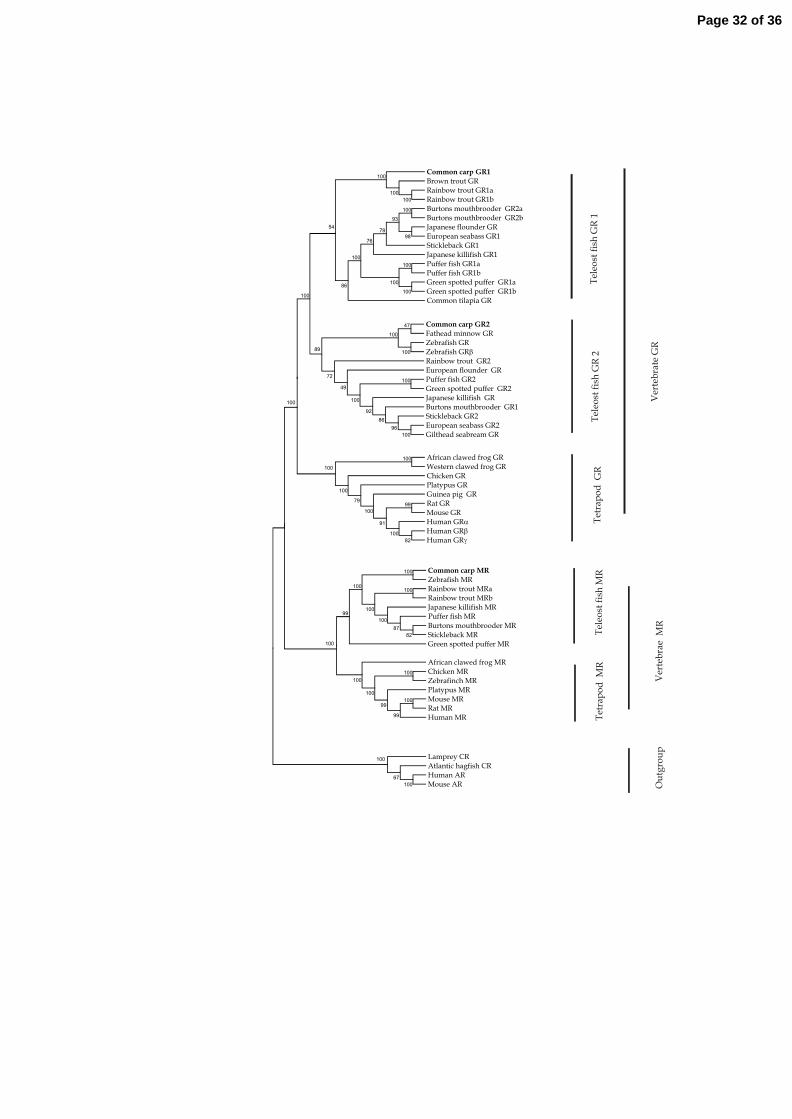
Phylogenetic analysis.The neighbour-joining phylogenetic tree for corticosteroid receptor 325
proteins (Fig.3) resulted in a predicted cluster of GRs and MRs on separate branches together with 326
mammalian orthologues; androgen receptors and corticosteroid receptors from jawless fish represent 327
Page 12 of 36

13
an outgroup. Within both the MR and the GR branch, teleostean and tetrapod proteins form separate 328
clades. The teleostean GR clade has a subdivision as a result of duplication of the GR gene. 329
Expression of mRNAs for corticosteroid receptors. Expression of GR1-, GR2- and MR-330
genes in brain (without hypothalamus and pituitary gland), ventral hypothalamus, pituitary gland of 331
healthy, non-stressed carp was quantitated by real time PCR is given in figure 4. The highest GR 332
expression was found in brain and hypothalamus. Expression of GR1- and GR2-genes was generally 333
comparable; in brain, however, GR1 expression was higher than GR2 expression. Receptor expression 334
abundance in pituitary tissue was about half that seen in brain or hypothalamus. The MR gene also 335
showed an about 50% lower expression level in pituitary tissue compared to brain and hypothalamus 336
(Fig. 4a). 337
To discriminate gene expression levels in the pars distalis (POMC-cells producing ACTH) 338
and pars intermedia (POMC-cells producing melanocyte stimulating hormone (MSH)) we dissected 339
pituitary glands and confirmed tissue separation by assay of prolactin mRNA expression, a marker for 340
the rostral pars distalis (RPD), (insert Fig 4b). GR1 and GR2 mRNA expression was significantly (p < 341
0.01) higher in pituitary pars distalis compared to pars intermedia. No such difference was observed 342
for MR mRNA (Fig. 4b). 343
CR localisation. The localisation of mRNA expression was further studied by in-situ 344
hybridisation. In the telencephalon, mRNA expression of all three receptors were detected, 345
predominantly in the outer pallial layers. In other brain areas GR1 and GR2 show the same 346
distribution pattern, although relative expression levels were different, whereas MR mRNA showed a 347
less wide distribution. In transverse sections of the hypothalamus mRNA expression of all three 348
receptors was observed in the magnocellular part of the NPO (as assessed by comparison to 349
paramedian sagittal slides (Huising et al., 2004)); expression was less pronounced in the parvocellular 350
part (Fig. 5), In the pituitary pars intermedia GR mRNA expression was low. In the pars distalis, 351
strongest GR expression was found in the proximal pars distalis, in growth hormone (GH) producing 352
cells. In the rostral pars distalis ACTH cells express both corticosteroid receptors GR1 and GR2 and to 353
a far higher degree than the prolactin cells (Fig. 6). 354
Page 13 of 36

14
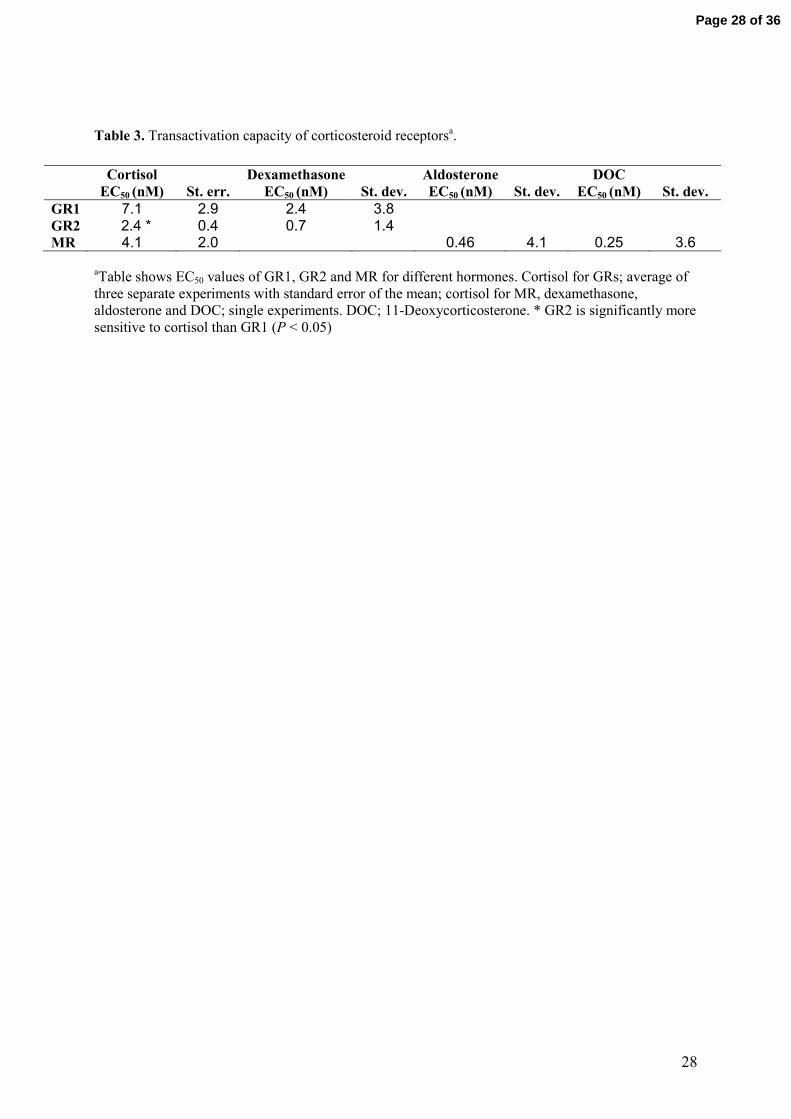
Transactivation activity. GR2 was more sensitive to the different hormones tested than 355
GR1. For both receptors dexamethasone was the strongest agonist tested, followed by cortisol, 356
deoxycortisol and corticosterone. Aldosterone and DOC finally, were very weak agonists. The 357
physiologically important stress hormone cortisol was chosen as ligand to compare sensitivity between 358
the different receptors in a transactivation assay. Carp GR1 was less sensitive than the GR2, both to 359
cortisol (EC50 7.1 ± 2.9 nM and 2.4 ± 0.4 nM for GR1 and GR2, respectively) and to dexamethasone 360
(EC50 2.4 ± 3.8 nM and 0.7 ± 1.4 nM for GR1 and GR2, respectively) (Table 3). The carp MR has 361
intermediate sensitivity for cortisol (EC50 4.1 ± 2.0 nM) when compared to the GRs. The sensitivity of 362
the MR to aldosterone and DOC was comparable, and approximately 10-fold higher than to cortisol. 363
364
Physiology365
Corticosteroid receptor expression and stress. To study corticosteroid receptor expression after stress, 366
we used two different stress paradigms. Restraint of carp for 24 hr resulted in significantly elevated 367
plasma cortisol and plasma glucose values as assessed upon completion of the treatment. Plasma 368
sodium concentrations had significantly decreased in stressed animals, indicative of stress related loss 369
of integumental permeability to water and ions (Metz et al., 2003, Wendelaar Bonga, 1997). 370
Corticosteroid receptor expression in any of the tissues tested was not affected by this restraint. When 371
fish were repeatedly subjected to temperature drops, they showed strongly elevated plasma cortisol 372
levels and a downregulation of mRNA expression of the GRs and the MR in brain; in hypothalamus 373
and pituitary gland no statistically significant changes were seen (Fig. 7). 374
375
Discussion 376
In vertebrates, corticosteroids are deeply involved in general metabolism, stress adaptation, 377
reproduction, osmoregulation, growth and bone formation. The phenomenal pleiotropy of 378
corticosteroids would suggest radiation of multiple isoforms and splice variants for their receptors 379
during evolution. Indeed, research on mammals has focused on isoform and splice variant incidence of 380
cortisol receptors (glucocorticoid receptors, GRs) and how these variants translate for instance into 381
regulation of the stress axis. The extant teleostean fishes are representatives of the earliest true 382
Page 14 of 36
15
vertebrates, and exhibit a complex receptor profile. With two genes encoding functionally different 383
GRs, this system is even more complex than that observed in mammals, which warranted 384
investigation into the role of these different receptors in stress axis regulation. 385
386
CR characterisation387
Receptor evolution in fishes. Different GR genes were demonstrated in distantly related 388
teleostean species (Bury et al., 2003, Greenwood et al., 2003) and for that very reason not necessarily 389
result from the tetraploidisation of common carp (Greenwood et al., 2003, Stolte et al., 2006). In the 390
green-spotted puffer two duplicates on different chromosomes are found, which makes a single gene 391
duplication less likely (Stolte et al., 2006). Moreover, all known teleostean GR1 proteins share a 392
conserved insert of nine amino acids (WRARQNTDG, or WRARQNADG in carp) in the DNA-binding 393
domain that is not found in other vertebrates. We rate it highly unlikely that all teleosts independently 394
duplicated a single gene and inserted every time again a nine amino acid sequence. Most convincing 395
for this debate is that our phylogenetic analysis yields two distinct clades of GR genes in the teleostean 396
lineage, which argues against duplication in the tetrapod lineage. The duplication in all likelihood 397
results from an early genome duplication 300-450 million years ago, and only after the divergence of 398
the tetrapods from the fish lineage (Volff, 2005). If we proceed from a notion of a major genomic 399
duplication in fishes, it follows that one MR has apparently been lost during evolution as we were not 400
able to detect a second MR coding gene in carp or in genomic databases for zebrafish (Danio rerio), 401
puffers (Fugu species) or rice fish (Oryzias latipes). Three possibilities arise after a gene/genome 402
duplication. Non-functionalisation, which is the fate of most duplicated genes (Brunet et al., 2006), 403
neo-functionalisation; the acquirement of a new function, or sub-functionalisation; where each copy 404
loses part of the ancestral function and both copies are required to maintain the full function (Force et 405
al., 1999). The duplicated GR genes of fish escaped a fate as non-functional pseudogene: expression 406
levels and differential sensitivities for cortisol are more so in line with neo-or subfunctionalisation 407
(Bury et al., 2003, Greenwood et al., 2003). Interestingly, zebrafish has only one GR copy, that 408
clusters with other fish GR2 sequences. However, zebrafish has acquired a splicing β-isoform of the 409
GR (Fig. 2), that resembles the dominant negative GRβ of humans in structure, expression level and 410
Page 15 of 36

16
function. This could reflect an alternative regulatory mechanism to compensate for the loss of a 411
functional second GR gene (Schaaf et al., 2007). 412
Receptor functional definition by transactivation capacity In carp, transactivation capacity of cortisol 413
(capacity of hormone to initiate or repress CR-mediated transcription of down-stream genes) is about 414
three-fold higher for GR2 (EC50 2.4 ± 0.4 nM), than for GR1 (EC50 7.1 ± 2.9), and this would facilitate 415
differential regulation by basal and elevated cortisol levels. The carp MR sensitivity (EC50 4.1 ± 2.0 416
nM) is intermediate to that of the GRs, and this is in stark contrast to data for Burton’s mouthbrooder 417
and trout, with MRs more sensitive to cortisol than the GRs (Greenwood et al., 2003, Sturm et al.,418
2005). In fish levels of up to 10 nM DOC were published (Campbell et al, 1980). The low EC50 of 419
DOC (0.25 nM) for MR transactivation in carp certainly does not exclude a mineralocorticoid 420
function for DOC in fishes. In carp plasma basal total levels of cortisol are around 5 ng/ml (i.e. 13.8 421
nM); following stress, cortisol levels easily reach 150 ng/ml (> 400 nM). As only 20% is available as 422
unbound cortisol (Flik & Perry, 1989) this corresponds to 2.8 nM and > 80 nM, respectively, for 423
which in carp apparently specific receptor subtypes are present: at rest both GR2 and MR may be 424
occupied and activated, whereas GR1 is preferentially activated by stress-levels of cortisol. In rodent 425
brain a similar system was demonstrated: an 80% MR and 10% GR corticosterone occupancy was 426
established in non-stressed situations (Reul et al., 1987). Even though the majority of MRs is occupied 427
at low cortisol levels, it still is a dynamically regulated receptor. MR activity could be increased by an 428
agonist to further inhibit HPA axis activity (Buckley et al., 2007). We assume the same applies for 429
common carp GR2 and MR. This means that although both receptors are partly or even largely 430
occupied with cortisol, continuous modulation of HPI axis activity could be mediated by increasing 431
cortisol levels after stressful events via GR1. 432
Receptor functional definition by localisation. As we focus on the involvement of the different 433
receptors in stress axis regulation, our areas of interest are the HPI axis organs. Hypothalamus and 434
pituitary gland of unstressed carp showed comparable mRNA levels for both GRs and the MR, 435
suggesting functional importance of all three. Only in brain (without hypothalamus and pituitary 436
gland), a consistent two-fold higher mRNA expression for GR1 over GR2 was seen. A receptor-437
defined duality in glucocorticoid function in brain of fishes seems of wider occurrence as similar 438
Page 16 of 36

17
preferential expression was seen in brain of rainbow trout and Burtons’ mouthbrooder (Bury et al.,439
2003, Greenwood et al., 2003). The higher mRNA expression level could translate into higher protein 440
levels but may also reflect higher turnover. We have no data on brain cortisol levels but two receptors 441
with significant difference in receptor sensitivity would allow differential responses to basal and stress 442
levels of the steroid. In carp and trout (Sturm et al., 2005), brain shows strong MR mRNA expression; 443
unexpectedly, typical osmoregulatory organs such as gills, kidney and intestine show far lower MR 444
mRNA expression. This suggests that a widely accepted but only presumed hypothesis of MR 445
involvement in osmoregulation may be wrong, and is a consequence of extrapolation of the situation 446
for aldosterone and MR function in mammals. However, also in the mammalian brain MRs play a key 447
role in corticosteroid regulated processes (De Kloet et al., 1998). The mammalian hippocampus exerts 448
inhibitory control over HPA-axis activity: a dominant inhibition by MR activity is attenuated by GR 449
activation (De Kloet et al., 1998). Our results support such a combined function for steroids mediated 450
by GR and MR activities in the regulation of stress coping and learning, and this is apparently a very 451
early function developed in our ancestral fishes. 452
Steroid receptors distribution in telenchephalic regions may contribute to define hippocampal 453
regions, especially involved in (learning) behaviour and sentience. Our demonstration of GR and MR 454
mRNA in carp telencephalon expands and further substantiates the notion that GR and MR 455
corticosteroid receptors have basic functions in regulation of learning and memory. In goldfish 456
(Vargas et al., 2006) and cod (Nilsson et al., 2007) learning and spatial memory may involve the 457
telencephalic lateral pallium, the homologue of the hippocampus of mammals (Meek & Nieuwenhuys, 458
1998). 459
In the hypothalamus, mRNA of all three receptor genes is expressed in parvo- and 460
magnocellular neurons of the preoptic nucleus. We confirmed (data not shown) by 461
immunohistochemistry on adjacent sections that expression of GR- and MR-mRNA co-localises with 462
CRH (Huising et al., 2004). So far, the presence of GR protein in these cells was shown for rainbow 463
trout (Teitsma et al., 1998) and Mozambique tilapia (Oreochromis mossambicus) (Pepels et al., 2004). 464
However, the antiserum used in these studies does not distinguish between GR gene species. To the 465
best of our knowledge, no data on MR distribution in other fish brains are available. In mammals the 466
Page 17 of 36

18
MR was described in the ventromedian and arcuate nuclei of the hypothalamus and the GR in the 467
arcuate nuclei, paraventricular and supraoptic nucleus of the hypothalamus, (Reul & de Kloet, 1985); 468
the hypothalamic arcuate nucleus is an important target for metabolic and hormonal signals controlling 469
food intake and feeding behaviour (Meister, 2007). Clearly, future studies on GR and MR localisation 470
in the fish analogues of these structures are warranted as we know that regulation of stress an feeding 471
(arcuate nucleus in fish) are strongly intertwined, also in fish (Bernier et al., 2004). 472
In carp pituitary gland, the two GR genes co-localise in the same areas. Remarkably little 473
expression was seen in pars intermedia and would imply limited feedback by cortisol on MSH and 474
somatolactin producing cells. This reminds of the situation reported for trout (Teitsma et al., 1998), 475
but not for tilapia that has significant GR-immunoreactivity in the pars intermedia (Pepels et al.,476
2004), although mRNA expression could not be detected (Kitahashi et al., 2007). The strongest signal 477
for GR mRNA was seen in the proximal pars distalis GH-cells (in line with observations for GR1 on 478
trout (Teitsma et al., 1998) and tilapia; (Kitahashi et al., 2007, Pepels et al., 2004)). Stress/cortisol 479
induced suppression of growth, for instance seen after handling or confinement of fishes is thus 480
explained by down-regulation of GH cells (Auperin et al., 1997). In the rostral pars distalis finally, 481
ACTH-cells express significant levels of GR mRNA, as one could predict as a basis for feedback 482
control in the stress axis. Interestingly, recent data in tilapia showed no mRNA expression of either of 483
the duplicated GRs in ACTH producing cells (Kitahashi et al., 2007), whereas immuno-histochemical 484
studies with an antibody against GR showed positivity in ACTH cells in tilapia and rainbow trout 485
(Pepels et al., 2004) (Teitsma et al., 1998). Prolactin cells, however, known to become activated 486
during chronic stress (Auperin et al., 1997), showed no detectable GR-expression (Teitsma et al.,487
1998). This only seems at variance with recent reports on direct effects of cortisol on prolactin cells 488
(Uchida et al., 2004): a G-protein coupled membrane receptor for cortisol should be considered. 489
Indeed, the reported effects of cortisol on prolactin cells reported are fast, faster than one would 490
predict for GR/MR mediated genomic effects. 491
MR mRNA was far more abundant in the pars distalis than in the pars intermedia. Based on 492
comparisons with GR staining, we predict MR expression to be scarcely expressed in the α-MSH cells 493
of the pars intermedia and strongly expressed in the GH cells of the pars distalis. Unfortunately, we 494
Page 18 of 36

19
were unable to demonstrate MR mRNA in ACTH cells specifically. Assuming (by analogy to the 495
situation for GR mRNA) absence of MR mRNA in prolactin cells, our RQ-PCR data would favor 496
presence of MR in ACTH-cells; this part of our study requires future attention. 497
498
Physiology499
Restraint by netting for 24h resulted in hyperglycemia, hyponatremia, typical signs of strong 500
catecholaminergic activation and inherent loss of control over integumental permeability to water and 501
ions (Wendelaar Bonga, 1997). A persistent hypercortisolinemia was observed, but the duration of the 502
stress condition proved insufficient to induce feedback by cortisol. However, a more persistent stress 503
of repeated cold transfer induced high cortisol levels and hyperglycemia and mild hypernatremia 504
indicative of adaption to the stressor. Mild hypernatremia is typical for enhanced prolactin activity and 505
successful restoration of blood mineral levels to a new set point (Metz et al., 2003). This longer-term 506
adaptation process did involve measurable down-regulation of CRs in brain (without hypothalamus 507
and pituitary gland). This observation suggests a central initiation of downregulation of cortisol 508
release, rather than direct feedback via NPO or pituitary gland. In tilapia, a similar regulation system 509
was suggested; cortisol feedback on CRH release is exerted via the forebrain medial part of dorsal 510
telencephalon (Pepels et al., 2004). Our observation of GR and MR mRNA down-regulation only 511
following persistent stress is further consistent with experiments on Coho salmon (Oncorhynchus 512
kisutch) that showed no effect of acute stress on GR expression whereas chronically elevated cortisol 513
levels in several other paradigms did (Maule & Schreck, 1991). 514
The MR mRNA in carp brain was down-regulated to the same extent as the mRNA levels of 515
both GRs. This seems in contrast with the mammalian model where GR stimulates HPA axis activity, 516
whereas MR has an inhibiting effect (De Kloet et al., 1998). However, a similar result was found in 517
hippocampus of rats exposed to increasing corticosteroid levels (Hugin-Flores et al., 2004). And in 518
mouse pups with high corticosteroid levels due to 24 hr maternal deprivation, both GR and MR 519
mRNA expression were significantly decreased (Schmidt et al., 2003). These discrepancies between 520
different stressors are thus of wider occurrence and require further and species specific approaches. 521
Page 19 of 36
20
In conclusion, we show that carp express separate glucocorticoid receptors for regulation 522
under basal and stressful conditions. We predict an ancestral role not only for the duplicated GRs but 523
also for MR in stress physiology, based on receptor localisation and expression profile after chronic 524
stress and provide a receptor profile in brain conform memory and learning functionalities in fishes as 525
in higher vertebrates. A role for DOC in stress physiology in fishes has never been considered but 526
seems a reasonable hypothesis for future research. More in-depth studies on specific roles of these 527
receptors in learning and stress physiology will therefore elucidate early strategies in vertebrate 528
evolution to control the basics of life. 529
530
531
Ackowledgements 532
We gratefully acknowledge Ms. Sandra Janssen and Mrs. Liesbeth Pierson for their excellent technical 533 assistance during experiments. F.A. Tom Spanings is thanked for excellent fish husbandry. Support of 534 the Smart Mix Programme of the Netherlands Ministry of Economic Affairs and the Netherlands 535 Ministry of Education, Culture and Science is gratefully acknowledged. The authors declare that there 536 is no conflict of interest that would prejudice the impartiality of this scientific work. 537
Page 20 of 36
21
References
Altschul SF, Madden TL, Schaffer AA, Zhang J, Zhang Z, Miller W & Lipman DJ 1997 Gapped BLAST and PSI-BLAST: a new generation of protein database search programs. Nucleic Acids Res 25 3389-3402. Arends RJ, van der Gaag R, Martens GJ, Wendelaar Bonga SE & Flik G 1998 Differential expression of two pro-opiomelanocortin mRNAs during temperature stress in common carp (Cyprinus carpio L.). J Endocrinol 159 85-91. Auperin B, Baroiller JF, Ricordel MJ, Fostier A & Prunet P 1997 Effect of confinement stress on circulating levels of growth hormone and two prolactins in freshwater-adapted tilapia (Oreochromis niloticus). Gen Comp Endocrinol 108 35-44. Baker ME, Chandsawangbhuwana C & Ollikainen N 2007 Structural analysis of the evolution of steroid specificity in the mineralocorticoid and glucocorticoid receptors. BMC Evol Biol 7 24. Balment RJ & Henderson IW 1987 Secretion of endocrine glands and their relationship to osmoregulation.,p.^pp Pages, edn. Ed.^Eds II Chester-Jones, P.M. Phillips, J.G. . New York: Plenum press. Basu N, Kennedy CJ & Iwama GK 2003 The effects of stress on the association between hsp70 and the glucocorticoid receptor in rainbow trout. Comp Biochem Physiol A Mol Integr Physiol 134 655-663. Bernier NJ, Bedard N & Peter RE 2004 Effects of cortisol on food intake, growth, and forebrain neuropeptide Y and corticotropin-releasing factor gene expression in goldfish. Gen Comp Endocrinol 135 230-240. Bridgham JT, Carroll SM & Thornton JW 2006 Evolution of hormone-receptor complexity by molecular exploitation. Science 312 97-101. Brunet FG, Crollius HR, Paris M, Aury JM, Gibert P, Jaillon O, Laudet V & Robinson-Rechavi M 2006 Gene loss and evolutionary rates following whole-genome duplication in teleost fishes. Mol Biol Evol 23 1808-1816. Buckley TM, Mullen BC & Schatzberg AF 2007 The acute effects of a mineralocorticoid receptor (MR) agonist on nocturnal hypothalamic-adrenal-pituitary (HPA) axis activity in healthy controls. Psychoneuroendocrinology.Bury NR & Sturm A 2007 Evolution of the corticosteroid receptor signalling pathway in fish. Gen Comp Endocrinol 153 47-56. Bury NR, Sturm A, Le Rouzic P, Lethimonier C, Ducouret B, Guiguen Y, Robinson-Rechavi M, Laudet V, Rafestin-Oblin ME & Prunet P 2003 Evidence for two distinct functional glucocorticoid receptors in teleost fish. J Mol Endocrinol 31 141-156. Chenna R, Sugawara H, Koike T, Lopez R, Gibson TJ, Higgins DG & Thompson JD 2003 Multiple sequence alignment with the Clustal series of programs. Nucleic Acids Res 31 3497-3500. De Kloet ER, Vreugdenhil E, Oitzl MS & Joels M 1998 Brain corticosteroid receptor balance in health and disease. Endocr Rev 19 269-301. Engelsma MY, Stet RJ, Schipper H & Verburg-van Kemenade BM 2001 Regulation of interleukin 1 beta RNA expression in the common carp, Cyprinus carpio L. Dev Comp Immunol 25 195-203. Flik G & Perry SF 1989 Cortisol stimulates whole body calcium uptake and the branchial calcium pump in freshwater rainbow trout. J Endocrinol 120 75-82. Force A, Lynch M, Pickett FB, Amores A, Yan YL & Postlethwait J 1999 Preservation of duplicate genes by complementary, degenerative mutations. Genetics 151 1531-1545. Gilmour KM 2005 Mineralocorticoid receptors and hormones: fishing for answers. Endocrinology 146 44-46. Greenwood AK, Butler PC, White RB, DeMarco U, Pearce D & Fernald RD 2003 Multiple corticosteroid receptors in a teleost fish: distinct sequences, expression patterns, and transcriptional activities. Endocrinology 144 4226-4236. Huang X & Miller W 1991 A time-efficient, linear-space local similarity algorithm. Advanced Applied Mathematics 12 337-357. Hugin-Flores ME, Steimer T, Aubert ML & Schulz P 2004 Mineralo- and glucocorticoid receptor mrnas are differently regulated by corticosterone in the rat hippocampus and anterior pituitary. Neuroendocrinology 79 174-184. Huising MO, Metz JR, van Schooten C, Taverne-Thiele AJ, Hermsen T, Verburg-van Kemenade BM & Flik G 2004 Structural characterisation of a cyprinid (Cyprinus carpio L.) CRH, CRH-BP and CRH-R1, and the role of these proteins in the acute stress response. J Mol Endocrinol 32 627-648. Irnazarow I 1995 Genetic variability of Polish and Hungarian carp lines. . Aquaculture 129 215-219. Kitahashi T, Ogawa S, Soga T, Sakuma Y & Parhar I 2007 Sexual maturation modulates expression of nuclear receptor types in laser-captured single cells of the cichlid (Oreochromis niloticus) pituitary. Endocrinology 148 5822-5830. Maule AG & Schreck CB 1991 Stress and cortisol treatment changed affinity and number of glucocorticoid receptors in leukocytes and gill of coho salmon. Gen Comp Endocrinol 84 83-93. Meek J & Nieuwenhuys R 1998 The central nervous system of vertebrates 2: Holosteans and Teleosts, p.^pp Pages, edn. Ed.^Eds R Nieuwenhuys, HJ Ten Donkelaar & C Nicholson. Heidelberg: Springer-Verlag.
Page 21 of 36

22
Meister B 2007 Neurotransmitters in key neurons of the hypothalamus that regulate feeding behavior and body weight. Physiol Behav 92 263-271. Metz JR, van den Burg EH, Bonga SE & Flik G 2003 Regulation of branchial Na(+)/K(+)-ATPase in common carp Cyprinus carpio L. acclimated to different temperatures. J Exp Biol 206 2273-2280. Mommsen TP, Vijayan MM & Moon TW 1999 Cortisol in teleosts: dynamics, mechanisms of action, and metabolic regulation. Reviews in Fish Biology and Fisheries 9 211-268. Nei M & Kumar S 2000 Molecular evolution and phylogenetics, p.^pp Pages, edn. Ed.^Eds New York: Oxford University Press Inc. Nilsson J, Kristiansen TS, Fosseidengen JE, Ferno A & van den Bos R 2007 Learning in cod (Gadus morhua): long trace interval retention. Anim Cogn.Pepels PP, Van Helvoort H, Wendelaar Bonga SE & Balm PH 2004 Corticotropin-releasing hormone in the teleost stress response: rapid appearance of the peptide in plasma of tilapia (Oreochromis mossambicus). JEndocrinol 180 425-438. Pfaffl MW 2001 A new mathematical model for relative quantification in real-time RT-PCR. Nucleic Acids Res 29 e45. Prunet P, Sturm A & Milla S 2006 Multiple corticosteroid receptors in fish: from old ideas to new concepts. Gen Comp Endocrinol 147 17-23. Reul JM & de Kloet ER 1985 Two receptor systems for corticosterone in rat brain: microdistribution and differential occupation. Endocrinology 117 2505-2511. Reul JM, van den Bosch FR & de Kloet ER 1987 Relative occupation of type-I and type-II corticosteroid receptors in rat brain following stress and dexamethasone treatment: functional implications. J Endocrinol 115 459-467. Reul JM, Gesing A, Droste S, Stec IS, Weber A, Bachmann C, Bilang-Bleuel A, Holsboer F & Linthorst AC 2000 The brain mineralocorticoid receptor: greedy for ligand, mysterious in function. Eur J Pharmacol 405 235-249. S Kumar KT, and M Nei 2004 MEGA3: Integrated software for Molecular Evolutionary Genetics Analysis and sequence alignment. . Briefings in Bioinformatics 5 150-163. Sambrook J & Russell DW 2001 Molecular Cloning, p.^pp Pages, edn. Ed.^Eds New York: Cold Spring Harbor Laboratory Press. Schaaf MJ, Champagne D, van Laanen IH, van Wijk DC, Meijer AH, Meijer OC, Spaink HP & Richardson MK 2007 Discovery of a functional glucocorticoid receptor {beta}-isoform in zebrafish. Endocrinology.Schmidt MV, Oitzl MS, Muller MB, Ohl F, Wurst W, Holsboer F, Levine S & De Kloet ER 2003 Regulation of the developing hypothalamic-pituitary-adrenal axis in corticotropin releasing hormone receptor 1-deficient mice. Neuroscience 119 589-595. Stolte EH, van Kemenade BM, Savelkoul HF & Flik G 2006 Evolution of glucocorticoid receptors with different glucocorticoid sensitivity. J Endocrinol 190 17-28. Sturm A, Bury N, Dengreville L, Fagart J, Flouriot G, Rafestin-Oblin ME & Prunet P 2005 11-deoxycorticosterone is a potent agonist of the rainbow trout (Oncorhynchus mykiss) mineralocorticoid receptor. Endocrinology 146 47-55. Teitsma CA, Anglade I, Toutirais G, Munoz-Cueto JA, Saligaut D, Ducouret B & Kah O 1998 Immunohistochemical localization of glucocorticoid receptors in the forebrain of the rainbow trout (Oncorhynchus mykiss). J Comp Neurol 401 395-410. Uchida K, Yoshikawa-Ebesu JS, Kajimura S, Yada T, Hirano T & Gordon Grau E 2004 In vitro effects of cortisol on the release and gene expression of prolactin and growth hormone in the tilapia, Oreochromis mossambicus. Gen Comp Endocrinol 135 116-125. Vargas JP, Bingman VP, Portavella M & Lopez JC 2006 Telencephalon and geometric space in goldfish. Eur J Neurosci 24 2870-2878. Volff JN 2005 Genome evolution and biodiversity in teleost fish. Heredity 94 280-294. Wendelaar Bonga SE 1997 The stress response in fish. Physiol Rev 77 591-625.
Page 22 of 36

23
Figure legends
Fig. 1 Alignment of corticosteroid receptor sequences of carp. Locations of probes are indicated; GR1
is underlined, GR2 is shown in bold and MR is shown in grey. Different regions of the receptors are
indicated below the alignment; the transactivation region is located N-terminally from the other
regions and has not been indicated. The nine amino acid insert present in the DNA binding region of
GR1 is shown in a larger, bold font. Asterisks indicate conserved amino acids, double points indicate
replacement by amino acids with high similarity and single points indicate replacement with amino
acids of low similarity.
Fig. 2 Similarities between the receptor domains (AB ~ transactivation region, C ~ DNA- binding
region, D ~ hinge region and E ~ ligand binding region) of the common carp and other vertebrate
corticosteroid receptors. Percentage amino acid identity of the different domains is shown in the
boxes. Amino acid length of particular domains is represented by length of boxes and is also
mentioned. Total length of each protein is shown at the right. Grey bar indicates 9 amino acid insert as
a result of alternative splicing.
Fig. 3 Phylogenetic tree, comparing the amino acid sequences of the vertebrate corticosteroid
receptors. This tree was generated with MEGA version 3.1 software using the neighbour-joining
method. Reliability of this tree was assessed by bootstrapping using 1000 bootstrap replications;
values in percentage are indicated at branch nodes. Atlantic hagfish and sea lamprey corticosteroid
receptors (CR) and human and rat androgen receptors (AR) are used as outgroup.
Common carp (Cyprinus carpio) GR1; AJ879149, GR2; AM183668, Rainbow trout (Oncorhynchus
mykiss) GR1; P49843, GR2; AY4953720, Burton’s mouthbrooder (Haplochromis burtoni) GR1;
AF263738, GR2a; AF263739, GR2b; AF263740, Zebrafish (Danio rerio) GR2; EF436284, GR2β;
EF436285 Japanese flounder (Paralichthys olivaceus) GR; (O73673), European sea bass
(Dicentrarchus labrax) GR1; AY549305, GR2; AY619996, Brown trout GR (Salmo trutta);
AY863149, Fathead minnow (Pimephales promelas) GR; AY533141, Puffer fish (Fugu) (Takifugu
Page 23 of 36

24
rubripes) GR1; GENSCAN00000003615 (scaffold 1264) & GENSCAN00000029451 (scaffold 4328),
GR2; SINFRUG00000143550 (scaffold 59), Green spotted puffer (Tetraodon) (Tetraodon
nigroviridis) GR1; GIDT00024792001 (Chr. 7), GR2; GSTENG00017027001 (Chr. 1) Stickleback
(Gasterosteus aculeatus) GR1; ENSGACP00000027400, GR2; ENSGACP00000024074, Japanese
Killifish (Medaka) (Oryzias latipes) GR1; ENSORLP00000001939, GR2; ENSORLP00000007570,
Mozambique or common tilapia (Oreochromis mossambicus) GR; BAA23662, African clawed frog
(Xenopus laevis) GR; P49844, Western clawed frog (Xenopus tropicalis) GR; CR848477,
Chicken (Gallus gallus) GR; ENSGALP00000011948 (Q8JHA4 partial), Platypus (Ornithorhynchus
anatinus) GR; ENSOANP00000009152, Pig (Sus scrofa) GR; AY779185 , Cow (Bos taurus) GR;
AY238475, Guinea pig (Cavia Porcellus) GR; P49115, Mouse (Mus musculus) GR; P06537, Rat
(Rattus norvegicus) GR; NP_036708, Human (Homo sapiens) GRα; P04150, Human GRβ;
NP_001018661, Human GRγ; NP_001019265, Carp (Cyprinus carpio) MR; AJ783704, Zebrafish
(Danio rerio) MR; ENSDARP00000053817, Rainbow trout (Oncorhynchus mykiss) MRa; Y495584,
MRb; AY495585, Burton’s mouthbrooder (Haplochromis burtoni) MR; Q8JJ89, Puffer fish (Fugu)
(Takifugu rubripes) MR; NEWSINFRUP00000129848, Green spotted puffer (Tetraodon) (Tetraodon
nigroviridis) MR; GSTENT00032894001, Stickleback (Gasterosteus aculeatus) MR;
ENSGACP00000022713, Japanese killifish (Medaka) (Oryzias latipes) MR; ENSORLT00000009439,
Chicken (Gallus gallus) MR;ENSGALP00000016283 (Q8QHI2, partial), Platypus (Ornithorhynchus
anatinus) MR; ENSOANT00000008378, African clawed frog (Xenopus laevis) MR; BC081082,
Mouse MR; XP_356093, Rainbow trout MR; AY495584, Human MR; M16801, Sea lamprey
(Petromyzon marinus) CR; AY028457, Atlantic hagfish (Myxine glutinosa) CR; DQ382336 Mouse
(Mus muscus) AR; M37890 Human (Homo sapiens) AR; P10275.
NB: Burton’s mouthbrooder nomenclature is different; GR1 has no splice variants (comparable
to common carp and rainbow trout GR2) and GR2 has two splice variants (comparable to
rainbow trout GR1); Burton’s mouthbrooder GR2b has a nine amino acid insert.
Fig. 4 Basal corticosteroid receptor expression in stress axis of control fish (A). Comparison of
quantitative real time PCR data was based on samples of four untreated fish and controls from 24hr
Page 24 of 36

25
netting experiment (n = 4) and controls of the cold water transfer experiment (n = 4). Data are plotted
as average of the mean of each of the 3 experiments relative to the housekeeping gene 40S; error bars
indicate standard error of the means of these 3 experiments.
NB; Gene expression data relative to housekeeping gene β-actin (n = 8) showed the same pattern
(not shown).
Basal corticosteroid receptor expression in different sections of the pituitary gland (n=5) (B). Insert
shows prolactin mRNA expression in different sections of pituitary.
Fig. 5 Localisation of GR1, GR2 and MR expression by ISH in cells of the telencephalon and the
NPO. Panel A-C; telencephalon; (A); insert; overview of the telencephalon with heamatoxilin and
eosin staining. Anti-sense probe for GR1(A), GR2 (B) and MR (C). Panel D-F; NPO; nucleus pre-
opticus of hypothalamus; anti-sense probe for GR1 (D), GR2 (E) and MR (F). GR1 with, Tel;
telencephalon, TeO; tectum opticum; pmc; nucleus pre-opticus magnocellularis, ppc; nucleus pre-
opticus parvocellularis. Scale bars indicate 500µm (A insert) or 100 µm (B – F).
Fig. 6 Localization of GR1 and GR2 expression in cells of the pituitary. Panel A; sense control for
GR1, B; anti-sense probe for GR1, C; detail of rostral pars distalis (RPD) with anti-sense probe for
GR1. Panel D; sense control for GR2, E; anti-sense probe for GR2, F; detail of RPD with antisense
probe for GR2. Panel G; overview of pituitary stained with heamatoxilin and eosin; H; detail of
proximal pars distalis (PPD) with antibody against GH, I; detail of RPD with antibody against ACTH.
PI; pars intermedia. Scale bars indicate 500 µm (A, B, D, E, G), 50 µm (H), 100 µm (C, F, I).
Fig. 7 Corticosteroid receptor expression in stress exposed fish. Gene expression of corticosteroid
receptors in stress axis organs after 24h restraint stress (A) and cold transfer (23˚C to 10˚C) stress (B).
Inserts of plasma cortisol, glucose and sodium levels are shown for control and stressed animals for
the respective experiments. Gene expression is shown in comparison to unstressed control fish of the
respective experiment and relative to β-actin.
Table 1. Primers used to generate in situ hybridisation probes.
Page 25 of 36
26
Gene Sequence Amplicon length (bp) GR1 fw 5’-AGC-ATC-CAG-GCC-CCT-GAC-AC-3’ 474
rv 5’-AGG-ACC-ACC-CAT-CCC-TGA-CAT-CTG-3’ GR2 fw 5’-CCT-TCA-GTG-GAC-TCC-CTG-ATT-G-3’ 509 rv 5’-GAA-GTG-GTG-ACG-CCG-CAG-ATG-TTA-A-3’MR fw 5’-CAY-YGT-GGG-GTC-ACC-TCC-AC-3’ 827 rv 5’-TCC-CTT-GCG-CTC-CAA-TCT-GG-3’
Page 26 of 36

27
Table 2. Primers used for gene expression studies.
Gene Sequence Amplicon length (bp)
Genbank Acc. no.
GR1 fw 5’-AGA-CTG-AGA-GGC-GGA-GCT-ACT-G-3’ 113 AJ879149 rv 5’GGC-GGT-GTT-GGC-TCC-AT-3’
GR2 fw 5’GGA-GAA-CAA-CGG-TGG-GAC-TAA-AT-3’ 110 AM183668 rv 5’GGC-TGG-TCC-CGA-TTA-GGA-A-3’ MR fw 5’TTC-CCT-GCA-GAA-CTC-AAA-GGA-3’ 117 AJ783704 rv 5’ACG-GAC-GGT-GAC-AGA-AAC-G-3’ PRL fw 5’CAT-CAA-TGG-TGT-CGG-TCT-GA-3’ 130 X52881 rv 5’TGA-AGA-GAG-GAA-GTG-TGG-CA-3’ β-actin fw 5’GCT-ATG-TGG-CTC-TTG-ACT-TCG-A-3’ 89 M24113 rv 5’CCG-TCA-GGC-AGC-TCA-TAG-CT-3’ 40S fw 5’CCG-TGG-GTG-ACA-TCG-TTA-CA-3’ 69 AB012087 rv 5’TCA-GGA-CAT-TGA-ACC-TCA-CTG-TCT-3’
Page 27 of 36
28
Table 3. Transactivation capacity of corticosteroid receptorsa.
aTable shows EC50 values of GR1, GR2 and MR for different hormones. Cortisol for GRs; average of three separate experiments with standard error of the mean; cortisol for MR, dexamethasone, aldosterone and DOC; single experiments. DOC; 11-Deoxycorticosterone. * GR2 is significantly more sensitive to cortisol than GR1 (P < 0.05)
Cortisol Dexamethasone Aldosterone DOC EC50 (nM) St. err. EC50 (nM) St. dev. EC50 (nM) St. dev. EC50 (nM) St. dev.
GR1 7.1 2.9 2.4 3.8 GR2 2.4 * 0.4 0.7 1.4 MR 4.1 2.0 0.46 4.1 0.25 3.6
Page 28 of 36

10 20 30 40 50 60 | | | | | | GR1 MD--------SGQKR--------SSNNGENLT---------LGDCIERGFVPDIG----- GR2 MDQG---GLTNGAKRD----DHLNTLDYSNSP---------VEGILRSGIQSAMP----- MR METKRYQSYREGANAENKLAQMPNTMDYCCSAEEHLTNSDMLMDNVNSSNAPNMPSVCKD *: .* : .: : . : . :. . . : 70 80 90 100 110 120 | | | | | | GR1 -----VNVSALN-----------TSKDFSNGQSGSDAQRNLSLADPSLLGRNTQEPAVKA GR2 -----VAPTSLVPQPNP--LMQPVSGDVPNGLSNSPTLEEHTTSVSSTLGIFGEDSELKM MR NNFKTTETTMLRVNQNQPLLFPSFNNSFQNRKSETDS-KELSKTVAESMGLYMNAAREAD . : * . .. * * : : .: : : .. :* : . 130 140 150 160 170 180 | | | | | | GR1 FKPFRM-----QHQQKVKEPLNIGENFSLLDESIADLNRGS-------SIQAPDTFTMKM GR2 VGKEQR-----AHQHQTLGAFTLGDSFSSLEASIADLNSTSPSVDSLIGGMDPNLFPLKT MR FGFSQQGTAGGQGSPQKLYPLSGRANEDSQSRTTGSPKMKAPPASFPPGAQLPNGRPQEC . : . : .:. . . . : .. : : . *: . : 190 200 210 220 230 240 | | | | | | GR1 EQFSPMEKDRLDFP---SYGHMDKELDS-NERVIGDNTIDILKDLDLPDSLSDLNELYVA GR2 EEYSLMDKGDMDLDQ-DSFGPIGKDGDVDNHKLFSDNTLDLLQDFELDGSPSDF---YGA MR AVVSASVPSAMAATLSCSTDGSGPMSSPTGHNMVSSTTSPTFFDSDCPSLASTHTNLIQG * . : * . . . ...:....* : * : . * . 250 260 270 280 290 300 | | | | | | GR1 DEAA------FLSSLAVDDALLGESNFLKD-----------TSPVVTGN----SAACANV GR2 DDP-------FLSTISEDALLGDLPTITER-----------DSKVAVNG----ATTTPST MR QHTSPNTCSPVKSSVVGSPPLASPLSVIKSPVSSPHSIGSVSSPLSCNTNMRSSVSSPTT :.. . *:: . * . .. : * : . :.: ... 310 320 330 340 350 360 | | | | | | GR1 NGMGKR-------QQMVEASVNIKTEKDAD------------------------------ GR2 SGIN----------TVTVSLPTVKVEKDS------------------------------- MR YGGNTSNIRPSISSPPTVGSMTMSSPRNSSRGFSVSSPPSGLGLVQNDVNSPESREHDFK * . . . .:. ::: 370 380 390 400 410 420 | | | | | | GR1 ---------------FIQLCTPGVIKQETER-----RSYCQMSGMGGPHSG--------- GR2 ---------------IIQLCTPGVIKQENNGG----TKYCQASLHSTPIN---------- MR AFEFPKVENVDGEIFNIGLDAMGVAKYIKNEPGTDYRSMCLGSSKSAMPHSPFITHIKTE * * : ** * .: . * * . 430 440 450 460 470 480 | | | | | | GR1 -----PTTLGDMGGQGYHYGAN---TASAVSLPDQKPPFGLF----SPLPTLSDGWVRGN GR2 -----ICGVTTSVGQSFLIGTSP-STAAVSQQKDQKPVFNVY----TPVTSSEDGWGRGY MR PNREVTCSNLQFVEPQHSLGCFPSTETTYLSLRDNIDEYSLSGILGPPVLSLNGNYEPGV . * :: . *: :.: .*: : ...: * 490 500 510 520 530 540 | | | | | | GR1 --GYGDPSGMQR-ANETVLP----------------------------STYPYSRPEASA GR2 --GFGNASEMQQRASESFSKN---------------------------YTSPYARPEDST MR FPNNGLPKGIKQETSDGSYYQENNNVPTSAIVGVNSGGHSFHYQIGAQGTMSFSRHNLRD . * .. ::: :.: * .::* : 550 560 570 580 590 600 | | | | | | GR1 SSS---------------------------------------------SGSVKPGGNTHK GR2 ATS---------------------------------------------SAAGKSG--THK MR QTNPLLNLISPVTGLMETWKTRPGLSQGPLSARGDGYPGSVCLTENMESASVRHTSSTAK :. *.: : * *
Page 29 of 36

610 620 630 640 650 660 | | | | | | GR1 ICLVCSDEASGCHYGVLTCGSCKVFFKRAVEGWRARQNADGQHNYLCAGRNDCIIDKIRR GR2 SCLVCSDEASGCHYGVLTCGSCKVFFKRAVEG---------QHNYLCAGRNDCIIDKIRR MR VCLVCGDEASGCHYGVVTCGSCKVFFKRAVEG---------QHNYLCAGRNDCIIDKIRR ****.**********:*************** ******************* ����------------------- DNA binding region -------------------���� 670 680 690 700 710 720 | | | | | | GR1 KNCPACRFRKCLQAGMNLEARKNKK---LMRLRGHSSSSEQ----APALPEER------- GR2 KNCPACRYRKCLMAGMSLEARKNKRGRQTGKVIQQPSIPERS---LPPLPE--------- MR KNCPACRVRKCLQAGMNLGARKSKKLG-KMKSVGEDSSLQNSKDGLPFLTSEKELSSVST ******* **** ***.* ***.*: : . * :. * *..
����DNA binding region��������------------Hinge region----------------���� 730 740 750 760 770 780 | | | | | | GR1 MCSLVPKAMPQLVPTMLSLLKAIEPEIIYAGYDSTIPDTSTRIMTTLNRLGGRQVISAVK GR2 VQALVPKPMPQVVPTMLSLLKAIEPDTIYAGYDSTIPDTSIRLMTTLNRLGGRQVISAVK MR LVPHVPTVAPFLSPSVCSVLELIEPEVVFAGYDNTQPDTTDHLLTSLNHLAGKQMIRVVK : . **. * : *:: *:*: ***: ::****.* ***: :::*:**:*.*:*:* .**
-------��������------------------ Ligand binding region ---------���� 790 800 810 820 830 840 | | | | | | GR1 WAKALPGFRNLHLDDQMTLLQCSWLFLMSFGLGWRSYQQCNGGMLCFAPDLVINEERMKL GR2 WAKALPGFRNLDLDDQMTLLQCSWLFLMSFGLGWRSYQQCNGNMLCFAPDLVINEERMRL MR WAKVLPGFRSLPIEDQITLIQYSWMCLSSFSLSWRSYKHTNAQMLYFAPDLVFNEERMQQ ***.*****.* ::**:**:* **: * **.*.****:: *. ** ******:*****:
����--------------------- Ligand binding region --------------���� 850 860 870 880 890 900 | | | | | | GR1 PYMNDQCSQMLKITSELVRLQVSYDEYLCMKVLLLLSTVPKDGLKSQAVFDEIRMSYIKE GR2 PYMNDQCEQMLKISNEFVRLQVSNEEYLCMKVLLLLSTVPKDGLKSQSVFEELRMSYIKE MR SAMYDLCVGMRQVSQEFVRLQLTYEEFLAMKVLLLLSTVPKDGLKNQGAFEEMRVNYIKE . * * * * :::.*:****:: :*:*.****************.*..*:*:*:.****
����--------------------- Ligand binding region --------------���� 910 920 930 940 950 960 | | | | | | GR1 LGKAIVKREENSSQNWQRFYQLTKLLDSMQEMVEGLLNFCFYTFVN-KSLSVEFPEMLAE GR2 LGKAIVKREENSSKNWQRFYQLTKLLDSMHDMVGGLLNFCFYTFVN-KSLSVEFPEMLAE MR LRRSVGKATNNSGQTWQRFFQLTKLLDTMHELVGSLLDFCFYTFRESQALKVEFPEMLVE * ::: * :**.:.****:*******:*:::* .**:****** : ::*.*******.*
����--------------------- Ligand binding region --------------���� 970 980 | | GR1 IISHQLPKFKDGSVKPLLFHQK GR2 IISNQLPKFKAGSVKSLLFHQK MR IISDQIPKVESGLTHTLYFHKK ***.*:**.: * .:.* **:*
���� Ligand binding region ����
Page 30 of 36

Carp GR 1
Carp GR 2 90%28%
385 aa 66
4141
84%252 aa
Zebrafish GR 31%
386 aa
4539
Zebrafish GRb 31%
386 aa 66
4539
86%
Human GR 75%25%
419 aa 68
2838
87%253 aa
Human MR 59%14%601 aa 68
2864
83%251 aa
Carp MR
AB C D E
252 aa75363 aa 39
58%12%
385 aa 66
5340
84%251 aa
984 aa
778 aa
971 aa
745 aa
730 aa
66
86% 91%252 aa
75%243 aa
737 aa
746 aa
Page 31 of 36
Common carp GR1
Brown trout GR
Rainbow trout GR1a
Rainbow trout GR1b
Burtons mouthbrooder GR2a
Burtons mouthbrooder GR2b
Japanese flounder GR
European seabass GR1
Stickleback GR1
Japanese killifish GR1
Puffer fish GR1a
Puffer fish GR1b
Green spotted puffer GR1a
Green spotted puffer GR1b
Common tilapia GR
Common carp GR2
Fathead minnow GR
Zebrafish GR
Zebrafish GRb
Rainbow trout GR2
European flounder GR
Puffer fish GR2
Green spotted puffer GR2
Japanese killifish GR
Burtons mouthbrooder GR1
Stickleback GR2
European seabass GR2
Gilthead seabream GR
African clawed frog GR
Western clawed frog GR
Chicken GR
Platypus GR
Guinea pig GR
Rat GR
Mouse GR
Human GRa
Human GRb
Human GRg
Common carp MR
Zebrafish MR
Rainbow trout MRa
Rainbow trout MRb
Japanese killifish MR Puffer fish MR
Burtons mouthbrooder MR
Stickleback MR
Green spotted puffer MR
African clawed frog MR
Chicken MR
Zebrafinch MR
Platypus MR
Mouse MR
Rat MR
Human MR
Lamprey CR
Atlantic hagfish CR
Human AR
Mouse AR100
100
100
100
99
100
82
87
100
99
100
100
100
100
100
99
82
100
100
99
91
100
79
100
100
100
100
100
100
67
100
100
100
100
98
93
78
76
100
47
100
100
100
86
54
100
89
72100
49
100
100
96
92
86
o
Te
est
fi
hR
ls
MT
eo
Gtr
apd
Re
oi
2
Tle
st f
shG
Ro
i
Te
est
fh
R 1
ls
G
Vr
bat
e
ete
r G
RV
erb
aeR
ter
M
ug
pO
ou
tr
Te
o M
Rtr
apd
Page 32 of 36

00
11
22
33
44
55
66
77
88
Basal corticosteroid receptor expression in control fish N = 12
Ex
pes
sio
n r
elat
ive
to 4
0r
S
Hypothalamus PituitaryBrain
GR 1
GR 2
MR
Ee
tn
xp
ress
ion
rla
tiv
eto
Ac
i
0.070.07
0.060.06
0.050.05
0.040.04
0.030.03
0.020.02
0.010.01
0.000.00
Basal corticosteroid receptor expression in the pituitary N = 5
**
**
Pars Intermedia Pars Distalis
0.5
1.0
1.5
2.0
2.5
0.0
Prolactin expression in pituitary N = 5
Pars Intermedia Pars Distalis
GR 1
GR 2
MR
A
B
**
Page 33 of 36

figure 5 199x90mm (300 x 300 DPI)
Page 34 of 36

Figure 6 199x149mm (300 x 300 DPI)
Page 35 of 36

1.50
1.00
0.50
0.0
Hypothalamus PituitaryBrain
Corticosteroid receptor expression after cold transfer stress (23 C to 10 C)
xr
ssio
nr
lai
eo
Ai
Ep
e
et
v t
ctn
GR 1
GR 2
MR
**
*
N = 5 N = 5N = 4
Cortisol concentration after cold transfer stress (23 C to 10 C)
Control Stress
250
150
250
200
100
50
0
Pa
a co
rti
ol
ng
/m
l)l
sms
(
**
N = 7 N = 7
0.0
0.5
1.0
1.5
2.0
2.5
Hypothalamus PituitaryBrain
Corticosteroid receptor expression after 24hr restraint stress
GR 1
GR 2
MR
pr
i
tA
nE
xes
so
nre
aiv
e to
ct
il
N = 4 N = 4 N = 4
2
6
0
4
8
10
12
Control Stress
N = 6 N = 7
al
Pla
sm g
luco
se (
mm
ol/
)
Glucose concentration after 24hr restraint stress
**
0
50
100
150
200
250
Cortisol concentration after 24hr restraint stress
Pas
co
ri
(n
gm
ll
ma
tso
l/
)
Control StressN = 6 N = 7
*
100
110
120
130
140
150
0
2
4
6
8
10
12
Pl
sm s
od
ium
( m
mo
l/a
aL
)
m)
Pla
sa
glu
cose
( m
mo
l/L
Sodium concentration after cold transfer stress (23 C to 10 C)
Control Stress
N = 7 N = 7
Control Stress
N = 7 N = 7
Glucose concentration after cold transfer stress (23 C to 10 C)
B
A
100
110
120
130
140
150
Pm
a so
diu
m
L
)la
s(
mm
ol/
Sodium concentration after 24hr restraint stress
Control Stress
N = 7 N = 7
**
Page 36 of 36