Embed Size (px)
Citation preview
REPORT NO. NADC-81174-60
CORROSION CONIROL TEST METHOD
FOR AVIONIC COMPONENTS
i • A, •, MORRIS
MC DO?4NELL AZRCRAFT COMPANYMC DONNELL DOUGLAS CORPORATION
P.O. Box 516St. Louis, Missouri 63166
25 September 1981
FINAL REPORTAIRTASK A320 320A/0011/IF61542000
Work Unit ZM510
APPROVED FOR PUBLIC RELEASE; DISTRIBUTION UNLIMITED
Prepared for DE -3 1981Aircraft and Crew Systems Technology Directorate
Warminster, Pennsylvania 18974 A
, 1 05
S~8112•02 005
'-=a
NOTICES
REPORT NUMBERING SYSTEM The numbering if technical project reports issued by the Naval Air DevelopmentCenter is arranged for specific identification purposes. Each number consists of the Q-nter acronym, the calendaryear in which the number was a"igred, the sequence number at the report withip the specific calendar year, andthe official 2.digit correspondence code of the Command Office or the Functinnal Directorate responsible for thereport- For example: Report No. NAr.-78015-20 indicates the fifteeth Cemor report for the year 1978, and preparedby the Sytems Directorate. The numerical codes are as follows:
CODE OFFICE OR DIRECTORATE
00 Commander, Naval Air Development Center01 Technical Oirector, Naval Air Development Center02 Comptoriler10 Directorate Commad Projects20 Systems Oirerate30 Sensors & Avionics Technology Directorate40 Communication Er Navigation Technology Directorate50 Software Comphor Directorateso Aircraft & Crew Systems Technology Directorate70 Panning Assessment Resources80 Engineering Support Group
PRODUCT ENDORSEMENT . The discussion or instructions concerning comrmerdal praduw.s herein do not constýutean endorsement by the Government nor do they cnnvey or imply the Ucerse or right to use such products.
APFROVEO BY: DATE:S /
61,T .WOS•
CDR USN
!-mrT C ý r
rECURl -Y ,LAS1IFICAIl ON OF N"i. PAGE 'Whom Cats lnsrd,)
REPORT DICUMENTTRTION PAGE SREPORT DOCUMENTATION_ PAGE I BEFORE COMPLETING _ORN.
I REPORT NSMEN J "ACCEiION NO.J2 ;RECqI!p'T's CA.' a NUMI(ER
NADC-81174-60 /___... . ... ____
4. TITLE (ad Swbtljel S. TS PFE OF fREPORT & 0!EROO COVERED
Corrosion Control Test Method _,:r i - 7 Sep 77 - 27 May 81Components 6 O OPF. 4EIOG NUMBER
7 AU~'N'opfs) - GN AC 3 AWP~ .4mUEmi~tr
A. W. Morris N62269-79-C-0257
9 0I"VP',1WOAMING ORG14MIZATION NAME ANO ADORES$S 10 E AMOGAAM ELEMENT NuM0jBeC 'ASKXc~~onneli~~ Aicr f Cm an PEA Al "ORK •IIT ,4UM§J[r•
McDonniell Aircraft Company AIRTASK A320 320A/0013/3L. Louis, MO 63166 IF61'542000
Work Unit =M10
i ONTrPOL1II.1 C" 'C1 NAME•"NO 4 10 OIRSS i '2 qEPO T MATE
NAVAL AIR 1EVELOPMENT CENTES 1. 2) Spetamber 19S1Aircraft and Crew Systems Technology Directorate 3 NUMIER Off WAGES
Warminster, PA 13974 _,1
'* 4 O N I '~ R f N O A1 - I CA N A M E 41 A O O R E S S ( It al , if r e rn t OM f • n't r o l l n if O lf ic e o 'S S 'U R F t V ' L ý5 . 'O5 1. 1 . '. o o r u
I UNC1ASS IFIED
S• 'ECLASSIFICATION "'O14GRAOINUSC4 EMU LE
14 JJS'f'•UUr1N S AT& ME7N 'at .efil pot)
Approved for public release; distribucion unlimited
17 DISTRI!UTION STA-i'.ENT .0o I(h. abutract entered in BWock 20, If different Froml Report)
'A SUPOLEME4CTANY .CTES
19 ( f 40140 COi ntinue ,3 reverse aide iI roceasary wRP Identi"y ba block nur'berj
Corrosion Test Method, Aircraft Carrier Environment Avionics Corrosion?revention, Accelerated Laboratory Corrosion Test, High Temperature SulfurDioxide Salt 7og Test
ZO. ASST'R AC 'Confenue on *e--raw ide itf nece•.•ar, end dert~fy Lv block numb•o,
The program objective was to develop an accelerated laboratory corrosiontest capable of simulating the severe corrosive effects of an aircraft carrierdeplovrent envirunment. The current standard 5% salt fog Lest is 7ot zc'!ereenough to simulate the -arrier environment., thus limiting its usefuLness in:orecasting corrcsion failures.
To provide test standards, representative al-icrical and elecronic unit3were exposed on an oil burning carrier during a 9 month tropical cruise and on
DO s,:mt3 1473 " ¶JTNCLASS1!FwDS SECUIiTy C,,ASSfffCATION OF TWIS P&OE W•l•t, Dtra Enter*
SECURITY CL..ASSIFICATION OYr TWIS PAGErf'h..n Data Enltered)
20. ABSTRACT
-a nuclear carrier during a 10 month tropical cruise. series of laboratorytests were run to identify corrosion environments whi-h provide good corre-lation with actual carrier results. The tests were also Judged on theirability to promote moisture related electrical failures. .
During the final phase )f the program, 25 electronic and electricalcomponents were exposed to the two most promising test methods.
The selected test method is a modification of the NADC sulfur dioxide saltfog test. It utilizes a much higher exposure temperature and a dilute substi-tute ocean water solution for fog generation. In one week this test methodproduces both corrosion damage and electrical failures that correlate with thecondition of the test articles exposed for nine to ten months on an aircraftcarrier.
I1
- .1
UNCLASSIFIEDSECURITY CLASSIFICATION OF THIS PAGErt•e.n D•te Entered)
NADC 81174-601
ABSTRACT
The program objective was to develop an accelerated labora-tory corrosion test capable of simulating the severe corro3siveeffects of an aircraft carrier deployment environment. The cur-rent standard 5% salt fog test is not severe enough to simulatethe carrier environment, thus limiting its usefulness in forecast-ing corrosion failures.
To provide test standards, representative electrical andelectronic units were exposed on an oil burning carrier during an9 month tropical cruise and on a nuclear carrier during a 10month tropical cruise. A~ series of laboratory tests were run toidentify corrosion environments which provided good correlationwith actual carrier results. The tests were also judged on theirability to promote moisture related electrical failures.
During the final phase of the program, 25 electronic andelectrical components were exposed to the two most promising testmethods.
The selected test method is a modification of the NADC sul-fur dioxide salt fog test. Tt utilizes a much higher exposuretemperature and a dilute substitute ocean water solution for foggeneration. In one week thi±s test method produces both corrosiondamage and electrical failures that correlate with the conditionof the test articles exposed for eight to ten months on an air-craft carrier.
C~r-1
iii A
NADC 81174-60
FOREWORD
This final report describes work performed on Navy ContractN62269-79--C-0257 "Corrosion Control Test Method for AvionicComponents." The work reported herein was performed by theMcDonnell Aircraft Company, McDonnell Douglas Corporation, St.Louis, Missouri. The program was administered under the direc-tion of the Naval Air Development Center by Irving Shaffer.
The program was conducted by the Materials and ProcessDevelopment Department at McDonnell Aircraft Company, St. Louis,and was managed by H. C. Turner, with A. W. Morris as principalinvestigator. Other contributors to the program includeH. M. Keeser, E. Malakelis, and E. A. Muegge who were responsiblefor running the laboratory tests.
This report covers the entire program contract period fromDecember 1979 to March 1981.
iv
iv
NADC 811/4-60
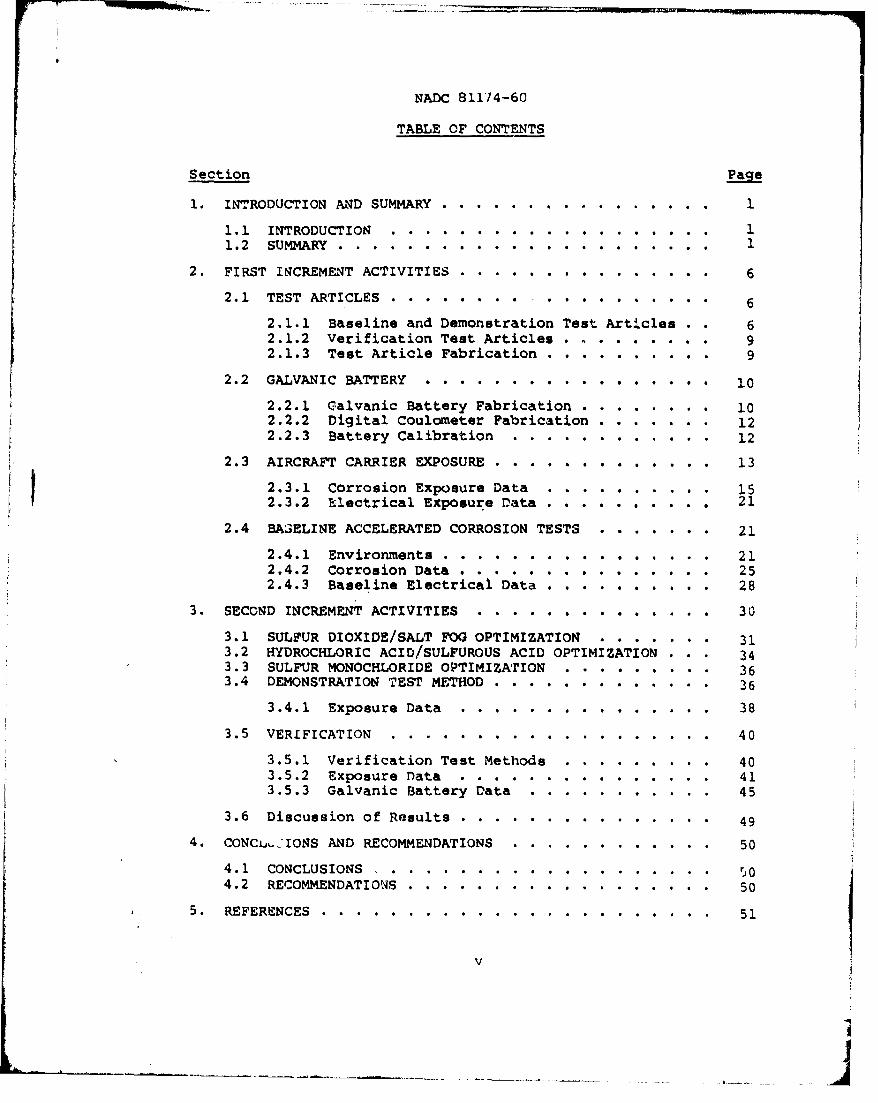
TABLE OF CONTENTS
Section PACe
1. INTRODUCTION AND SUMMARY .......... .... ................ 1
1.1 INTRODUCTION ............................... 11.2 SUMMARY ......................... ...... 1
2. FIRST INCREMWT ACTIVITIES .... ................. 6
2.1 TEST ARTICLES .................. 6
2.1.1 Baseline and Demonstration Test Articles . * 62.1.2 Verification Test Articles . . . . . . . .. 92.1.3 Test Article Fabrication. . . . . . . . . . 9
2.2 GALVANIC BATTERY .. .. .. .. .. .. .. . .. 10
2.2.1 Galvanic Battery Fabrication . .. .. . .. 102.2.2 Digital Coulometer Fabrication .. .. . .. 12
2.2.3 Battery Calibration .... ............ .. 12
2.3 AIRCRAFT CARRIER EXPOSURE .... ... . . . . . . . . 13
2.3.1 Corrosion Exposure Data . . ......... 152.3.2 Electrical Exposure Data . . . . . . . . .*. 21
2.4 BASELINE ACCELERATED CORROSION TESTS . . . . . .*. 21
2.4.1 Environments . . . . . . . . . . . . . . . . 212.4.2 Corrosion Data ...... . .. .. 252.4.3 Baseline Electrical Data . . . . . . . . . . 28
3. SECOND INCREMENT ACTIVITIES . . . . . . . . . . . . . . 30
3.1 SULFUR DIOXIDE/SALT FOG OPTIMIZATION .. ....... .. 313.2 HYDROCHLORIC ACID/SULFUROUS ACID OPTIMIZATION . . . 343.3 SULFUR MONOCHLORIDE OPTIMIZATION . . . . . . . . . 363.4 DEMONSTRATION TEST METHOD .... ............. .. 36
3.4.1 Exposure Data . .. ............. 38
3.5 VERIFICATION .......... ................... .. 40
3.5.1 Verification Test Methods ... ......... .. 403.5.2 Exposure Data ...... ............... .. 413.5.3 Galvanic Battery Data .... ........... .. 45
3.6 Discussion of Results ..... ............... .. 49
4. CONCiJ-IONS AND RECOMMENDATIONS .... ............ 50
4.1 CONCLUSIONS . . . . . . . . . . . . . . . . . . . r04.2 RECOMMENDATIONS ....... .................. .. 50
5. REFERENCES . . . ........................ 51
____ ___ ____ V -~ -
J
NADC 81174-60
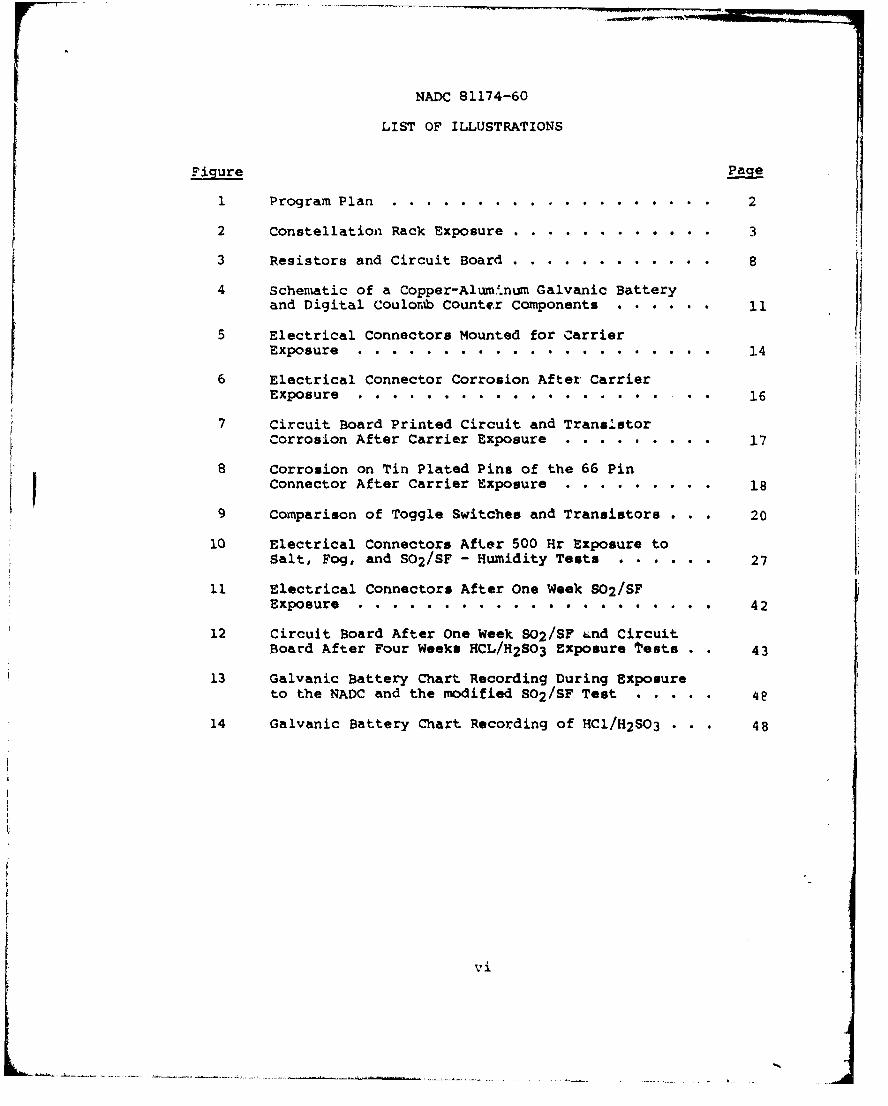
LIST OF ILLUSTRATIONS
Figure Pag
1 Program Plan.................... 2
2 Constellation Rack Exposure ..... .......... . . 3
3 Resistors and Circuit Board ..... ............ . 8
4 Schematic of a Copper-Alumi.num Galvanic Batteryand Digital Coulomb Counter Components ...... 11
Electrical Connectors Mounted for CarrierExposure . . . . . . . . . . . . . . . . . . . . . 14
6 Electrical Connector Corrosion After CarrierExposure . . . . . . . . . . . . .. . .. . . . . .. 16
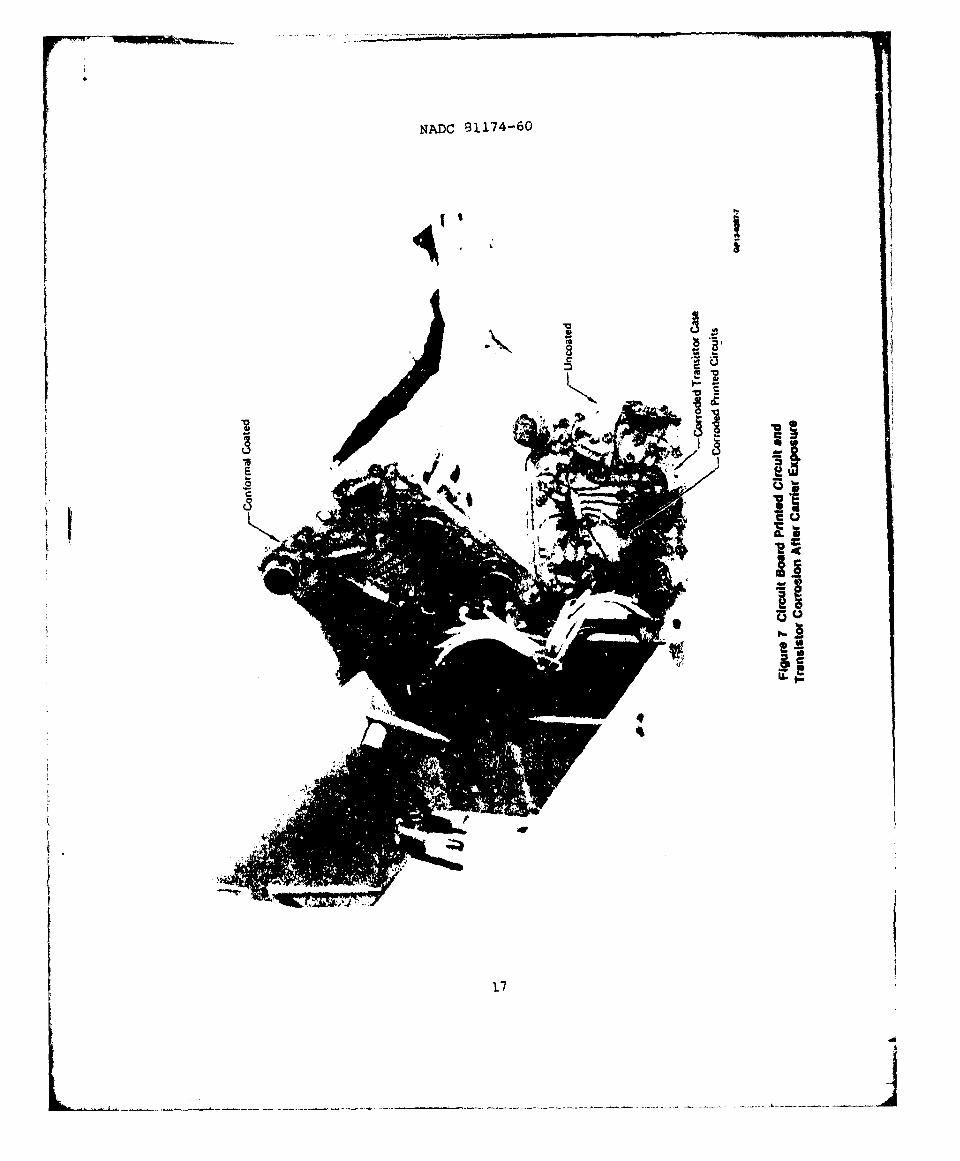
7 Circuit Board Printed Circuit and TransistorCorrosion After Carrier Exposure .. . ........ 17
8 Corrosion on Tin Plated Pins of the 66 PinConnector After Carrier Xxposure .. ......... .. 18
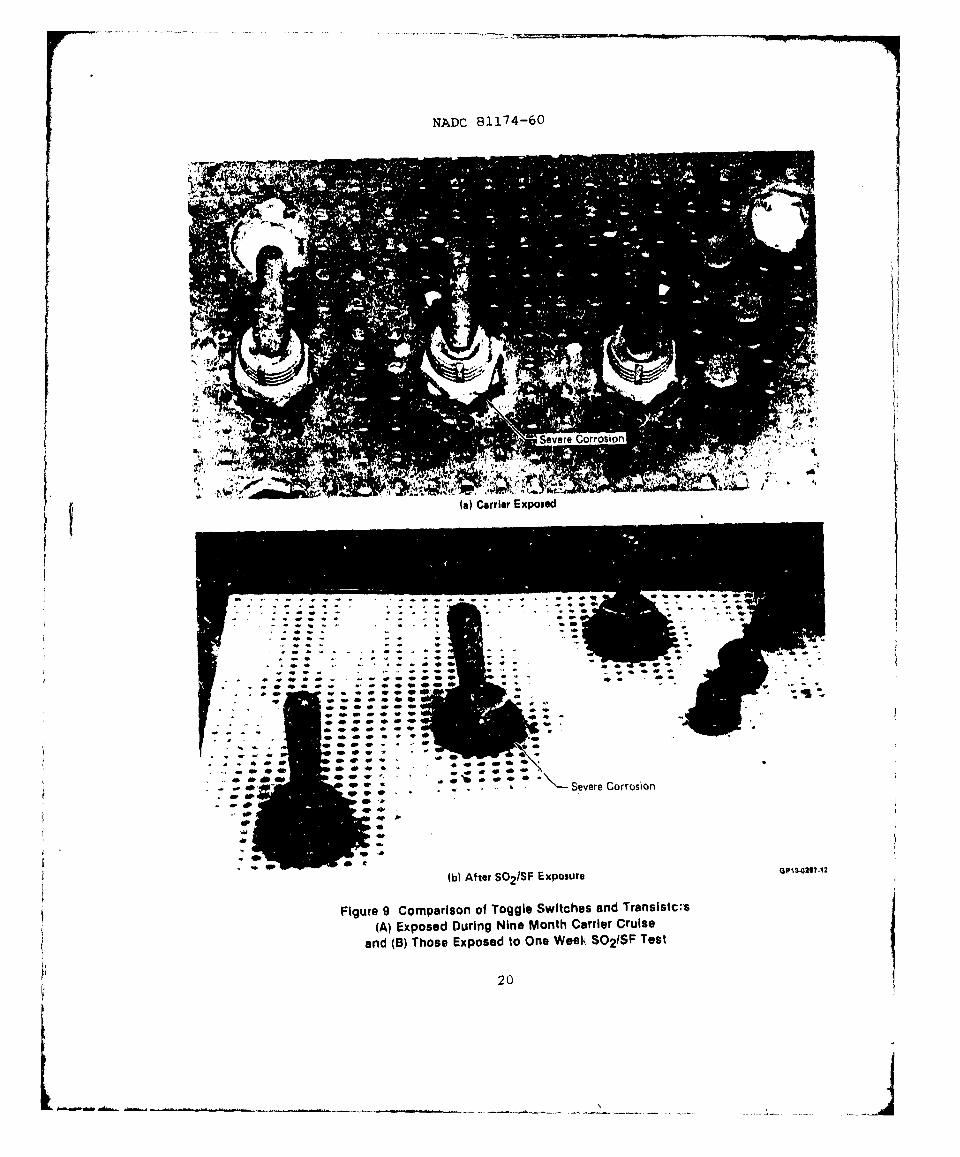
9 Comparison of Toggle Switches and Transistors . . . 20
10 Electrical Connectors After 500 Hr Exposure toSalt, Fog, and S0 2 /SF - Humidity Tests .. .. . . 27
11 Electrical Connectors After One Week S02/SFExposure . . . . . . . . . . . . . . . . . . . . . 42
12 Circuit Board After One Week S02/SF t•nd CircuitBoard After Four Weeks HCL/H 2 SO3 Exposure tests . . 43
13 Galvanic Battery Chart Recording During Exposureto the NADC and the modified S0 2 /SF Test .... .
14 Galvanic Battery Chart Recording of HCl/H2SO3 . 48
vi
k --J-----
NADC 81174-60
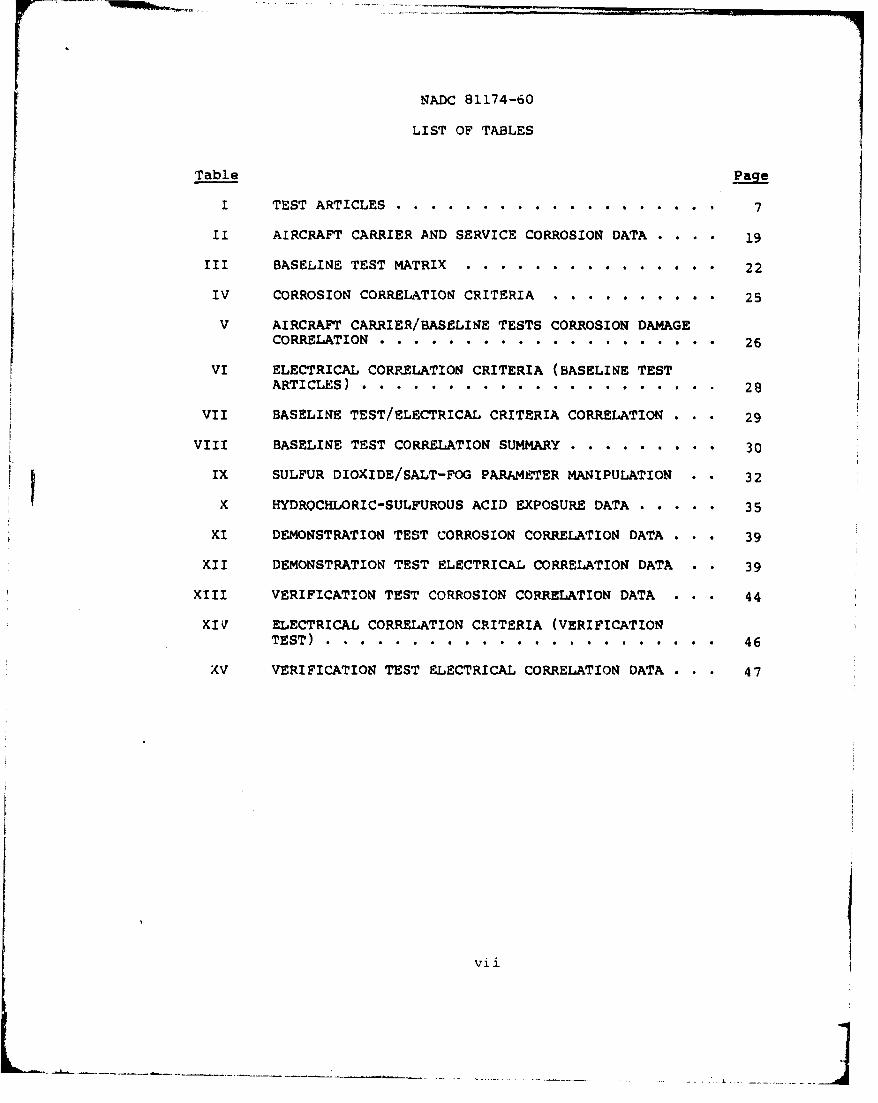
LIST OF TABLES
Table Page
I TEST ARTICLES .................................. 7
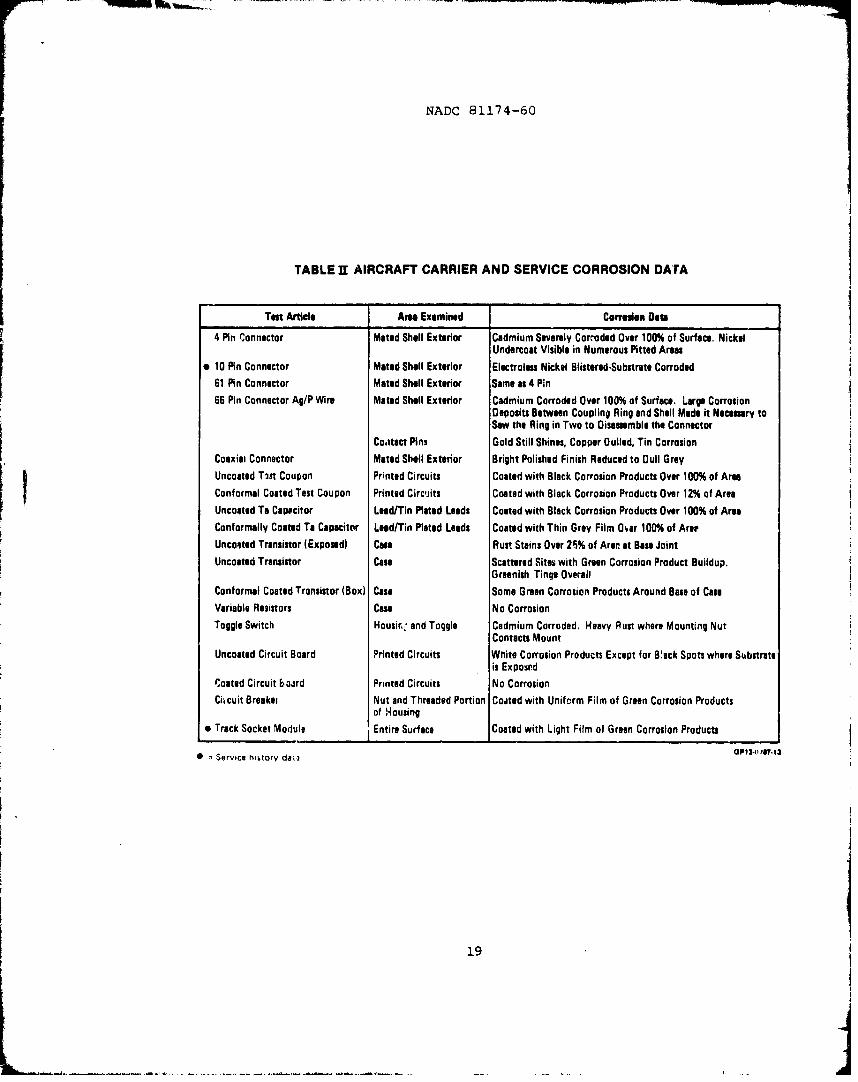
II AIRCRAFT CARRIER AND SERVICE CORROSION DATA . . . . 19
III BASELINE TEST MATRIX ............... *.*..... 22
IV CORROSION CORRELATION CRITERIA . . . .......... 25
V AIRCRAFr CARRIER/BASELINE TESTS CORROSION DAMAGECORRELATION . . . ................ . . 26
VI ELECTRICAL CORRELATION CRITERIA (BASELINE TESTARTICLES) . . . . . . . . . . . . . . . . . . . . 28
VII BASELINE TEST/ELECTRICAL CRITERIA CORRELATION . . . 29
VIII BASELINE TEST CORRELATION SUMMARY . . . . . . .. . 30
IX SULFUR DIOXIDE/SALT-FOG PARAMETER MANIPULATION • • 32
X HYDROCHLORIC-SULFUROUS ACID EXPOSURE DATA . . . . . 35
XI DEMONSTRATION TEST CORROSION CORRELATION DATA . . . 39
XII DEMONSTRATION TEST ELECTRICAL CORRELATION DATA • . 39
XIII VERIFICATION TEST CORROSION CORRELATION DATA . • • 44
XIv ELECTRICAL CORRELATION CRITERIA (VERIFICATIONTEST) .................................... 46
XV VERIFICATION TEST ELECTRICAL CORRELATION DATA • • • 47
vii
NADC 81174-60
i. INTRODUCTION AND SUMMARY
1.1 INTRODUCTION - A major reason for the increased effective-ness of modern military aircraft is the greatly enhancedcapabilities of their avionic systems. Therefore, successfulmission completion is increasingly dependent on avionic reli-ability. A Naval Air Development Center investigation (Reference1) shows that environmental related effects, such as corrosion,play a significant role in reducing avionics reliability, as wellas increasing maintenance and replacement costs.
An effective way of minimizing corrosion problems on futureproducts is to use a qualification test that is capable of identi-fying weaknesses or oversights in the design of avionic systemsthat result in premature corrosion related failures. This en-ables the designer to take the necessary corrective action beforethe system is put into fleet service.
The MIL-STD-810 5% salt fog test is currently the only testspecified in standards and specifications for evaluating avioniccomponents for resistance to marine environments. The neutralenvironment of the salt fog test cannot duplicate the wide rangeof service induced corrosion mechanisms because natural environ-ments are generally acidic as a result of the pre'ailing presenceof sulfur dioxide. For example, Ketcham (Reference 2) reportsthat moisture films on aircraft deployed on the flight deck offour different carriers had pH's ranging from 2.4 to 4.0.
The program objective is to develop an avionic corrosiontest that is tailored to the needs of certifying line replaceableunits (LRU) or individual components intended for use in aircraftcarrier deployed weapon systems. To be effective, the testmethod must produce corrosion failures in a few days that nor-mally occur after months or years of service. On the other hand,it must not produce failures that will not occur in service. Thetest method should also be designed for exposing LRU's in theiravionic boxes or electrical connectors without the benefit ofenclosures to represent weapon system installation practice.
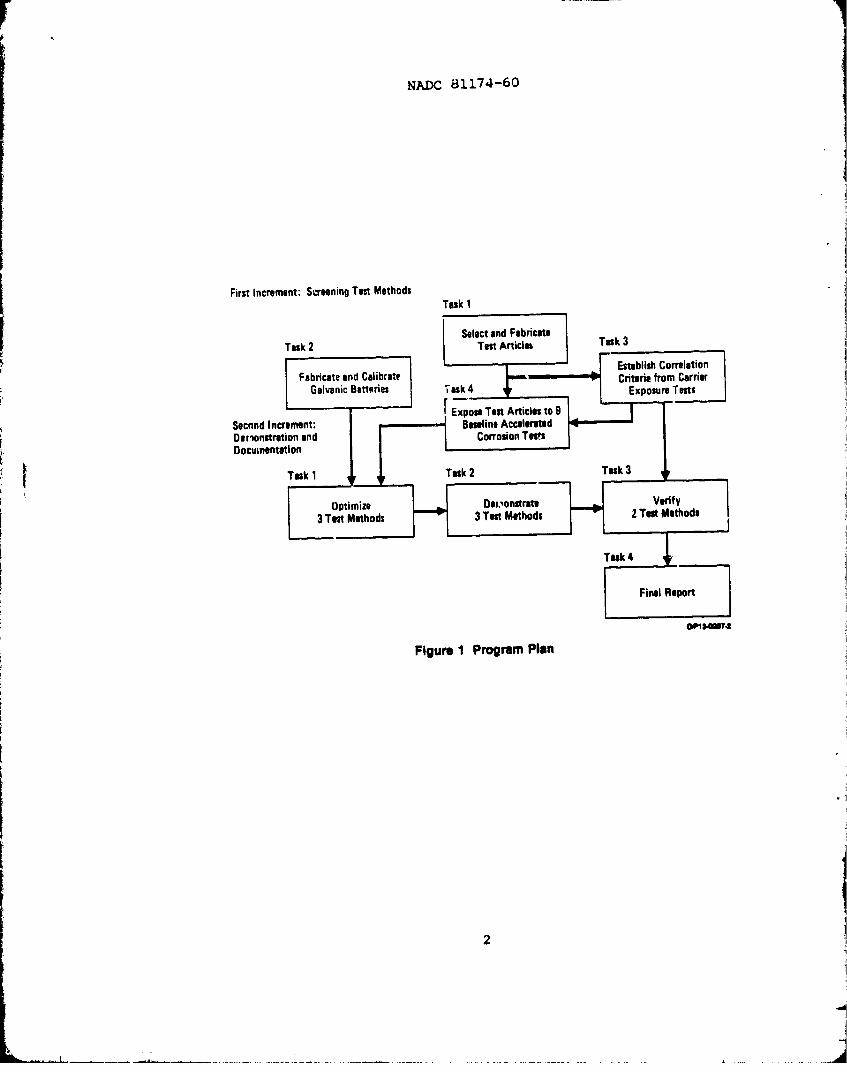
1.2 SUMMARY - The program plan is shown in Figure 1. Test arti-cles were selected which represent state-of-the-art technology, avariety of materials and protective finishes and which are a mixof components - some with a history of corrosion related servicefailures and others with a history of satisfactory performance.To be satisfactory a test must fail test articles which fail inservice but must not fail components that perform satisfactory inservice.
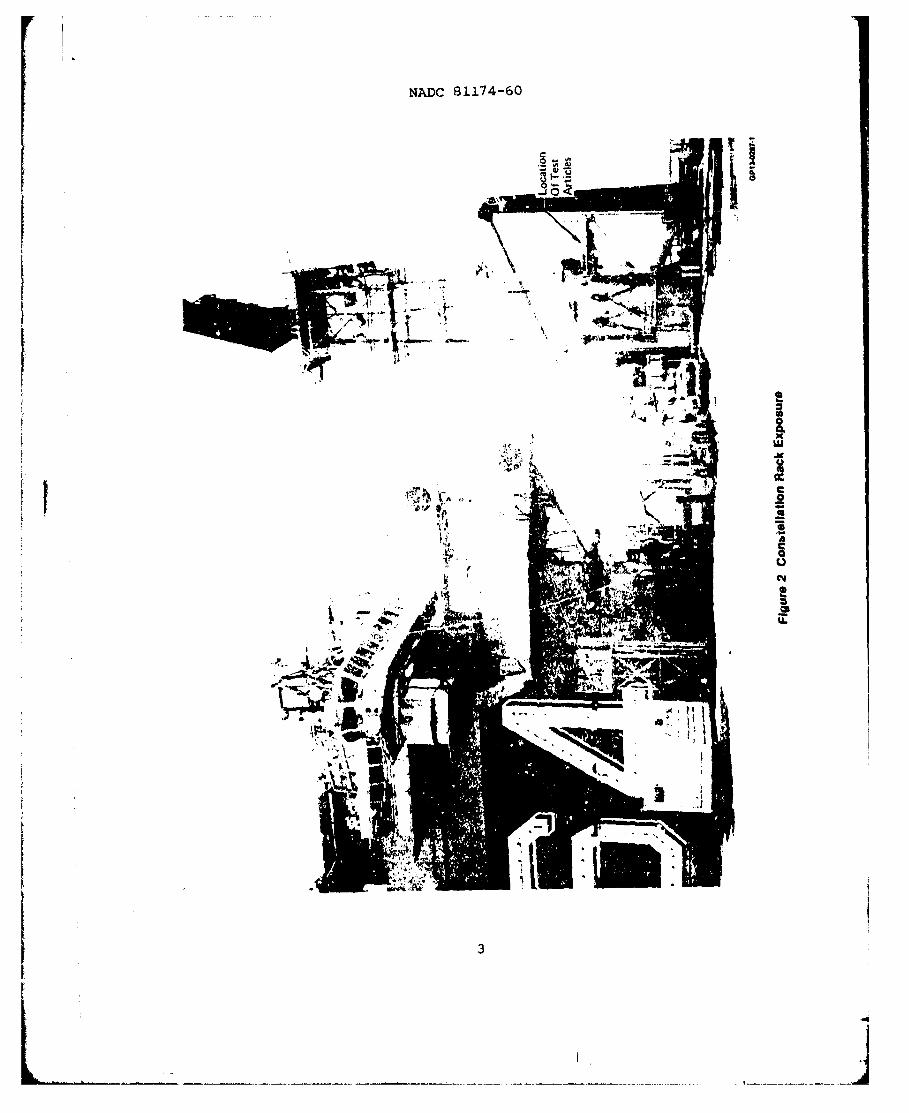
Sets of test articles were fabricated for carrier and labora-tory exposure. Test articles were first exposed on the radarmast of the nuclear carrier Nimitz. Other test articles wereexposed on the radar mast of the conventional carrier Constella-tion (see Figure 2). Test article sets used in the initial
_ ~- -. .. -- ~ ~ -- ~- ~-.,- - - ... . j..•....
NADC 81174-60
First Increment: Screening Teot MethodsTusk 1
Select and FabricateTask 2 Test Articles Task 3
Establish CorrelationFabricate and Calibrate Criteria from Carrier
Galvanic Batteries iak4Exposure Tests
Second Increment: Baseline AcceleratedOelionstration and Corrosion TestsDocumnentation
Task 1 Task 2k3
3 Tent Methods 3 Test Methods 2 Test Methods
FIgure 1program Plan
2
NADC 81174-60
04
L-
A i
3w
NADC 81174-60
laboratory accelerated tests were similar to those exposed on theConstellation. Test articles exposed on both the Nimitz andConstellation were con.bined for the set of articles used in thefinal verification accelerated tests. These carrier exposed testarticles were used as test standards. Laboratory tests wererated on their ability to duplicate the condition of the teststandards.
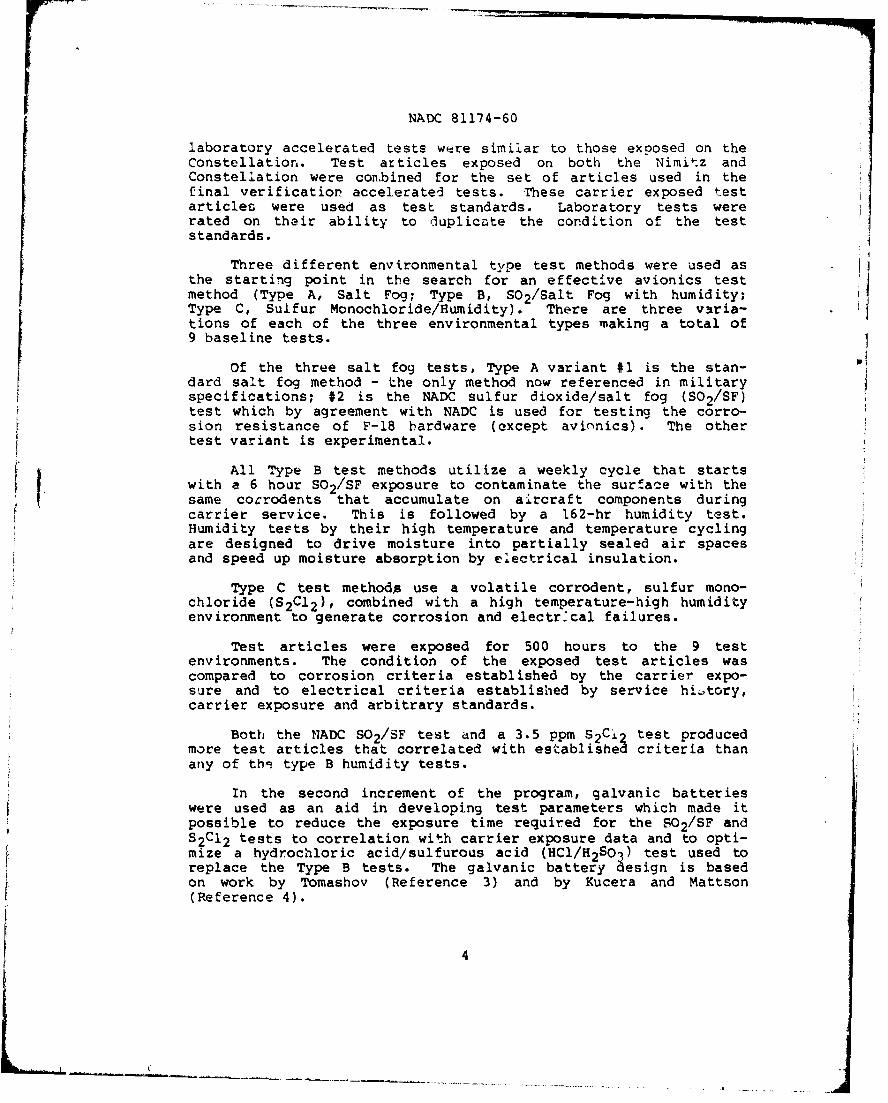
Three different environmental type test methods were used asthe starting point in the search for an effective avionics testmethod (Type A, Salt Fog; Type B, S0 2 /Salt Fog with humidity;Type C, Sulfur Monochloride/Humidity). There are three v!ria-tions of each of the three environmental types making a total of9 baseline tests.
Of the three salt fog tests, Type A variant #1 is the stan-dard salt fog method - the only method now referenced in militaryspecifications; #2 is the NADC sulfur dioxide/salt fog (S0 2 /SF)test which by agreement with NADC is used for testing the corro-sion resistance of F-18 hardware (except avionics). The othertest variant is experimental.
All Type B test methods utilize a weekly cycle that startswith a 6 hour S0 2/SF exposure to contaminate the surface with thesame cocrodents that accumulate on aircraft components duringcarrier service. This is followed by a 162-hr humidity test.Humidity tests by their high temperature and temperature cyclingare designed to drive moisture into partially sealed air spacesand speed up moisture absorption by e'ectrical insulation.
Type C test methods use a volatile corrodent, sulfur mono-chloride (S 2 C12 ), combined with a high temperature-high humidityenvironment to generate corrosion and electr'cal failures.
Test articles were exposed for 500 hours to the 9 testenvironments. The condition of the exposed test articles wascompared to corrosion criteria established by the carrier expo-sure and to electrical criteria established by service hi..;tory,carrier exposure and arbitrary standards.
Both the TIADC S0 2 /SF test and a 3.5 ppm S2 Ci 2 test producedmore test articles that correlated with established criteria thanany of thq type B humidity tests.
In the second increment of the program, galvanic batterieswere used as an aid in developing test parameters which made itpossible to reduce the exposure time required for the S0 2/SF andS2 C12 tests to correlation with carrier exposure data and to opti-mize a hydrochloric acid/sulfurous acid (HCI/H2So ) test used toreplace the Type B tests. The galvanic battery design is basedon work by Tomashov (Reference 3) and by Kucera and Mattson(Reference 4).
4
NADC 81174-60
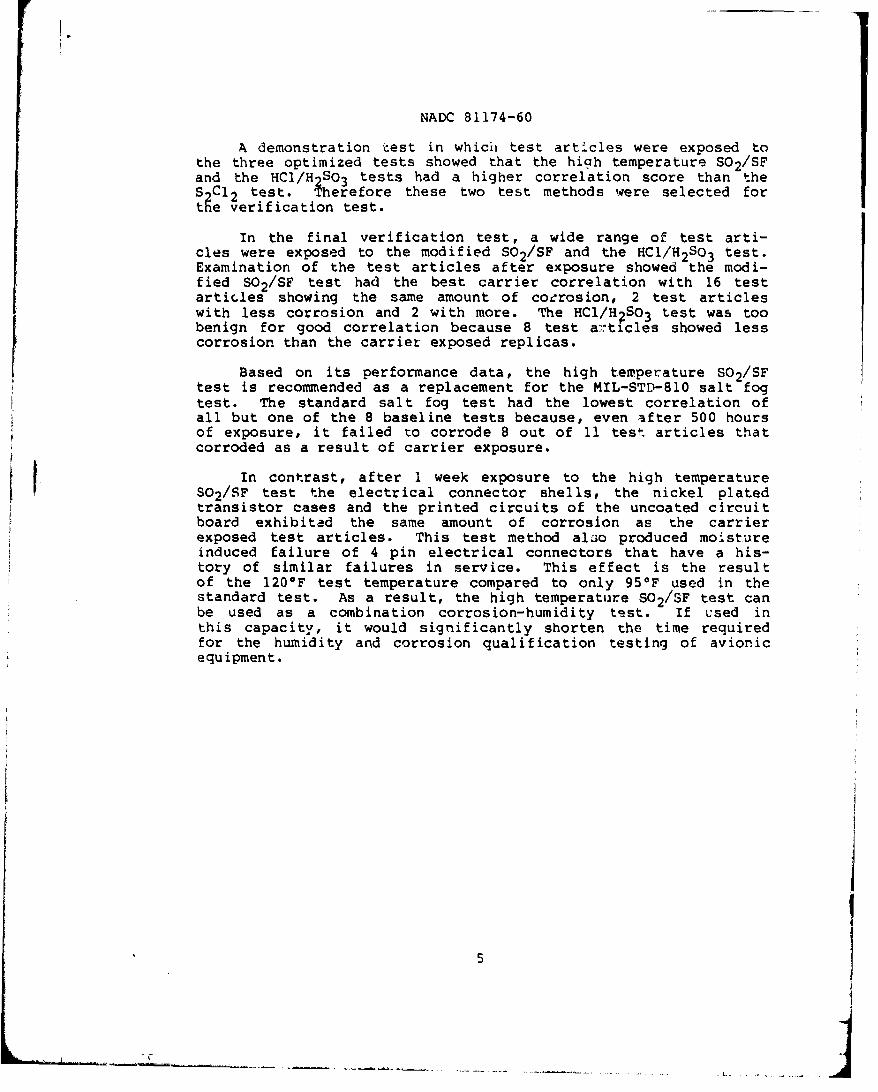
A demonstration cest in which test articles were exposed tothe three optimized tests showed that the high temperature SO2 /SFand the HCl/H 2 SO 3 tests had a higher correlation score than theSgC1 2 test. Therefore these two test methods were selected fort e verification test.
In the final verification test, a wide range of test arti-cles were exposed to the modified S0 2/SF and the HCl/H 2So 3 test.Examination of the test articles after exposure showed the modi-fied S0 2/SF test had the best carrier correlation with 16 testarticles showing the same amount of cocrosion, 2 test articleswith less corrosion and 2 with more. The HC1/H2SO3 test was toobenign for good correlation because 8 test a-,ticles showed lesscorrosion than the carrier exposed replicas.
Based on its performance data, the high temperature S0 2 /SFtest is recommended as a replacement for the MIL-STD-810 salt fogtest. The standard salt fog test had the lowest correlation ofall but one of the 8 baseline tests because, even after 500 hoursof exposure, it failed to corrode 8 out of 11 test articles thatcorroded as a result of carrier exposure.[ In contrast, after 1 week exposure to the high temperature
S0 2 /SF test the electrical connector shells, the nickel platedtransistor cases and the printed circuits of the uncoated circuitboard exhibitad the same amount of corrosion as the carrierexposed test articles. This test method aljo produced moistureinduced failure of 4 pin electrical connectors that have a his-tory of similar failures in service. This effect is the resultof the 120OF test temperature compared to only 95*F used in thestandard test. As a result, the high temperature S0 2 /SF test canbe used as a combination corrosion-humidity test. If vsed inthis capacity, it would significantly shorten the time requiredfor the humidity and corrosion qualification testing of avionicequipment.
5
NADC 81174-60
2. FIRST INCREMENT ACTIVITIES
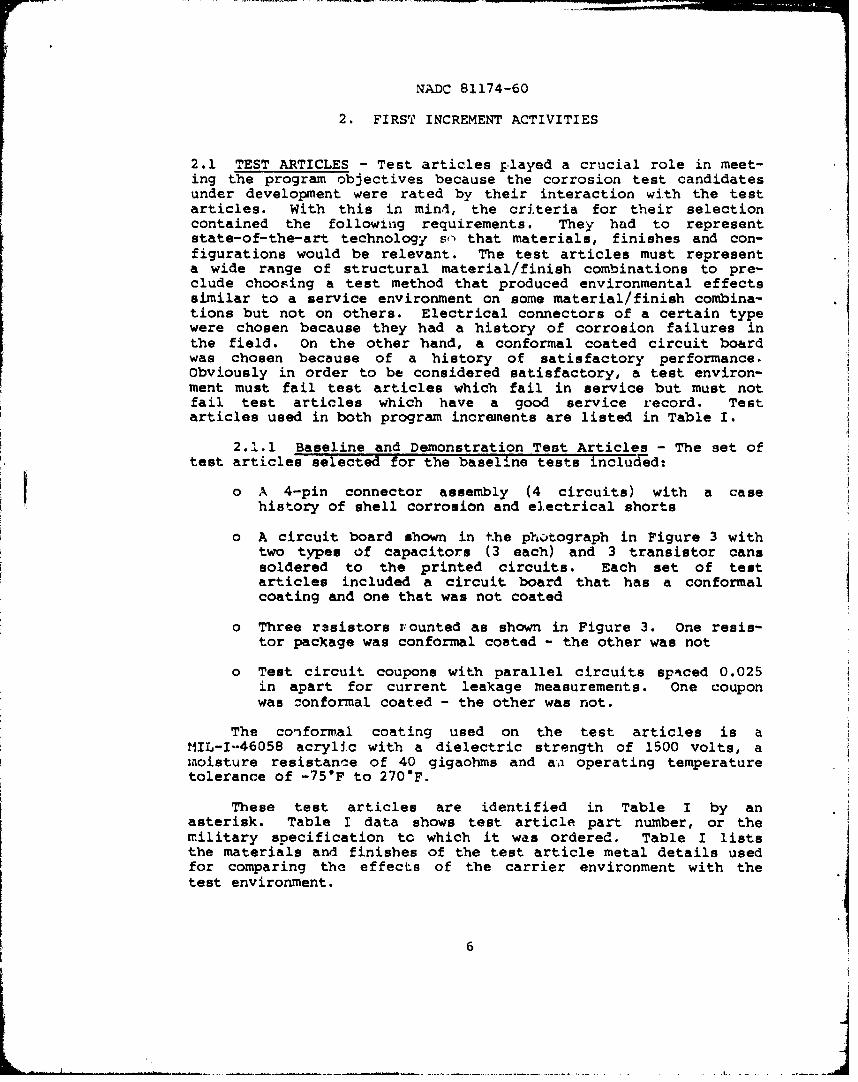
2.1 TEST ARTICLES - Test articles played a crucial role in meet-ing the program objectives because the corrosion test candidatesunder development were rated by their interaction with the testarticles. With this in mind, the criteria for their selectioncontained the following requirements. They had to representstate-of-the-art technology sr that materials, finishes and con-figurations would be relevant. The test articles must representa wide range of structural material/finish combinations to pre-clude choosing a test method that produced environmental effectssimilar to a service environment on some material/finish combina-tions but not on others. Electrical connectors of a certain typewere chosen because they had a history of corrosion failures illthe field. On the other hand, a conformal coated circuit boardwas chosen because of a history of satisfactory performance,obviously in order to be considered satisfactory, a test environ-ment must fail test articles which fail in service but must notfail test articles which have a good service record. Testarticles used in both program increments are listed in Table I.
2.1.1 Baselin, and Demonstration Test Articles - The set oftest articles selected for the baseline tests includled:
oA4-pin connector assembly (4 circuits) with a casehistory of shell corrosion and electrical shorts
o A circuit board shown in the pho.tograph in Figure 3 withtwo types of capacitors (3 each) and 3 transistor canssoldered to the printed circuits. Each set of testarticles included a circuit board that has a conformalcoating and one that was not coated
o Three rasistors rounted as shown in Figure 3. one resis-tor package was conformal coated - the other was not
o Test circuit coupons with parallel circuits spa~ced 0.025in apart for current leakage measurements. One couponwarn zonformal coated - the other was not.
The coniformal coating used on the test articles is atlIL-I--46058 acrylic with a dielectric strength of 1500 volts, amoisture resistance of 40 gigaohms and a-a operating temperaturetolerance of -75*F to 270*F.
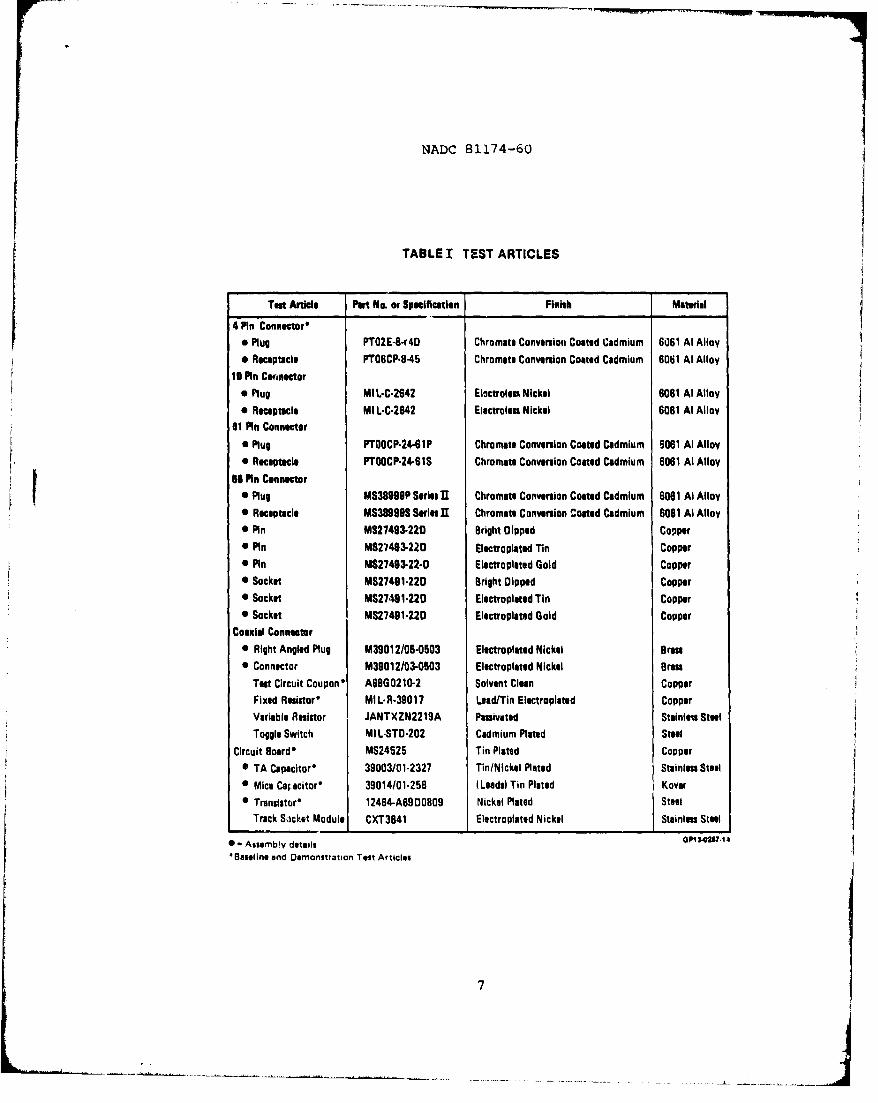
These test articles are identified in Table I by anasterisk. Table I data shows test article part number, or themilitary specification to which it was ordered. Table I liststhe materials and finishes of the test article metal details usedfor comparing the effects of the carrier environment with thetest environment.
6
NADC 81174-60
TABLE I TEST ARTICLES
Test Article Port No. or Specification Finish Material
RecPl acl PTOBCP-8-r45 Chromate Conversion Coated Cadmium 6061 Al Allay
isRcptacl PT0ESC8-r45 Chromate Conversion Coated Cadmium 60261 Al Alloy10 Pin Connector
* Plug MI L-C-2642 Eljetrolesa Nickel 6061 Al Alloy* Receptacle Ml L-C-2642 Electroless Nickel 6061 Al Allay
61 Pin Connector* Plug PTOOCP-24-61P Chramate Conversion Coated Cadmium 6061 Al Alloy* Receptacle PTOOCP-24-SIS Chromate Conversion Coated Cadmium 6061 Al Allay
66 PIN Connector0 Plug MS3SS99P Seriesfl Chromate Conversion Coated Cadmium 6061 Al Alloy0 Receptacle MS38999S Seriea R Chromate Conversion Coated Cadmium 6061 Al Alloy* Pin MS27493-220 Bright Dipped Copper* Pin 101127493-220 Electroplated Tin Copper0 Pin MS27493-22-0 Electropleted Gold Copper* Socket M827491-220 Bright Dipped copper* Socket MS27491-220 Electropleted Tin copper* Socket M827491-220 Electroplated Gold Copper
Coaxial connector"* Right Angled Plug M39012/0"-503 Electropleted Nickel Brasn"* Connector M39012/a3-003 Electroplated Nickel Brass
Test Circuit Coupon* A69G021G02 Solvent Clean CopperFixed Resistor* MIL-R-39017 Lead/Tin Electroplated CopperVeriable Resistor JANTXZN2219A Pasiveted Stainlew SteelToggle Switch Ml L-STO-202 Cadmium Plated Steel
Circuit Board* MS24525 Tin Plated Copper* TA Capacitor* 39003/01-2327 Tin/Nickel Plated Stainless Steal* Mica Cajacitor' 39014/01-256 (Leeds) Tin Plated Kover* Tranulstbjr' 12464-A6900809 Nickel Plated Steel
Track Socket Module CXT3841 Electroplated Nickel jStainless Steel
*-Assembly details*Baseiine and Demonstration Test Articles
7

NADC 81174-60
2 Transistor3 MicaCapacitor
4 Tantlum Cpacitor
Figure 3 Resistors and Circuit Board
NADC 81174-60
2.1.2 Verification Test Articles - The final screening testin the second increment of the program was used to verify theperformance of the two most successful test methods and to selectthe winning candidate. To broaden the data base fcr making thetest selection, all 25 test articles listed in Table I wereexposed to the two test environments and compared to theiraircraft carrier exposed replicas.
The extra test articles added the following material/finishAomblnations to those of the baseline test articles; electrolessnickel plated aluminum, tin and gold plated copper, passivatedstainless steel, nickel plated brass and nickQi plated stainlesssteel.
2.1.3 Test Article Fabrication
Electrical Connectors - All electrical connectors were wiredin the production facilities using milit&ry aircraft proceduresand miaterials. Connectors are assembled by crimping M22759/11wire to attach the wires to the gold plated sockets in the plugand to attach wires to the gold plated pins in the receptacle.The contact assembly is then inserted into connector grommetswhich act as a dielectric material to prevent shorting. Thiscontact assembly is then pushed into a connector shell until theSI| grommet snaps into place. The cavity behind the grommet issealed by potting with MIL-S-8516 cl4ss 3 sealing compound to aminimum height of 0.25 in. above the ends of the crimped area ofthe Din and socket contacts. The connector wires are protectedby a polyester btaided jacket which extends 6 in. from theconnector back shell to within a few inches of the ring tongueterminals. Selfbonding silicon tape is wrapped over thebackshell and extends for approximately 6 inches above thejacket.
The connector and wire bundle assembly with 66 circuits(pins) was not standard in that although 22 pi s had standardgold plated pins, 22 were tin plated, and 22 were unplatedcopper. This was done to determine the effect of the test andcarrier environments on cle contact resistance between the pinsand sockets with the Lhrue different finishes.
The coaxial connectors were assembled with back shells andradio frequency coaxial cables with an extruded polyetherfluro-ethlyne dielectric arotnd the central copper wire conductor. Thecables were fitted with standard nickel plated brass receptacleand a right angle plug.
Circuit Boards - The circuit boards shown in Figure 3 weremade from a copper clad laminate by etching away all copper notused for the circuits, then tin plating the circuits. All compo-nents were mounted on the circuit board by hand-soldering.Final]y, six 12 in Teflon coated 22 AWG lead wires were solderedto the solder pads to permit electrical tests on the capacitors.
9

NADC 81174-60
No electrical tests were planned for the transistors, the intentbeing to display the corrosiveness of an environment by theamount of corrosion on the transistor cases.
The test circuit coupons, like the circuit boards, are fabri-cated from copper clad laminate. The etched copper circuitry isespecially designed to test the dielectric properties of theboard by energizing two parallel circuits spaced 0.025 in. apart.No fabrication was required beyond conformal coating the desig-nated coupons. None of the other test articles required anyin-house operations beyyoAd mounting them on fiberglass boards forsupport during the testing.
2.2 GALVANIC BATTERY
2.2.1 Galvanic Battery Fabrication - Five galvanic batter-ies were fabricated and calibrated as tools for expediting theoptimization of three winning baseline test environments in thesecond increment of the program. The schematic in Figure 4illustrates their assembly. Anodes, 0.020 in. thick, were fabri-cated from QQ-A-250/1, 1100-H14 aluminum, cathodes from QQ-C-276copper, 0.020 in. thick, and 0.004 mil Mylar sheet was used asinsulation. Aluminum was chosen as the anode material because,in the corrosive environments used in the test program, steel orzinc anodes would produce voluminous corrosion products whichcould produce spurious readings. Copper was chosen as thecathode because increased sensitivity provided by more aggressivecathodes such as silver or platinum was not necessary in theaggressive tesu environments.
Mylar sheet, 0.004 in. in thickness was chosen as the Insu-lating material for its durability. Galvanic action between theanodes and adjacent cathodes is initiated when an electrolyte,such as a moisture film, bridges across the Mylar insulation toproduce an ionic path between anode and cathode. As a result,the sensitivity of the battery to relative humidity is affectedby the thickness of the Mylar because the thinner the insulation,the thinner the moisture film needed for battery activation.
Each individual metal ply was manually deburred to eliminateany electrical shorts and then the electrodes and the Mylar weredrilled for the Nylon bolts and duburred. They were assembled byalternately stacking copper, Mylar, aluminum, Mylar, copper, etc.as shown in Figure 4. The copper plies extended beyond the alum-inum on one end of the battery so that a copper bolt could beinserted in the holes to form the cathode terminal. The aluminumplies were also bolted in like manner to form the anode terminal.
The working faces of the batteries were surface ground andpolished to a bright finish and until all edge faces were ofuniform height. Considerable additional effort was expended ineliminating any electrical shorts detected with an ohmmeter.
110
L _ _

N1ADC 81174-60
Copper Foil
-PeI i o p rBot lsi h eCimped onnecltorlu i um F i
-EoyEcaslto
Ree
Leads t
CorrosioBatter
Clock ispla
AP327
F~gure 4 Scematic of aCope.~mn Glai utrandDiitl ouom Contr omonnt
NADC 81174-60
The resistance of the batteries was determined at variousstages of assembly with a General Radio Company Megohmeter(serial No. 1373) while applying 50 volts DC across the copperbolt terminals after the Nylon bolts had been tightened. Theresistances r .ged from 240 x 106 to 500 x 106 ohms.
2.2.2 Digital Coulometer Fabrication - The coulometer hastwo basic circuits as shown in Figure 4. One circuit is anelapsed time clock; tne other is a coulomb measuring device. Inthis latter circuit, a small current (i.e., from the galvanicbattery) is converted to a proportional voltage. This voltage isthen converted into square wave pulses with frequencyproportional to the input voltage. These pulses are counted anddisplayed. An important feature of the current-to-voltageconverter is a low input impedance. This is necessary so thatthe battery operation is not inhibited by circuit impedance. Thebasic component of this circuit is a precision operationalwaiplifier (LMl08AL) which has an extremely low offset voltage(0.3mV). The conversion equation for this current is V (volts) -i (amperes) x R (ohms), where R is the value of the feedbackresistor. The i-to-V converter operates in either of two ranges,wet or dry, by switching between different feedback resistors.
To test the accuracy of the coulomb counter, several longterm calibrations were performed by connecting the coulometer toa Kiethly 261 Picoampere source for several weeks. At the end ofeach run the total current on the display was compared to calcu-lated value. This test was repeated using several differentcurrent levels. The accuracy checked out within 0.5 percent.
2.2.3 Battery Calibration - The batteries were calibratedin several media in pairs to see which medium gave the mostconsistent results. The resultant data is tabulated below.Because both the anode and cathode area of the battery is 1square inch, the coulometer reading was in coulombs per squareinch which could be converted to milliamperes (mA) per squareinch by dividing by the time over which the current was measuredin seconds.
AVERAGE CORROSION CURRENT HOURS OFCALIBRATION MEDIA IN MA/IN EXPOSURE
Battery 1 Battery 2
Distilled Water 0.0124 0.0115 4005% Salt Fog 1.36 1.41 95% NaCl Immersion 1.37 1.40 12Substitute Ocean
Water Immersion 0.274 0.144 32185*F/95% RH Oven 1.26 1.29 19165* /95% RH Oven
after 6 hr S0 2 /SFexposure withoutcleaning 1.26 1.29 17
12
-J
NADC 81174-60
During 24 hours of substitute ocean water (SOW) immersion,battery output was at its highest level during the first hour ofexposure; then it gradually dropped to the stable output shown inthe table.
The corrosion current data in the above table shows goodagreement between the batteries except for the subsititute oceanwater immersion. It is theorized that battery No. 2 built up aprotective film of corrosion products on the aluminum anodeswhich inhibited battery output.
After calibration in each of the abcve media the batterieswere exposed to the So2/SF environment to see which of the medi'lmprovided the most stable output.
It was found that the batteries stabilized in a shorter timeand gave more consistent results when used in a test environmentafter calibration in a 185OF cabinet with a relative humidity of95%. Apparently, this type of conditioning produced a surfacefilm that promoted a more uniform attack on the aluminum anodes
by heS02/ SP exposure. Under magnification, the surface of thebattery appeared to be more uniformly pitted by the S02/SF expo-sure when conditioned in thF humidity cabinet as opposed todistilled water calibration.
2.3 AIRCRAFT CARRIER EXPOSURE - Twenty-three of the test arti-cles listed in Table I were exposed on aircraft carriers toprovide authentic test standards by which identical sets of testarticles which had been exposed to laboratory environments couldbe measured.
All test articles marked with an asterisk in Table Iexceptthe 4-pin connectors were installed in an avionic box pr ior toexposure on the Constellation because they are the type of compo-nent that would be in an avionics boxc for service use. Thealuminum avionics box, is about 5" long x 2.5" high x 2.5" wide.The box has 4 ventilation slots in the front simulating an F-18design and has a hole for the wire bundle. This box with thetest articles secured inside was sent to the Naval Air Develop-ment Center (NADC) where it was fastened to their expanded steelexposure rack.
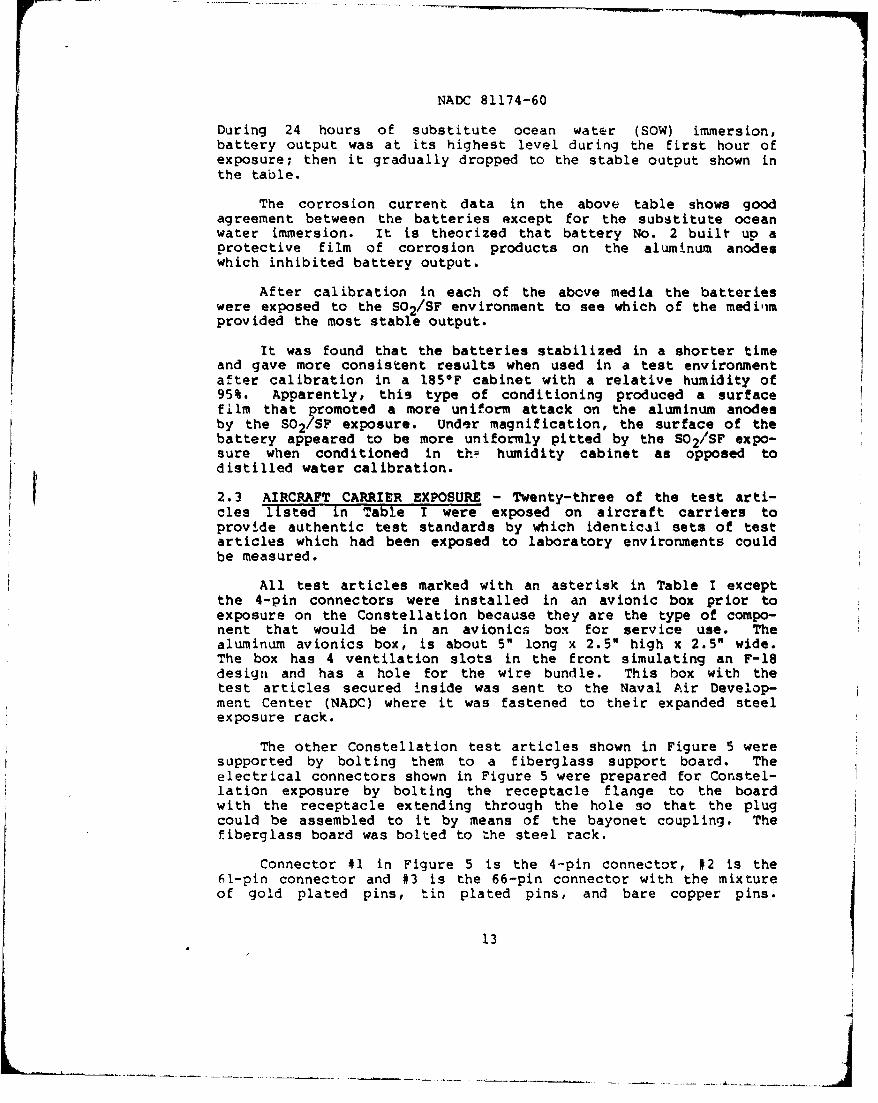
The other Constellation test articles shown in Figure 5 weresupported by bolting them to a fiberglass support board. Theelectrical connectors shown in Figure 5 were prepared for Constel-lation exposure by bolting the receptacle flange to the boardwith the receptacle extending through the hole so that the plugcould be assembled to it by means of the bayonet coupling. Thefiberglass board was bolted to the steel rack.
Connector 41 in Figure 5 is the 4--pin connector, #2 is the61-pin connector and #3 is the 66-pin connector with the mixtureof gold plated pins, tin plated pins, and bare copper pins.
13
NAD)C 81174-60
Figure 5 Electrical Connectors Mounted lot Csarier Exposure
14
NADC 81174-60
These connectors and the avionic box and contents were fastenedto the radar mast of the oil fueled catrier Constellation or 18February 1980. They were recovered 9 months later nn 20 November1980 after the carrier returned from the Indian Ocean by way ofthe Pacific Ocean.
The remaining test articles listed in Table I except thetrack module and the 10-pin connector were mounted on fiberglassboards as described above, bolted to the NADC test rack andinstalled on the radar mast of the nuclear carrier Nimitz about14 ft. above deck level on 24 July 1979. The test articles wererecovered 10 months later on 24 May 1980 after cruising theMediterranean Sea and Indian Ocean. The Nimitz also carried aset of coated and uncoated transistors as a comparison referencewith the Constellation.
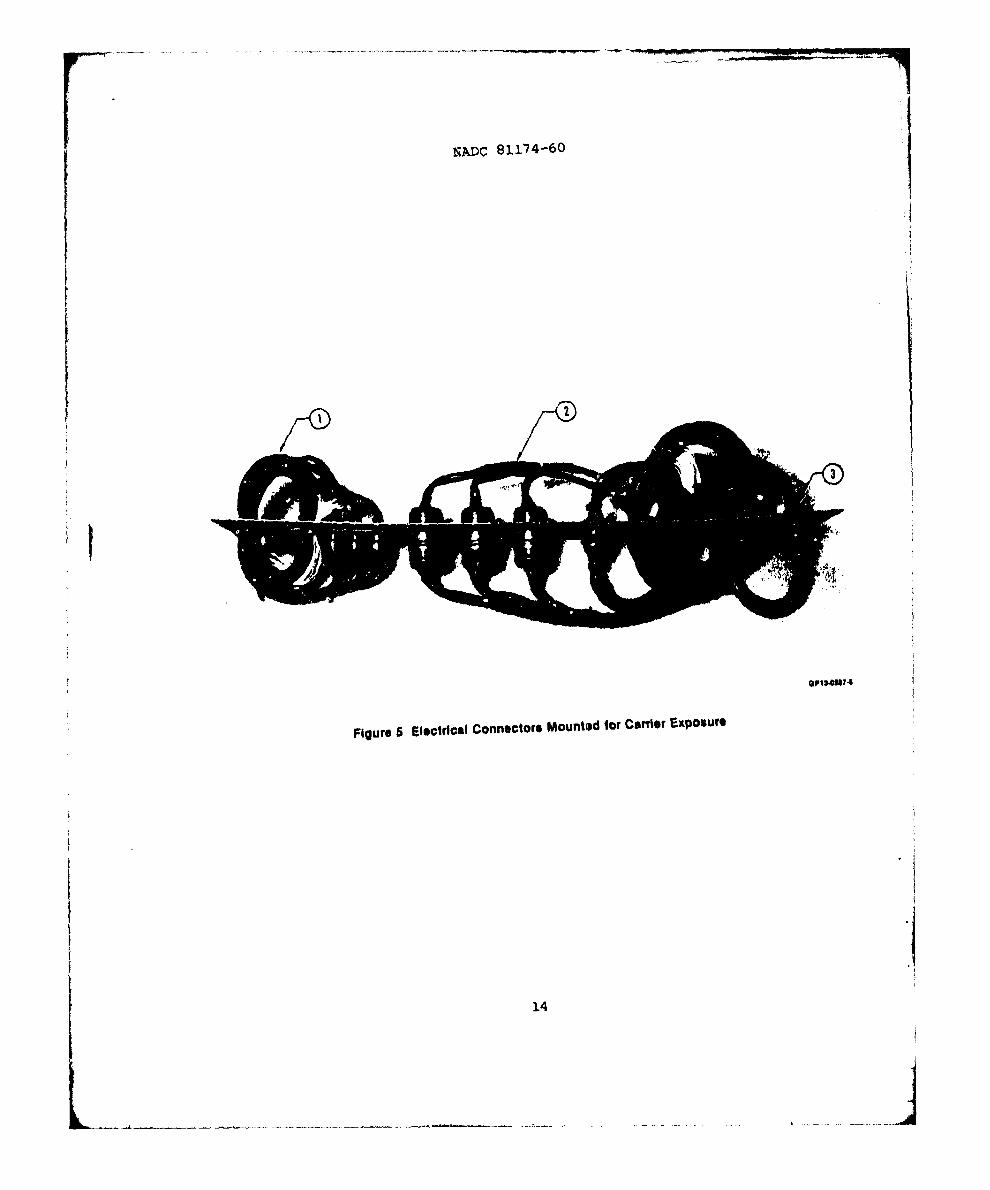
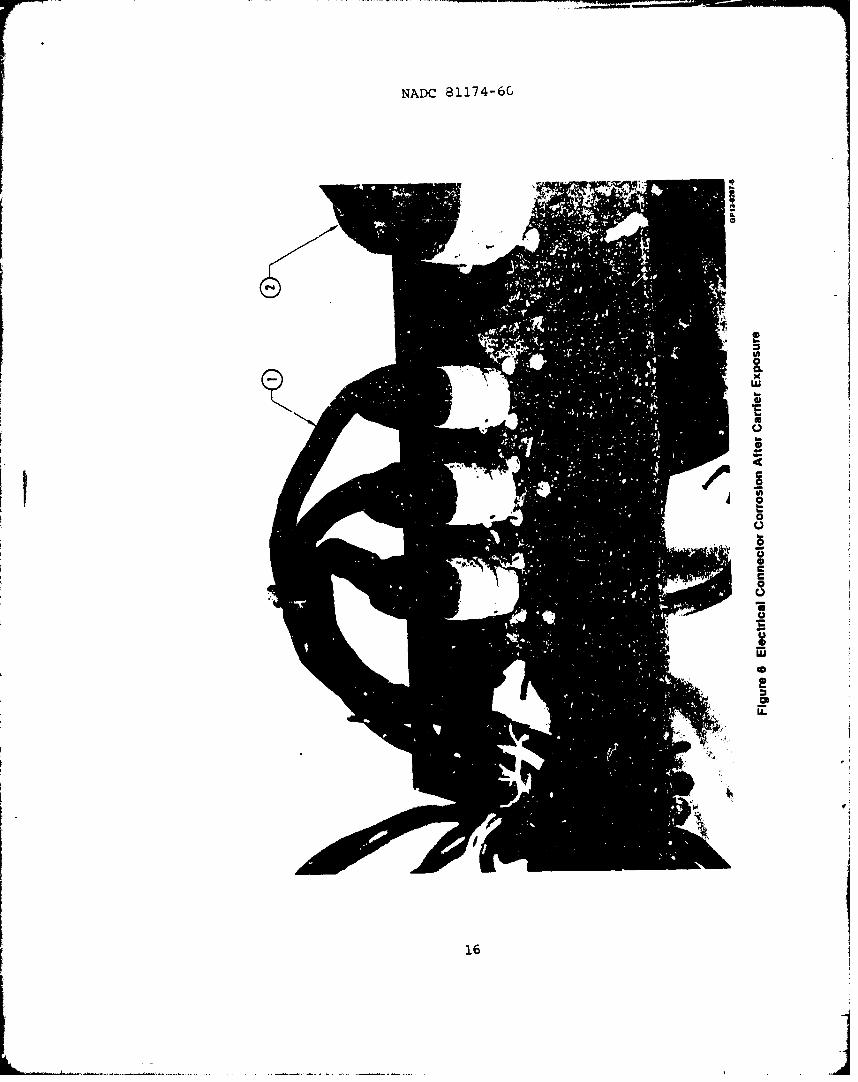
2.3.1 Corrosion Exposure Data - The entire Constellationtest package including the plastic board on which test articleswere mounted had a light salt deposit on it. As shown in Figure6, the 4-pin (1) and 61-pin (2) connector shells were heavilycoated with a white powder - mostll ecadmium corrosion productswith some crystalline salt. When tý shells were washed andbrushed, numerous pits extending into the aluminum substratebecame visible. The uncoated transistor cans in Figure 7 had agreenish appearance and each can had at least a 100 sites wherethere was a buildup of corrosion products about the size of apinhead. The conformal coated transistor cans had a narrow bandof corrosion products around the base interface. All uncoatedprinted circuits were corroded. Conformal coated circuit boardsstill had a bright shiny appearance while the coated test couponcircui.t had black corrosion products beginning at the through-hole at the end of the circuit and continuing for 10% of itslength. One coaxial connector had to be cut with a saw before itcould be disassembled because of corrosion products in the jointinterface. This problem was caused by a defective seal. The66-pin connector shown in Figure 8 had corrosion products on someof the tin plated pins. The bare copper pins had a dark tarnish.This data is tabulated in Table II for use as correlationcriteria to evaluate laboratory test candidates.
Data derived by a visual examination of the Nimitz exposedtest articles and documenteri in Table II can be summarized asfollows:
o All cadmium plated parts were corroded but not as severe-ly as the Constellation parts. The salt deposit was notnearly as heavy on the corroded surfaces.
o The most severe corrosion occurred on the cadmium platedtoggle switch jam nuts and the uncoated transistors whichwere mounted outside the avuionics box. See Figure 9.50% of this area was covered by a rust sta1ia.
15
NADC 81174-6G
CL1-x
LU
0i
I1
NADC 91174-60
CC
17.
~ui

NADC 81174-60
Tin Plated
Bare Copper Pn
Figure B Corros'ofl on Tin Piated Pins of the 86 Pin ConnectorAfter Carrier Exposure
18 1
NADC 81174-60
TABLE H AIRCRAFT CARRIER AND SERVICE CORROSION DATA
Test Artide Area Examined Corrdos aeta
4 Pin Connector Mated Shell Exterior Cadmium Severely Corroded Over 100% of Surface. NickelUndercoat Visible in Numerous Pitted Areas
i 10 Pin Connector Mated Shell Exterior Electroless Nickel Blistered-Substrate Corroded61 Pin Connector Meted Shell Exterior Same as 4 Pin66 Pin Connector Ag/P Wire Mated Shell Exterior Cadmium Corroded Over 100% of Surface. Large Corrosion
Deposits Between Coupling Ring and Shell Made it Necessary to
Saw the Ring in Two to Oisammble the Connector
Coatect Pins Gold Still Shines, Copper Oulled, Tin Corrosion
Coaxial Connector Mated Shell Exterior Bright Polished Finish Reduced to Oull GreyUncoated T~st Coupon Printed Circuits Coated with Black Corrosion Products Over 100% of ArmConformal Coated Test Coupon Printed Circuits Coated with Black Corrosion Products Over 12% of AreaUncoated Ta Capocitor Lead/Tin Plated Leads Coated with Black Corrosion Products Over 100% of AreaConformally Coated Ta Capacitor Lead/Tin Plated Leads Coated with Thin Grey Film Our 100% of ArerUncoated Transistor (Exposed) Case Rust Stains Over 25% of Arer at Base JointUncoated Transistor Case Scattered Sites with Green Corrosion Product Buildup.
Greenish Tinge OverallConformal Coated Transistor (Box) Case Some Green Corrosion Products Around Base of CaseVariable Resistors Case No CorrosionToggle Switch Housir, and Toggle Cadmium Corroded. Heavy Rust where Mounting Nut
Contacts MountUncoated Circuit Board Printed Circuits White Corrosion Products Except for B'ack Spots where Substrate
is ExposrdCoated Circuit board Printed Circuits No CorrosionCiicuit Breoker Nut and Threaded Portion Coated with Unifarm Film of Green Corrosion Products
of Housinge Track Socket Module Entire Surface Coated with Light Film of Green Corrosion Products
* SerViCe hi~torv data
19
NADC 81174-60
(a) Carrier Exposed
7 fe o/FEpsr
F~gre Cmpa~sn o Tggl Swtces ndTrasitc'
(A) Expse Duin Nin Mont Care Cu
dod (4 hs xosdt n ee OIFTs
ob 020
NADC 81174-60
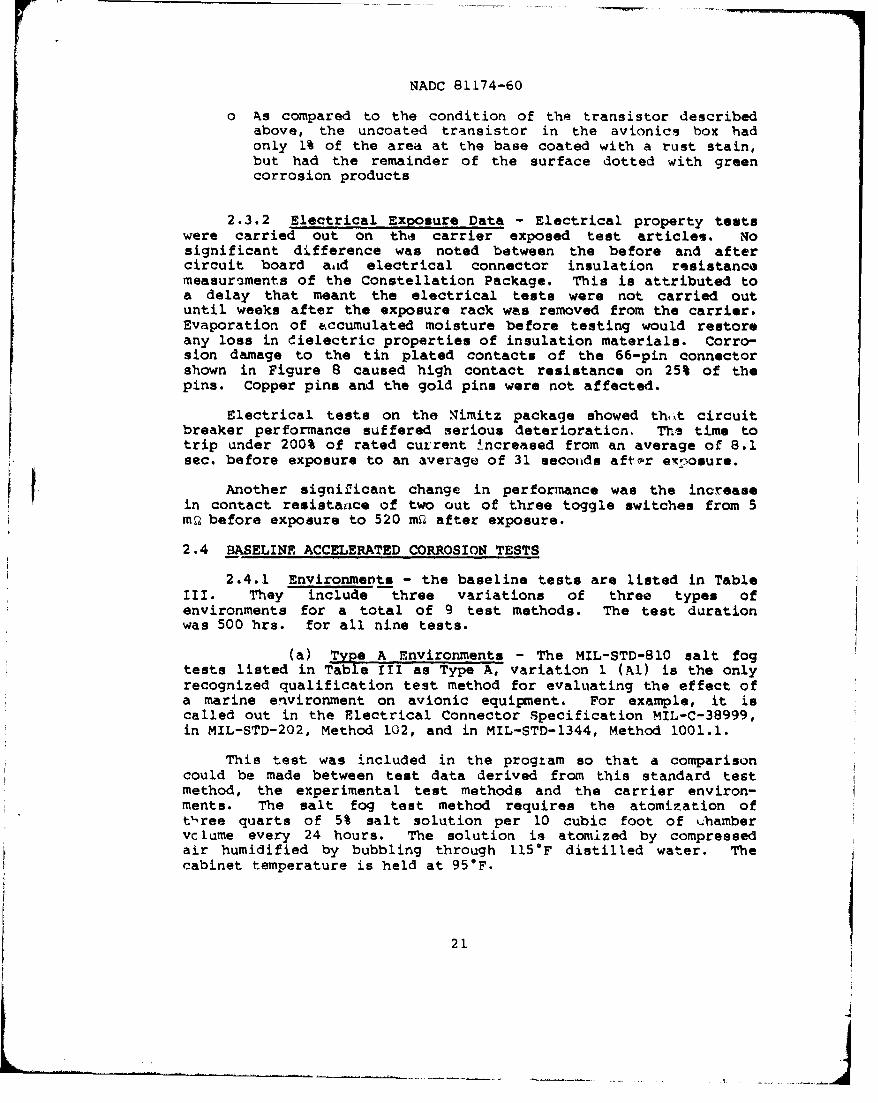
o ks compared to the condition of the transistor describedabove, the uncoated transistor in the avionics box hadonly 1% of the area at the base coated with a rust stain,but had the remainder of the surface dotted with greencorrosion products
2.3.2 Electrical Exposure Data - Electrical property testswere carried out on thd carrier exposed test articles, Nosignificant difference was noted between the before and aftercircuit board aaid electrical connector insulation resistancemeasuroments of the Constellation Package. This is attributed toa delay that meant the electrical tests were not carried outuntil weeks after the exposure rack was removed from the carrier.Evaporation of accumulated moisture before testing would restoreany loss in dielectric properties of insulation materials. Corro-sion damage to the tin plated contacts of the 66-pin connectorshown in Figure 8 caused high contact resistance on 25% of thepins. Copper pins and the gold pins were not affected.
Electrical tests on the Nimitz package showed thxt circuitbreaker performance suffered serious deterioration. Th- time totrip under 200% of rated current increased from an average of 8.1sec. before exposure to an average of 31 secotids after exposure.
Another significant change in performance was the increasein contact resistance of two out of three toggle switches from 5mQ before expoeure to 520 mW after exposure.
2.4 BASELINE ACCELERATED CORROSION TESTS
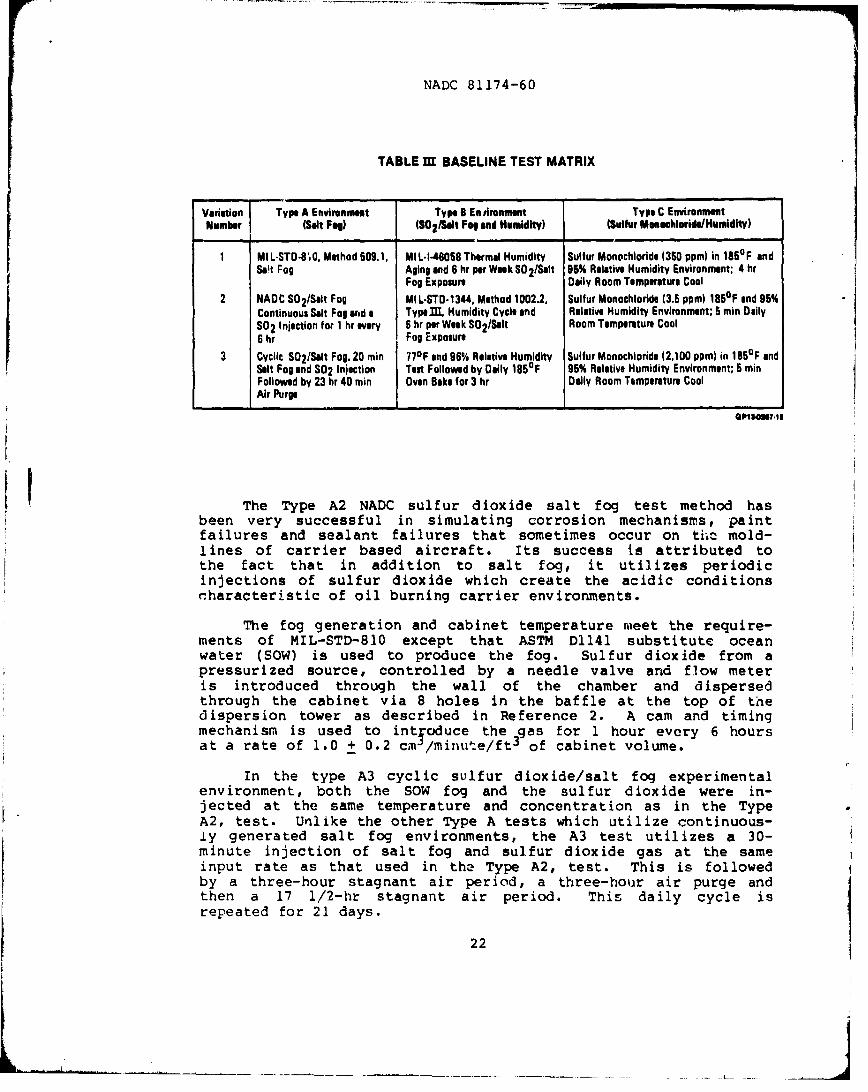
2.4.1 Environments - the baseline tests are listed in TableIII. They include three variations of three types ofenvironments for a total of 9 test methods. The test durationwas 500 hrs. for all nine tests.
(a) Type A Environments - The MIL-STD-810 salt fogtests listed in Table III as Type A, variation I (Al) is the onlyrecognized qualification test method for evaluating the effect ofa marine environment on avionic equipment. For example, it iscalled out in the Electrical Connector Specification MIL-C-38999,in MIL-STD-202, Method 102, and in MIL-STD-1344, Method 1001.1.
This test was included in the program so that a comparisoncould be made between test data derived from this standard testmethod, the experimental test methods and the carrier environ-ments. The salt fog test method requires the atomization oft',ree quarts of 5% salt solution per 10 cubic foot of uhambervelume every 24 hours. The solution is atomized by compressedair humidified by bubbling through 115*F distilled water. Thecabinet temperature is held at 95*F.
21
A4
NADC 81174-60
TABLE n BASELINE TEST MATRIX
Variation Type A Environment Type 8 Entironment Type C EnvironmentNumber (Salt Fog) (S02 /Silt Fog and Humidity) (Sulfur Moneshloride/Humidity)
1 MIL-STD-8.0, Method 509.1, MIL-146058 Thermal Humidity Sulfur Monochloride (350 ppm) in 185°F andSaGt Fog Aging and 6 hr per Week S02/Salt 95% Relative Humidity Environment; 4 hr
Fog Exposure Daily Room Temperature Cool2 NADC S02/Salt Fog MIL-STD.1344, Method 1002.2, Sulfur Monochloride (3.5 ppm) 185 0F and 95%
Continuous Salt Fog and a Typo I. Humidity Cycle and Relative Humidity Environment; 5 min DailySO2 Injection for 1 hr wary 6 hr per Week S02/Salt Room Temperature Cool6 hr Fog Exposure
3 Cyclic S02/Salt Fog. 20 min 770F and 96% Relative Humidity Sulfur Monochloride (2,100 ppm) in 1850 F andSalt Fog and S02 Inlection Test Followed by Daily 185OF 95% Relative Humidity Environment; 5 minFollowed by 23 hr 40 min Oven Bake for 3 hr Daily Room Temperature CoolAir Purge
The Type A2 NADC sulfur dioxide salt fog test method has
been very successful in simulating corrosion mechanisms, paintfailures and sealant failures that sometimes occur on thc mold-lines of carrier based aircraft. Its success is attributed tothe fact that in addition to salt fog, it utilizes periodicinjections of sulfur dioxide which create the acidic conditionscharacteristic of oil burning carrier environments.
The fog generation and cabinet temperature meet the require-ments of MIL-STD-810 except that ASTM D1141 substitute oceanwater (SOW) is used to produce the fog. Sulfur dioxide from apressurized source, controlled by a needle valve and flow meteris introduced through the wall of the chamber and dispersedthrough the cabinet via 8 holes in the baffle at the top of thedispersion tower as described in Reference 2. A cam and timingmechanism is used to introduce the gas for 1 hour every 6 hoursat a rate of 1.0 + 0.2 c=3/minute/ft 3 of cabinet volume.
In the type A3 cyclic sulfur dioxide/salt fog experimentalenvironment, both the SOW fog and the sulfur dioxide were in-jected at the same temperature and concentration as in the TypeA2, test. Unlike the other Type A tests which utilize continuous-ly generated salt fog environments, the A3 test utilizes a 30-minute injection of salt fog and sulfur dioxide gas at the sameinput rate as that used in the Type A2, test. This is followedby a three-hour stagnant air period, a three-hour air purge andthen a 17 1/2-hr stagnant air period. This daily cycle isrepeated for 21 days.
22
NADC 81174-60
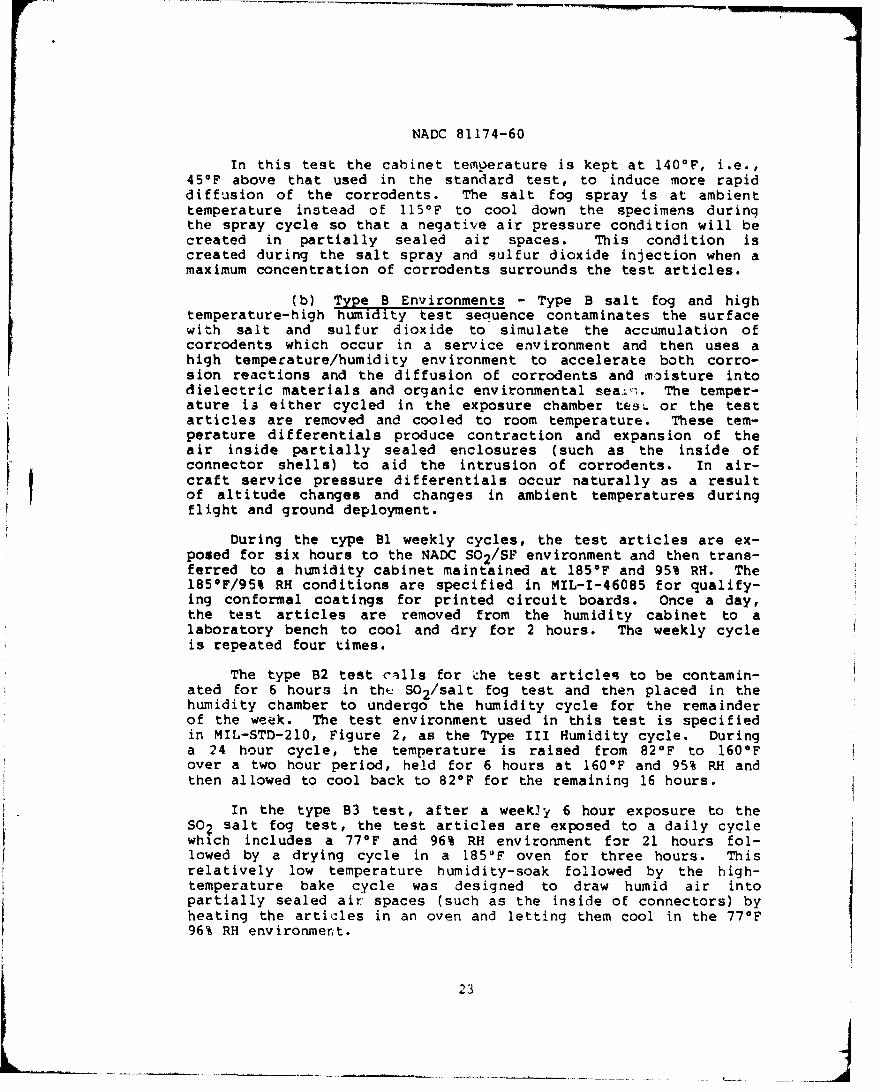
In this test the cabinet temperature is kept at 140 0 F, i.e.,45OF above that used in the standard test, to induce more rapiddiffusion of the corrodents. The salt fog spray is at ambienttemperature instead of 115OF to cool down the specimens duringthe spray cycle so that a negative air pressure condition will becreated in partially sealed air spaces. This condition iscreated during the salt spray and sulfur dioxide injection when amaximum concentration of corrodents surrounds the test articles.
(b) Type B Environments - Type B salt fog and hightemperature-high humidity test sequence contaminates the surfacewith salt and sulfur dioxide to simulate the accumulation ofcorrodents which occur in a service environment and then uses ahigh temperature/humidity environment to accelerate both corro-sion reactions and the diffusion of corrodents and moisture intodielectric materials and organic environmental seal-,. The temper-ature is either cycled in the exposure chamber tesý. or the testarticles are removed and cooled to room temperature. These tem-perature differentials produce contraction and expansion of theair inside partially sealed enclosures (such as the inside ofconnector shells) to aid the intrusion of corrodents. In air-craft service pressure differentials occur naturally as a resultof altitude changes and changes in ambient temperatures duringflight and ground deployment.
During the type Bl weekly cycles, the test articles are ex-posed for six hours to the NADC S0 2 /SF environment and then trans-ferred to a humidity cabinet maintained at 1850F and 95% RH. The1850F/95% RH conditions are specified in MIL-I-46085 for qualify-ing conformal coatings for printed circuit boards. Once a day,the test articles are removed from the humidity cabinet to alaboratory bench to cool and dry for 2 hours. The weekly cycleis repeated four times.
The type B2 test calls for 'he test articles to be contamin-ated for 6 hours in the S0 2 /salt fog test and then placed in thehumidity chamber to undergo the humidity cycle for the remainderof the week. The test environment used in this test is specifiedin MIL-STD-210, Figure 2, as the Type III Humidity cycle. Duringa 24 hour cycle, the temperature is raised from 82 0 F to 160 0 Fover a two hour period, held for 6 hours at 160OF and 95% RH andthen allowed to cool back to 82 0 F for the remaining 16 hours.
In the type B3 test, after a weekly 6 hour exposure to theSO? salt fog test, the test articles are exposed to a daily cyclewhich includes a 77"F and 96% RH environment for 21 hours fol-lowed by a drying cycle in a 185 0 F oven for three hours. Thisrelatively low temperature humidity-soak followed by the high-temperature bake cycle was designed to draw humid air intopartially sealed air, spaces (such as the inside of connectors) byheating the articles in an oven and letting them cool in the 77*F96% RH environment.
23
_ __ J

NADC 81174-60
(c) Type C Environments - Exposure to sulfut mono-chloride vapor as part of a high temperature-high humidityenvironment was included in the baseline tests because prelimin-ary tests indicate it is capable of reproducing service environ-ment effects such as exfoliation and stress corrosion of aluminumand it does not require the elaborate atomizing equipment used insalt fog generation.
Sulfur monochloride ($2012) in contact with moisture dissoci-ates to form hydrochloric acid, sulfur dioxide and hydrogensulfide:
S2C1 2 + 2H20 - 2HCl + S02 + H2S
Sulfur dioxide and hydrogen sulfide are common air pollut-ants. The fact that the chloride is in the form of an acidinstead of a salt makes it more corrosive but should not changethe type of corrosion reactions generated by natural environmentchlorides.
A 9 liter desiccator was used as a sealed environmentalchamber for the three S2 C1 2 tests. An evaporating dish full ofdistilled water provided 100% RH. A 185*F temperature was main-tained by placing the desiccator in an oven. In the originaltest method, a glass bottle containing liquid S2 C1 2 was alsoplaced in the oven to act as a vapor generator. The S2 C1 2 flowrate to the generator through glass tubing was controlled by aCorning Rotoflow adjustable valve. However, although consider-able effort was expanded, the attempt to develop a gas analysistechnique with the sensitivity needed to quantify the concuntra-tion of 902 and C12 in the parts per million (PPM) range wasunduccassful. The tests were repeated using a calibrated eyed,:oppe.r that delivers a drop of S2 CI 2 weighing 0.02885 gm.
'i!e type C1 test was designed to expose the test articles toa 350 PPM concentration of S2 C].2 . Calculations show that at185"F, I drop (0.02885 gm) of S2 C12 produces a 350 PPM concentra-tion in •'ha 9 liter airspace. The actual concentration would beless bectase of corrosion reaction consumption. After the ini-tial cycle in which the test articles, the distilled water and 1drop of S2C12 were placed in the desiccator, and the desiccatorplaced in the oven, the following daily routine was followed:
a) Remove the desiccator from the ovenb) Allow the desiccator to cool on a bench for 4 hoursc) Remove the lid to dispel residual S2C12d) Add 1 drop of S2 C1 2e) Replace the desiccator in the 185*F oven for 20 hours.
The type C2 test method is similar to that described aboveexcept that the S2 CI2 was diluted with 10 parts by volume withether to produce a concentration of 3.5 PPM and the room cooltime was reduced to 5 minutes.
24
NADC 81174-60
The type C3 test method was identical to that used for thetype C Series 2 test except that 6 drops o. S2Cl were addeddaily to provide a calculated concentration of 2100 PPM of theS2C12 vapor.
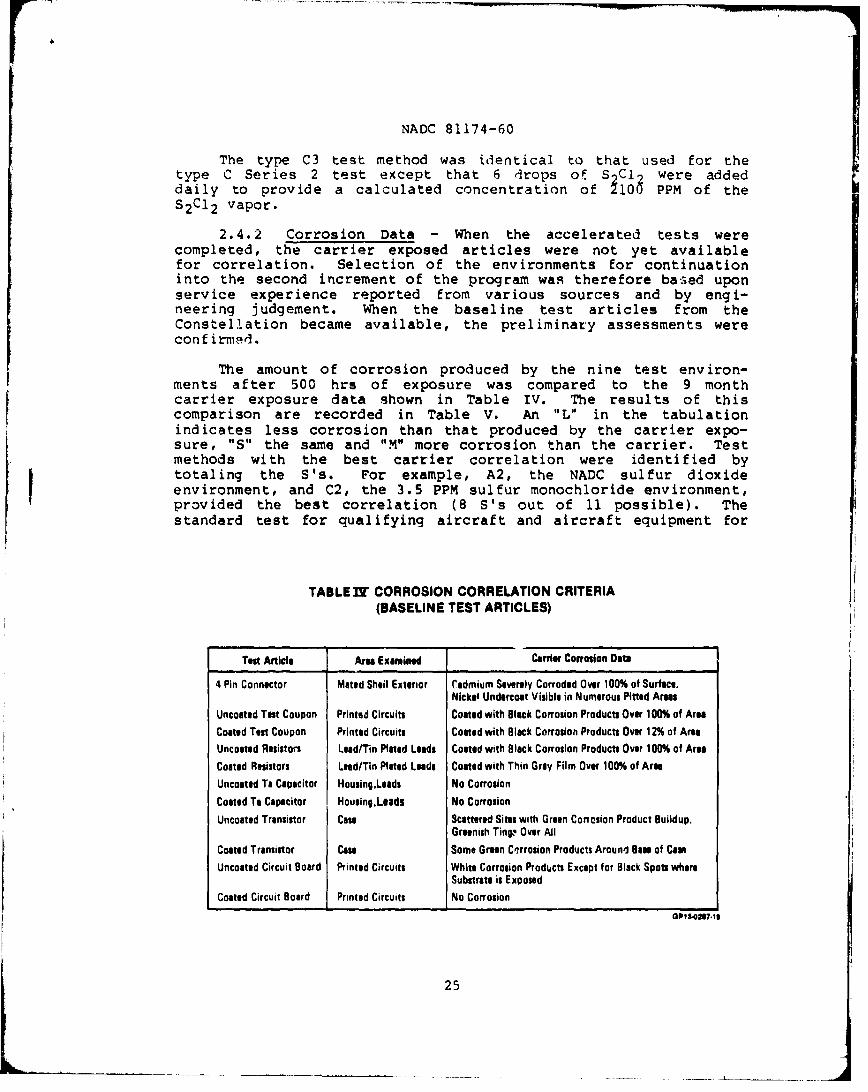
2.4.2 Corrosion Data - When the accelerated tests werecompleted, the carrier exposed articles were not yet availablefor correlation. Selection of the environments for continuationinto the second increment of the program was therefore based uponservice experience reported from various sources and by engi-neering judgement. When the baseline test articles from theConstellation became available, the preliminary assessments werecon f irmed.
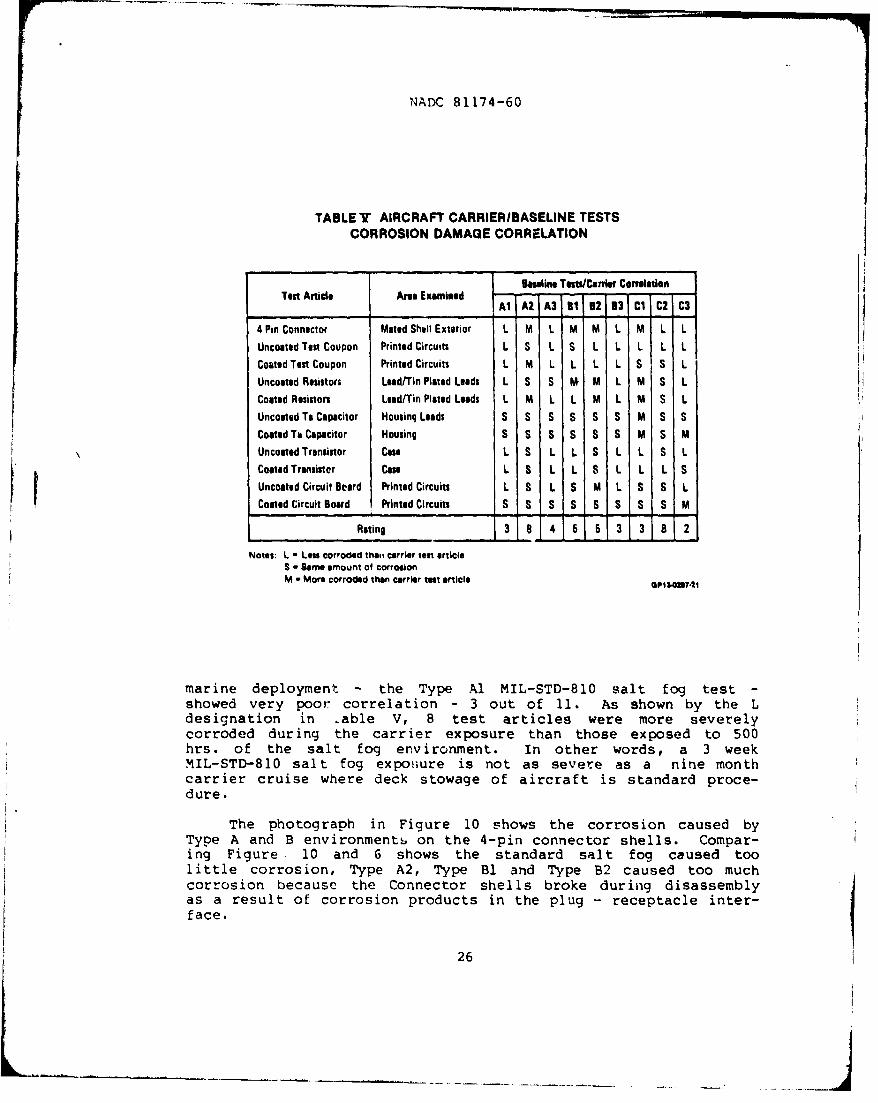
The amount of corrosion produced by the nine test environ-ments after 500 hrs of exposure was compared to the 9 monthcarrier exposure data shown in Table IV. The results of thiscomparison are recorded in Table V. An "L" in the tabulationindicates less corrosion than that produced by the carrier expo-sure, "S" the same and "M" more corrosion than the carrier. Testmethods with the best carrier correlation were identified bytotaling the S's. For example, A2, the NADC sulfur dioxideenvironment, and C2, the 3.5 PPM sulfur monochloride environment,provided the best correlation (8 S's out of 11 possible). Thestandard test for qualifying aircraft and aircraft equipment for
TABLE 7N CORROSION CORRELATION CRITERIA(BASELINE TEST ARTICLES)
Test Article Area Examined Carrier Corrosian Data
4 Pin Connector Mated Sheil Exterior radmium Severely Corroded Over 100% of Surface.Nickel Undercoat Visible in Numerous Pitted Areas
Uncoated Test Coupon Printed Circuits Coated with Black Corrosion Products Over 100% of AreaCoated Test Coupon Printed Circuits Coated with Black Corrosion Products Over 12% of AreaUncoated Resistors Lead/Tin Plated Leads Coated with Black Corrosion Products Over 100% of AreaCoated Resistors Lead/Tin Plated Leads Coated with Thin Grey Film Over 100% of AreaUncoated To Capacitor HousingLeads No CorrosionCoated Ta Capacitor HousingLeads No CorrosionUncoated Transistor Case Scattered Sites with Green Corresion Product Buildup.
Greenish Tinge' Over AllCoated Transistor Case Some Green CoTrrosion Products Aroun'J Base of CamUncoated Circuit Board Printed Circuits White Corrosion Products Except for Black Spots where
Substrate is ExposedCoated Circuit Board Printed Circuits No Corrosion
OP1 3 .a
25
NADC 81174-60
TABLETY AIRCRAFT CARRIERIBASELINE TESTSCORROSION DAMAGE CORRELATION
Baseline Tess/Catter ConrItionTest Article Area Examined A A I - " 1Al A2 A3 31 32j 33 C1 C2 C3
4 Pin Connector Meted Shall Exterior L M L M M L M L LUncoated Test Coupon Printed Circuits L S L S L L L L L
Coated Test Coupon Printed Circuits L M L L L L S S LUncoated Resistors Lead/Tin Plated Leads L S S M M L M S LCoated Resistors Lead/Tin Plated Leads L M L L M L M S LUncoated Ta Capacitor Housing Leads S S S S S S M S SCoated Ta Capacitor Housing S S S S S S M S MUncoated Transistor Case L S L L S L L S LCoated Transistor Casl L S L L S L L L SUncoated Circuit Board Printed Circuits L S L S M L S S LCoated Circuit Board Printed Circuits S S S S S S S S M
Rating 3 8 4 5 5 3 3 8 2
Notes: L - Less corroded tnai carrier test articleS - Same amount of corrosionM - More corroded then carrier test ariclis
marine deployment - the Type Al MIL-STD-810 salt fog test -
showed very poor correlation - 3 out of 11. As shown by the Ldesignation in -able V, 8 test articles were more severelycorroded during the carrier exposure than those exposed to 500hrs. of the salt fog environment. In other words, a 3 weekMIL-STD-810 salt fog expo,;ure is not as severe as a nine monthcarrier cruise where deck stowage of aircraft is standard proce-dure.
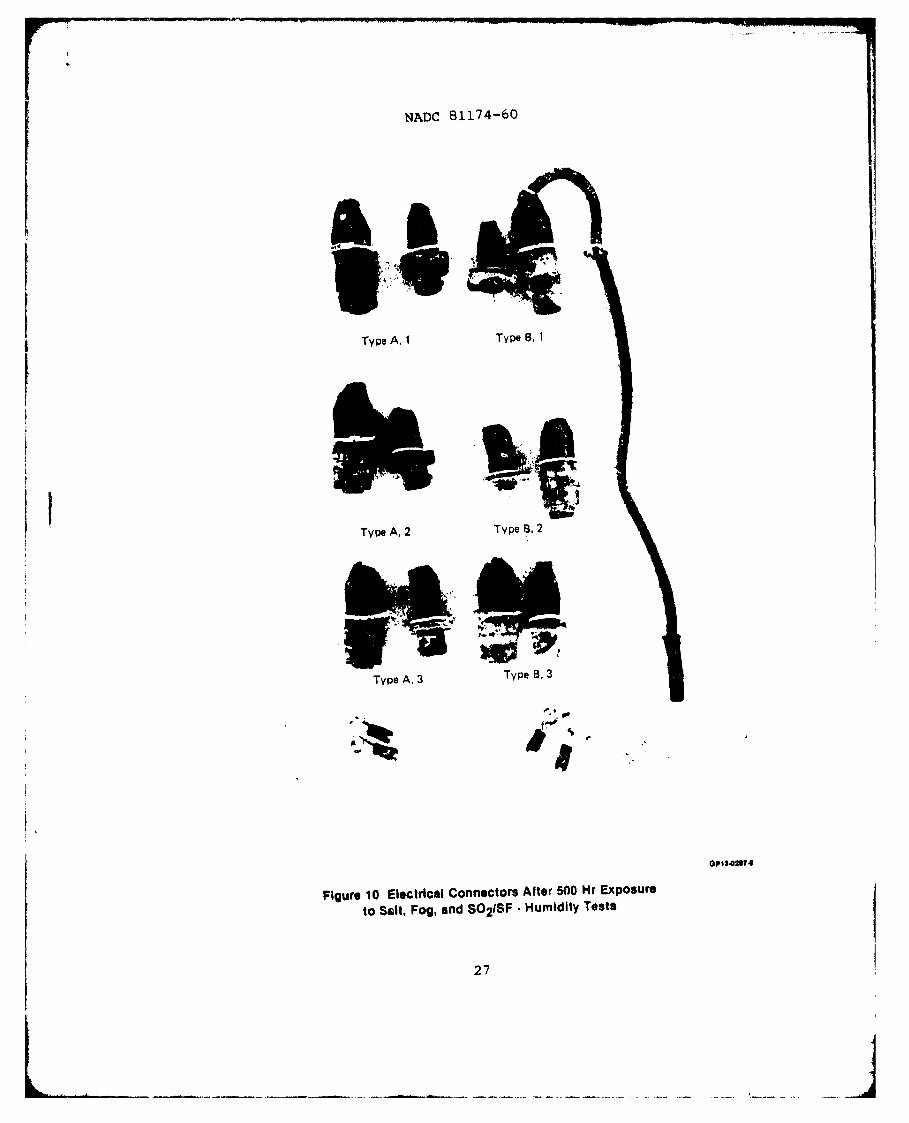
The photograph in Figure 10 shows the corrosion caused byType A and B environmentb on the 4-pin connector shells. Compar-ing Figure 10 and 6 shows the standard salt fog caused toolittle corrosion, Type A2, Type B1 and Type B2 caused too muchcorrosion because the Connector shells broke during disassemblyas a result of corrosion products in the plug - receptacle inter-face.
26
NADC 81174-60
Type A. I Type B, 1
Type A, 2 Type 8, 2
Type A, 3 Type B, 3
Figure 10 Electrical Connectors After 500 Hr Exposure
to SAlt, Fog, and SO2 /SF • Humidity Tests
27
_ j
NADC 81174-60
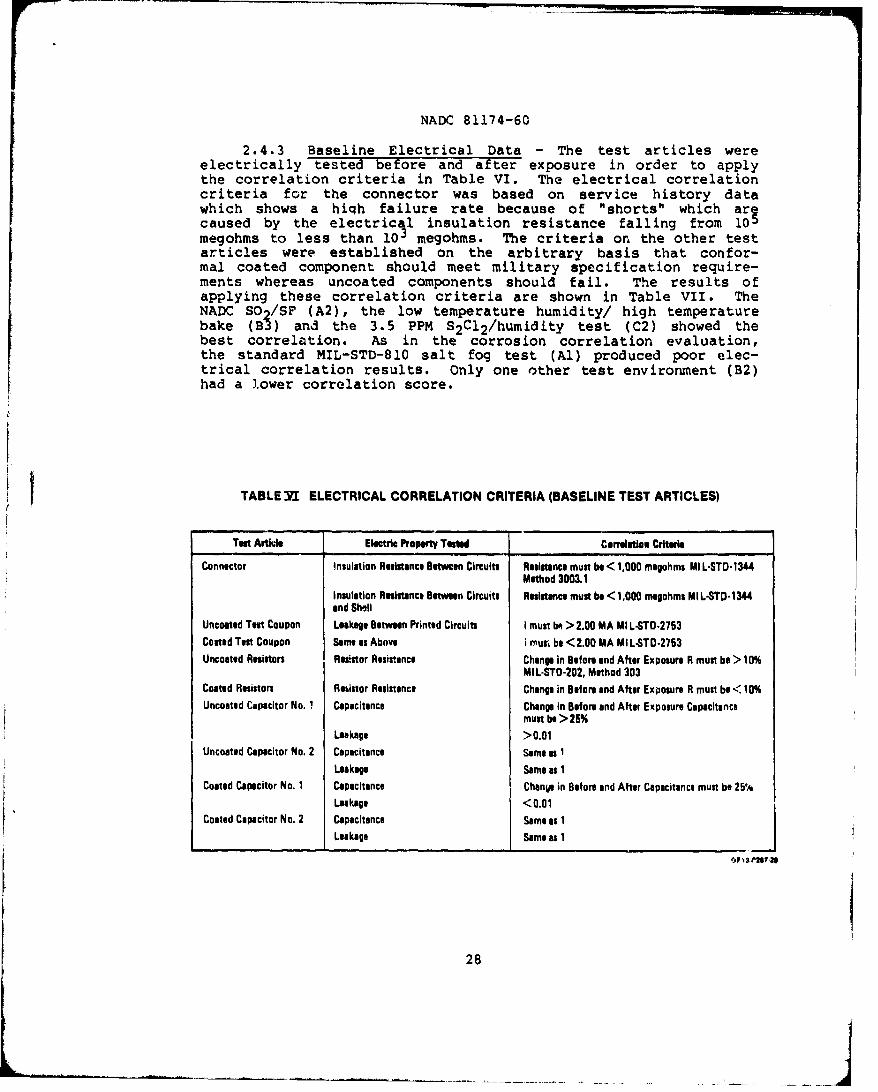
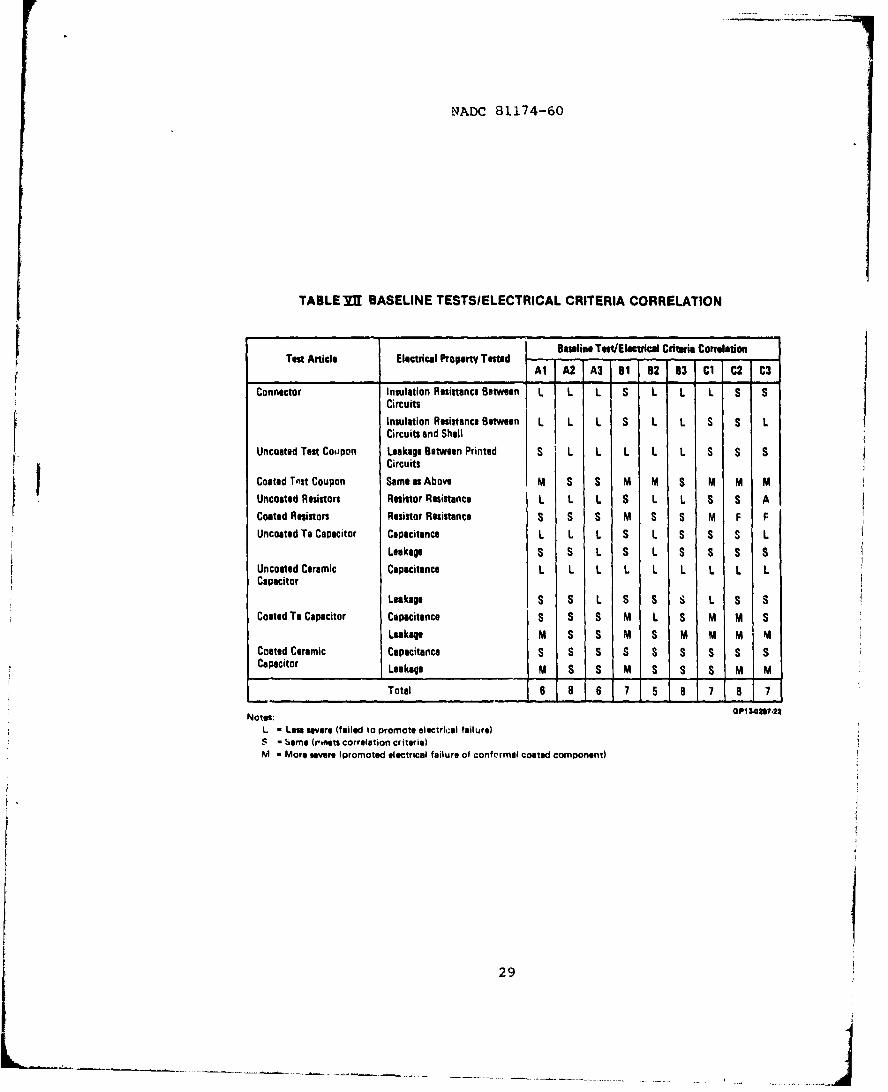
2.4.3 Baseline Electrical Data - The test articles wereelectrically tested before and after exposure in order to applythe correlation criteria in Table VI. The electrical correlationcriteria for the connector was based on service history datawhich shows a hiqh failure rate because of "shorts" which artcaused by the electricil insulation resistance falling from 109megohms to less than 10 megohms. The criteria on the other testarticles were established on the arbitrary basis that confor-mal coated component should meet military specification require-ments whereas uncoated components should fail. The results ofapplying these correlation criteria are shown in Table VII. TheNADC So /SF (A2), the low temperature humidity/ high temperaturebake (B3) and the 3.5 PPM S2 C12 /humidity test (C2) showed thebest correlation. As in the corrosion correlation evaluation,the standard MIL-STD-810 salt fog test (Al) produced poor elec-trical correlation results. Only one other test environment (B2)had a lower correlation score.
TABLEYI ELECTRICAL CORRELATION CRITERIA (BASELINE TEST ARTICLES)
Teat Artklle Electric Property Tested Cerrueltion Criteria
Connector Insulation Resistance Between Circuits Resistance must be < 1,000 megohms MI L-STD.1344Method 3003.1
Insulation Resistance Between Circuits Resistance must be < 1,000 megohms MIL-STD-1344end Shall
Uncoated Test Coupon Leakage Between Printed Circuits I must bm > 2.00 MA MI L4-TD.2753Costed Test Coupon Same as Above i murs be <2.00 MA MIL-STD-2753
Uncoated Resistors Ress|tor Assistance Change in Before end After Exposure R must be > 10%MIL-STD-202, Method 303
Coated Resistors Resistor Resistance Change in Before and After Exposure R must be < 10%Uncoated Capacitor No. 1 Capacitance Change in Before and After Exposure Capacitance
must be > 25%Leakage >0.01
Uncoated Capacitor No. 2 Capacitance Same as ILeakage Same as 1
Coated Capacitor No. 1 Capacitance Chanye in Before and After Capacitance must be 25'/Leakage <0.01
Coated Capacitor No. 2 Capacitance Same as 1
Leakage Same a 1s
28
NADC 81174-60
TABLE I1" BASELINE TESTSIELECTRICAL CRITERIA CORRELATION
I __________________________________________________ Baseline Tes/Eteatrial Ciltuma CorrelationTest Article Electrical Property Tested B - C Coreato
Al A2 A3 81 12 13 C1 C2 C3Connector Insulation Resistance Between L L L S I L L S S
Circuits
Insulation Resistance Between L L L S L L S S LCircuits and Shell
Uncoated Test Coupon Leakage Between Printed S L L L L L S S SCircuits
Coated Thst Coupon Same as Above M S S M M S M M MUncoated Resistors Resistor Resistance L L L S L L S S ACoated Resistors Resistor Resistance S S S M S S M F FUncoated Ta Capacitor Capacitance L L L S L S S S L
Leakage S S L S L S S S SUncoaed Ceramic Capacitance L L L L L L L L LCapacitor
Leakage S S L S S S L S SCoated Ta Capacitor Capacitance S S S M L S M M S
Leakage M S S M S M M M MCoated Ceramic Capacitance S S S S S S S S SCapacitor Leakage M S S M S S S M M
Total 6 8 6 7 5 8 7 8 7
Notes: OP13027.22
L - Les severe (failed to promote electri,.al failure)S - 6ame (riets correlation criteria)M - More severe lpromoted electrical failure of confcrmal coated component)
29
NADC 81174-60
3. SECON'D PINCREMENT ACTIrVITIES
The program plan requires that o~ne baseline test method fromeach of the three types be optimized to improve its ability tosimulate service environment effects.
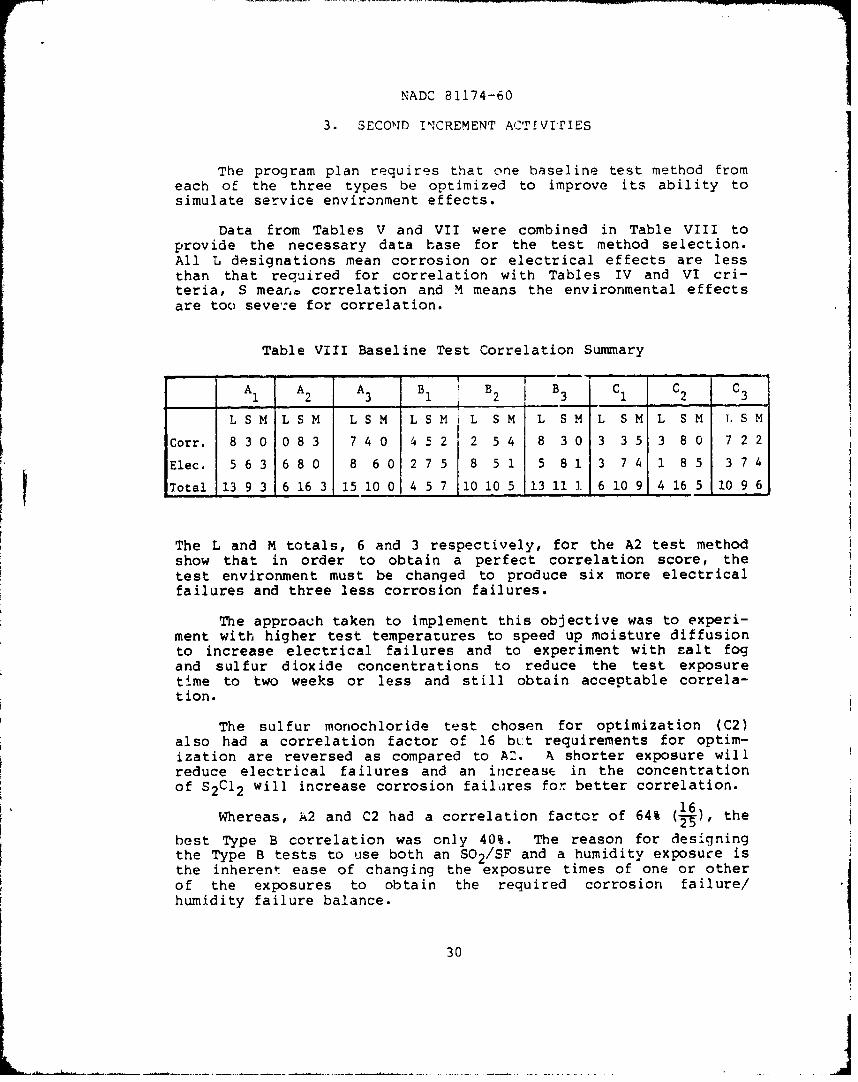
Data from Tables V and VII were combined in Table VIII toprovide the necessary data hase for the test method selection.All L designations mean corrosion or electrical effects are lessthan that required for correlation with Tables IV and VI cri-teria, S mear.. correlation and M means the environmental effectsare too seve':e for correlation.
Table VIII Baseline Test Correlation Summary
A , B 2 B 3 C 2 C3
L S ML SM L SM L SM L SM LS ML SM L SM 1,S M
Corr. 83 0 08 3 7 40 4 52 2 54 8 30 3 35 380 72 2
Elec. 5 63 6 80 8 6 0 2 75 8 5 1 5 8 1 3 7 4 1 8 5 37 4
Total 13 93 6 16 3 15 10 0 4 57 .1010 5 113111. 6 10 9 4 16 5 109 6
The L and M totals, 6 and 3 respectively, for the A2 test methodshow that in order to obtain a perfect correlation score, thetest environment must be changed to produce six more electricalfailures and three less corrosion failures.
The approach taken to implement this objective was to experi-ment with higher test temperatures to speed up moisture diffusionto increase electrical failures and to experiment with salt fogand sulfur dioxide concentrations to reduce the test exposuretime to two weeks or less and still obtain acceptable correla-tion.
The sulfur monochloride test chosen for optimization (C2)also had a correlation factor of 16 bt~t requirements for optim-ization are reversed as compared to A2. A shorter exposure willreduce electrical failures and an inrlLease in the concentration
of 2C 2 wllincrease corrosion failares for better correlation.
16Whereas, k2 and C2 had a correlation factor of 64% (!-), the
best Type B correlation was only 40%. The reason for designingthe Type B tests to use both an SO /SF and a humidity exposure isthe inherent ease of changing the exposure times of one or otherof the exposures to obtain the required corrosion failure/humidity failure balance.
30
NADC 81174-60
However, the poor performance of the Type B tests comparedto the other tests showed that the corrosion-humidity balancecould be achieved with a single test environment. Also becauseof the inconvenience of having to tie up a humidity cabinet aswell as a salt fog chamber to run the test it was decided not totry to optimize a Type B test. Instead a test method with a newapproach using hydrochloric and sulfurous acids was substituted.
3.1 SULFUR DIOXIDE/SALT FOG OPTIMIZATION - As a first step inthe optimization attempt, a galvanic battery was used to estab-lish the corrosivity of the standard NADC S0 2 /salt fog test toprovide a standard by which attempts at optimizing the test couldbe compared. The galvanic battery was then used to measure theeffect of different combinations of salt fog and sulfur dioxideinjections on corrosivity to provide a data base for test para-meter development.
In order to use battery data to compare the relative corro-sivity of environments produced by exploratory test parameterchanges with that of the baseline Type A2 environment, it wasnecessary to calculate an average battery reading. For example,the Type A2 test method calls for 5 hours of salt fog and 1 hourof combined salt fog and sulfur dioxide gas. The average batteryreading for the 6 hour cycle is calculated by multiplying thebattery reading durinq fog 'joiieration by 5, adding the averagebattery reading during the 1 hour combined S0 2/fog generation anddividing by 6. Because these tests were cyclic, the batterieswere connected to a strip chart recorder to provide a graphicpicture of battery output.
In the first test of the series shown in Table IX, the cabi-net was purged of S02, and a galvanic battery was used to measurethe corrosivity when the cabinet is operated in accordance withthe NADC procedure. As shown in the Table, the average batteryoutput when exposed to the salt fog is 2.1 mA/in 2 and 4.3 mA/inwhen exposed to the combined effects of salt fog and sulfurdioxide. This averages out to a reading of 2.5 mA for the 6 hourrepetitive cycle.
In the second test, a battery was used to measure the corro-sivity of distilled water at the 90 0 F cabinet temperature and thecorrosivity of SO 2 when not accompanied by salt fog. Table IXdata shows that sulfur dioxide by itself generates almost thesame battery output - 4.2 mA vs. 4.3 mA - as it does when accom-panied by salt fog.
A 6 hour cycle consisting of 5 hours of salt fog followed byturning off the fog and injecting SO2 for an hour at the NADCflow rate produces an average battery output of 2.4 mA as com-pared to 2.5 mA for the standard cycle.
The objective of test number 3 ,was to measure output when abattery not contaminated by exposure to salt fog is exposed toS02 and then to salt fog. Table IX data show that when a battery
31
J

NADC 81174-60
TABLE 1X SULFUR DIOXIDEISALT-FOG PARAMETER MANiPULATION
""attery Avvrage*'Test Cabinet Tower Cabinet Operating Conditions Reading Fiesding Remarks
Number Tempprature Temperature (mA) (mA)
I 90OF 115 F Fog On, SO? Off 2.1 Started Test with Zlean battery(Type Fog and S02 On 4.3 2.5 Output Increased from 2. I to 4.3 in 10 minA2)
2 900F 115 0F Chamber Free of Fog and SO2 , 0.1 Battery Face Wet with Distilled Water BeforeBcttary Allowed 80 min Placing in Chamberto Reach Chamber TemperLture
Fog On, S02 nff 2.0Fog Off, SO2 On 4.2 Took 25 min to Reach Steady OutputSO2 Off 1.8 2.4 Took £0 min to Reach Steady Output
3 90OF 115 0F S02 On 3.9Fog On 2.3 2.6
4 140OF 135or Fog On 0.4 Humidity too LowSO2 On 4.3 Batteries Sloshed with Chamber Condensate
1.9 Battery Coated with Salt Deposits 6 causeof Evaporation
SO2 Off 0.7ýog On 2.7
5 1200'F 135°F Synthatic Ocean Water Diluted 0A4with 10 Parts Water for For,Generation Chamber i-reý ofFog and SO2
Fog On 1.2 Battery Output Increased Gradually as Comparedto Normal Fog Effect
S0 On 4,4 Took 25 min fur Battery Output to StabilizeS02 Off 2.2 1.8
'Average reading is average over entire tes. OPII.01l7.1S
32
NADC 81174-60
with a clean surface is exposed to sulfur dioxide, the output isabout 10% lower than when the battery has been previously exposedto salt fog. On the other hand, when the battery was exposed tosalt fog following the SO 2 e.posure, its output is higher (2.3 vs2.1).
In the fourLh test, both the chamber and bubble tower thermo-stats were set for maximum temperature to increase moisture diffu-
sion rates so that electrical failures could be produced in ashorter exposure time frame. The other test parameters remainedthe same. Because the cabinet reached a higher temperature thanthe bubble tower, the resulting low humidity produced in a saltbuild-up on the surface of the battery because of evaporation.As a result, battery output dropped to 0.4 mA.
Test 5 overcame the difficulties experienced in Test 4.Chamber temperature was lowered to 120*F to provide sufficientspread between bubble tower temperature and cabinet temperatureto prevent salt deposit formation because of evaporation.
The RADC SO2 /SF environment produces corrosion failures in ashorter time than electrical failures as compared to a serviceenvironment. Therefore synthetic ocean water (SOW) used for foggeneration was diluted to 1 part SOW to 10 parts water to reducecorrosivity. As shown by Table IX data, the average batteryreading dropped from 2.1 when standard fog was used to 1.2 mAwhen diluted fog was atomized. However, the combined effects ofthe diluted SOW and the sulfur dioxide salt fog test produced a4.4 mA battery output which is the same as the standard test.The average battery output calculated for a 6 hr cycle is a 1.8mA or a 28% reduction ccmpared to that of the baseline NADCenvironment.
In order to reduce the corrosivity of the environment morethan 28%, it was decided to reduce the Juration of the SO2 injec-tion from 1 hour to 1/2 hour. It was anticipated the highertemperature and lower corrositivity would balance corrosion andmoisture related effects to correlate with those produced bycarrier exposure. These concepts are incorporated in thefollowing test cycle:
a. The ASTM D1141 synthetic ocein water (SOW) for genera-tion was d-luted with 10 parts distilled watec to reducecorros iv ity.
b. Cabinet temperature was increased from the ASTM B117standard 951F to 12UOF to increase moisture absorp':ionby dielectric materials used for insulation.
c. The bubble tower temperature was increased from 115F to1350F.
d. Fog generation was changed from continuous to 5 hour on,1 hour off.
33
I
NADC 81174-60
e. S02 was introduced when the fog was off to prevent itI being carried to the bottom of the chamber with the fog.f. S02 flow rate remained the samte at 1.0 + 2.0 crn3/minute
per cubic foot of cabinet environment b-ut the durationof the flow was reduced from 1 h-ur to 0.5 hours every 6hours to reduce zorrosivity.
After the chamber was run using the above cycle for 24 hoursfor stabilization, three test circuit coupons and three cadmiumplated connector shells were placed in the chamber. The test wasterminated after a 2 week exposure period.
At the completion of the exposure, visual examinationsshowed that the flange surfaces on the receptacle were more sev-erely corroded than the same connector surfaces exposed duringthe cruise of the Constellation. Other surfaces on both the plugand receptacle shells were slightly less corroded than equivalentsurfaces exposed to the carri~er environment.
The amount of corrosion on the test coupon printed circuitswas comparable to that produced by carrier exposure except thatthere were localized areas where the normally white corrosionproduces had a greenish tinge. Since these test results are
satisfactory, these parameters were retained for the demonstra-
3.2 HYDROCHLORIC. ACID/SULFUROUS ACID OPTIMIZATION - As statedearlier, it was decided not. Lo optimize a Type B environment butto try a different approach that would requiice the use of onlyone environmental cabinet. For example, if the make-up waterused tc generate water vapor in humidity cabinets was replaced bya solution of hydrochloric acid in sulfurous acid, the solutionwould volatize producing chloride ions and sulfur dioxide whichare the most co~mmon marine corrodents. Because chlorides in theform of vapor are better able to penetrate partially sealed airspaces than as salt fog, hydrochloric acid vapor can in a fewhours penetrate air space enclosures that would require a longerexposure in salt fog to obtain the same effect.
If this test method were used on a regular basis, a humiditycabinet could be set aside for its exclusive use. However, inthis exploratory phase, instead of taking the risk of contaminat-ing a cabinet, optimization tests were carried out in a sealed
container.
Sealed 1 liter beakers were used ts environmental chambers.25 ml of the following liquids were absorbed on cheese cloth andplaced around the inside walls of the beakers to provide a largeevaporating surface: distilled water, saturated sulfurous acid,and a 50-50 solution of saturated sulfurous and 3% hydrochloricacids. The test articles placed in each beaker included 2 matedelectrical connector shells and 3 printed circuit test coupons.The beakers were placed in a 180*F oven.
3,,1
.. ...... j

NADC 81174-60
Calibrated corrosion batteries were used to monitor thecorrosivity of the humidity cabinet environment as well as thesealed beaker environments. The batteries were exposed in thehumidity chamber at 195OF/95% RH for temperature and surface filmstabilization. Battery readingo are shown in Table Xalong witha description of the test article!s after a 14 day exposure.
Table X Hydrochloric - Sulfurous Acid Exposure Data
Connectors Galvanic BatteryTest Test Coupon Shell * Shell mA/in 2
Environment Corrosion Corrosion Disconnect
Oven at 185*Fand 90% RH 1.4
Beaker at 185*F Nil Nil Passed 0.016and 100% RH
Same as 2 + Slight Moderate Passed 0.25H 2So3 Vapor
Same as 2 + Severe Severe Passed 3.4H2 SO3 and HCl
*To pass shell disconnect criteria, connectors hadto be disassembled using hand pressure.
The most surprising result was the 100 to 1 ratio betweenthe gaivaiic tattery readings generated by the oven environmentand the distilled water-sealed beaker environment. The mostobvious difference is the rapid air movement in the oven producedby the high volume fan and the stagnant condition in the beaker.
The galvanic battery reading (0.25 mA/in 2 ) generated by thesulfurous acid environment is only one tenth as high as thatgenerated by salt fog. Lack of aggressive behavior is alsodemonstrated by the lack of serious corrosion of the connectorshells and the printed circuits of the test coupons.
On the other hand, corrosion produced by the hydrochloric/sulfurous acid environment produced severe corrosion of the testarticles and generated a battery current of 3.5 mA as compared tothe 2.5 mA average generated by the NADC S0 2/SF environment.
The severe corrosion produced by the hydrochloric acid/sul-furous acid solution in the last test indicated the concentrationof these corrodents was too high. In the next attempt, it wasdecided to obtain better control at lower concentration by injec-tion of HCl and SO2 in the gaseous form. A 9 liter dessicatorwith holes drilled in the lid for the galvanic battery leads and
35
NADC 81174-60
the ayringe for HC1 and SO2 injections was used as the environ-mental chamber. Water, 2 printed circuit coupons and 2 electri-cal connector shells were placed in the chamber. The lid wassealed after the chamber reached temperature equilibrium in a185°F oven. Daily additions of 0.45 ml of HC1 and 0.45 ml of SO2were injected to provide a concentration of 50 ppm of each corro-dent. The lid was removed daily prior to the injection so thatresidual gases could be dissipated.
The galvanic battery was calibrated in a 185*F/95% RHenvironment until the reading stabilized at 0.150 nA prior touse. During the first 19 hours battery output averaged 3-6 mAbut fe3l to an average of 0.5 mA for the next two days. Duringthe final week of the test, the average reading was less than 0.1mA in spite of an increase in daily HCl and 602 injections from0.45 ml to 0.90 ml. The drop in corrosivity was substantiated bythe uncorroded condition of the test articles. Examination ofthe test articles after 4 weeks of exposure revealed that theprinted circuits of the test coupons were not as corroded as theConstellation exposed coupons. The connector shells wereslightly discolored but not corroded.
3.3 SULFUR MONOCHLORIDE OPTIMIZATION - As shown in Table VII,the sulfur monochloride test (C2) chosen for optimization caused5 too many electrical failures and three too few corrosionfailures for correlation. To correct these problems, the testduration was shortened from 4 weeks to 2 weeks to reduce electri-cal failures and the sulfur monochloride concentration wasincreased from 3.5 ppm to 14 ppm to increase corrosion failures.
Three printed circuit test coupons, three mated connectorshells and a 50 ml beaker of distilled water were placed in asealed 1 liter container. A drop of a solution of 1 part S2C12to ten parts of ether from a calibrated eye dropper was addeddaily through a hole drilled in the lid. The container wasplaced in a 185"F oven. The corrosivity of the environment wasmonitored by neans of a calibrated galvanic battery. Tte avoragebattery output during the first week was 0.56 mA/in4 and 1.6during the second week. The 2 week average output of 1.08 mA/in2
is only half the target 2.0 mA/in2 . This target was based on thefact that the S0 2 /SF test was too corrosive when it generated a2.5 mA/in 2 average battery output. The overall average batterycurrent of 1 mA did not meet the target of 2.0 mA/in2 . The lackof corrosivity indicated by the battery data was confirmed by thefact that the connector shells were-not corroded by the two weekexposure. Time did not permit additional optimization testsprior to the demonstration test.
3.4 DEMONSTRATION TEST METHOD - The objective was to expose testarticles to the optimized Type A, B and C test environments andbased on how well the data correlated with the Constellationcorrosion criteria in Table IV and the electrical criteria inTable VI, eliminate the least desirable test method from furtherconsideration.
36
NADC 811.74-60
The following test articles were exposed to each of thethree environments:
Four pin connector assemb•. t ei (wired)*Uncoated circuit board asse' lies*Conformally coated circuit b,.rd assemblies*'Jncoated test circuit coupons*Conformally coated test circu..t coupons*Uncoated resistors*Conformally coated resistors*UTnwired but sealed 31-pin conn'ecLor adsemblies
*Electronic test articles exposed in an avionic box
The following test parameters were used:
Environment A - Modified Sulfur Dic..ide/Salt Fog Test
a) SOW diluted with 10 -.arts water for fog generationb) Bubble tower at 135"F - 140*Fc) Cabinet at 120"Fd) The following 6 hr cycle was used:
5 hr salt fog1/4 hr of S02 gas flow to start immediatelyafter fog shuts off3/4 hr rest period with fog and SO2 off
Environment B - High Temperature Corrosion/Humidity Test
a) A sealed 9 liter container was placed in a 185'F ovenand allowatd to come to temperature.
b) HCI and S02 gases were injected to produce a concentra-tion in the container of 100 ppm HCl, 50 ppm S02 and arelative humidity of 100%.
c) Batteries were placed in the bell jar with leads sealedthrough a hole in the cover and output was monitoredwith the chart recorder until the battery outputstabilized.
d) The concentration of S02 and HC1 was adjuited asrequired to produce a battery output of 1.0 mA/in'.
e) Prior to the daily gas addition, the container wasopened to dissipate residual HKl and S02 vapor.
Environment C - Sulfur Monochloride/Humidity Test
a) A 9 liter dessicator containing distilled water wasplaced in a 185*F oven and allowed to come to tempera-ture.
37
NADC 81174-60
b) S2 C12 was diluted with 10 parts by volume of ether. 1drop of the mixture was added three times a day at 8 AM,12 noon and 4 PM. Disregarding loss by corrosion reac-tions this would provide a 105 PPM concentration.Before the first daily addition was made, the dessicatorwas opened to dissipate any residual vapor produced bythe previous day's additions.
in preparation for exposure, a set of the electronic testarticles was installed in each of the three avionic boxes. Theboxes were exposed to the environments in a horizontal posi-tion with the lid side up. The connector assemblies were sup-ported by the wire harness with the plug above the receptacle asspecified in MIL.-C-38999. The galvanic batteries were calibratedin a humidity cabinet at 1850 F until the output stabilized at1.26 mA/in 2 .
Exposure to the three environments continued until a visualexamination showed that the majority of 'he test articles werecorroded to the same extent as the Constellation test articles oruntil the exposure duration lasted 4 weeks. The S0 2 /SF environ-ment produced good courelation in 2 weeks, the HCl/H 2 SO, andS2 C12 tests were terminated after 4 weeks.
3.4.1 Exposure Data - The results of the corrosion evalua-i- tion is shown in Table XI. The test articles were given an L, S
or M rating depending on whether the test environment producedless, the same or more corrosion than the carrier correlationcriteria in Table IV. The modified sulfur dioxide/salt fog testshowed the best correlation with the carrier exposed test arti-cles with a total of eight test articles correlating and threenot. The hydrochloric acid/sulfurous acid environment was secondbest with six test articles showing correlation and five showingless corrosion than the carrier exposed test articles. The sul-fur monochloride environment was too benign for good correlation.
The results obtained by comparing electrical test dataobtained after the exposure with criteria in Table VI are shownin Table XII. The modified SO2 salt fog test produced a drop inthe average insulation resistance from 16,000 to 9000 megohms butthis is well above the 1000 maximum megohms set as the failurecriterion. Hence the 'L' rating. On the other hand, theHCl/H 2 S0 3 environment received an 'S' rating because it produceJcircuit to circuit failure in all three connec':rs and degradedthe circuit-to-shell before test insulation resistance of 14,000megohms, to 4500 megohms. The S2 C12 environment reduced thecircuit-to-circuit resistance from 16,300 megohms to 7,000megohms in one connector but had no effect on the other two. Theshell-to-shell insulation was reduced from 20,000 to 6,700megohms - not enough to rate a failure.
None of the tests caused a leakage current failure of theuncoated test circuit coupons and therefore were given an Lrating.
38
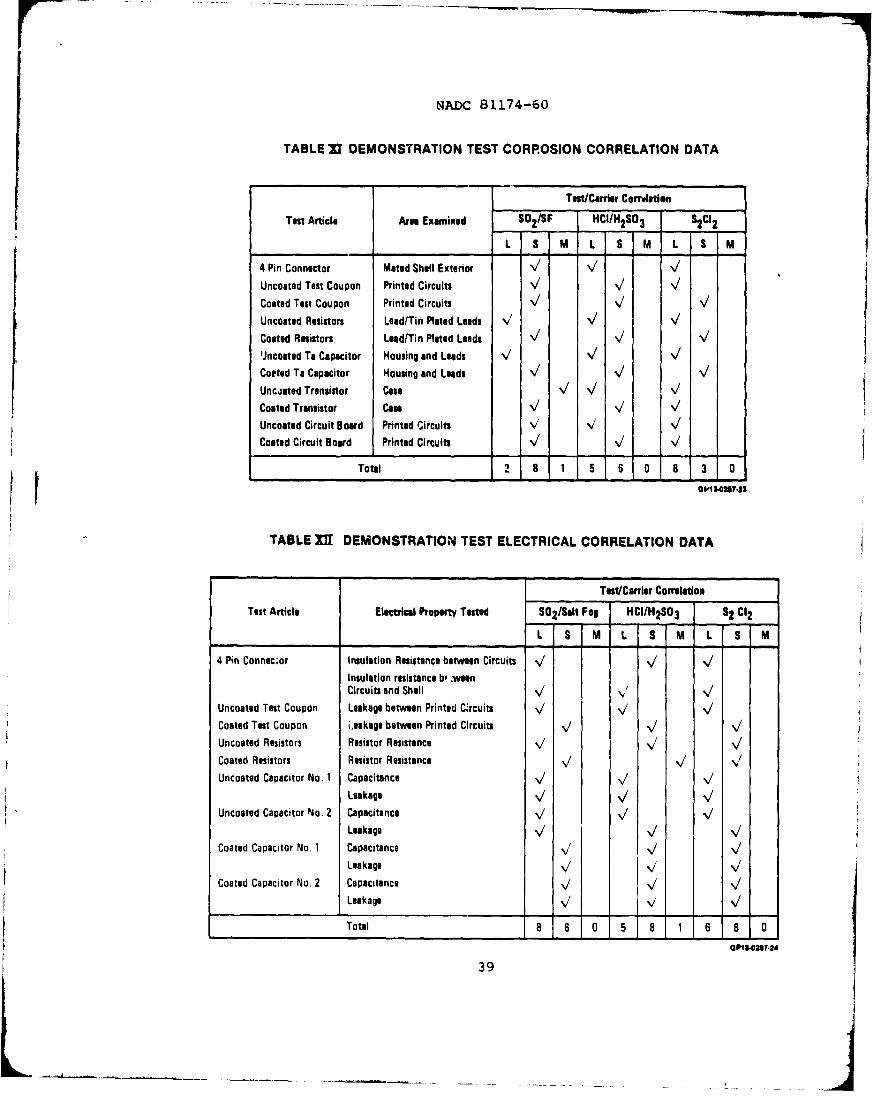
NADC 81174-60
TABLE'I DEMONSTRATION TEST CORROSION CORRELATION DATA
Test/Carder Corrolation
Test Article Area Examined SO2/SF HCI/H 2S0 3 S2 C12
L S M L S M L S M
4 Pin Connector Mated Shell Exterior V V /
Uncoated Test Coupon Printed Circuits I V /Coated Test Coupon Printed Circuits V/ V VUncoated Resistors Lead/Tin Plated Leads V V VCoated Resistors Lead/Tin Plated Leads V V V'Jncoated Ta Capacitor Housing and Leads V V %/Coated Ta Capacitor Housing and Leads V V VUncated Transistor Case V V V/Coated Transistor Case V V VUncoated Circuit Board Printed Circuits V V VCoated Circuit Board Printed Circuits V V V
Total 2 5 1 5 6 0 8 3 0
TABLE XfT DEMONSTRATION TEST ELECTRICAL CORRELATION DATA
Test/Carrier Correlation
Test Article Electrical Property Tested S02/Salt Fog HCI/H 2S03 92 C12
L S M L S I M L S M
4 Pin Connec~or Insulation Resistance between Circuits V V VInsulation resistance bF mweonCircuits and Shell V / V
Uncoated Test Coupon Leakage between Printed Circuits V V VCoated Test Coupon i.eakage between Printed Circuits V/ V VUncoated Resistors Resistor Resistance / V VCoated Resistors Resistor Resistance V V VUncoated Capacitor No. 1 Capacitance V V V
Leakage V V VUncoated Capacitor No. 2 Capacitance V V V
Leakage V/V VCoated Capacitor No. 1 Capacitance V V V
Leakage V v VCoated Capacitor No. 2 Capacitance V/V V
Leakage V V V
Total 8 6 0 5 8 1 6 8 0
OP3.O9?24
39
NADC 81174-60
The S2 C12 test was the only one which had a perfect resistorcorrelation score in that it failed the set of three uncoatedresistors but not the conformal coated set. The S0 2 /SF test didnot fail either resistor set while the HCl/H 2 So 3 test failed bothsets. None of the tests caused a capacitance output failure ofthe capacitors. Both the HCl/H 2 SO3 and the S2C12 test produced acurrent leakage failure of the ceramic capacitor.
The HCl/H 2 SO3 environment and the S2C12 environment, asexpected, produced more electrical failures than the modifiedsulfur dioxide test because the higher temperature - 185 0 F ascompared to 120OF - promoted faster moisture permeation of thedielectric materials.
In summary, the two tests chosen for the verification werethe S0 2 /SF and the HCl/H S0 3 tests. The S0 2 /SF test was chosenbecause it had the highest correlation score. The HCl/H 2 S0 3 testwas chosen because it had a higher correlation score than theS2 C12 test, and because the S2C12 test produced orange coloredcadmium sulfide corrosion products on cadmium plated parts in-stead of the white corrosion products characteristic of serviceexposure.
3.5 VERIFICATION - The program plan calls for a total of 25 testarticles, including the test articles used for the baselinetests, to be exposed to the two most effective test methods.This requirement widens the scope of the materials and finishesexposed to the test environments including nickel plated stain-less steel, nickel plated brass, stainless steel and electrolessnickel plated aluminum connectors. All test articles exposed tothe carrier environment and listed in Table I, plus two testarticles with service corrosion problems at land bases were usedfor the verification test.
3.5.1 Verification Test Methods - Because the S0 2 /SF demon-stration test produced two too few corrosion failures and eighttoo few electrical failures, it was decided to increase the S02injection duration from 15 to 30 minutes every 6 hours and in-crease the bubble tower temperature during the verification test.Since the bubble tower temperature control was already set atmaximum, it was necessary to insulate the glass bubble tower toraise the temperature. The modified S0 2 /SF test parameters wereas follows:
o SOU' diluted with 10 parts distilled watero Bubble tower 140 - 145 0Fo Cabinet at 120 0 Fo 5 hours salt fog every 6 hourso 30 minutes SO2 injection to begin 15 min before fog shuts
off and continue for another 15 min after shut-off
The reason the SO2 was started 15 minutes before the foggeneration was shut down was to acidify the fog that condensed onthe parts. The 15 min period of SO2 input after the fog shutdown was to keep the fog from absorb ing the S02 and carrying it
40
-- - ~ - '---.--
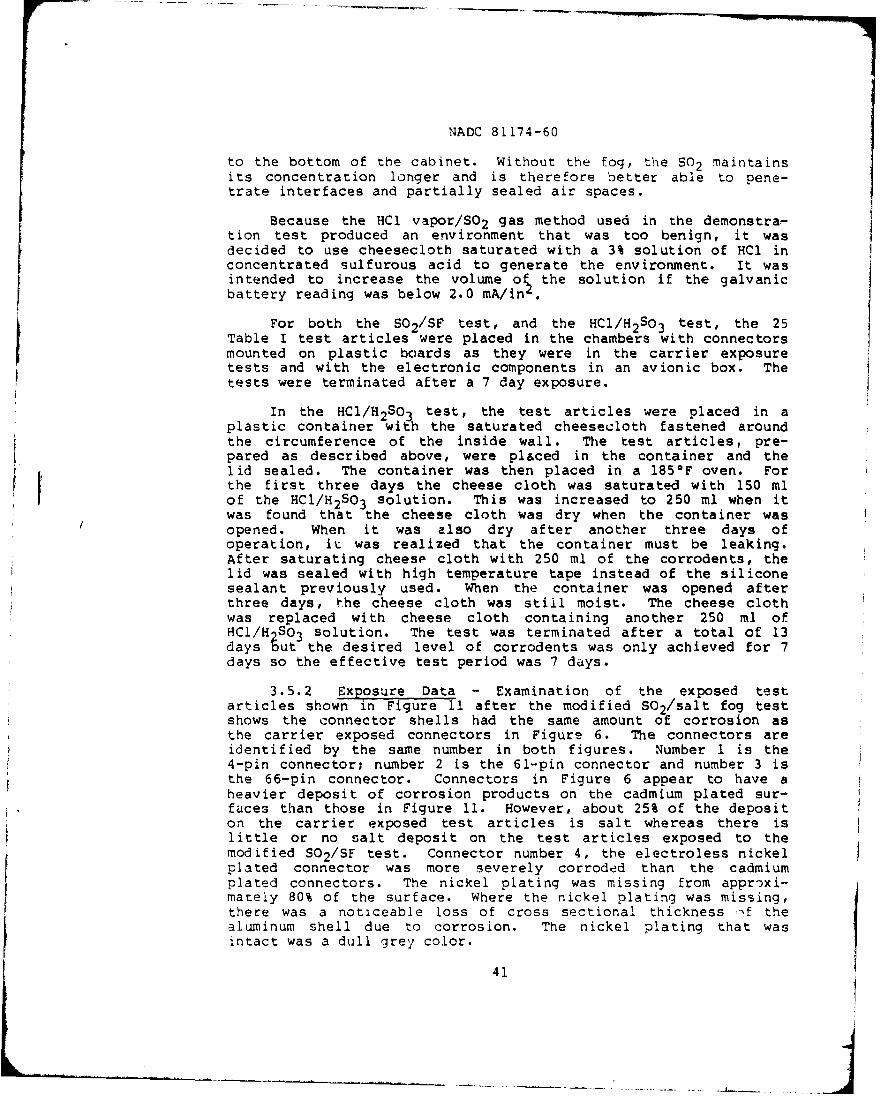
NADC 81174-60
to the bottom of the cabinet. Without the fog, the SO 2 maintainsits concentration longer and is therefore better able to pene-trate interfaces and partially sealed air spaces.
Because the HCl vapor/SO2 gas method used in the demonstra-tion test produced an environment that was too benign, it wasdecided to use cheesecloth saturated with a 3% solution of HCl inconcentrated sulfurous acid to generate the environment. It wasintended to increase the volume o• the solution if the galvanicbattery reading was below 2.0 mA/in
For both the S02/SF test, and the HCI/H2SO3 test, the 25Table I test articles were placed in the chambers with connectorsmounted on plastic boards as they were in the carrier exposuretests and with the electronic components in an avionic box. Thetests were terminated after a 7 day exposure.
In the HCl/H 2 SO 3 test, the test articles were placed in aplastic container with the saturated cheesecloth fastened aroundthe circumference of the inside wall. The test articles, pre-pared as described above, were placed in the container and thelid sealed. The container was then placed in a 185 0 F oven. Forthe first three days the cheese cloth was saturated with 150 mlof the HCl/H 2SO 3 solution. This was increased to 250 ml when itwas found that the cheese cloth was dry when the container wasopened. When it was also dry after another three days ofoperation, it was realized that the container must be leaking.After saturating cheese cloth with 250 ml of the corrodents, thelid was sealed with high temperature tape instead of the siliconesealant previously used. When the container was opened afterthree days, the cheese cloth was still moist. The cheese clothwas replaced with cheese cloth containing another 250 ml ofHCI/H2S0 3 solution. The test was terminated after a total of 13days but the desired level of corrodents was only achieved for 7days so the effective test period was 7 days.
3.5.2 Exposure Data - Examination of the exposed testarticles shown in Figure 11 after the modified S0 2/salt fog testshows the connector shells had the same amount of corrosion asthe carrier exposed connectors in Figure 6. The connectors areidentified by the same number in both figures. Number 1 is the4-pin connector; number 2 is the 61-pin connector and number 3 isthe 66-pin connector. Connectors in Figure 6 appear to have aheavier deposit of corrosion products on the cadmium plated sur-faces than those in Figure 11. However, about 25% of the depositon the carrier exposed test articles is salt whereas there islittle or no salt deposit on the test articles exposed to themodified S0 2/SF test. Connector number 4, the electroless nickelplated connector was more severely corroded than the cadmiumplated connectors. The nickel plating was missing from appr-xi-mately 80% of the surface. Where the nickel plating was missing,there was a noticeable loss of cross sectional thickness -f thealuminum shell due to corrosion. The nickel plating that wasintact was a dull grey color.
41
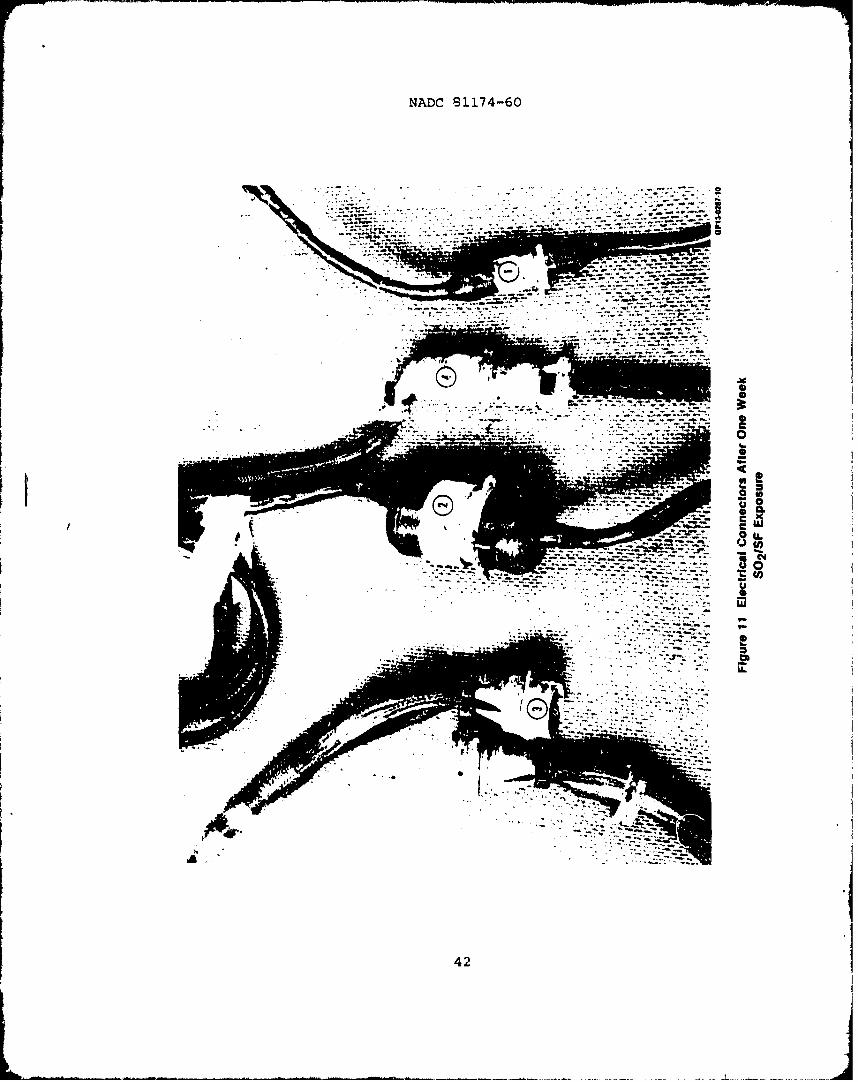
NADC 81174-60
0
42
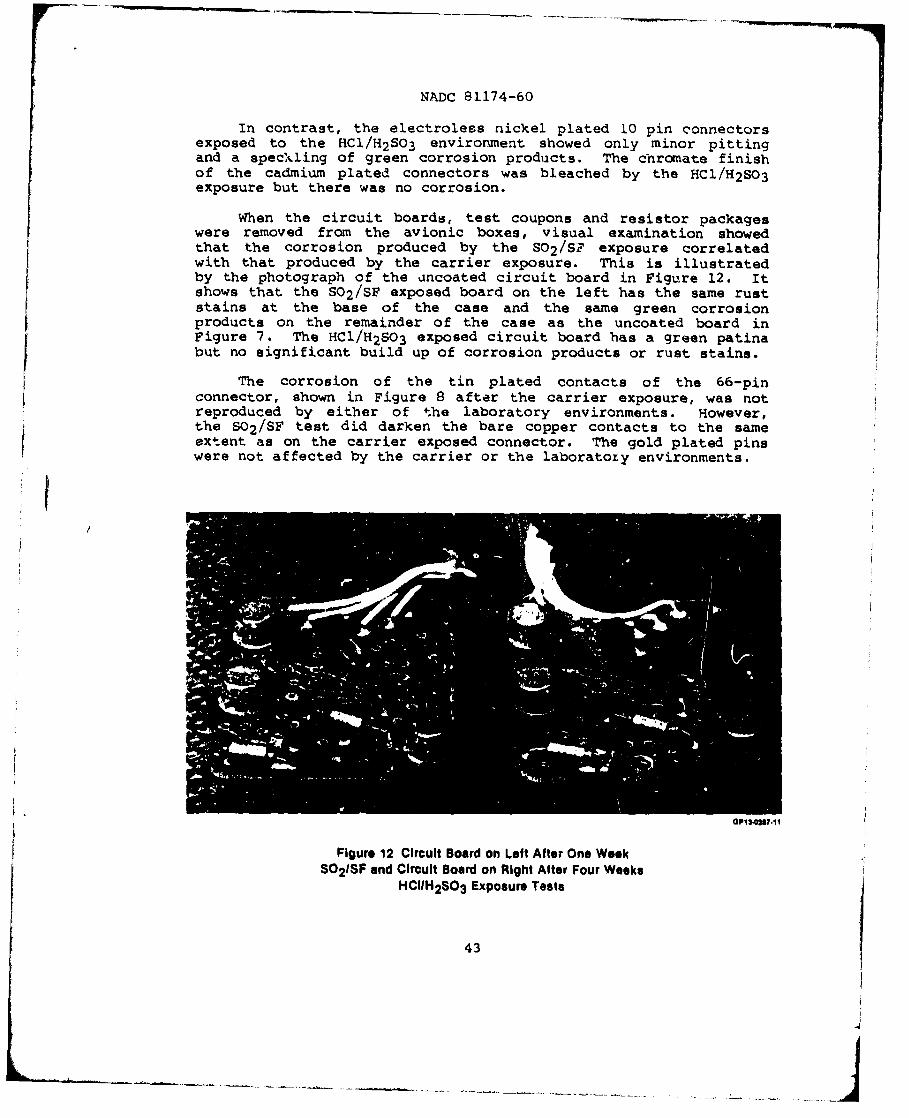
NADC 81174-60
In contrast, the electroless nickel plated 10 pin connectorsexposed to the HCl/H 2 S0 3 environment showed only minor pittingand a speckling of green corrosion products. The chromate finishof the cadmium plated connectors was bleached by the HCl/H 2 S0 3exposure but there was no corrosion.
When the circuit boards, test coupons and resistor packageswere removed from the avionic boxes, visual examination showedthat the corrosion produced by the S0 2 /SF exposure correlatedwith that produced by the carrier exposure. This is illustratedby the photograph of the uncoated circuit board in Figure 12. Itshows that the S0 2 /SF exposed board on the left has the same ruststains at the base of the case and the same green corrosionproducts on the remainder of the case as the uncoated board inFigure 7. The HCl/H 2 S0 3 exposed circuit board has a green patinabut no significant build up of corrosion products or rust stains.Ii
The corrosion of the tin plated contacts of the 66-pinconnector, shown in Figure 8 after the carrier exposure, was notreproduced by either of the laboratory environments. However,the S0 2 /SF test did darken the bare copper contacts to the sameextent as on the carrier exposed connector. The gold plated pinswere not affected by the carrier or the laboratozy environments.
GP1 327.11
Figure 12 Circuit Board on Left After One WeekSO 21SF and Circuit Board on Right After Four Weeks
HCIIH2 SO 3 Exposure Tests
43
__ _ j
2NADC 81174-60
The results of the visual comparison of the carrier exposedtest articles and those exposed to the verification test environ-ments are summarized in Table XIII. As shown by this data, themodified S02/3F test produced the same degree and type of corro-sion as the carrier exposure on 16 of the test articles. Itproduced lens corrosion on the tin plated pins of the 66-pinconnector an'd on the tin plated printed circuits of the uncoatedcircuit boards. It produced more corrosion on transistor casesthat were not protected by teb- avionics box and on the cadmiumplated toggle switch mounting nuts.
The HCl/H 2 S0 3 test provided correlation with 10 of thecarrier test articles, less corrosion on 8 and too much on thestainless steel variable resistor and nickel plated brass coaxialconnector. Based on the tabulated corrosion data, the modifiedS02/SF test is superior to the HCl/H2S03 test method.
TABLE Zl VERIFICATION TEST CORROSION CORRELATION DATA
S~SO 2ISalt Fell HCIIH2SO3
Test Article Am&a Examined ,,
L ISIM L S_8M
4 Pin Connector Mated Shell Exterior X X10 Pin Connector Mated Shell Exterior X X61 Pin Connector Meted Shell Exterior X X66 Pin Connector Ag/P Wire Copper Pins X X
Tin Plated Pins X XGold Plated Pins X X
Coaxial Connector Mated Shell Exterior X XUncoated Test Coupon Printed Circuits X X
Conformal Coated Test Coupon Printed Circuits X XUncoated Resistors Lead-Tin Plted Leads X XCoolformally Coated Resistors Leed-Tin Plated Leads X X
Uncoated Transistors (Exposed) Case X XUncoated Transistors (Box) Case X X
Conformel Coated Transistors (Box) Can X XVao~able Resistors Stainless Steel Housing X X
Toggle Switch Toggle and Mounting Nut X X
Uncoated Circuit Board Circuits X XConformal Coated Circuit Board Circuits X XCircuit Breaker Housing Thread and Jam Nut X X
Stainless Stee! Track Module Nickel Electroplate X X
Total 2r2 6 2 8 10 2
44

NADC 81174-60
Electrical tests were carried out on the test articlesbefore and after the exposure tests to detect any significantchange in electric characteristics or performance. Data derivedby tests made after the exposura were compared to the Table XIVelectrical correlation criteria. The results of this comparisonare shown in Table XV. The data show that both tests failed toproduce failure of some of the connectors and circuit boardcomponents.
However, the SO /SF test did produ,:e failure of the 4-pinand 61-pin electrical connectors and the circuit breaker. Theconnectors have a history of corrosion failures and the circuitbreaker failed due to the carrier exposure. The other connectotsdo not have a history of service failure. The modified S0 2 /SFtest also increased pin/socket contact resistance as did thecarrier exposure.
$':he Table XIV criteria that requires the test circuitcoupons to fail may be unrealistic. So based on solid servicehistory and carrier data the modified S0 2/SF test produced therequired respoonse in all test articles.
3.5.3 Galvanic Battery Data - Because the corrosion currentgenerated by a galvanic battery changes with fluctuations inenvironmental corrosivity, it provides a method of tracking thedynamics of a rapidly changing environment. For example theduplication of superimposed chart recordings in Figure 13 showsthat the battery senses the increase in corrosivity produced bythe injection of SO2 and shows the drop off in corrosivity about30 minutes after the injection is terminated. Note that thechart pen recorded from right to left so the time scale "0" is atthe far right end of the abscissa. Figure 13 data shows thatalthough the modified S0 2/SF injection duration is only 30 min-utes as compared to 60 in the NADC test, the erfect of the injec-tion lasts about the same length of time. This is because thesalt fog is off for the last 15 minutes of the modified test andtherefore does not absorb the S02 and carry it to the bottom ofthe chamber. The recording in Figure 14 shows the rapid ir::reasein corrosivity when the sealed container with cheese cloth satur-ated with the HCI/H 2 SO 3 solution is placed in a 185IF oven andgradual decrease in corrosivity of the HC]/H 2S0 3 environment asthe active ingredients are depleted. This in ormation indicatesthat for this environment to work successfully, the HCl/H 2 SO3solution has to be introduced at more frequent intervals toproduce sufficient corrosion to correlate with a carrier environ-ment.
45
_ _
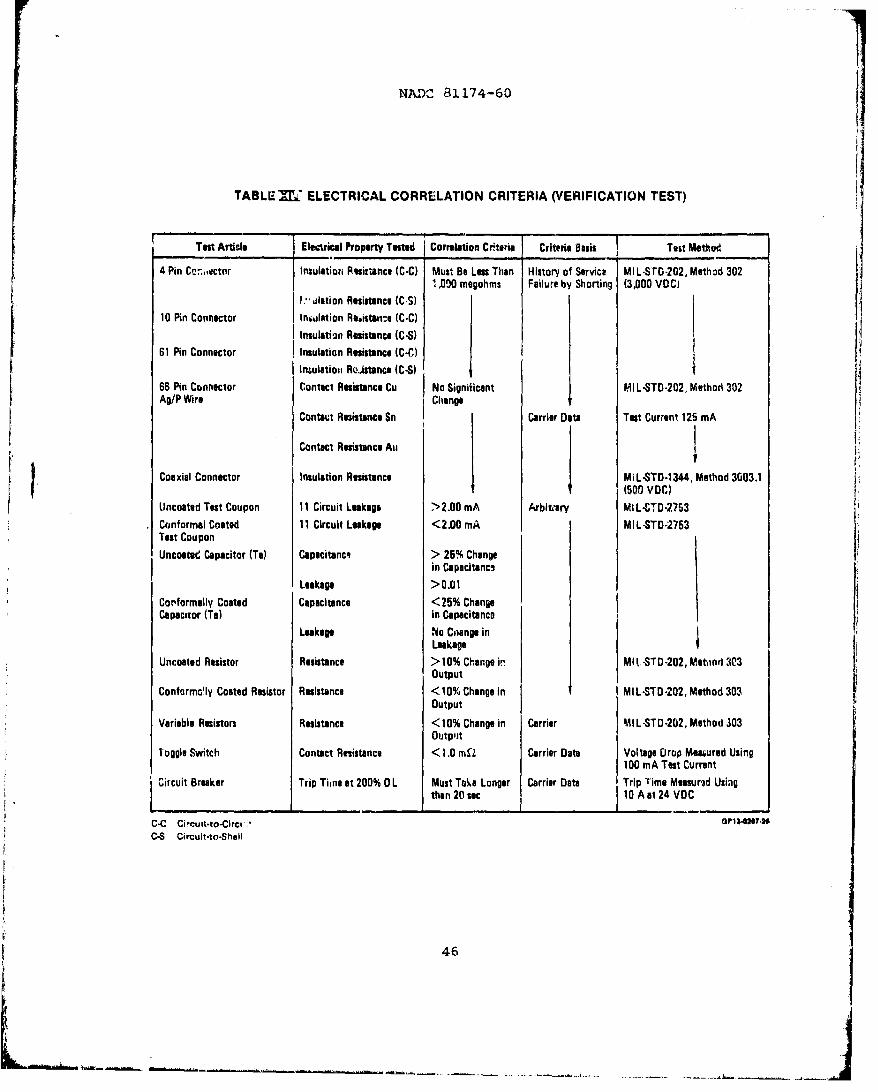
NADC a1174-60
TABLEXIM ELECTRICAL CORRELATION CRITERIA (VERIFICATION TEST)
Tesg Article Elect-rical Property Tested Correlation Cr-teria Criteria Basis Test Meth~odt4 Pin Cu,ector insulatiorn RPiztance (C-C) Must Be Les Then History of Service MIL-sro-202, Method 302
.000 megohms Failure by Shorting (3,000 VDC)
n.-slation Resistance (C-S)10 Pin Connector Iniulation Re.istan:e (C-C)
Insulatiin R esistanc e (C-S) •
61 Pin Connector Insulatian Resistance (C-C)
,nrulatio,, ReAtance (C-S)66 Pin Connector Contact Resistance Cu No Significant MIL-STD-202, Method 302Ag/P Wire Change
Contact Resistance Sn Carrier Data Test Current 125 mA
Contact Resistance Au
Coaxial Connector Insulation Resistance MIL-STD-1344, Method 3003.1' (500 VDC)
Uncoated Test Coupon 11 Circuit Leakag6 >2.00 mA Arbiteary MIL-STD-2753Conformal Coated 11 Circuit Leakage <2.00 mA MIL-STD-2753Tast Coupon
Uncoated Capacitor (Ta) Capacitance > 25% Changein Capacitanc,
Leakage > 0.01Co-formally Coated Capacitance <25% ChangeCapacitor (Ta) in Capecitanco
Leakage No Change inLeakage
Uncoated Resistor Resistance > 10% Change in Mlý,-STD-202,Meti•ir 303Output
Conform,!ly Coated Resistor Resistance <10% Change in MIL-STD-202, Method 303Output
Variable Resistors Resistance <I10% Change in Carrier MIL-STD-202, Method 303Output
1 oggle Switch Contact Resistance < 1.0 mr2 Carrier Data Voltage Drop Measured Using100 mA Test Current
Circuit Breaker Trip Time at 200% 0 L Must Take Longer Carrier Data Trip T ime Measured Usiigthan 20 sac 10 A at 24 VOC
C-C Cicuit-to-Circt Gpla'aa74dC-8 Circuit-to-Shell
46
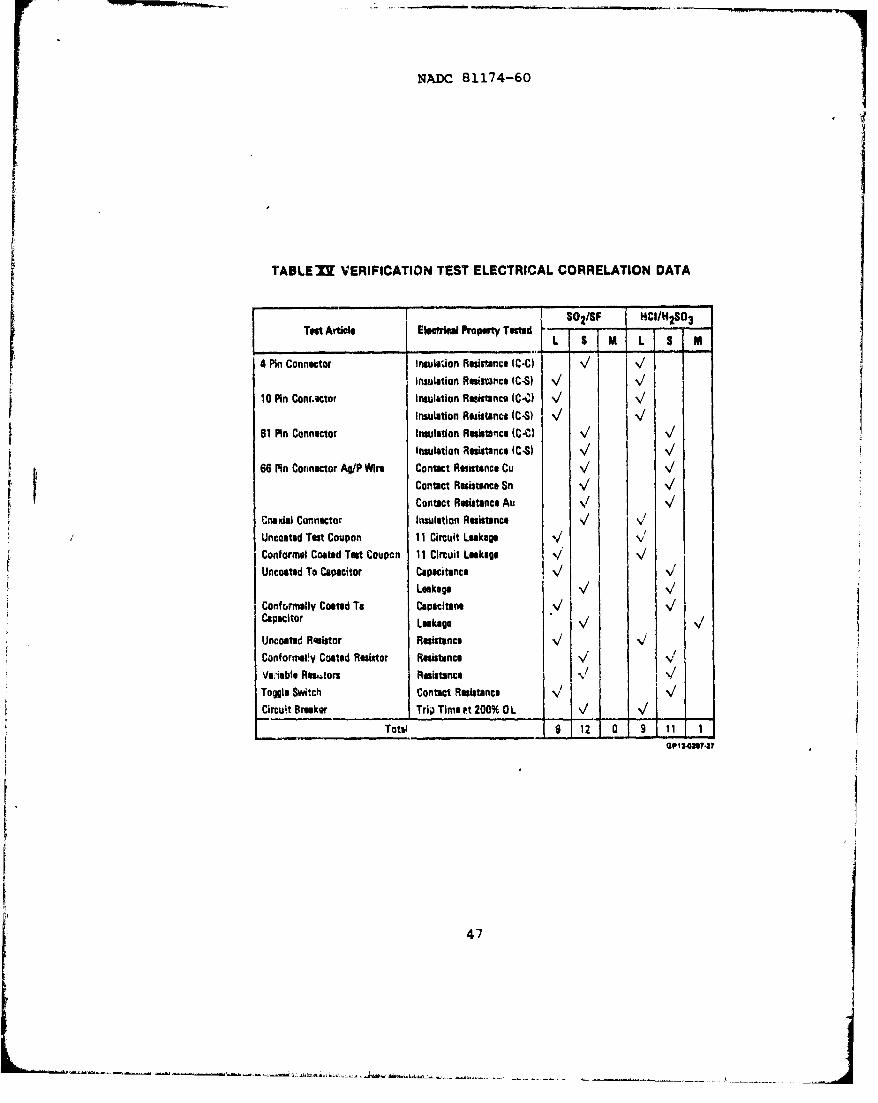
NADC 81174-60
TABLE"XZ VERIFICATION TEST ELECTRICAL CORRELATION DATA
SArticle Pro e ted /SF HC1/H 2S03Test A~tuce Elec?,imdI opestyTed L S M L f M
4 Pin Connector Insulesion Resistance (C-C) - V-
Insulation Rllrmnce (C4) V V10 Pin Conr.ector Inrulstion RAsistance (C-C) V /
Insulation RAijtanca (CS) v/ V61 Pin Connector Insulation Resistance (C-C) /
Insulation assistance (CS) V V66 Pin Cornector Ag/P Wire Contact Resistance Cu V V
Cortact Resistance Sn V /Contact Resistance Au V V
Coaxial Connector Ihsulation Resistance V/Uncoated Test Coupon 11 Circuit Leakage /Confornal Coated Teat Coupon 11 Circuit Lkage ak VgUncoated To Capacitor Capacitance V/ V
Leakage N VConfrormalIV Coated Ta Capacitane ,VCapacitor Lekage / VUncoated Rosistor ResistanceConformal'y Coated Resixtor Resistance V %Valeble Remsors Resistance /
Toggle Switch Contact Resistance V j VCircuit Breaker Trip Time P't 200% 01 V V
Total 9 1Z 0 9 11 1
47
_ j
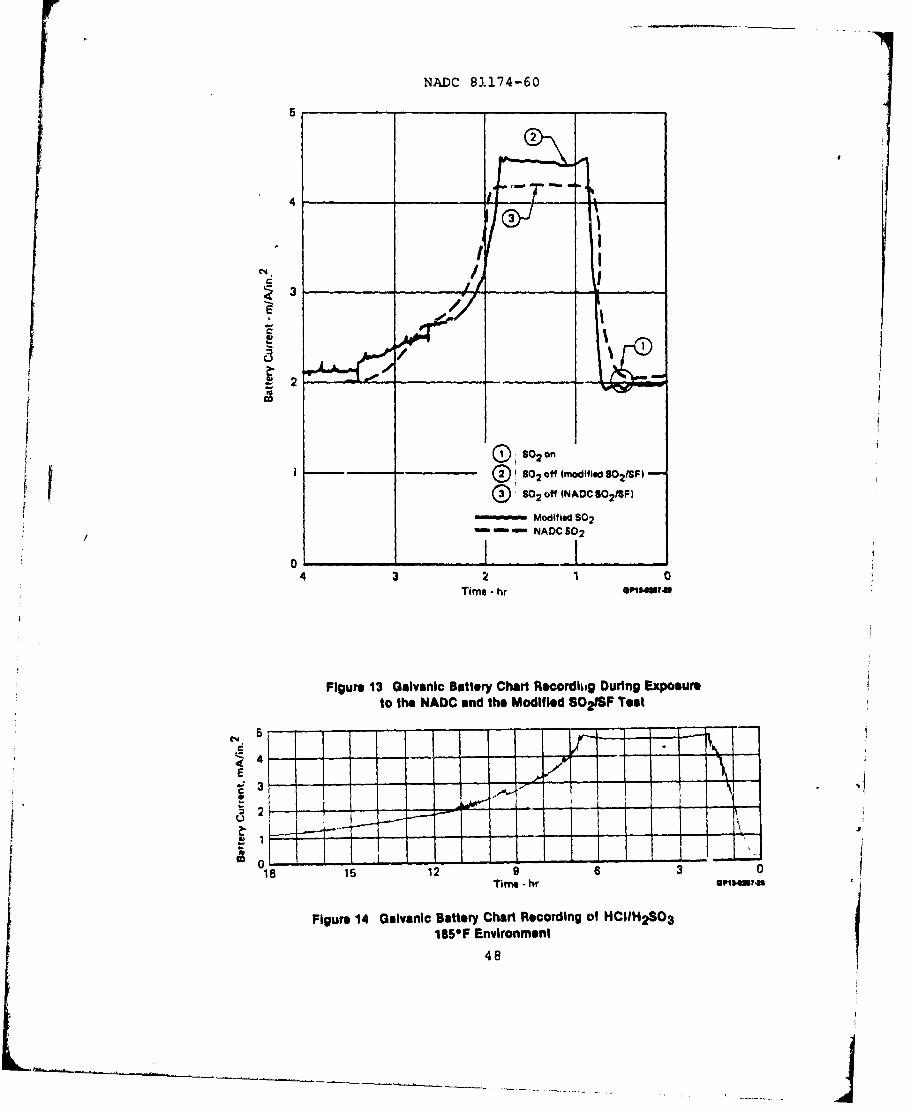
NADC 81174-60
"4i
Z 2
CS
6II
( • SO2 on
1 -- - 0' 02 *ff (modified S02 tSP)
80 2 off s NAODC 5o 2/SF)
Modified S02
Ui, NADC SO 2
Time - hr 0
Figure 13 Galvanic Battery Chart Recordhig During Exposureto the NADC and the Modified S0 21SF Test
C4
I~ 0&18 15 12 9 63u
Time - hr
Figure 14 Galvanic Battery Chart Recording of HCiIH 2 SO3185eF Environment
48
NADC 81174-60
3.6 DISCUSSION OF RESULTS - The modified S0 2 /SF test producedthe same amount of corrosion on 16 of the 20 test articles as thecarrier exposure. Two test articles were more corroded and twowere less corroded than the carrier test articles. This isconsidered to be as high a correlation score as is practicable.A perfect correlation score is not possible using such a widevariety of test articles because the results of the carrierexposure will vary depending on the operating area, the time ofyear and the weather conditions. Therefore, since the teststandards are to some degree a variable as are the results ofsequential laboratory tests, the test method should be expectedto provide good but not perfect correlation.
Wherever there is moisture to act as an electrolyte, thereis a danger that corrosion can occur. Therefore to be effective,a corrosion test must have the same ability to force moisture topenetrate partially sealed components such as connector interiorsas the service environment. The high temperature S0 2 /SF testmeets this criteria because it caused insulation failure of the4-pin connector and tarnished the copper pins inside the 61-pinconnector. The Mil-STD-810 5% neutral Salt Fog test and the NADCsulfur dioxide operate at a cabinet temperature at 950F. Thistemperature is too low to produce the moisture diffusion andintrusion phenomena Lhat occur during long term avionics deploy-ment.
49
NADC 81174-60
4. CONCLUSIONS AND RECOMMENDATIONS
4.1 CONCLUSIONS - As a result of the data developed by the pro-gram, the following conclusions are presented:
o The Mil-STD-8l0 (ASTM B117) neutral salt fog test isinadequate for qualifying avionic components for marineservice.
o The program objective of developing a avionic corrosiontest method that can be used for component certificationhas been accomplished. So The program objective has been exceeded in the sense thatthe high temperature S0 2 /SF test -an be used as a humid-ity test as well as a corrosion test.
o The galvanic battery is a valuable addition to the analy-tical tools required in corrosion research and develop-
Smen t.
4.2 RECOMMENDATIONS - It is recommended that:
o Additional tests be carried out using the high tempera-ture sulfur dioxide/salt fog test by more than one labor-atory using line replaceable units with known corrosionproblems to determine if this test method will duplicatethe service problems. The following test patrameters arerecommended tor running these tests:
a) Cabinet temperature 120-1250F.b) Bubble tower temperatures 135-1400F (it may be neces-
sary to insulate the tower to meet the temperaturerequirements).
c) Make up salt solution for fog generation by adding 1part of the ASTM D1141 solution to 10 parts distilledwater.
d) Fog generation in accordance with ASTM B117 exceptthat the Fog is discontinuous - 5 hrs. on and 1 hr.off every 6 hrs.
e) Sulfur dioxide dispersed throughout the cabinet asshown in Pigure 1 of Reference 2.
f) The flowrate of sulfur dioxide and flow rate controlequipment should be in accordance with Reference 2.
g) The cam contcolled solenoid valve should be set tostart the S02 flow 15 minutes before the salt fog isshutoff and should continue for 15 minutes after thefog is shut off for a total of 30 minutes of inputevery 6 hrs.
o Feasibility studies be made using galvanic batteries toestablish aircraft wash schedules based on galvanicbattery output.
50
NADC 81174-60
5. REFERENCES
1. L. W. Grzech and R. C. Schrel, Aeronautical AnalytLcalRework Program, Naval Aircraft Avionics Corrosion Preventionand Control Final Report Phase I, January 31, 1974, NavalAir Development Center.
2. S. J. Ketcham, "Accelerated Laboratory Corrosion Test forMaterials and Finishes Used in Naval Aircraft, Report No.NADc-77252-30.
3. N. D. Tomashov, "Theory of Corrosion and Protection ofMetals", The MacMillan Company, NY pp 376-378.
4. V. Kucera and E. Mattson, "Electrochemical Techniques forDetermination of the Instantaneous Rate of AtmosphericCorrosion", ASTM STP 558, American Society for Testing andMaterials.
51
51
__ __ j- -
DI STR I BUT IO LIST
REPORT NO. NADC-81174-60
No. of Copies
NAVAIR (AIR-950D) .........................................2 for retention1 for AIR-3201 for AIR-320A1 for AIR-4111EI for AIR-5163I for AIR-5163C1 for AIR-5163C2I for AIR-5185
NAVAIREWORKFAC, NAS, Alameda (Code 340) . . . .............. 1Jacksonville (Code 340) ............. 1Norfolk (Code 340) .... ................ .North Island (Code 340) ................... IPensacola (Code 340) ....... ..... .. 1
MCAS, Cherry Point (Code 340) ........... ...... 1WPAFB (AFWAI./MLSA and MLLN), Dayton, OR. ..... ................. 2
COMNAVAIRLANT (Code 528) .. .. .. .. .. .. .. . . . . .. .. 1
COMNAVAIRPAC (Code 7412) . .. . . .. .. .. .. . . . . . . .. .. 1
NWC, China Lake, CA (Code 3665) ........ .....................
McDonnell-Douglas, St. Louis, MO (A. W. Morris) ................ 2
Vought, Dallas, TX (A. Hrhuan) ....... ....................... I
Texas Instruments, Attlebow, MA (R. Eaboian) ....................
Hctneywell, Minneapolis, MN (J. Nathan) ..... ................... 1
IBM, Poughkeepsie, NY (D. Jeannotte) ............ ................ 1
DTIC. . . . . . . . . . . . . . . . . . . . . . . . . . . . . . . . . 12
'.]
__ j