Embed Size (px)
Citation preview
JOURNALOFNEUROPHYSIOLOGY
Vol. 44, No. 6, December 1980. Printed in U.S.A.
Correlations Between Task-Related Activity and
Responses to Perturbation in
Primate Sensorimotor Cortex
JONATHAN R. WOLPAW
Laboratory of Neurophysiology, National Institute of Mental Health, Bethesda, Maryland 20205
SUMMARY AND CONCLUSIONS
1. Monkeys were trained to maintain hand position against a range of constant forces. Short-latency responses to passive wrist extension or flexion, as well as short- latency responses to stretch of a single wrist muscle, were recorded from units in areas 4, 3, 1, and 2. These responses were compared to unit activity during active holding and during active movement.
2. Units related to active holding and to active movement were most common in areas 4 and 2. Three-quarters of these units displayed a specific correlation between their passive and active behaviors. Thus, a unit excited by passive extension was ex- cited during active holding against extension force and excited during an active flexion movement. This behavior is similar to the expected concurrent behavior of muscle stretch receptors. By demonstrating that a significant number of task-related units give qualitatively similar responses to passive extension and passive flexion, the results appear to explain the disagreement among previous studies (5,9,36) in regard to area 4 behavior during active and passive move- ments.
3. Area 4 units responded similarly to passive wrist extension and electromagnetic stretch of a single flexor muscle occurring in the absence of wrist extension, indicating that muscle stretch was important in deter- mining area 4 unit responses to passive movements.
4. The similarity of area 4 behavior to area 2 behavior in active and passive situa- tions, along with the observation that area 2
responses to passive movements occurred several milliseconds earlier than those of area 4, emphasizes the importance of area 2 in motor performance and is consistent with significant area 2 mediation of area 4 re- sponses.
5. Results support the hypothesis of an oligosynaptic transcortical pathway (22, 32, 34), beginning in large part with muscle stretch receptors. Furthermore, the cor- relation noted between short-latency re- sponses to passive movement and task- related activity suggests that this trans- cortical pathway not only mediates responses to passive movement but may be respon- sible, to a significant degree, for task- related activity during undisturbed per- formance. Thus, active position main- tenance and active movement were probably accomplished, at least in part, by increasing and decreasing the influence of this pathway on specific area 4 neurons and thereby producing the patterns of area 4 activity responsible for task performance.
INTRODUCTION
The clear relation of the precentral gyrus (area 4) to movement and the equally clear relation of the postcentral gyrus (areas 3, 1, and 2) to somatosensory input have strongly affected studies of these regions. Thus, motoneuron and electromyographic (EMG) activity resulting from stimulation of area 4 has been intensively studied, and area 4 neuronal activity has been correlated with active movement and active position main- tenance. In contrast, postcentral cortex unit activity has been precisely related to stimu-
CORTICAL ACTIVITY AND PERTURBATION 1123
lation of specific peripheral receptors. Its relation to motor activity remains largely unexplored in spite of the observation that stimulation of this region can produce move- ment (12, 58) and the more recent finding that corticospinal neurons reside here as well as in motor cortex (6, 20, 33).
The recognition that area 4 responds very quickly to a perturbation imposed during motor performance (5, 8, 36) has generated interest in the relationship between its sen- sory input and its motor output. The pro- posal by Koeze et al. (22) and Phillips (34) of a transcortical loop, an oligosynaptic pathway by which peripheral input gener- ates compensatory area 4 activity, is sup- ported by most (5, 9, 13, 32), though not all (24, 36), studies. That is, most studies have found that area 4 neurons that are active with active movement in one direction are usually excited by passive movement in the other direction. The observation that area 4 neurons do not respond to a perturbation if the task forbids compensatory movement (8, 10, 11) is an additional indication that short-latency peripheral input elicits com- pensatory activity. Such input could also be important in producing the task-related activity responsible for undisturbed per- formance. If this were the case, task per- formance would involve controlling periph- eral access to area 4 neurons. Evaluation of this possibility requires knowledge of the specific aspect of peripheral input most important in determining area 4 response in a given situation, whether muscle stretch, joint rotation, tactile stimulation, or a com- bination of the three.
The prevalence and characteristics of postcentral task-related activity have only recently come under study (41). The relation of such activity to peripheral input and to concurrent area 4 activity requires ex- tensive investigation. The role of the post- central gyrus in mediating area 4 short- latency responses is unresolved.
The present study asked several ques- tions about the relationship between task- related neuronal activity and neuronal re- sponses to perturbations in both precentral and postcentral regions. The specific ques- tions were: a) Do the responses of task- related area 4 neurons to perturbations tend to compensate for the perturbations, as
most studies report (5, 9, 13, 32) and, if so, can apparently contradictory findings (24, 36) be accounted for? b) Is muscle stretch, as opposed to joint rotation or tactile stimu- lation, an important determinant of area 4 responses? c) When does each area of the postcentral gyrus response to perturbations in relation to the response time of area 4? d) Are task-related neurons found in the postcentral gyrus, and in what areas are they most frequent? e) How does post- central task-related activity relate to post- central responses to perturbations?
METHODS
Training
Each of four monkeys (Macaca mulatta) was seated in a primate chair. The right arm was snugly restrained above the elbow and at the wrist so that the elbow angle was fixed at 90”, and the right palm was strapped to a torque motor handle that moved in the plane of wrist exten- sion and flexion. Because the handle was firmly strapped across the animal’s palm, its fingers did not contribute to control of handle position. The absence of need for finger use and the lack of finger restraint minimized change in length of forearm finger muscles, as opposed to fore- arm wrist muscles, caused by passive and active movements. This design was intended to limit as much as possible the responsive and task- related neurons to those related to wrist move- ment, as opposed to just finger movement. The effects of a compensatory transcortical loop on neurons concerned primarily with finger move- ment might differ markedly, depending on whether the eliciting disturbance stretches finger muscles at the wrist joint or at the finger joints; thus these neurons could have greatly compli- cated data analysis. Similarly, fixation of the elbow angle was intended to exclude the majority of neurons responsive to movement about the elbow. These features helped to compensate for the usual absence of comprehensive receptive- field evaluation, which was impractical due to the experimental apparatus. Each monkey re- ceived liquid reward at pseudorandomly varying 3- to 6-s intervals for maintaining the handle in a middle zone of 6’ (occasionally 12”), with its wrist neither flexed nor extended. Handle posi- tion was monitored by a potentiometer mounted on the motor shaft. A light signaled presence of the handle in the reward zone. The torque motor could apply extension or flexion constant background force to the handle, requiring con- tinuous exertion by wrist flexors or extensors,
1124 J. R. WOLPAW
respectively, if the handle was to remain in the reward zone. The torque motor cycled through five levels of background force: zero, strong extension, strong flexion, weak extension, and weak flexion. Each level was maintained until the monkey earned 16 rewards. The force range was set to allow the monkey to perform the task indefinitely. Absolute amplitude of strong extension and strong flexion background force was usually 0.03 N. Weak extension and weak flexion were half this absolute amplitude. Animals readily mastered the task over the course of one to four daily 3- to 4-h exposures. One-half second before reward delivery, a SO-ms force pulse of fixed absolute amplitude (1.4 times that of strong background force) was superimposed on the background force. This caused a handle displacement usually between 10 and 20”, de- pending on the animal and background force. (In a prerigor mortis monkey cadaver arm, ex- tension of this magnitude lengthened the muscle flexor carpi ulnaris by 100-200 pm.) Eight extension and eight flexion pulses in pseudo- random order were delivered at each background force level. In the course of performance, animals frequently left the reward zone, either spontaneously or as a result of a force pulse. Re- turn into the reward zone was defined as cor- rective movement ifit did not occur within 100 ms following onset of a force pulse. This condition excluded immediate rebound after the force pulse.
Surgery
After training, each monkey was prepared under Nembutal anesthesia for chronic single-unit recording by standard methods (7). A head holder was attached to bolts implanted in the skull to allow immobilization of the head during unit recording; A chronic recording cylinder was centered over the arm region of primary motor and somatosensory cortex on the left side. Cylinder placement was determined by stereo- taxic coordinates, by the minimal visualization of sulci possible through the dura, and by evalu- ation of the sulcal pattern via digital markings on the disk of skull removed (54). A pyramidal tract-stimulating electrode was positioned in the left medullary pyramid. In each of two mon- keys, a 2-g, 3 x 5 x 20 mm, coated (26) iron slug was implanted in the distal musculotendinous junction of the right flexor carpi ulnaris (FCU) muscle (4, 56).
Recording Animals resumed performance several days
after surgery. Experimental design was identical to that during training except that a solenoidal coil encircled the forearm of each monkey with an implanted slug (4, 56). One to two seconds before force pulse delivery, a lOO-ms (7-ms rise
time) DC current pulse passed through the coil. The pulse exerted a 70-g distally directed force on the slug, and thus stretched the FCU (25- 50 pm, rise time 50-75 ms, measured in a pre- rigor mortis monkey cadaver arm). The stretch caused no change in handle position as measured by the potentiometer, and appeared to be ig- nored by the monkeys. It often produced a tendon jerklike FCU EMG response with a latency of lo-14 ms (56).
Single-unit recordings were obtained from each animal over a period of 2-3 mo. Penetra- tions were made perpendicular to the plane of the cylinder with glass-insulated platinum-iridium microelectrodes (52). The electrode was slowly advanced as the animal performed the task. Unit background activity and responses to force pulses were monitored on-line by a raster display. For each well-isolated unit that appeared to respond to extension and/or flexion force pulses, unit activity and handle position were recorded on tape for one or more experimental cycles. A cycle consisted of the 5 background force levels with 16 force pulses (and 8 or 16 FCU stretch pulses) at each level. The inter- locking of extension and flexion background force levels, as noted above, provided a check against change in unit behavior over time. For two monkeys, corrective movement activity (that is, unit activity occurring with movements into the reward zone) was also recorded, unless such corrective movement occurred less than 100 ms after the force pulse (this stricture eliminated rebound from the force pulse). During selected penetrations, small lesions were made by current passage to aid later histological analysis.
Histology On completion of recording, animals were
killed by an overdose of Nembutal and were perfused with normal saline and 10% Formalin. Brains were embedded in celloidin, cut in the sagittal plane at 50 pm, and stained for Nissl substance with thionine. Sections were examined and cortical areas identified according to the criteria of Powell and Mountcastle (37) (Figs. i and 2). The area 4/ares 3a boundary was located by marked decrease in cortical thickness and dis- appearance of Betz cells. The area 3b/area 1 boundary was placed primarily on the basis of increasing differentiation and decreasing density of middle cortical layers. The area 2 boundaries were more difficult to place. For the area l/ area 2 boundary, the most helpful features were increase in cortical thickness and appearance of large pyramidal cells in layers III and V. In- crease in clarity of lamination and position in the gyrus were used to locate the area 2/ares 5 boundary. More laterally, the area 2/ares 7 boundary was placed at the bottom of the intra-
CORTICAL ACTIVITY AND PERTURBATION 1125
10 mm
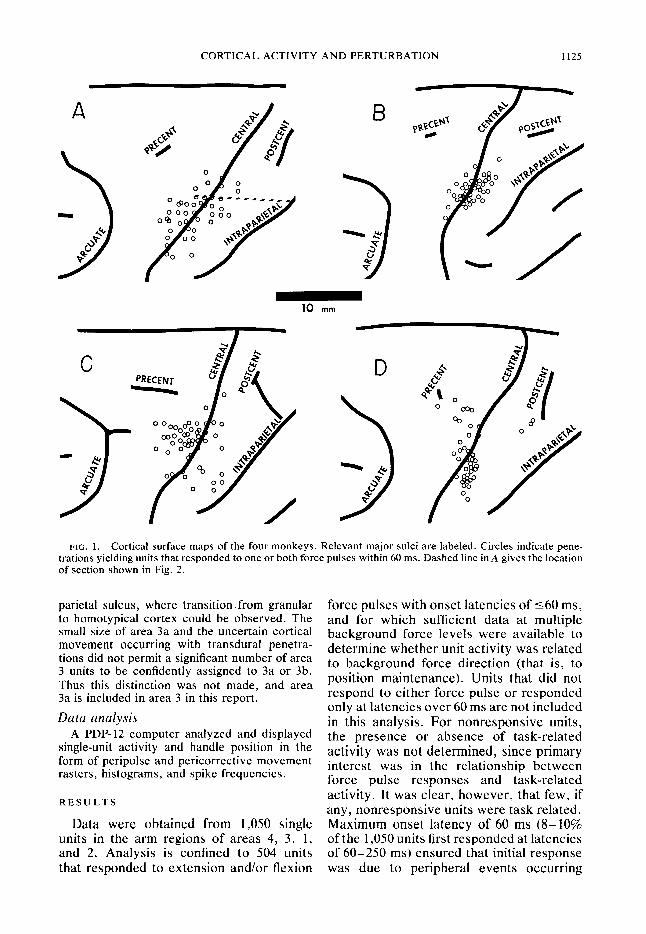
FIG. 1. Cortical surface maps of the four monkeys. Relevant major sulci are labeled. Circles indicate pene- trations yielding units that responded to one or both force pulses within 60 ms. Dashed line in A gives the location
of section shown in Fig. 2.
parietal sulcus, where transition from granular to homotypical cortex could be observed. The small size of area 3a and the uncertain cortical movement occurring with transdural penetra- tions did not permit a significant number of area 3 units to be confidently assigned to 3a or 3b. Thus this distinction was not made, and area 3a is included in area 3 in this report.
Data analysis A PDP-12 computer analyzed and displayed
single-unit activity and handle position in the form of peripulse and pericorrective movement rasters, histograms, and spike frequencies.
RESULTS
Data were obtained from 1,050 single units in the arm regions of areas 4, 3, 1, and 2. Analysis is confined to 504 units that responded to extension and/or flexion
force pulses with onset latencies of ~60 ms, and for which sufficient data at multiple background force levels were available to determine whether unit activity was related to background force direction (that is, to position maintenance). Units that did not respond to either force pulse or responded only at latencies over 60 ms are not included in this analysis. For nonresponsive units, the presence or absence of task-related activity was not determined, since primary interest was in the relationship between force pulse responses and task-related activity. It was clear, however, that few, if any, nonresponsive units were task related. Maximum onset latency of 60 ms (8-10% of the 1,050 units first responded at latencies of 60-250 ms) ensured that initial response was due to peripheral events occurring
1126 J. R. WOLPAW
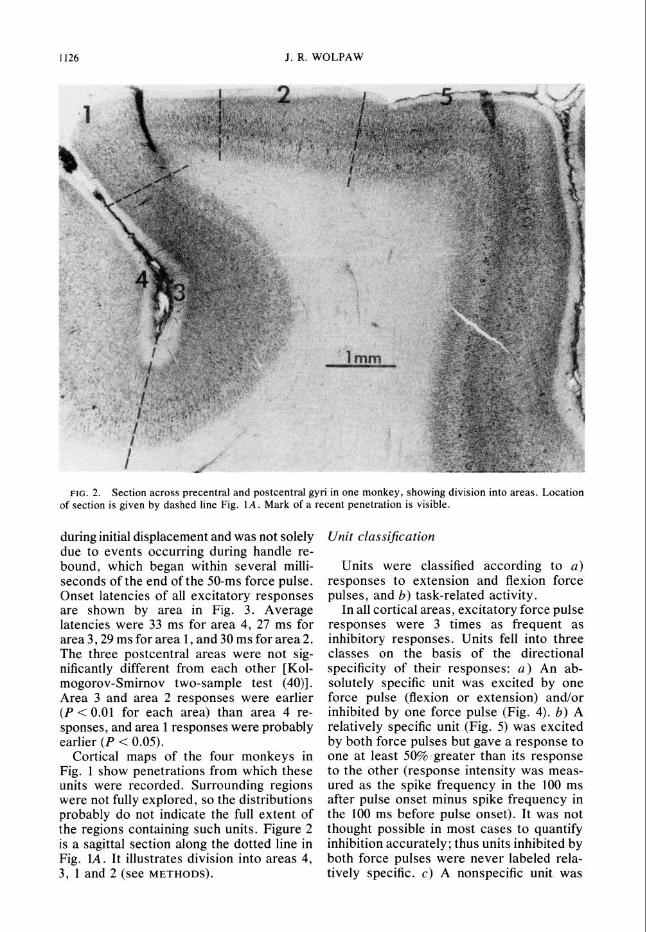
FIG. 2. Section across precentral and postcentral gyri in one monkey, showing division into areas, Location of section is given by dashed line Fig. 1A. Mark of a recent penetration is visible.
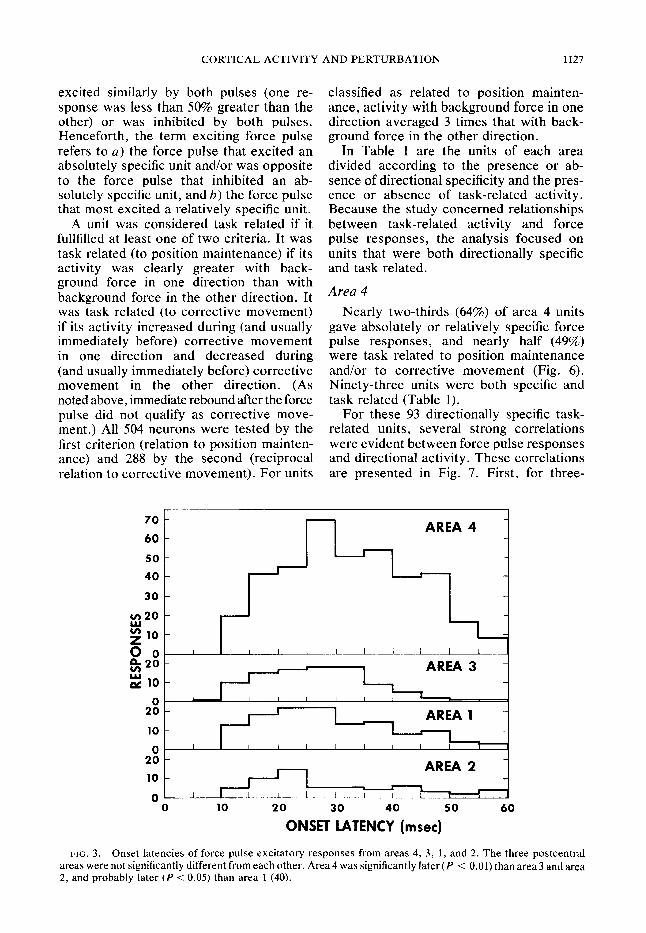
during initial displacement and was not solely due to events occurring during handle re- bound, which began within several milli- seconds of the end of the 50-ms force pulse. Onset latencies of all excitatory responses are shown by area in Fig. 3. Average latencies were 33 ms for area 4, 27 ms for area 3,29 ms for area 1, and 30 ms for area 2. The three postcentral areas were not sig- nificantly different from each other [Kol- mogorov-Smirnov two-sample test (40)]. Area 3 and area 2 responses were earlier (P < 0.01 for each area) than area 4 re- sponses, and area 1 responses were probably earlier (P < 0.05).
Cortical maps of the four monkeys in Fig. 1 show penetrations from which these units were recorded. Surrounding regions were not fully explored, so the distributions probably do not indicate the full extent of the regions containing such units. Figure 2 is a sagittal section along the dotted line in Fig. IA. It illustrates division into areas 4, 3, 1 and 2 (see METHODS).
Unit classification
Units were classified according to a) responses to extension and flexion force pulses, and b) task-related activity.
In all cortical areas, excitatory force pulse responses were 3 times as frequent as inhibitory responses. Units fell into three classes on the basis of the directional specificity of their responses: a) An ab- solutely specific unit was excited by one force pulse (flexion or extension) and/or inhibited by one force pulse (Fig. 4). 6) A relatively specific unit (Fig. 5) was excited by both force pulses but gave a response to one at least 50%.greater than its response to the other (response intensity was meas- ured as the spike frequency in the 100 ms after pulse onset minus spike frequency in the 100 ms before pulse onset). It was not thought possible in most cases to quantify inhibition accurately; thus units inhibited by both force pulses were never labeled rela- tively specific. c) A nonspecific unit was
CORTICAL ACTIVITY AND PERTURBATION 1127
excited similarly by both pulses (one re- sponse was less than 50% greater than the other) or was inhibited by both pulses. Henceforth, the term exciting force pulse refers to a) the force pulse that excited an absolutely specific unit and/or was opposite to the force pulse that inhibited an ab- solutely specific unit, and b) the force pulse that most excited a relatively specific unit.
A unit was considered task related if it fullfilled at least one of two criteria. It was task related (to position maintenance) if its activity was clearly greater with back- ground force in one direction than with background force in the other direction. It was task related (to corrective movement) if its activity increased during (and usually immediately before) corrective movement in one direction and decreased during (and usually immediately before) corrective movement in the other direction. (As noted above, immediate rebound after the force pulse did not qualify as corrective move- ment.) All 504 neurons were tested by the first criterion (relation to position mainten- ance) and 288 by the second (reciprocal relation to corrective movement). For units
classified as related to position mainten- ance, activity with background force in one direction averaged 3 times that with back- ground force in the other direction.
In Table 1 are the units of each area divided according to the presence or ab- sence of directional specificity and the pres- ence or absence of task-related activity. Because the study concerned relationships between task-related activity and force pulse responses, the analysis focused on units that were both directionally specific and task related.
Area 4
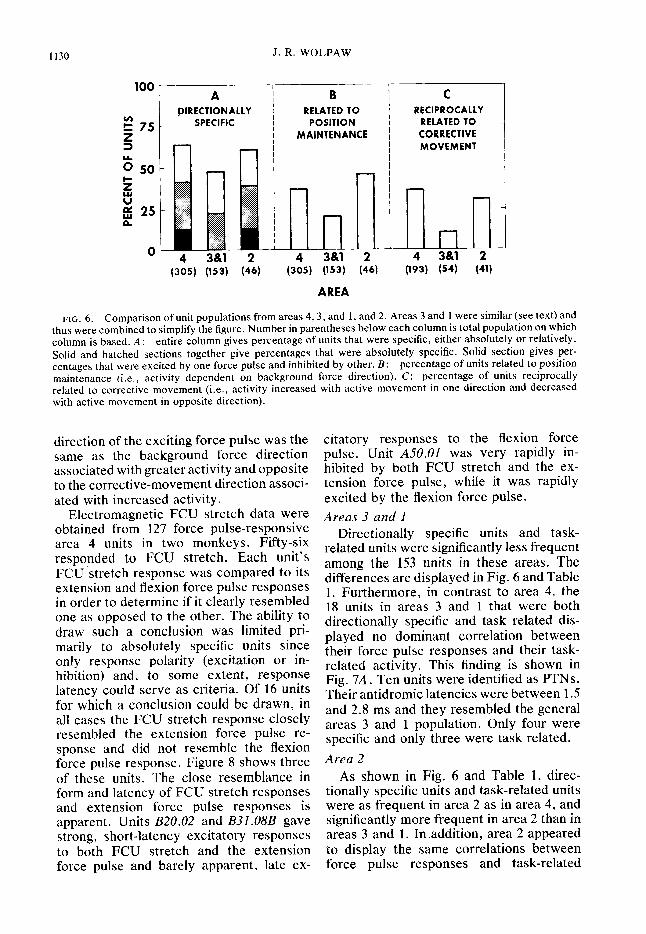
Nearly two-thirds (64%) of area 4 units gave absolutely or relatively specific force pulse responses, and nearly half (49%) were task related to position maintenance and/or to corrective movement (Fig. 6). Ninety-three units were both specific and task related (Table 1).
For these 93 directionally specific task- related units) several strong correlations were evident between force pulse responses and directional activity. These correlations are presented in Fig. 7. First, for three-
FIG. 3. Onset latencies of force pulse excitatory responses from areas 4, 3, 1, and 2. The three postcentral areas were not significantly different from each other. Area 4 was significantly later (P < 0.01) than area 3 and area 2, and probably later (P < 0.05) than area 1 (40).
70 AREA 4
60
50
40 1
30 -
-20 - \
ix z lo 4
00 I I I I I I I I I I
z20 - AREA 3 z 10 - I
1 0 A \ I I I I I !
20
10
n
2ij - , AREA 2
10 - c I
Ob I I I 1
0 10 20 30 40 50 60
ONSET LATENCY (msec)

1128 J. R. WOLPAW
FLEXION FORCE PULSE
~~~~,~li
0.5 set
FLEXION MOVEMENT EXTENSION MOVEMENT
*,,r- n 1100 Spks
set
1 .O set (UNIT W6.02)
FIG. 4. A: responses of an area 4 unit to extension and flexion force pulses at all five background force levels. Each raster displays individual responses, while corresponding histogram shows average of individual responses in spikes per second. Force pulse onset is indicated by vertical line in middle of raster, and its duration is shown by barjust above histogram. Full sweep time, 500 ms; bin width, 5 ms. Trace above histogram is averaged handle position. Downward deflection indicates wrist extension; upward indicates wrist flexion. Background force levels from left to right are: strong extension, weak extension, zero, weak flexion, and strong flexion. Unit was absolutely specific. It was excited by flexion force pulse and inhibited by extension force pulse. Activity was greater with flexion background force. B: activity of same unit with corrective movement. In this display, vertical line in center of raster indicates entry into reward zone. (As noted, entry into reward zone occurring within 100 ms following onset of a force pulse was not considered corrective movement and is not included in data shown here.) Trace is averaged handle position. Full sweep time, 1 s; bin width, 20 ms. Flexion background force was present. Unit activity increased just before and during extension and decreased just before and during flexion. Thus, exciting force pulse was in same direction as background force associated with greater background activity and opposite in direction to corrective movement associated with increased activity.
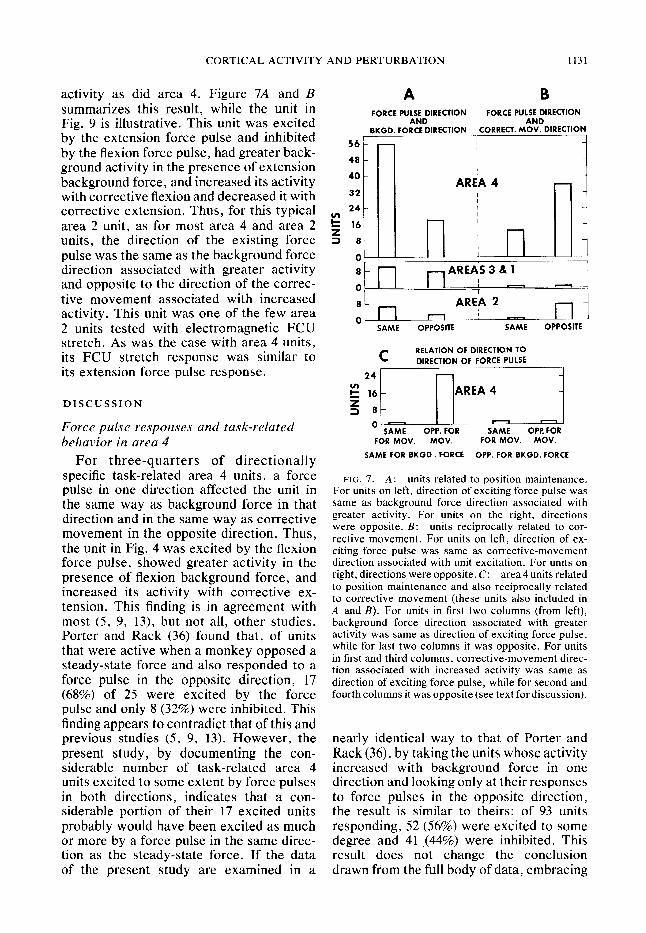
quarters of units related to position main- tenance, the direction of the exciting force pulse was the same as the background force direction associated with greater activity (P < 0.001) (Fig. 7A). The unit in Fig. 4 is illustrative. It was excited by the flexion force pulse and inhibited by the extension force pulse and was more active in the presence of flexion background force. In terms of muscle groups involved, the group stretched by the exciting force pulse (the extensors) was the same group active during the background force direction associated with greater unit activity. Second, for three- quarters of units reciprocally related to cor- rective movement, the direction of the cor- rective movement associated with increased
unit activity was opposite to the direction of the exciting force pulse (Fig. 7B) (P < 0.001). The unit in Fig. 4 is again illustrative. Its activity increased with corrective exten- sion, and it was excited by the flexion force pulse. In terms of the muscle groups in- volved, the group active with corrective movement in the direction associated with increased unit activity (the extensors) was the same group stretched by the exciting force pulse. Third, these correlations were especially marked for the 30 units related to both position maintenance and corrective movement, such as the unit in Fig. 4. For all but five, the direction of the exciting force pulse was the same as the background force direction associated with greater activity
CORTICAL ACTIVITY AND PERTURBATION 1129
EXTENSION FORCE PULSE
FLEXION FORCE PULSE
0.5 see (UNIT A7.01)
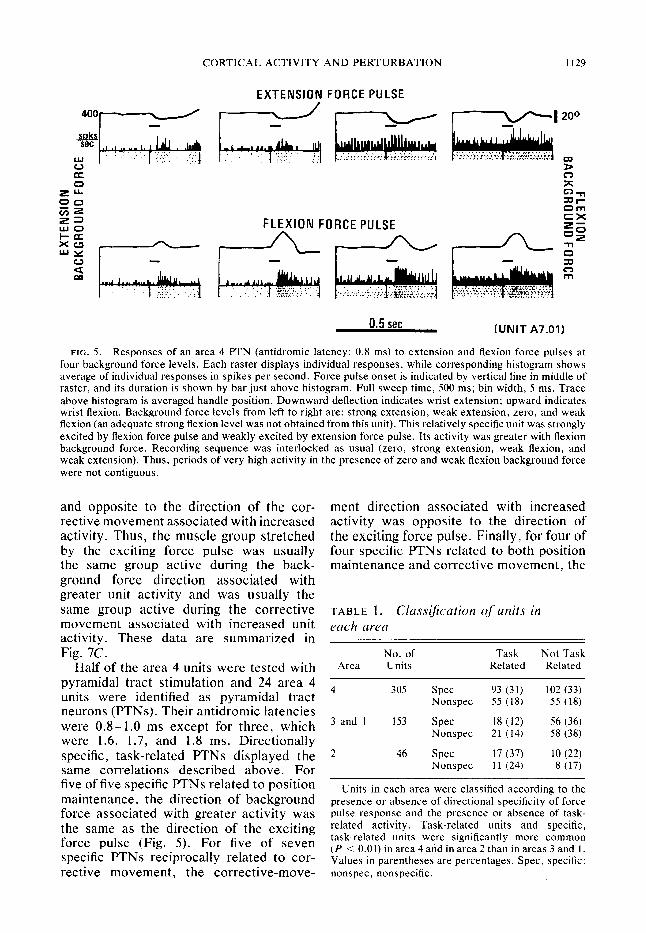
FIG. 5. Responses of an area 4 PTN (antidromic latency: 0.8 ms) to extension and flexion force pulses at four background force levels. Each raster displays individual responses, while corresponding histogram shows average of individual responses in spikes per second. Force pulse onset is indicated by vertical line in middle of raster, and its duration is shown by bar just above histogram. Full sweep time, 500 ms; bin width, 5 ms. Trace above histogram is averaged handle position. Downward deflection indicates wrist extension; upward indicates wrist flexion. Background force levels from left to right are: strong extension, weak extension, zero, and weak flexion (an adequate strong flexion level was not obtained from this unit). This relatively specific unit was strongly excited by flexion force pulse and weakly excited by extension force pulse. Its activity was greater with flexion background force. Recording sequence was interlocked as usual (zero, strong extension, weak flexion, and weak extension). Thus, periods of very high activity in the presence of zero and weak flexion background force were not contiguous.
and opposite to the direction of the cor- rective movement associated with increased activity. Thus, the muscle group stretched by the exciting force pulse was usually the same group active during the back- ground force direction associated with greater unit activity and was usually the same group active during the corrective movement associated with increased unit activity. These data are summarized in Fig. 7C.
Half of the area 4 units were tested with pyramidal tract stimulation and 24 area 4 units were identified as pyramidal tract neurons (PTNs). Their antidromic latencies were 0.8- 1.0 ms except for three, which were 1.6, 1.7, and 1.8 ms. Directionally specific, task-related PTNs displayed the same correlations described above. For five of five specific PTNs related to position maintenance, the direction of background force associated with greater activity was the same as the direction of the exciting force pulse (Fig. 5). For five of seven specific PTNs reciprocally related to cor- rective movement, the corrective-move-
ment direction associated with increased activity was opposite to the direction of the exciting force pulse. Finally T for four of four specific PTNs related to both position maintenance and corrective movement, the
TABLE 1. Classijkation of units in
each area
Area No. of Task Not Task
Units Related Related
4 305 Spec 93 (31) 102 (33) Nonspec 55 (18) 55 (18)
3 and 1 153 Spec 18 (12) 56 (36) Nonspec 21 (14) 58 (38)
2 46 Spec 17 (37) 10 (22)
Nonspec 11 (24) 8 (17)
Units in each area were classified according to the presence or absence of directional specificity of force pulse response and the presence or absence of task- related activity. Task-related units and specific, task-related units were significantly more common (P < 0.01) in area 4 and in area 2 than in areas 3 and 1. Values in parentheses are percentages. Spec, specific;
nonspec, nonspecific.
1130 J. R. WOLPAW
100 A i
I
~IRECflONALLY 1
SPECIFIC I I
4 3&l 2 3&l 2 4 3&l 2 (305) (153) (46) (305) (153) (46) (193) (54) (41)
B RELATED TO
POSITION
MAINTENANCE
r
C RECIPROCALLY
RELATED TO
CORRECTIVE
MOVEMENT
:
1
AREA
FIG. 6. Comparison of unit populations from areas 4, 3, and 1, and 2. Areas 3 and 1 were similar (see text) and thus were combined to simplify the figure. Number in parentheses below each column is total population on which column is based. A: entire column gives percentage of units that were specific, either absolutely or relatively. Solid and hatched sections together give percentages that were absolutely specific. Solid section gives per- centages that were excited by one force pulse and inhibited by other. B: percentage of units related to position maintenance (i.e., activity dependent on background force direction). C: percentage of units reciprocally related to corrective movement (i.e., activity increased with active movement in one direction and decreased with active movement in opposite direction).
direction of the exciting force pulse was the same as the background force direction associated with greater activity and opposite to the corrective-movement direction associ- ated with increased activity.
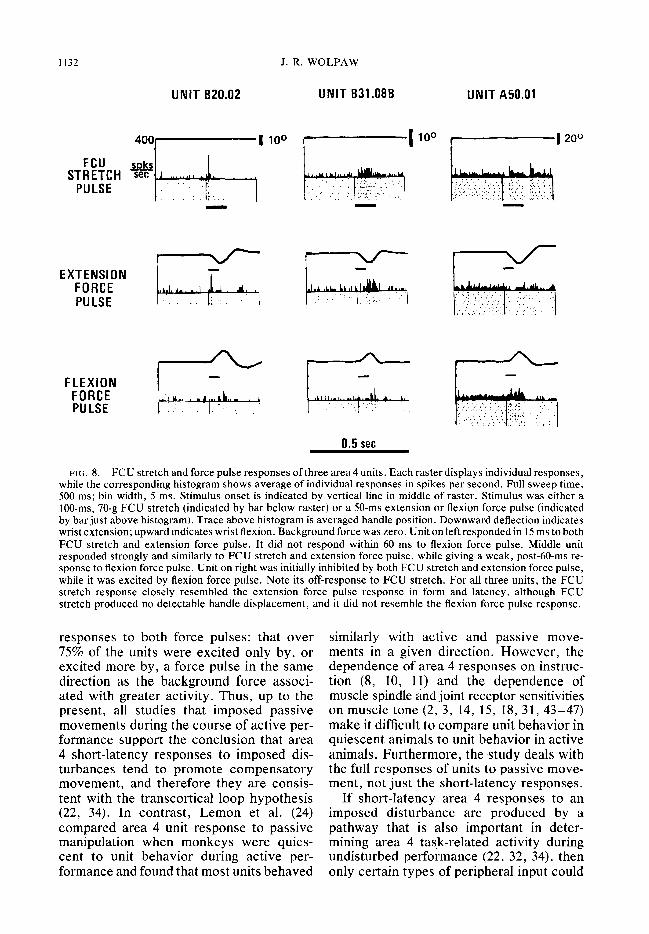
Electromagnetic FCU stretch data were obtained from 127 force pulse-responsive area 4 units in two monkeys. Fifty-six responded to FCU stretch. Each unit’s FCU stretch response was compared to its extension and flexion force pulse responses in order to determine if it clearly resembled one as opposed to the other. The ability to draw such a conclusion was limited pri- marily to absolutely specific units since only response polarity (excitation or in- hibition) and, to some extent, response latency could serve as criteria. Of 16 units for which a conclusion could be drawn, in all cases the FCU stretch response closely resembled the extension force pulse re- sponse and did not resemble the flexion force pulse response. Figure 8 shows three of these units. The close resemblance in form and latency of FCU stretch responses and extension force pulse responses is apparent. Units B20.02 and B32.08B gave strong, short-latency excitatory responses to both FCU stretch and the extension force pulse and barely apparent, late ex-
citatory responses to the flexion force pulse. Unit A50.01 was very rapidly in- hibited by both FCU stretch and the ex- tension force pulse, while it was rapidly excited by the flexion force pulse.
Areas 3 and 1
Directionally specific units and task- related units were significantly less frequent among the 153 units in these areas. The differences are displayed in Fig. 6 and Table 1. Furthermore, in contrast to area 4, the 18 units in areas 3 and 1 that were both directionally specific and task related dis- played no dominant correlation between their force pulse responses and their task- related activity. This finding is shown in Fig. 7A. Ten units were identified as PTNs. Their antidromic latencies were between 1.5 and 2.8 ms and they resembled the general areas 3 and 1 population. Only four were specific and only three were task related.
Area 2 As shown in Fig. 6 and Table 1, direc-
tionally specific units and task-related units were as frequent in area 2 as in area 4, and significantly more frequent in area 2 than in areas 3 and 1. In #addition, area 2 appeared to display the same correlations between force pulse responses and task-related
CORTICAL ACTIVITY AND PERTURBATION
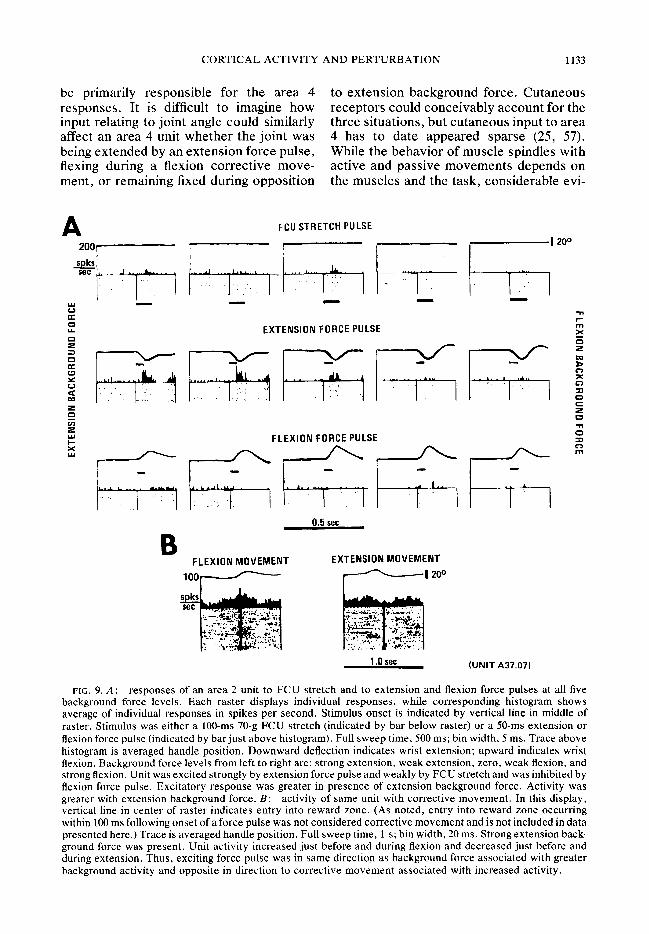
activity as did area 4. Figure 7A and B summarizes this result, while the unit in Fig. 9 is illustrative. This unit was excited by the extension force pulse and inhibited
A B FORCE PULSE DIRECTION FORCE PULSE DIRECTION
AND AND BKGD. FORCE DIRECTION CORRECT. MOV. DIRECTION
GAL I I
by the flexion force pulse, had greater back- ground activity in the presence of extension
;i
background force, and increased its activity 4o with corrective flexion and decreased it with 32
corrective extension. Thus, for this typical v) 24 area 2 unit, as for most area 4 and area 2 5 16
units, the direction of the existing force 2 8 pulse was the same as the background force I 1 _ _ O-
-
direction associated with greater activity and opposite to the direction of the correc- tive movement associated with increased activity. This unit was one of the few area 2 units tested with electromagnetic FCU stretch. As was the case with area 4 units, its FCU stretch response was similar to its extension force pulse response.
8-‘ AREA’S 3 & 1 I O- - 1 I
8- AREA 2 - I I 0 I . 1 I
SAME OPPOSITE SAME OPPOSITE
DISCUSSION
Force pu behavior
lse respon area 4
ses and task-related
For three-quarters of directionally specific task-related area 4 units, a force pulse in one direction affected the unit in the same way as background force in that direction and in the same way as corrective movement in the opposite direction. Thus, the unit in Fig. 4 was excited by the flexion force pulse, showed greater activity in the presence of flexion background force, and increased its activity with corrective ex- tension. This finding is in agreement with most (5, 9, 13), but not all, other studies. Porter and Rack (36) found that, of units that were active when a monkey opposed a steady-state force and also responded to a force pulse in the opposite direction, 17 (68%) of 25 were excited by the force pulse and only 8 (32%) were inhibited. This finding appears to contradict that of this and previous studies (5, 9, 13). However, the present study, by documenting the con- siderable number of task-related area 4 units excited to some extent by force pulses in both directions, indicates that a con- siderable portion of their 17 excited units probably would have been excited as much or more by a force pulse in the same direc- tion as the steady-state force. If the data of the present study are examined in a
RELATION OF DIRECTION TO DIRECTION OF FORCE PULSE
I 1
SAME OPP. FOR SAME OPR FOR FOR MOV.
SAME FOR BKGD . FORCE OPP. FOR BKGD. FORCE
FOR MOV.
FIG. 7. A: units related to position maintenance. For units on left, direction of exciting force pulse was same as background force direction associated with greater activity. For units on the right, directions were opposite. B: units reciprocally related to cor- rective movement. For units on left, direction of ex- citing force pulse was same as corrective-movement direction associated with unit excitation. For units on right, directions were opposite. C: area 4 units related to position maintenance and also reciprocally related to corrective movement (these units also included in A and B). For units in first two columns (from left), background force direction associated with greater activity was same as direction of exciting force pulse, while for last two columns it was opposite. For units in first and third columns, corrective-movement direc- tion associated with increased activity was same as direction of exciting force pulse, while for second and fourth columns it was opposite (see text for discussion).
nearly identical way to that of Porter and Rack (36), by taking the units whose activity increased with background force in one direction and looking only at their responses to force pulses in the opposite direction, the result is similar to theirs: of 93 units responding, 52 (56%) were excited to some degree and 41 I (44%) were inhibited. This result does not change the conclusion drawn from the full body of data, embracing
1132 J. R. WOLPAW
UNIT B20.02 UNIT B31.08B UNlTA50.01
EXTENSION FORCE PULSE
FLEXION FORCE PULSE
0.5 set
FIG. 8. FCU stretch and force pulse responses of three area 4 units. Each raster displays individual responses, while the corresponding histogram shows average of individual responses in spikes per second. Full sweep time, 500 ms; bin width, 5 ms. Stimulus onset is indicated by vertical line in middle of raster. Stimulus was either a lo@ms, 70-g FCU stretch (indicated by bar below raster) or a 50-ms extension or flexion force pulse (indicated by bar just above histogram). Trace above histogram is averaged handle position. Downward deflection indicates wrist extension; upward indicates wrist flexion. Background force was zero. Unit on left responded in 15 ms to both FCU stretch and extension force pulse. It did not respond within 60 ms to flexion force pulse. Middle unit responded strongly and similarly to FCU stretch and extension force pulse, while giving a weak, post-60-ms re- sponse to flexion force pulse. Unit on right was initially inhibited by both FCU stretch and extension force pulse, while it was excited by flexion force pulse. Note its off-response to FCU stretch. For all three units, the FCU stretch response closely resembled the extension force pulse response in form and latency, although FCU stretch produced no detectable handle displacement, and it did not resemble the flexion force pulse response.
responses to both force pulses: that over 75% of the units were excited only by, or excited more by, a force pulse in the same direction as the background force associ- ated with greater activity. Thus, up to the present, all studies that imposed passive movements during the course of active per- formance support the conclusion that area 4 short-latency responses to imposed dis- turbances tend to promote compensatory movement, and therefore they are consis- tent with the transcortical loop hypothesis (22, 34). In contrast, Lemon et al. (24) compared area 4 unit response to passive manipulation when monkeys were quies- cent to unit behavior during active per- formance and found that most units behaved
similarly with active and passive move- ments in a given direction. However, the dependence of area 4 responses on instruc- tion (8, 10, 11) and the dependence of muscle spindle and joint receptor sensitivities on muscle tone (2, 3, 14, 15, 18, 31, 43-47) make it difficult to compare unit behavior in quiescent animals to unit behavior in active animals. Furthermore, the study deals with the full responses of units to passive move- ment, not just the short-latency responses.
If short-latency area 4 responses to an imposed disturbance are produced by a pathway that is also important in deter- mining area 4 task-related activity during undisturbed performance (22, 32, 34), then only certain types of peripheral input could
CORTICAL ACTIVITY AND PERTURBATION 1133
be primarily responsible for the area 4 to extension background force. Cutaneous responses. It is difficult to imagine how receptors could conceivably account for the input relating to joint angle could similarly three situations, but cutaneous input to area affect an area 4 unit whether the joint was 4 has to date appeared sparse (25, 57). being extended by an extension force pulse, While the behavior of muscle spindles with flexing during a flexion corrective move- active and passive movements depends on ment, or remaining fixed during opposition the muscles and the task, considerable evi-
A 2007 i
FCU STRETCH PULSE
I I- r-’ *O”
EXTENSION FORCE PULSE
FLEXION FORCE PULSE
0.5 set
B FLEXION MOVEMENT EXTENSION MOVEMENT
spks set
1.0 set (UNIT A37.07)
FIG. 9.A: responses of an area 2 unit to FCU stretch and to extension and flexion force pulses at all five background force levels. Each raster displays individual responses, while corresponding histogram shows average of individual responses in spikes per second. Stimulus onset is indicated by vertical line in middle of raster. Stimulus was either a lOO-ms 70-g FCU stretch (indicated by bar below raster) or a 50-ms extension or flexion force pulse (indicated by bar just above histogram). Full sweep time, 500 ms; bin width, 5 ms. Trace above histogram is averaged handle position. Downward deflection indicates wrist extension; upward indicates wrist flexion. Background force levels from left to right are: strong extension, weak extension, zero, weak flexion, and strong flexion. Unit was excited strongly by extension force pulse and weakly by FCU stretch and was inhibited by flexion force pulse. Excitatory response was greater in presence of extension background force. Activity was greater with extension background force. B: activity of same unit with corrective movement. In this display, vertical line in center of raster indicates entry into reward zone. (As noted, entry into reward zone occurring within 100 ms following onset of a force pulse was not considered corrective movement and is not included in data presented here.) Trace is averaged handle position. Full sweep time, 1 s; bin width, 20 ms. Strong extension back- ground force was present. Unit activity increased just before and during flexion and decreased just before and during extension. Thus, exciting force pulse was in same direction as background force associated with greater background activity and opposite in direction to corrective movement associated with increased activity.
1134 J. R. WOLPAW
dence (2, 3, 18, 31, 43-47) indicates that, in a context similar to that of this study, these receptors are capable of accounting for the predominant area 4 correlation be- tween force pulse responses, position main- tenance behavior, and corrective movement behavior. Other receptors sensitive to muscle stretch and/or muscle tension, Golgi tendon organs (47), and some joint capsule receptors (14, 15), should also be capable of accounting for this correlation. Recent work (16, 27, 51) has demonstrated considerable input to area 4 from muscle stretch re- ceptors. The close similarity in the present study between area 4 unit response to wrist extension and to stretch of a single flexor muscle in the absence of wrist extension indicates the importance of the muscle stretch component in determining area 4 unit responses. Stretch of one (of five) wrist flexors provided a large proportion of area 4 neurons with information comparable to that provided by actual wrist extension. Tissues outside the FCU were jostled by its electromagnetically induced movement, and thus receptors outside the FCU were presumably stimulated. However, extra- FCU deep or superficial stimulation re- sulting from FCU stretch would probably not have closely resembled extension force pulse stimulation or not have resembled it more closely than it resembled flexion force pulse stimulation. Therefore, it probably could not account for the similarity of area 4 FCU stretch responses to extension, not flexion, force pulse responses (Fig. 8). The importance of muscle stretch in producing area 4 responses to force pulses suggests at least a partial explanation for the large number of directionally nonspecific and relatively specific units. Several studies have noted the moderate prominence in motor cortex of units giving the same re- sponse to both the onset and the offset of muscle stretch (16, 53). It may be that when a unit more active in the presence of ex- tension background force was excited by a flexion force pulse, it was in fact giving an off-response to the transient decrease of extension force. This consideration and the presumed presence in area 4 of neurons concerned with regulation of intrafusal muscle fibers (9) may account for the
minority of task-related units that did not show the dominant correlation between force pulse responses and task-related activity.
The results support the hypothesis of an oligosynaptic transcortical loop (22, 34), beginning in large part with muscle stretch receptors. This loop appears to be important not only in determining area 4 responses to passive movements, but in determining area 4 task-related activity as well. If this is cor- rect, then the animals did not accomplish position maintenance and corrective move- ment only by delivering excitation directly to area 4 from as yet undefined loci else- where in the brain. Rather, they performed these tasks, at least in part, by controlling the extent to which ongoing activity in the afferent, prearea 4, limb of this loop was allowed to reach the efferent limb, specific area 4 neurons, and thereby produce the pattern of area 4 activity responsible for task performance. Thus, according to this view, the activity produced in area 4 by an oligosynaptic transcortical pathway, probably originating largely with muscle stretch receptors, is capable of being used as a motor output for task performance. A companion study (55) provides further evi- dence for the importance of this mechanism in motor control by demonstrating appropri- ate correlations between force pulse re- sponse amplitude and background force direction.
A considerable number of area 4 force pulse-responsive units were not task related (Table l), and a considerable number of task-related area 4 units did not display the predominant correlation between force pulse responses and task-related activity (Fig. 7). The first finding suggests that the short-latency input from a relatively focal limb perturbation has a wide distribution in area 4, probably reaching areas concerned with control of many different muscle groups. The second finding suggests that the activity produced in area 4 by this pathway does not bear a single, simple relationship to a limb perturbation. For example, there is some activity produced that might tend to increase rather than reduce the deflection caused by a perturbation. These possible implications are particularly interesting in
CORTICAL ACTIVITY AND PERTURBATION 1135
the light of recent studies by Marsden et al. (29, 30). Recording in man, they found that a) perturbation of one limb can produce a very-short-latency, possibly transcortical, EMG response in specific muscles of an- other limb, if such a response is conducive to better task performance (29); and b) a perturbation stretching one muscle group can produce a very-short-latency, possibly transcortical, EMG response in the short- ened antagonist muscle group, if such a response is conducive to better task per- formance (30). These observations, to- gether with those of the present study, sug- gest that a given focal input via an oligo- synaptic transcortical pathway can produce any of a wide variety of motor outputs, involving any of a number of limbs. Which, if any, output actually occurs in a situation depends on the demands of the task at hand. Presumably, in most situations a given input is permitted to produce significant motor activity at only a very small fraction of its area 4 destinations. At the rest it produces no activity or, if it is momentarily strong enough, it produces a transient response like those elicited from non-task-related units by the force pulses in the present study.
Force pu behavior
lse in
responses and ta postcentral gyms
Sk-related
Task-related units (as well as directionally specific units) were more common in area 2 than in areas 3 and 1. The use of four monkeys and the distribution of penetra- tions make it difficult to ascribe this dif- ference to sampling bias. The few task- related units in areas 3 and 1 displayed no clear correlation between force responses and task-related activity. Task-related area 2 units appeared to display the same cor- relation between force pulse responses and task-related activity found in area 4. Most, like the unit in Fig. 9, were affected in the same way by a force pulse in one direction, background force in the same direction, and corrective movement in the opposite direc- tion. As noted above, such behavior re- sembles the probable concurrent behavior of muscle stretch receptors and does not resemble the behavior of receptors monitor- ing joint angle. Furthermore, while areas 3 and 1 respond mainly to superficial cutane-
ous input, area 2 responds mainly to input from deep receptors (21, 38, 49), including muscle stretch receptors (1, 39). Thus, the present findings suggest that in area 2, as well as in area 4, task-related activity and force pulse responses are in significant part a result of muscle stretch receptor input. The similarity of areas 4 and 2 emphasizes the need for further investigation of motor function in primary somatosensory cortex.
It is unlikely that the apparent correlation in area 2 between force pulse responses and position-maintenance activity could be ascribed to receptors responding to joint angle and the leeway of the reward zone. First, joint-angle sensitivity is significant only in the presence of muscle tension (14, IS), and thus force pulse responses should have been extremely dependent on the pres- ence and direction of background force, which they were not. Second, input relating to joint angle alone could not account for the area 2 correlation between force pulse re- sponses and corrective-movement activity.
It is also unlikely that a significant number of area 2 task-related units were in fact area 5 units. The correlation reported here be- tween force pulse responses and active- movement behavior in area 2 is opposite to the correlation found in area 5 by MacKay et al. (28).
Area 2 and area 4
The course of the pathway responsible for area 4 short-latency responses to per- turbation is not clear. It could ascend from the thalamus directly to area 4 (17, 23) or it could first pass through areas 3, 1, and 2, and/or area 5 (19, 42, 48, 50, 59). The latency data in Fig. 2 show that all three primary somatosensory areas re- spond early enough to mediate the area 4 responses. However, both areas 3 and 1 dis- played less directional specificity and task- related activity than area 4. Furthermore, the fact that electromagnetic muscle stretch responses are earlier in area 4 than area 1 (53), and that they appear to contain in- formation comparable to the force pulse responses, makes area 1 mediation less likely. In contrast, area 2, in its force pulse responses, in its task-related activ ity, and in the relation b letween the two , was similar to
1136 J. R. WOLPAW
area 4 except that its response latencies were presumably obscured. For this reason, averaged several milliseconds less. These the study cannot address the question of the similarities, coupled with the indication that role of direct area 3a output to area 4, or of force pulse responses and task-related 3a output to area 4 via area 2. activity in both areas were largely a result of muscle stretch receptor input, are com- ACKNOWLEDGMENTS
patible with the possibility that the pathway I thank Dr. Edward V. Evarts, Mr. Alvin C. to area 4 traverses area 2 as well as with the Ziminsky, Mr. Samuel G. Sudler, and Mr. William possibility that there are two parallel path- T. Burriss for invaluable advice and assistance, and
ways, one slightly faster than the other. Drs. Steven P. Wise and Michael E. Goldberg for
The most anterior part of primary so- reviewing the manuscript.
matosensory cortex, area 3a, receives input from muscle stretch receptors (16, 35). Address requests for reprints to J. R. Wolpaw at
Whether this area projects to area 4 in the his present address: Division of Laboratories and Re-
primate is not Clear (19, 59). In the present search, NY State Dept. of Health, Empire State Plaza, Albany, NY 12201.
study, units from area 3a and the larger area 3b were of necessity combined. Thus any special characteristics of area 3a responses
Received 20 July 1979; accepted in final form 4 August 1980.
REFERENCES
1.
2.
3.
4.
5.
6
7.
8.
9.
10.
BURCHFIEL, J. L. AND DUFFY, F. H. Muscle 11. afferent input to single cells in primate somato- sensory cortex. Brain Res. 45: 241-246, 1972. BURKE, D., HAGBARTH, K.-E., AND LOFSTEDT, L. 12. Muscle spindle responses in man to changes in load during accurate position maintenance. J. 13, Physiol. London 276: 159-165, 1978. BURKE, D., HAGBARTH, K.-E., AND LOFSTEDT, L. Muscle spindle activity in man during lengthening and shortening contractions. J. Physiol. London 277: 131-142, 1978. 14. COLBURN, T. R., WOLPAW, J. R., VAUGHN, W., AND CHRISTENSEN, J. L. An electromagnetic method for in situ stretch of individual muscles. Med. Biol. Eng. Comput. 18: 145-152, 1980. CONRAD, B., MATSUNAMI, K., MEYER-L• HMANN,
15.
J., WIESENDANGER, M., AND BROOKS, V. B. Cortical load compensation during voluntary elbow movements. Brain Res. 71: 507-514, 1974.
COULTER, J. D., ERVING, L., AND CARTER, C. 16
Origin of primary sensorimotor cortical projections to lumbar spinal cord of cat and monkey. Brain Res. 103: 366-372, 1976. EVARTS, E. V. Methods for recording activity of individual neurons in moving animals. In: Methods 17.
in Medical Research, edited by R. F. Rushmer. Chicago: Year Book, 1966, vol. II, p. 241-250. EVARTS, E. V. Motor cortex reflexes associated with learned movement. Science 179: 501-503, 1** 1973.
EVARTS, E. V. AND FROMM, C. The PTN as summing point in a closed-loop control system in the monkey. In: Progress in Clinical Neuro- 19. physiology. Vol. 4. Cerebral Motor Control in Man: Long Loop Mechanisms, edited by J. E. Desmedt. Basel: Karger, 1978, p. 56-69. EVARTS, E. V. AND TANJI, J. Gating of motor cortex reflexes by prior instruction. Brain Res. 20.
EVARTS, E. V. AND TANJI, J. Reflex and intended responses in motor cortex pyramidal tract neurons of monkey. J. Neurophysiol. 39: 1069- 1080, 1976. FERRIER, D. Experiments on the brain of monkeys. Proc. R. Sot. London Ser. B 23: 409-430, 1875.
FETZ, E. E., CHENEY, P. D., AND GERMAN, D. C. Corticomotoneuronal connections of precentral cells detected by post-spike average of EMG activity in behaving monkeys. Brain Res. 114: 505-510, 1976. GRIGG, P. Response of joint afferent neurons in cat medial articular nerve to active and passive movements of the knee. Brain Res. 118: 482- 485, 1976.
GRIGG, P. AND GREENSPAN, B. J. The response of primate joint afferent neurons to mechanical stimulation of the knee joint. J. Neurophysiol. 40: 1-8, 1977. HORE, J., PRESTON, J. B., DURKOVIC, R. G., AND CHENEY, P. D. Responses of cortical neurons (areas 3a and 4) to ramp stretch of hindlimb muscles in the baboon. J. Neurophysiol. 39: 484-500, 1976.
HORNE, M. K. AND TRACEY, D. J. The afferents and projections of the ventroposterolateral thalamus in the monkey. Exp. Brain Res. 36: 129- 142, 1979.
HULLIGER, M. AND VALLBO, A. B. The response of muscle spindle afferents during voluntary tracking movements in man. Load dependent servo assistance? Brain Res. 166: 401-404, 1979.
JONES, E. G., COULTER, J. D., AND HENDRY,
S. H. C. Intracortical connectivity of architectonic fields in the somatic sensory, motor and parietal cortex of monkeys. J. Comp. Neurol. 181: 291-348, 1978.
JONES, E. G. AND WISE, S. P. Size, laminar and columnar distribution of efferent cells in the 71: 479-494, 1974.

CORTICAL ACTIVITY AND PERTURBATION 1137
sensory-motor cortex of monkeys. J. Comp. Neurol. 175: 391-438, 1977.
21. KAAS, J. H., NELSON, R. J., SUR, M., LIN, C.-S., AND MERZENICH, M. M. Multiple representations of the body within the primary somatosensory cortex of primates. Science 204: 521-523, 1979.
22. KOEZE, T. H., PHILLIPS, C. G., AND SHERIDAN,
J. D. Thresholds of cortical activation of muscle spindles and motoneurons of the baboon’s hand. J. Physiol. London 195: 419-449, 1968.
23. LEMON, R. N. Short-latency peripheral inputs to the motor cortex in conscious monkeys. Brain Res. 161: 150-155, 1979.
24. LEMON, R. N., HANBY, J. A., AND PORTER, R. Relationship between the activity of precentral neurons during active and passive movements in conscious monkeys. Proc. R. Sot. London Ser. B 194: 341-373, 1976.
25. LEMON, R. N. AND PORTER, R. Afferent input to movement-related precentral neurons in conscious monkeys. Proc. R. Sot. London Ser. B 194: 313-339, 1976.
26. LOEB, G. E., BAK, M. J., SALEMAN, M., AND
SCHMIDT, E. M. Parylene as a chronically stable, reproducible microelectrode insulation. IEEE Trans. Biomed. Eng. 24: 121-128, 1977.
27. LUCIER, G. E., RUEGG, D. C., AND WIESEN-
DANGER, M. Responses of neurons in the motor cortex and in area 3a to controlled stretch of forelimb muscles in cebus monkeys. J. Physiol. London 251: 833-853, 1975.
28. MACKAY, W. A., KWAN, M. C., MURPHY, J. T., AND WONG, Y. C. Responses to active and passive wrist rotation in area 5 of awake monkeys. Neurosci. Lett. 10: 235-239, 1978.
29. MARSDEN, C. D., MERTON, P. A., AND MORTON,
H. B. Anticipatory postural responses in the human subject. J. Physiol. London 275: 47-48P, 1978.
30. MARSDEN,~. D., ROTHWELL, J.C., ANDTRAUB,
M. Long latency stretch reflex of the human thumb can be reversed if the task is changed. J. Physiol. London 293: 41-42P, 1979.
31. MATTHEWS, P. B. C. Mammalian Muscle Re- ceptors and Their Central Actions. Baltimore: Williams & Wilkins, 1972, p. 522-525, 566-574.
32. MURPHY, J. T., KWAN, H. C., MACKAY, W. A., AND WONG, Y. C. Spatial organization of pre- central cortex in awake primates. III. Input- output coupling. J. Neurophysiol. 41: 1132- 1139, 1978.
33. MURRAY, E. A. AND COULTER, J. D. Cortico- spinal projections from the medial cerebral hemisphere in monkeys. Sot. Neurosci. Abstr. 3: 275, 1977.
34. PHILLIPS, C. G. Motor apparatus of the baboon’s hand. Proc. R. Sot. London Ser. B 173: 141- 174, 1969.
35. PHILLIPS, C. G., POWELL, T. P. S., AND
WIESENDANGER, M. Projection from low-threshold muscle afferents of hand and forearm to area 3a of baboon’s cortex. J. Physiol. London 217: 419-446, 1971.
36. PORTER, R. AND RACK, P. M. H. Timing of the response in the motor cortex of monkeys to an
unexpected disturbance of finger position. Brain Res. 103: 201-213, 1976.
37. POWELL, T. P. S. AND MOUNTCASTLE, V. B. The cytoarchitecture of the postcentral gyrus of the monkey Macaca mulatta. Bull. Johns Hopkins Hosp. 105: 108-133, 1959.
38. POWELL, T. P. S. AND MOUNTCASTLE, V. B. Some aspects of the functional organization of the cortex of the postcentral gyrus of the monkey: a correlation of findings obtained in a single unit analysis with cytoarchitecture. Bull. Johns Hopkins Hosp. 105: 133-162, 1959.
39. SCHWARTZ, D. W. F., DEECKE, L., AND
FREDRICKSON, J. M. Cortical projection from group I muscle afferents to areas 2, 3a, and the vestibular field in the rhesus monkey. Exp. Brain Res. 17: 516-526, 1973.
40. SIEGEL, S. Nonparametric Statistics for the Behavioral Sciences. New York: McGraw, 1956, p. 127- 136.
41. Soso, M. J. AND FETZ, E. E. Responses of identified cells in postcentral cortex of awake monkeys during comparable active and passive joint movements. J. Neurophysiol. 43: 1090- 1111, 1980.
42. STRICK, P. L. AND KIM, C. C. Input to primate motor cortex from posterior parietal cortex (area 5). I. Demonstration by retrograde transport. Brain Res. 157: 325-330, 1978.
43. VALLBO, A. B. Slowly adapting muscle receptors in man. Acta Physiol. Stand. 78: 315-333, 1970.
44. VALLBO, A. B. Muscle spindle response at the onset of isometric voluntary contractions in man. Time differences between fusimotor and skeleto- motor effects. J. Physiol. London 218: 405-431, 1971.
45. VALLBO, A. B. Muscle spindle afferent discharge from resting and contracting muscles in normal human subjects. In: New Developments in Electro- myography and Clinical Neurophysiology , edited by J. E. Desmedt. Basel: Karger, 1973, vol. 3, p. 251-262.
46. VALLBO, A. B. Afferent discharge from human muscle spindles in non-contracting muscles. Steady state impulse frequency as a function of joint angle. Acta Physiol. Stand. 90: 303-318, 1974.
47. VALLBO, A. B., HAGBARTH, K.-E., TOREBJORK, H. E., AND WALLIN, B. C. Somatosensory pro- prioceptive, and sympathetic activity in human peripheral nerves. Physiol. Rev. 59: 919-957, 1979.
48. VOGT, B. A. AND PANDYA, D. N. Corticocortical connections of somatic sensory cortex (areas 3, 1 and 2) in the rhesus monkey. J. Comp. Neurol. 177: 179-192, 1978.
49. WERNER, G. AND WHITSEL, B. L. Func- tional organization of the somatosensory cortex. In: Handbook of Sensory Physiology. Vol. II. Somatosensory System, edited by A. Iggo. Berlin: Springer, 1973, p. 621-700.
50. WHITSEL, B. L., RUSTIONI, A., DREYER, D. A., LOE, P. R., ALLEN, E. E., AND METZ, C. B. Thalamic projections to S-I in Macaque monkey. J. Comp. Neural. 178: 385-410, 1978.
51. WIESENDANGER, M. Input from muscle and
1138 J. R. WOLPAW
52.
53.
54.
55.
56.
cutaneous nerves of the hand and forearm to neu- rons of the precentral gyrus of baboons and mon- keys. J. Physiol London 228: 203-219, 1973. WOLBARSHT, M. L., MACNICHOL, E. F., AND
WAGNER, H. G. Glass insulated platinum micro- electrodes. Science 132: 1309- 13 10, 1960. WOLPAW, J. R. Electromagnetic muscle stretch strongly excites sensorimotor cortex neurons in behaving primates. Science 203: 465-467, 1979. WOLPAW, J. R. Gyral impressions in the skull as a guide to cortical topography in chronic trans- dural unit recording. Brain Res. 160: 505-508, 1979.
WOLPAW, J. R. Amplitude of responses to per- turbation in primate sensorimotor cortex as a func- tion of task. J. Neurophysiol. 44: 1139- 1147, 1980. WOLPAW, J. R. AND COLBURN, T. R. Electro-
57.
58.
59.
magnetic stretch of individual muscles in behaving primates. Brain Res. 141: 193-196, 1978. WONG, Y. C., KWAN, H. C., MACKAY, W. A., AND MURPHY, J. T. Spatial organization of pre- central cortex in awake primates. I. Somatosen- sory inputs. J. Neurophysiol. 41: 1107- 1119, 1978.
WOOLSEY, C. N. Organization of somatic sensory and motor areas of the cerebral cortex. In: Biological and Biochemical Basis of Behavior, edited by H. F. Harlow and C. N. Woolsey. Madison: Univ. of Wisconsin Press, 1958, p. 63- 81. ZARZECKI, P., STRICK, P. L., AND ASANUMA, H. Input to primate motor cortex from posterior parietal cortex (area 5). II. Identification by antidromic activation. Brain Res. 157: 331-335, 1978.