Embed Size (px)
Citation preview

ORIGINAL RESEARCH ARTICLEpublished: 23 July 2013
doi: 10.3389/fnhum.2013.00376
Task modulation of brain responses in visual wordrecognition as studied using EEG/MEG and fMRIY. Chen1, M. H. Davis 2, F. Pulvermüller 2,3 and O. Hauk2*
1 Neuroscience and Aphasia Research Unit, University of Manchester, UK2 MRC Cognition and Brain Sciences Unit, Cambridge, UK3 Brain Language Laboratory, Department of Philosophy and Humanities, Freie Universität Berlin, Berlin, Germany
Edited by:
Hans-Jochen Heinze, University ofMagdeburg, Germany
Reviewed by:
Rik Vandenberghe, KatholiekeUniversiteit Leuven, BelgiumEvie Malaia, University of Texas atArlington, USA
*Correspondence:
O. Hauk, MRC-Cognition and BrainSciences Unit, 15 Chaucer Road,Cambridge CB2 7EF, UKe-mail: [email protected]
Do task demands change the way we extract information from a stimulus, or only howwe use this information for decision making? In order to answer this question for visualword recognition, we used EEG/MEG as well as fMRI to determine the latency rangesand spatial areas in which brain activation to words is modulated by task demands.We presented letter strings in three tasks (lexical decision, semantic decision, silentreading), and measured combined EEG/MEG as well as fMRI responses in two separateexperiments. EEG/MEG sensor statistics revealed the earliest reliable task effects ataround 150 ms, which were localized, using minimum norm estimates (MNE), to leftinferior temporal, right anterior temporal and left precentral gyri. Later task effects (250and 480 ms) occurred in left middle and inferior temporal gyri. Our fMRI data showedtask effects in left inferior frontal, posterior superior temporal and precentral cortices.Although there was some correspondence between fMRI and EEG/MEG localizations,discrepancies predominated. We suggest that fMRI may be less sensitive to the earlyshort-lived processes revealed in our EEG/MEG data. Our results indicate that task-specificprocesses start to penetrate word recognition already at 150 ms, suggesting that earlyword processing is flexible and intertwined with decision making.
Keywords: top–down control, lexical decision, semantic decision, reading, source estimation
INTRODUCTIONWord recognition has long been thought to be largely automatic,as for example demonstrated in the classic Stroop effect (Stroop,1992). Some authors have criticized this “curse of automatic-ity,” and pointed out that word processing should be consideredas flexible, because behavioral performance in word processingtasks is highly task dependent (Balota and Yap, 2006). However,behavioral evidence alone cannot determine at which stage taskdemands modulate word processing. In one extreme, a visuallypresented word may automatically activate all types of informa-tion associated with it, but only the information relevant forthe task is used for decision making. Alternatively, top–downcontrol may already allow retrieval of specific types of wordinformation that is necessary for the task. These two views arenot mutually exclusive. A direct way of testing these views isto measure brain activation during on-line word processing: Wecan determine whether task demands modulate early or latestages of word processing, and whether the pattern of brainactivation suggests different information processing at early andlate stages. Here, we present data from a multi-modal imagingstudy, employing EEG/MEG and fMRI data from separate exper-iments, to investigate the effects of task demands on early wordprocessing.
A number of studies have already demonstrated that informa-tion not essential for a task can still affect behavioral and brainresponses, as demonstrated in the Stroop effect or in the effects
of semantic variables in lexical decision (Chumbley and Balota,1984; Kiefer and Spitzer, 2000; Neely and Kahan, 2001; Balotaet al., 2004; Heil et al., 2004). However, the size of these effectshas been shown to depend on task demands, demonstrating somedegree of flexibility (James, 1975; Balota et al., 2004; Woollams,2005; Evans et al., 2012). Although there is strong evidence thatwe cannot completely suppress the retrieval of task-irrelevantinformation, it is still not clear at what stage task demands affectword processing.
Behavioral data alone are inherently limited in their abilityto distinguish different processing stages (Anderson, 1978). Onlymethods such as EEG and MEG enable us to record brain acti-vation on-line, i.e., while word recognition is unfolding. RecentERP studies have shown that task demands can affect the mecha-nisms of masked and unmasked priming. In a masked primingERP study, the reduction of N400 amplitude to target wordspreceded by semantically-related prime words was greater if pre-ceded by another semantic task, and smaller if preceded by aperceptual task (Kiefer and Martens, 2010). The authors suggestthat different preceding tasks can either “sensitize” or “desensi-tize” the semantic system, causing the enhancement or inhibitionof semantic processing of the masked prime, respectively. Thisinteresting study still does not allow discrimination between thedecision or retrieval views. The preceding task may affect the easewith which relevant information for the next task is retrieved, orthe ease with which this information can be used for decision
Frontiers in Human Neuroscience www.frontiersin.org July 2013 | Volume 7 | Article 376 | 1
HUMAN NEUROSCIENCE

Chen et al. Task modulation in word recognition
making. In our view, the most direct way to clarify this issue is touse single-word paradigms, and monitor the time course of earlyword recognition with high temporal resolution.
Unfortunately, the literature is still inconsistent with regard toeven basic aspects of the time course of visual word recognition.In particular, the latency ranges for lexico-semantic informa-tion retrieval are still intensely debated, with estimates rang-ing from before 150 to about 350 ms (Pylkkanen and Marantz,2003; Sereno and Rayner, 2003; Grainger and Holcomb, 2009;Pulvermuller et al., 2009; Kutas and Federmeier, 2011; Hauket al., 2012). We will therefore present results for several latencyranges. However, we adopt the view that the earliest modula-tion of lexico-semantic information retrieval can be expectedaround the N170 component. A number of studies have reportedeffects of lexical and semantic variables in this latency range(Sereno and Rayner, 2003; Hauk and Pulvermuller, 2004a;Amsel, 2011; Van Doren et al., 2012; Amsel et al., 2013), anda recent study has provided consistent evidence from behav-ioral responses, ERPs and EEG/MEG source estimation for thisassumption (Hauk et al., 2012). We assume that an absence oftask effects before this latency (e.g., around 100 ms) would indi-cate that tasks are similar with respect to general attentionaldemands.
The “earliness” of task modulation in brain responses wouldalready provide strong evidence as to whether they reflect differ-ences in early information retrieval or late decision making. Inaddition, the pattern of brain activation at early and late latenciesmay reveal whether task demands modulate brain areas usuallyassociated with executive functions, or with early lexico-semanticinformation retrieval. We therefore applied state-of-the-art dis-tributed source estimation using the minimum norm method(Dale and Sereno, 1993; Hämäläinen and Ilmoniemi, 1994; Hauk,2004) to our combined EEG and MEG data using individual headgeometries.
fMRI cannot provide evidence about the timing of cognitiveprocesses, but a comparison of fMRI localization and EEG/MEGsource estimation results may provide better clues about thespatio-temporal dynamics of the neuronal generators. A num-ber of brain regions, mainly in left perisylvian cortex, havebeen implicated in orthographic, lexical and semantic process-ing (Jobard et al., 2003; Binder et al., 2009). Interestingly, sev-eral studies have reported task effects mainly in frontal brainregions for visual word recognition (Chee et al., 2002; Fiebachet al., 2007). We therefore also asked whether fMRI can detecttask differences in perisylvian regions commonly associated withearly word processing, or whether it is mostly sensitive to laterprocesses related to decision-making and response execution.
Although some studies on perceptual processes have showngood correspondence between metabolic neuroimaging andEEG/MEG activation (Heinze et al., 1994; Opitz et al., 1999;Sharon et al., 2007), combining EEG/MEG with fMRI for highercognitive functions, in particular for language processing, has sofar been less successful (Liljestrom et al., 2009; McDonald et al.,2010; Vartiainen et al., 2011). We therefore did not attempt adirect fusion of our EEG/MEG and fMRI data. Instead, we per-formed an independent analysis of EEG/MEG and fMRI data, inorder to study their consistencies and discrepancies.
We employed three different psycholinguistic tasks that arecommonly used in behavioral and neuroimaging research: (1)Lexical Decision (LexT), (2) Semantic Decision (SemT), and (3)Silent Reading (SilT). LexT responses can be made based on thegeneral “wordlikeness,” i.e., do not require word identification,although a number of studies mentioned above have shown thatsemantic information is retrieved in LexT as well. SemT (e.g.,deciding whether a word is a person’s name) explicitly requiresidentification of an individual word and its meaning, and is there-fore putting more emphasis on semantic processing. To avoidmuscle and movement artifacts due to overt articulation in ourEEG/MEG and fMRI data, we employed a silent reading taskinstead of reading aloud, which should still involve phonologicalprocesses. Silent reading has successfully been employed in severalprevious neuroimaging experiments (Joubert et al., 2004; Hauket al., 2008b; Kronbichler et al., 2009). We focused mainly on thetime course of brain activity as measured with EEG/MEG, sincethis is most informative with respect to top–down effects on earlyword recognition processes. We also compared our EEG/MEGresults with fMRI data from a different participant group, in orderto corroborate our EEG/MEG source estimation results, and todetermine the differential sensitivities of EEG/MEG and fMRI todifferent aspects of visual word recognition.
METHODSPARTICIPANTSFifteen subjects (11 female) entered the EEG/MEG analysis afterthree subjects were removed due to excessive movement andeye blinking artifacts. Twenty subjects (10 female) entered thefMRI analysis after two subjects were removed due to measure-ment error. A reduced version of the Oldfield handedness inven-tory (Oldfield, 1971) showed no significant difference betweenEEG/MEG and fMRI participants in handedness (M of later-ality Quotient = 86.9 vs. 86.8, p = 0.982), age (M = 25 vs.25.7, p = 0.719), and there was no difference with respect toself-reported years of education (M = 16.6 vs. 17.3, p = 0.515).All participants were native English speakers, had normal orcorrected-to-normal vision and reported no neurological disor-der or dyslexia. They were paid 10 pounds per hour for theirparticipation (a minimum of £20 for the whole experiment). Theexperiment was approved by the Cambridge Psychology ResearchEthics Committee.
STIMULISix hundred words (200 per task) were selected from the MRCpsycholinguistic database based on the criteria that their wordlength ranged between 3 and 7 letters, their word form fre-quency and lemma frequency per million were greater than 0 andthey were not listed as morphologically complex in the CELEXdatabase (Baayen et al., 1993). Bigram frequency, trigram fre-quency, word length, word form frequency, lemma frequency, andneighborhood size (Coltheart’s N) were obtained from CELEXdatabase (Baayen et al., 1993). Number of semantic mean-ings and number of senses were obtained from the Wordsmythdatabase (http://www.wordsmyth.net/). Action-relatedness rat-ings of stimuli were obtained using the same method as Hauket al. (2008a,b). Concreteness and imageability were obtained
Frontiers in Human Neuroscience www.frontiersin.org July 2013 | Volume 7 | Article 376 | 2

Chen et al. Task modulation in word recognition
from the MRC psycholinguistic database. Stimuli were dividedinto three lists, matched on all the variables mentioned aboveusing the Match software (van Casteren and Davis, 2007), asshown in Table 1. The three word lists were counterbalanced overthe three tasks.
Two hundred pseudowords were created for the lexical deci-sion task. They were matched with the three lists of real wordsin word length, bigram frequency, trigram frequency and N. Forthe semantic decision task, twenty common person’s names (e.g.,Jack, Mandy) were selected as catch trials. Names were matchedin word length (i.e., 3–7 letters) to the non-target words. Mixsoftware (van Casteren and Davis, 2006) was used to randomizethe pseudowords and real words in the lexical decision task, realwords in silent reading, as well as real words and catch trial itemsin semantic decision. Words starting with the same letter did notfollow each other in the experiment.
PROCEDUREEach participant performed three psycholinguistic tasks: lexicaldecision task (LexT), silent reading task (SilT) and semantic deci-sion task (SemT). The lexical decision task required participantsto press buttons using the left hand middle finger for 200 pseu-dowords and the left hand index finger for 200 real words. Thesilent reading task required participants to silently read 200 wordswithout making any overt articulatory response. The semanticdecision task required participants to press a button using theirleft hand middle finger when they saw a target word correspond-ing to a person name. There were 20 target trials out of 220 totaltrials. Task order was counterbalanced across subjects in bothfMRI and EEG/MEG.
For all three tasks, stimuli were presented for 100 ms, fol-lowed by a red fixation cross which had variable duration [M =2400 ms, Range = (2150–2650)]. The average SOA was 2.5 s.Words were presented in a fixed width font (Courier New) inwhite on a black background. The longest word (7 letters) hada visual angle of 1.5◦ (fMRI) and 1.4◦ (EEG/MEG).
As the lexical decision was about twice as long as the othertwo tasks (due to the presence of pseudowords), it was split intotwo halves so that the whole experiment contained four blocksof comparable length. Breaks of 10 s were inserted after every
minute of stimulus presentation. Each block lasted for 11 minexcept for the semantic decision task which was 12 min long dueto the presence of 20 additional target trials. Before the first blockof lexical decision task and the semantic decision task, a practicecontaining 10 items was given to the participants to ensure thetask was well understood. As silent reading required no responseinside the scanner, participants performed an unannounced post-scan word recognition test to ensure they had attended to thestimuli. In the recognition test, participants saw 40 words one ata time and were required to determine whether the words hadbeen seen in the scanner using button presses. Half of the wordshad been presented previously and the other half were matchedcontrols.
EEG/MEG DATA ACQUISITION AND PRE-PROCESSINGMEG data were acquired using a 306-channel NeuromagVectorview system which contained 204 planar gradiometers and102 magnetometers at MRC Cognition and Brain Sciences Unit,Cambridge, UK. EEG data were acquired simultaneously usinga 70-electrode EEG cap (EasyCap), with the recording referenceelectrode attached to the nose, and the ground electrode to theleft cheek. The electrooculogram (EOG) was recorded by placingelectrodes above and below the left eye (vertical EOG) and at theouter canthi (horizontal EOG). To ensure accurate co-registrationwith MRI data, the positions of 5 Head Position Indicator (HPI)coils attached to the EEG cap, 3 anatomical landmark points(bilateral preauricular points and nasion), and 50–100 additionalpoints covering the whole scalp were digitized with a 3SpaceIsotrak II System.
The signal-space separation (SSS) method implemented in theMaxfilter software (Version 2.0) of Neuromag was applied to theraw MEG data to remove noise generated from sources distant tothe sensor array (Taulu and Kajola, 2005). In this process, move-ment compensation was applied and bad MEG channels wereinterpolated. Data acquired in all blocks except the first one wereinterpolated to the sensor array of the first block. Data were band-pass-filtered between 0.1 and 40 Hz using MNE software (Version2.6) and downsampled to 4 ms time resolution. Data were dividedinto epochs of 600 ms, starting from 100 ms before stimulionset. Epochs were rejected if maximum-minimum amplitudes
Table 1 | Mean values (and standard deviations) of 11 psycholinguistic variables for the three word lists and one pseudoword list.
Word list 1 Word list 2 Word list 3 Pseudowords
Word length 5.03(1.1) 5.05(1.04) 4.9(0.89) 4.86(0.79)
Bigram 32882.39(12136.29) 33855.98(13533.4) 34113.87(13828.06) 34392.19(14063)
Trigram 3568.2(2195.92) 3509.98(2244.32) 3394.78(2218.53) 3346.39(2155.28)
N 4.07(4.29) 4.17(4.21) 4.2(4.12) 4.21(4.05)
Word form frequency 41.92(76.59) 44.01(75.69) 42.62(73.91) N/A
Lemma frequency 80.14(143.67) 88.06(204.32) 72.44(112.21) N/A
Concreteness 511.19(107.62) 514.99(97.89) 517.81(105.73) N/A
Imageability 524.69(86.01) 527.9(81.51) 529.33(84.18) N/A
Action relatedness 3.31(0.95) 3.32(0.94) 2.82(1.2) N/A
Number of meanings 1.15(0.4) 1.19(0.51) 1.18(0.45) N/A
Number of senses 4.62(3.06) 4.96(3.14) 5.15(3) N/A
Frontiers in Human Neuroscience www.frontiersin.org July 2013 | Volume 7 | Article 376 | 3

Chen et al. Task modulation in word recognition
in the −100 to 500 ms interval exceeded the following thresholds:100 µV in the EEG, 100 µV in the EOG, 2500 fT in magnetome-ters, 1000 fT/cm for gradiometers. Raw data were inspected foreach subject to check for consistently bad EEG channels, whichwere subsequently interpolated.
fMRI DATA ACQUISITION AND PRE-PROCESSINGFunctional MRI scanning was performed using a Siemens 3T TimTrio MR system with a head coil at the MRC Cognition and BrainSciences Unit. Echo planar images (EPI) were acquired usinga TR = 2 s, TE = 30 ms and a flip angle of 78◦. Reconstructedimages contained 32 slices covering the whole brain, withslice thickness 3 mm, interslice distance 0.75 mms, field-of-view192 mm and in-plane resolution 64 × 64 voxels (3 × 3 mm).Functional scans were preceded by a high-resolution struc-tural T1-weighted MRI images, acquired using a 3D MPRAGEsequence, field-of-view 256 × 240 × 160 mm, matrix dimensions256 × 240 × 160, 1 mm isotropic resolution, TR = 2250 ms,TI = 900 ms, TE = 2.99 ms, flip angle 9◦. Structural images werealso acquired using the same sequence for participants in theEEG/MEG experiment.
Functional images were corrected for slice timing andrealigned to the middle image. The EPI images were coregis-tered to the skull-stripped structural T1-images using a mutualinformation coregistration procedure (Pluim et al., 2003). Thestructural MRI was normalized to the 152-subject T1 templateof the Montreal Neurological Institute (MNI). The resultingtransformation parameters were applied to the coregistered EPIimage. Images were resampled with a spatial resolution of 2 × 2 ×2 mm3, and spatially smoothed with a 10-mm full-width half-maximum Gaussian kernel. Low-frequency noise was removedby applying a high-pass filter (time constant 128 s). Imaging datawas processed using SPM5 software (Wellcome Department ofCognitive Neurology, London, UK) and Automatic Analysis script(https://github.com/rhodricusack/automaticanalysis/wiki).
STATISTICAL ANALYSISEEG/MEG SensorSPMs and displayStatistical analysis of EEG/MEG amplitude in sensor space datawas performed using “SensorSPMs” in SPM5. Two spatial dimen-sions of the sensor array and one dimension of time werecombined into a 3D “volume,” and subjected to SPM analy-sis comparable to fMRI whole-brain analysis (http://imaging.mrc-cbu.cam.ac.uk/meg/SensorSpm). F-tests were computed atevery latency and sensor. The significance threshold for the result-ing F-distribution was determined using random field theory,taking into account the multiple comparisons problem acrossboth space and time (Kiebel and Friston, 2004). SensorSPMs canonly be computed for each sensor type separately (electrodes,magnetometers and gradiometers), due to different physical mea-surement units for the three sensor types. Furthermore, so farrandom field theory has only been applied to scalar fields (notvector fields), i.e., distributions that contain one value per loca-tion. For gradiometers, we could therefore combine the valuesof the two gradiometers at each location by computing theroot-mean-square (RMS). However, this may produce spuriousdifferences due to different noise-levels, as the RMS procedure
produces only positive values which may turn differences in noiselevels into differences in mean activations. We therefore onlypresent SensorSPMs for magnetometer data and EEG. However,ROI statistics on source estimates (see below) are based oncombined data from all sensor types.
In order to describe the time course of our data and todetermine peaks and latency ranges of interest, we displayed theRMS of the signal-to-noise ratio (SNR) across all magnetome-ters, gradiometers and electrodes (dividing signal amplitude bythe standard deviation of the baseline for each channel). The com-putation of SNRs prior to RMS transformation renders the valuesfor all channels unit-less (original measurements are in T,T/mand µV, respectively), and allows the computation of a combinedmeasure for display.
Source estimation of EEG/MEG dataOur source estimation procedure followed the standard proce-dure described for the MNE software (http://www.nmr.mgh.
harvard.edu/martinos/userInfo/data/sofMNE.php). Minimumnorm estimates (Hämäläinen and Ilmoniemi, 1994; Hauk, 2004)were computed on individually reconstructed cortical surfacesusing boundary element models of the head geometry derivedfrom structural MRI images. MEG sensor configurations andMRI images were co-registered based on the matching of about50–100 digitized additional points on the scalp surface withthe reconstructed scalp surface from the FreeSurfer software(Version 4.3; http://surfer.nmr.mgh.harvard.edu/). StructuralMRI images were processed using the automated segmentationalgorithms of FreeSurfer (Dale et al., 1999; Fischl et al., 1999).The noise covariance matrices for each data set were computedfor baseline intervals of 200 ms duration before the onset ofeach stimulus presented during the whole experiment. Forregularization, the default signal-to-noise ratio in the MNEsoftware was used (SNR = 3).
The result of the FreeSurfer segmentation was processed fur-ther using the MNE software package (Version 2.6). The originaltriangulated cortical surface (consisting of several hundred thou-sand vertices) was downsampled to a grid using the traditionalmethod for cortical surface decimation with an average distancebetween vertices of 5 mm, which resulted in ∼10000 vertices. ForMEG, a boundary element model (BEM) containing 5120 trian-gles was created from the inner skull surface using a watershedalgorithm. For EEG, a three-layer BEM containing 5120 trian-gles were created from scalp, outer skull surface and inner skullsurface respectively. Dipole sources were assumed to be perpen-dicular to the cortical surface. Source estimates were computedfor each subject. The individual results were morphed to the aver-age brain across all subjects, and a grand-average was computed.These grand-averages were then displayed on the inflated averagecortical surface.
Six ROIs in regions commonly associated with word or lan-guage processing in the left hemisphere and their right hemi-sphere counterparts were defined on the basis of the All-wordscondition from EEG/MEG, which is orthogonal to the contrastscomputed in the further analyses (Friston and Henson, 2006). Itis important to note that spatial resolution of EEG/MEG data isinherently limited, and that source estimation may suffer from
Frontiers in Human Neuroscience www.frontiersin.org July 2013 | Volume 7 | Article 376 | 4

Chen et al. Task modulation in word recognition
systematic mislocalization of the true sources (Fuchs et al., 1999;Molins et al., 2008; Hauk et al., 2011). Using standard coordi-nates from metabolic imaging studies, or from the fMRI partof our study, is therefore not recommended. Instead, we definedROIs that fell within general areas of interest based on activationfor all words averaged across all three tasks. This allows localiza-tion within the resolution limits of our sensor configuration, andensures that ROIs are defined independently of the between-taskcomparisons and comprise parts of the source space to which ourmeasurement configuration is sensitive.
General areas of interest were defined using anatomical labelsprovided in FreeSurfer software (e.g., “middle temporal cortex”).More precisely, for every general area of interest, we detectedthe most prominent activation peak within the time window100–500 ms. We then extracted the ROI around this peak usingthe mne_analyze tool in the MNE software, approximately fol-lowing the line of half-maximum-amplitude around the peak.In this way, six ROIs in each hemisphere were defined on theinflated surface as shown in Figure 1B. They were inferior lat-eral occipital gyrus, anterior middle temporal gyrus, precentralgyrus, inferior temporal gyrus, posterior middle temporal gyrus,and inferior frontal gyrus. For each ROI, average amplitudeswithin time windows and across vertices were computed. Weperformed Two-Way ANOVAs (factors Task and ROI) in theleft hemisphere. We furthermore compared tasks in individualROIs. Tasks were compared by means of pair-wise two-tailed t-tests in each ROI. We compared individual tasks to each other,i.e., LexT vs. SemT, LexT vs. SilT, and SemT vs. SilT, but alsocompared the mean of LexT and SemT (LexSemT) to SilTin order to increase statistical power to detect lexico-semanticeffects.
fMRI analysisfMRI analysis was conducted using the general linear modelimplemented in SPM5 software. Each stimulus event in eachcategory (words, pseudowords, error trials for words and pseu-dowords in LexT, words and targets in semantic decision, wordsonly in silent reading) was modeled as separate columns in thedesign matrix, and then convolved with the canonical haemo-dynamic response function (HRF) in SPM5. Covariates of nointerest were added for the six movement parameters (translationand rotation) as well as the mean activation level within each ses-sion. Parameter estimates from the least mean square fit of thedesign matrix in each participant were entered into group anal-yses with inter-subject variation as a random effect (Holmes andFriston, 1998). For initial inspection of results, and selection ofROIs, the contrast of the response to all words in each task againstthe unmodeled resting period (i.e., implicit baseline) for each par-ticipant (i.e., All-words vs. Baseline) was used for analysis. Furthercontrasts between tasks were evaluated using one sample t-testsapplied to subtractions of parameter estimates in each subject.
Depending on the research questions, several ROIs were usedin different types of analyses, as will be described in the appro-priate parts of the Results section. ROI analysis was performedusing 4-mm-radius spheres centered at peaks as well as theircorresponding right hemisphere peaks by flipping the sign of xcoordinate in MNI space. Small volume correction (SVC) was
FIGURE 1 | EEG/MEG results for all words collapsed across the three
tasks. (A) Root-Mean-Square (RMS) of Signal-to-Noise Ratio (SNR, basedon standard deviation of baseline interval) across all EEG/MEG sensors overtime. The shaded areas indicate the five time windows selected based onpeaks in the RMS curves: 92–124, 144–176, 200–300, 300–400, and400–492 ms. Asterisks indicate whether a One-Way ANOVA with factorTask was significant at a family-wise corrected level (∗∗p < 0.01,∗∗∗p < 0.001). MAG stands for magnetometers. (B) EEG/MEG sourceestimates on a group-averaged inflated brain surface for words averagedacross tasks in the time windows specified above. ROIs selected forfurther analysis are outlined in black in the middle column.
performed in spheres of 15 mm radius around the correspond-ing peaks, or within labeled areas of the Automatic AnatomicalLabeling (AAL) atlas (Tzourio-Mazoyer et al., 2002).
RESULTSBEHAVIORAL RESULTSIn LexT, the mean accuracy of detecting real words was 93%(SD = 4%) for EEG/MEG and 95% (SD = 4%) for fMRI. A Two-Way ANOVA with factors Method (fMRI vs. EEG/MEG) andLexicality (words vs. pseudowords) revealed a significant effect ofLexicality (words vs. pseudowords in mean RT: 665 ms vs. 755 ms)[F(1, 33) = 98.94, p < 0.001], but no significant effect of Method.
The mean d′ of post-scan word recognition tests in SilTwas 0.94 (SD = 0.14) for EEG/MEG and 0.76 (SD = 0.15) forfMRI. Both were significantly different from 0 (EEG/MEG: t =6.74, df = 14, p < 0.001; fMRI: t = 4.99, df = 19, p < 0.001).Because our participants were not instructed to memorize anyof the stimuli prior to the experiment, we interpret these resultsas evidence that our participants attended to the stimuli duringthe experiment despite the absence of overt behavioral responses.The mean d′ for SemT in EEG/MEG was 4.36 (SD = 0.16) andin fMRI 4.30 (SD = 0.12). They were both significantly differ-ent from 0 (EEG/MEG: t = 27, df = 14, p < 0.001; fMRI: t = 36,df = 19, p < 0.001).
Frontiers in Human Neuroscience www.frontiersin.org July 2013 | Volume 7 | Article 376 | 5

Chen et al. Task modulation in word recognition
EEG/MEG RESULTSThe mean numbers of trials rejected in the averaging pro-cess were 33.9 (SD = 29.8) (lexical decision), 27.7 (24.0) (silentreading) and 27.1 (27.5) (semantic decision). A One-Wayrepeated-measures ANOVA revealed no significant task differencein number of rejected trials [F(2, 28) < 1, p > 0.5]. We analyzedour EEG/MEG data both in sensor and in source space. Theresults will be reported in separate sections below.
Sensor spaceIn order to illustrate the overall time course of brain activa-tion, Figure 1A shows the root mean square (RMS) of signal-to-noise ratios (SNR) of all EEG/MEG sensors for words, separatelyfor each task. In all three tasks, real words elicited clear peakresponses around 100, 150, and 250 ms, with broader peaksaround 350 and 450 ms. In order to test for reliable task differ-ences in sensor space taking into account multiple comparisonsacross space and time, we employed a One-Way ANOVA withthree levels (LexT, SemT, SilT) in a SensorSPM analysis, at astatistical threshold of p < 0.05 family-wise (FWE) voxel cor-rected with a minimum cluster size of 10 voxels. Based on SNRcurves in Figure 1A, we tested within a time window from 92 to500 ms. This analysis revealed the most reliable effect of task ataround 150 ms (140 ms for magnetometers, F = 28.9, p < 0.01,FWE corrected; 152 ms for EEG, F = 46.58, p < 0.001, FWEcorrected). Post-hoc pair-wise comparisons showed a significantdifference between LexT and SilT in this latency range [magne-tometers peaks at 144 ms, F = 26.71, p < 0.01, false discoveryrate (FDR) corrected; EEG peaks at 176 ms, F = 85.49, p < 0.05,FWE corrected], as well as a significant difference between SemTand SilT (magnetometers peaks at 156 ms, F = 48.26, p < 0.01,FDR corrected; EEG peaks at 152 ms, F = 167.98, p < 0.001,
FWE corrected) but no corrected significant difference betweenLexT and SemT.
Further significant effects were seen at 250 ms (magnetome-ters peak at 260 ms, F = 26.38, p < 0.01, FWE corrected; EEGpeaks at 236 ms, F = 44.68, p < 0.001, FWE corrected). Post-hocpair-wise comparisons revealed significant differences betweenLexT and SemT (magnetometers not significant; EEG peaks at260 ms, F = 46.16, p < 0.05, FDR corrected), between LexT andSilT (magnetometer peaks at 256 ms, F = 43.08, p < 0.01, FDRcorrected; EEG peaks at 232 ms, F = 113.61, p < 0.01, FWEcorrected), and between SilT and SemT (magnetometers peaksat 244 ms, F = 59.81, p < 0.01, FDR corrected; EEG peaks at240 ms, F = 39.71, p < 0.01, FDR corrected).
Later effects were detected in EEG only, at 496 ms (EEG,F = 27.59, p < 0.01, FWE corrected). Post-hoc pair-wise com-parisons revealed that there were significant differences betweenLexT and SilT (EEG peaks at 496 ms, F = 52.48, p < 0.001,FDR corrected), between LexT and SemT (EEG peaks at 500 ms,F = 31.56, p < 0.05, FDR corrected) but not between SilTand SemT.
Relatively few previous studies on word recognition haveemployed both EEG and MEG in the same experiment. It istherefore often difficult to compare MEG results with the usuallymore extensive ERP literature. Therefore, we present the topogra-phies of EEG and magnetometer signals for All-word > baselinefor two early latencies in Figure 2. In addition, time courses forpeak electrodes are shown. This demonstrates typical posteriorpositive ERP components at 108 ms (“P1,” centre of 92–124 mstime window) and negative components at 160 ms (“N1,” centerof 144–176 ms time window). The task effects revealed by theSensorSPM analysis (Figure 1) can also be seen in the ERP timecourses for peak electrodes.
FIGURE 2 | EEG/MEG results in sensor space. Left: Topography of EEGand Magnetometers (MAG) for All-word > Baseline contrast at 108 ms (P1),as well as time courses for peak electrodes (P7 and P8). Right: Topography
of EEG and MAG for All-word > Baseline contrast at 160 ms (N1), as well astime courses for peak electrodes (P9 and P10). Contour line increments: 14fTfor MAG, 0.85 µV for EEG.
Frontiers in Human Neuroscience www.frontiersin.org July 2013 | Volume 7 | Article 376 | 6
Chen et al. Task modulation in word recognition
Source spaceOur sensor space analysis provides strong evidence for task mod-ulation of brain responses around 150 ms after word onset. Inorder to determine the likely neuronal generators that under-lie these and later effects in sensor space, and compare themwith fMRI results below, we computed minimum norm estimatesfrom combined EEG and MEG data for the average across wordsfor each task separately. Word-evoked activation for all wordsacross tasks on inflated cortical surfaces is shown in Figure 1B.Time windows of 32 ms were used to capture the peaks (dueto downsampling we had to choose a multiple of 4 ms). Strongbilateral occipital activation occurred in the 92–124 ms time win-dow, followed by a strong widespread activation of the lateraland inferior portions of temporal lobe between 144 and 176 ms.In the 200–300 ms window, activation was more distributed,extending to regions such as left precentral and left inferiorfrontal cortex. Activation appeared mostly left-lateralized, espe-cially in the anterior part of middle temporal region. In the300–400 ms time window, activation started to diminish butwas still present in occipital and anterior temporal lobe, and inthe 400-492 ms time window in anterior temporal and frontalareas.
Task-differences were statistically analyzed using an ROIapproach in the time windows defined above. Neuronal genera-tors revealed by MNE were averaged within each specified timewindow.
As shown in Figure 1A, the signal-to-noise ratio curve peaksat 160 ms, and the most reliable effects in SensorSPMs occurredaround this latency. We therefore focused our ROI analysis onthe time window 144–176 ms. A Two-Way ANOVA [Task(3) ×ROI(6)] in the left hemisphere revealed no effect of Task or aTask × ROI interaction (p > 0.6). On the basis of significanttask effects in sensor space, we therefore carried out a morelenient analysis in source space analysis for individual ROIs, inorder to provide an estimate for the most likely generators ofour effects in sensor space. The reliability of these results willbe discussed on the background of the existing neuroimagingliterature.
As shown in Figure 3, two-tailed paired sample t-tests showedthat words in SilT elicited significantly stronger activation thanthose in LexT in left precentral gyrus [t(14) = 3.141, p < 0.01]but not in the right hemisphere [t(14) < 1]; SemT elicited strongeractivation than SilT in left inferior temporal gyrus [t(14) = 2.215,p < 0.05] but not in the right hemisphere [t(14) < 1]. The aver-age of LexT and SemT (LexSemT) showed greater activity thanSilT in the left inferior temporal region [t(14) = 2.208, p < 0.05].SilT elicited weaker activation in right anterior temporal regionthan LexT [t(14) = 2.693, p < 0.05] and SemT, although the lattereffect was just marginally significant [t(14) = 2.072, p = 0.057].LexSemT showed greater activity than SilT in the right ante-rior temporal region [t(14) = 2.550, p < 0.05] but not in the leftanterior temporal cortex [t(14) < 1].
FIGURE 3 | ROI analysis in EEG/MEG source space. Task effects on wordactivation are shown for six ROIs and in three time windows (144–176,236–268, 460–492 ms) that showed significant family-wise corrected effectsof Task in the sensor space analysis (SensorSPMs). For each time window,
the anatomical locations of the ROIs with significant results are shown in red(Op < 0.1, ∗p < 0.05, ∗∗p < 0.01. “T”-bars indicate that combined lexicaldecision and semantic decision are different from silent reading). IT, inferiortemporal gyrus; MT, middle temporal gyrus.
Frontiers in Human Neuroscience www.frontiersin.org July 2013 | Volume 7 | Article 376 | 7

Chen et al. Task modulation in word recognition
The SensorSPM analysis suggested that further task effectsoccurred after the 150 ms time window. The Two-Way ANOVA(Task × ROI) in the left hemisphere in the 250 ms time win-dow again revealed no task or task x ROI interaction (p > 0.2).For individual ROIs, SemT elicited stronger activation than SilTin left anterior temporal regions [t(14) = 3.074, p < 0.01] butonly marginally in the right anterior temporal region [t(14) =1.984, p = 0.067]. LexSemT showed greater activity than SilT inthe left anterior temporal region [t(14) = 3.053, p < 0.01], andmarginally greater activity than SilT in the right anterior temporalregion [t(14) = 2.059, p = 0.059]. LexT elicited stronger activa-tion than SilT in right posterior middle temporal region [t(14) =2.488, p < 0.05] but not in the left hemisphere [t(14) < 1].LexSemT showed greater activity than SilT in the right posteriormiddle temporal region [t(14) = 2.516, p < 0.05].
In the time window 460 to 492 ms, the Two-Way ANOVA(Task × ROI) in the left hemisphere revealed a main effect oftask (p < 0.05) but no Task x ROI interaction (p > 0.3). Post-hoc paired sample t-tests showed that the main effect of Taskwas due to a lower response in SilT than LexT (p < 0.05) andSemT (p < 0.01). In the individual ROI analysis, SemT againelicited stronger activation than SilT in left anterior temporalregion [t(14) = 3.077, p < 0.01] and in the right anterior tem-poral region [t(14) = 3.187, p < 0.01]. LexSemT showed greateractivity than SilT in the left anterior temporal region [t(14) =2.918, p < 0.05]. Furthermore, SemT elicited stronger activa-tion than LexT in the left inferior temporal cortex [t(14) = 2.291,p < 0.05] but not in the right hemisphere [t(14) < 1].
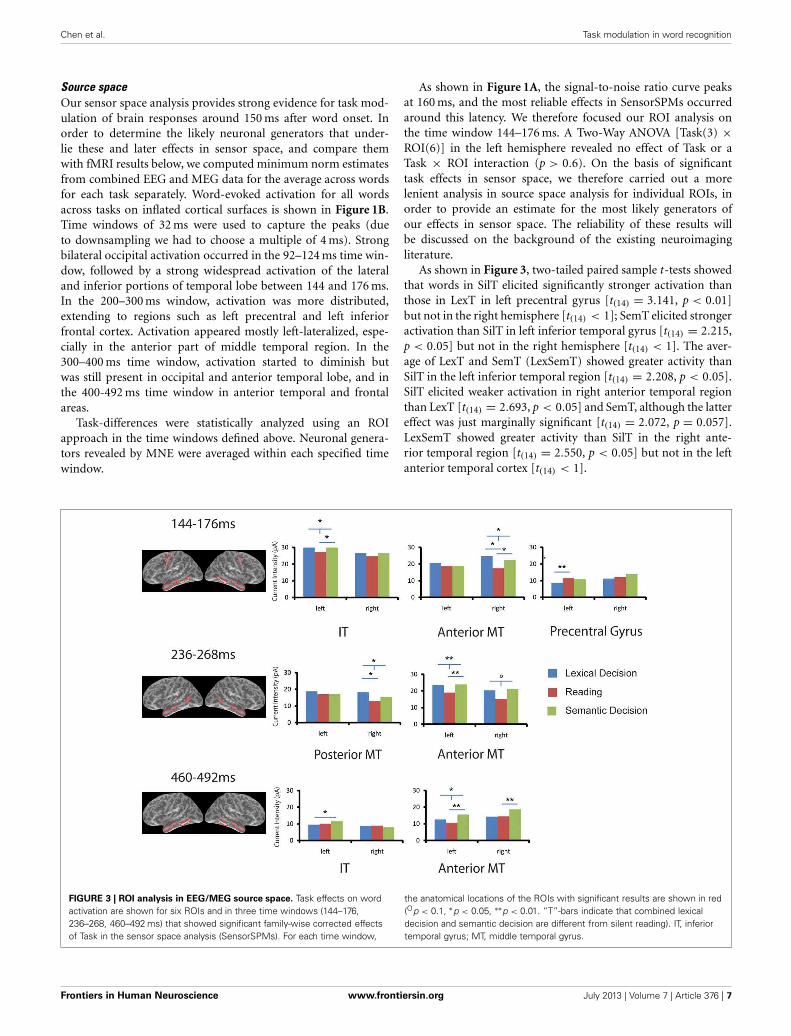
fMRI RESULTSWhole-brain analysisAs shown in Figure 4, real words against baseline across the threetasks elicited left lateralized activations in posterior cingulum,inferior temporal gyrus, angular gyrus, hippocampus, medialsuperior frontal gyrus and supplementary motor area in the lefthemisphere, as well as right precentral gyrus, paracentral lobuleand bilateral inferior frontal gyrus (see Table 2). It may surprisethat we did not find activation in posterior inferior temporal andoccipital areas for this contrast. However, this is likely due tothe choice of our baseline task, which consisted of 10 s blocksof rest with instructions on the screen. Note that our task con-trasts are orthogonal to the general word activation contrast, i.e.,the absence of general word activation does not prevent us fromdetecting task effects.
As shown in Figure 4, whole brain One-Way repeated measureANOVAs with Task as the only factor revealed several regions thatdistinguished between the three tasks (p < 0.001, uncorrected,extent >10). At an FDR-corrected threshold, we found reliabletask effects in cerebellum, superior temporal gyrus, precentralgyrus, middle cingulum and precueneus in the left hemisphere(see Table 3). In the right hemisphere task differences were seen inright precentral gyrus, middle cingulum, middle occipital gyrus,superior occipital gyrus, postcentral gyrus and pallidum. Amongthese regions, left superior temporal gyrus is important in lan-guage processing, especially for speech processing. The post-hocROI analysis centered at this peak (region 6 in Figure 4) showedthat SilT elicited greater activation than LexT (p < 0.001) and
SemT (p < 0.05). Further analysis in bilateral precentral gyrus iscovered in pairwise comparisons later.
Small volume correction (SVC) and ROI analysisOur whole-brain ANOVA did not reveal reliable task effects inareas that have previously been implicated in word processingincluding inferior frontal, middle temporal, inferior temporal,and precentral areas (Price, 2000; Jobard et al., 2003; Binderet al., 2009). Because some of these areas showed effects in ourEEG/MEG source space analysis, we performed a more lenientanalysis of our fMRI results based on small volume corrections(SVC) and ROIs. For SVC analyses, only results that survivedp < 0.05 cluster correction are reported below.
Three peaks in left IFG and one peak in right IFG wererevealed by whole brain All-word > Baseline activation contrast(p < 0.001 uncorrected, extent >10). SVC surrounding thesepeaks and their corresponding coordinates in the other hemi-sphere (by flipping the x coordinate) was performed for each ofthe pair-wise task comparisons. This revealed a significant clus-ter peaking in the left IFG (−36 14 26; Z = 3.25) for SemT >
SilT (p < 0.05 cluster corrected). This result was confirmed by anSVC analysis using left pars triangularis AAL label. An SVC anal-ysis using left pars opercularis AAL labels also revealed a clusterpeak for SemT > SilT (−34 16 26; Z = 3.18) (p < 0.05 clustercorrected).
For middle temporal cortex, only SVC using bilateral AALlabels revealed for SilT > LexT significant clusters peaking in leftposterior middle temporal cortex (−42 −68 22; Z = 3.49) (p <
0.05 cluster corrected), and right middle temporal cortex (52 −648; Z = 3.86) (p < 0.01 cluster corrected). No task differenceswere found in left inferior temporal cortex.
The All-word > Baseline contrast revealed a cluster in theright precentral region. ROI analysis centered on its peak showedthat LexT elicited stronger activation than SemT (p < 0.001), andSilT elicited greater activation than SemT (p < 0.05) (region 3,Figure 4B). SVC analysis showed that SilT elicited greater acti-vation than LexT in the left precentral gyrus (−36 −28 60;Z = 3.83) (p < 0.001 cluster corrected). In the right precentralgyrus, there was also a significant effect of LexT > SemT (38 −1664; Z = 4.72) (p < 0.001 cluster corrected), and a significanteffect of SilT > SemT (40 −28 58) (p < 0.05 cluster corrected).Finally, SVC analysis using bilateral AAL precentral gyrus labelsrevealed that SilT > LexT showed significant voxels in left precen-tral gyrus (−36 −28 60; Z = 3.83) (p < 0.01 cluster corrected).Right precentral gyrus showed elicited responses in LexT>SemT(40 −14 56; Z = 4.75) (p < 0.001 cluster corrected) andSilT>SemT (40 −26 56; Z = 3.51) (p < 0.05 cluster corrected)contrasts.
DISCUSSIONIn order to investigate the flexibility of visual word recogni-tion, we asked in which latency ranges and cortical areas brainresponses are modulated by task demands. We studied word-evoked brain activity in three different psycholinguistic tasksusing EEG/MEG and fMRI. Words were presented in lexical deci-sion (LexT), silent reading (SilT) and semantic decision (SemT)tasks. Sensor space analysis of our EEG/MEG data revealed
Frontiers in Human Neuroscience www.frontiersin.org July 2013 | Volume 7 | Article 376 | 8

Chen et al. Task modulation in word recognition
FIGURE 4 | fMRI activation to all words and task effects. (A)
Regions that produced significant activation to all words (averagedacross three tasks) against baseline. (B) Regions that showedsignificant effects in a One-Way ANOVA with the factor Task. Circlesindicate ROIs that showed significant task effects using small volume
correction. Bar graphs show significant ROI analysis results in moredetail (significance levels indicated as in Figure 3). All whole-brainresults are displayed at a significance threshold of p < 0.001uncorrected with minimum extent of 10 voxels (see Table 3 fordetails). ∗p < 0.05, ∗∗p < 0.01, ∗∗∗p < 0.001.
reliable task differences already around 150 ms after word onset.At this latency, task effects on brain activation in source spaceoccurred in left inferior temporal, left precentral and right ante-rior temporal areas. These results suggest that task demandspenetrate word processing already at an early stage. Left ante-rior temporal areas also showed task effects around 250 ms, andbilaterally around 480 ms. Within these time ranges, LexT andSemT produced more activation than SilT, except in precen-tral cortex. Around 480 ms SemT elicited greater activity thaneither LexT or SilT in bilateral anterior temporal lobes. The fMRIanalysis revealed brain areas affected by task demands in left pos-terior superior temporal gyrus, bilateral precentral gyrus and leftinferior frontal gyrus. This only partly matched our EEG/MEGresults, and we suggest that fMRI may be more sensitive to laterstages of word processing.
EEG/MEG RESULTSThe main results of this study were early task effects inlatency ranges around 150 and 250 ms after stimulus onset.This was revealed by statistical sensor space analysis that con-trolled for multiple comparisons across sensors and time samples(SensorSPM). Our tasks differed with respect to whether exper-imental sessions contained only words (SilT and SemT) or alsopseudowords (LexT), and whether overt responses were requiredfor every item (LexT), for a subset of items (SemT), or notat all (SilT). Similar differences also existed in previous behav-ioral studies, for example reading aloud and lexical decisionwill necessarily differ with respect to response selection. Thesestudies usually employ block designs with respect to the fac-tor Task, since randomizing tasks across trial would introducepotential confounds with regard to task switching. However, it
Frontiers in Human Neuroscience www.frontiersin.org July 2013 | Volume 7 | Article 376 | 9

Chen et al. Task modulation in word recognition
Table 2 | BOLD responses to words across tasks, at least p < 0.001
uncorr, minimum extent = 10, ∗p < 0.05 FDR corrected, ∗∗p < 0.05
FWE corrected.
Region Cluster x y z T Z
WORDS IN ALL TASKS > BASELINE
L Post cingulum 3149 ** −16 −40 18 8.76 5.48
** 20 −42 16 7.95 5.22
** −12 −2 24 7 4.87
L Inf temporal 1727 ** −42 −20 −20 7.49 5.05
** −48 −36 −4 7.31 4.98
** −46 −32 −14 7.2 4.94
R Precentral 673 ** 36 −24 68 6.54 4.68
* 42 −18 56 6.21 4.53
* 44 −22 64 6.14 4.5
L Supp motor 219 * −6 6 58 5.28 4.09
R Paracentral lobule 85 * 4 −28 62 4.83 3.85
L Inf frontal 283 * −50 38 −8 4.65 3.75
* −40 30 −14 4.4 3.61
L Angular 75 * −56 −64 36 4.49 3.66
L Hippocampus 48 * −16 −12 −16 4.39 3.6
L Medial sup frontal 69 * −10 40 42 4.12 3.44
L Inf frontal 48 * −48 24 12 4.02 3.38
R Inf frontal 10 * 36 0 28 3.73 3.19
Table 3 | Regions showing significant differences between tasks in
One-Way repeated-measure ANOVA, at least p < 0.001 uncorr,
minimum extent = 10, ∗p < 0.05 FDR corrected, ∗∗p < 0.05 FWE
corrected.
Region Cluster x y z F Z
ANOVA FOR THE EFFECT OF TASK
L Cerebellum 1019 ** −14 −52 −22 34.54 5.83
* 10 −58 −34 9.52 3.32
R Precentral 677 * 40 −14 58 21.25 4.84
L Sup temporal 68 * −62 −36 12 13.27 3.93
R Mid cingulum 173 * 14 −32 42 12.6 3.83
R Cuneus 166 * 16 −82 42 12.04 3.75
30 −88 32 8.5 3.13
L Precentral 248 * −36 −24 56 11.35 3.64
L Mid cingulum 178 * −4 −22 46 11.09 3.6
* −10 −34 44 9.68 3.35
R Mid occipital 119 * 44 −76 30 11.07 3.59
* 48 −70 24 10.39 3.48
L Precuneus 29 * −10 −82 46 10.59 3.51
R Sup occipital 30 * 18 −94 22 10.37 3.47
R Pallidum 27 * 26 0 −8 9.66 3.35
R Postcentral 22 * 60 −2 38 9.59 3.34
L Precuneus 44 * −6 −56 60 9.35 3.29
is still possible that general differences in attention or responseselection may explain our early task effects at around 150 ms.Considering that we did not find reliable task effects around100 ms, and in particular that overall activity did not differ, we
conclude that general attentional demands were similar acrosstasks.
We further asked whether there were specific differencesbetween tasks in source space, i.e. whether the spatial patternof our early task effects is consistent with the view that tasksalready modulate early information retrieval. Surprisingly fewneuroimaging studies have investigated task effects on generalvisual word recognition processes yet, and to our knowledge noresults from comparable EEG/MEG source estimation studies areavailable. In the following, we will begin with a discussion of ournovel EEG/MEG results, and then compare them with our fMRIdata and previous fMRI literature.
The earliest task effects occurred around 150 ms, with moreactivation for SilT compared to LexT in precentral gyrus, aswell as more activation to LexT and SemT compared to SilT inleft inferior temporal cortex and right anterior middle temporalgyrus. Early activation of left precentral areas is consistent withearly retrieval of phonological information, as reported in severalprevious studies. Pammer et al. (2004) found left precentral gyrusactivation in the time window between 0 and 200 ms for wordsbut not anagrams. Wheat et al. (2010) reported pseudohomo-phone priming effects in left precentral gyrus around 100 ms. Thissupports the view that silent reading (as an artifact-minimizingversion of reading aloud) puts more emphasis on phonologicalinformation retrieval than LexT and SemT.
The localization of the task effect in left inferior temporalcortex around 150 ms is consistent with the “visual word formarea” (VWFA), which is assumed to link higher-level orthogra-phy with lexical information (Cohen et al., 2000, 2002, 2004;Kronbichler et al., 2007; Dehaene and Cohen, 2011). PreviousERP studies have reported effects of lexical variables around160 ms (Hauk et al., 2006a), and orthographic and lexical vari-ables have been shown to interact around 160 ms (Hauk et al.,2006b). We therefore propose that task effects around 150 ms inthe present study occurred at the earliest stage when orthographicand lexico-semantic information retrieval interact.
This conclusion is further supported by an early task effectin right anterior mid-temporal lobe (ATL). ATL is of particu-lar interest with respect to semantics, since it has been labeledthe “semantic hub,” i.e., it is thought to link word forms withdistributed polymodal semantic representations (Patterson et al.,2007; Pulvermuller et al., 2010). The ATL has been shown toactivate more under conditions where demands on the semanticsystem are increased (Woollams et al., 2011). It is possible that wemissed a left-hemispheric effect around 150 ms due to a lack ofsensitivity: ATL is located at the lower level of the EEG/MEG elec-trode and sensor array, and may therefore produce lower signalsthan for example more posterior and superior temporal areas.Differences in orientation or distribution of sources may havefavored the right hemisphere over the left. Around 250 ms, a sim-ilar pattern of results can be observed in bilateral ATL. Our resultsat 150 ms may have captured the onset of this effect.
Greater activation for LexT and SemT than SilT in bilat-eral ATL around 250 ms, which was more reliable in the lefthemisphere, indicates larger emphasis on semantic informationretrieval in lexical and semantic tasks compared to silent reading.This was accompanied by a similar pattern in right posterior
Frontiers in Human Neuroscience www.frontiersin.org July 2013 | Volume 7 | Article 376 | 10

Chen et al. Task modulation in word recognition
middle temporal gyrus, and is consistent with other studies thathave reported effects of semantic variables in this latency range(Hauk and Pulvermuller, 2004b; Amsel, 2011). ATL also showedtask effects around 480 ms in the left hemisphere, but with a dif-ferent pattern: SemT activated more than LexT and SilT. Effectsin this latency range (N400) are traditionally linked to seman-tic or conceptual processing, and ATL is one of the possiblecontributors to this components (Lau et al., 2008). We offertwo possible explanations for the temporal sequence of our ATLeffects. First, the later effect may be due to reevaluation of seman-tic information retrieved at earlier stages, which is necessaryfor accurate semantic decisions, but not for lexical decisions orsilent reading. Second, it may reflect the time course of semanticinformation retrieval from coarse features early on to more fine-grained features at later latencies. A recent ERP study has demon-strated that different semantic features can modulate the brainresponse at different latencies (Amsel, 2011). A more detailedanalysis of the time course of semantic processing using com-bined EEG/MEG source estimation should be provided by futurestudies.
COMPARISON OF EEG/MEG AND fMRI RESULTSAreas reliably modulated by task demands in fMRI were bilateralprecentral gyrus, left superior temporal gyrus, bilateral poste-rior middle temporal lobe, and left inferior frontal gyrus. Amongthose areas, only left precentral gyrus showed task effects around150 ms in our EEG/MEG analysis, with more activation for SilTcompared to LexT. This corresponds well to our fMRI results,where left precentral gyrus was also more activated for SilT thanfor LexT. As described above, this is also consistent with the ideaof early phonological activation in word reading (Pammer et al.,2004; Wheat et al., 2010), and may reflect grapheme-to-phonemeconversion in single-word reading (Jobard et al., 2003).
An area that showed a task effect in fMRI (more activation forSemT compared to SilT) but did not have a counterpart in ourEEG/MEG analysis was the left inferior frontal gyrus (LIFG). Thisis consistent with a number of fMRI studies that have reportedan involvement of LIFG in language processing, and semantics inparticular (Bookheimer, 2002; Devlin et al., 2003; Jobard et al.,2003; Binder et al., 2009; Whitney et al., 2011). LIFG has alsobeen shown to be sensitive to selection demands (Thompson-Schill, 2003), which would explain why it activates most in SemTwhere words and their meanings have to be uniquely identified.However, our EEG/MEG analysis did not reveal any task effectsin this area in any of the analyzed latency ranges. Furthermore,our results presented in Figure 1B do not suggest strong activa-tion in inferior frontal areas even to words in general within thefirst 500 ms. Note that we used combined EEG and MEG mea-surements in our source estimation procedure, which should haveincreased our chances to pick up signals in frontal areas comparedto MEG alone (Molins et al., 2008; Goldenholz et al., 2009).
Further effects, for which a clear correspondence betweenEEG/MEG and fMRI could not be established, occurred in theposterior middle temporal lobe (pMTL). EEG/MEG detected taskeffects in pMTL only in the right hemisphere around 250 ms,where LexT produced more activation than SilT. In fMRI, theeffects were reversed: SilT activates more than LexT. It is possible
that the ROIs in the EEG/MEG and fMRI analyses reflect acti-vation from different anatomical regions. For example, pMTLhas been implicated in processing intelligible speech (Scott et al.,2000; Davis and Johnsrude, 2003). Higher activation in SilTmight reflect stronger phonological processing or grapheme-to-phoneme conversion when participants were reading the wordthan performing LexT. This phonological account would also beconsistent with the results that SilT activated left superior tem-poral gyrus more than both LexT and SemT. Superior temporalgyrus, together with posterior middle temporal gyrus and precen-tral gyrus, have been proposed to form a loop that is importantfor speech production (Scott et al., 2000). This is consistent withour assumption that the silent reading task encourages internalarticulation and the retrieval of phonological information. OurfMRI data do not allow conclusions about the stage at whichphonological information becomes available during word recog-nition. The fact that left pMTL effects were present in fMRI butnot EEG/MEG suggests that they may reflect internal vocalizationat a post-recognition stage.
Task effects in left inferior temporal cortex were found only inEEG/MEG, but not fMRI. They occurred in one early (150 ms)and one late (480 ms) latency range. As discussed earlier, leftinferior temporal activation is often interpreted as reflectingearly analysis of orthographic structures (Vinckier et al., 2007;Dehaene and Cohen, 2011). However, it has also been found tobe modulated by variables other than orthography (Price andDevlin, 2011). In particular, several studies have reported image-ability effects in left fusiform areas (Wise et al., 2000; Fiebachand Friederici, 2004; Sabsevitz et al., 2005; Hauk et al., 2008a),although some studies have failed to confirm these findings(Jessen et al., 2000; Binder et al., 2005). It is possible that theseleft inferior temporal brain areas are affected by multiple vari-ables at multiple stages of processing. Indeed, our EEG/MEG datasuggest different patterns of results at early and late latencies. Itis therefore possible that different tasks activate inferior tempo-ral areas at different stages and for different reasons, which in anfMRI analysis that integrates information over time may producesimilar levels of activation.
The ATL is of particular interest with respect to semantics(Patterson et al., 2007; Pulvermuller et al., 2010). Unfortunately,fMRI is relatively insensitive to ATL activation due to effects ofmagnetic susceptibility (Devlin et al., 2000; Visser et al., 2009).Indeed, we did not find task effects in ATL in our fMRI data, butin three time windows of the EEG/MEG analysis: around 150 ms,250 ms and 480 ms. It was first modulated by task demands inthe right hemisphere (150 ms), followed by an effect in the lefthemisphere (250 ms), and finally bilaterally (480 ms). Our resultssuggest that combined EEG/MEG source estimation is sensitive toATL activation at different stages of processing, and may thereforebe a promising tool for future studies in this area.
CONCLUSIONSIn conclusion, our signal space EEG/MEG results indicatethat task demands can already penetrate early stages of visualword processing. Furthermore, the patterns of brain activationobtained from distributed source estimation, which demonstratethe specificity of task effects to particular cortical regions, provide
Frontiers in Human Neuroscience www.frontiersin.org July 2013 | Volume 7 | Article 376 | 11

Chen et al. Task modulation in word recognition
evidence that these task effects originate at early stages of lexico-semantic information retrieval. Our results do not contradictfindings that task-irrelevant information can affect task perfor-mance (as in the Stroop effects); instead, in combination withprevious results, we argue that visual word recognition is bestdescribed as flexible rather than automatic, and that informa-tion accumulation and decision making may be more intertwinedthan previously thought (Balota and Yap, 2006; Norris, 2006).An integration of these findings with our fMRI results is notstraightforward, which we suggest reflects the relative insensitiv-ity of fMRI to early short-lived processes that occur within the
first 250 ms of word onset. Our results highlight the importanceof EEG/MEG methodology in combination with source estima-tion for the investigation of the spatio-temporal dynamics of wordrecognition.
ACKNOWLEDGMENTSThis work was supported by the Medical Research Council UK(MC-A060-5PR40 to O. Hauk, MC_US_A060_0038 to M. H.Davis, MC_US_A060_0034 to F. Pulvermüller, and PhD schol-arships of the Cambridge Overseas Trust, Gonville and CaiusCollege Cambridge and MRC-UK to Y. Chen).
REFERENCESAmsel, B. D. (2011). Tracking
real-time neural activation ofconceptual knowledge using single-trial event-related potentials.Neuropsychologia 49, 970–983.doi: 10.1016/j.neuropsychologia.2011.01.003
Amsel, B. D., Urbach, T. P., and Kutas,M. (2013). Alive and grasping: sta-ble and rapid semantic access to anobject category but not object gras-pability. Neuroimage 77, 1–13. doi:10.1016/j.neuroimage.2013.03.058
Anderson, J. R. (1978). Arguments con-cerning representations for mentalimagery. Psychol. Rev. 85, 249–277.doi: 10.1037/0033-295X.85.4.249
Baayen, R. H., Piepenbrock, R., andvan Rijn, H. (1993). The CELEXLexical Database. Philadelphia,PA: Linguistic Data Consortium,University of Pennsylvania.
Balota, D. A., Cortese, M. J., Sergent-Marshall, S. D., Spieler, D. H.,and Yap, M. (2004). Visual wordrecognition of single-syllable words.J. Exp. Psychol. Gene. 133, 283–316.doi: 10.1037/0096-3445.133.2.283
Balota, D. A., and Yap, M. (2006).“Attentional control and flexible lex-ical processing: explorations of themagic moment of word recogni-tion,” in From Inkmarks to Ideas:Current Issues in Lexical Processing,ed S. Andrews (New York, NY:Psychology Press), 229–258.
Binder, J. R., Desai, R. H., Graves,W. W., and Conant, L. L. (2009).Where Is the semantic system? Acritical review and meta-analysis of120 functional neuroimaging stud-ies. Cereb. Cortex 19, 2767–2796.doi: 10.1093/cercor/bhp055
Binder, J. R., Westbury, C. F.,McKiernan, K. A., Possing, E.T., and Medler, D. A. (2005).Distinct brain systems for process-ing concrete and abstract concepts.J. Cogn. Neurosci. 17, 905–917. doi:10.1162/0898929054021102
Bookheimer, S. (2002). FunctionalMRI of language: new approaches
to understanding the cortical orga-nization of semantic processing.Annu. Rev. Neurosci. 25, 151–188.doi: 10.1146/annurev.neuro.25.112701.142946
Chee, M. W. L., Hon, N. H. H.,Caplan, D., Lee, H. L., and Goh,J. (2002). Frequency of concretewords modulates prefrontal activa-tion during semantic judgments.Neuroimage 16, 259–268. doi:10.1006/nimg.2002.1061
Chumbley, J. I., and Balota, D. A.(1984). A word’s meaning affectsthe decision in lexical decision.Mem. Cognit. 12, 590–606. doi:10.3758/BF03213348
Cohen, L., Dehaene, S., Naccache, L.,Lehericy, S., Dehaene-Lambertz, G.,Henaff, M. A., et al. (2000). Thevisual word form area - Spatialand temporal characterization of aninitial stage of reading in normalsubjects and posterior split-brainpatients. Brain 123, 291–307. doi:10.1093/brain/123.2.291
Cohen, L., Henry, C., Dehaene, S.,Martinaud, O., Lehericy, S., Lemer,C., et al. (2004). The pathophys-iology of letter-by-letter reading.Neuropsychologia 42, 1768–1780.doi: 10.1016/j.neuropsychologia.2004.04.018
Cohen, L., Lehericy, S., Chochon, F.,Lemer, C., Rivaud, S., and Dehaene,S. (2002). Language-specific tuningof visual cortex functional prop-erties of the Visual Word FormArea. Brain 125, 1054–1069. doi:10.1093/brain/awf094
Dale, A. M., Fischl, B., and Sereno,M. I. (1999). Cortical surface-based analysis: I. segmentationand surface reconstruction.Neuroimage 9, 179–194. doi:10.1006/nimg.1998.0395
Dale, A. M., and Sereno, M. I. (1993).Improved localizadon of corticalactivity by combining eeg andmeg with mri cortical surfacereconstruction: a linear approach.J. Cogn. Neurosci. 5, 162–176. doi:10.1162/jocn.1993.5.2.162
Davis, M. H., and Johnsrude, I. S.(2003). Hierarchical processing inspoken language comprehension.J. Neurosci. 23, 3423–3431.
Dehaene, S., and Cohen, L. (2011).The unique role of the visualword form area in reading. TrendsCogn. Sci. 15, 254–262. doi:10.1016/j.tics.2011.04.003
Devlin, J. T., Matthews, P. M., andRushworth, M. F. S. (2003).Semantic processing in the leftinferior prefrontal cortex: acombined functional magneticresonance imaging and transcra-nial magnetic stimulation study.J. Cogn. Neurosci. 15, 71–84. doi:10.1162/089892903321107837
Devlin, J. T., Russell, R. P., Davis, M.H., Price, C. J., Wilson, J., Moss,H. E., et al. (2000). Susceptibility-induced loss of signal: compar-ing PET and fMRI on a semantictask. Neuroimage 11, 589–600. doi:10.1006/nimg.2000.0595
Evans, G. A., Lambon Ralph, M. A.,and Woollams, A. M. (2012). What’sin a word? A parametric study ofsemantic influences on visual wordrecognition. Psychon. Bull. Rev. 19,325–331. doi: 10.3758/s13423-011-0213-7
Fiebach, C. J., and Friederici, A. D.(2004). Processing concrete words:fMRI evidence against a specificright-hemisphere involvement.Neuropsychologia 42, 62–70. doi:10.1016/S0028-3932(03)00145-3
Fiebach, C. J., Ricker, B., Friederici,A. D., and Jacobs, A. M. (2007).Inhibition and facilitation invisual word recognition: pre-frontal contribution to theorthographic neighborhood sizeeffect. Neuroimage 36, 901–911. doi:10.1016/j.neuroimage.2007.04.004
Fischl, B., Sereno, M. I., and Dale,A. M. (1999). Cortical surface-based analysis: II: inflation,flattening, and a surface-basedcoordinate system. Neuroimage 9,195–207. doi: 10.1006/nimg.1998.0396
Friston, K. J., and Henson, R.N. (2006). Commentaryon: divide and conquer; adefence of functional localisers.Neuroimage 30, 1097–1099. doi:10.1016/j.neuroimage.2006.02.007
Fuchs, M., Wagner, M., Kohler,T., and Wischmann, H.-A.(1999). Linear and nonlinearcurrent density reconstructions.J. Clin. Neurophysiol. 16, 267–295.doi: 10.1097/00004691-199905000-00006
Goldenholz, D. M., Ahlfors, S. P.,Hämäläinen, M. S., Sharon, D.,Ishitobi, M., Vaina, L. M., et al.(2009). Mapping the signal-to-noise-ratios of cortical sourcesin magnetoencephalography andelectroencephalography. Hum.Brain Mapp. 30, 1077–1086. doi:10.1002/hbm.20571
Grainger, J., and Holcomb, P. J.(2009). Watching the wordgo by: on the time-courseof component processes invisual word recognition. Lang.Linguist. Compass 3, 128–156. doi:10.1111/j.1749-818X.2008.00121.x
Hämäläinen, M. S., and Ilmoniemi,R. J. (1994). Interpreting magneticfields of the brain: minimum normestimates. Med. Biol. Eng. Comput.32, 35–42. doi: 10.1007/BF02512476
Hauk, O. (2004). Keep it simple:a case for using classical min-imum norm estimation in theanalysis of EEG and MEG data.Neuroimage 21, 1612–1621. doi:10.1016/j.neuroimage.2003.12.018
Hauk, O., Coutout, C., Holden, A., andChen, Y. (2012). The time-course ofsingle-word reading: evidence fromfast behavioral and brain responses.Neuroimage 60, 1462–1477. doi:10.1016/j.neuroimage.2012.01.061
Hauk, O., Davis, M. H., Ford, M.,Pulvermuller, F., and Marslen-Wilson, W. D. (2006a). Thetime course of visual wordrecognition as revealed by lin-ear regression analysis of ERPdata. Neuroimage 30, 1383–1400.
Frontiers in Human Neuroscience www.frontiersin.org July 2013 | Volume 7 | Article 376 | 12

Chen et al. Task modulation in word recognition
doi: 10.1016/j.neuroimage.2005.11.048
Hauk, O., Patterson, K., Woollams,A., Watling, L., Pulvermuller,F., and Rogers, T. T. (2006b).[Q:] When would you prefer aSOSSAGE to a SAUSAGE? [A:] Atabout 100 msec. ERP correlates oforthographic typicality and lexi-cality in written word recognition.J. Cogn. Neurosci. 18, 818–832. doi:10.1162/jocn.2006.18.5.818
Hauk, O., Davis, M. H., Kherif, F., andPulvermuller, F. (2008a). Imageryor meaning? Evidence for a seman-tic origin of category-specific brainactivity in metabolic imaging. Eur.J. Neurosci. 27, 1856–1866. doi:10.1111/j.1460-9568.2008.06143.x
Hauk, O., Davis, M. H., andPulvermuller, F. (2008b).Modulation of brain activity bymultiple lexical and word formvariables in visual word recog-nition: a parametric fMRI study.Neuroimage 42, 1185–1195. doi:10.1016/j.neuroimage.2008.05.054
Hauk, O., and Pulvermuller, F.(2004a). Effects of word lengthand frequency on the humanevent-related potential. Clin.Neurophysiol. 115, 1090–1103. doi:10.1016/j.clinph.2003.12.020
Hauk, O., and Pulvermuller, F. (2004b).Neurophysiological distinction ofaction words in the fronto-centralcortex. Hum. Brain Mapp. 21,191–201. doi: 10.1002/hbm.10157
Hauk, O., Wakeman, D. G., andHenson, R. (2011). Comparisonof noise-normalized minimumnorm estimates for MEG analysisusing multiple resolution metrics.Neuroimage 54, 1966–1974. doi:10.1016/j.neuroimage.2010.09.053
Heil, M., Rolke, B., and Pecchinenda,A. (2004). Automatic semantic acti-vation is no myth: semantic con-text effects on the N400 in theletter-search task in the absence ofresponse time effects. Psychol. Sci.15, 852–857. doi: 10.1111/j.0956-7976.2004.00766.x
Heinze, H. J., Mangun, G. R., Burchert,W., Hinrichs, H., Scholz, M., Munte,T. F., et al. (1994). Combinedspatial and temporal imaging ofbrain activity during visual selectiveattention in humans. Nature 372,543–546. doi: 10.1038/372543a0
Holmes, A. P., and Friston, K. J. (1998).Generalisability, random effects andpopulation inference. Neuroimage 7,S754.
James, C. T. (1975). The role ofsemantic information in lexicaldecisions. J. Exp. Psychol. Hum.Percept. Perform. 1, 130–136. doi:10.1037/0096-1523.1.2.130
Jessen, F., Heun, R., Erb, M., Granath,D. O., Klose, U., Papassotiropoulos,A., et al. (2000). The concrete-ness effect: evidence for dualcoding and context availability.Brain Lang. 74, 103–112. doi:10.1006/brln.2000.2340
Jobard, G., Crivello, F., and Tzourio-Mazoyer, N. (2003). Evaluation ofthe dual route theory of read-ing: a metanalysis of 35 neu-roimaging studies. Neuroimage 20,693–712. doi: 10.1016/S1053-8119(03)00343-4
Joubert, S., Beauregard, M., Walter,N., Bourgouin, P., Beaudoin, G.,Leroux, J. M., et al. (2004). Neuralcorrelates of lexical and sublex-ical processes in reading. BrainLang. 89, 9–20. doi: 10.1016/S0093-934X(03)00403-6
Kiebel, S. J., and Friston, K. J.(2004). Statistical parametricmapping for event-related poten-tials: I. Generic considerations.Neuroimage 22, 492–502. doi:10.1016/j.neuroimage.2004.02.012
Kiefer, M., and Martens, U. (2010).Attentional sensitization ofunconscious cognition: tasksets modulate subsequent maskedsemantic priming. J. Exp. Psychol.Gen. 139, 464–489. doi: 10.1037/a0019561
Kiefer, M., and Spitzer, M. (2000).Time course of conscious andunconscious semantic brain activa-tion. Neuroreport 11, 2401–2407.doi: 10.1097/00001756-200008030-00013
Kronbichler, M., Bergmann, J.,Hutzler, F., Staffen, W., Mair,A., Ladurner, G., et al. (2007).Taxi vs. Taksi: on orthographicword recognition in the left ventraloccipitotemporal cortex. J. Cogn.Neurosci. 19, 1584–1594. doi:10.1162/jocn.2007.19.10.1584
Kronbichler, M., Klackl, J., Richlan, F.,Schurz, M., Staffen, W., Ladurner,G., et al. (2009). On the func-tional neuroanatomy of visualword processing: effects of caseand letter deviance. J. Cogn.Neurosci. 21, 222–229. doi:10.1162/jocn.2009.21002
Kutas, M., and Federmeier, K.D. (2011). Thirty years andcounting: finding meaning inthe N400 component of theevent-related brain potential(ERP). Annu. Rev. Psychol. 62,621–647. doi: 10.1146/annurev.psych.093008.131123
Lau, E. F., Phillips, C., and Poeppel,D. (2008). A cortical networkfor semantics: (de)constructingthe N400. Nat. Rev. Neurosci. 9,920–933. doi: 10.1038/nrn2532
Liljestrom, M., Hulten, A., Parkkonen,L., and Salmelin, R. (2009).Comparing MEG and fMRI viewsto naming actions and objects.Hum. Brain Mapp. 30, 1845–1856.doi: 10.1002/hbm.20785
McDonald, C. R., Thesen, T., Carlson,C., Blumberg, M., Girard, H.M., Trongnetrpunya, A., et al.(2010). Multimodal imagingof repetition priming: UsingfMRI, MEG, and intracranialEEG to reveal spatiotempo-ral profiles of word processing.Neuroimage 53, 707–717. doi:10.1016/j.neuroimage.2010.06.069
Molins, A., Stufflebeam, S. M.,Brown, E. N., and Hämäläinen,M. S. (2008). Quantificationof the benefit from integrat-ing MEG and EEG data inminimum l2-norm estimation.Neuroimage 42, 1069–1077. doi:10.1016/j.neuroimage.2008.05.064
Neely, J. H., and Kahan, T. A.(2001). “Is semantic activa-tion automatic? A criticalre-evaluation,” in The Nature ofRemembering: Essays in Honor ofR. G. Crowder, ed H. L. Roediger(Washington, DC: AmericanPsychological Association), 69–93.doi: 10.1037/10394-005
Norris, D. (2006). The Bayesianreader: explaining word recog-nition as an optimal Bayesiandecision process. Psychol. Rev. 113,327–357. doi: 10.1037/0033-295X.113.2.327
Oldfield, R. C. (1971). The assessmentand analysis of handedness:the Edinburgh inventory.Neuropsychologia 9, 97–113. doi:10.1016/0028-3932(71)90067-4
Opitz, B., Mecklinger, A., VonCramon, D. Y., and Kruggel,F. (1999). Combining electro-physiological and hemodynamicmeasures of the auditory oddball.Psychophysiology 36, 142–147. doi:10.1017/S0048577299980848
Pammer, K., Hansen, P. C.,Kringelbach, M. L., Holliday,I., Barnes, G., Hillebrand, A.,et al. (2004). Visual word recog-nition: the first half second.Neuroimage 22, 1819–1825. doi:10.1016/j.neuroimage.2004.05.004
Patterson, K., Nestor, P. J., and Rogers,T. T. (2007). Where do you knowwhat you know? The represen-tation of semantic knowledgein the human brain. Nat. Rev.Neurosci. 8, 976–987. doi: 10.1038/nrn2277
Pluim, J. P., Maintz, J. B., and Viergever,M. A. (2003). Mutual-information-based registration of medicalimages: a survey. IEEE Trans.
Med. Imaging 22, 986–1004. doi:10.1109/TMI.2003.815867
Price, C. J. (2000). The anatomy oflanguage: contributions from func-tional neuroimaging. J. Anat. 197(Pt3), 335–359. doi: 10.1046/j.1469-7580.2000.19730335.x
Price, C. J., and Devlin, J. T. (2011).The interactive account ofventral occipitotemporal con-tributions to reading. TrendsCogn. Sci. 15, 246–253. doi:10.1016/j.tics.2011.04.001
Pulvermuller, F., Cooper-Pye, E.,Dine, C., Hauk, O., Nestor, P.,J., and Patterson, K. (2010). Theword processing deficit in seman-tic dementia: all categories areequal, but some categories aremore equal than others. J. Cogn.Neurosci. 22, 2027–2041. doi:10.1162/jocn.2009.21339
Pulvermuller, F., Shtyrov, Y., andHauk, O. (2009). Understandingin an instant: neurophysiolog-ical evidence for mechanisticlanguage circuits in the brain.Brain Lang. 110, 81–94. doi:10.1016/j.bandl.2008.12.001
Pylkkanen, L., and Marantz, A.(2003). Tracking the time courseof word recognition with MEG.Trends Cogn. Sci. 7, 187–189. doi:10.1016/S1364-6613(03)00092-5
Sabsevitz, D. S., Medler, D. A.,Seidenberg, M., and Binder, J. R.(2005). Modulation of the seman-tic system by word imageability.Neuroimage 27, 188–200. doi:10.1016/j.neuroimage.2005.04.012
Scott, S. K., Blank, C. C., Rosen, S., andWise, R. J. (2000). Identificationof a pathway for intelligible speechin the left temporal lobe. Brain123(Pt 12), 2400–2406. doi:10.1093/brain/123.12.2400
Sereno, S. C., and Rayner, K. (2003).Measuring word recognitionin reading: eye movementsand event-related potentials.Trends Cogn. Sci. 7, 489–493. doi:10.1016/j.tics.2003.09.010
Sharon, D., Hämäläinen, M. S.,Tootell, R. B., Halgren, E., andBelliveau, J. W. (2007). The advan-tage of combining MEG andEEG: comparison to fMRI infocally stimulated visual cortex.Neuroimage 36, 1225–1235. doi:10.1016/j.neuroimage.2007.03.066
Stroop, J. R. (1992). Studies ofinterference in serial verbal reac-tions (Reprinted from JournalExperimental-Psychology, Vol18, Pg 643–662, 1935). J. Exp.Psychol. Gene. 121, 15–23. doi:10.1037/0096-3445.121.1.15
Taulu, S., and Kajola, M. (2005).Presentation of electromagnetic
Frontiers in Human Neuroscience www.frontiersin.org July 2013 | Volume 7 | Article 376 | 13

Chen et al. Task modulation in word recognition
multichannel data: the signal spaceseparation method. J. Appl. Phys.97, 124905.
Thompson-Schill, S. L. (2003).Neuroimaging studies of semanticmemory: inferring “how” from“where”. Neuropsychologia 41,280–292. doi: 10.1016/S0028-3932(02)00161-6
Tzourio-Mazoyer, N., Landeau, B.,Papathanassiou, D., Crivello, F.,Etard, O., Delcroix, N., et al. (2002).Automated anatomical labeling ofactivations in SPM using a macro-scopic anatomical parcellationof the MNI MRI single-subjectbrain. Neuroimage 15, 273–289. doi:10.1006/nimg.2001.0978
van Casteren, M., and Davis, M.H. (2006). Mix, a program forpseudorandomization. Behav.Res. Methods 38, 584–589. doi:10.3758/BF03193889
van Casteren, M., and Davis, M.H. (2007). Match: a program toassist in matching the conditionsof factorial experiments. Behav.Res. Methods 39, 973–978. doi:10.3758/BF03192992
Van Doren, L., Schrooten, M.,Adamczuk, K., Dupont, P.,and Vandenberghe, R. (2012).Chronometry of word and
picture identification: commonand modality-specific effects.Neuroimage 59, 3701–3712. doi:10.1016/j.neuroimage.2011.11.068
Vartiainen, J., Liljestrom, M., Koskinen,M., Renvall, H., and Salmelin, R.(2011). Functional magneticresonance imaging blood oxy-genation level-dependent signaland magnetoencephalographyevoked responses yield differentneural functionality in reading.J. Neurosci. 31, 1048–1058. doi:10.1523/JNEUROSCI.3113-10.2011
Vinckier, F., Dehaene, S., Jobert, A.,Dubus, J. P., Sigman, M., andCohen, L. (2007). Hierarchical cod-ing of letter strings in the ventralstream: dissecting the inner orga-nization of the visual word-formsystem. Neuron 55, 143–156. doi:10.1016/j.neuron.2007.05.031
Visser, M., Jefferies, E., and LambonRalph, M. A. (2009). Semanticprocessing in the anterior tem-poral lobes: a meta-analysis ofthe functional neuroimaging lit-erature. J. Cogn. Neurosci. 22,1083–1094. doi: 10.1162/jocn.2009.21309
Wheat, Cornelissen, P. L., Frost,S. J., and Hansen, P. C. (2010).During visual word recognition,
phonology is accessed within100 ms and may be mediated by aspeech production code: evidencefrom magnetoencephalography.J. Neurosci. 30, 5229–5233. doi:10.1523/JNEUROSCI.4448-09.2010
Whitney, C., Kirk, M., O’Sullivan, J.,Lambon Ralph, M. A., and Jefferies,E. (2011). The neural organizationof semantic control: TMS evidencefor a distributed network in leftinferior frontal and posterior mid-dle temporal gyrus. Cereb. Cortex21, 1066–1075. doi: 10.1093/cer-cor/bhq180
Wise, R. J., Howard, D., Mummery,C. J., Fletcher, P., Leff, A.,Buchel, C., et al. (2000). Nounimageability and the tempo-ral lobes. Neuropsychologia 38,985–994. doi: 10.1016/S0028-3932(99)00152-9
Woollams, A. M. (2005). Imageabilityand ambiguity effects in speedednaming: convergence and diver-gence. J. Exp. Psychol. Learn.Mem. Cogn. 31, 878–890. doi:10.1037/0278-7393.31.5.878
Woollams, A. M., Silani, G., Okada,K., Patterson, K., and Price, C.J. (2011). Word or word-like?Dissociating orthographic typi-cality from lexicality in the left
occipito-temporal cortex. J. Cogn.Neurosci. 23, 992–1002. doi:10.1162/jocn.2010.21502
Conflict of Interest Statement: Theauthors declare that the researchwas conducted in the absence of anycommercial or financial relationshipsthat could be construed as a potentialconflict of interest.
Received: 07 March 2013; paper pend-ing published: 03 May 2013; accepted:29 June 2013; published online: 23 July2013.Citation: Chen Y, Davis MH,Pulvermüller F and Hauk O (2013)Task modulation of brain responses invisual word recognition as studied usingEEG/MEG and fMRI. Front. Hum.Neurosci. 7:376. doi: 10.3389/fnhum.2013.00376Copyright © 2013 Chen, Davis,Pulvermüller and Hauk. This is anopen-access article distributed underthe terms of the Creative CommonsAttribution License, which permits use,distribution and reproduction in otherforums, provided the original authorsand source are credited and subject toany copyright notices concerning anythird-party graphics etc.
Frontiers in Human Neuroscience www.frontiersin.org July 2013 | Volume 7 | Article 376 | 14