Embed Size (px)
Citation preview

NCHRP Project 25-25, Task 45: Transportation Program Responses to GHG Reduction Initiatives
and Energy Reduction Programs
Requested by:
American Association of State Highway and Transportation Officials (AASHTO)
Standing Committee on the Environment
Prepared by:
Cambridge Systematics, Inc. 100 Cambridge Park Drive, Suite 400
Cambridge, Massachusetts 02140
October 2009
The information contained in this report was prepared as part of NCHRP Project 25-25, Task 45, National Cooperative Highway Research Program, Transportation Research Board.
SPECIAL NOTE: This report IS NOT an official publication of the National Cooperative Highway
Research Program, Transportation Research Board, National Research Council, or The National Academies.
Acknowledgements This study was requested by the American Association of State Highway and Transportation Officials (AASHTO), and conducted as part of the National Cooperative Highway Research Program (NCHRP) Project 25-25. The NCHRP is supported by annual voluntary contributions from the state Departments of Transportation. Project 25-25 is intended to fund quick response studies on behalf of the AASHTO Standing Committee on the Environment. The report was prepared by Christopher Porter, Evan Enarson-Hering, and John Suhrbier of Cambridge Systematics, Inc. The work was guided by a task group chaired by John Zamurs which included Kathleen Ames, Gina Campoli, Cora Cook, Gary McVoy, Phil Peevy, Jackie Ploch, Robert Kafelanos, and Mia Waters. The project was managed by Nanda Srinivasan, NCHRP Senior Program Officer. Disclaimer The opinions and conclusions expressed or implied are those of the research agency that performed the research and are not necessarily those of the Transportation Research Board or its sponsors. The information contained in this document was taken directly from the submission of the author(s). This document is not a report of the Transportation Research Board or of the National Research Council.
NCHRP Project 25-25, Task 45: Transportation Program Responses to GHG Reduction Initiatives and Energy Reduction Programs
Cambridge Systematics, Inc. i 7308.045
Table of Contents
1.0 Introduction and Summary............................................................................1-1 1.1 Review of Existing State DOT Practices ................................................1-1 1.2 Ongoing and Potential Future GHG Reduction Benefits .....................1-2 1.3 Policy Implications..................................................................................1-5
2.0 State DOT Involvement in Energy and Climate Change Planning Efforts ...............................................................................................................2-1 2.1 Overview of DOT Involvement .............................................................2-1 2.2 Detailed Discussion and Interview Findings ........................................2-5
3.0 State DOT Actions to Reduce GHG Emissions and Energy Use.....................3-1 3.1 Transportation Demand Management ..................................................3-3 3.2 Freight Demand Management ...............................................................3-7 3.3 Land Use Planning..................................................................................3-7 3.4 Pricing Strategies.....................................................................................3-9 3.5 Traffic Systems Operations...................................................................3-12 3.6 Alternative Fuels and Vehicle Technology .........................................3-16 3.7 DOT Conservation and Efficiency Efforts ...........................................3-19 3.8 Other Strategies .....................................................................................3-27
4.0 Quantifying the Benefits of State DOT Actions .........................................4-1
5.0 Policy Implications .........................................................................................5-1
A. State DOT Telephone Interview Guide..........................................................1


NCHRP Project 25-25, Task 45: Transportation Program Responses to GHG Reduction Initiatives and Energy Reduction Programs
Cambridge Systematics, Inc. iii
List of Tables
Table 1.1 Cumulative Ongoing and Potential Future GHG Reductions from DOT Actions..................................................................................1-4
Table 3.1 Responsibility for Transportation Greenhouse Gas Emission Reduction Strategies ..............................................................................3-2
Table 4.1 Baseline Transportation GHG Emissions and Forecasts (mmt CO2e) .......................................................................................................4-2
Table 4.2 Greenhouse Gas Conversion Factors for On-Road Fuels....................4-3
Table 4.3 Strategies Analyzed ...............................................................................4-5
Table 4.4 Federal Funding for TDM and Nonmotorized Programs ($Millions)a .............................................................................................4-9
Table 4.5 Calculated GHG Cost-Effectiveness Estimates by Source ................4-12
Table 4.6 Estimates of Cost-Effectiveness for Ongoing Reductions.................4-13
Table 4.7 Estimates of Ongoing GHG Reductions from State DOT TDM and Bicycle/Pedestrian Programs ......................................................4-14
Table 4.8 Assumed State DOT and Local Match Expenditures on TDM and Bicycle/Pedestrian Programs ......................................................4-14
Table 4.9 Estimates of Potential Future GHG Reductions from State DOT Demand Reduction Actions ................................................................4-15
Table 4.10 Delay-Related Fuel Use, Interstates, and Urban Freeways...............4-18
Table 4.11 GHG Reductions Due to Bottleneck Improvements .........................4-19
Table 4.12 Fuel Savings and GHG Reductions from Ongoing ITS Treatments............................................................................................4-21
Table 4.13 Additional GHG Reductions Due to ITS and Operational Deployments, 2010-2030 (mmt CO2e).................................................4-22
Table 4.14 GHG Reductions from DOT Construction and Maintenance Practices (mmt CO2).............................................................................4-28
Table 4.15 GHG Reductions from DOT and Contractor Facilities, Equipment, and Workforce Strategies (mmt CO2e) ..........................4-31
Table 4.16 Illustrative Estimates of Cumulative Ongoing and Potential Future GHG Reductions from DOT Actions (mmt CO2e) ................4-43
Table 4.17 Comparison of Methods and Key Assumptions by Strategy ...........4-44

NCHRP Project 25-25, Task 45: Transportation Program Responses to GHG Reduction Initiatives and Energy Reduction Programs
Cambridge Systematics, Inc. v
List of Figures
Figure 2.1 State Climate Change Action Plans ......................................................2-2
Figure 2.2 Results of ODOT GREEN-STEP Results for Hypothetical Policy Changes Affecting Annual C02 Emissions in Oregon .........................2-9

NCHRP Project 25-25, Task 45: Transportation Program Responses to GHG Reduction Initiatives and Energy Reduction Programs
Cambridge Systematics, Inc. 1-1
1.0 Introduction and Summary
The objectives of NCHRP Project 25-25, Task 45, Transportation Program Responses to Greenhouse Gas Reduction Initiatives and Energy Reduction Programs, are to: 1) review the strategies and actions undertaken by state departments of transportation (DOT) to reduce the greenhouse gas (GHG) emissions and energy use associated with transportation; and 2) estimate ongoing GHG reductions achieved by state DOTs as well as the potential magnitude of GHG reductions of key strategies if implemented by DOTs nationwide.
Political and public interest in climate change issues is growing rapidly and pressure is being exerted at local, regional, and state levels to develop comprehensive strategies to reduce GHG emissions and energy consumption. In response, many states developed, or are in the process of developing, statewide Climate Change Action Plans (CCAP). These plans involve a number of reduction strategies and encompass a wide range of emissions sources, including transportation. The transportation sector is responsible for nearly 30 of total nationwide greenhouse gas emissions – up to 50 percent in some states – and is widely viewed as an important sector in which significant reductions may be made. Several states also have established aggressive GHG reduction targets – as much as an 80 percent reduction from 1990 levels by 2050.
DOTs and other transportation agencies are identified as key partners in these efforts and are increasingly being asked by governments to respond with plans, policies, and programs to address climate change. DOT emission reduction strategies include responses to recommendations in statewide CCAPs that explicitly target climate change and energy use, as well as existing efforts undertaken to reduce congestion, improve system performance, and reduce vehicle travel. This research will assist the American Association of State Highway and Transportation Officials (AASHTO) in identifying effective transportation emission reduction and energy conservation strategies currently implemented or planned by state DOTs, and estimating the benefits of these strategies.
1.1 REVIEW OF EXISTING STATE DOT PRACTICES Sections 2.0 and 3.0 of this report review existing state DOT practices to conserve energy and reduce GHG emissions. To comprehensively assess the individual efforts of each state and each DOT would require an extensive and ongoing effort, as DOTs are continually updating agency plans, policies, priorities, and programs. This report focuses on describing the activities of those DOTs most engaged in climate change planning efforts and is not an exhaustive review of energy or GHG emissions reductions strategies by each DOT.
NCHRP Project 25-25, Task 45: Transportation Program Responses to GHG Reduction Initiatives and Energy Reduction Programs
1-2 Cambridge Systematics, Inc.
To evaluate the extent of energy and greenhouse gas reduction planning efforts and implemented strategies, interviews were conducted with staff from selected DOTs, and publicly available on-line resources were reviewed. The selected agencies have been actively involved in statewide climate change planning efforts and/or internal agency climate and energy initiatives. State climate change documents published on-line were reviewed to assess DOT roles and responsibilities in these processes. An inventory of strategies and actions currently being undertaken by state DOTs was compiled based on information gathered from agency web sites and supporting research materials. Information from external sources, including Federal agencies, national organizations, AASHTO, and consulting firms also was gathered. Finally, examples of direct DOT involvement in implementing each of the strategies identified in this report were generated.
The findings of the review suggest that DOTs have taken three types of actions related to GHG emissions mitigation:
1. Examining and quantifying the benefits of existing programs and actions;
2. Undertaking coordinated internal and external planning efforts to further reduce GHG emissions; and
3. Implementing emission reduction strategies.
To date, relatively few state DOTs have explicitly examined programs and policies to evaluate their potential to reduce GHG emissions and amended agency priorities to advance internal climate change initiatives. Many DOTs, however, have been active in ongoing statewide climate planning efforts. Furthermore, every state DOT promotes transportation strategies with GHG reduction potential, even though those programs may have been undertaken for other primary purposes such as congestion mitigation, air quality improvement, or operating costs savings. For example, nearly every DOT has implemented incident management systems to reduce congestion caused by incidents, or worked to improve traffic flow by coordinating traffic signals. Some DOTs are funding and supporting coordinated transportation and land use planning and long-term regional visioning efforts. Still others provide funding for transportation demand management programs or investments in public transit systems.
1.2 ONGOING AND POTENTIAL FUTURE GHG REDUCTION BENEFITS Section 4.0 of this report estimates ongoing nationwide GHG reductions as a result of current GHG actions, as well as potential additional reductions if such actions were undertaken more intensively at all state DOTs. Reductions from seven types of strategies that already have been undertaken by at least some DOTs are estimated. These strategies include:
• Travel reduction:
– Commute trip reduction; and

NCHRP Project 25-25, Task 45: Transportation Program Responses to GHG Reduction Initiatives and Energy Reduction Programs
Cambridge Systematics, Inc. 1-3
– Nonmotorized investment.
• System efficiency:
– Traffic flow improvements through bottleneck relief;
– Intelligent Transportation Systems (ITS); and
– Idle reduction.
• DOT conservation and efficiency:
– Construction materials; and
– Facilities, equipment, and workforce.
“Ongoing” reductions are presented as estimates of reductions that have been achieved, cumulative over the current decade (2000-2009), while potential future reductions are estimated as cumulative reductions from 2010 through 2030, if DOTs increased their involvement in these strategies. Both “low” and “high” estimates of potential future reductions are developed in order to create a range of plausible impacts. There is considerable uncertainty in these estimates, due to the limited information available on the level of implementation, GHG benefits of strategies, limitations to existing analysis methods, and the varying effectiveness of different projects or programs implemented in different contexts. Therefore, these estimates should be considered illustrative of what has been and could be achieved, rather than precise estimates of actual or future benefits.
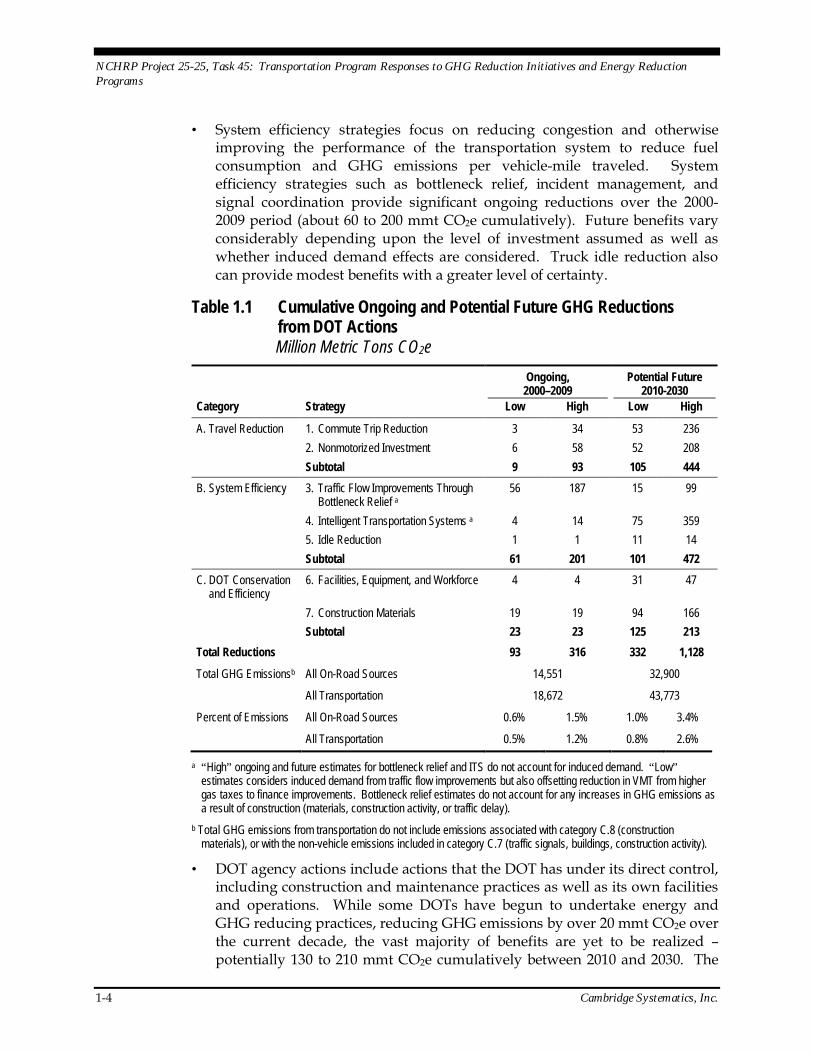
Table 1.1 shows the cumulative results from all the strategies analyzed. Ongoing reductions are estimated at from just under 100 to just over 300 million metric tons (mmt) of carbon dioxide-equivalent (CO2e) emissions cumulatively over the 2000-2009 period, depending upon analysis assumptions, while potential future reductions are estimated to be in the range of about 300 to 1,100 mmt CO2e cumulatively between 2010 and 2030. Ongoing reductions represent between 0.6 and 2.2 percent of U.S. on-road emissions and 0.5 to 1.7 percent of total U.S. transportation sector emissions over this period. Future reductions range from 1.0 to 3.4 percent of on-road emissions and 0.8 to 2.6 percent of all U.S. transportation emissions forecast over the 2010-2030 period. The range of estimates reflects uncertainty over the effectiveness of ongoing and future projects, as well as uncertainty over future investment/deployment levels for each strategy.
All of the strategies analyzed can help reduce GHG emissions, although the magnitude varies by strategy and time period. In particular:
• Travel reduction can reduce GHG emissions by shifting travelers to modes that have lower average emissions per mile than single-occupancy vehicles (e.g., ridesharing, transit), reducing vehicle trip lengths (e.g., through more compact land use patterns), or eliminating motorized trips altogether (e.g., bicycling, walking, telecommuting). Ongoing GHG reductions are estimated to be in the range of 10 to 90 mmt CO2e cumulatively over the current decade; future reductions could be significantly greater, contingent upon higher levels of investment in TDM, nonmotorized infrastructure, and land use planning.
NCHRP Project 25-25, Task 45: Transportation Program Responses to GHG Reduction Initiatives and Energy Reduction Programs
1-4 Cambridge Systematics, Inc.
• System efficiency strategies focus on reducing congestion and otherwise improving the performance of the transportation system to reduce fuel consumption and GHG emissions per vehicle-mile traveled. System efficiency strategies such as bottleneck relief, incident management, and signal coordination provide significant ongoing reductions over the 2000-2009 period (about 60 to 200 mmt CO2e cumulatively). Future benefits vary considerably depending upon the level of investment assumed as well as whether induced demand effects are considered. Truck idle reduction also can provide modest benefits with a greater level of certainty.
Table 1.1 Cumulative Ongoing and Potential Future GHG Reductions from DOT Actions Million Metric Tons CO2e
Ongoing,
2000–2009 Potential Future
2010-2030 Category Strategy Low High Low High
A. Travel Reduction 1. Commute Trip Reduction 3 34 53 236 2. Nonmotorized Investment 6 58 52 208 Subtotal 9 93 105 444 B. System Efficiency 3. Traffic Flow Improvements Through
Bottleneck Relief a 56 187 15 99
4. Intelligent Transportation Systems a 4 14 75 359 5. Idle Reduction 1 1 11 14 Subtotal 61 201 101 472 C. DOT Conservation
and Efficiency 6. Facilities, Equipment, and Workforce 4 4 31 47
7. Construction Materials 19 19 94 166 Subtotal 23 23 125 213 Total Reductions 93 316 332 1,128
Total GHG Emissionsb All On-Road Sources 14,551 32,900
All Transportation 18,672 43,773
Percent of Emissions All On-Road Sources 0.6% 1.5% 1.0% 3.4%
All Transportation 0.5% 1.2% 0.8% 2.6%
a “High” ongoing and future estimates for bottleneck relief and ITS do not account for induced demand. “Low” estimates considers induced demand from traffic flow improvements but also offsetting reduction in VMT from higher gas taxes to finance improvements. Bottleneck relief estimates do not account for any increases in GHG emissions as a result of construction (materials, construction activity, or traffic delay).
b Total GHG emissions from transportation do not include emissions associated with category C.8 (construction materials), or with the non-vehicle emissions included in category C.7 (traffic signals, buildings, construction activity).
• DOT agency actions include actions that the DOT has under its direct control, including construction and maintenance practices as well as its own facilities and operations. While some DOTs have begun to undertake energy and GHG reducing practices, reducing GHG emissions by over 20 mmt CO2e over the current decade, the vast majority of benefits are yet to be realized – potentially 130 to 210 mmt CO2e cumulatively between 2010 and 2030. The
NCHRP Project 25-25, Task 45: Transportation Program Responses to GHG Reduction Initiatives and Energy Reduction Programs
Cambridge Systematics, Inc. 1-5
greatest single benefit within this category may be realized from the use of fly ash in portland cement, which reduces the energy associated with cement production. Warm-mix asphalt, building energy efficiency, and anti-idling policies also have the potential for additional GHG reduction benefits.
While the reductions estimated in this report may seem modest compared to total transportation GHG emissions nationwide, they nevertheless represent an important step towards addressing climate change. Furthermore, they only reflect actions that already have been undertaken to some extent by state DOTs, and for which estimates of benefits could be developed. State DOTs also may play a role in other actions, such as transit investment and road pricing, which could have additional GHG reduction benefits. Finally, most strategies have significant cobenefits (such as increased mobility, reduced delay, improved air quality, or improved public health) and therefore may be worth implementing for reasons other than their energy or GHG reduction benefits alone.
1.3 POLICY IMPLICATIONS As discussed in Section 5.0 of this report, all of the transportation emission reduction strategies described above can be implemented by state DOTs under existing authority and funding structures – and already have been to some extent, as documented under “ongoing reductions.” Policy changes, however, could potentially provide greater reason for DOTs to undertake these actions. In addition, broader implementation of these strategies across all states could be supported by policy guidance and/or technical assistance from national organizations.
The following are some of the key policy actions that might help to increase the implementation of GHG reducing strategies by state DOTs:
• Travel Reduction – State DOTs have primarily funded travel reduction through the Federal Congestion Mitigation and Air Quality Improvement (CMAQ) program, as well as other Federal and state sources such as the Recreational Trails program, the Surface Transportation Program (STP), and state funds. New funding sources could be identified at the state-level, or State DOTs could allocate a larger proportion of existing funds to these activities. Travel reduction also can be encouraged through policy changes, such as the adoption of “complete streets” policies or otherwise revised design practices to ensure that all modes are accommodated in future street construction and reconstruction.
• System Efficiency – Bottleneck relief and traffic management can be funded through existing Federal and state transportation funding sources. As with travel reduction strategies, the key issues involve: 1) identifying adequate funds; and 2) prioritizing these funds towards GHG–reducing activities. State DOTs may be able to leverage scarce resources by providing funding and technical support for traffic management by local jurisdictions (e.g., to support ongoing signal retiming); as well as supporting interjurisdictional
NCHRP Project 25-25, Task 45: Transportation Program Responses to GHG Reduction Initiatives and Energy Reduction Programs
1-6 Cambridge Systematics, Inc.
coordination efforts, led by the state DOT or an MPO, to implement regionwide traffic management approaches. State DOTs also can work with truck stop owners and operators to implement idle reduction technology.
• DOT Agency Actions – Construction practices can be directly affected by DOT requirements for materials, contractor operations practices, etc. Regarding construction materials, including fly ash or other recycled materials in cement, as well as warm-mix asphalt, DOTs may need to take individual initiative to demonstrate the feasibility and cost differential (if any) of these materials in their state, and to revise construction material specifications to require the use of these materials. They can require other emission reduction practices to be implemented by construction contractors, such as reduced idling and improved equipment maintenance, as well as implementing such practices for their own equipment. State DOTs also could impose energy efficiency standards when they construct new buildings or renovate older ones, as well as adopt fleet practices such as purchasing energy-efficient or alternative fuel vehicles, or using biodiesel in existing vehicles.1
1 It is uncertain as to whether corn ethanol or biodiesel made from soybeans produce any
net GHG benefits, once indirect effects such as indirect land use change associated with agricultural production practices are considered (see discussion in Section 4.C).
NCHRP Project 25-25, Task 45: Transportation Program Responses to GHG Reduction Initiatives and Energy Reduction Programs
Cambridge Systematics, Inc. 2-1
2.0 State DOT Involvement in Energy and Climate Change Planning Efforts
There is growing interest in coordinating climate change mitigation and adaptation responses of local, regional, and state agencies from a statewide perspective. The involvement of state DOTs in these efforts was assessed through a review of existing literature and Internet sites, as well as through focused discussions with a small sample of state DOTs.
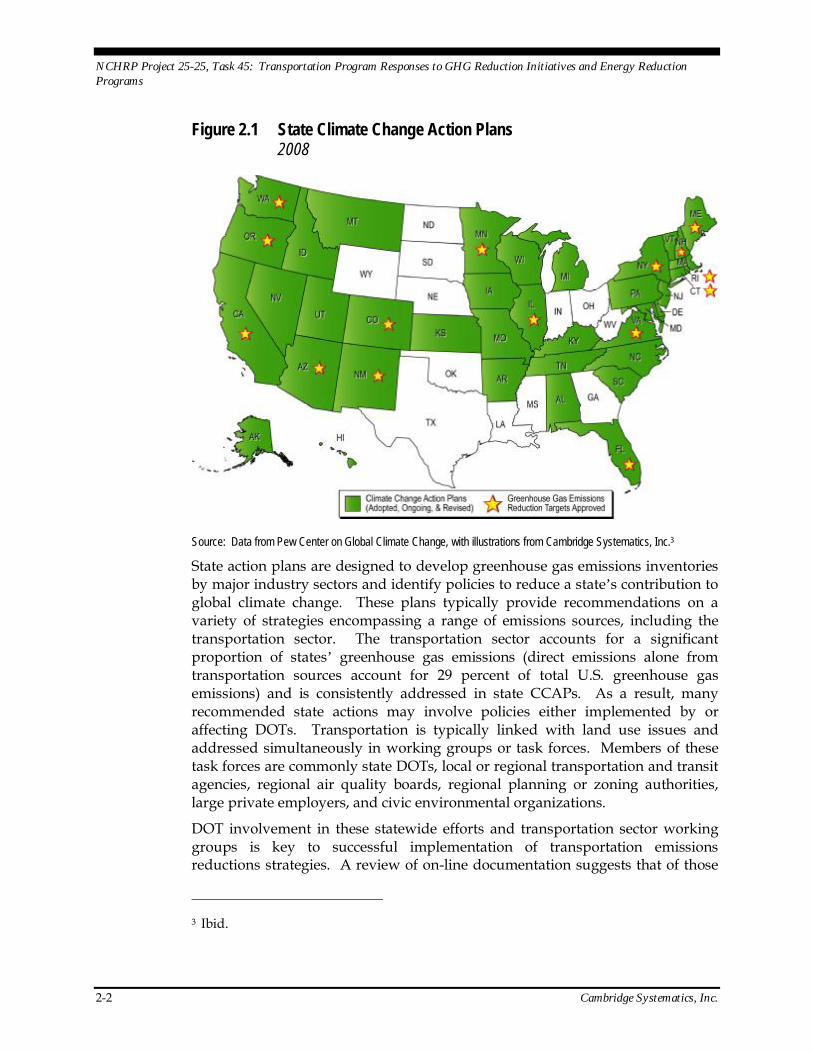
2.1 OVERVIEW OF DOT INVOLVEMENT As of the fall of 2008, 38 states had developed, or were in the process of developing, statewide Climate Change Action Plans (CCAP) to provide recommendations and set targets for reducing growth in greenhouse gas emissions. Of those states, 28 had established structured and ongoing advisory groups, and 19 had adopted greenhouse gas emissions reduction targets.2 These planning efforts are often gubernatorial-mandated and result in the adoption of a recommended action plan or report to the state Legislature. Processes have been championed by organizations such as the Center for Climate Strategies, Center for Clean Air Policy, and The Pew Center on Global Climate Change, as well as the U.S. Department of Transportation and Environmental Protection Agency. Typically, a mix of public and private stakeholders is selected to an advisory council, which receives input from sector task forces and provides policy recommendations for state agencies or legislative rulemaking. Ongoing Climate Action Teams and or subgroups may continue to meet to provide annual progress updates or explore the feasibility and implementation requirements of recommended policies.
2 Pew Center on Global Climate Change, “State Actions.” Web page accessed October 17,
2008. Available on-line at: http://www.pewclimate.org/what_s_being_done/in_the_states/action_plan_map.cfm.
NCHRP Project 25-25, Task 45: Transportation Program Responses to GHG Reduction Initiatives and Energy Reduction Programs
2-2 Cambridge Systematics, Inc.
Figure 2.1 State Climate Change Action Plans 2008
Source: Data from Pew Center on Global Climate Change, with illustrations from Cambridge Systematics, Inc.3
State action plans are designed to develop greenhouse gas emissions inventories by major industry sectors and identify policies to reduce a state’s contribution to global climate change. These plans typically provide recommendations on a variety of strategies encompassing a range of emissions sources, including the transportation sector. The transportation sector accounts for a significant proportion of states’ greenhouse gas emissions (direct emissions alone from transportation sources account for 29 percent of total U.S. greenhouse gas emissions) and is consistently addressed in state CCAPs. As a result, many recommended state actions may involve policies either implemented by or affecting DOTs. Transportation is typically linked with land use issues and addressed simultaneously in working groups or task forces. Members of these task forces are commonly state DOTs, local or regional transportation and transit agencies, regional air quality boards, regional planning or zoning authorities, large private employers, and civic environmental organizations.
DOT involvement in these statewide efforts and transportation sector working groups is key to successful implementation of transportation emissions reductions strategies. A review of on-line documentation suggests that of those
3 Ibid.

NCHRP Project 25-25, Task 45: Transportation Program Responses to GHG Reduction Initiatives and Energy Reduction Programs
Cambridge Systematics, Inc. 2-3
states with statewide, stakeholder-based planning processes, DOTs participated in decision support roles in 20 cases, or just over half. (This does not mean that the DOT had authority to determine transportation strategies, targets, etc., but rather they participated in decision-making regarding these issues.)
In the majority of those states, a DOT agency executive was represented in a voting capacity on advisory committees with final decision-making responsibility for recommendations contained within a state’s CCAP. DOT involvement in the formation of recommendations has been primarily limited to voluntary staff participation in technical working groups. DOTs have contributed transportation data and staff resources to state greenhouse gas inventories, but generally have not been involved in the generation of emissions reductions recommendations for the transportation sector or analysis. Below are a few known examples of statewide climate change planning processes:
• California Climate Change Action Team (CAT) – In 2005, the Governor of California, through executive order, established the CAT to coordinate state actions implementing global warming emission reduction programs and reporting on progress toward meeting established statewide greenhouse gas targets. The group is made up of decision-makers from various state boards and departments led by the Secretary of the California Environmental Protection Agency and includes the Secretary of the Business, Transportation, and Housing Agency, as well as other state and regional agencies. The Team is organized into 11 subgroups, nine of which address specific economic sectors, and two that analyze broad issues related to climate change. In 2006, the CAT issued a first report, outlining more than 40 strategies (including transportation strategies) to reduce greenhouse gas emissions.
• Washington Climate Change Challenge Advisory Team (CAT) – In 2007, the Governor of Washington established the CAT to provide input on the policies and strategies necessary to respond to global climate change. The CAT continues in 2008 to refine the comprehensive recommendations developed earlier into targeted specific policies and actions to meet the climate change goals established by the State Legislature and Governor. The Washington Department of Transportation is not represented in the CAT leadership body, but is involved in the technical working groups. The CAT supports five technical working groups that address issues of transportation; energy supply; agriculture, forestry, and residential; commercial; and industrial issues.
• Florida Action Team on Energy and Climate – In 2007, the Governor of Florida created the Governor’s Action Team on Energy and Climate to draft a Florida Climate Change Action Plan. The plan includes recommendations for strategies to reduce emissions and proposed legislation. The team consists of 27 members, and does not include the Florida Department of Transportation (FDOT). The team supports six technical working groups, including Transportation and Land Use, of which the DOT is a member.
NCHRP Project 25-25, Task 45: Transportation Program Responses to GHG Reduction Initiatives and Energy Reduction Programs
2-4 Cambridge Systematics, Inc.
Beyond climate change planning efforts, many states also have undertaken greening government and sustainability initiatives. These efforts include the adoption of state energy and resource conservation mandates or state vehicle fleet fuel efficiency requirements. DOTs have supported statewide efforts for energy conservation by implementing actions and policies to reduce energy use among state personnel, maintenance vehicles, and facilities, as well as general resource efficiency. Below are a few known examples:
• Vermont Agency of Transportation (VTrans) – In 2008, and in accordance with state statute, VTrans completed an annual update to the State Agency Energy Implementation Plan. This document includes a comprehensive energy audit of the agency’s operations, facilities, and fleets that identifies steps to meet energy consumption reduction standards.4
• Washington Department of Transportation (WSDOT) – The Department, through a state-prescribed system, is required to update an annual sustainability action plan to incorporate sustainable business practices into agency practices. This plan highlights trends in resource use, identifies policies implemented, and target goals in the areas of fuel-efficiency, energy use, waste management, and toxic chemicals.5
• Oregon Department of Transportation (ODOT) – In 2004, the Department created a Sustainability Program with dedicated staff and resources to manage assets and incorporate sustainable practices into its operations. ODOT is updating its 2004 Sustainability Strategic Plan to include long- and short-term goals and strategies, as well as performance indicators to track agency progress. Sustainability concepts have been integrated into updates of the Oregon Transportation Plan and the State Bridge Repair Program, and an environmental management system has been developed to better manage materials used in maintenance activities.6
• Colorado Department of Transportation (CDOT) – Building off state greening government initiatives, the Department has instituted a sustainability program within the Environmental Programs Branch to promote concepts of sustainability within department operations, including waste minimization, reuse, recycling, resource conservation, and environmental stewardship. The Division of Transportation Development
4 Vermont Transportation Agency, “2007-2008 State Agency Energy Implementation
Plan.” Document provided to Cambridge Systematics, Inc. by VTrans staff. 5 Washington Department of Transportation, “2007 Sustainability Plan, and Progress
Report.” October 2007. Available on-line at http://www.wsdot.wa.gov/NR/rdonlyres/0B4201A0-9D14-412F-8EA6-85E69A3A928C/0/SPPR10152007.pdf.
6 Oregon Department of Transportation. Sustainability Program web page, “About Us” accessed September 2008. Available on-line at http://www.oregon.gov/ODOT/SUS/about_us.shtml.
NCHRP Project 25-25, Task 45: Transportation Program Responses to GHG Reduction Initiatives and Energy Reduction Programs
Cambridge Systematics, Inc. 2-5
has proposed instituting an Environmental Management System plan to minimize adverse impacts of the division activities and that focus sustainability efforts on areas such as transportation, agency-purchasing, energy, resource, and water conservation, and waste minimization.7
2.2 DETAILED DISCUSSION AND INTERVIEW FINDINGS To further assess the extent of agency involvement in issues of climate change and to supplement the information that could be obtained through review of published documents, a selective sample of DOTs was contacted in the fall of 2008 for focused discussions. States interviewed included Maryland, Michigan, Oregon, Vermont, and Washington. (Attempts made to contact several other states were unsuccessful). Interviews were conducted with DOT staff who were directly involved in statewide planning efforts and were often specialists in public affairs and policy, environment and air quality, or transportation planning. Cambridge Systematics staff interviewed department contacts by telephone in confidential discussions following a consistent format (Appendix A of this report contains the interview template). The final report for NCHRP Project 20-24 Task 598 also provides some insights into state DOT involvement in state climate action planning efforts.
Findings from these interviews and from a detailed review of on-line documents and information are presented below, according to the following three major topical areas covered in the interviews:
1. DOT internal and external involvement in climate change planning efforts;
2. DOT assessment of transportation emissions reduction strategies and program impact analysis; and
3. DOT transportation emissions reduction programs, policies, or action currently under implementation or planning.
7 Colorado Department of Transportation. “Proposed Work Plan to Develop and
Implement an Environmental Management System for CDOT.” Prepared by the AASHTO Center for Environmental Excellence, February 2006. Draft available on-line at http://www.dot.state.co.us/environmental/Hazardous/docs/EMSDTDOfficePlanFocusDraft22806.pdf.
8 Burbank, C. and H. Kassoff (2008). Strategies for Reducing the Impacts of Surface Transportation on Global Climate Change: A Synthesis of Policy Research and State and Local Mitigation Strategies. Prepared by Parsons Brinckerhoff under National Cooperative Highway Research Program Project 20-24, Task 59.
NCHRP Project 25-25, Task 45: Transportation Program Responses to GHG Reduction Initiatives and Energy Reduction Programs
2-6 Cambridge Systematics, Inc.
DOT Internal and External Involvement in Climate Change Planning Efforts
Internal Initiatives With several exceptions, state DOTs have generally not been engaged in internal planning initiatives or have created formally organized decision-making bodies to address issues of climate change. Of those DOTs with internal initiatives, most have not grown organically from within the agency, but rather emerged in response to statewide efforts, executive orders, and legislative action. However, DOTs actively participating in statewide efforts indicated a degree of internal support for future action from agency executives, as well as significant personal and professional interest among staff. Several examples of states with well established internal initiatives include California, New York, Oregon, and Washington. The activities of these states are detailed in later sections of this report. Furthermore, the landscape in this area is changing fast as of the writing of this report, with Federal action increasing, many states move forward with implementing Climate Action Plans, and transportation agencies increasingly undertaking GHG reduction strategy development and analysis.
The primary reasons cited for the lack of internal initiatives include:
• Constrained staff resources and limited agency influence. Even among those states with active internal support, there is limited dedicated staff or funding for climate change work. Many agencies have relied on voluntary participation from staff to send representatives to external statewide efforts or create internal initiatives.
• Focus of DOT priorities remains on traditional issues such as maintenance and capacity. Agency priorities are slowly being retooled to analyze and promote existing transportation strategies in terms of GHG emissions, such as transportation demand management, asset management, and system operations improvements. DOT staff suggested that agencies are beginning to examine priorities for transportation spending and project development that incorporate climate change considerations, but change is slow to occur. There is recognition that agencies must be able to respond to increased public awareness and promotion of climate change issues from within participatory transportation planning processes.
• Program assessment criteria are based on traditional measures of cost-effectiveness rather than greenhouse gas reduction impacts. Agencies tend to evaluate programs based on traditional cost and benefit metrics such as dollar value, travel-time savings, or crash reductions. Interviewees indicated that as public concern and state involvement in environmental issues increases, more programs will be presented, justified, evaluated, and funded based on climate change and greenhouse gas emissions reduction potential.

NCHRP Project 25-25, Task 45: Transportation Program Responses to GHG Reduction Initiatives and Energy Reduction Programs
Cambridge Systematics, Inc. 2-7
External Efforts DOT involvement in climate change issues has generally come in response to external statewide efforts or legislative mandates. Two issues were notably dominant among interviewees: first, that DOT participation in statewide efforts was generally limited; and second, that the resulting recommendations for the transportation sector did not necessarily reflect agency input. Interviewees expressed frustration with some aspects of these intensive statewide planning efforts, citing lack of communication, saliency of strategies presented, and inconsistencies in quantification of potential emissions reductions.
External efforts in a number of states have constituted large-scale, heavily structured, stakeholder-based processes, often mediated by organizations such as the Center for Climate Strategies. Among many agencies participating in these efforts, representation on decision-making bodies and early engagement with the agency was generally viewed as limited. Interviewees expressed interest in greater participation in climate working groups, in formulating recommendations, and greater involvement in studying and implementing recommendations.
• For example, based on a review completed for this report, of the 38 states with statewide climate change planning efforts, DOTs were directly involved in over half of the efforts, or in 20 states. Of those states, in 15 instances, the agency secretary was a member of the executive committee charged with crafting final recommendations for that State’s climate action plan. In five states with executive committees that were predominantly composed of private or civic interests, DOTs were involved only in subcommittees. In most cases, DOT staff has been significantly involved in working groups and task forces examining transportation and land use issues, by contributing data, resources, and input to strategy recommendations.
In terms of implementation, in many states, the transportation emissions reductions strategies put forth for the transportation sector involve policies that may not fall directly under a DOT’s control. For example, vehicle emissions standards are likely to be implemented by regional air quality boards or be legislatively approved; pay-as-you-drive automobile insurance programs are governed by Departments of Finance, Administrative Services, or other regulatory agencies; and anti-idling ordinances must be enacted by local governments or Departments of Environment. Many previously existing DOT programs, strategies, and policies that effectively reduce vehicle-miles traveled (VMT) or improve the efficiency of the transportation system were not recommended for expansion or additional funding, and their impacts were not quantified in statewide climate action plans.
• For example, California’s Climate Action Team includes 15 subgroups dedicated to a variety of issues, including Economics, Environmental Justice, Green Buildings, State Vehicle Fleet, and Land Use. Caltrans is the lead agency for only the Cement Subgroup, which is tasked to address reductions
NCHRP Project 25-25, Task 45: Transportation Program Responses to GHG Reduction Initiatives and Energy Reduction Programs
2-8 Cambridge Systematics, Inc.
in GHG emissions related to cement production, and is partially involved in only the Land Use Subgroup. Instead, the California Energy Commission is the regulatory agency tasked with developing strategies for the following transportation-related programs: Alternative and Renewable Fuel and Vehicle Technology, California Fuel Cell Partnership, Clean Cities Program, Fuel Efficient Tires, Fuel Temperature Delivery Study, Heavy-Duty Advanced Technology Development, School Bus Demonstration Projects, and Truck Stop Electrification Programs.
DOT Assessment of Transportation Emissions Reduction Strategies and Program Impact Analysis A common finding across all interviews was that DOTs were not consistently involved in the evaluation and quantification of the greenhouse gas emissions reductions impacts of transportation strategies or projects. Some DOTs cited lack of staff resources, others pointed towards the absence of a standardized national emissions accounting methodology, and others did not see the value of interpreting program impacts in terms of GHG reductions. Washington, California, and Oregon are examples of leaders in this area, producing GHG assessments of environmentally responsive programs and estimating the effects of transportation policies.
• In particular, the Oregon DOT is developing a model for estimating the GHG reduction potential of policy proposals for the Land Use and Transportation Subcommittee of Oregon’s Global Warming Commission. The impetus for developing such a tool grew out of state and DOT recognition that the impacts of climate change policy proposals on VMT, local economies, and land development patterns were largely unknown.
This sketch-planning model is known as the Greenhouse Gas Statewide Transportation Emissions Planning model (Green-STEP) and is designed to estimate the effects of policy changes on factors that influence GHG emissions, including: metropolitan population densities and relative amounts of urban and rural development; capacity and use of transit service and highways; use of alternative fuel or technology vehicles, vehicle fuel efficiency, and future market share of efficient automobiles; the carbon content of fuels and fuel costs; potential VMT-based fees and other vehicle charges that may be levied; and greenhouse gas emissions from electrical power generation.
The model tests the sensitivity of outputs (e.g., VMT and GHG growth rates) to policy inputs (e.g., increasing fuels costs, increasing vehicle efficiency). In one hypothetical test run, a reference scenario with baseline projected figures for urban and rural growth rates, transit miles, highway miles, fuel costs, and fuel efficiency was compared to three alternative scenarios. The first scenario modeled the effects of changes in taxation policy and market prices that effectively raised fuel costs over time to a maximum of $13 per gallon by 2040. The second scenario modeled policy changes and market characteristics that may increase the fuel efficiency of automobiles to 60 miles per gallon (mpg)
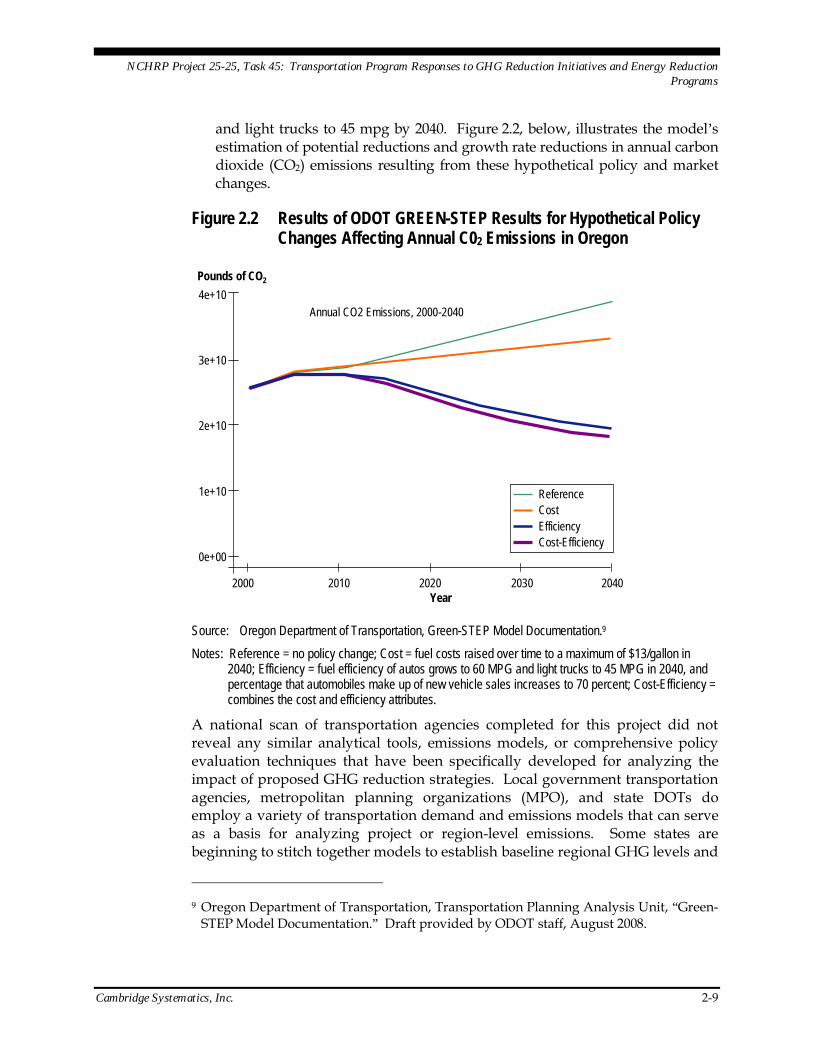
NCHRP Project 25-25, Task 45: Transportation Program Responses to GHG Reduction Initiatives and Energy Reduction Programs
Cambridge Systematics, Inc. 2-9
and light trucks to 45 mpg by 2040. Figure 2.2, below, illustrates the model’s estimation of potential reductions and growth rate reductions in annual carbon dioxide (CO2) emissions resulting from these hypothetical policy and market changes.
Figure 2.2 Results of ODOT GREEN-STEP Results for Hypothetical Policy Changes Affecting Annual C02 Emissions in Oregon
Pounds of CO2
Annual CO2 Emissions, 2000-2040
2000 2010 2020 2030 2040Year
0e+00
1e+10
2e+10
3e+10
4e+10
ReferenceCostEfficiencyCost-Efficiency
Source: Oregon Department of Transportation, Green-STEP Model Documentation.9 Notes: Reference = no policy change; Cost = fuel costs raised over time to a maximum of $13/gallon in
2040; Efficiency = fuel efficiency of autos grows to 60 MPG and light trucks to 45 MPG in 2040, and percentage that automobiles make up of new vehicle sales increases to 70 percent; Cost-Efficiency = combines the cost and efficiency attributes.
A national scan of transportation agencies completed for this project did not reveal any similar analytical tools, emissions models, or comprehensive policy evaluation techniques that have been specifically developed for analyzing the impact of proposed GHG reduction strategies. Local government transportation agencies, metropolitan planning organizations (MPO), and state DOTs do employ a variety of transportation demand and emissions models that can serve as a basis for analyzing project or region-level emissions. Some states are beginning to stitch together models to establish baseline regional GHG levels and
9 Oregon Department of Transportation, Transportation Planning Analysis Unit, “Green-
STEP Model Documentation.” Draft provided by ODOT staff, August 2008.
NCHRP Project 25-25, Task 45: Transportation Program Responses to GHG Reduction Initiatives and Energy Reduction Programs
2-10 Cambridge Systematics, Inc.
identify the GHG emissions associated with regional plans or project alternatives. However, these models are primarily oriented towards analyzing major capacity expansion projects and are not well suited for many of the traffic operations, land use, road-pricing, or demand management strategies that can be employed. The state of practice in GHG analysis tools is investigated in more detail in a 2006 NCHRP report.10
Those states that have developed greenhouse gas emissions inventories or quantified the benefits of programs and policies have relied primarily on estimates from external organizations prepared for state CAP processes or have employed existing travel demand forecasting models to estimate emissions related to VMT reductions. However, interviewees believed that transportation emissions reductions estimates prepared for many of the state CAP processes by national organizations were likely overstated, inconsistent, or improbable. Agencies expressed the desire for a nationally consistent methodology to estimate the emissions impacts of transportation and land use strategies, perhaps originating from the FHWA or the EPA.
DOT Implemented or Planned Transportation Emissions Reduction Policies, Programs, or Actions There was consensus among interviewees that agencies generally were not considering additional transportation policies and programs solely for potential GHG emissions reductions, though those impacts were increasingly being considered and publicized. Programs that result in secondary emissions benefits continue to be justified and funded primarily on cost-effectiveness and efficiency grounds, or to meet stated goals of slowing growth in VMT rates. There was consistent recognition of the importance of addressing climate change and evaluating transportation strategies for emissions reductions benefits. Agencies suggested that increased public input and attention to these issues in long-range planning efforts would accelerate DOTs’ climate change efforts and strategic priorities.
• For example, several DOTs have recently enacted or expanded ridesharing, employer-provided carpooling, and other TDM programs in response to customer demand for additional travel options as a result of a short-term sharp increase in fuel prices in the fall of 2008. Michigan DOT provided additional carpooling services through a partnership with a major private grocery chain to utilize existing parking capacity for park-and-ride facilities. VTrans is working with major employers to provide additional vanpooling and ridesharing options for commuters traveling to dense employment centers in rural areas, such as resorts and industrial parks.
10 ICF Consulting (2006). Assessment of Greenhouse Gas Analysis Techniques for
Transportation Projects. Prepared for AASHTO through NCHRP Project 25-25 Task 17.
NCHRP Project 25-25, Task 45: Transportation Program Responses to GHG Reduction Initiatives and Energy Reduction Programs
Cambridge Systematics, Inc. 2-11
Outcomes of several state CAPs included stated goals to reduce future growth rates in VMT, though Washington is the only State to mandate and provide enforcement mechanisms for a VMT-growth reduction target. The Washington Legislature enacted a bill targeting a 50 percent reduction in annual VMT per capita by 2050.11 The act requires the DOT to engage in a collaborative process with partners to develop strategies, evaluate new revenue sources, and report progress towards meeting this goal. WSDOT’s perspective is that for the agency to achieve the objectives of this bill would require significant investment and broad development of various trip reduction programs, system improvements, active transportation management, and alternative pricing systems. Additional funding sources are not appropriated in the bill, nor are enforcement mechanisms or consequences of not attaining per capita VMT reductions firmly established.
11 Washington State Legislature, 60th Session “A Bill Providing a Framework for Reducing
Greenhouse Gas Emissions in the Washington Economy.” Second Substitute House Bill 2815-2007-08. Signed by Governor March 13, 2008.

NCHRP Project 25-25, Task 45: Transportation Program Responses to GHG Reduction Initiatives and Energy Reduction Programs
Cambridge Systematics, Inc. 3-1
3.0 State DOT Actions to Reduce GHG Emissions and Energy Use
To assess the extent of current and planned DOT actions resulting in greenhouse gas emissions reductions, an inventory of strategies was completed based on a review of state DOT web sites, as well as other information and research from Federal agencies, national organizations, AASHTO, and other sources. A brief summary of each strategy is included along with an example of direct DOT involvement, including programs and policies, in implementing each strategy. This review focused particularly on those states and agencies with climate change planning efforts that were well documented and published on-line. As a result, the information presented in this section is selective and not representative of the actions and involvement of all state DOTs.
In general, DOTs have undertaken GHG reduction strategies falling under three broad motivations, including:
1. Strategies specifically aimed at GHG emissions reductions and energy conservation;
2. Strategies undertaken previously for purposes such as congestion management, air quality improvements, and operating costs savings, but that are now being reviewed or associated with greenhouse gas emissions reduction potential; and
3. Supporting initiatives led by other state agencies to reduce GHG emissions and improve energy conservation, such as vehicle efficiency and low-carbon fuel standards.
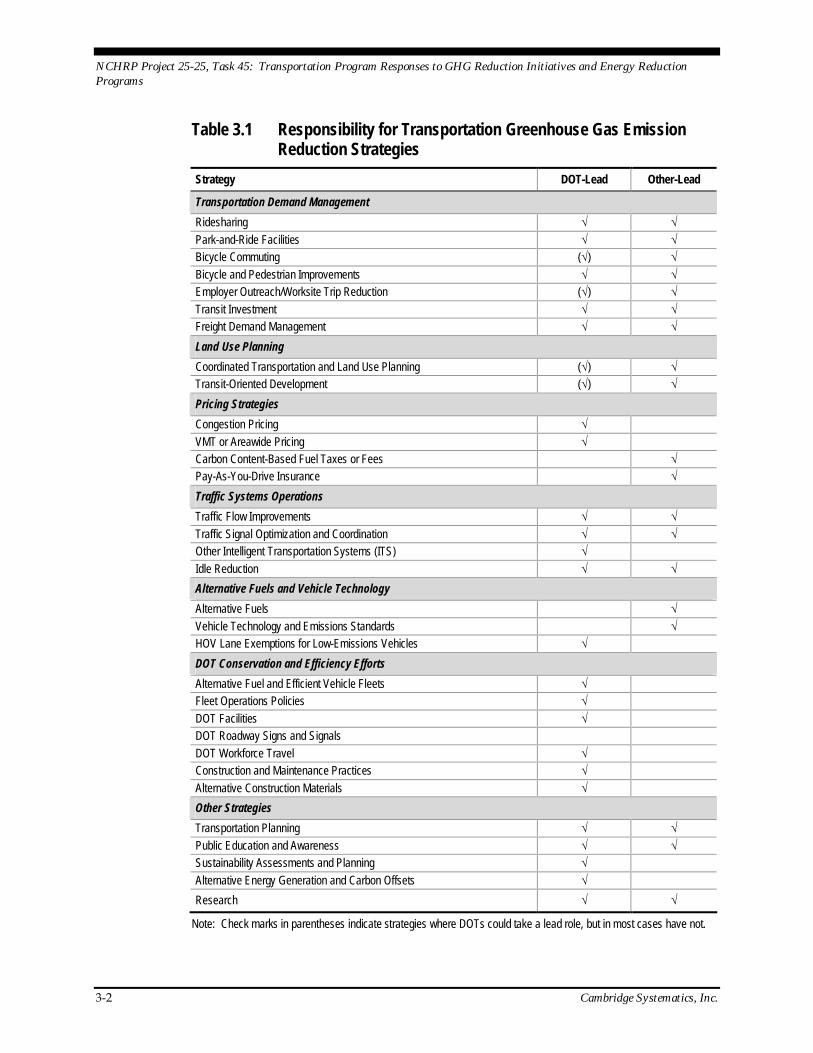
The transportation emissions reductions strategies identified can be organized broadly by the lead agency charged with implementation (Table 3.1). Responsibility for many of these strategies may be shared by DOTs with local, regional, state, and Federal agencies, and relatively few fall under a single domain.
NCHRP Project 25-25, Task 45: Transportation Program Responses to GHG Reduction Initiatives and Energy Reduction Programs
3-2 Cambridge Systematics, Inc.
Table 3.1 Responsibility for Transportation Greenhouse Gas Emission Reduction Strategies
Strategy DOT-Lead Other-Lead
Transportation Demand Management Ridesharing √ √ Park-and-Ride Facilities √ √ Bicycle Commuting (√) √ Bicycle and Pedestrian Improvements √ √ Employer Outreach/Worksite Trip Reduction (√) √ Transit Investment √ √ Freight Demand Management √ √ Land Use Planning Coordinated Transportation and Land Use Planning (√) √ Transit-Oriented Development (√) √ Pricing Strategies Congestion Pricing √ VMT or Areawide Pricing √ Carbon Content-Based Fuel Taxes or Fees √ Pay-As-You-Drive Insurance √ Traffic Systems Operations Traffic Flow Improvements √ √ Traffic Signal Optimization and Coordination √ √ Other Intelligent Transportation Systems (ITS) √ Idle Reduction √ √ Alternative Fuels and Vehicle Technology Alternative Fuels √ Vehicle Technology and Emissions Standards √ HOV Lane Exemptions for Low-Emissions Vehicles √ DOT Conservation and Efficiency Efforts Alternative Fuel and Efficient Vehicle Fleets √ Fleet Operations Policies √ DOT Facilities √ DOT Roadway Signs and Signals DOT Workforce Travel √ Construction and Maintenance Practices √ Alternative Construction Materials √ Other Strategies Transportation Planning √ √ Public Education and Awareness √ √ Sustainability Assessments and Planning √ Alternative Energy Generation and Carbon Offsets √ Research √ √
Note: Check marks in parentheses indicate strategies where DOTs could take a lead role, but in most cases have not.
NCHRP Project 25-25, Task 45: Transportation Program Responses to GHG Reduction Initiatives and Energy Reduction Programs
Cambridge Systematics, Inc. 3-3
3.1 TRANSPORTATION DEMAND MANAGEMENT Broadly, transportation demand management (TDM) refers to a variety of strategies to reduce vehicle travel for commuters and other travelers, including the promotion of public transit; ridesharing and vanpools; bicycling or walking; as well as the introduction of off-peak scheduling or telecommuting incentives; and compressed or flexible working hours. Although most individual demand management strategies affect a small proportion of total travel, the cumulative impacts of TDM programs may result in significant reductions in congestion, vehicle-miles traveled and, therefore, greenhouse gas emissions.
Ridesharing Rideshare programs provide options for regularly scheduled commuting to and from employment sites or central business districts. Carpooling coordination programs (e.g., ride-matching support, outreach, incentives) may be organized by state or regional agencies, local governments, or business or nonprofit groups such as Transportation Management Associations (TMA). Vanpool programs are often organized by employers, TMAs, or state or regional agencies and charge nominal fees to users or may be subsidized by employers. Vanpooling is particularly suitable for longer commutes or groups of employees traveling to the same site, such as business parks. A majority of states have rideshare coordination programs in place, though effectiveness and commuter use varies significantly.
Vermont Agency of Transportation (VTrans) – VTrans’ official web site, Go Vermont, is set up to connect commuters with alternative travel options to “save money and reduce their carbon footprint” by coordinating all state ridesharing information.12 In interviews conducted for this project, VTrans staff suggested that private employers’ interest in vanpool programs increased significantly in 2008, partially in response to demand from workers seeking to offset relatively high fuel prices and in part as an employer-provider benefit to attract and retain employees. Vermont is particularly well suited for ridesharing as it has many dense employment centers (business parks, recreation resorts, and city centers) located significant distances from employees’ homes, and relatively few transit options. As part of the agency’s 2008 Climate Action Plan,13 VTrans is implementing a new sophisticated, self-serve software application for rideshare coordination that shares a database for commuters in Vermont, New Hampshire, and Maine. The agency also is streamlining program requirements and investing
12 Vermont Agency of Transportation, “Go Vermont.” Web page accessed November 24,
2008. Available on-line at: http://www.connectingcommuters.org. 13 Vermont Agency of Transportation, “VTrans Climate Change Action Plan.” June 2008.
Available on-line at: http://www.aot.state.vt.us/planning/Documents/Planning/VTransClimateActionPlanfinal1.pdf.
NCHRP Project 25-25, Task 45: Transportation Program Responses to GHG Reduction Initiatives and Energy Reduction Programs
3-4 Cambridge Systematics, Inc.
in marketing initiatives to promote commute alternatives. There is no impact data available for VTrans coordinate ridesharing programs.
Connecticut Department of Transportation (ConnDOT) – A primary transportation strategy recommendation included in Connecticut’s 2005 Climate Change Action Plan was the State’s expansion of ridesharing programs through a “2 Million-Mile Rideshare Challenge.” This initiative utilizes NuRide Inc., a private on-line matching program to arrange ridesharing trips. The State’s 2006 Climate Change Progress Report indicated the program’s successful registration of over 3,000 commuters, 68 percent of whom are new to carpooling and transit users. In that year, over 2.8 million passenger miles were reduced through the program, resulting in the reduction of 1,250 tons of greenhouse gases from the state baseline.14
Park-and-Ride Facilities Many state DOTs or local transit agencies provide park-and-ride facilities at transit terminals, major highway access points, or other central locations, particularly in suburban areas. Parking at these collection points is generally free or at lower cost than in urban centers and is intended to increase use of public transit and rideshare programs. While many states have park-and-ride-based transit services, most are operated by local or regional transit agencies and not directly under the control of state DOTs.
New Mexico Department of Transportation – The New Mexico DOT manages the operation of park-and-ride facilities with intercity bus service during weekday peak periods. New Mexico Park-and-Ride is the State’s fourth largest bus transit system, with over 300,000 passenger trips in fiscal year 2007. In addition, fixed-route shuttle service is provided in the City of Santa Fe for commuters to travel between major employment sites and park-and-ride locations not accessible by City transit. In state fiscal year 2007, the program resulted in reductions of 12 million vehicle-miles traveled, 600,000 gallons of gasoline, and over 5,820 tons of CO2.15
Bicycle Commuting Public strategies to encourage commuting by bicycle may include programs that provide bicycle sharing for flexible in-town trips, offer tax incentives to
14 Connecticut Climate Change, “2006 Progress Report.” Prepared for the Governor’s
Steering Committee on Climate Change, January 2007. Available on-line at: http://www.ctclimatechange.com/documents/SectorSummaries2006Progress_000.pdf.
15 State of New Mexico, “New Mexico Climate Change Team Implementation Report.” Prepared for the Clean Energy Development Council, August 2007. Available on-line at: http://www.nmenv.state.nm.us/cc/ClimateChangeImplementationTeamReportAugust2007.pdf.

NCHRP Project 25-25, Task 45: Transportation Program Responses to GHG Reduction Initiatives and Energy Reduction Programs
Cambridge Systematics, Inc. 3-5
employers to offset costs of biking, or encourage bicycle adoption through education, collaboration, and marketing.
Connecticut Department of Transportation – ConnDOT, in cooperation with other agencies and the Central Connecticut Bicycle Alliance, initiated a Bike to Work program to encourage workers in the greater Hartford area to commute by bicycle one day a month. In 2005, 340 individuals participated, commuting over 340,000 miles and avoiding 171,000 pounds of CO2 emissions.16
Bicycle and Pedestrian Improvements The provision of streetscaping, sidewalks, crosswalks, pedestrian overpasses, bicycle lanes, and other street-side amenities will fall under the domain of state DOTs for facilities on the state highway system or otherwise subject to state design standards. Direct investments in these hard design features and roadway conditions can increase walkability and bikeability, encouraging travel by transit and nonmotorized modes. Nationally, DOT involvement in bicycle and pedestrian improvements is widespread, through directed Federal monies (such as the Congestion Mitigation and Air Quality or CMAQ program) and revision of state roadway design practices, although few have made the direct link to climate change.
Washington State Department of Transportation (WSDOT) – On average, the DOT annually adds 20 miles of new sidewalk, trails, and pathways annually. According to the agency, these investments can mean savings of more than $23 million in fuel costs and reductions of 67,000 metric tons of CO2 emissions each year.17
Employer Outreach/Worksite Trip Reduction Some state DOTs provide funding or partner with various agencies to develop outreach strategies to employers and commuters to affect their commuting behavior. Financial incentives (typically provided by other state or transit agencies) may include discounts for certain groups or specified schedules, or state tax incentives for employer-provided transportation benefits. Transit usage also may be incentivized though adoption of convenience technology (e.g., RFID smart cards) and agency investment in marketing, communications, and accessibility information programs.
Washington State Department of Transportation – The Washington State Legislature passed the Commute Trip Reduction (CTR) Law in 1991 and in 2006 16 Connecticut Climate Change, “2006 Success Stories.” Available online at: http://
ctclimatechange.com/documents/BiketoWorkInitiativeTakesCarsOfftheRoad_000.pdf. 17 Washington State Department of Transportation, Environmental Stewardship, “What is
WSDOT Doing about Climate Change?” Web page accessed October 20, 2008. Available on-line at: http://www.wsdot.wa.gov/Environment/ClimateChange/stewardship.htm.
NCHRP Project 25-25, Task 45: Transportation Program Responses to GHG Reduction Initiatives and Energy Reduction Programs
3-6 Cambridge Systematics, Inc.
revised the statutes. Local governments in counties with severe congestion and air pollution are required to adopt CTR ordinances and support large employers in implementing TDM strategies. Employers are required to develop programs to achieve reductions in vehicle trips. WSDOT’s role in the program is to staff the CTR Board and provide implementation support and technical assistance to governments and employers, including training, data collection, and analysis, networking with partners, and documentation of best practices. In 2007, the program was estimated to remove 26,000 vehicles from state roadways each weekday morning, reduce gasoline consumption by 7.9 million gallons, and achieve reductions in emissions of CO2-equivalent gases by nearly 85,600 tons annually.18
New Jersey Department of Transportation (NJDOT) – Through the state tax system, New Jersey businesses who develop employee transportation programs may apply for a Smart Moves for Business tax credit for expenses incurred to make alternative modes of transportation available to their employees.19 While the tax credit is not administered by the DOT, Smart Moves for Business is a NJDOT-administered program.
Utah Department of Transportation (UDOT) – UDOT in cooperation with other modal partner agencies is initiating a program known as “TravelWise” to promote the use of alternative modes.20 The program includes a web site with extensive information and may include a variety of additional components such as outreach to employers and coordination of regional carpooling, vanpooling, and carsharing programs. While largely aimed at commuters, this program also is intended to affect travel behavior for all purposes.
Transit Investment Working with MPOs, transit agencies, and other state authorities, DOTs may play a lead or supporting role in directing funding towards transit investment, including urban transit as well as intercity transit and high-speed rail. They also may fund improvements in transit station accessibility and amenities (e.g., pedestrian access, wireless Internet). Some DOTs play a more direct role in transit planning and operations than others.
18 Washington State Department of Transportation, Commute Trip Reduction Program
Overview. Web page accessed November 24, 2008. Available on-line at: http://www.wsdot.wa.gov/TDM/CTR/overview.htm#goals.
19 New Jersey Department of Transportation. Smart Moves Tax Credit. Available on-line at: http://www.state.nj.us/transportation/commuter/smartmoves/taxcredits.shtm.
20 State of Utah, Travel Wise. Web page accessed October 28, 2008. Available on-line at: http://travelwise.utah.gov.

NCHRP Project 25-25, Task 45: Transportation Program Responses to GHG Reduction Initiatives and Energy Reduction Programs
Cambridge Systematics, Inc. 3-7
3.2 FREIGHT DEMAND MANAGEMENT Freight demand management includes various strategies aimed at increasing the efficiency of freight and commercial transport. Logistics management is a technical term often applied to information and management systems designed to increase the efficiency of freight management, including shipping practices (e.g., vehicle type, shipment size, and frequency), facility siting, and related activities. Logistics usually focuses on minimizing shipper costs, with little consideration of social costs such as congestion or pollution impacts. DOTs in general are not actively involved in regulating or enhancing freight demand management and logistics, with the exception of improvements to roadway access to intermodal terminals, and in a few cases, planning for or funding improvements to rail infrastructure that may support shifting of freight from truck to rail.
California Department of Transportation – Caltrans is working with partner agencies to accelerate improvements in California’s freight sector through better freight transport management, efficiency gains (shorter routes, better loading, etc.), reduced truck idling (fuel cell auxiliary systems, overnight idling, electrification of truck parking), technology improvements, and alternative fueled heavy-duty vehicles. The Department supports implementation of short-, intermediate-, and long-term actions recommended in the Governor’s Goods Movement Action Plan which is expected to have a positive impact on the level of greenhouse gas emissions generated by the movements of goods within the State.
3.3 LAND USE PLANNING Transportation and land use practices can be revised to produce compact, accessible, multimodal, and transit-oriented communities with shorter travel distances and greater travel options. The long-term climate impacts of land use stem from reductions in vehicle-miles traveled, preservation of natural area carbon sinks, and conservation of resources consumed by the built environment, all of which may significantly reduce future greenhouse gas emissions.
Coordinated Transportation and Land Use Planning Planning for transportation and land use coordinated among relevant state agencies and DOTs is a consistent recommendation among state Climate Action Plans. Although land use regulation is an issue that falls under local authority, several DOTs are active in promoting better coordination between transportation and land use through voluntary mechanisms such as outreach, incentives, planning studies, and best practice dissemination, as well as through transportation investment and design policies that support land use compatibility. Currently, the potential climate change impacts of coordinated planning policies are not well understood and the emission reduction benefits may be severely overestimated in state climate change planning documents. Those states advanced in this strategy have adopted integrated transportation
NCHRP Project 25-25, Task 45: Transportation Program Responses to GHG Reduction Initiatives and Energy Reduction Programs
3-8 Cambridge Systematics, Inc.
policies and regional growth approaches that fully incorporate transportation design and energy efficiency measures into land use planning structures.
California Department of Transportation – The Department maintains a Local Development/Intergovernmental Review program, to cooperate with local jurisdictions on land use planning and decision-making processes. The program is intended to ensure that local development decisions are supportive and inclusive of all transportation choices, including transit, intercity rail, passenger service, air service, walking, or biking. The California Regional Blueprint Program is a strategic, integrated, and cooperative planning process that provides regions a long-term framework for establishing land use patterns and transportation systems that improve mobility and accessibility. The program provides funding to local and regional entities to develop long-term growth policies that, if implemented, could be expected to significantly reduce VMT, fuel consumption, and associated GHG emissions. As an example, the Southern California Association of Governments’ regional Blueprint plan could potentially offset 246,000 gallons of fuel each day by 2030.21
New York State Department of Transportation (NYSDOT) – In 2008, the Department created Smart Growth, an on-line initiative to enhance transportation and land use planning capabilities throughout the State through an on-line information portal. The site includes basic information on smart-growth principles in the transportation planning realm, as well as tools for community planning and project development frameworks. The site is intended to convey information to local governments on subjects such as smart planning, context-sensitive solutions, and socioeconomic, cultural, and environmental assessment processes, and provide access to available state and Federal programs and funding opportunities as well as additional resources on bicycle, pedestrian, and transit modes. This initiative follows the creation of a Smart Growth Cabinet for the State that includes NYSDOT leadership, as well as agency commitments to enhancing land use planning identified in climate change action plans.22
Transit-Oriented Development Transit-Oriented Development (TOD) denotes a practice of development with features designed to maximize access to public transport. TOD clusters high-density mixed-use residential or commercial zoning within walking distance of a transit stop. Transit and development density efficiencies can result in reductions of greenhouse gas emissions compared to typical development
21 California Department of Transportation, “Climate Action Program at Caltrans.”
December 2006. Available on-line at: http://www.dot.ca.gov/docs/ClimateReport.pdf. 22 New York State Department of Transportation, “Smart Growth.” Web page accessed
October 24, 2008. Available on-line at: http://www.nysdot.gov/smartplanning.
NCHRP Project 25-25, Task 45: Transportation Program Responses to GHG Reduction Initiatives and Energy Reduction Programs
Cambridge Systematics, Inc. 3-9
patterns. The key public sector actors in TOD policies are local governments with zoning power, in cooperation with local transit agencies and private developers. While DOTs are rarely involved directly, some have supported TOD through planning study funds, funding for supportive infrastructure improvements, and provision of state land for development. State DOTs actively involved in facilitating TOD planning and implementation include California, Maryland, Washington, Oregon, Pennsylvania, Massachusetts, and Florida.
New Jersey Department of Transportation – The Department, in cooperation with NJ TRANSIT, lead a smart growth partnership program known as the Transit Village Initiative. The program’s interagency task force designates Transit Villages in municipalities that have adopted land use strategies to support compact, mixed-use development within walking distance of transit. The benefits of designation include coordination among the nine state agencies that make up the Transit Village Task Force, priority funding and technical assistance, and eligibility for grants from NJDOT’s available $1,000,000 in annual funding for Transit Villages.23
3.4 PRICING STRATEGIES Transportation pricing strategies are designed to better utilize existing capacity and reduce discretionary personal vehicle use. Some pricing strategies with potential to reduce GHG emissions include congestion pricing, universal VMT-based tolling, emissions-based registration fees, use-based automobile insurance, and gasoline tax increases.
Congestion Pricing Congestion pricing enables government to fully price the costs of driving and provides an economic incentive for some drivers to shift discretionary peak highway travel to alternative routes, off-peak-period schedules, or other transportation modes. For maximum economic efficiency, tolls are set at levels to equal to the marginal costs of congestion from the addition of another vehicle on a congested facility. The environmental effects of congestion pricing are not well documented in part because they will vary significantly depending upon specifically how the pricing scheme is implemented. The reduction in emissions from removing vehicles from congested conditions may in some cases be offset by motorists who travel on longer, less efficient alternative routes. In addition to travel impacts, congestion pricing will have operational impacts which may result in higher or lower fuel efficiency due to changes in operating speeds for different vehicles on different roadways. 23 New Jersey Department of Transportation, Community Programs, “Transit Village
Initiative.” Web page accessed October 23, 2008. Available on-line at: http://www.state.nj.us/transportation/community/village/index.shtml.
NCHRP Project 25-25, Task 45: Transportation Program Responses to GHG Reduction Initiatives and Energy Reduction Programs
3-10 Cambridge Systematics, Inc.
Congestion pricing may be implemented in different forms. Variably priced lanes, such as High-Occupancy Toll (HOT) lanes, involve tolling express lanes on a specific highway facility or segment. HOT lanes are the only congestion pricing schemes that have been implemented to date in the United States. Variable universal tolls involve pricing existing toll roads and bridges, as well as currently toll-free facilities in a regional network, though only during peak-period travel or for use of certain roadway types. Cordon charges (which have been applied in London, Stockholm, and other international locations but not in the United States) are imposed in relation to defined boundaries, such as an urban area or central business district, where variable or fixed charges are incurred for motorists to drive within the cordoned area. Areawide charges may be imposed universally on all roads within an urban area or region, based on a flat per-mile usage with additional charges that may vary by level of congestion or roadway type.
California Department of Transportation – The 91 Express Lanes is a four-lane, 10-mile toll road built in 1995 in the median of California’s Riverside Freeway (State Route 91). Vehicles in the express toll lanes now carry about 40 percent of the traffic, traveling at 60 to 65 mph, while vehicles in the remaining four mixed lanes carry the remainder, traveling at about 20 mph. Because HOT lanes are often newly constructed capacity, induced demand and higher speeds may lead to no overall change or even increases in emissions. A 1998 evaluation of the SR 91 project’s impact on emissions indicated that total growth in vehicle emissions would have been approximately the same as if HOV lanes or general use lanes had been constructed instead.24
VMT or Areawide Pricing Under VMT-based pricing schemes, a per-mileage fee is imposed according to the amount a vehicle uses public roadways. Mileage-based fees are being evaluated as a potential replacement for state motor fuel taxes. Hypothetically, fees could vary by vehicle weight, fuel type and consumption, environmental impact, road system, or geography, to account for marginal social costs of each vehicle. If a flat mileage fee were imposed, the system would favor vehicles with low fuel economy and disadvantage fuel efficient vehicles, when compared to the tax burdens under the current gasoline taxes. However, mileage-based fees would immediately alter current driving patterns and motorist behavior which could result in overall emissions reductions. The concept is being studied by the Oregon DOT, the Puget Sound Regional Council in Washington State, and has been recommended in California.
24 California Department of Transportation, Traffic Operations Program, HOV Systems
Branch, “Continuation Study to Evaluate the Impacts of the SR 91 Value-Priced Express Lanes: Final Report.” Prepared by Cal Poly State University. December 2000. Available on-line at: http://ceenve3.civeng.calpoly.edu/sullivan/SR91/final_rpt/FinalRep2000.pdf.
NCHRP Project 25-25, Task 45: Transportation Program Responses to GHG Reduction Initiatives and Energy Reduction Programs
Cambridge Systematics, Inc. 3-11
Oregon Department of Transportation (ODOT) – In 2001, Oregon Legislative Assembly established the Road User Fee Task Force, which recommended that a new road revenue system-based per-mile charge would be a real, practical alternative to the current road revenue system. ODOT completed a Road User Fee Pilot Program pilot study in 2007 and determined that a per-mile charge could be collected efficiently and inexpensively. To address environmental concerns, the Oregon Mileage Fee Concept suggests charging a flat rate with additional premiums assessed based on vehicles’ fuel efficiency ratings, weight, size or emissions ratings.25
Carbon Content-Based Fuel Taxes or Fees Taxes levied directly on emissions are considered effective policy to reduce carbon emissions from mobile sources. A carbon-based tax imposes the full social cost of emissions on motorists, taxes low-carbon fuel use advantageously, and may impact travel behavior with associated reduction in GHG emissions. Carbon taxes have been proposed but not adopted in the United States, although they have been implemented in Denmark, Finland, the Netherlands, Norway, Sweden, and Quebec, Canada. Though this policy change has been included in state CAP recommendations, state DOTs would have little to no involvement in the imposition or regulation of carbon-based fuel taxes.
Pay-As-You-Drive Insurance Use-based automobile insurance varies the costs of insurance depending on distance, location, or time traveled. Dynamically pricing automobile insurance has competitive advantages for insurance firms seeking to differentiate risk-averse drivers and a secondary advantage of varying automobile ownership costs directly by use. Direct charges for use, particularly during peak-period schedules and routes, may induce behavioral effects that reduce miles traveled and associated emissions. Usage-based insurance premiums have been a recommendation in nearly every state CAP in recent years. While DOTs have little to no regulatory power over this policy change, some have sponsored pilot programs, including Minnesota, Washington State, and California. Progressive Casualty Insurance Company offers a use-based plan know as MyRate that currently is available in Kentucky, Alabama, Louisiana, Maryland, Michigan, Minnesota, New Jersey, and Oregon.
Minnesota Department of Transportation (Mn/DOT) – In 2007, Mn/DOT completed a demonstration project to simulate effects on vehicle-use from the conversion of automobile ownership fixed cost to variable per-mile costs for lease instruments and insurance premiums. The Pay-As-You-Drive Insurance 25 Oregon Department of Transportation, “Oregon’s Mileage Fee Concept and Road User Fee Pilot
Program.” Report to the 73rd Oregon Legislative Assembly. June 2005. Available on-line at: http://www.oregon.gov/ODOT/HWY/OIPP/docs/2005 LegislativeReport.pdf.

NCHRP Project 25-25, Task 45: Transportation Program Responses to GHG Reduction Initiatives and Energy Reduction Programs
3-12 Cambridge Systematics, Inc.
pilot project involved a market assessment and experimental field test designed to estimate the level of interest in the pay-as-you-drive approach, the nature of the market for the concept, the response of drivers to price signals based on miles driven, and the overall effect of the program on vehicle-miles traveled and traffic congestion. During the evaluation, average miles per vehicle driven during priced weekend peak periods, declined 8.1 percent. Average mileage per vehicle fell 6.6 percent during weekday priced peak-period travel times.26
3.5 TRAFFIC SYSTEMS OPERATIONS Improvements to the operations of traffic control systems to make traffic flow more efficient can reduce GHG’s by reducing idling, stops and starts, and hard accelerations, and by keeping traffic moving at more fuel-efficient moderate speeds. Regulatory measures, traffic control devices, traveler information services, and operational techniques are strategies employed to improve the efficiency of traffic operations. State DOTs all have traffic operations departments, often dedicated funding programs, and have generally invested significantly in operations improvements in recent years. Of the many operational improvements possible, those with the greatest potential to reduce unnecessary congestion and vehicle emissions are included here. These strategies are discussed in three categories: 1) traffic flow improvements; 2) traffic signal optimization and coordination; and 3) other intelligent transportation systems.
Traffic Flow Improvements Traffic flow improvements include a range of physical strategies that enhance roadway capacity and efficiency. These strategies can reduce congestion, idling, and stops and starts, thereby reducing GHG emissions by keeping traffic moving at more efficient speeds. Several types of improvements include: conversion of two-way streets to one-way operation, restricting left turns and separating turning vehicles from through traffic, and widening and reconstructing roadways and intersections to reduce bottlenecks. Traffic flow improvements are similar to signalization improvements in that they are primarily orientated towards reducing congestion on local and arterial streets by improving the effi-ciency of the system. The environmental effects and emissions reduction benefits of single projects are relatively low and locally concentrated, but as state DOTs undertake comprehensive congestion management programs, the cumulative reductions in greenhouse gases may be significant.
26Minnesota Department of Transportation, “Mileage-Based User Fee Demonstration
Project: Pay-As-You-Drive Experimental Findings.” Final Report MN/RC – 2006-39A. Prepared by Cambridge Systematics, Inc., et al. March 2006. Available on-line at: http://www.lrrb.org/PDF/200639A.pdf.

NCHRP Project 25-25, Task 45: Transportation Program Responses to GHG Reduction Initiatives and Energy Reduction Programs
Cambridge Systematics, Inc. 3-13
Traffic Signal Optimization and Coordination Retiming of traffic signals reduces vehicle travel time along with unnecessary traffic delay, start-stop, and idling. The Institute of Transportation Engineers recommends that with growth and changing travel patterns, traffic signal should be updated at least every five years, depending upon traffic patterns. Among DOTs and national organizations there exists substantial guidance associated with improving signal timing. The National Transportation Operations Coalition produces an annual report detailing the state and needs of signals across the states. The 2007 National Traffic Signal Report Card noted improvements in the condition of signals and retiming efforts since 2005, but noted that agency programs to support efficient maintenance and operations of traffic signals are not as effective as they could be.27
Adaptive traffic signals (which respond to real-time traffic conditions to optimize flow and reduce delay) as well as coordinated signal timing across multiple intersections also can improve traffic flow. The U.S. DOT’s Intelligent Transportation Systems (ITS) Joint Program Office contains a benefit/cost database that documents program benefits with case studies. According to a 2006 survey of ITS deployment, over 22 states have adaptive traffic signals in place. The database includes the following examples of emissions benefits from signal optimization programs: 28
• Signal improvements to an 11-intersection arterial in St. Augustine, Florida, showed reductions of 36 percent in arterial delay, 49 percent in arterial stops, and 10 percent in travel time, resulting in an annual fuel savings of 26,000 gallons and an annual cost savings of $1.1 million.
• By implementing coordinated signal timing on the arterial network in Syracuse, New York, total fuel consumption was reduced by up to 13 percent, average fuel consumption declined by up to 14 percent, and average vehicle emissions decreased by up to 13 percent.
Washington Department of Transportation – A recent state audit cited that modest signal coordination efforts in the Puget Sound region could reduce roadway delay by 15 to 20 percent. For each second of average delay reduction, more than 12,000 metric tons of CO2 equivalent can be prevented.29
27 National Transportation Operations Coalition, “2007 National Traffic Signal Report
Card.” Available on-line at: http://www.ite.org/REPORTCARD/technical_report%20final.pdf.
28 U.S. Department of Transportation, “ITS Benefits Database. ” Available on-line at: http://www.itsbenefits.its.dot.gov/, accessed October 2008.
29 Washington State Department of Transportation, “Advanced Traffic Operations.” Fact Sheet. June 10, 2008. Available on-line at: http://www.ecy.wa.gov/climatechange/2008CATdocs/IWG/tran/6908_ato5.pdf.

NCHRP Project 25-25, Task 45: Transportation Program Responses to GHG Reduction Initiatives and Energy Reduction Programs
3-14 Cambridge Systematics, Inc.
Other Intelligent Transportation Systems Intelligent transportation systems (ITS) denote a broad range of communications, information, and electronics technologies that when applied to transportation systems result in operational efficiencies. ITS applications resulting in reduced congestion and associated environmental benefits includes emergency and incident management, traveler information, and delay alert systems. It is estimated that over half of congestion on urban highways is caused by nonrecurring incidents, such as accidents or incidents that impede traffic flow. This can result in 4 to 10 minutes of accrued traffic back up for every minute a lane remains blocked.
According to the U.S. DOT’s ITS Joint Program Office survey of ITS deployment, over 40 states have traveler information systems, as many as 37 states have incident management or emergency response systems, and 22 states operate at least one Traffic Management Center.
California Department of Transportation – The agency’s ITS State Architecture and the Transportation Management System (TMS) Master Plan is designed to provide a framework for consistency between regional systems and to facilitate deployment of ITS technologies. Caltrans systems focus on traveler information, traffic control, incident management, and system monitoring and evaluation. Analysis has shown that ITS measures could reduce VMT and delay by 20 percent in congested corridors and that operational improvements and ITS deployments could result in estimated reductions of 0.07 million metric tons (MMT) of greenhouse gases by 2010 and 2.17 MMT between 2006 and 2020.30
Georgia Department of Transportation – The State introduced its NaviGAtor incident management program in 1996 and the Atlanta-area system has expanded to cover approximately 180 freeway miles, with full coverage for the region expected in 2010. The deployment of this ITS system has been estimated to have reduced annual fuel consumption by 6.83 million gallons.31
Maryland Department of Transportation (MDOT) – Chesapeake Highway Advisories Routing Traffic Program (CHART) is a Freeway Incident Management System created through a joint effort of MDOT and the Maryland State Police to improve traffic flow on Maryland major highways. The State
30 California Department of Transportation, “Climate Action Program at Caltrans.”
December 2006. Available on-line at: http://www.dot.ca.gov/docs/ClimateReport.pdf. 31 United States Department of Transportation, Research and Innovation Technology
Administration, Intelligent Transportation Systems, Benefits Database, “Georgia NaviGAtor Incident Response System.” August 2006. Available on-line at: http://www.benefitcost.its.dot.gov/its/benecost.nsf/ID/D8C9DC0B8F0769C28525733A006D5A17?OpenDocument&Query=BMeasure.

NCHRP Project 25-25, Task 45: Transportation Program Responses to GHG Reduction Initiatives and Energy Reduction Programs
Cambridge Systematics, Inc. 3-15
Highway Administration estimates that in 2006, the system reduced idle time for trucks and passenger vehicles by nearly 2.5 million hours.32
Idling Reduction Unnecessary idling of commercial, state-owned equipment, or transit vehicles may use up to several billion gallons of fuel and emit significant greenhouse gases each year. According to the U.S. Department of Energy, the average commercial long-haul truck idles up to 1,800 hours each and in total commercial trucks may waste 3.5 billion gallons of fuel idling each year.33 As a result, idle reduction technologies and practices are an increasingly being adopted by local and state governments as a means to reduce fuel consumption and vehicle emissions. In 2008, according to the American Transportation Research Institute, 26 states have anti-idling regulations, ordinances, or policies in place at either the state or local government levels.34 Idle reduction practices include regulations codified in state or local law, voluntary compliance policies and educational programs, or retrofitting and technology adaptation, such as truck stop electrification and on-board power sources.
While DOTs do not have statutory authority over commercial vehicle anti-idling ordinances, they are becoming involved in truck stop electrification projects, supporting projects with available Federal funding and establishing public-private partnerships. According to the U.S. Department of Energy, there were 136 electrification stations in the United States in 2008, up from 46 in 2006. In total, 34 states have stations, the majority of which are in California, Ohio, and Texas.35
Maryland Department of Transportation – The Department partnered to open three truck stop electrification facilities in Maryland. A stationary power source provides power to overnight trucks. According to agency calculations, between
32 Maryland Climate Action Plan, Greenhouse Gas and Carbon Mitigation Working Group,
“Policy Options Document.” Available on-line at: http://www.mde.state.md.us/assets/document/Air/ClimateChange/Appendix_D_Mitigation.pdf.
33 United States Department of Energy, Argonne National Lab, “Estimation of Fuel Use by Idling Commercial Trucks.” January 2006. Available on-line at: http://www.transportation.anl.gov/pdfs/TA/374.pdf.
34 American Transportation Research Institute, “Compendium of Idling Regulations.” July 2008. Available on-line at: http://www.atri-online.org/research/idling/atri_idlingcompendium7_11_08.pdf.
35 U.S. Department of Energy (2008). “Fact #551: December 29, 2008: Truck Stop Electrification Sites.” Energy Efficiency and Renewable Energy Information Center, http://www1.eere.energy.gov/vehiclesandfuels/facts/2008_fotw551.html.
NCHRP Project 25-25, Task 45: Transportation Program Responses to GHG Reduction Initiatives and Energy Reduction Programs
3-16 Cambridge Systematics, Inc.
August 2005 and March 2008, these locations operated 671,869 hours and saved 671,869 gallons of diesel fuel, the equivalent of 7,121 metric tons of CO2.36
Nevada Department of Transportation (NDOT) – In 2007, the agency began offering employees and the public free idling reduction presentations from NDOT air quality specialists. The seminars outline the health, environmental, and fuel cost saving benefits of reduced idling and discuss alternatives and technologies to reduce idling.37
3.6 ALTERNATIVE FUELS AND VEHICLE TECHNOLOGY The most direct approaches to reducing GHG emissions from the transportation sector may be to increase vehicle fuel economy in new cars, light- and heavy-duty trucks, and to rapidly develop and deploy alternative, low-carbon fuels, and infrastructure.
Alternative Fuels Alternative fuels policies and programs are generally directed at increasing the production, distribution infrastructure, and consumption of a variety of fuels and fuel additives with lower carbon content per unit energy than traditional transportation fuels (gasoline and diesel). In general, DOTs are not the regulating agency governing these policies. However, many DOTs are actively using biofuels or have conducted studies to determine the effectiveness of using biodiesel, ethanol-blended fuel, and other alternative fuels in fleet vehicles. The research conducted for this report found that 45 of 50 state DOTs were actively using biofuel blends, primarily biodiesel, in agency fleets. The most common deterrents for agencies to adopt biofuel requirements for state fleets include the additional cost of blended fuel, retrofitting or expanded maintenance, and concerns among some DOTs about biofuel operation in cold weather. Federal CMAQ funds are primarily available for projects in states with air quality nonattainment and maintenance areas. Eligible activities can include alternative fuel stations and refueling infrastructure.
Vermont Agency of Transportation – In its climate change action plan, VTrans has committed to support research into a Vermont low-carbon fuel standard that would require the emissions from transportation fuels to be reduced to a specified level within a certain timeframe. The agency is increasing the use of
36 Maryland State Highway Administration, “Ongoing Transportation Emissions
Reduction Strategies.” April 2008. Internal working document provided to Cambridge Systematics, Inc.
37 Nevada Department of Transportation, “Centerline.” Newsletter. August 2007. Available on-line at: http://www.nevadadot.com/news/newsletters/pdfs/centerline/2007_08.pdf.

NCHRP Project 25-25, Task 45: Transportation Program Responses to GHG Reduction Initiatives and Energy Reduction Programs
Cambridge Systematics, Inc. 3-17
biofuels in its fleet by supporting education initiatives and by demonstrating the viability of biodiesel in its ongoing use of B-5 and B-20 in fleet vehicles. As much as 15 to 20 percent of the Agency’s fuel use will have a biodiesel component in 2008.38
Tennessee Department of Transportation (TDOT) – In 2006, TDOT received $1.5 million from the State to initiate a Green Island Corridor grant program that provides incentives for retail stations to offer biofuels. As of 2008, 22 E-85 stations and 27 B-20 fueling stations offered biofuels. The DOT’s goal is to establish biofueling stations no more than 100 miles apart along all major Interstates by 2010.39
Utah Department of Transportation – In 2007, the agency provided over $50,000 in grant funding for a project with Utah State University to grow biodiesel feedstocks, including drought-tolerant crops such as canola, safflower, and perennial flax, along state highway right-of-way. The ultimate goal of the project is to determine the yields and feasibility of producing biofuels in areas that do not encroach on existing farmland, and in addition providing a secondary benefit of reducing UDOT’s costs of over a $1 million a year to mow and treat roadsides. UDOT’s Executive Director suggested that a mile of right-of-way could generate 500 gallons of biodiesel per year.40
Vehicle Technology and Emissions Standards Tailpipe emissions from passenger and light-commercial vehicles are significant contributors to greenhouse gas emissions from the transportation sector and have been targeted for action in many state Climate Action Plans. The Clean Air Act enables the Federal government to set and enforce emissions standards for new vehicles. The Act also allows California to adopt standards for cars sold in that State, and allows other states to adopt new vehicle standards equivalent to California’s. In 2002, the State directed the California Air Resources Board (CARB) to adopt regulations that require carmakers to reduce global warming emissions from new passenger cars and light trucks. The result was California’s Clean Car Program and CA LEV II standards, which will apply to the 2009 new model year dependent on ongoing negotiations with the U.S. Environmental Protection Agency. The program includes requirements for reducing greenhouse gas
38 Vermont Agency of Transportation, “VTrans Climate Change Action Plan.” June 2008.
Available on-line at: http://www.aot.state.vt.us/planning/Documents/Planning/VTransClimateActionPlanfinal1.pdf.
39 Tennessee Department of Transportation, Commissioner Nicely, “Tennessee in Motion.” October 2008. Available on-line at: http://www.tdot.state.tn.us/columns/2008/1008.htm.
40 Utah Department of Transportation, Research Division, “Research Newsletter.” June 2007. Available on-line at: http://www.dot.state.ut.us/main/uconowner.gf?n=54542315105982301.

NCHRP Project 25-25, Task 45: Transportation Program Responses to GHG Reduction Initiatives and Energy Reduction Programs
3-18 Cambridge Systematics, Inc.
emissions from motor vehicles and sets progressively restrictive limits on fuel economy and tailpipe emissions through 2016. The regulations are estimated to reduce greenhouse gas emissions from the State’s light-duty passenger vehicle fleet by an estimated 87,700 CO2-equivalent tons per day statewide in 2020 and by 155,200 CO2-equivalent tons per day in 2030. This equates to an 18 percent reduction in climate changes emissions from the light-duty fleet in 2020 and a 27 percent reduction in 2030. As of the fall of 2008, 12 states have adopted and another six have announced intentions of adopting California’s emissions standards.41
State DOTs have little direct involvement in setting, implementing, or regulating emissions standards, although they may advocate for the adoption of such standards at a state-level.
HOV Lane Exemptions for Low-Emission Vehicles In 1998, the Transportation Equity Act for the 21st Century (TEA-21) allowed states to exempt the HOV lane occupancy requirement for vehicles certified as “low-emission and energy-efficient” and in 2005, provisions in the Safe, Accountable, Flexible, Efficient Transportation Equity Act: A Legacy for Users Act (SAFETEA-LU) allowed states even greater flexibility in utilizing HOV lane capacity. As of 2008, nine states, including Arizona, Colorado, Florida, New York, New Jersey, Tennessee, Utah, and Virginia have adopted pass/sticker programs to allow hybrids to use the lanes.42 A handful of other states had at one time adopted programs to allow certified low-emission vehicles (not necessarily low GHG emissions) to use HOV lanes. While these programs may encourage the purchase of more efficient vehicles, they must be managed carefully to ensure that traffic volumes in the HOV lane do not become so great as to cause congestion. In some states, stickers are no longer being issued or will expire within the next few years in order to limit demand as hybrid market penetration grows – therefore this strategy can be considered at best a short-term strategy to encourage the adoption of new technology when it is first introduced.
New York State Department of Transportation – NYSDOT’s Clean Pass program began in March 2006 as a one-year pilot program to allow eligible low-emission, energy-efficient vehicles to use Long Island Expressway HOV lanes. During the first year, the program was estimated to result in a reduction of 6,000 tons of greenhouse gas emissions and savings in excess of 500,000 gallons of gasoline.43
41 (Arizona, California, Colorado, Connecticut, Florida, Massachusetts, Maryland, Maine,
New Jersey, New Mexico, New York, Oregon, Pennsylvania, Rhode Island, Utah, Vermont and Washington.) Clean Cars Campaign, “State Action.” Web page accessed October 31, 2008. Available on-line at: http://www.cleancarscampaign.org.
42 HybridCars (2009). “Carpool (HOV) Lanes.” http://www.hybridcars.com/local-incentives/carpool-hov-lanes.html
43 HybridCars (2009), ibid.
NCHRP Project 25-25, Task 45: Transportation Program Responses to GHG Reduction Initiatives and Energy Reduction Programs
Cambridge Systematics, Inc. 3-19
3.7 DOT CONSERVATION AND EFFICIENCY EFFORTS A number of state DOTs are building on existing efforts, such as statewide energy conservation or climate change action plans, and introducing policies and programs to institutionalize energy efficiency and greenhouse gas emission reduction measures into the operations and maintenance of department procedures, facilities, fleet vehicles, and heavy-duty equipment. As of August 2008, a total of 39 states had energy efficiency requirements in place for state facilities and 25 had energy efficient equipment purchasing requirements. The purposes of these policies are for public agencies to achieve cost savings within their own operations, buildings, and fleets in order to demonstrate the ease and feasibility of energy efficiency and provide secondary benefits of reduced operating costs. In states with efficiency mandates, many DOTs are required to submit energy action plans detailing energy conservation efforts. In other areas, DOTs have long practiced efficient operating policies and measures for cost savings.
A few state DOTs also are undertaking carbon footprints to comprehensively inventory emissions from their facilities and operations. A 2008 survey commissioned by the Equipment Focus Group of the AASHTO Subcommittee on Maintenance found that Oregon, California, North Carolina, Idaho, and Maryland had completed carbon footprints of agency activities.44 For example, according to the Idaho Department of Transportation’s 2008-2009 Greenhouse Gas Emission Reduction Action Plan, required annually by the State, the DOT’s vehicle and equipment fleet contributes 19,013 tons of CO2 to the atmosphere a year. The agency’s electrical usage for 565 buildings accounts for 4,113 tons of CO2 and the use of heating fuel for those buildings accounts for an additional 4,008 tons of CO2 each year. Employees commuting to and from work contribute 3,468 tons of CO2 annually.45
Alternative Fuel and Efficient Vehicle Fleets A significant number of state DOTs are under requirements to purchase alternative fuel passenger vehicles for fleet use. The Energy Policy Act (EPAct) of 1992 established the State and Alternative Fuel Provide program, which mandates that 75 percent of fleet acquisitions must be alternative fuel vehicles, in state fleets that operate 50 or more vehicles, 20 of which must be in metropolitan areas. In 2007, this program resulted in the acquisition of more than 14,000 alternative vehicles by state governments and the consumption of 4.5 million
44 American Association of State Highway and Transportation Officials. “MNT-08-02
Survey for the Member Department of Transportation Equipment Managers.” August 2008. Internal survey results provided by AASHTO to Cambridge Systematics, Inc.
45 Idaho Department of Transportation, “Transporter Newsletter.” February 2008. Available on-line at http://www.itd.idaho.gov/Transporter/2008/022908_Trans/022908_GHGplan.html.
NCHRP Project 25-25, Task 45: Transportation Program Responses to GHG Reduction Initiatives and Energy Reduction Programs
3-20 Cambridge Systematics, Inc.
gallons of biodiesel.46 Some states and DOTs have enacted internal policies more stringent than Federal standards, notably Texas, which requires the use of alternative fuels in the vehicles.
In addition, agencies are revising fleet purchasing guidelines to incorporate factors that consider the life-cycle costs of vehicles and establish priority criteria for emissions and fuel economy to meet statewide greenhouse gas emission reduction mandates. States with active green fleet initiatives include California, Washington, Oregon, and Colorado, among others. In a 2008 survey commissioned by the Equipment Focus Group of the AASHTO Subcommittee on Maintenance, of the 27 state DOTs responding, 10 states indicated that they had adopted life-cycle costing assessments when purchasing. At least 16 states indicated that had adopted a number of other policies to encourage fuel efficiency, including downsizing of vehicles, programmed engine idle shut-off switches, programming medium and heavy trucks for maximum vehicle speed, reducing the weight of vehicles, using performance lubricants and fuel additives, improving tire inflation, and using GPS systems.47
Texas Department of Transportation (TxDOT) – The agency has committed to reducing emissions by adopting low-emission technologies and using alternative fuels in its equipment fleet. In 2005, TxDOT’s fleet of 4,500 alternative fuel vehicles reduced gasoline consumption from the fleet baseline by 5 million gallons. The Texas Legislature authorized the Department to study the feasibility of hydrogen-fueled fleet vehicles and it is developing a plan to analyze the costs involved, identify funding options, and determine the overall benefits of using hydrogen-fueled vehicles.48
New York State Department of Transportation (NYSDOT) – NYSDOT operates an alternative fuel fleet of more than 700 vehicles, primarily using compressed natural gas and hybrids. In 2007, the Department displaced more than 750,000 gallons of gasoline using compressed natural gas vehicles. With the Office of General Services, the DOT helped build 59 CNG stations, with 11 of them open to the public.49
46 U.S. Department of Energy, State and Alternative Fuel Providers Program, “Annual
Report.” 2007 Available on-line at: http://www1.eere.energy.gov/vehiclesandfuels/epact/pdfs/my2007_annual_report.pdf.
47 American Association of State Highway and Transportation Officials. “MNT-08-02 Survey for the Member Department of Transportation Equipment Managers.” August 2008. Internal survey results provided by AASHTO to Cambridge Systematics, Inc.
48 Texas Department of Transportation, General Services Division, “Alternative Fuels.” Web page accessed October 24, 2008. Available on-line at: http://www.dot.state.tx.us/services/general_services/alternative_fuels.htm.
49 New York State Department of Transportation, “Climate and Energy Report.” August 2008. Available on-line at: http://www.nysdot.gov/divisions/engineering/technical-
Footnote continued

NCHRP Project 25-25, Task 45: Transportation Program Responses to GHG Reduction Initiatives and Energy Reduction Programs
Cambridge Systematics, Inc. 3-21
Minnesota Department of Transportation – In 2008, the DOT purchased its first hybrid diesel-electric bucket lift truck, which provides substantial energy savings when in operation. The truck utilizes a rechargeable battery to power its lift when stopped and operating, rather than traditional trucks that rely on idling a diesel engine as a primary power source. The hybrid model has a fuel economy rating of 10 miles per gallon, compared with 5 to 6 miles per gallon for the standard diesel models. The agency indicated that it has reduced nonrenewable fuel use by 20 percent in recent years by using E-85, biodiesel and more efficient vehicles.50
California Department of Transportation – Caltrans began a Fleet Greening Program in 2000 as an effort to reduce emissions from the DOT’s fleet of over 13,000 equipment pieces, in order to meet emerging state regulations and set examples for the use of alternative technologies. The impacts of the program have been substantial and include the replacement of 54 diesel-powered trucks with low-emissions models, the installation of zero-emission static inverters have replaced diesel generators on 34 trucks, the increased use of solar-powered equipment accessories, and purchase of compressed natural gas dump trucks and street sweepers.51 The cumulative emissions savings of fleet replacement activities have been estimated to be 0.0065 million metric tons of greenhouse gases by 2020.52
Fleet Operations Policies State DOT vehicle fleets can be targeted for idling reductions or other practices, such as revised maintenance procedures, to reduce fuel consumption and emissions from these vehicles. In a 2008 survey commissioned by the Equipment Focus Group of the AASHTO Subcommittee on Maintenance, of the 27 state DOTs responding, 22 state agency equipment or operations managers stated that their state has developed new policies for fuel conservation. The most popular policies included anti-idling policies, carpooling when using state vehicles, proper tire pressure and preventative maintenance schedules, and practice defensive driving. Survey respondents suggested that these were internal policies or executive orders developed in response to fuel prices, but lacking
services/trans-r-and-d-repository/NYSDOT%20Energy%20and%20Climate%20Change%20Report.pdf.
50 Minnesota Department of Transportation, “Newsline.” July 16, 2008. Available on-line at: http://www.newsline.dot.state.mn.us/archive/08/jul/16.html.
51 California Department of Transportation, Equipment, Greening the Fleet Program. Webpage accessed November 2, 2008. Available on-line at: http://www.dot.ca.gov/hq/eqsc/CleanAir/greenfleet.htm.
52 California Department of Transportation, “Climate Action Program at Caltrans.” December 2006. Available on-line at: http://www.dot.ca.gov/docs/ClimateReport.pdf.

NCHRP Project 25-25, Task 45: Transportation Program Responses to GHG Reduction Initiatives and Energy Reduction Programs
3-22 Cambridge Systematics, Inc.
enforcement mechanisms, though some states provided incentives for conservation.53
Washington Department of Transportation – In 2006, WSDOT adopted an agency no-idle policy to reduce fuel use and vehicle emissions. The Department estimates that by reducing unnecessary vehicle idling by 50 percent during operations, the agency could save up to $500,000 annually in fuel costs.54 Caltrans also has issued an internal directive that sets out agency policy on unnecessary idling.
DOT Facilities Department of transportation facility energy conservation programs often focus on electricity and natural gas consumption associated operating DOT buildings and supporting employee activities. Because DOTs operate district offices, subdistrict maintenance sites, central offices, and sometimes other modal offices, their energy consumption totals and potential conservation savings may be greater than other state agencies. Department maintenance sheds and other facilities that have not been improved recently may be evaluated for costs savings associated with insulation and lighting improvements. DOTs in some states also are participating in green building initiatives at the state level for DOT-operated facilities, by adhering to nationally recognized standards such as the Leadership and Excellence in Environmental Design (LEED) program.
Washington Department of Transportation – The agency has reduced electricity use by 22 percent (24 million kilowatt hours) from fiscal year 2003 to 2007, by employing more energy efficient technologies, appliances, and equipment.55
Idaho Department of Transportation (IDOT) – According to the agency’s 2008-2009 Greenhouse Gas Emission Reduction Action Plan, the agency’s electrical usage for 565 buildings accounts for 4,113 tons of CO2 and the use of heating fuel for those buildings accounts for an additional 4,008 tons of CO2 each year. The Department has implemented a variety of measures to increase energy efficiency over the last decade, primarily to reduce operating costs. Examples of improvements to IDOT’s headquarters and district facilities include a video
53 American Association of State Highway and Transportation Officials. “MNT-08-02
Survey for the Member Department of Transportation Equipment Managers.” August 2008. Internal survey results provided by AASHTO to Cambridge Systematics, Inc.
54 Washington Department of Transportation, Environmental Stewardship, “What is WSDOT Doing About Climate Change?” Web page accessed October 24, 2008. Available on-line at: http://www.wsdot.wa.gov/Environment/ClimateChange/stewardship.htm.
55 Washington Department of Transportation, Environmental Stewardship, “What is WSDOT Doing About Climate Change?” Web page accessed October 24, 2008. Available on-line at: http://www.wsdot.wa.gov/Environment/ClimateChange/stewardship.htm.
NCHRP Project 25-25, Task 45: Transportation Program Responses to GHG Reduction Initiatives and Energy Reduction Programs
Cambridge Systematics, Inc. 3-23
conference system and improvements to heat pumps, fluorescent lights, landscaping, and restroom facilities.56
Maryland State Highway Administration – In Maryland, Executive Order No. 06-02 directed all new state buildings or major renovations to meet, at a minimum, the U.S. Green Building Council’s Leadership in Energy and Environmental Design (LEED) program’s silver certification status. The SHA has designed a new headquarters building to meet this level of LEED certification. Additionally, the Oregon Department of Transportation recently designed the renovation of the Transportation Building on the Capital Mall to be LEED Silver certified. The agency indicated that to design to Gold certified standards would have increased constructed costs by $1.6 million.57
DOT Roadway Signs and Signals Energy efficiency savings from the operations of state-owned roadways have been achieved primarily through upgrades of traffic signals and mobile message boards to use light-emitting diode (LED) technology. Currently, most arrow boards, warning beacons, and message signs used to direct traffic in construction areas operate off of the power generated by an idling vehicle (usually diesel). In addition, message signs and traffic signals on roadways use incandescent lamps. LED technology for signs and signals has been proven to consume far less energy and can operate more readily on battery power. A number of DOTs are upgrading to LED lights for signs and signals, including Washington, California, New York, and New Mexico. The Idaho, Minnesota, Vermont, and Colorado DOTs employ LED lights on snowplow vehicles.
Washington Department of Transportation – By replacing existing 12 inch incandescent lights in traffic signals, WSDOT reduced electricity consumption from 31,600 to 4,744 kilowatt hours annually. In addition, more than 200 vehicles have been outfitted with LED lights, saving an estimated 121,000 gallons of fuel annually. The agency estimated reductions of 4.4 tons of air pollutants and 800 tons of CO2 as a result of vehicle LED retrofits.58
56 Idaho Department of Transportation, “Transporter.” Newsletter. February 2008.
Available on-line at: http://www.itd.idaho.gov/transporter/2008/022908_Trans/022908_GHGplan.html.
57 Oregon Legislative Fiscal Office, “Fiscal Analysis of Proposed Legislation.” May 2007. Available on-line at: http://www.leg.state.or.us/comm/sms/fis07/fsb0576a05-10-2007.pdf.
58 Washington Department of Transportation, Environmental Stewardship, “What is WSDOT Doing About Climate Change?” Web page accessed October 24, 2008. Available on-line at: http://www.wsdot.wa.gov/Environment/ClimateChange/stewardship.htm.

NCHRP Project 25-25, Task 45: Transportation Program Responses to GHG Reduction Initiatives and Energy Reduction Programs
3-24 Cambridge Systematics, Inc.
New York State Department of Transportation – The Department operates over 6,000 traffic signals, all of which have been updated to LED technology, reducing energy consumption by 75 percent.59
DOT Workforce Travel A number of state DOTs have responded to increased fuel prices, state mandates to reduce fuel and energy consumption, and greenhouse gas emission requirements by introducing policies to limit travel by state employees. In a 2008 survey commissioned by the Equipment Focus Group of the AASHTO Subcommittee on Maintenance, of the 27 state DOTs responding, 15 states indicated that their agency had changed work hours for employees to combat fuel and energy increases. The most common responses included allowing the option of a four-day, 10-hour workweek, and revising department telecommuting policies. As many as 11 states also indicated that policies were in place to limit travel by state employees, either by requiring carpooling when using state vehicles, maximizing the use of teleconferences, or limiting all but essential travel.
New York State Department of Transportation – As part of the Department’s climate change and energy efforts, potential agencywide actions to reduce emissions are being evaluated. Based on a recommendation from one of the internal Climate Change/Energy workgroups, agency management approved a pilot program to enable employees to schedule compressed work weeks.60
Utah Department of Transportation – The State of Utah recently instituted the nation’s first mandatory four-day work week for state employees. The policy change is intended to help the State meet its goal of a 20 percent reduction in energy consumption by 2015, and affects 17,000 employees, or 80 percent of the state workforce. The DOT and local transit agencies have amended transit schedules to better match the extended weekday hours.
Construction and Maintenance Practices Emissions and air quality impacts from road construction activities, including the equipment and materials used in construction, are often quantified in environmental review and permitting stages of projects (although such reviews are only beginning to look at GHG emissions). Increasingly, some DOTs have
59 New York State Department of Transportation, “Climate and Energy Report.” August 2008.
Available on-line at: https://www.nysdot.gov/divisions/engineering/technical-services/trans-r-and-d-repository/NYSDOT%20Energy%20and%20Climate%20Change%20Report.pdf.
60 New York State Department of Transportation, “Climate and Energy Report.” Prepared by Executive Deputy Commissioner Stan Gee. August 2008. Available on-line at: https://www.nysdot.gov/divisions/engineering/technical-services/trans-r-and-d-repository/NYSDOT%20Energy%20and%20Climate%20Change%20Report.pdf.

NCHRP Project 25-25, Task 45: Transportation Program Responses to GHG Reduction Initiatives and Energy Reduction Programs
Cambridge Systematics, Inc. 3-25
sought to reduce emissions from construction activities (including GHG) by amending contract language or awarding contract bonuses for contractors implementing clean diesel, air quality, and green construction practices.
Connecticut Department of Transportation – Connecticut DOT’s Clean Air Construction Initiative is a partnership with the Connecticut Construction Industries Association to require contractors to either retrofit their diesel equipment with diesel oxidation catalysts or use alternative clean fuels during construction programs. The Initiative also introduces idling restrictions and truck staging zones where diesel emissions may have the least air quality impacts. Under the program, requirements are built into initial contract bid specifications so contractors may plan and include in bids additional retrofit costs. Estimates indicated that the requirements reduced air pollutants and particulate matter during the I-95 New Haven Harbor Crossing Corridor Improvement Program, but no evidence of GHG or fuels savings was prepared.61
Alternative Construction Materials Significant greenhouse gas emissions are produced during production processes of cement and concrete used in road construction. Cement production generates GHG from calcination, the chemical process in which limestone calcium carbonate (CaCO3) is heated to form calcium oxide (CaCO), and combustion of fuel to power the production processes. In 2004, Caltrans estimated the carbon contributions cement production used in Department projects to be 1.44 million metric tons of CO2.62 A number of state Climate Action Plans recommend optimizing cement content in roadway construction activities as a strategy to reduce associated greenhouse gas emissions. The primary strategy to optimize cement production is to replace a percentage of cement with other materials (fly ash, slag, silica fume) in the production of concrete.
Additional alternative methods or recycled materials may be used in construction of road projects, including reclaimed asphalt pavement (RAP), cold in-place recycling pavement rehabilitation, recycled portland cement, and crumb rubber from vehicle tires. Because of the significant amount of materials consumed annually in construction practices, these methods, and materials have potential to reduce life-cycle costs and greenhouse gas emissions resulting from construction. FHWA’s Green Highways Program provides resources for states to apply recycled materials in construction projects. According to FHWA, each year, approximately 200 million tons of road materials are reprocessed, with 80
61 Connecticut Department of Transportation, “Clean Air Construction Initiative.” Web
page accessed November 2, 2008. Available on-line at: www.i95newhaven.com/poverview/environ_init.asp.
62 California Department of Transportation, “Climate Action Program at Caltrans.” December 2006. Available on-line at: http://www.dot.ca.gov/docs/ClimateReport.pdf.
NCHRP Project 25-25, Task 45: Transportation Program Responses to GHG Reduction Initiatives and Energy Reduction Programs
3-26 Cambridge Systematics, Inc.
percent of that material flowing to new highway projects. Reprocessing reduces the amount of new material and resources needed to produce new asphalt and concrete, resulting in reductions in the life-cycle emissions of new highway projects. FHWA estimates that an additional 50 million tons of asphalt paving is recycled on-site when repaving. Based on the total quantities of asphalt materials recycled back into roads, avoided energy consumption equaled 29 trillion Btu and CO2 emissions of 1,951,000 tons. FHWA estimates that at current coal fly ash usage rates, 15 million tons of portland cement are replaced annually, thus avoiding 10.5 million tons of CO2 emissions.63
California Department of Transportation – Caltrans is the lead agency of the California Climate Action Team’s Cement Subgroup. The Department has set a goal of reducing the amount of cement used in pavements and bridges by up to 50 percent. Currently, the typical Department concrete mix replaces 25 percent of the portland cement with fly ash, which has resulted in 25 percent less greenhouse gas emissions from statewide cement production. The Department received a U.S. EPA award for the use of recycled ash from burned coal in concrete for the construction of the new Bay Bridge. This project will use 450,000 cubic yards of concrete, and based on the new concrete mix will result in savings 0.75 million metric tons of CO2 during construction.64 A recommendation of the Climate Action Team is to adopt a universal maximum GHG intensity factor of 0.86 tons of CO2 per ton of cementitious material for all concrete used in California construction projects. This strategy is in place to encourage alternative construction practices and prevent the production of concrete used in California from occurring in states without a GHG standard.65
New York State Department of Transportation – The Department’s current policy is to allow and advocate the use of recycled materials whenever they perform as well as the materials replaced. Asphalt pavement, concrete, glass, plastics, and rubber are commonly recycled materials allowed by NYSDOT in transportation applications.
63 The White House, “Closing the Circle Awards: 2008 Nominations Forms.” Available on-
line at: http://www.fee.tteam.com/apply/uploads/2008CTC_id_163.doc. 64 California Department of Transportation, “Climate Action Program at Caltrans.”
December 2006. 65 California Department of Transportation, California Climate Action Team, Cement Sub-
Group, “Universal GHG Emissions Standards.” Available on-line at: http://www.dot.ca.gov/hq/esc/Translab/ClimateActionTeam/equivalent-ghg-emission-standards.html.
NCHRP Project 25-25, Task 45: Transportation Program Responses to GHG Reduction Initiatives and Energy Reduction Programs
Cambridge Systematics, Inc. 3-27
3.8 OTHER STRATEGIES Transportation Planning While departments of transportation have long acknowledged environmental considerations in transportation planning, increasingly energy efficiency, and climate change factors are being integrated into comprehensive statewide and project-level planning processes. State DOTs may provide incentives such as priority funding to agencies that proactively address long-term climate issues. Agencies also may require that transportation project assessments account for economic and environmental benefits, including associated energy efficiency measures and emission reduction strategies. To further integrate climate change and transportation project planning, states may need to develop better inventories and GHG emissions projections from transportation sources and improve modeling capabilities for evaluating energy and climate impacts of transportation projects. A small number of states require greenhouse gas emission impacts and projection in transportation project assessments, including California, New York, Washington, Oregon, and Massachusetts.
New York State Department of Transportation – The New York State Energy Plan, adopted in 2002, recommends that MPOs, in conjunction with the State, assess the energy use and greenhouse gas emissions expected to result from implementation of transportation plans and programs. In response, NYSDOT has drafted methodological guidance to help MPOs fulfill this recommendation. Eleven of the 13 MPOs in New York have now estimated energy use and CO2 emissions from their long-range transportation plans and also from their transportation improvement programs. According to NYSDOT, results to date indicate reductions of GHG emissions of 11 percent, compared to typical baseline cases. The State also examines GHG during project alternative selection processes. NYSDOT has indicated that improvements are needed in modeling methods for calculating GHG emissions and associated reductions.66
California Transportation Commission – In 2007, the Commission reviewed its guidelines for Regional Transportation Plans (RTP) to consider requiring local transportation planning agencies to include climate change emission reduction measures in regional plans. The Commission suggested that the state Legislature consider legislation mandating that RTPs include a greenhouse gas reduction strategy, perform a greenhouse gas analysis for plans, and provide additional funding to enhance coordinated land use and transportation planning and
66 New York State Department of Transportation, “New York State DOT Strategies for
Climate Change. Presentation by John Zamurs 2008 at the June 9, 2008 NASTO Annual Meeting in Pittsburgh, Pennsylvania. Available on-line at: http://www.nysdot.gov/nasto/repository/WS4d_Zamurs%20_AASHTO_0.ppt.
NCHRP Project 25-25, Task 45: Transportation Program Responses to GHG Reduction Initiatives and Energy Reduction Programs
3-28 Cambridge Systematics, Inc.
modeling through the existing California Blueprint Program.67 The Blueprint Program’s current grant guidelines include recommendations that regions incorporate greenhouse gas emissions reductions and climate change plans in long-term transportation and land use planning.
Massachusetts Executive Office of Energy and Environmental Affairs – In 2007, the Executive Office broadened the review requirements under the Massachusetts Environmental Policy Act to include analysis of greenhouse gas emissions for certain transportation projects. The policy change the Massachusetts Highway Department, or other project lead agencies, quantify GHG emissions from proposed transportation projects and identify measures to avoid, minimize and mitigate emissions. The policy describes analysis methodologies and scope for certain projects subject to environmental review and that the Commonwealth is involved in.68
Public Education and Awareness A number of State Climate Action Plans contain recommendations to enhance state efforts to educate the public regarding the link between transportation and climate change. State DOTs have responded, particularly following fuel prices increases in late 2008, by offering driver education seminars that promoted actions and behavior to enhance fuel economy. Existing programs that DOTs have traditionally offered include information on air quality requirements, environmental retro-fit, retirement programs for older and inefficient vehicles, and emissions check, and licensing programs. A number of states, including California, New York, Connecticut, and Vermont, have introduced policies requiring that vehicles sold in those states be accompanied with greenhouse gas emissions labels. States also have begun to increase attention to climate change during public participation processes and have increasingly produced public relations materials designed to increase awareness of clean transportation, energy efficiency, transportation-related GHG emissions reductions being undertaken by a state DOT, and the benefits and costs of GHG reduction alternatives. Washington State DOT is a leading example, producing fact sheets and creating web pages that describe what the agency is doing to address climate change.
67 California Transportation Commission, “Final Letter to Senate President Pro Tempore
Perata.” January 2007. Available on-line at: http://www.catc.ca.gov/programs/rtp/Final_Letter_to_Perata_with_Attachments.pdf.
68 Massachusetts Executive Office of Energy and Environmental Affairs, “MEPA Greenhouse Gas Policy and Protocol.” Presentation by MEPA Director Deerin Babb-Brott, December 2007. Available on-line at: http://www.eot.state.ma.us/smartgrowth/downloads/SessionsB/B6/B6_babb-brottd.pdf.
NCHRP Project 25-25, Task 45: Transportation Program Responses to GHG Reduction Initiatives and Energy Reduction Programs
Cambridge Systematics, Inc. 3-29
Comprehensive Sustainability Assessments and Planning A growing number of public and private agencies and organizations are engaged in comprehensive sustainability assessments and planning. Such activities examine the full range of the agency’s practices, and how they can be improved to support greater sustainability (including reduction of climate change impacts).
Oregon Department of Transportation – ODOT’s Sustainability Office has been in existence for the past four years, and staff remains the primary liaison to the State’s climate change planning efforts. In addition, the DOT has a well organized internal management structure to address sustainability and climate change, including:
• The Sustainability Council is a formal body comprised of nine mid- to senior-level managers representing a variety of functional, modal, and geographic backgrounds that provides policy and decision support to the Sustainability Program and its efforts;
• The Climate Change Executive Group is an informal group of six program-level managers, including Planning, Policy, and Government Relations as well as a representative from the Governor’s Office, that is tasked with developing internal policies; and
• The Technical Advisory Council is an informal coalition of staff persons across the agency’s divisions with technical expertise in air quality, traffic, operations, NEPA, etc. and an interest in environmental issues, and who meet to share information and coordinate technical work.
California Department of Transportation (Caltrans) – Caltrans has been one of the national leaders in considering performance measures in the context of a sustainability framework, as part of the vision that was adopted in the 2025 California Transportation Plan (CTP). Environmental quality is one of the three cornerstones of the sustainability framework guiding transportation investment in the State, along with a prosperous economy and social equity. Caltrans has developed or is considering a range of environmental indicators and measures that relate to the goals of the statewide transportation plan, including days exceeding national/state air quality standards by region/air basin and statewide and ratio of fossil fuel use to passenger miles traveled, as well as measures relating to greenhouse gases, ecological impacts, and water resources.
Alternative Energy Generation and Carbon Offsets Some state DOTs are beginning to examine ways of offsetting carbon emissions from other sources through strategies such as the use of right-of-way for alternative energy generation.
Oregon Department of Transportation – The agency is evaluating the potential of right-of-way to be used for solar panel installations. Solar power production would allow the agency to purchase green power at or below grid rates and reduce the agency’s emissions. Estimates found that a ground-mounted solar

NCHRP Project 25-25, Task 45: Transportation Program Responses to GHG Reduction Initiatives and Energy Reduction Programs
3-30 Cambridge Systematics, Inc.
panel system sited in an ODOT right-of-way could produce a solar electricity output of 100,000 kilowatt-hours annually. That amount of solar electricity generation could reduce carbon emissions by 38.9 metric tons of CO2 equivalent, compared to the Pacific Northwest Regional Energy Grid.69
Research State DOTs have used research funds to support research into strategies that may reduce GHG emissions by reducing travel, improving traffic operations, or increasing the use of alternative fuel and vehicle technologies.
New York State Department of Transportation – The Department has provided over $1 million in funding to establish a research institute focused on energy and sustainable transportation. In cooperation with the New York State Energy Research and Development Authority, the research funding will be focused on reducing vehicle-miles traveled.70
69 Oregon Department of Transportation, “Avoided Carbon Emissions from Solar Panel
Systems and Sequestered Carbon Emissions from Tree Growth.” Reported prepared by goodcompany.com. August 2008. Available on-line at: http://www.oregon.gov/ODOT/HWY/OIPP/docs/treesvsolar.pdf.
70 New York State Department of Transportation, “Climate and Energy Report.” August 2008. Available on-line at: http://www.nysdot.gov/divisions/engineering/technical-services/trans-r-and-d-repository/NYSDOT%20Energy%20and%20Climate%20Change%20Report.pdf.
NCHRP Project 25-25, Task 45: Transportation Program Responses to GHG Reduction Initiatives and Energy Reduction Programs
Cambridge Systematics, Inc. 4-1
4.0 Quantifying the Benefits of State DOT Actions
This section describes revised results from an illustrative assessment of the potential impacts of state DOT programs that reduce greenhouse gas emissions. The original objective of this task was to estimate ongoing nationwide GHG reductions as a result of current GHG actions, as well as potential additional reductions if such actions were undertaken more comprehensively by all state DOTs. Ultimately, it turned out to be very difficult to find reliable information from which to develop quantitative estimates of either ongoing or future reductions for most strategies. Therefore, the results shown in this section should be considered as illustrative of the magnitude of benefits that might be achieved, rather than as actual estimates of these benefits.
Basic Parameters and Baseline Data GHG reductions in this analysis are presented in absolute terms, expressed in metric tons (tonnes) or million metric tons (mmt) of CO2-equivalent emissions (CO2e).71 “Ongoing” reductions are presented as cumulative over the current decade (2000-2009), while potential future reductions are estimated as cumulative reductions from 2010 through 2030. Both “low” and “high” estimates are developed in order to create a range of plausible impacts.
In the conclusions to this section, the estimates of GHG reductions from state DOT actions are compared to total transportation GHG emissions in the United States. Emission forecasts through 2030 are based on the U.S. Department of Energy, Energy Information Administration Annual Energy Outlook (AEO), April 2009 release.72 These scaled forecasts show nearly flat transportation
71 A “tonne” or metric ton is 1,000 kilograms (about 2,200 lbs., slightly larger than a “short
ton” of 2,000 lbs.). 72 The April 2009 release of the AEO includes the effect of updated corporate average fuel
economy (CAFE) standards through 2016, various vehicle tax credits, and biofuels programs. However, it does not reflect the Obama Administration’s proposal to align Federal fuel efficiency standards with California’s proposed GHG emission standards. The estimates used in this report incorporate some minor adjustments made by the report authors to scale the AEO forecasts (which include only CO2) into GHG-equivalent emissions, or CO2e. The conversion involved adding a small amount of emissions to account for N2O, CH4, and refrigerants. The effect was to increase total emissions by about six to seven percent. The revised AEO forecasts are the same as those used in the U.S. Department of Transportation Report to Congress,
Footnote continued

NCHRP Project 25-25, Task 45: Transportation Program Responses to GHG Reduction Initiatives and Energy Reduction Programs
4-2 Cambridge Systematics, Inc.
emissions, increasing slightly from 2,154 mmt in 2006 to 2,171 mmt in 2030 (Table 4.1). The AEO forecasts reflects improvements in light-duty vehicle efficiency of 45 percent and in heavy truck efficiency of 14 percent over this period, which are offset by a VMT growth rate of about 1.5 percent annually.73 Light-duty vehicles accounted for about 59 percent of transportation’s total in 2006 and trucks for 17 percent, meaning that on-road sources accounted for just over three-quarters of all transportation GHG emissions. All of these figures include only direct emissions from the operation of transportation vehicles. They do not include other emissions such as those associated with fuel production and transport, vehicle manufacture, or infrastructure construction and maintenance.
Table 4.1 Baseline Transportation GHG Emissions and Forecasts (mmt CO2e)
Single-Year Cumulative Over Analysis Period
Transportation Subsector 2006 2030 2000–2009 2010–2030
All Transportation 2,154 2,171 18,672 43,773
On-Road 1,667 1,593 14,551 32,900
Light-Duty Vehicles 1,275 1,123 a 24,033
Heavy-Duty Vehicles 392 470 a 8,867
Source: 2006-2030 data from U.S. Department of Energy Annual Energy Outlook, April 2009 release, with adjustments by Cambridge Systematics, Inc. to account for non-CO2 emissions. 2000-2005 data from U.S. Environmental Protection Agency, Inventory of U.S. Greenhouse Gas Emissions and Sinks: 1990 to 2006 (2008).
b Not calculated due to differences in source data for 2000-2005 versus 2006-2009.
Some strategies will affect all types of highway travel (including light-duty/personal vehicles as well as trucks), while others will affect only one or the other. Since most light-duty vehicles are gasoline-powered and most trucks are diesel-powered, consideration is required of the different CO2 contents of the two
Transportation’s Role in Reducing Greenhouse Gas Emissions (publication anticipated fall 2009).
73 While short-term declines in VMT have been experienced due to higher fuel prices and the economic downturn, longer-term forecasts still project increasing VMT. However, many factors, such as higher or lower fuel prices, advances in fuel efficiency standards beyond current projections, low-carbon fuel standards, changing demographic trends, etc. could cause future VMT, vehicle efficiency, and total GHG emissions to vary from the AEO Reference case forecast. If the baseline is higher than projected, the tonnage reductions from a particular strategy will be proportionately higher (assuming the same percent reduction). Similarly, if the baseline is lower than projected, tonnage reductions from a particular strategy will be proportionately lower.
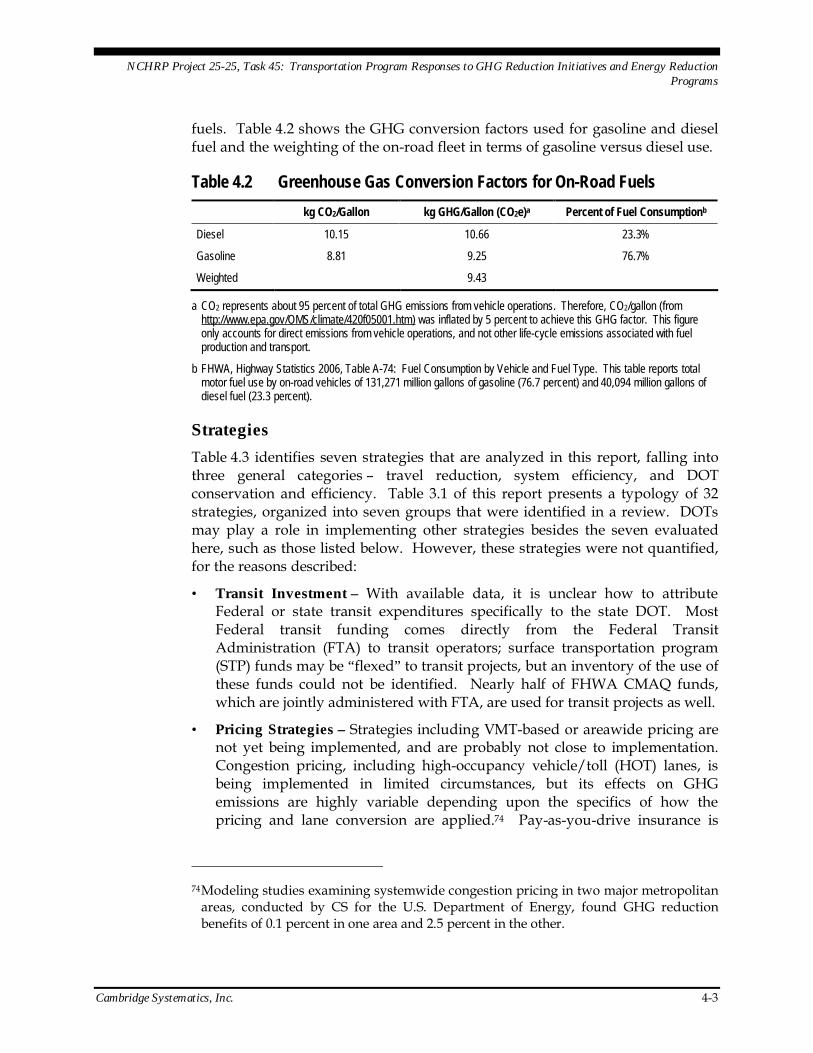
NCHRP Project 25-25, Task 45: Transportation Program Responses to GHG Reduction Initiatives and Energy Reduction Programs
Cambridge Systematics, Inc. 4-3
fuels. Table 4.2 shows the GHG conversion factors used for gasoline and diesel fuel and the weighting of the on-road fleet in terms of gasoline versus diesel use.
Table 4.2 Greenhouse Gas Conversion Factors for On-Road Fuels kg CO2/Gallon kg GHG/Gallon (CO2e)a Percent of Fuel Consumptionb
Diesel 10.15 10.66 23.3%
Gasoline 8.81 9.25 76.7%
Weighted 9.43
a CO2 represents about 95 percent of total GHG emissions from vehicle operations. Therefore, CO2/gallon (from http://www.epa.gov/OMS/climate/420f05001.htm) was inflated by 5 percent to achieve this GHG factor. This figure only accounts for direct emissions from vehicle operations, and not other life-cycle emissions associated with fuel production and transport.
b FHWA, Highway Statistics 2006, Table A-74: Fuel Consumption by Vehicle and Fuel Type. This table reports total motor fuel use by on-road vehicles of 131,271 million gallons of gasoline (76.7 percent) and 40,094 million gallons of diesel fuel (23.3 percent).
Strategies Table 4.3 identifies seven strategies that are analyzed in this report, falling into three general categories – travel reduction, system efficiency, and DOT conservation and efficiency. Table 3.1 of this report presents a typology of 32 strategies, organized into seven groups that were identified in a review. DOTs may play a role in implementing other strategies besides the seven evaluated here, such as those listed below. However, these strategies were not quantified, for the reasons described:
• Transit Investment – With available data, it is unclear how to attribute Federal or state transit expenditures specifically to the state DOT. Most Federal transit funding comes directly from the Federal Transit Administration (FTA) to transit operators; surface transportation program (STP) funds may be “flexed” to transit projects, but an inventory of the use of these funds could not be identified. Nearly half of FHWA CMAQ funds, which are jointly administered with FTA, are used for transit projects as well.
• Pricing Strategies – Strategies including VMT-based or areawide pricing are not yet being implemented, and are probably not close to implementation. Congestion pricing, including high-occupancy vehicle/toll (HOT) lanes, is being implemented in limited circumstances, but its effects on GHG emissions are highly variable depending upon the specifics of how the pricing and lane conversion are applied.74 Pay-as-you-drive insurance is
74 Modeling studies examining systemwide congestion pricing in two major metropolitan
areas, conducted by CS for the U.S. Department of Energy, found GHG reduction benefits of 0.1 percent in one area and 2.5 percent in the other.

NCHRP Project 25-25, Task 45: Transportation Program Responses to GHG Reduction Initiatives and Energy Reduction Programs
4-4 Cambridge Systematics, Inc.
largely outside the DOTs’ realm of influence although a couple have sponsored pilot studies on the topic.
• Land Use – A few DOTs have played a role in planning for more efficient land use patterns, for example, by funding corridor or local planning studies that consider both transportation and land use. However, DOTs typically do not take the lead role in this area, and a specific state DOT line-item to fund land use planning could only be identified in one state (California Department of Transportation provides $5 million per year for “blueprint” regional planning activities). While national-level estimates of the potential benefits of land use and “smart growth” strategies have been developed, it would be very difficult to attribute a specific increment of these benefits to state DOTs, since numerous actors and funding sources are typically involved in these projects.
• Alternative Fuels and Vehicle Technology – Alternative technologies in DOT fleets will be included under “DOT conservation and efficiency.” Broader fuels and technology initiatives – beyond just DOT vehicles – are for the most part outside of the DOTs’ realm of influence.
• Intermodal Access and Rail Infrastructure Improvements – There is insufficient data available to reliably assess the impact of intermodal improvements on truck-to-rail mode shifting and, therefore, GHG emissions. However, the benefits of individual improvements within a typical DOT’s sphere of influence are probably quite small, since the private sector has typically been responsible for the vast majority of investment in the rail and intermodal system.
• Transportation Planning, Sustainability Planning, and Research – The GHG impacts of planning and research initiatives alone cannot be quantified, without some knowledge of how programs and investments are affected by the consideration of GHG issues.
The effects of all of these strategies (except the last one) on transportation GHG reductions are evaluated in at least two other recent studies, including the Moving Cooler study75 and a U.S. DOT Report to Congress.76
75Cambridge Systematics, Inc. (2009). Moving Cooler: An Analysis of Transportation
Strategies for Reducing Greenhouse Gas Emissions. Washington, D.C.: Urban Land Institute.
76 U.S. DOT (2009). Transportation’s Role in Reducing U.S. Greenhouse Gas Emissions. Pending publication, fall 2009.
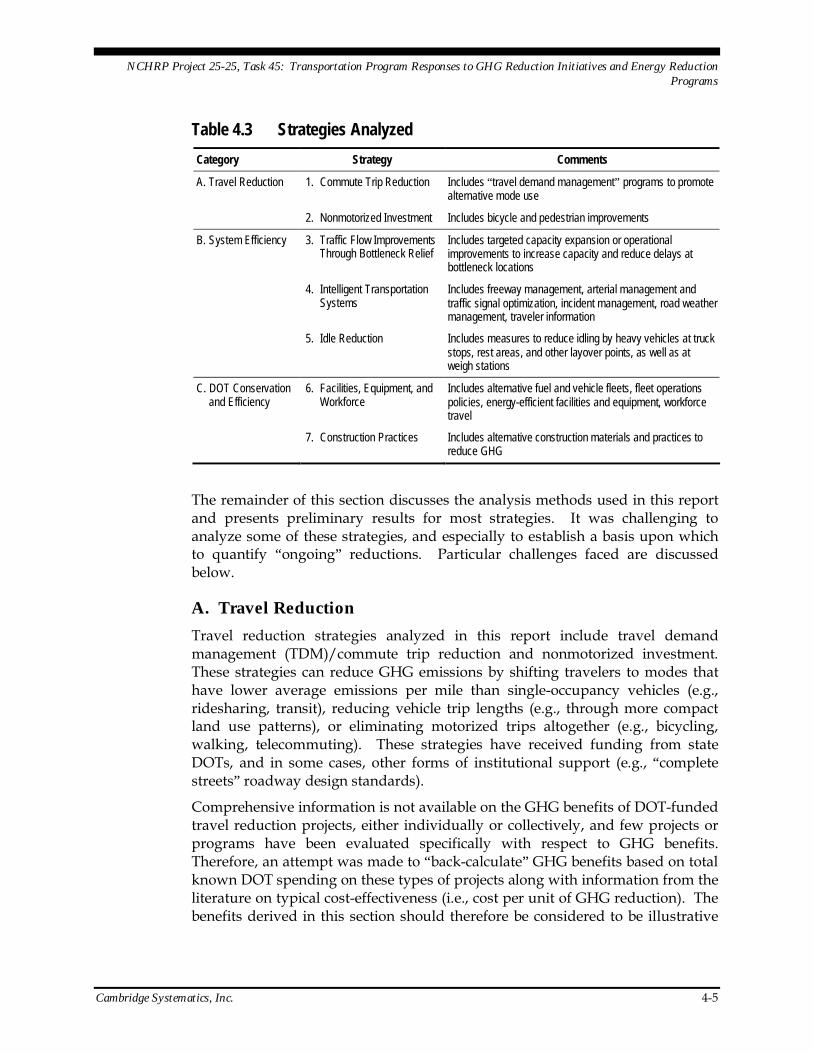
NCHRP Project 25-25, Task 45: Transportation Program Responses to GHG Reduction Initiatives and Energy Reduction Programs
Cambridge Systematics, Inc. 4-5
Table 4.3 Strategies Analyzed Category Strategy Comments
A. Travel Reduction 1. Commute Trip Reduction Includes “travel demand management” programs to promote alternative mode use
2. Nonmotorized Investment Includes bicycle and pedestrian improvements
B. System Efficiency 3. Traffic Flow Improvements Through Bottleneck Relief
Includes targeted capacity expansion or operational improvements to increase capacity and reduce delays at bottleneck locations
4. Intelligent Transportation Systems
Includes freeway management, arterial management and traffic signal optimization, incident management, road weather management, traveler information
5. Idle Reduction Includes measures to reduce idling by heavy vehicles at truck stops, rest areas, and other layover points, as well as at weigh stations
C. DOT Conservation and Efficiency
6. Facilities, Equipment, and Workforce
Includes alternative fuel and vehicle fleets, fleet operations policies, energy-efficient facilities and equipment, workforce travel
7. Construction Practices Includes alternative construction materials and practices to reduce GHG
The remainder of this section discusses the analysis methods used in this report and presents preliminary results for most strategies. It was challenging to analyze some of these strategies, and especially to establish a basis upon which to quantify “ongoing” reductions. Particular challenges faced are discussed below.
A. Travel Reduction Travel reduction strategies analyzed in this report include travel demand management (TDM)/commute trip reduction and nonmotorized investment. These strategies can reduce GHG emissions by shifting travelers to modes that have lower average emissions per mile than single-occupancy vehicles (e.g., ridesharing, transit), reducing vehicle trip lengths (e.g., through more compact land use patterns), or eliminating motorized trips altogether (e.g., bicycling, walking, telecommuting). These strategies have received funding from state DOTs, and in some cases, other forms of institutional support (e.g., “complete streets” roadway design standards).
Comprehensive information is not available on the GHG benefits of DOT-funded travel reduction projects, either individually or collectively, and few projects or programs have been evaluated specifically with respect to GHG benefits. Therefore, an attempt was made to “back-calculate” GHG benefits based on total known DOT spending on these types of projects along with information from the literature on typical cost-effectiveness (i.e., cost per unit of GHG reduction). The benefits derived in this section should therefore be considered to be illustrative

NCHRP Project 25-25, Task 45: Transportation Program Responses to GHG Reduction Initiatives and Energy Reduction Programs
4-6 Cambridge Systematics, Inc.
of the benefits that have been or could be achieved – rather than as reliable estimates of actual benefits.
The basic approach proposed to analyze the GHG benefits of TDM and nonmotorized strategies consisted of the following steps, as described in more detail below:
1. Evaluate recent/ongoing state DOT expenditures on these activities.
2. Identify available data on cost-effectiveness of these strategies with respect to VMT and GHG reduction, to estimate the amount of VMT and GHG reduction that may be associated with a unit of program expenditure for each of these strategies.
3. Apply the cost-effectiveness data in conjunction with current program expenditure data to estimate ongoing GHG reductions.
4. Apply the cost-effectiveness data in conjunction with assumptions about higher program expenditure levels to arrive at estimates of potential future GHG reductions.
Expenditures The project team attempted to review a sample of State Transportation Improvement Programs (STIP) to identify funding provided in the recent past and near future by type of projects. However, few of the STIPs reviewed give a summary breakdown of expenditures by the required program categories. It would have been impractical to review even a meaningful sample of STIPs line-by-line and categorize projects and, therefore, this data source was rejected.
As an alternative, Federal-aid highway funds authorized for TDM, nonmotorized, and land use planning-related activities were reviewed. There are a small number of programs that likely fund a majority of this work. These programs, and available evidence on the extent to which they support the specific types of GHG reduction projects of interest here, are described below:
• Congestion Mitigation and Air Quality Program (CMAQ) – CMAQ funding is available for areas that do not meet Federal air quality standards as well as former nonattainment areas that are now in compliance with air quality standards. In addition, a minimum amount of CMAQ funding is provided to all states regardless of air quality attainment status. CMAQ funds are distributed by state DOTs and MPOs for projects that improve air quality, and have been used in many areas for travel reduction projects, including TDM and ridesharing, nonmotorized improvements, and transit. A 2008 review of the CMAQ program found that between FY 2000 and FY 2005, 5 percent of funds were used for bicycle and pedestrian projects and 8 percent

NCHRP Project 25-25, Task 45: Transportation Program Responses to GHG Reduction Initiatives and Energy Reduction Programs
Cambridge Systematics, Inc. 4-7
for demand management and rideshare projects.77 Most of the remainder were used for transit (42 percent) or traffic flow improvements (32 percent). About 88 percent of CMAQ funds apportioned have been obligated.
• Transportation Enhancements Program (TE) – TE activities are projects that “expand travel choices and enhance the transportation experience by improving the cultural, historic, aesthetic, and environmental aspects of our transportation infrastructure.” As 10 percent of the Surface Transportation Program, TE is a large potential source of funding for trail projects. There are 12 different TE activity categories. FHWA provides a breakdown of funds expended on two categories relevant to this research: 1) pedestrian and bicycle facilities; and 2) conversion of abandoned railway corridors to trails.78
• Recreational Trails Program – This program is a grant program to support maintenance and development of recreational trails. At least 30 percent of all funds must be used for nonmotorized trails, and since 1995 this program has helped construct more than 100 miles of trail. Such trails may be used for transportation purposes as well and are therefore considered in this analysis.
• Safe Routes to School (SRTS) – This program makes funding available for a wide variety of programs and projects, from building safer street crossings to establishing programs that encourage children and their parents to walk and bicycle safely to school. A total of $610 million was authorized through SAFETEA-LU for FYs 2005 to 2009. However, of the $416 million apportioned by FHWA through March 2008, only approximately $75 million, or 18 percent, of the funds had been obligated by states.79
• Transportation, Community and System Preservation Program (TCSP) – TCSP projects should improve the efficiency of the transportation system, reduce the impacts of transportation on the environment, reduce the need for costly future public infrastructure, ensure efficient access to jobs, services and centers of trade, and encourage private sector development patterns. Trails are an eligible use of program funds. A fifth-year review of the program found that for FY 2001-2003, about 30 percent of funds were spent on bicycle and pedestrian projects and 15 percent on land use planning.80
• Other Federal-Aid Highway Programs – Surface Transportation Program (STP) funds can be used for a wide variety of purposes, including transit and nonmotorized projects. Some highway projects may also include
77 ICF International (2008). SAFETEA-LU 1808: CMAQ Evaluation and Assessment: Phase I
Final Report. Prepared for FHWA, FHWA-HEP-08-019. 78 http://www.enhancements.org/projectlist.asp. 79 http://www.gao.gov/new.items/d08789.pdf. 80 TCSP Fifth-Year Report. Prepared by Cambridge Systematics, Inc. for FHWA, 2005
(unpublished).
NCHRP Project 25-25, Task 45: Transportation Program Responses to GHG Reduction Initiatives and Energy Reduction Programs
4-8 Cambridge Systematics, Inc.
nonmotorized improvements as a project component. A breakdown of spending under these programs sufficient to identify expenditures for the specific types of projects of interest here is not available and, therefore, these sources could not be included in the analysis.
• State Funds – State DOTs may expend state transportation funds in addition to Federal funds to support TDM, nonmotorized travel, transit, and land use planning. An inventory of such expenditures is not available. However, since most Federal projects require at least a 20 percent local match, it may be inferred that state expenditures equal at least 20 percent of the Federal expenditures from the programs identified above.
Table 4.4 provides an inventory of Federally authorized funds by program and type of use, as estimated based on the data on each program described above. This includes the following sources:
• Demand Management – CMAQ; and
• Bicycle and Pedestrian – CMAQ, TE, Recreational Trails, Safe Routes to School, TCSP.
To support the GHG calculations, these funding amounts by program type were inflated by 20 percent to account for local matching funds, except for the TE funding data, which already included the local match.

NCHRP Project 25-25, Task 45: Transportation Program Responses to GHG Reduction Initiatives and Energy Reduction Programs
Cambridge Systematics, Inc. 4-9
Table 4.4 Federal Funding for TDM and Nonmotorized Programs ($Millions)a
Program and Use Percent of Program 2000 2001 2002 2003 2004 2005 2006 2007 2008 2009
Congestion Mitigation and Air Quality Improvement Program (CMAQ)
Total Authorized 100% 1,358.0 1,385.0 1,407.0 1,434.0 1,400.0 1,667.2 1,694.1 1,721.4 1,749.1 1,777.3
Total Obligated 88% 1,195.0 1,218.8 1,238.2 1,261.9 1,232.0 1,467.1 1,490.8 1,514.8 1,539.2 1,564.0
Total Obligated with Local Match 125% 1,493.8 1,523.5 1,547.7 1,577.4 1,540.0 1,833.9 1,863.5 1,893.5 1,924.0 1,955.0
Bicycle/Pedestrian 5% 74.7 76.2 77.4 78.9 77.0 91.7 93.2 94.7 96.2 97.8
TDM and Rideshare 8% 119.5 121.9 123.8 126.2 123.2 146.7 149.1 151.5 153.9 156.4
Transportation Enhancements (TE)
Bicycle/Pedestrian Obligated (including Local Match)
549.0 489.0 660.0 632.0 408.0 354.0 517.0 459.0 207.0 81.0
Safe Routes to School
Apportioned - - - - - 54.0 99.0 125.0 147.0 183.0
Obligated (Bicycle/Pedestrian) 18% - - - - - 9.7 17.8 22.5 26.5 32.9
Total with Local Match (Bike/Ped) 125% 12.2 22.3 28.1 33.1 41.2
Recreational Trails
Obligated 100% 44.2 44.8 47.6 44.9 44.0 43.5 58.0 65.9 62.8 62.8
Total w/Local Match 125% 55.3 56.0 59.5 56.1 55.0 54.4 72.5 82.4 78.5 78.5
Bike/Ped 30% 16.6 16.8 17.9 16.8 16.5 16.3 21.8 24.7 23.6 23.6
Transportation, Community, and System Preservation Program (TCSP)
Total (Appropriations) 100% 35.0 51.7 276.1 90.0 25.0 25.0 60.3 55.0 53.4 53.4
Total with Local Match 125% 43.8 64.6 345.1 112.5 31.3 31.3 75.3 68.8 66.8 66.8
Bicycle/Pedestrian 30% 13.1 19.4 103.5 33.8 9.4 9.4 22.6 20.6 20.0 20.0
a Sources: Shaded cells represent assumptions or estimates by Cambridge Systematics, Inc. CMAQ authorizations – NHI Course 141053, The CMAQ Program: Purpose and Practice; total obligation percentage – http://www.fhwa.dot.gov/environment/cmaqpgs/msgobsrec1.htm; bicycle/pedestrian and TDM/rideshare percentages from ICF International (2008), SAFETEA-LU 1808: CMAQ Evaluation and Assessment: Phase I Final Report, prepared for FHWA, FHWA-HEP-08-019. TE obligations – compiled from state-level data at http://www.enhancements.org/projectlist.asp. SRTS apportionments- http://safety.fhwa.dot.gov/saferoutes/funding/, 18% obligation rate from General Accountability Office, “Safe Routes To School: Progress in Implementing the Program, but a Comprehensive Plan to Evaluate Program Outcomes Is Needed,” July 2008. Recreational Trails obligations – http://www.fhwa.dot.gov/environment/rectrails/recfunds93_06.htm; 30% bike/ped share is based on requirement that at least 30 percent of all funds must be used for non-motorized trails. TCSP appropriations – http://www.fhwa.dot.gov/tcsp/projects.html; bicycle/pedestrian assumptions based on unpublished data prepared by Cambridge Systematics for the TCSP Fifth-Year Report

NCHRP Project 25-25, Task 45: Transportation Program Responses to GHG Reduction Initiatives and Energy Reduction Programs
4-10 Cambridge Systematics, Inc.
Cost-Effectiveness Identifying appropriate cost-effectiveness data by project type proved to be another challenge. Only one published study was identified that estimated cost-effectiveness of the listed strategies directly in terms of GHG reduced. The Moving Cooler study81 estimated cost-effectiveness for a wide range of transportation strategies if applied on a nationwide basis. Estimates for worksite-focused TDM strategies are in the range of $35-$40 per tonne considering direct implementation costs only. Bicycle and pedestrian projects are estimated to have a cost in the range of $80- $220 per tonne, based on city/regionwide deployment of improved bicycle and pedestrian infrastructure at varying levels of aggressiveness. However, these are program-wide estimates (i.e., for a comprehensive set of projects) rather than estimates for individual projects.
Other evidence on cost-effectiveness can be inferred from two previous evaluation reports on the CMAQ program82 as well as a 1994 report for the National Association of Regional Councils on transportation control measures.83 The authors’ estimates of GHG cost-effectiveness based on the data contained in each of these three reports are shown in Table 4.5. The Apogee report was a literature review in which the authors provided a best estimate of cost per VMT reduced, so the conversion to cost per ton of GHG required only an assumption about average vehicle fuel efficiency and conversion into 2008 dollars using the consumer price index. The two CMAQ studies both developed original estimates of pollutant reduction cost-effectiveness based on evaluation data on travel (VMT and vehicle-trip) impacts for a number of projects within each project category. Cost-effectiveness from the CMAQ studies is reported only as cost per ton of criteria pollutant reduced (VOC and NOx). Therefore, GHG cost-effectiveness was “back-calculated” for this study using assumptions about emission factors, average fuel efficiency (19.6 mpg), and CO2 emission rates (19.6 pounds/gallon). The 2002 study used uniform emission factors which it applied to its case study projects to ensure that emissions cost-effectiveness estimates
81 Cambridge Systematics (2009), ibid. 82 Transportation Research Board (2002). The Congestion Mitigation and Air Quality
Improvement Program: Assessing 10 Years of Experience. TRB Special Report 264, National Academy Press, Washington, D.C.; and ICF International (2008). SAFETEA-LU 1808: CMAQ Evaluation and Assessment: Phase I Final Report. Prepared for FHWA, FHWA-HEP-08-019.
83 Apogee (1994). Costs and Effectiveness of Transportation Control Measures (TCMs): A Review and Analysis of the Literature. Prepared for the National Association of Regional Councils.
NCHRP Project 25-25, Task 45: Transportation Program Responses to GHG Reduction Initiatives and Energy Reduction Programs
Cambridge Systematics, Inc. 4-11
were consistent.84 For the 2008 study, uniform emission factors could not be identified in the report, so emission factors were derived from the EPA’s National Emissions Model System (NEMS) data on total emissions and total VMT in the United States, divided to produce an average emissions rate.85 The most appropriate emission factor to use is not certain, since the emission factors used in the underlying project evaluations could be based on different evaluation years, and emission factors would also be different depending upon the vehicle mix, meteorological conditions, control programs, etc. in any given area. Therefore, the GHG cost-effectiveness estimates based on the 2008 CMAQ report could be off by a factor of at least two based on this uncertainty factor alone.
84 The factors for the first five years of project life were 0.55 g/mi for reactive organic gas
(ROG) and 1.02 g/mi for NOx, where NOx was given four times the rate of ROG for a weighted average of 0.93 g/mi of pollutant (TRB 2002, p. 293).
85 Average emission factors from the 2005 NEMS, the last year available, were 1.23 g/mi VOC and 1.06 g/mi NOx. These were averaged (since VOC and NOx were not weighted in the 2008 report) for a result of 1.14 g/mi.

NCHRP Project 25-25, Task 45: Transportation Program Responses to GHG Reduction Initiatives and Energy Reduction Programs
4-12 Cambridge Systematics, Inc.
Table 4.5 Calculated GHG Cost-Effectiveness Estimates by Source $/tonne CO2e
Project Type Low Median or Single
Value High
1994 NARC/Apogee Report
Employer trip reduction $956
Areawide ridesharing $56
HOV lanes $371
Bicycle/pedestrian facilities $984
2002 TRB CMAQ Evaluation Report
Regional ridesharing $3 $21 $45
Vanpool programs $15 $29 $249
Park-and-ride lots $24 $120 $198
Ridesharing Total (average) $14 $57 $164
Miscellaneous TDM $6 $35 $93
Employer trip reduction programs $16 $64 $493
Travel Demand Management Total (average) $11 $49 $293
Bicycle/Pedestrian $12 $235 $966
2008 FHWA CMAQ Evaluation Report
Regional ridesharing $231 $1,319
Vanpool programs $89 $447
Park-and-ride lots $37 $19,215
Travel demand management $44 $8,154
TDM/Shared Ride Programs (average) $100 $7,284
Bicycle/Pedestrian Facilities $1,700 $18,693
Source: Authors’ calculations based on VMT and pollutant emission reduction cost-effectiveness estimates presented in each report.
Another challenge to using the data in these reports is that the range of cost-effectiveness estimates for each type of project varies widely. For example, in the 2002 CMAQ evaluation report, regional ridesharing programs ranged from a low of $1,200 per tonne of pollutant (an estimated $3/tonne CO2) to a high of $16,000 per tonne of pollutant ($45/tonne CO2). The least cost-effective vanpool program was $89,000/tonne pollutant ($249/tonne CO2). The cost-effectiveness data are based on travel reduction estimates reported by project sponsors, which may vary widely depending not only on the individual project but also the quality of the estimate. Furthermore, the sample sizes are fairly small, with typically five to 15 projects per category in the 2006 report and less than five projects per category in the 2008 report.
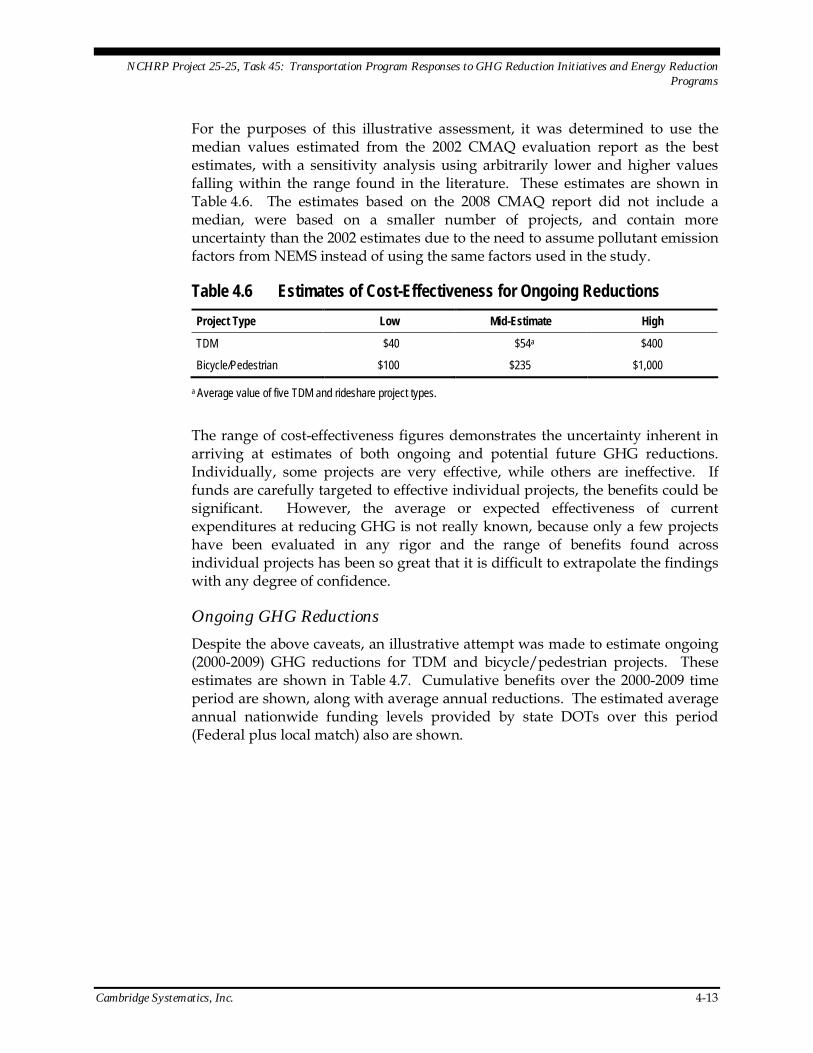
NCHRP Project 25-25, Task 45: Transportation Program Responses to GHG Reduction Initiatives and Energy Reduction Programs
Cambridge Systematics, Inc. 4-13
For the purposes of this illustrative assessment, it was determined to use the median values estimated from the 2002 CMAQ evaluation report as the best estimates, with a sensitivity analysis using arbitrarily lower and higher values falling within the range found in the literature. These estimates are shown in Table 4.6. The estimates based on the 2008 CMAQ report did not include a median, were based on a smaller number of projects, and contain more uncertainty than the 2002 estimates due to the need to assume pollutant emission factors from NEMS instead of using the same factors used in the study.
Table 4.6 Estimates of Cost-Effectiveness for Ongoing Reductions Project Type Low Mid-Estimate High
TDM $40 $54a $400
Bicycle/Pedestrian $100 $235 $1,000
a Average value of five TDM and rideshare project types.
The range of cost-effectiveness figures demonstrates the uncertainty inherent in arriving at estimates of both ongoing and potential future GHG reductions. Individually, some projects are very effective, while others are ineffective. If funds are carefully targeted to effective individual projects, the benefits could be significant. However, the average or expected effectiveness of current expenditures at reducing GHG is not really known, because only a few projects have been evaluated in any rigor and the range of benefits found across individual projects has been so great that it is difficult to extrapolate the findings with any degree of confidence.
Ongoing GHG Reductions Despite the above caveats, an illustrative attempt was made to estimate ongoing (2000-2009) GHG reductions for TDM and bicycle/pedestrian projects. These estimates are shown in Table 4.7. Cumulative benefits over the 2000-2009 time period are shown, along with average annual reductions. The estimated average annual nationwide funding levels provided by state DOTs over this period (Federal plus local match) also are shown.

NCHRP Project 25-25, Task 45: Transportation Program Responses to GHG Reduction Initiatives and Energy Reduction Programs
4-14 Cambridge Systematics, Inc.
Table 4.7 Estimates of Ongoing GHG Reductions from State DOT TDM and Bicycle/Pedestrian Programs 2000-2009, mmt CO2e
Cumulative and Average Annual GHG Reductions
Project Type Average Annual DOT
Funding (millions) Low Mid-Estimate High
TDM $137 3 25 34
Bicycle/Pedestrian $582 6 25 59
Total Cumulative $719 9 51 93
Average Annual 0.9 5.1 9.3
It can be observed from Table 4.7 that the benefit estimates could vary widely, depending upon the cost-effectiveness of projects undertaken, which as noted, is a subject of considerable uncertainty. In particular, the “low” and “high” benefit estimates both fall well within the range of individual project effectiveness estimates derived from the literature.
Potential Future Reductions Illustrative estimates of potential future reductions were made for the 2010-2030 period for two scenarios:
• Scenario 1 – Continue funding for all activities at current (2005-2009 average) levels;
• Scenario 2 – Quadruple current levels of spending on TDM and bicycle/pedestrian projects. Table 4.8 shows what this would mean in terms of aggregate spending per year on each of the program categories.
Table 4.8 Assumed State DOT and Local Match Expenditures on TDM and Bicycle/Pedestrian Programs $Millions per Year, 2010-2030
Project Type Scenario 1
Continue Current Levels Scenario 2
Aggressive Expansion
TDM $137 $606
Bicycle/Pedestrian $582 $2,327
Total $719 $2,933
The ”mid-estimate” cost-effectiveness figure shown in Table 4.6 is used. The results are shown in Table 4.9. To do a “reality check” on the numbers, the magnitude of results was compared to the magnitude of cumulative impacts estimated from nationwide implementation of TDM and nonmotorized strategies in the future (regardless of which agencies are responsible). The DOT estimates

NCHRP Project 25-25, Task 45: Transportation Program Responses to GHG Reduction Initiatives and Energy Reduction Programs
Cambridge Systematics, Inc. 4-15
presented here are in the same general range as the estimates from a recent nationwide study.86 This suggests that the figures shown in Table 4.7 represent an “upper bound” on what might be expected from state DOT actions, assuming that state DOTs become the primary force (through funding as well as planning support) in implementing TDM and nonmotorized programs.
Table 4.9 Estimates of Potential Future GHG Reductions from State DOT Demand Reduction Actions 2010-2030, mmt CO2e
Project Type Scenario 1
Continue Current Levels Scenario 2
Aggressive Expansion
TDM 53 236
Bicycle/Pedestrian 52 208
Total 105 444
Average Annual 5.0 21.1
B. System Efficiency System efficiency strategies focus on ways to optimize the use of the transportation network by improving the efficiency of transportation operations. Essentially, these strategies seek to reduce the energy use and greenhouse gas emissions associated with a given unit of passenger or freight travel (person-miles, vehicle-miles, or ton-miles). Most of the strategies discussed here are under the direct control of state DOTs as well as local transportation agencies that manage the operation of the transportation system. They include:
• Traffic flow improvements, including bottleneck relief and traffic management, to reduce congestion or otherwise keep vehicles moving at their most energy-efficient speeds; and
• Truck idle reduction strategies to reduce short- and long-duration idling of heavy vehicles.
The benefits of truck idle reduction strategies are fairly straightforward to estimate, as GHG emissions are reduced in proportion to the reduction in time spent idling (with some potential offsetting emissions from alternative power 86 Moving Cooler estimated cumulative reductions of 61 mmt CO2e between 2010 and 2030
for bicycle and pedestrian programs for a nationwide expansion of current best practice, and 134 mmt CO2e for a more aggressive investment scenario. Estimates for worksite-based TDM programs ranged from 33 mmt CO2e cumulatively between 2010 and 2030 for widespread employer outreach and ridesharing support, to 208 mmt for a more aggressive program that included requirements for employers with at least 50 employees to develop and implement trip reduction plans.
NCHRP Project 25-25, Task 45: Transportation Program Responses to GHG Reduction Initiatives and Energy Reduction Programs
4-16 Cambridge Systematics, Inc.
sources). Traffic flow improvements, however, have much more complex impacts. Fuel consumption varies by speed but is typically highest at low speeds (under 30 mph) and high speeds (well over 60 mph), and in driving conditions with much acceleration and deceleration, although fuel consumption characteristics vary by individual vehicle. Conversely, fuel consumption is lower when vehicles are driven at steady and moderate speeds. Improvements that keep traffic movement at relatively constant, but moderate, speeds will, therefore, have the greatest GHG benefit. Estimates of the GHG benefits of such strategies, if applied on a national scale, necessarily involve many approximations since it is not possible to analyze the operational details of every improvement.
For traffic flow improvements (bottleneck relief and traffic management), GHG reductions in this study are based on speed-fuel consumption relationships. The analysis of GHG reductions from system efficiency strategies was performed by estimating a reduction in delay per 1,000 VMT from each strategy, and then calculating the reduction in fuel consumption per hour of delay reduced. This calculation was based on relationships developed for FHWA by SAIC,87 adjusted for acceleration and deceleration effects. The SAIC formulas indicate a fuel savings of 0.62 gallons per hour of delay reduced for passenger cars, 1.607 gallons per hour for single-unit trucks, and 1.934 gallons per hour for combination trucks, for a weighted value of 0.71 gallons per hour across all vehicles. However, the formulas probably underestimate the fuel savings of delay reduction because they do not consider the effects of reduced acceleration and deceleration. Correction factors were developed by evaluating relationships between average speed and fuel efficiency embedded in FHWA’s ITS Deployment and Analysis System (IDAS) model and the U.S. Environmental Protection Agency’s new draft MOVES model (March 2009 release). Evaluation of the speed-fuel consumption curves suggests that within the speed ranges where most congestion reductions would occur (20-45 mph), the change in fuel consumption per hour of delay reduced is about 40 percent higher than from the SAIC equations (based on IDAS) or 30 percent higher (based on MOVES). For this analysis, the SAIC delay-fuel consumption relationships were increased by 30 percent, the lower of these adjustments.
Another important consideration in estimating the GHG benefits of traffic flow improvements is induced demand. Induced demand is defined as the increase in travel in response to improved highway conditions. To the extent that they reduce travel times, traffic management strategies would also result in induced demand and lower GHG reductions than would be expected just from the flow improvements. The magnitude of the induced demand effect, however, is subject to considerable debate. Relationships between delay reductions and fuel
87 SAIC (1993). Speed Determination Models for the Highway Performance Monitoring System.
Prepared for FHWA by Science Applications International Corporation.
NCHRP Project 25-25, Task 45: Transportation Program Responses to GHG Reduction Initiatives and Energy Reduction Programs
Cambridge Systematics, Inc. 4-17
savings are also subject to uncertainty. Therefore, it is difficult to draw definitive conclusions regarding the net GHG impacts of traffic flow improvements. For comparison in this study, results are presented both with and without the inclusion of induced demand effects.
A final consideration is that the future effectiveness of traffic management strategies as a GHG reduction strategy will depend upon vehicle technology. With hybrid and electric-drive vehicles, driving cycles have a much lesser impact on fuel consumption and emissions. For example, today’s hybrid-electric vehicles have urban fuel economy ratings that typically approach or exceed highway fuel economy ratings. All of the benefits estimates cited here assume current vehicle technology, albeit with improved fuel economy as assumed in the baseline forecasts from AEO referenced at the beginning of this section.
Bottleneck Relief Ongoing Reductions
It is challenging to estimate the “ongoing” GHG reductions from bottleneck relief or other traffic flow improvement projects, as there is no comprehensive list of such completed projects. The project team examined Highway Performance Monitoring System (HPMS) data from the Federal Highway Administration (FHWA) to see if it was possible to identify HPMS sections that have undergone lane additions over time. Unfortunately, HPMS could not be used for this type of time series analysis, as only half the sections from the 2000 and 2007 datasets could be matched. The reason is that states can delete sections or modify their endpoints from year to year. As a result, estimates of the direct effect of past improvements on GHG emissions are not available.
However, a simple analysis could be performed with historical HPMS data. For Interstate highways (rural and urban) and other freeways (urban only), delay and the excess fuel consumed in delay were first estimated using 2007 VMT and capacity data (Table 4.10, middle column). What delay and fuel use would have been with 2007 VMT but 2000 capacities also was estimated (Table 4.10, right column). (For all scenarios the same delay-fuel consumption relationship was used as described above, so this analysis did not account for any changes in the overall efficiency or car versus truck composition of the vehicle fleet.) The difference between the actual and forecasted 2007 values scenario captures the effect of capacity improvements that occurred in this period, albeit rather crudely. VMT grew by 14 percent between 2000 and 2007 while the excess fuel use due to delay increased by 23 percent. The reason for the differential is that sections already congested in 2000 see an exponential increase in delay as VMT increases. The forecasted 2007 results indicate that with no capacity improvements (just VMT growth), excess fuel use would have increased by 78 percent. The capacity improvements are credited with saving just over three billion gallons of fuel and reducing CO2 emissions by 29 mmt. If these benefits are scaled to start from zero in 2000 and increase linearly through 2008, the cumulative benefits over the 2000-2009 period are 187 mmt.

NCHRP Project 25-25, Task 45: Transportation Program Responses to GHG Reduction Initiatives and Energy Reduction Programs
4-18 Cambridge Systematics, Inc.
This analysis does not consider any offsetting effects of induced demand. In the next section, induced demand effects are analyzed for their effect on potential future reductions and compared with reductions without such effects. A lower estimate considering induced demand was also included that was calculated by reducing the “without induced demand” estimate by 70 percent, which is the reduction estimated for “future benefits” for the more aggressive expansion scenario (see next section). The analysis also does not account for any additional emissions related to the construction of bottleneck relief projects (including emissions from construction materials and activity, as well as emissions from additional workzone-related traffic delay).
Table 4.10 Delay-Related Fuel Use, Interstates, and Urban Freeways
Excess Fuel Consumed Because of Delay, Peak Periodsa
(Millions of Gallons)
Highway Type 2000 VMT and
Capacities 2007 VMT and
Capacities 2007 VMT with 2000
Capacities
Rural Interstate 123 125 237
Urban Interstate 4,351 5,439 7,679
Urban Freeways 1,153 1,362 2,096
Total 5,627 6,925 10,012
Capacity Expansion Benefits 3,087
GHG Reduction (mmt)
2007 28
Cumulative, 2000-2009 187
Cumulative, 2000-2009 with Induced Demand
56
a Peak periods are defined as the three highest volume hours on weekday mornings plus the three highest volume hours on weekday afternoons.
Potential Future Reductions
The analysis of potential future reductions from bottleneck relief is based in part on analysis of delay reduction and fuel savings benefits done for the American Highway Users’ Alliance (AHUA)88 and is similar to methods developed for the Moving Cooler study. The AHUA work compiled a list of national bottlenecks, almost exclusively freeway-to-freeway interchanges, where the majority of delay occurs in urban areas. These locations were then identified in the HPMS data. Delay with and without improvements to a target level of service was calculated using a procedure in FHWA’s Surface Transportation Efficiency Analysis Model (STEAM), and fuel savings were then estimated. In this analysis, two scenarios 88American Highway Users’ Alliance (2004). Unclogging America’s Arteries: Effective Relief
for Highway Bottlenecks. Prepared by Cambridge Systematics, Inc.
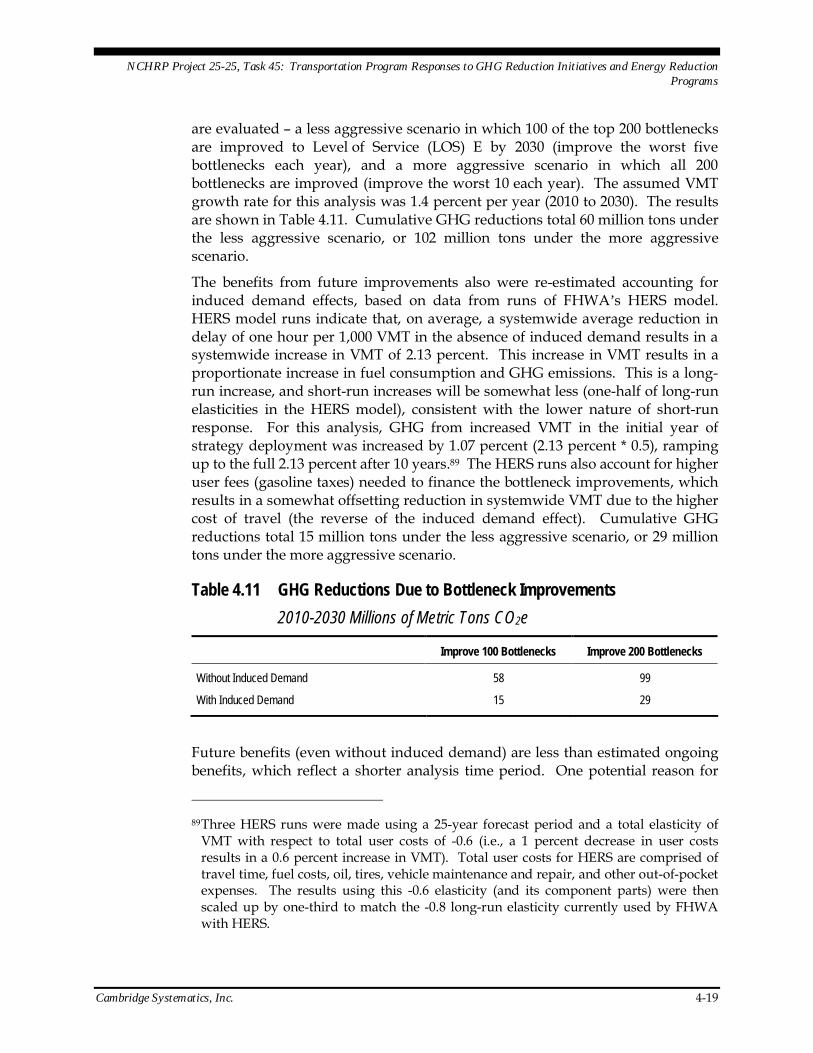
NCHRP Project 25-25, Task 45: Transportation Program Responses to GHG Reduction Initiatives and Energy Reduction Programs
Cambridge Systematics, Inc. 4-19
are evaluated – a less aggressive scenario in which 100 of the top 200 bottlenecks are improved to Level of Service (LOS) E by 2030 (improve the worst five bottlenecks each year), and a more aggressive scenario in which all 200 bottlenecks are improved (improve the worst 10 each year). The assumed VMT growth rate for this analysis was 1.4 percent per year (2010 to 2030). The results are shown in Table 4.11. Cumulative GHG reductions total 60 million tons under the less aggressive scenario, or 102 million tons under the more aggressive scenario.
The benefits from future improvements also were re-estimated accounting for induced demand effects, based on data from runs of FHWA’s HERS model. HERS model runs indicate that, on average, a systemwide average reduction in delay of one hour per 1,000 VMT in the absence of induced demand results in a systemwide increase in VMT of 2.13 percent. This increase in VMT results in a proportionate increase in fuel consumption and GHG emissions. This is a long-run increase, and short-run increases will be somewhat less (one-half of long-run elasticities in the HERS model), consistent with the lower nature of short-run response. For this analysis, GHG from increased VMT in the initial year of strategy deployment was increased by 1.07 percent (2.13 percent * 0.5), ramping up to the full 2.13 percent after 10 years.89 The HERS runs also account for higher user fees (gasoline taxes) needed to finance the bottleneck improvements, which results in a somewhat offsetting reduction in systemwide VMT due to the higher cost of travel (the reverse of the induced demand effect). Cumulative GHG reductions total 15 million tons under the less aggressive scenario, or 29 million tons under the more aggressive scenario.
Table 4.11 GHG Reductions Due to Bottleneck Improvements 2010-2030 Millions of Metric Tons CO2e
Improve 100 Bottlenecks Improve 200 Bottlenecks
Without Induced Demand 58 99
With Induced Demand 15 29
Future benefits (even without induced demand) are less than estimated ongoing benefits, which reflect a shorter analysis time period. One potential reason for
89 Three HERS runs were made using a 25-year forecast period and a total elasticity of
VMT with respect to total user costs of -0.6 (i.e., a 1 percent decrease in user costs results in a 0.6 percent increase in VMT). Total user costs for HERS are comprised of travel time, fuel costs, oil, tires, vehicle maintenance and repair, and other out-of-pocket expenses. The results using this -0.6 elasticity (and its component parts) were then scaled up by one-third to match the -0.8 long-run elasticity currently used by FHWA with HERS.
NCHRP Project 25-25, Task 45: Transportation Program Responses to GHG Reduction Initiatives and Energy Reduction Programs
4-20 Cambridge Systematics, Inc.
this is that the ongoing benefits estimate reflects all capacity improvements undertaken over this time period, while the future benefits estimate reflects only improvements at the most significant bottlenecks. Differences in the analysis methodology also may explain the different results.
Traffic Management Strategies Traffic management strategies, including intelligent transportation systems (ITS), are assumed to result in reduced fuel consumption and GHG emissions by smoothing traffic flow, reducing stops and starts, and increasing average travel speeds into a vehicle’s most efficient operating range (30 to 60 mph). Due to data availability, the methodology used to analyze the “ongoing” benefits of ITS strategies is somewhat different than the methodology used to analyze potential future reductions. As a result, the mix of strategies is somewhat different, with a greater number of strategies being analyzed for future implementation.
Ongoing Reductions
The Texas Transportation Institute’s (TTI) 2007 Urban Mobility Monitoring Report contains estimates of gallons of fuel saved as a result of operational treatments and existing high-occupancy vehicle (HOV) lanes by year, starting in 2000 and continuing through 2005. “Operational treatments” include freeway incident management, freeway ramp metering, arterial street signal coordination, arterial street access management, and high-occupancy vehicle lanes. For this analysis, benefits in 2006 through 2009 were assumed to continue to increase along a linear trend consistent with benefits from 2000 through 2005.
The methodology applied to analyze future reductions could not be applied to estimate ongoing reductions because the analysis model used to estimate the effects of new ITS and operations deployment assumed that past deployments are included in the baseline condition; no attempt was made to assess what effect already-deployed ITS alone would have on future performance with this model. Instead, TTI’s data for the 2000-2005 period were used to estimate ongoing reductions. The set of ITS strategies analyzed by TTI for 2000-2005 is similar to the set that analyzed for the “potential future reductions” (see below), although it does not include advanced strategies that currently are in the very early stages of testing and deployment (such as Active Traffic Management). TTI’s strategies also include HOV lanes, which were not a component of this analysis; the TTI data did not permit the effects of HOV lanes to be distinguished from the other strategies, although they probably make a relatively small contribution. The methodologies also involve different capacity-delay and delay-fuel consumption relationships. Table 4.12 shows the benefits by year expressed in terms of fuel savings and GHG reduction. The total benefits for the 2000-2009 period are 14 mmt GHG.
The TTI estimate also do not account for induced demand effects. Making a similar adjustment for induced demand as described for bottleneck relief
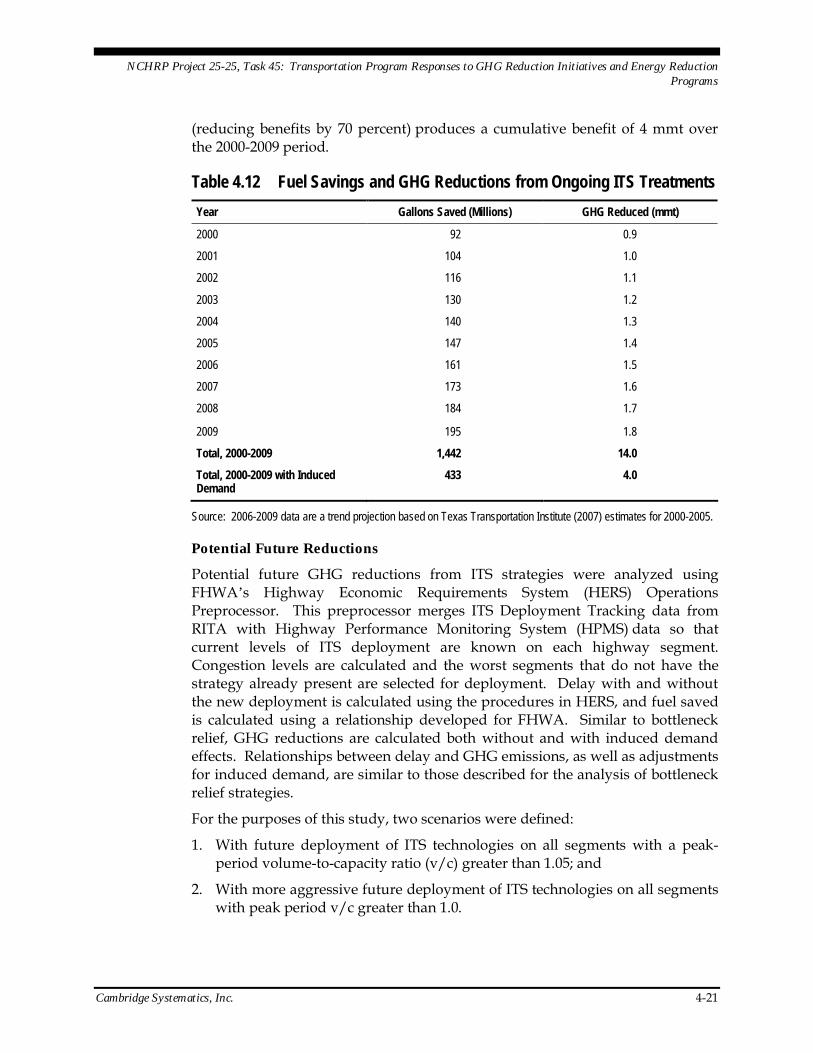
NCHRP Project 25-25, Task 45: Transportation Program Responses to GHG Reduction Initiatives and Energy Reduction Programs
Cambridge Systematics, Inc. 4-21
(reducing benefits by 70 percent) produces a cumulative benefit of 4 mmt over the 2000-2009 period.
Table 4.12 Fuel Savings and GHG Reductions from Ongoing ITS Treatments Year Gallons Saved (Millions) GHG Reduced (mmt)
2000 92 0.9
2001 104 1.0
2002 116 1.1
2003 130 1.2
2004 140 1.3
2005 147 1.4
2006 161 1.5
2007 173 1.6
2008 184 1.7
2009 195 1.8
Total, 2000-2009 1,442 14.0
Total, 2000-2009 with Induced Demand
433 4.0
Source: 2006-2009 data are a trend projection based on Texas Transportation Institute (2007) estimates for 2000-2005.
Potential Future Reductions
Potential future GHG reductions from ITS strategies were analyzed using FHWA’s Highway Economic Requirements System (HERS) Operations Preprocessor. This preprocessor merges ITS Deployment Tracking data from RITA with Highway Performance Monitoring System (HPMS) data so that current levels of ITS deployment are known on each highway segment. Congestion levels are calculated and the worst segments that do not have the strategy already present are selected for deployment. Delay with and without the new deployment is calculated using the procedures in HERS, and fuel saved is calculated using a relationship developed for FHWA. Similar to bottleneck relief, GHG reductions are calculated both without and with induced demand effects. Relationships between delay and GHG emissions, as well as adjustments for induced demand, are similar to those described for the analysis of bottleneck relief strategies.
For the purposes of this study, two scenarios were defined:
1. With future deployment of ITS technologies on all segments with a peak-period volume-to-capacity ratio (v/c) greater than 1.05; and
2. With more aggressive future deployment of ITS technologies on all segments with peak period v/c greater than 1.0.

NCHRP Project 25-25, Task 45: Transportation Program Responses to GHG Reduction Initiatives and Energy Reduction Programs
4-22 Cambridge Systematics, Inc.
The ITS and operational strategies included in this analysis are:
• Signal optimization and coordination (retiming signals to reduce intersection delay, and/or coordinating control of traffic signals along a corridor or network);
• Adaptive signal control (use of advanced software that continuously updates signal timing based on demand);
• Incident management (identifying incidents more quickly, improving response times, and managing incident scenes more effectively);
• Traveler information (providing real-time information on traffic conditions to travelers so they can choose the most efficient route, mode, or time of travel);
• Ramp metering (stoplights to regulate the flow of freeway on-ramp traffic during periods of high demand);
• Integrated Corridor Management (coordination among multiple strategies); and
• Active Traffic Management (emerging strategies such as lane control, speed harmonization, and queue warning to squeeze extra capacity out of the system and prevent flow breakdown).
The less aggressive scenario assumes deployment along 200 miles of freeways and 400 miles of arterials per year nationwide, while the more aggressive scenario assumes deployment at a rate of 500 miles of freeways and 1,000 miles of arterials per year.
The results appear in Table 4.13. Cumulative additional GHG reductions range from 250 to 359 million metric tons depending upon the scenario. Results also were recalculated considering induced demand effects. This was done by reducing the benefits by 70 percent, which as noted is about the same percentage reduction as observed for bottleneck relief. The net effect is to reduce the benefits of these strategies to about 75 to 108 mmt CO2e cumulatively. Again, there is considerable uncertainty into the effects of induced demand and the best way to estimate these effects; therefore, this should be considered as one illus-trative scenario.
Table 4.13 Additional GHG Reductions Due to ITS and Operational Deployments, 2010-2030 (mmt CO2e)
Low Scenario High Scenario
Without Induced Demand 250 359
With Induced Demand 75 108

NCHRP Project 25-25, Task 45: Transportation Program Responses to GHG Reduction Initiatives and Energy Reduction Programs
Cambridge Systematics, Inc. 4-23
Truck Idling Reduction The freight strategies evaluated in this section are directed at reducing idling emissions from trucks, including idling as a result of delay at weigh stations, as well as extended idling at truck stops and other locations.
Electronic Credentialing to Bypass Weigh Stations
For this measure, ongoing reductions from existing deployment of the PrePass and NORPASS electronic credentialing systems are first evaluated. PrePass is a transponder-based prescreening system that enables enrolled trucks meeting predefined criteria to bypass weigh stations that have been retrofitted with the PrePass infrastructure, saving time, reducing fuel use, and improving safety. As of early 2009, 28 states were participating in the program.90 NORPASS (the North American Preclearance and Safety System) is a similar system created through a partnership of state and provincial agencies and trucking industry representatives (currently with 11 partner states and provinces). It is fully compatible with PrePass.91
To estimate potential future reductions, the PrePass and NORPASS electronic credentialing systems are assumed to be expanded so they cover all 49 mainland states and both systems are recognized at all weigh stations and inspection sites in these states, with an equivalent system implemented in Hawaii. This expansion is assumed to be implemented over 15 years (2010-2025) for a less aggressive scenario, and five years (2010-2015) for a more aggressive scenario. Full implementation requires that all trucks are instrumented with fully compatible transponders and that every weigh station is equipped with fully compatible receivers.
90 PrePass web site, www.prepass.com. Accessed January 2009. 91 NORPASS web site, http://www.norpass.org. Accessed January 2009.

NCHRP Project 25-25, Task 45: Transportation Program Responses to GHG Reduction Initiatives and Energy Reduction Programs
4-24 Cambridge Systematics, Inc.
The analysis used the following input data and assumptions:
• PrePass covers 281 facilities in 28 states;92
• Trucks with PrePass transponders: 421,759;93
• Bypasses at PrePass facilities in 2008: 56.0 million;94
• Bypasses per truck per facility: 0.47;
• NORPASS covers 48 sites in 7 states, and is compatible with PrePass’s 281 sites in 28 states;95
• Trucks with NORPASS transponders: 100,000+;
• Estimate of NORPASS bypasses (100,000 NORPASS trucks at NORPASS or PrePass facilities): 15.5 million;
• Estimated current eligible trucks, i.e., combination trucks (2008): 1.59 million;96
• Estimated current (2008) bypasses: 71.5 million;
• Potential total bypasses in the United States in 2008: 345.0 million; and
• Fuel saving per bypass: 0.10 gallons.
The analysis results in the following estimates of GHG reduction benefits:
• Current Decade (2000-2008): 0.3 mmt CO2e;
• Future (2009-2030) Low: 4.5 mmt CO2e; and
• Future (2009-2030) High: 5.6 mmt CO2e.
Weigh-in-Motion Screening at Weigh Stations
Under this measure, mainline weigh-in-motion (WIM) systems are installed at all 24-hour truck weigh stations and used to allow clearly underweight vehicles to bypass static scales. This is implemented over 15 years for a less aggressive scenario, and 5 years for a more aggressive scenario.
92 PrePass web site, http://www.prepass.com/Pages/Home.aspx. Accessed January 21,
2009. 93 Federal Motor Carrier Safety Administration (2008). “FMCSA Update – AASHTO
SCOHT Meeting,” Presentation, June 26, 2008. 94 Prepass, ibid. 95 NORPASS web site, www.norpass.net. Accessed January 21, 2009. 96 U.S. Census Bureau (2004). 2002 Economic Census: Vehicle Inventory and Use Survey. U.S.
Department of Commerce, Report EC02TV-US, http://www.census.gov/prod/ec02/ec02tv-us.pdf; Table 3a, page 25.
NCHRP Project 25-25, Task 45: Transportation Program Responses to GHG Reduction Initiatives and Energy Reduction Programs
Cambridge Systematics, Inc. 4-25
WIM systems are useful where vehicles are being checked for weight violations but not for safety violations. This analysis, therefore, assumes that the number of locations at which this approach can be used equals half the number at which electronic credentialing can be used. Potential fuel savings, therefore, equal roughly half that of electronic credentialing.97 The analysis results in the following estimates of GHG reduction benefits:
• Current Decade (2000-2008): 0.2 mmt CO2e;
• Future (2009-2030) Low: 2.2 mmt CO2e; and
• Future (2009-2030) High: 2.8 mmt CO2e.
Truck Stop Electrification
Truck stop electrification helps to reduce long-duration idling and has been implemented to varying degrees throughout the country. Of the nation’s 5,000 truck stops, 136 were electrified as of October 2008.98 These include both single system electrification systems which are owned and operated by the truck stop, and shore power systems which require both onboard and off-board equipment. Truck stop electrification works in combination with in-truck installation of idle reduction technologies. All or part of 25 states have implemented anti-idling laws99 which provide an important incentive for adopting idle reduction technologies, and 36 percent of trucks with sleeper cabs currently have on-board idle reduction technologies.100
The analysis of ongoing benefits assumes the existing (2008) deployment of electrified truck stops (136). To analyze future benefits, the number of truck stops that allow trucks to plug in to local power was increased to 1,500 for the less aggressive future scenario or to 5,000 for the more aggressive scenario.
97 This assessment could potentially be refined if supported by adequate data. In
particular, the following would need to be determined: 1) the weighted percentage of weigh stations at which safety inspections are conducted (weighted by numbers of trucks that operate past the station); and 2) how much time is saved by avoiding a safety inspection versus time saved by avoiding static weighing. However, the GHG reductions from this strategy are relatively small so the effort required to research this data may not be worth the benefit of improved analysis accuracy.
98 U.S. DOE (2008). “Fact #551: December 29, 2008: Truck Stop Electrification Sites.” Energy Efficiency and Renewable Energy Information Center, http://www1.eere.energy.gov/vehiclesandfuels/facts/2008_fotw551.html.
99 American Transportation Research Institute (2009). “Compendium of Idling Regulations, Updated January 2009.” http://www.atri-online.org/research/idling/atri_IdlingCompendium1_22_09.pdf.
100 American Transportation Research Institute (2006). Idle Reduction Technology: Fleet Preferences Survey. Prepared for New York State Energy Research and Development Authority. http://www.atri-online.org/.
NCHRP Project 25-25, Task 45: Transportation Program Responses to GHG Reduction Initiatives and Energy Reduction Programs
4-26 Cambridge Systematics, Inc.
The analysis used the following input data and assumptions:
• New truck stops are implemented in the first year of the policy program (2010);
• Average number of spaces per truck stop = 40;101
• Average utilization per day = 30 percent;102
• Utilization will remain constant over time as policy initiatives or market responses increase supply to meet increased demand;
• Number of hours per use = 8;
• Fuel saved per truck per hour = 1 gallon;103
• Average electric power per truck = 3.8 kilowatts;104
• GHG per gallon of diesel fuel = 22.2 pounds;105 and
• GHG per kilowatt-hour = 1.40 pounds.106
The analysis results in the following estimates of GHG reduction benefits:
• Current Year (2008): 0.04 metric tons CO2e.
• Ongoing (2000-2008): 0.09 metric tons CO2e (assumes a linear deployment over 2005-2008; there were some demonstration projects in 2002-2003 but it is likely that most projects were not implemented until 2005 and later.)
• Future (2009-2030) Low: 4.5 mmt CO2e.
• Future (2009-2030) High: 5.4 mmt CO2e.
Total for Idle Reduction
Adding the above benefits for all the idle reduction strategies – weigh station bypass, weigh-in-motion, and truck stop electrification – produces the following results:
• Ongoing (2000-2008): 0.6 mmt CO2e;
101 The Climate Trust. “Truck Stop Electrification.” http://www.climatetrust.org/
offset_truckstop.php, accessed January 2009. 102 Perrot, T.L., et al. (2003). Truck Stop Electrification as a Long-Haul Tractor Idling
Alternative. TRB 2004 Annual Meeting preprint, December 2003. 103 Perrot (2003), ibid. 104 Perrot (2003), ibid. 105 U.S. EPA, “Emission Facts: Average Carbon Dioxide Emissions Resulting from Gasoline and
Diesel Fuel.” http://www.epa.gov/OMS/climate/420f05001.htm 106 Energy Information Administration, Annual Energy Outlook Table ES-1
NCHRP Project 25-25, Task 45: Transportation Program Responses to GHG Reduction Initiatives and Energy Reduction Programs
Cambridge Systematics, Inc. 4-27
• Future (2009-2030) Low: 11.2 mmt CO2e; and
• Future (2009-2030) High: 13.8 mmt CO2e.
The “future” estimates assume the same truck fuel efficiency in the future as currently. As a result, the future estimates may somewhat overestimate the expected reductions, to the extent that trucks become more fuel-efficient due to technology improvements, higher fuel costs, and/or regulations. The estimates also assume the continued use of petroleum-based diesel fuel.
C. DOT Agency Conservation and Efficiency Actions This category includes actions that the DOT has under its direct control, including construction and maintenance practices as well as its own facilities and operations.
Greenhouse gas emissions from infrastructure construction and maintenance activities can be reduced through the use of less energy-intensive construction materials by state and local highway departments and other transportation agencies. Materials strategies to reduce GHG include:
• Fly ash substitution for cement, or the use of other recycled materials in concrete; and
• Use of warm-mix instead of hot-mix asphalt.
Transportation agencies also can introduce other practices to reduce GHG emissions associated with their or their contractors’ activities. Facilities, equipment, and workforce practices to reduce GHG include:
• Light-emitting diode (LED) traffic signals;
• Energy efficient DOT buildings;
• Alternative fuel vehicles in DOT fleets;
• Anti-idling policies that apply to DOT fleet vehicles;
• Requiring GHG reduction practices by contractors (e.g., reduced idling, use of alternative fuels in construction equipment); and
• Workforce travel reductions (via a compressed work week).
Construction Materials Table 4.14 shows the estimated GHG reductions from the use of alternative construction materials. Total ongoing GHG benefits are estimated at 21 mmt between 2000 and 2009. Potential future benefits are estimated at between 90 and 159 mmt cumulatively between 2010 and 2030. The greatest benefit comes from the use of fly ash in concrete.
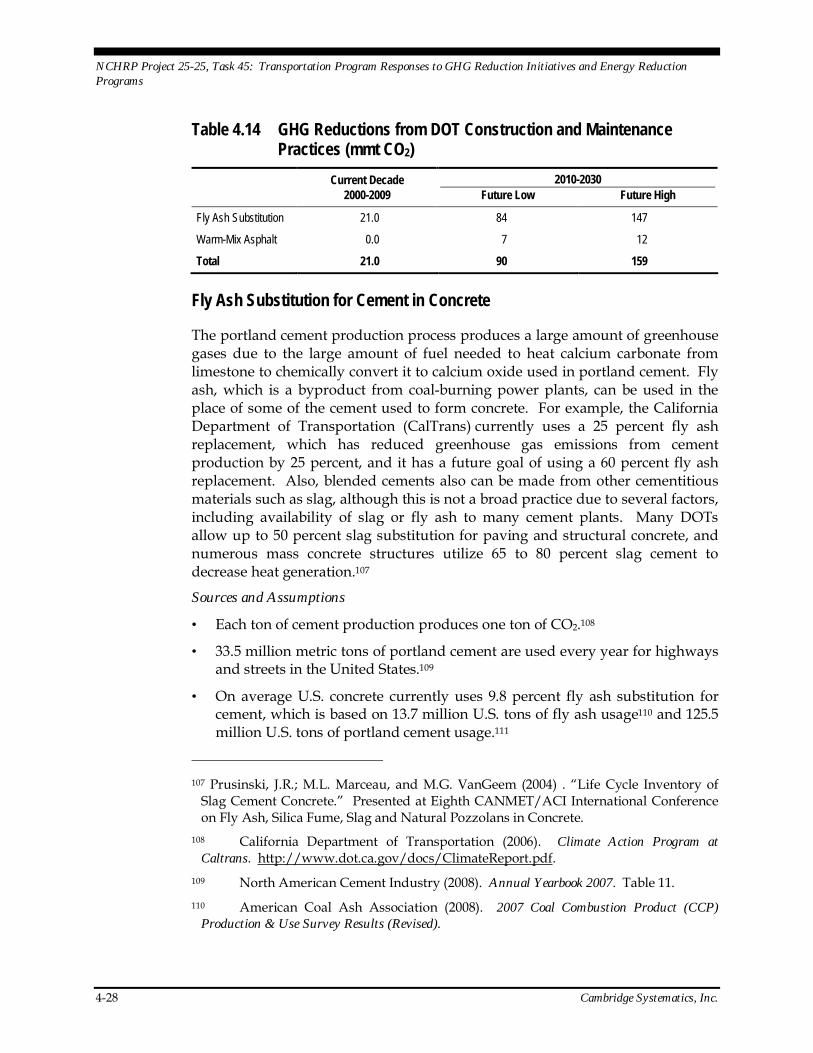
NCHRP Project 25-25, Task 45: Transportation Program Responses to GHG Reduction Initiatives and Energy Reduction Programs
4-28 Cambridge Systematics, Inc.
Table 4.14 GHG Reductions from DOT Construction and Maintenance Practices (mmt CO2)
Current Decade 2010-2030 2000-2009 Future Low Future High
Fly Ash Substitution 21.0 84 147
Warm-Mix Asphalt 0.0 7 12
Total 21.0 90 159
Fly Ash Substitution for Cement in Concrete
The portland cement production process produces a large amount of greenhouse gases due to the large amount of fuel needed to heat calcium carbonate from limestone to chemically convert it to calcium oxide used in portland cement. Fly ash, which is a byproduct from coal-burning power plants, can be used in the place of some of the cement used to form concrete. For example, the California Department of Transportation (CalTrans) currently uses a 25 percent fly ash replacement, which has reduced greenhouse gas emissions from cement production by 25 percent, and it has a future goal of using a 60 percent fly ash replacement. Also, blended cements also can be made from other cementitious materials such as slag, although this is not a broad practice due to several factors, including availability of slag or fly ash to many cement plants. Many DOTs allow up to 50 percent slag substitution for paving and structural concrete, and numerous mass concrete structures utilize 65 to 80 percent slag cement to decrease heat generation.107
Sources and Assumptions
• Each ton of cement production produces one ton of CO2.108
• 33.5 million metric tons of portland cement are used every year for highways and streets in the United States.109
• On average U.S. concrete currently uses 9.8 percent fly ash substitution for cement, which is based on 13.7 million U.S. tons of fly ash usage110 and 125.5 million U.S. tons of portland cement usage.111
107 Prusinski, J.R.; M.L. Marceau, and M.G. VanGeem (2004) . “Life Cycle Inventory of
Slag Cement Concrete.” Presented at Eighth CANMET/ACI International Conference on Fly Ash, Silica Fume, Slag and Natural Pozzolans in Concrete.
108 California Department of Transportation (2006). Climate Action Program at Caltrans. http://www.dot.ca.gov/docs/ClimateReport.pdf.
109 North American Cement Industry (2008). Annual Yearbook 2007. Table 11. 110 American Coal Ash Association (2008). 2007 Coal Combustion Product (CCP)
Production & Use Survey Results (Revised).
NCHRP Project 25-25, Task 45: Transportation Program Responses to GHG Reduction Initiatives and Energy Reduction Programs
Cambridge Systematics, Inc. 4-29
• Based on expenditures for highways by state versus local government, it is assumed that 62.2 percent of the national CO2 savings from highway materials could be directly achieved by state DOTs.112
Results
• Ongoing (2000-2009): The current 9.8 percent fly ash for cement substitution rate is estimated to have saved 20.5 mmt CO2 compared to using concrete with no fly ash.
• Future (2010-2030) Low: Increasing the substitution rate for the nation to 25 percent, which is the rate currently used in California, by 2030 with a linear increase in interim years would save 83.5 mmt CO2 compared to using concrete with no fly ash.
• Future (2010-2030) High: Increasing the substitution rate for the country to 50 percent, which is the goal in California, by 2030 with a linear increase in interim years would save 146.5 mmt CO2 annually compared to using concrete with no fly ash.
Uncertainty
Most of the data used for calculating the CO2 savings from fly ash usage come from industry trade groups, which base their data on surveys of members. The certainty of this usage data along with the CO2 saved per ton of cement substi-tution is high. The percentage of the national savings that can be attributed to state DOTs assumes that concrete usage is proportional to overall highway spending. While this assumption slightly decreases the certainty of the final CO2 savings, the overall savings is still believed to provide a good ballpark number. Furthermore, it is possible that adoption of fly ash usage as standard practice by state agencies could accelerate its use by local agencies, thereby increasing the total GHG reduction benefits.
Warm-Mix Asphalt
Asphalt aggregate mixture is produced by combining an asphalt binder (black gooey material made from crude oil)113 with an aggregate (crushed rock or gravel). Hot-mix asphalt is the traditional process used that heats the asphalt binder to high temperatures to lower its viscosity for proper mixing and paving. A recently developed material, warm-mix asphalt, uses chemical additives to lower the temperature needed to achieve the proper viscosity. This, in turn,
111 North American Cement Industry, ibid. 112 U.S. Census Bureau (2007). Census of Governments. State and Local Government
Finances 2005-2006. Expenditures Section. 113 Asphalt binder is formally defined by ASTM International as “dark brown or black
cementitious material in which the predominating constituents are bitumens which occur in nature or are obtained in petroleum processing.
NCHRP Project 25-25, Task 45: Transportation Program Responses to GHG Reduction Initiatives and Energy Reduction Programs
4-30 Cambridge Systematics, Inc.
reduces the amount of fuel used and therefore the greenhouse gas emissions. Lowering the temperature of the asphalt itself also lowers direct greenhouse gas emissions from the oxidation of the asphalt material. A number of demon-stration projects using warm-mix asphalt have occurred in states around the country; however, this technology does not yet have widespread use. An NCHRP study (Project 09-47) is currently underway to further develop and evaluate warm-mix asphalt technology, including evaluation of emission reductions.
Sources and Assumptions
• All GHG reductions are assumed to come from a reduction in fuel usage, due to insufficient data on the direct GHG emissions from the oxidation of asphalt material.
• Eight liters of fuel are needed for drying and heating one ton of hot-mix asphalt, and 2.7 kg CO2 is released per liter of fuel burned.114 Therefore, 21.6 kg CO2 is released per ton of traditional hot-mix asphalt mix.
• Warm-mix asphalt technology reduces the temperature needed to heat the asphalt by 10 to 30 degrees Celsius. It is assumed that it will reduce it by 30 degrees, which corresponds to a 24 percent fuel reduction, which equals a CO2 savings of 5.18 kg CO2 per ton of asphalt.115
• Each year 550 million tons of asphalt pavement material is produced.116 It is assumed that all of this material is used on roadways.
Scenarios and Results
• Ongoing (2000-2009): Warm-mix asphalt has only been used in demonstration projects and does not yet provide any significant greenhouse gas savings.
• Future (2010-2030) Low: Use of warm-mix asphalt is assumed for 50 percent of asphalt roadway projects (assuming the same proportion of asphalt roadways in future) by 2030 with five years of no savings, followed by five years of 1 percent per year implementation, followed by 12 years of linear growth to reach the 2030 target. This is estimated to save 6.5 mmt CO2 over the time period.
114 Mallik, Rajib, et al. (2009). A Laboratory Study on CO2 Emission Reductions Through
the Use of Warm Mix Asphalt. Presented at the Annual Meeting of the Transportation Research Board, January 2009.
115 Mallik et al., ibid. 116National Asphalt Pavement Association web site, http://www.hotmix.org/
index.php?option=com_content&task=view&id=14&Itemid=33. Accessed January 2009.

NCHRP Project 25-25, Task 45: Transportation Program Responses to GHG Reduction Initiatives and Energy Reduction Programs
Cambridge Systematics, Inc. 4-31
• Future (2010-2030) High: Use of warm-mix asphalt is assumed for 100 percent of asphalt roadway projects (assuming same amount of asphalt roadways in future) by 2030 with five years of no savings followed by five years of 1 percent per year implementation followed by 12 years of linear growth to reach the 2030 target. This is estimated to save 12.3 million metric tons of CO2 over the time period.
Uncertainty
The results of the warm-mix asphalt strategy have a moderate amount of uncertainty due to the fact that this technology is still in development. Green-house gas savings are based on laboratory data instead of field results and a single temperature reduction was chosen from a range of possible values. Also, the implementation schedule is an educated guess at best, because it is unclear when this technology will be adopted for widespread implementation.
DOT and Contractor Facilities, Equipment, and Workforce Table 4.15 shows the estimated GHG reductions from strategies, including more energy efficient DOT facilities, equipment, and workforce and operational practices. Total ongoing GHG benefits are estimated at 5 mmt CO2e. Potential future benefits are estimated at between 32 and 50 mmt cumulatively between 2010 and 2030.
Table 4.15 GHG Reductions from DOT and Contractor Facilities, Equipment, and Workforce Strategies (mmt CO2e)
Current Decade 2010-2030 (2000-2009) Future Low Future High
LED Traffic Signals 4.3 15.1 15.2
Energy Efficient Buildings 0.1 7.7 15.2
Alternative Fuel Vehicles 0.2 1.4 2.8
Anti-Idling Policies 0.4 5.3 10.5
Construction Activity 0.2 1.8 4.9
Workforce Travel <0.1 0.6 1.2
Total 5 32 50
LED Traffic Signals
The installation of light-emitting diode (LED) traffic signals lowers greenhouse gas emissions due to their lower electricity usage compared to incandescent bulbs in traditional traffic signals.
Sources and Assumptions
• Data collected from the New York State DOT, City of Portland, City and County of Denver, Arkansas, and Philadelphia revealed an average

NCHRP Project 25-25, Task 45: Transportation Program Responses to GHG Reduction Initiatives and Energy Reduction Programs
4-32 Cambridge Systematics, Inc.
electricity savings of 417 kilowatt-hours (kWh) per bulb annually. Assuming 28 bulbs per signalized intersection (12 three-bulb signals plus four pedestrian signals per signalized intersection) this results in 11,683 kWh saved per signalized intersection annually.
• The U.S. average emission factor for electricity is 1,363 pounds of CO2 per MWh, or 618 g per kWh.117 This results in 7.2 metric tons of CO2 saved per signalized intersection annually.
• There are about 300,000 signalized intersections in the United States of which about one-third, or 100,000 of them, are operated by state DOTs.118
• About 90 percent of all signalized intersection in the United States already have been converted to LED.119
Scenarios and Results
• Ongoing (2000-2009): LED traffic signals are estimated to have saved 4.3 million metric tons of CO2 between 2000-2009, based on the assumption that 30 percent of signalized intersections were LED in 2000 and by 2009 that number had reached 92 percent. It is assumed that the rate of implemen-tation increased in 2005 when the Department of Energy adopted new standards for energy efficient traffic signals.
• Future (2010-2030) Low: LED traffic signals are estimated to have saved 15.1 million metric tons of CO2e between 2010-2030, based on the assumption that 100 percent of signalized intersections will become LED within four years.
• Future (2010-2030) High: LED traffic signals are estimated to have saved 15.2 million metric tons of CO2e between 2010-2030, based on the assumption that 100 percent of signalized intersections will become LED within the first year.
Uncertainty
There is little uncertainty about greenhouse gas savings from LED traffic signals. This is due to well documented and consistent electricity use reductions from several LED replacement projects. Some uncertainty does come into play due to a lack of data on the number of signalized intersections and percent of LED implementation, but the professional judgment of an AASHTO official inter-viewed is judged as a reasonable replacement for this data.
Energy Efficient Buildings
All transportation agencies involved in constructing and maintaining roadways have a number of buildings for housing office staff and keeping equipment and
117 EPA (2007). eGrid2006. Version 2.1. 118 Telephone interview with Ken Kobetsky, AASHTO, January 26, 2009. 119 Kobetsky, ibid.

NCHRP Project 25-25, Task 45: Transportation Program Responses to GHG Reduction Initiatives and Energy Reduction Programs
Cambridge Systematics, Inc. 4-33
supplies in a sheltered environment. A number of strategies can be implemented to increase the energy efficiency of these buildings, such as pursuing LEED certification or implementing energy efficiency measures separately such as energy efficient heating and air conditioning, fluorescent lighting, and energy efficient appliances.
Sources and Assumptions
• 9.09 kWh per square foot can be saved annually in office buildings through LEED certification or by implementing energy efficiency measures that save 33 percent of electricity.120 This kWh/square foot savings corresponds well with the Caltrans’ District 7 office building, which is a new LEED Silver building that is estimated to save 9.08 kWh per square foot annually.
• The U.S. average emission factor for electricity is 1,363 pounds of CO2 per MWh, or 618 g per kWh.121 This results in 5,617 grams of CO2 saved per square foot annually.
• State governments own 3.81 billion square feet of buildings.122
• It is assumed that state DOTs occupy eight percent of state government-owned buildings. This is based on distributing the resulting 304.6 million square feet to each state based on the number of state DOT employees123 and verifying these with known state DOT square footages, such as Idaho’s 2.28 million square feet of buildings.124
Scenarios and Results
• Ongoing (2000-2009): The current percentage of state DOT buildings that are LEED certified or implementing energy efficiency measures is unknown, but based on qualitative descriptions of state DOT actions in this area it is assumed that 1 percent of building square footage has implemented these measures by 2009 with a linear increase from 0.1 percent in 2000. This results in 0.1 million metric tons of CO2 savings over the time period.
120 New Buildings Institute (2008). Energy Performance of LEED for New Construction
Buildings. Appendix C. Table 2. Note a conversion factor of 3.412 kBtu/kWh is used by this source.
121 EPA (2007), ibid. 122 Energy Information Administration (2006). “2003 Commercial Buildings Energy
Consumption Survey: Building Characteristics Tables.” Revised June 2006. Table B14. 123 U.S. Census Bureau. Census of Government Employment and Payroll, 2007.
http://www.census.gov/govs/www/buildatable.html. 124 Idaho Transportation Department. “Building Energy Use Comparison.” Spreadsheet
obtained through personal communication with Patti Raino, February 3, 2009.

NCHRP Project 25-25, Task 45: Transportation Program Responses to GHG Reduction Initiatives and Energy Reduction Programs
4-34 Cambridge Systematics, Inc.
• Future (2010-2030) Low: It is assumed that all new state DOT facilities implement energy efficiency measures equal to LEED Silver rating (33 percent energy savings in buildings). This assumes a 50-year lifespan on buildings, which leads to 40 percent building replacement by 2030. A linear increase from one percent in 2009 is assumed. This results in 7.7 million metric tons of CO2 savings over the time period
• Future (2010-2030) High: It is assumed that all new state DOT facilities and an equal number of retrofits implement energy efficiency measures equal to LEED Silver rating (33 percent energy savings in buildings). This assumes a 50-year lifespan on buildings, which leads to 40 percent building replacement by 2030 plus 40 percent retrofits equaling a total of 80 percent of buildings implementing energy efficiency measures by 2030. A linear increase from one percent in 2009 is assumed. This results in 15.2 million metric tons of CO2 savings over the time period.
Uncertainty
Aside from the scenario assumptions regarding what fraction of buildings will be retrofitted or replaced, the largest source of uncertainty for this measure is the total square footage of buildings that state DOTs occupy. Since there is limited data in this area, extrapolation methods must be used. Also, it is unclear if energy efficiency measures can be applied or will be as effective for state DOTs’ nonoffice building uses, such as equipment shops and maintenance facilities. For this analysis it is assumed that energy efficiency measures can be implemented at these nonoffice facilities with the same electricity savings.
Alternative Fuel Vehicles (AFV)
Several types of vehicles and equipment are necessary for constructing and maintaining roadways. These include on-road vehicles used by transportation agency employees for traveling between worksites and offices, and off-road vehicles, such as construction equipment and mowing tractors. Many state DOTs own and purchase a significant number of alternative fuel vehicles, such as compressed natural gas (CNG), electric, an 85 percent ethanol blend (E85), and liquefied petroleum gas (LPG). Oftentimes, this is to comply with requirements of the EPAct, which require certain state fleets to acquire alternative fuel vehicles. Biodiesel also can be used for diesel vehicles but was not analyzed due to a lack of available data.
Sources and Assumptions
• In 2006 state agencies operated 10,317 CNG vehicles, 2,280 electric vehicles, 50,068 E85 vehicles, and 9,131 LPG vehicles.125
125 Energy Information Administration (2006). “Alternatives to Traditional Fuels 2006
(Part II-User and Fuel Data).” Table V8. http://www.eia.doe.gov/cneaf/alternate/page/atftables/afvtransfuel_II.html.
NCHRP Project 25-25, Task 45: Transportation Program Responses to GHG Reduction Initiatives and Energy Reduction Programs
Cambridge Systematics, Inc. 4-35
• Savings are based on comparison to the same number of gasoline vehicles where each vehicle is assumed to drive 12,165 miles per year126 and have a fuel efficiency of 19.5 miles per gallon.127 Gasoline is known to contain 8.81 kg CO2 per gallon.128
• CNG vehicles reduce CO2 emissions by 24 percent, electric vehicles reduce them by 17 percent, E85 vehicles reduced them by 20 percent, and LPG vehicles reduce them by 22.5 percent.129 On average this results in 1,141 kg of CO2 per vehicle annually.
• There are 506,300 vehicles in state-owned vehicle fleets.130 Based on data from Idaho131 and Maine,132 it is assumed that 30 percent of state-owned vehicles are operated by state DOTs, which results in 151,900 vehicles in state DOT vehicle fleets.
126 Idaho Department of Environmental Quality. “State Inventory Survey Results.”
Spreadsheet obtained through personal communication with Jess Byrne, February 9, 2009.
127 Bureau of Transportation Statistics (2008). National Transportation Statistics, Table 4-23: Average Fuel Efficiency of U.S. Passenger Cars and Light Trucks (Updated December 2008). U.S. Department of Transportation, Research and Innovative Technology Administration. http://www.bts.gov/publications/national_transportation_statistics/.
128 U.S. EPA (2008). Climate Leaders GHG Inventory Protocol, Table 5. 129 U.S. Department of Energy. “Alternative Fuel Vehicle Emissions.” Alternative Fuels
Data Center, http://www.afdc.energy.gov/afdc/vehicles/emissions.html, accessed January 2009. The estimates for E85 (corn ethanol) do not account for indirect land use change (e.g., land use changes due to agricultural land conversion resulting from higher corn prices) and other indirect effects. Analysis by the U.S. EPA in support of the Renewable Fuel Standard – II (RFSII) rulemaking show a very wide range of potential GHG impacts of corn ethanol, with some scenarios showing increases in net GHG emissions. See: U.S. EPA (2009). Draft Regulatory Impact Analysis: Changes to the Renewable Fuel Standard Program. EPA-420-D-09-001, May 2009.
130 National Conference of State Fleet Administrators (2008). 2007 NCSFA Target Membership Estimated Fleet Totals and Dollars (reported by state fleets). http://www.ncsfa. net/PUBLICATIONS/Conference/2007%20NCSFA%20Est.%20Target%20Fleet$.pdf.
131 Idaho Department of Environmental Quality, ibid. 132 Maine Department of Environmental Protection (2008). A Report on the State Vehicle
Fleet: Emissions, Fuel Economy, and Vehicle-Miles Traveled.
NCHRP Project 25-25, Task 45: Transportation Program Responses to GHG Reduction Initiatives and Energy Reduction Programs
4-36 Cambridge Systematics, Inc.
Scenarios and Results
• Ongoing (2000-2009): Historical alternative fuel vehicle acquisitions by state governments133 are used to find the percentage of vehicles that are alternative fuel (which ranges from 5.9 percent in 2000 to 20.9 percent in 2009). This results in 0.2 mmt CO2 savings from 2000-2009.
• Future (2010-2030) Low: Increase alternative fuel vehicles by the historical increase rate of 1.7 percent per year (equivalent to acquiring alternative fuel vehicles for about one-quarter of all new vehicles assuming 16-year vehicle lifespan) until 2030. This results in 56 percent alternative fuel vehicles by 2030. The CO2 savings for this scenario is 1.4 mmt.
• Future (2010-2030) High: Increase alternative fuel vehicles by using alternative fuel vehicles for all new vehicle acquisitions assuming a 16-year vehicle lifespan (resulting in a 6.25 percent per year increase rate). This results in 100 percent alternative fuel vehicles by 2022 and for all subsequent years. The CO2 savings for this scenario is 2.8 mmt.
Uncertainty
The number of state DOT vehicles and the percentage that are alternative fuel has a high-level of certainty due to good data; however, the CO2 savings per vehicle is somewhat uncertain due to a number of factors. For example, changes in fuel efficiency over time are not considered in gasoline or alternative fuel vehicles. Due to the lack of detailed data on state DOT vehicle types different fuel efficiency were not used, and all vehicles were assumed to be gasoline when in reality some are likely diesel. Also, CO2 savings of alternative fuel vehicles over gasoline vehicles varied among a number of sources consulted. Future CO2e savings will depend highly on the specific vehicle and fuel technologies used, as different fuel sources have very different CO2 benefits. This is true even for a given type of fuel; for example, cellulosic ethanol (still in the early stages of development) has much greater GHG benefits than the corn-based ethanol in current use, and it is not certain whether corn ethanol produces any net GHG benefits.
Off-road vehicles and equipment were not considered in this analysis, although some of them also may use alternative fuels. In addition, a number of state DOTs recently surveyed by AASHTO mentioned that they use a large amount of biodiesel, but a lack of data on the number of these vehicles prevented them from being included in this analysis.
133 U.S. Department of Energy. “State EPAct AFV Acquisition History.” Alternative Fuels
Data Center, http://www.afdc.energy.gov/afdc/data/providers.html, accessed January 2009.
NCHRP Project 25-25, Task 45: Transportation Program Responses to GHG Reduction Initiatives and Energy Reduction Programs
Cambridge Systematics, Inc. 4-37
Anti-Idling Policies
Anti-idling policies can reduce greenhouse gas emissions by decreasing fuel usage by DOT fleet vehicles. Providing alternative electrical sources or reducing the electrical demands of equipment can reduce the need to idle heavy-duty vehicles.
Sources and Assumptions
• Washington State DOT showed that an anti-idling policy for heavy-duty diesel vehicles saved 756 gallons of diesel per vehicle annually.134
• The CO2 content of diesel is 10.15 kg CO2 per gallon.135
• There are 506,317 vehicles in state-owned vehicle fleets.136 Based on data from Idaho137 and Maine,138 it is assumed that 30 percent of state-owned vehicles are operated by state DOTs, which results in 151,895 vehicles in state DOT vehicle fleets.
Scenarios and Results
• Ongoing (2000-2009): All state DOTs are assumed have a modest anti-idling program in place, similar to Washington State DOT’s program (see Task 1 report), which would apply to 9.0 percent of the heavy-duty diesel vehicles, or 4.0 percent of the total fleet. This results in 0.4 mmt CO2 savings over the time period.
• Future (2010-2030) Low: The number of heavy-duty diesel vehicles affected by an anti-idling policy is increased to 50 percent in the first year and for all subsequent years (21.5 percent of the total fleet). This results in 5.3 mmt CO2 savings over the time period.
• Future (2010-2030) High: The number of heavy-duty diesel vehicles subject to an anti-idling policy is increased to 100 percent in the first year and for all subsequent years (43 percent of the total fleet). This results in 10.5 mmt CO2 savings over the time period.
Uncertainty
There is some uncertainty associated with the effectiveness of anti-idling programs, and whether they can all achieve the same fuel reduction seen in Washington State. The current implementation of anti-idling programs is also 134 Washington State DOT (2006). “WSDOT Awarded Grant to Help Improve Air
Quality.” Press release, November 9, 2006. 135 U.S. EPA (2008), ibid. 136 National Conference of State Fleet Administrators, ibid. 137 Idaho Department of Environmental Quality, ibid. 138 Maine Department of Environmental Protection, ibid.

NCHRP Project 25-25, Task 45: Transportation Program Responses to GHG Reduction Initiatives and Energy Reduction Programs
4-38 Cambridge Systematics, Inc.
uncertain, but the simplifying assumption was made that all states implement these programs at the same level of Washington State.
Construction Activity
State DOTs and their contractors have a large amount of off-road vehicles and equipment used in the construction and maintenance of transportation facilities. Several practices can reduce the amount of greenhouse gases produced due to the fuel used by these vehicles. The practices examined in this section include reducing equipment idling, improving maintenance and driver training (efficiency), and using biodiesel.
Sources and Assumptions
• The transportation subsector of the construction industry, in its work for state DOTs, operates about 197,000 diesel off-road vehicles at 1,500 hours per year, and idling emits 20.7 pounds CO2 per vehicle per hour. These vehicles idle about 29 percent of their operating time.139
• Improved maintenance and driver training practices yield efficiency improvements in these 197,000 pieces of diesel off-road construction equipment of 3.0 percent, assuming a heavy-duty diesel vehicle with an average of 6.6 miles per gallon, operating 1,500 miles per year.140
• B20 (a blend of 20 percent biodiesel and 80 percent diesel) emits 17.8 pounds CO2/gallon, which is calculated by assuming the biodiesel portion emits 0 pounds CO2/gallon (when considering the life cycle) and diesel emits 22.4 pounds CO2/gallon.141
139 U.S. EPA (2009). Potential for Reducing Greenhouse Gas Emissions in the Construction
Sector. See endnote #92. This report estimates a total of two million off-road construction vehicles. This number is reduced to account for the fact that only 15.9 percent of the vehicles are for the transportation construction subsector (per this same report, Appendix A) and that only 62.3 percent of those vehicles are for state DOT transportation construction work (per previous U.S. Census Bureau citation).
140 U.S. EPA (2009), ibid. The estimate of miles operated per year is the same as the estimate of hours operated per year (1,500).
141 U.S. Department of Energy. “Alternative Fuel Vehicle Emissions.” Alternative Fuels Data Center, http://www.afdc.energy.gov/afdc/vehicles/emissions.html, accessed January 2009. The estimates for biodiesel do not account for indirect land use change (e.g., land use changes due to agricultural land conversion resulting from higher soybean prices) and other indirect effects. Analysis by the U.S. EPA in support of the Renewable Fuel Standard – II (RFSII) rulemaking show a range of potential GHG impacts of biodiesel produced from soy, with some scenarios showing increases in net GHG emissions. See: U.S. EPA (2009). Draft Regulatory Impact Analysis: Changes to the Renewable Fuel Standard Program. EPA-420-D-09-001, May 2009.
NCHRP Project 25-25, Task 45: Transportation Program Responses to GHG Reduction Initiatives and Energy Reduction Programs
Cambridge Systematics, Inc. 4-39
Scenarios and Results
• Ongoing (2000-2009): Regulations to reduce idling were in place for about half of all states as of July 2008. It is assumed that these regulations reduce idling by 5.0 percent. Due to the lack of evidence found, it is assumed that there are no large-scale efforts in place at the state DOT-level to improve maintenance and driver training or increase the usage of biofuels in off-road construction vehicles. This scenario saves 0.2 mmt CO2 over the time period.
• Future (2010-2030) Low: Idling restrictions are assumed to be adopted in all states and reduce idling by 5 percent. Furthermore a 1.5 percent increase in fuel economy is assumed for heavy equipment due to improved maintenance and driver training, and that 3 percent of equipment switches from diesel to B20. This scenario saves 1.8 mmt CO2 over the time period.
• Future (2010-2030) High: More stringent idling restrictions are assumed in all states, or restrictions with greater enforcement, that reduce idling by 10 percent. A 3 percent increase in fuel economy is assumed for heavy equipment due to improved maintenance and driver training, and 10 percent of equipment is assumed to switch from diesel to B20. This scenario saves 4.9 mmt CO2 over the time period.
Uncertainty
Almost all calculations for construction practices are based on the EPA report referenced above. This report notes that “many assumptions and estimates had to be made when data were unavailable, resulting in significant uncertainty.” It notes that some of the data that are lacking include the number of pieces of construction equipment by type, their annual operating hours, their current fuel efficiency, and their emissions while idling. It is also uncertain as to whether biodiesel produces any net GHG benefits if it is produced from soybeans or other primary agricultural products.
Workforce Travel (Compressed Work Week)
Allowing employees to work four 10-hour days per week instead of five 8-hour days can eliminate the need to travel to work one day a week or 50 days per year.
Sources and Assumptions
• Most state DOTs are willing to implement four-day 10-hour work weeks,142 which results in 50 days less travel per year.
• It is assumed that workers will not increase their travel on their normal fifth working day.
142 American Association of State Highway and Transportation Officials (2008). “MNT-
08-02 Survey for the Member Department of Transportation Equipment Managers.” Internal survey results provided by AASHTO to Cambridge Systematics, Inc.
NCHRP Project 25-25, Task 45: Transportation Program Responses to GHG Reduction Initiatives and Energy Reduction Programs
4-40 Cambridge Systematics, Inc.
• The average distance between home and work is 12.1 miles.143
• 90.8 percent of work commutes are in private vehicles.144
• The average fuel efficiency is 19.5 miles per gallon.145
• The CO2 content of gasoline is 8.81 kg CO2 per gallon.146
• There are 236,758 people employed by state DOTs.147
Scenarios and Results
• Ongoing (2000-2009): There is no data on the percentage of employees currently participating in compressed work weeks, but qualitative information from the AASHTO survey indicate that it would be reasonable to assume that one percent of state DOT employees currently work four days a week. This results in 0.01 million metric tons of CO2 savings over the time period.
• Future (2010-2030) Low: Half of all state DOT employees are assumed to be eligible to participate in a compressed work week of four 10-hour days, and half of those who are eligible choose to participate, resulting in 25 percent participation in the first year and all subsequent years. This results in 0.6 mmt CO2 savings over the time period.
• Future (2010-2030) High: All state DOT employees are assumed to be eligible to participate in a compressed work week of four 10-hour days, and half of those who are eligible choose to participate, resulting in 50 percent participation in the first year and for all subsequent years. This results in 1.2 mmt CO2 savings over the time period.
Uncertainty
There is a small amount of uncertainty associated with using national averages to represent the commutes of state DOT employees. Also, the level of implementation that currently is practiced and that would be allowed in the future is somewhat uncertain, as are participation rates. It is conceivable that states could adopt mandatory four-day work weeks (such as Utah did in August 2008), meaning that most employees would work on this schedule.
143 Federal Highway Administration (2004). 2001 National Household Travel Survey:
Summary of Travel Trends. 144 Federal Highway Administration, ibid. 145 Bureau of Transportation Statistics, ibid. 146 U.S. EPA (2008) , ibid. 147 U.S. Census Bureau, ibid..
NCHRP Project 25-25, Task 45: Transportation Program Responses to GHG Reduction Initiatives and Energy Reduction Programs
Cambridge Systematics, Inc. 4-41
There also may be some offsetting “rebound” effects due to additional personal travel to run errands, etc. on the employee’s day off, as well as increased home energy use. Since these were not included in the analysis, the estimates should be considered as an upper bound.
Cumulative Results Table 4.16 shows the cumulative illustrative results from all the strategies analyzed.148 Table 4.17 compares analytic methods and key assumptions for each strategy. Ongoing reductions are estimated at from just under 100 to just over 300 mmt GHG cumulatively over the 2000-2009 period, depending upon analysis assumptions, while potential future reductions are estimated to be in the range of about 300 to 1,100 mmt GHG cumulatively between 2010 and 2030. Ongoing reductions represent between 0.6 and 2.2 percent of U.S. on-road emissions and 0.5 to 1.7 percent of total U.S. transportation sector emissions over this period. Future reductions range from 1.0 to 3.4 percent of on-road emissions and 0.8 to 2.6 percent of all U.S. transportation emissions forecast over the 2010-2030 period.
The following conclusions can be drawn from these illustrative estimates:
• For ongoing reductions over the 2000-2009 period, system efficiency strategies – in particular, bottleneck improvements – appear to have provided the greatest benefit. However, it should be noted that the estimated benefits of travel reduction and system efficiency strategies are subject to considerable uncertainty, for reasons discussed previously. This uncertainty is reflected in the range of results presented. The benefits of travel reduction strategies are made uncertain primarily because of the very large differences in effectiveness that may be achieved through different projects, while the benefits of system efficiency strategies are made uncertain primarily because of the unknown offsetting effects of future travel increases due to induced demand, as well as the sketch-level nature of the methodology. Ongoing system efficiency reductions are considerably larger than the estimated future benefits, most likely due to differences in the assumed base of improvement projects as well as differing analysis methods. Furthermore, the estimated benefits of travel reduction strategies are based only on known expenditures from particular programs, and do not reflect other projects or strategies that are not included in these expenditures.
148 For ongoing benefits, the “low” estimates of bottleneck relief and ITS strategies reflect
impacts with induced demand, while the “high” estimates reflect impacts without induced demand. For future benefits for these strategies, the “low” estimate includes the more conservative investment scenario with induced demand effects, while the “high” estimate includes the more aggressive investment scenario without induced demand effects. This is done simply to present a range of potential results, rather than to suggest that these particular scenarios go together.

NCHRP Project 25-25, Task 45: Transportation Program Responses to GHG Reduction Initiatives and Energy Reduction Programs
4-42 Cambridge Systematics, Inc.
• For future reductions over the 2010-2030 period, all strategies can potentially contribute to GHG reductions, collectively reducing emissions from on-road sources by over three percent. Again, however, the estimated benefits of travel reduction and system efficiency strategies are subject to considerable uncertainty not only for the reasons described above for ongoing benefits, but also because the future amount of investment that could be achieved in these strategies is uncertain.
• DOTs already have undertaken actions such as the use of LED traffic signals that reduce GHG emissions, and additional agency actions have the potential to provide greater benefits in the future. The greatest benefits may be real-ized from the use of fly ash in portland cement. Warm-mix asphalt, building energy efficiency, anti-idling policies, and workforce travel reduction also have the potential for additional future benefits.
While the reductions estimated in this report may seem modest compared to total transportation GHG emissions nationwide, they nevertheless represent an important step towards addressing climate change. Furthermore, they only reflect actions that already have been undertaken to some extent by state DOTs, and for which estimates of benefits could be developed. State DOTs also may play a role in other actions, such as transit investment, land use planning, and road pricing, which could have additional GHG reduction benefits. Finally, these estimates should be considered as sketch-level estimates only; a more complete evaluation would use more sophisticated modeling and analysis tools to estimate the potential benefits of specific actions in a particular state.
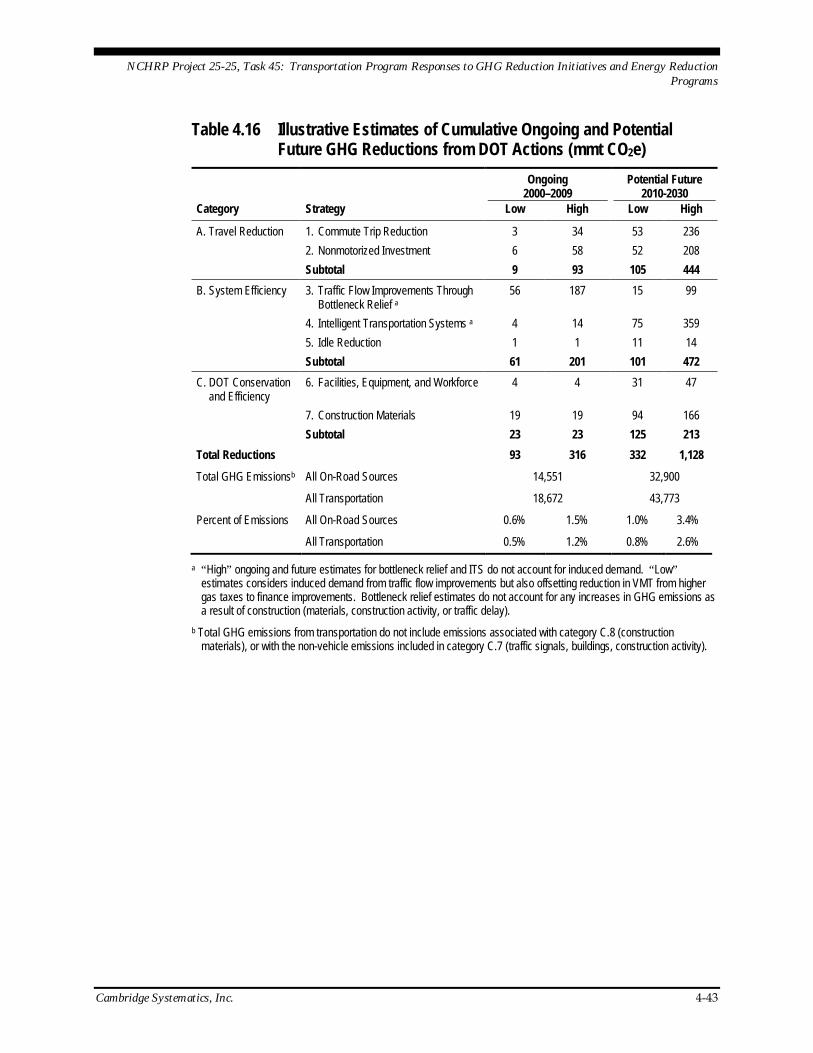
NCHRP Project 25-25, Task 45: Transportation Program Responses to GHG Reduction Initiatives and Energy Reduction Programs
Cambridge Systematics, Inc. 4-43
Table 4.16 Illustrative Estimates of Cumulative Ongoing and Potential Future GHG Reductions from DOT Actions (mmt CO2e)
Ongoing
2000–2009 Potential Future
2010-2030 Category Strategy Low High Low High
A. Travel Reduction 1. Commute Trip Reduction 3 34 53 236 2. Nonmotorized Investment 6 58 52 208 Subtotal 9 93 105 444 B. System Efficiency 3. Traffic Flow Improvements Through
Bottleneck Relief a 56 187 15 99
4. Intelligent Transportation Systems a 4 14 75 359 5. Idle Reduction 1 1 11 14 Subtotal 61 201 101 472 C. DOT Conservation
and Efficiency 6. Facilities, Equipment, and Workforce 4 4 31 47
7. Construction Materials 19 19 94 166 Subtotal 23 23 125 213 Total Reductions 93 316 332 1,128
Total GHG Emissionsb All On-Road Sources 14,551 32,900
All Transportation 18,672 43,773
Percent of Emissions All On-Road Sources 0.6% 1.5% 1.0% 3.4%
All Transportation 0.5% 1.2% 0.8% 2.6%
a “High” ongoing and future estimates for bottleneck relief and ITS do not account for induced demand. “Low” estimates considers induced demand from traffic flow improvements but also offsetting reduction in VMT from higher gas taxes to finance improvements. Bottleneck relief estimates do not account for any increases in GHG emissions as a result of construction (materials, construction activity, or traffic delay).
b Total GHG emissions from transportation do not include emissions associated with category C.8 (construction materials), or with the non-vehicle emissions included in category C.7 (traffic signals, buildings, construction activity).
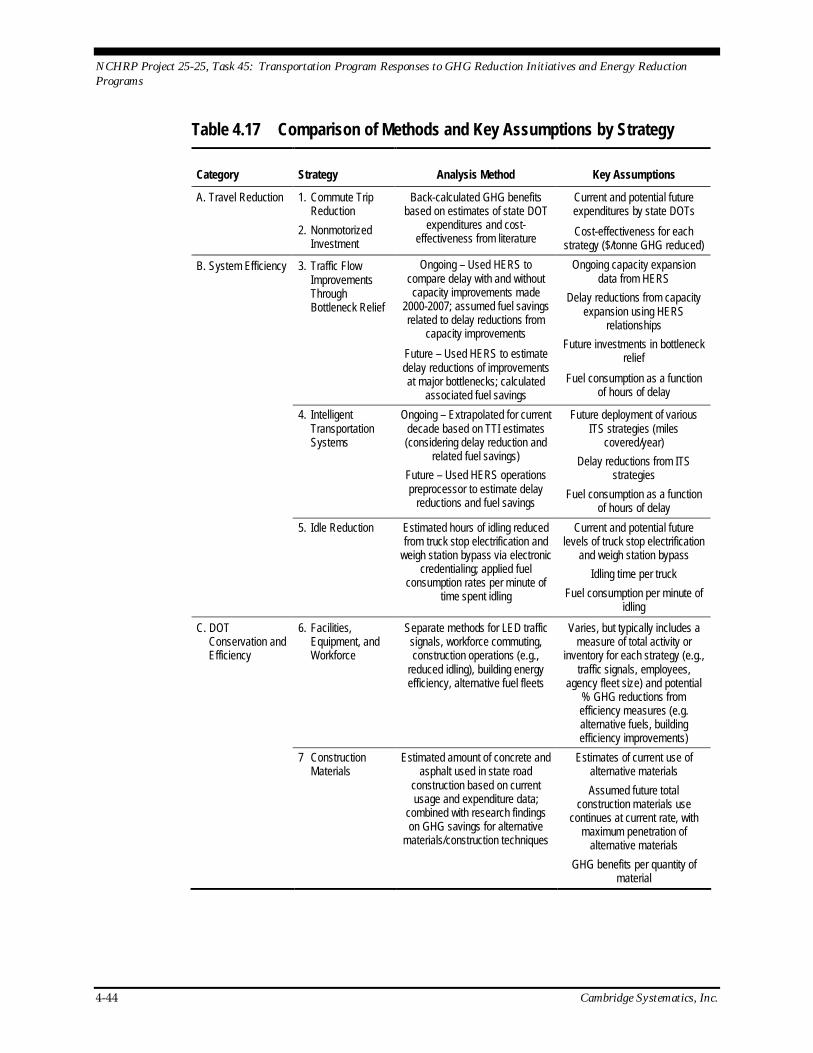
NCHRP Project 25-25, Task 45: Transportation Program Responses to GHG Reduction Initiatives and Energy Reduction Programs
4-44 Cambridge Systematics, Inc.
Table 4.17 Comparison of Methods and Key Assumptions by Strategy Category Strategy Analysis Method Key Assumptions
A. Travel Reduction 1. Commute Trip Reduction
2. Nonmotorized Investment
Back-calculated GHG benefits based on estimates of state DOT
expenditures and cost-effectiveness from literature
Current and potential future expenditures by state DOTs Cost-effectiveness for each
strategy ($/tonne GHG reduced) B. System Efficiency 3. Traffic Flow
Improvements Through Bottleneck Relief
Ongoing – Used HERS to compare delay with and without capacity improvements made
2000-2007; assumed fuel savings related to delay reductions from
capacity improvements Future – Used HERS to estimate delay reductions of improvements at major bottlenecks; calculated
associated fuel savings
Ongoing capacity expansion data from HERS
Delay reductions from capacity expansion using HERS
relationships Future investments in bottleneck
relief Fuel consumption as a function
of hours of delay
4. Intelligent Transportation Systems
Ongoing – Extrapolated for current decade based on TTI estimates (considering delay reduction and
related fuel savings) Future – Used HERS operations preprocessor to estimate delay
reductions and fuel savings
Future deployment of various ITS strategies (miles
covered/year) Delay reductions from ITS
strategies Fuel consumption as a function
of hours of delay 5. Idle Reduction Estimated hours of idling reduced
from truck stop electrification and weigh station bypass via electronic
credentialing; applied fuel consumption rates per minute of
time spent idling
Current and potential future levels of truck stop electrification
and weigh station bypass Idling time per truck
Fuel consumption per minute of idling
C. DOT Conservation and Efficiency
6. Facilities, Equipment, and Workforce
Separate methods for LED traffic signals, workforce commuting, construction operations (e.g.,
reduced idling), building energy efficiency, alternative fuel fleets
Varies, but typically includes a measure of total activity or
inventory for each strategy (e.g., traffic signals, employees,
agency fleet size) and potential % GHG reductions from efficiency measures (e.g. alternative fuels, building efficiency improvements)
7 Construction Materials
Estimated amount of concrete and asphalt used in state road
construction based on current usage and expenditure data;
combined with research findings on GHG savings for alternative
materials/construction techniques
Estimates of current use of alternative materials Assumed future total
construction materials use continues at current rate, with
maximum penetration of alternative materials
GHG benefits per quantity of material
NCHRP Project 25-25, Task 45: Transportation Program Responses to GHG Reduction Initiatives and Energy Reduction Programs
Cambridge Systematics, Inc. 5-1
5.0 Policy Implications
Policy Implications As noted in the Task 1 findings, state DOTs have been identified as key partners in state efforts to address climate change, and are increasingly being asked by state governments to respond with plans, policies, and programs to reduce greenhouse gas emissions from transportation. Transportation agencies’ involvement on this issue will potentially increase in the future if the Federal government acts to reduce greenhouse gas emissions through national policy.
All of the transportation emission reduction strategies described above can be implemented by state DOTs under existing authority and funding structures – and already have been to some extent, as documented under “ongoing reductions.” Policy changes, however, could potentially provide greater reason for DOTs to undertake these actions. In addition, broader implementation of these strategies across all states could be supported by policy guidance and/or technical assistance from national organizations
The following are some of the key policy actions that might help to increase the implementation of GHG reducing strategies by state DOTs. Actions are identified with different levels of responsibility – the DOT itself; state government; Federal policy and funding; and other support from national organizations.
Travel Reduction Strategies DOTs have primarily funded travel reduction strategies – including TDM and nonmotorized travel improvements – through a mix of the Federal CMAQ program, the Federal Recreational Trails program, STP or other Federal or state highway improvement funds (e.g., nonmotorized improvements when implemented as part of a roadway improvement project), and state matching funds. While only a few DOTs have established explicit programs to fund transportation and land use integration, state planning and research (SPR) and metropolitan planning (PL) funds can be used for regional planning activities to integrate land use and transportation planning, and transportation project or corridor studies can address land use issues within their scope. Many metropolitan planning organizations (MPO) have used Federal resources to specifically fund planning activities or implementation projects that support transportation-efficient land use patterns.
One primary policy need to expand travel reduction programs is to increase funding for these programs. This can be done by allocating a larger proportion of existing funds to these activities, or by identifying new funding sources. Since MPOs are responsible for project prioritization in urban areas (where travel
NCHRP Project 25-25, Task 45: Transportation Program Responses to GHG Reduction Initiatives and Energy Reduction Programs
5-2 Cambridge Systematics, Inc.
reduction strategies will most often be implemented), the state DOT must be a partner with the MPOs in these areas. Increased funding that is designated specifically for travel reduction projects and programs is a direct way to encourage the greater implementation of these strategies. Such funding could be directed through existing program channels or through new program channels. Similar concepts have been suggested in reauthorization proposals under consideration in 2009.
Roadway design standards are be an important policy vehicle for encouraging nonmotorized travel in particular. A growing number of state and local transportation agencies are adopting “complete streets” policies or otherwise revising design practices to ensure that all modes are accommodated in future street construction and reconstruction. Frequently such accommodations can be made at little or no net cost to the project. State transportation agencies can require bicycle and pedestrian accommodations on their own facilities and on state-funded local road projects. In addition, they can encourage such accommodations on local roadways by issuing model design standards or guidance for use by local governments.
System Efficiency Strategies Bottleneck relief and traffic management can be funded through existing Federal and state transportation funding sources. As with travel reduction strategies, the key issues involve: 1) identifying adequate funds; and 2) prioritizing these funds towards GHG–reducing activities. Like other transportation strategies, system efficiency strategies have many benefits and impacts (e.g., mobility, safety, air quality) and GHG reduction is just one consideration in whether a project is worth doing.
Bottleneck relief projects are by nature relatively expensive and, therefore, state DOTs face particular constraints on their ability to more widely implement such projects unless overall transportation funding levels are increased. Many states are suffering from a severe shortfall in revenue relative to needs for system investment and preservation, and their ability to fund major improvements is therefore limited. ITS and traffic management solutions – while often relatively less costly – still compete for limited funds. The CMAQ program has provided some funding that can be targeted specifically towards traffic flow improvements, as an air quality improvement strategy. ITS and traffic management strategies also face institutional barriers: some (such as incident management or corridor management) require effective coordination among state, regional, and local agencies, while others (such as optimized traffic signal timing) require ongoing attention from local and state agencies, who may have limited technical as well as financial resources.
Some specific actions that could encourage the implementation of traffic management strategies include:
NCHRP Project 25-25, Task 45: Transportation Program Responses to GHG Reduction Initiatives and Energy Reduction Programs
Cambridge Systematics, Inc. 5-3
• Additional funding to specifically cover the capital and operating costs of regional traffic management systems;
• Funding and technical support for traffic management by local jurisdictions (e.g., to support ongoing signal retiming); and
• Interjurisdictional coordination efforts, led by the state DOT or an MPO, to implement regionwide traffic management approaches.
Policy issues involving truck idle reduction strategies are somewhat different. State DOTs can work with truck stop owners and operators to implement idle reduction technology. It will not be feasible, however, to electrify the vast majority of truck parking spots, which are often dispersed (e.g., highway shoulders). As a result, the most significant gains from reduced idling will need to result from on-board technologies such as diesel fired heaters and storage cooling air conditioning units. From a truck owner’s perspective, the primary barriers to implementation of idle reduction technologies include initial startup cost, low fuel prices, and information dissemination. The following initiatives could help to overcome these barriers:
• A uniform anti-idling initiative, along with a exemption of auxiliary power units from a truck’s total weight. These actions would help to unify the existing patchwork of state laws and encourage more widespread adoption of idle reduction technology.
• Price incentives and education/outreach programs. Some already exist; for example, the EPA’s SmartWay program offers a variety of financing programs for the purchase or lease of idle reduction technologies approved by SmartWay or California Air Resources Board, and the Energy Improvement and Extension Act of 2008 eliminated the 12 percent excise tax on idle reduction devices for new trucks as a financial incentive to retrofit trucks with such devices.
DOT Conservation and Efficiency Construction practices can be directly affected by DOT requirements for materials, contractor operations practices, etc. Regarding construction materials, including fly ash or other recycled materials in cement, as well as warm-mix asphalt, DOTs will need to take individual initiative to demonstrate the feasibility and cost differential (if any) of these materials in their state, and to revise construction material specifications to require the use of these materials. Fly ash has been used in concrete since the early 1950s, but its use requires careful attention to differing characteristics of the concrete and evaluation to ensure that the fly ash concrete meets the engineering requirements of individual projects. A recent international scan tour to evaluate European practice concluded that with additional research and trials, there are no long-term barriers to the use of warm-mix asphalt in the United States.
NCHRP Project 25-25, Task 45: Transportation Program Responses to GHG Reduction Initiatives and Energy Reduction Programs
5-4 Cambridge Systematics, Inc.
Fuel-efficient and alternative fuel construction and fleet vehicles, energy efficient buildings, and traffic management in work zones have all been demonstrated to be feasible by transportation agencies around the country. Transportation agencies can require emission reduction practices to be implemented by construction contractors, and in a few cases (such as the Massachusetts Central Artery/Tunnel project and the Virginia Byways project in North Carolina) have done so with the objective of reducing criteria pollutants.
Actions could be taken to promote GHG reduction practices by transportation agencies. Such actions might include providing technical assistance such as the development of GHG inventory and assessment tools, cost savings information, and model contract language to require GHG reducing practices by contractors. In addition, transportation agencies could inventory the GHG emissions from their activities and implement GHG reduction practices; and/or funding could be provided targeted at specific activities. A pending NCHRP project (Project 25-25, Task 58) is developing a tool to estimate life-cycle GHG emissions from transportation agency construction, maintenance, and operations activities. This tool should provide much better information to assist agencies in identifying the most significant sources of GHG emissions and implementing GHG reduction practices.
State DOTs could impose energy efficiency standards when they construct new buildings or renovate older ones, as well as adopt fleet practices such as purchasing energy-efficient or alternative fuel vehicles. One primary barrier to vehicle and building efficiency strategies is up-front capital costs, which may in many cases be recouped over time through energy and fuel savings. The adoption of alternative fuel vehicles also may be inhibited by the need for refueling infrastructure. The feasibility of using some alternative fuels (such as biodiesel) in certain types of equipment or under particular operating conditions (e.g., cold weather) as not been fully demonstrated. As the state transportation agency, with a fleet of both light- and heavy-duty vehicles, the DOT could logically play a lead role in demonstrating the viability of alternative fuels and supporting infrastructure development within the state, and could work with other agencies and organizations to adopt practices that are proven viable.
NCHRP Project 25-25, Task 45: Transportation Program Responses to GHG Reduction Initiatives and Energy Reduction Programs
Cambridge Systematics, Inc. A-1
A. State DOT Telephone Interview Guide
Date:
State DOT Interviewee(s):
CS Interviewer(s):
State Planning for Climate Change and Greenhouse Gas Reduction Does the DOT have one or more staff person(s) esignated as the primary point of contact on climate change issues? If so, who? In what department?
Has the state completed or begun the preparation of a Climate Change or Energy Action Plan? If so, what is the actual or expected completion date?
Is or was the DOT involved in the preparation of this plan? If so, in what capacity?
• Representation on policy committee/decision-making body.
• Representation on technical committee or working group.
• Other means (e.g., informal involvement) – please describe:
Does the plan include specific greenhouse gas reduction targets for the transportation sector?
Does the plan include requirements of the DOT (process requirements, specific actions, etc.)? If so, please describe:
Is the state DOT, or another state agency, pursuing partnerships with MPOs, transit agencies, seaports and airports, local governments, or other transportation partners to establish GHG and energy reduction plans or to implement actions for the purpose of addressing climate change? If so, please identify who initiated this effort and describe the effort:
NCHRP Project 25-25, Task 45: Transportation Program Responses to GHG Reduction Initiatives and Energy Reduction Programs
A-2 Cambridge Systematics, Inc.
DOT Assessment of Greenhouse Gas Reduction Strategies Has the DOT undertaken the development of a climate action strategy, GHG or energy reduction plan, or inventory of GHG reduction strategies at the agency? If so, when was it initiated? Completed?
Is the DOT planning to undertake such an effort, if it has not already?
What was the primary motivation for undertaking this effort?
• Executive or legislative requirement.
• Internal – information to support planning, programming, or operations.
• Other (please describe):
Has the DOT quantified the potential GHG emissions reductions from any transportation strategies? If so, what methods and data sources have been used? Can we obtain a copy of the analysis?
For which additional strategies is the DOT planning to quantify GHG emission reduction benefits?
When estimating and communicating emissions reductions, how does the DOT consider ongoing actions or those already implemented – where is the “baseline” for analysis most often set?
If the DOT has developed VMT forecasts, have they considered revising the forecasts in light of recent trends showing a leveling off of VMT and rise in fuel prices?
NCHRP Project 25-25, Task 45: Transportation Program Responses to GHG Reduction Initiatives and Energy Reduction Programs
Cambridge Systematics, Inc. A-3
Specific Transportation Policies, Programs, and Actions Discuss each of the following strategies – please identify whether the DOT has:
• Undertaken the strategy, whether for GHG reduction or other purposes.
• Identified the strategy as a GHG reduction measure.
• Quantified GHG reduction benefits already achieved through this strategy.
• Quantified potential GHG reduction benefits from future implementation or expansion of this strategy.
Also provide examples of key efforts undertaken in each area.
Is the DOT planning to significantly expand implementation of any of these strategies in the next five years? If so, please describe. Is the primary purpose of doing so: 1) for GHG reduction purposes; or 2) for other reasons? (If other, please describe.)
Concluding Thoughts What key pieces of information are missing/needed to help the DOT estimate the GHG reduction impacts of transportation strategies that it might pursue?
What other barriers exist to DOT implementation of GHG reduction measures?
Is there anyone else we should talk to at the DOT about these issues?
Do you have contacts at other state DOTs who have actively been involved in this topic?