Embed Size (px)
Citation preview

British HeartJournal, I974, 36, 98I-987.
Correlation of left ventricular mass determined byechocardiography with vectorcardiographic andelectrocardiographic voltage measurements
D. H. Bennett and D. W. EvansFrom the Regional Cardiac Unit, Papworth Hospital, Cambridge
Left ventricular mass, derived from echocardiographic measurement of left ventricular wall volume, wascompared with simple vectorcardiographic and electrocardiographic voltage measurements in 36 patients withleft ventricular enlargement and 7 normal subjects. Left ventricular wall volume was obtained by subtractingthe volume of the ventricular cavity, calculated as the cube of the ultrasound internal dimension, from thevolume occupied by ventricular wall and cavity, calculated as the cube of the internal dimension plus twice thewall thickness. This method differs from those used hitherto and appears preferable on theoretical grounds.
The mass measurements correlated closely with the vectorcardiographic horizontal, and summed hori-zontal and sagittal, maximum QRS vectors (r= go9) and less closely with Sokalow's electrocardiographiccriterion (r=0o73).Both the voltage and echocardiographic measurements are useful techniques for assessing left ventricular
mass, particularly for serial observations. Where echocardiography is not practicable or available, simplevectorcardiographic measurements offer an alternative means of estimating left ventricular mass.
Measurement of left ventricular mass can be usefulin the diagnosis and assessment of disorders whichmay involve this chamber of the heart. The bestin vivo measurements are provided by angiocardio-graphic techniques, but their use is restricted to asmall proportion of patients, and opportunities forserial measurements rarely arise.
Echocardiographic measurement of left ven-tricular mass has been shown to correlate closelywith its measurement by angiocardiography (Troy,Pombo, and Rackley, I972; Murray, Johnston, andReid, I972) and has the advantage of being non-invasive and easily repeatable. However, the tech-nique can be difficult, or even impossible, to per-form on some patients and requires some smallmeasure of skill.Of the noninvasive techniques for the detection
and assessment of left ventricular enlargement, themost generally available is conventional scalarelectrocardiography. Spatial vectorcardiography,using a corrected orthogonal lead system, is claimedby some to be a superior method (Bristow, Porter,and Griswold, I96I; Mazzoleni, Wolff, and Wolff,I962; Abbott-Smith and Chou, 1970); however,Received 9 April 1974.
most studies have involved complex computationsof the vectorcardiographic data.
In this study the relations between simple vector-cardiographic, scalar electrocardiographic (Soka-low and Lyon, I949), and ultrasound measure-ments of left ventricular size, were examined innormal subjects and those with left ventricularoverload, where uniformity of left ventricular wallthickness could reasonably be assumed.
Subjects and methodsComparative data were obtained from 36 male patientswith disorders likely to cause left ventricular enlarge-ment and from 7 normal male subjects. The ages anddiagnoses of these patients are given in Table i. Dataobtained from a further 9 patients were not included inthe analysis because satisfactory echocardiograms couldnot be obtained. Patients with hypertrophic cardiomyo-pathy or myocardial infarction, in whom pronouncedvariations in left ventricular wall thickness may occur,were excluded from the study because the echocardio-graphic method,. like the angiocardiographic method, ofestimation of left ventricular mass is based on theassumption of uniform wall thickness. Patients with con-duction defects were also excluded.
Echocardiograms were recorded on polaroid film
on 15 July 2018 by guest. Protected by copyright.
http://heart.bmj.com
/B
r Heart J: first published as 10.1136/hrt.36.10.981 on 1 O
ctober 1974. Dow
nloaded from

982 Bennett and Evans
Septum
ECG
Mitralvalve
Poster'ior
left ~Lventricle
FIG. i Echocardiogram showing diastolic left ventricular wall thickness (LV) and internaldimension (LVID) in a patient with severe aortic incompetence.
__~~~~~~~~.
FIG. 2 Vectorcardiogram recordedfrom a patient with severe aortic regurgitation. Horizontal(H),frontal (F) and left sagittal (SL) planes. Dashes are at intervals of25 msec, the blunt endsindicating direction of loop inscription.
on 15 July 2018 by guest. Protected by copyright.
http://heart.bmj.com
/B
r Heart J: first published as 10.1136/hrt.36.10.981 on 1 O
ctober 1974. Dow
nloaded from

LV mass by ultrasound and voltage measurements 983
TABLE I Subject's details and ultrasound data
Subject Age Diagnosis Left ventricular measurements(yr)
Wall Internal Mass*thickness (mm) dimension (mm) (g)
I 4I2 33
3 29
4 26
5 296 22
7 448 46
9 34I0 69II 20
12 42I3 6I
I4 33I5 57I6 33I7 56I8 47I9 66
20 6I21 4I22 4823 26
24 5025 26
26 4427 6I28 4429 32
30 59
3' 43
32 37
33 27
34 5'35 62
36 37
37 26
38 27
39 2940 28
4I 28
42 30
43 26
Aortic regurgitation3,
3,
33
3,,
Aortic stenosis,,
Aortic stenosis and regurgitation
Mitral and aortic regurgitation
Mitral regurgitation
Aortic prosthesis
Aortic paraprosthetic leak
Leaking aortic homograft
Mitral and aortic prosthesesLeaking aortic and mitral valve
homograftsHypertension
Normal
* Approximated to nearest I0 g.
using an Eskoline 20 ultrasonoscope and a 2 25 MHzgeneral purpose transducer. The transducer was placedparasternally on the left fourth or fifth intercostal spaceand directed posteriorly and slightly medially until thecharacteristic motion of the anterior mitral cusp was
identified. The transducer was then angled slightly in-feriorly and laterally until, with adjustment of depthcompensation, gain, and reject controls, the posteriorwall of the left ventricle and interventricular septumwere located. As recommended by Feigenbaum (I972),part of the mitral valve apparatus was included on the
record to ensure that the ultrasound beam did not pass
too near to the apex and possibly give an inappropriatelysmall measurement of left ventricular internal dimen-sion, and also in an attempt to obtain a 'standardized'left ventricular internal dimension. Left ventricular wall
thickness (LV) was measured as the distance betweenthe inner surface of the endocardium and the outer sur-
face of the epicardium. The left ventricular internaldimension (LVID) was measured as the distance betweenthe endocardium of the interventricular septum and thatof the posterior wall. Both measurements were made at
13I2I513I2I5I8I4I3I6I2
I522I2I4I3i6I912I0
'78
'3i6I5I3i6I7I5'3
'7I2I0
I5I512I0I0
9I0I0I0I0
636i67526262606o40455353364962804958807050797257466064736759
67655548605443465437504940
480410640350420
5707004902403803204404902905207I0430720640400490380600550360440650880640430
770450270380540330I80200230140230220i6o
on 15 July 2018 by guest. Protected by copyright.
http://heart.bmj.com
/B
r Heart J: first published as 10.1136/hrt.36.10.981 on 1 O
ctober 1974. Dow
nloaded from
984 Bennett and Evans
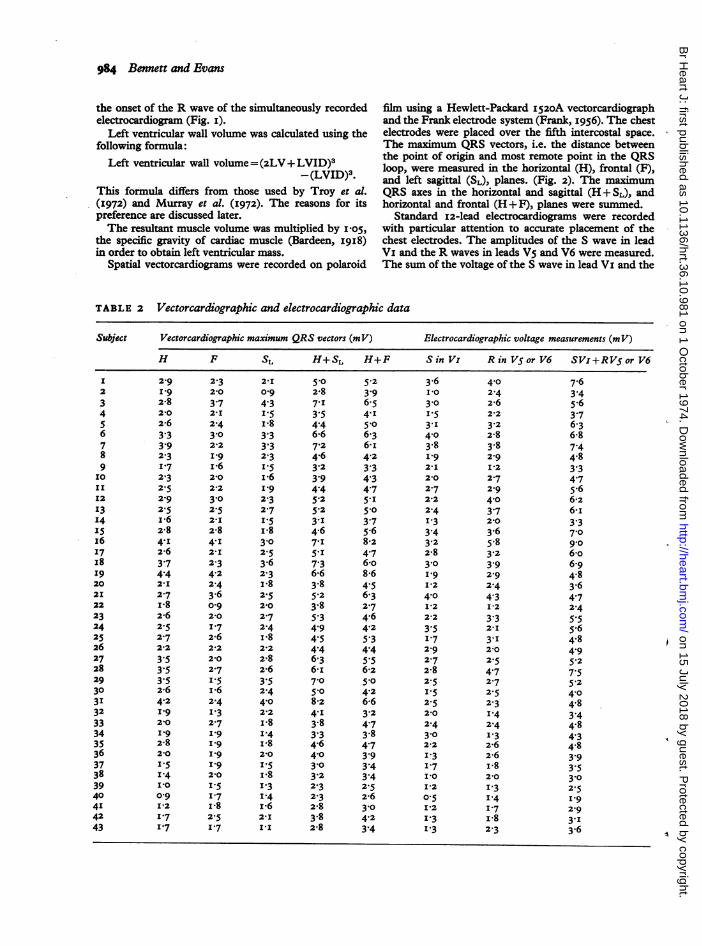
the onset of the R wave of the simultaneously recorded film using a Hewlett-Packard x52oA vectorcardiographelectrocardiogram (Fig. I). and the Frank electrode system (Frank, I956). The chest
Left ventricular wall volume was calculated using the electrodes were placed over the fifth intercostal space.following formula: The maximum QRS vectors, i.e. the distance between
the point of origin and most remote point in the QRSLeft ventricular wall volume=(2LV+ LVID)3 loop, were measured in the horizontal (H), frontal (F),-(LVID)3. and left sagittal (SL), planes. (Fig. 2). The maximum
This formula differs from those used by Troy et al. QRS axes in the horizontal and sagittal (H+ SL), and(I972) and Murray et al. (1972). The reasons for its horizontal and frontal (H+ F), planes were summed.preference are discussed later. Standard i2-lead electrocardiograms were recordedThe resultant muscle volume was multiplied by i-o5, with particular attention to accurate placement of the
the specific gravity of cardiac muscle (Bardeen, I9I8) chest electrodes. The amplitudes of the S wave in leadin order to obtain left ventricular mass. Vi and the R waves in leads Vs and V6 were measured.
Spatial vectorcardiograms were recorded on polaroid The sum of the voltage of the S wave in lead VI and the
TABLE 2 Vectorcardiographic and electrocardiographic data
Subject Vectorcardiographic maximum QRS vectors (mV) Electrocardiographic voltage measurements (m V)
H F SL H+SL H+F Sin Vi R in V5or V6 SVi+RVSor V6
2-9
2-82-02-6
3.33.92.31-72.32.52-92.5i*62-8
4.I2-6
3.74.42-I2.7i*82-62.52.72'2
3.53.53.52-64.2I'9
2-0I92-82-0I.5
I.4I *0
0-9I *21-7I.7
2.32-0
3.72-I2.4
3-02-2I 9
2102-2
3-02.52-I2-8
4.I2-I2.34.22.43.60-92-0I.72-6212
2-02.7I.5i*62.4I.32.7I 9
I 9
I
I 9
2-0I.51-7I *82.51-7
2-I 5-0o-g 2-8
4'3 7-1I-5 3-5I-8 4-43-3 6-6
3.3 7-2
2.3 4.61.5 3.2I-6 3'9I9 4.4
2.3 5.22-7 5-2
I.5 3.II-8 4.63-0 7-12.5 5.I3-6 7-32-3 6-6I-8 3.82.5 5.22-0 3-82-7 5-32-4 4-9I-8 4 52-2 4-42-8 6-32-6 6-I3-5 7-02-4 5-°4X0 8-22'2 4.II-8 3.81I4 3-3I-8 4.62-0 4-0I*-5 3-0I-8 3.2I.3 2.31.4 2.3I-6 2-82-I 3-8III 2-8
5.2 3-6 4-03.9 I-0 2.46-5 3-0 2-64.I 1I5 2-2
5-0 3-1 3.26-3 4-0 2-86- I 3.8 3.84.2 I-9 2-93.3 2'I I 24-3 2-0 2.74-7 2-7 2-95.I 212 4-05-0 2-4 3-73.7 I-3 2-0
5-6 3-4 3.68-2 3.2 5.84.7 2-8 3.26-o 3-0 3-98-6 I-9 2-9
4.5 I-2 2.46-3 4-0 4-32-7 I-2 I-24.6 2-2 3-34-2 3.5 2-I5.3 I-7 3.I4.4 2-9 2-05.5 2-7 2.56-2 2-8 4-75-0 2-5 2.74.2 I-5 2-56-6 2-5 2-33.2 210 I.44-7 2-4 2.43-8 3-0 I.34-7 2-2 2-63.9 I-3 2-63.4 I-7 I-83.4 IP0 2-02.5 I-2 I.32-6 0-5 I-43-0 I12 1.74.2 1.3 I-83.4 I-3 2.3
7.6
3.45-63.76.36-8
7.44.8
3.34.75-66-26-I3.37-09-06-o6-94.83.6
4.72.4
5.55.64.8
4.95-2
7.55.2
4-04.8
3.44.8
4.34.8
3.93.53-02.5I'9
2-9
3.I3.6
I2
345678910I'12'3'4'5x6I7I8I9202I2223242526272829303I3233343536373839404I4243
on 15 July 2018 by guest. Protected by copyright.
http://heart.bmj.com
/B
r Heart J: first published as 10.1136/hrt.36.10.981 on 1 O
ctober 1974. Dow
nloaded from

LV mass by ultrasound and voltage measurements 985
TABLE 3 Regression data (y = bx+ a) and correlation coefficients (r)
y x Slope (b) Intercept (a) r
FH+SL io8 6 -65 7 O0903Ultrasound left ventricular mass JH+F I02*2 -36-2 0o780 p <o-ooi
HSi8+R868 -7I9 o-895Sl+R or ve 8o-o 59-6 0-730
R wave in Vs or V6, whichever was greater, was used asan index of praecordial voltage (Sokalow and Lyon,'949).The ultrasound and voltage (H, H+ SL, H+ F,
Svl +RV5 or v6) data were submitted to stepwise linearregression analysis. Significance levels (P) were obtainedfrom tables. The correlation coefficients (r) relating toH+SL and Svl+RV5 or Vs were tested for significantdifference by Z transformation.
ResultsThe ultrasound data are given in Table i. Vector-cardiographic and electrocardiographic data aregiven in Table 2. There was a good correlationbetween left ventricular mass determined by echo-cardiography and the various voltage measure-ments (Table 3). The correlation between ultra-sound left ventricular mass and H + SL and Svl +Rv5 or Vs are illustrated in Fig. 3 and 4, respectively.
900
800
0%,700-
E bOO00
5> 300~
E 200L-
1-
u_
100
r -090P<0.001y= 108bx-657
0 .
0/-.
S.
0 1 2 3 4 5 6 7 8H + SL (mV)
FIG. 3 Relation between left ventricular mass de-termined echocardiographically and the sum of themaximum vectors in the horizontal and saggitalplanes of the vectorcardiogram. Open circles =normalsulects; dots =patients.
900
800a.700
E00m
*Q 500
>4
Xo 300-v
0
.E 200'
100
0
r=073P<0*001y = 80 00x + 59b6
0 1 2 3 4 5 6 7 8 9sV+ RV5orV6(mV)
FIG. 4 Relation between left ventricular mass de-termined echocardiographically and the swn of the Swave in lead VI and the R wave in Vs or V6 of theelectrocardiogram. Open circles= normal subjects;dots=patients.
The respective r values, o9go and o073, proved to besignificantly different at the 5 per cent level.
DiscussionSeveral authors have shown good correlation be-tween echocardiographic and angiocardiographicmeasurements of left ventricular wall thickness(Sjogren, Hytonen, and Frick, 1970; Troy et al.,I972; Murrayetal., 1972).Thecube oftheultrasoundleft ventricular internal dimension has been shownto correlate closely with left ventricular cavityvolume measured by biplane angiocardiography(Feigenbaum et al., I969; Feigenbaum, I972;Pombo, Troy, and Russell, 1971; Murray et al.,1972; Gibson, 1973).In our study, the volume occupied by the left
ventricular wall was estimated, using echocardio-graphic measurements of left ventricular wall thick-ness (LV) and internal dimension (LVID), by
*
0
o O
.
00
0
on 15 July 2018 by guest. Protected by copyright.
http://heart.bmj.com
/B
r Heart J: first published as 10.1136/hrt.36.10.981 on 1 O
ctober 1974. Dow
nloaded from

986 Bennett and Evans
FIG. 5 Diagrammatic cross-section of left ventricle,to show the components of the minor axis of the greaterspheroid (left ventricular cavity plus wall).
determining the volume occupied by left ventricularwall plus cavity, i.e. (2LV+ LVID)3, and sub-tracting from this the estimated left ventricularcavity volume LVID3 (Fig. 5). This method of cal-culation appears preferable to that used by Murrayet al. (I972), in their comparison of ultrasound andangiocardiographic left ventricular mass. They usedthe formula:Left ventricular wall volume = (LV + LVID)3 -
LVID3.However (LVID + LV) does not represent the com-plete ultrasound dimension of ventricular wall pluscavity. Recalculation of their data using the formula:
Left ventricular wall volume = (2LV+ LVID)3 -
LVID3gave substantially greater values for ultrasound leftventricular mass which in absolute terms corre-lated more closely with the angiocardiographicresults and gave an r value of o-86 compared withthe figure of o-83 which they obtained.Troy et al. (I972) employed the formula:
Left ventricular wall volume = 4(LVI + LV).
(LVID+LV) - 4 (LVID) LVID.
This is derived from the basic formula for an ellip-soid of rotation (prolate spheroid) and requires twoassumptions. The first is that LVID is a minor axis
(Fortuin et al., I97I; Pombo et al., I97I; Murrayet al., 1972; Gibson, 1973), 2 being the
2appropriate hemiaxis (radius) quantity. The secondis that the major axis of the reference figure is twicethe length of the minor axes (Sandler and Dodge,I968; Pombo et al., I97I; Ross et al., I97I). Intheir formula, therefore, LVID is used as the valueof the major hemiaxis of the inner spheroid andthis is appropriate. The major axis of the outerspheroid (ventricular wall plus cavity) is, however,represented by LVID + LV; since the minor hemi-
axes of this reference figure are each + LV,2
the proper term for its major hemiaxis is
2 LVI +LV), i.e. LVID+2LV.
Recalculation of their data using the correctedformula: Left ventricular muscle volume =4 (LVID 2~T 4(LVID)247LI +LV). (LVID +2LV)--ff3 \2 3ILVID yields closer correspondence between theactual values for ultrasound and angiocardiographicmass and r value of o-893 compared with theirfigure of o-883. Use of the simplified formula weemployed is, of course, equivalent to proper use ofthe same basic formula, X being substituted by 3.The error involved in this approximation is lessthan 5 per cent and considered insignificant in thelight of the obvious limitations of the basic assump-tions necessarily involved.
Various vectorcardiographic measurements havebeen used in the assessment of left ventricularenlargement. Some, such as the horizontal maxi-mum vector (Rainey et al., I967), or the sum of thehorizontal and frontal maximum vectors (Fowler,Shams, and Keith, I97I), are relatively simple andeasy to make. Others, however, such as the leftmaximum spatial voltage measurement (Hugen-holtz and Gamboa, I964) are too complex for generaluse. Left ventricular enlargement causes an increasein, and a posterior, leftward, and usually superiorshift of, the maximum QRS vector. Vectorcardio-graphic loops in two planes are required to recordthese changes fully since they occur in more thanone axis. For this study, therefore, the sums of themaximum QRS vectors in the horizontal and sagittal,and horizontal and frontal, planes were chosen assimple vectorcardiographic indices, together withthe maximum horizontal plane vector. All theseindices yielded good correlation with ultrasoundleft ventricular mass. Similarly good correlation hasbeen demonstrated in a study of 22 patients withaortic incompetence (Rainey et al., I967), between
I
on 15 July 2018 by guest. Protected by copyright.
http://heart.bmj.com
/B
r Heart J: first published as 10.1136/hrt.36.10.981 on 1 O
ctober 1974. Dow
nloaded from

LV mass by ultrasound and voltage measurements 987
left ventricular mass measured by angiocardio-graphy and the maximum vector in the horizontalplane, and, in 107 miscellaneous patients (Vineet al., I97i), between time strength integrals ofinstantaneous spatial vectors and angiocardio-graphic left ventricular mass.The scalar electrocardiographic criterion of
Sokalow and Lyon (1949), i.e. Sv1 + Rv5 or V6) waschosen as an index of praecordial voltage because ithad shown the closest correlation of various prae-cordial voltage criteria with angiocardiographicallydetermined left ventricular mass (Vine et al., I971).In this study there was less good correlation be-tween these voltage measurements and ultrasoundleft ventricular mass than was observed with thevectorcardiographic measurement (P <o0o5).
In conditions affecting only the left side of theheart the above recommended vectorcardiographicmeasurements are a useful noninvasive method ofassessing left ventricular mass and are easier tomake than the ultrasound measurements, which insome cases may be impossible to obtain. Wherethere is coexistent right ventricular enlargement,voltage changes arising from the left ventricle maybe influenced by those from the right ventricle andthe ultrasound method appears more suitable, pro-vided that uniformity of left ventricular wall thick-ness can reasonably be assumed.
Our thanks are due to the following: Dr. H. A. Flemingand Mr. B. B. Milstein for advice and permission tostudy their patients; Miss Vivien Key for technicalassistance; Messrs. R. Hankar (University of Cambridge)and J. Seldrup (Geigy Pharmaceuticals Ltd) for stat-istical help; Departnent of Medical Photography,Addenbrooke's Hospital, for reproduction of the figures.
ReferencesAbbott-Smith, C. W., and Chou, T. C. (I970). Vectorcardio-
graphic criteria for the diagnosis of left ventricular hyper-trophy. American HeartJournal, 79, 36I.
Bardeen, C. R. (I9I8). Determination of the size of the heartby means of the x-rays. American Journal of Anatomy, 23,423.
Bristow, J. D., Porter, G. A., and Griswold, H. E. (I96I).Observations with the Frank system of vectorcardio-graphy in left ventricular hypertrophy. American HeartJournal, 62, 62I.
Feigenbaum, H. (I972). Clinical applications of echocardio-graphy. Progress in Cardiovascular Diseases, 14, 53I.
Feigenbaum, H., Wolfe, S. B., Popp, R. L., Haine, C. L., andDodge, H. T. (I969). Correlation of ultrasound withangiocardiography in measuring left ventricular diastolicvolume. American3Journal of Cardiology, 23, III.
Fortuin, N. J., Hood, W. P., Sherman, M. E., and Craige, E.(I97I). Determination of left ventricular volumes byultrasound. Circulation, 44, 575.
Fowler, R. S., Shams, A., and Keith, J. D. (I97I). Vector-cardiography, p. 568. North-Holland Publishing Company,Amsterdam.
Frank, E. (I956). An accurate, clinically practical system forspatial vectorcardiography. Circulation, 13, 737.
Gibson, D. G. (I973). Estimation of left ventricular size byechocardiography. British Heart Journal, 35, I28.
Hugenholtz, P. G., and Gamboa, R. (I964). Effects of chron-ically increased ventricular pressure on electrical forces ofthe heart. Circulation, 30, 5II.
Mazzoleni, A., Wolff, R., and Wolff. L. (I959). The vetor-cardiogram in left ventricular hypertrophy. American HeartJournal, 58, 648.
Murray, J. A., Johnston, W., and Reid, J. M. (I972). Echo-cardiographic determination of left ventricular dimensions,volumes and performance. AmericanJournal of Cardiology,30, 252.
Pombo, J. F., Troy, B. L., and Russell, R. 0. (I97i). Leftventricular volumes and ejection fraction by echocardio-graphy. Circulation, 43, 480.
Rainey, R. L., Besseghini, I., Witham, A. C., and Edmonds,J. H. (I967). Vectorcardiographic correlations with mass,volume, and other hemodynamics in aortic insufficiency.Circulation, 36, Suppl. II, 2I5.
Ross, J., Sonnenblick, E. H., Taylor, R. R., Spotnitz, H. M.,and Covell, J. W. (I97i). Diastolic geometry and sarco-mere lengths in the chronically dilated canine left ven-tricle. Circulation Research, 28, 49.
Sandler, H., and Dodge, H. T. (I968). Use of single planeangiocardiograms for the calculation of left ventricularvolume in man. American Heart Journal, 75, 325.
Sjogren, A. L., Hyt6nen, I., and Frick, M. H. (I970). Ultra-sound measurements of left ventricular wall thickness.Chest, 57, 37.
Sokalow, M., and Lyon, T. P. (I949). The ventricular complexin left ventricular hypertrophy as obtained by unipolarprecordial and limb leads. American Heart-Journal, 37, I6I.
Troy, B. L., Pombo, J., and Rackley, C. E. (1972). Measure-ment of left ventricular wall thickness and mass by echo-cardiography. Circulation, 45, 602.
Vine, D. L., Finchum, R. N., Dodge, H. T., Bancroft, W. H.,and Hurst, D. C. (I97I). Comparison of the vectorcardio-gram with the electrocardiogram in the prediction of leftventricular size. Circulation, 43, 547.
Requests for reprints to Dr. D. Bennett, Regional Car-diac Unit, Papworth Hospital, Papworth Everard,Cambridge CB3 8RE.
on 15 July 2018 by guest. Protected by copyright.
http://heart.bmj.com
/B
r Heart J: first published as 10.1136/hrt.36.10.981 on 1 O
ctober 1974. Dow
nloaded from