Embed Size (px)
Citation preview

Corporate ProfileJune 2018

Forward Looking Information and Non-GAAP Measures
This presentation includes certain forward looking information, including future oriented financial information or financial outlook, which is intended to help current and potential investors understand management’s assessment of our future plans and financial outlook, and our future prospects overall. Statements that are forward-looking are based on certain assumptions and on what we know and expect today and generally include words like anticipate, expect, believe, may, will, should, estimate or other similar words.
Forward-looking statements do not guarantee future performance. Actual events and results could be significantly different because of assumptions, risks or uncertainties related to our business or events that happen after the date of this presentation. Our forward-looking information in this presentation includes statements related to: future dividend growth and the future growth of our core businesses.
Our forward looking information is based on certain key assumptions and is subject to risks and uncertainties, including but not limited to: our ability to successfully implement our strategic priorities and whether they will yield the expected benefits, the operating performance of our pipeline and energy assets, amount of capacity sold and rates achieved in our pipeline businesses, the availability and price of energy commodities, the amount of capacity payments and revenues from our energy business, regulatory decisions and outcomes, including those related to recent FERC policy changes, outcomes of legal proceedings, including arbitration and insurance claims, performance and credit risk of our counterparties, changes in market commodity prices, changes in the regulatory environment, changes in the political environment, changes in environmental and other laws and regulations, competitive factors in the pipeline and energy sectors, construction and completion of capital projects, costs for labour, equipment and materials, access to capital markets, including the economic benefit of asset drop downs to TC PipeLines, LP, interest, tax and foreign exchange rates, including the impact of U.S. Tax Reform, weather, cyber security, technological developments, economic conditions in North America as well as globally. You can read more about these risks and others in our April 26, 2018 Quarterly Report to Shareholders and 2017 Annual Report filed with Canadian securities regulators and the SEC and available at www.transcanada.com.
As actual results could vary significantly from the forward-looking information, you should not put undue reliance on forward-looking information and should not use future-oriented information or financial outlooks for anything other than their intended purpose. We do not update our forward-looking statements due to new information or future events, unless we are required to by law.
This presentation contains reference to certain financial measures (non-GAAP measures) that do not have any standardized meaning as prescribed by U.S. generally accepted accounting principles (GAAP) and therefore may not be comparable to similar measures presented by other entities. These non-GAAP measures may include Comparable Earnings, Comparable Earnings per Common Share, Comparable Earnings Before Interest, Taxes, Depreciation and Amortization (Comparable EBITDA), Funds Generated from Operations, Comparable Funds Generated from Operations, Comparable Distributable Cash Flow (DCF) and Comparable DCF per Common Share. Reconciliations to the most closely related GAAP measures are included in this presentation and in our April 26, 2018 Quarterly Report to Shareholders filed with Canadian securities regulators and the SEC and available at www.transcanada.com.
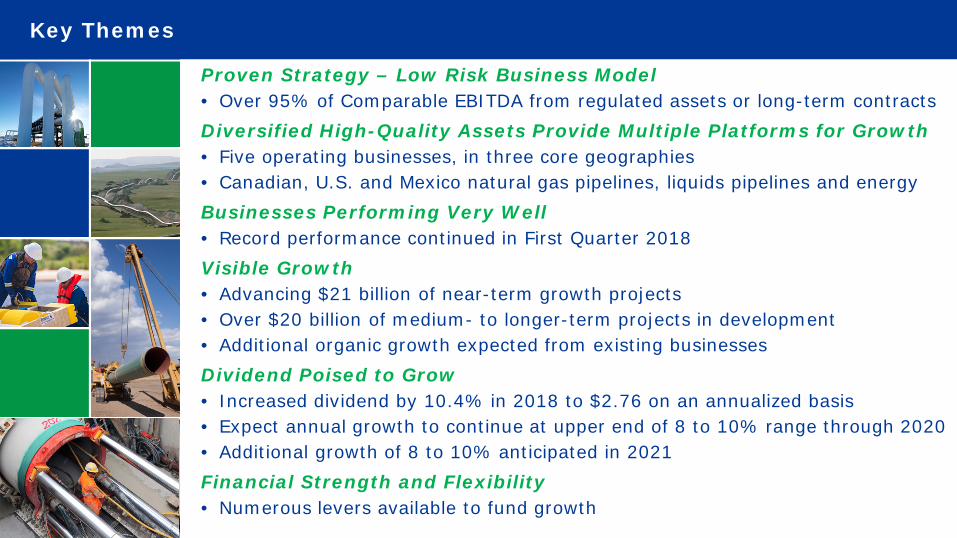
Proven Strategy – Low Risk Business Model• Over 95% of Comparable EBITDA from regulated assets or long-term contractsDiversified High-Quality Assets Provide Multiple Platforms for Growth• Five operating businesses, in three core geographies• Canadian, U.S. and Mexico natural gas pipelines, liquids pipelines and energyBusinesses Performing Very Well• Record performance continued in First Quarter 2018Visible Growth• Advancing $21 billion of near-term growth projects• Over $20 billion of medium- to longer-term projects in development• Additional organic growth expected from existing businessesDividend Poised to Grow• Increased dividend by 10.4% in 2018 to $2.76 on an annualized basis• Expect annual growth to continue at upper end of 8 to 10% range through 2020• Additional growth of 8 to 10% anticipated in 2021Financial Strength and Flexibility• Numerous levers available to fund growth
Key Themes
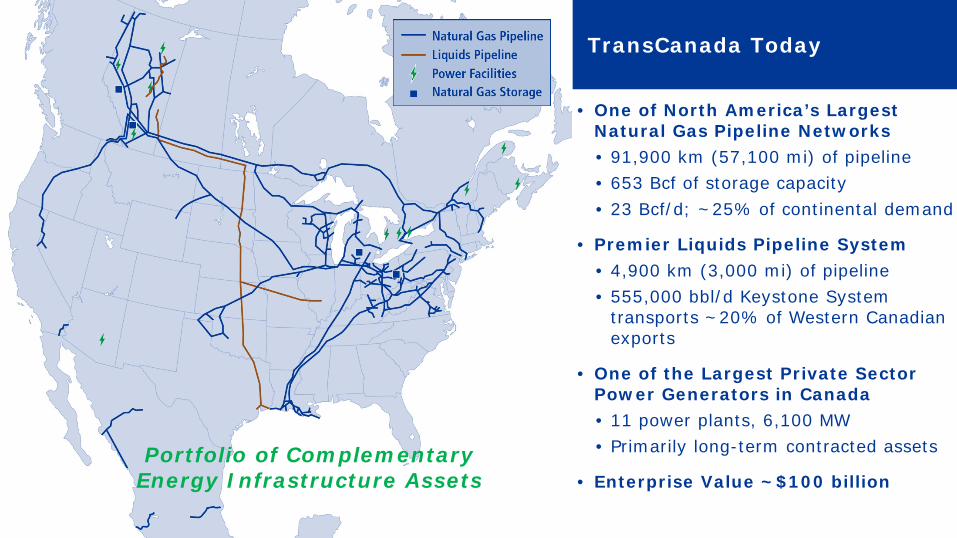
• One of North America’s Largest Natural Gas Pipeline Networks• 91,900 km (57,100 mi) of pipeline• 653 Bcf of storage capacity• 23 Bcf/d; ~25% of continental demand
• Premier Liquids Pipeline System• 4,900 km (3,000 mi) of pipeline• 555,000 bbl/d Keystone System
transports ~20% of Western Canadian exports
• One of the Largest Private Sector Power Generators in Canada• 11 power plants, 6,100 MW• Primarily long-term contracted assets
• Enterprise Value ~$100 billion
TransCanada Today
Portfolio of Complementary Energy Infrastructure Assets
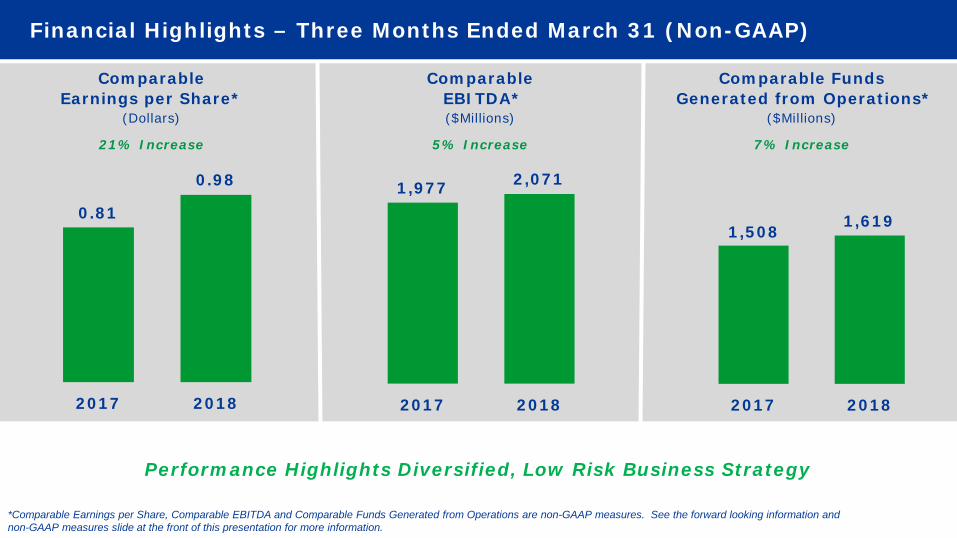
2017 2018
ComparableEBITDA*($Millions)
5% Increase
1,977 2,071
2017 2018
Financial Highlights – Three Months Ended March 31 (Non-GAAP)
2017 2018
0.81
0.98
1,508 1,619
Comparable Earnings per Share*
(Dollars)
21% Increase
Comparable FundsGenerated from Operations*
($Millions)
7% Increase
*Comparable Earnings per Share, Comparable EBITDA and Comparable Funds Generated from Operations are non-GAAP measures. See the forward looking information and non-GAAP measures slide at the front of this presentation for more information.
Performance Highlights Diversified, Low Risk Business Strategy

First Quarter 2018 Highlights
Continued to generate record financial results• Comparable earnings were $0.98 per share, a 21 per cent increase over last year
Declared quarterly dividend of $0.69 per common share• Equivalent to an annualized $2.76 per share, a 10 per cent increase over 2017
Advanced $21 billion near-term capital program• Placed the US$1.6 billion Leach XPress project, US$0.3 billion Cameron Access project and NGTL
Expansion projects of approximately $260 million into service• Announced $2.5 billion of NGTL expansions
Progressed over $20 billion of medium- to longer-term projects under development• Includes Keystone XL, Coastal GasLink and Bruce Power Life Extension program
Raised $649 million of common equity to help fund capital program• Included $234 million of DRP proceeds and $415 million under the ATM program
Successfully Advanced our Strategic Priorities
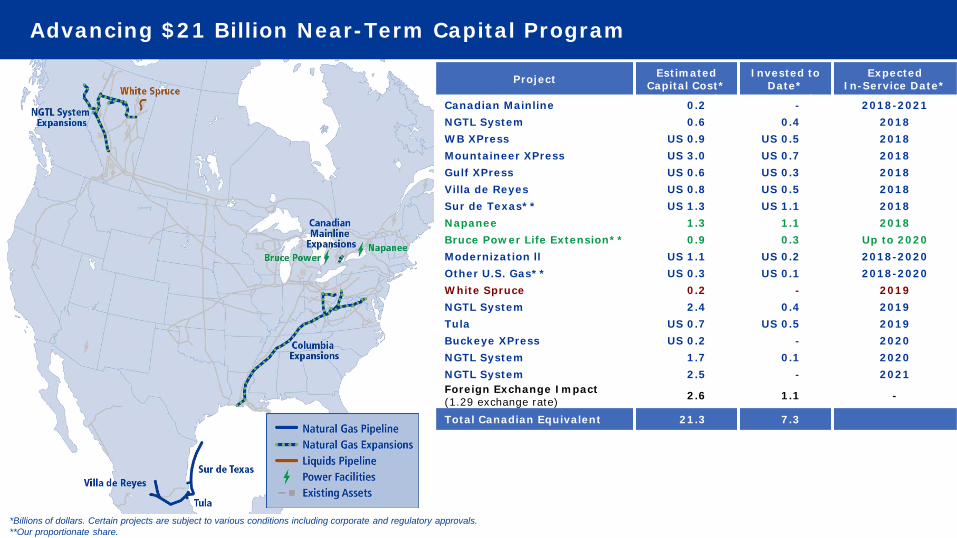
Advancing $21 Billion Near-Term Capital Program
*Billions of dollars. Certain projects are subject to various conditions including corporate and regulatory approvals. **Our proportionate share.
Project EstimatedCapital Cost*
Invested to Date*
Expected In-Service Date*
Canadian Mainline 0.2 - 2018-2021NGTL System 0.6 0.4 2018WB XPress US 0.9 US 0.5 2018Mountaineer XPress US 3.0 US 0.7 2018Gulf XPress US 0.6 US 0.3 2018Villa de Reyes US 0.8 US 0.5 2018Sur de Texas** US 1.3 US 1.1 2018Napanee 1.3 1.1 2018Bruce Power Life Extension** 0.9 0.3 Up to 2020Modernization ll US 1.1 US 0.2 2018-2020Other U.S. Gas** US 0.3 US 0.1 2018-2020White Spruce 0.2 - 2019NGTL System 2.4 0.4 2019Tula US 0.7 US 0.5 2019Buckeye XPress US 0.2 - 2020NGTL System 1.7 0.1 2020NGTL System 2.5 - 2021Foreign Exchange Impact (1.29 exchange rate) 2.6 1.1 -
Total Canadian Equivalent 21.3 7.3

5
6
7
8
9
10
2015 2016 2017 2020E
$21 Billion of Near-Term Projects Drive Significant Growth
* Includes existing assets, non-controlling interests in U.S. Natural Gas Pipelines and $21 billion of near-term projects subject to various conditions including corporate and regulatory approvals. Does not include potential impact of March 15, 2018 FERC actions. Comparable EBITDA is a non-GAAP measure. See the non-GAAP measures slide at the front of this presentation for more information. **Grey bar indicates EBITDA from Energy assets sold.
~10% CAGR
Comparable EBITDA Outlook*2015 – 2020E
$Billions
Advancing Over $20 Billion of Additional Projects that could Extend Growth Beyond 2020
5.9
6.6
7.4**
9.5
Columbia
Other U.S. Gas
Pipelines
Canadian Gas
Pipelines
Mexico Gas
Pipelines
Liquids Pipelines
Energy

0
2
4
6
8
10
12
2015 2020E 2021E
Visibility to 8-10% Growth Through 2021
*Comparable EBITDA is a non-GAAP measure. See the non-GAAP measures slide at the front of this presentation for more information.
Comparable EBITDA Outlook*
Capacity available to invest in future growth opportunities:
• Organic growth from existing platform (over $3 billion added in 2017; announced $2.5 billion NGTL expansion in first quarter 2018)
• Over $20 billion of medium- to longer-term projects in development
Other revenue enhancements and operating efficiencies across our existing businesses
$21 Billion Near-Term
Capital Program8%
CAGR
10% CAGR
$Billions
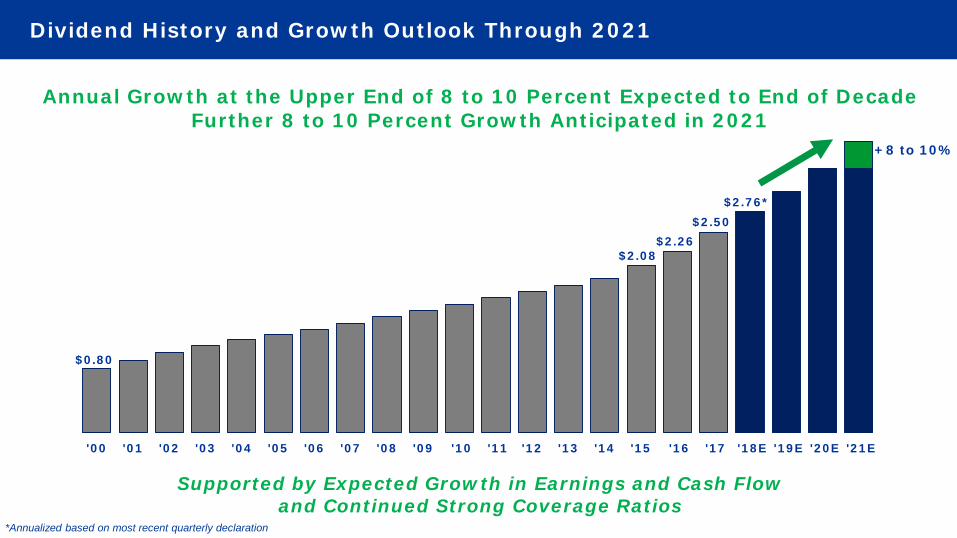
Annual Growth at the Upper End of 8 to 10 Percent Expected to End of DecadeFurther 8 to 10 Percent Growth Anticipated in 2021
'00 '01 '02 '03 '04 '05 '06 '07 '08 '09 '10 '11 '12 '13 '14 '15 '16 '17 '18E '19E '20E '21E
Dividend History and Growth Outlook Through 2021
Supported by Expected Growth in Earnings and Cash Flow and Continued Strong Coverage Ratios
+8 to 10%
$2.76*
$0.80
*Annualized based on most recent quarterly declaration
$2.08$2.26
$2.50
0
5
10
15
20
25
30
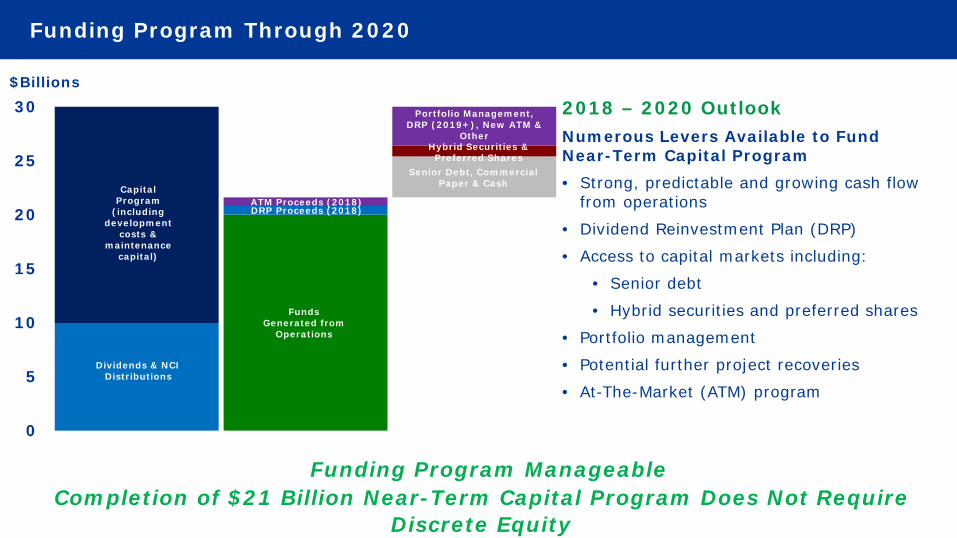
Senior Debt, Commercial Paper & Cash
Funding Program Through 2020
$Billions
2018 – 2020 OutlookNumerous Levers Available to Fund Near-Term Capital Program• Strong, predictable and growing cash flow
from operations
• Dividend Reinvestment Plan (DRP)
• Access to capital markets including:
• Senior debt
• Hybrid securities and preferred shares
• Portfolio management
• Potential further project recoveries
• At-The-Market (ATM) program
Funding Program ManageableCompletion of $21 Billion Near-Term Capital Program Does Not Require
Discrete Equity
Capital Program
(including development
costs & maintenance
capital)
Funds Generated from
Operations
Dividends & NCI Distributions
DRP Proceeds (2018)
Portfolio Management, DRP (2019+), New ATM &
Other
ATM Proceeds (2018)
Hybrid Securities & Preferred Shares
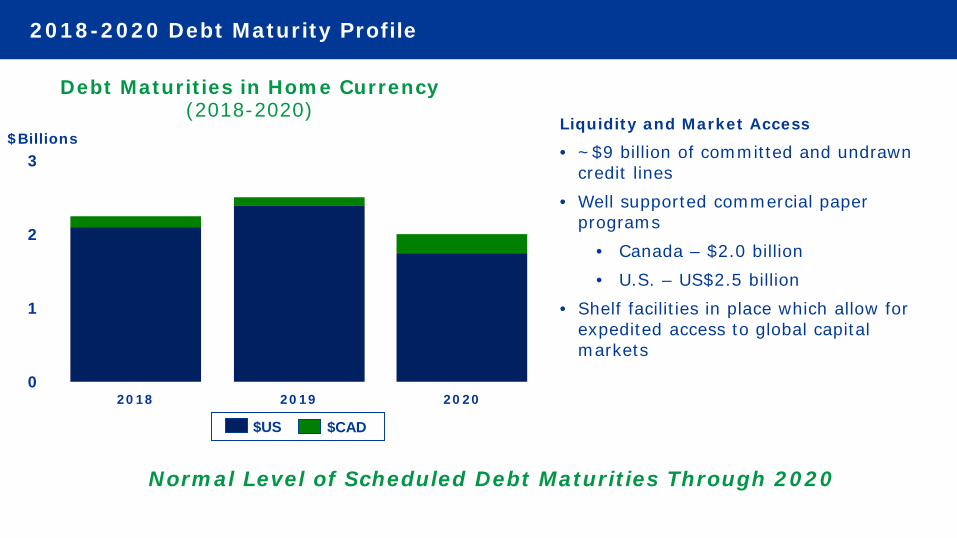
0
1
2
3
2018 2019 2020
2018-2020 Debt Maturity Profile
Liquidity and Market Access
• ~$9 billion of committed and undrawn credit lines
• Well supported commercial paper programs
• Canada – $2.0 billion• U.S. – US$2.5 billion
• Shelf facilities in place which allow for expedited access to global capital markets
Debt Maturities in Home Currency (2018-2020)
Normal Level of Scheduled Debt Maturities Through 2020
$Billions
$US $CAD

Funding Program Continues in 2018
Strong, predictable and growing cash flow from operations• Comparable funds generated from operations of $1.6 billion in first quarter
• $1.3 billion of cash and cash equivalents on hand at March 31
Access to capital markets on compelling terms• Issued US$2.5 billion of senior notes including US$1 billion of 10-year notes at 4.25 percent, US$500 million
of 20-year notes at 4.75 percent and US$1 billion of 30-year notes at 4.875 percent
Dividend Reinvestment Plan participation remains significant• Approximately $430 million of common dividends reinvested in common shares to date
At-the-Market (ATM) equity issuance supports simultaneous large capital program and de-leveraging• Issued 5.8 million common shares at an average price of $56.51 per share for gross proceeds of $329 million
in first quarter
• Additional 1.6 million common shares issued in April, bringing year-to-date gross proceeds to $415 million
Bruce Power issued senior notes in capital markets • Resulted in $121 million of related distributions to TransCanada
Well Positioned to Finance Industry Leading Capital Program with Multiple Attractive Funding Options
55%45%
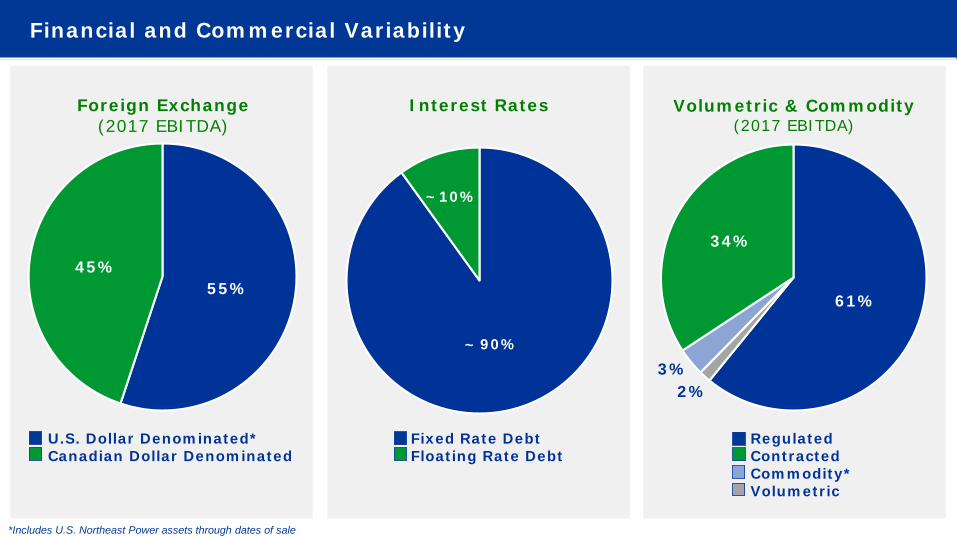
Financial and Commercial Variability
Foreign Exchange(2017 EBITDA)
Interest Rates
90%
10%
Fixed Rate DebtFloating Rate Debt
U.S. Dollar Denominated*Canadian Dollar Denominated
~
~
Volumetric & Commodity(2017 EBITDA)
61%
2%3%
34%
RegulatedContractedCommodity*Volumetric
*Includes U.S. Northeast Power assets through dates of sale

North American Natural Gas Pipeline Footprint
WCSB
Appalachian Basin
Extensive Footprint – Connecting Major Cost Competitive Basins to Markets
Across North America
• Well-positioned assets with access to North America’s two most prolific natural gas supply basins• 91,900 km (57,100 mi) of pipeline
• 653 Bcf of storage capacity
• Diversified customer base• Large intra-basin demand in Alberta
and the U.S. Northeast• Key transportation paths to large
demand centres across Canada, the U.S. and Mexico• Deliver ~25 percent of continental demand

Connecting Growing Natural Gas Supply to Market
North American Natural Gas Demand Growth*
0
20
40
60
80
100
120
140
2015 2020E 2030E
LNG Exports
Electric Generation
Industrial
Commercial
Residential
Pipe/Plant Fuels
Bcf/d
* TransCanada Outlook
WCSB
Appalachian Basin
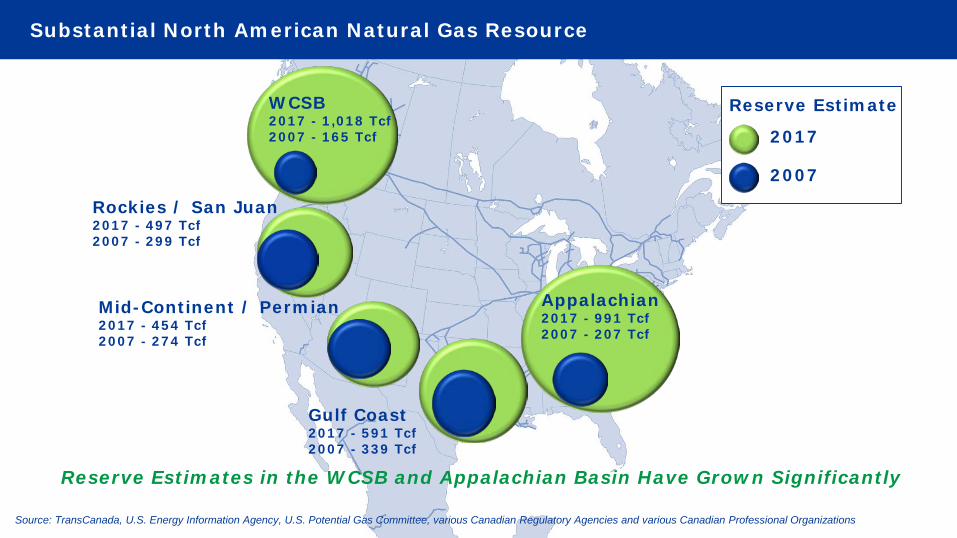
Substantial North American Natural Gas Resource
Source: TransCanada, U.S. Energy Information Agency, U.S. Potential Gas Committee, various Canadian Regulatory Agencies and various Canadian Professional Organizations
Rockies / San Juan2017 - 497 Tcf2007 - 299 Tcf
Mid-Continent / Permian2017 - 454 Tcf2007 - 274 Tcf
Gulf Coast2017 - 591 Tcf2007 - 339 Tcf
Appalachian2017 - 991 Tcf2007 - 207 Tcf
WCSB2017 - 1,018 Tcf2007 - 165 Tcf
Reserve Estimate
2017
2007
Reserve Estimates in the WCSB and Appalachian Basin Have Grown Significantly
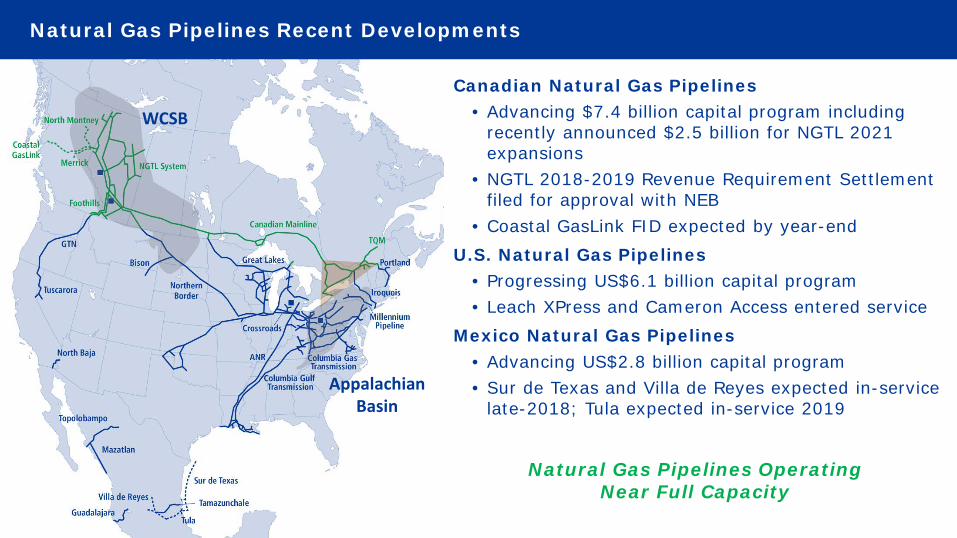
Natural Gas Pipelines Recent Developments
WCSB
Appalachian Basin
Canadian Natural Gas Pipelines• Advancing $7.4 billion capital program including
recently announced $2.5 billion for NGTL 2021 expansions
• NGTL 2018-2019 Revenue Requirement Settlement filed for approval with NEB
• Coastal GasLink FID expected by year-endU.S. Natural Gas Pipelines
• Progressing US$6.1 billion capital program • Leach XPress and Cameron Access entered service
Mexico Natural Gas Pipelines• Advancing US$2.8 billion capital program• Sur de Texas and Villa de Reyes expected in-service
late-2018; Tula expected in-service 2019
Natural Gas Pipelines Operating Near Full Capacity
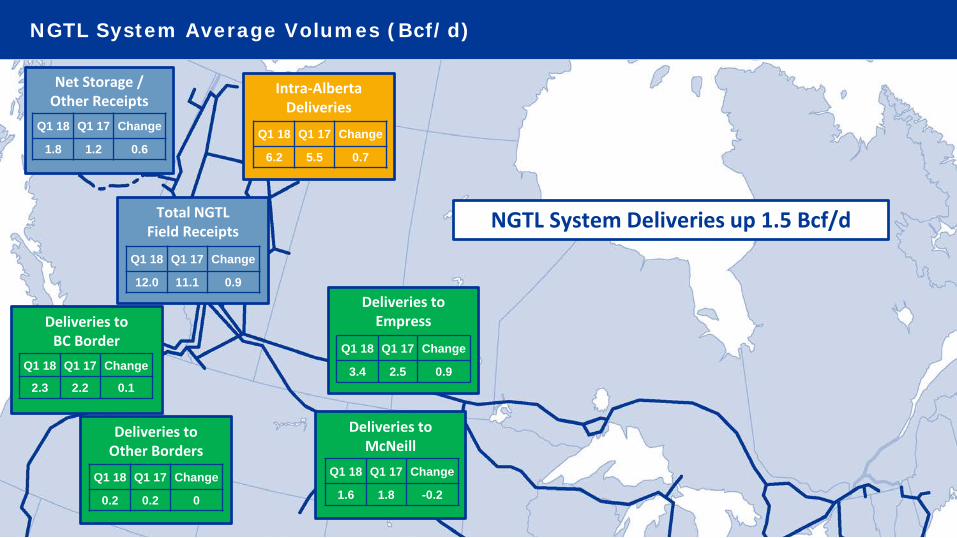
Total NGTL Field Receipts
NGTL System Average Volumes (Bcf/d)
Deliveries to McNeill
Deliveries to EmpressDeliveries to
BC Border
Intra-Alberta Deliveries
NGTL System Deliveries up 1.5 Bcf/d
Net Storage / Other Receipts
Q1 18 Q1 17 Change
1.8 1.2 0.6Q1 18 Q1 17 Change
6.2 5.5 0.7
Q1 18 Q1 17 Change
12.0 11.1 0.9
Q1 18 Q1 17 Change
3.4 2.5 0.9
Q1 18 Q1 17 Change
1.6 1.8 -0.2
Q1 18 Q1 17 Change
2.3 2.2 0.1
Deliveries to Other Borders
Q1 18 Q1 17 Change
0.2 0.2 0

• $7.2 billion capital program supported by long-term firm receipt and delivery contracts
• Adds 2.5 Bcf/d of incremental delivery capacity to market• Intra-Alberta delivery capacity to increase by
550 MMcf/d• Export capacity at Alberta / B.C. border (effectively
GTN) to increase by 650 MMcf/d• Export capacity at Alberta / Saskatchewan border to
increase by 1.3 Bcf/d
• Continue to work with industry on further initiatives to connect growing supply to markets including • Potential restoration of Canadian Mainline capacity• West Coast LNG
NGTL $7.2 Billion Capital Program Adds 2.5 Bcf/d of Delivery Capacity by 2021
~550 MMcf/d
~650 MMcf/d ~1.3 Bcf/d
Potential for Access to West Coast LNG

Canadian Mainline – Connecting North American Gas Supply to Market
• Current investment base of $3.8 billion expected to remain relatively stable• Strong ongoing operating and financial performance following 2014 rate settlement
• Mid-way toll review for 2018-2020 including costs, billing determinants, deferral balances• Approximately 8.4 Bcf/d of firm transportation contracts on the system
• Long-haul capacity contracted at approximately 3.5 Bcf/d from Empress• Includes 1.4 Bcf/d of Dawn Long-Term Fixed Price service at $0.77/GJ
• Expect to invest ~$200 million through 2021 to increase capacity from Dawn to eastern markets
Western Mainline
Eastern System
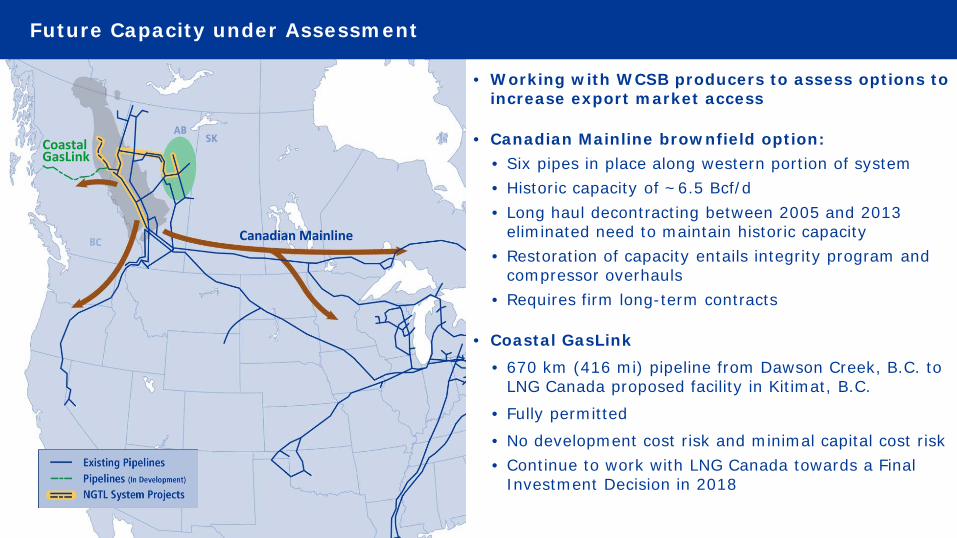
Future Capacity under Assessment
• Working with WCSB producers to assess options to increase export market access
• Canadian Mainline brownfield option:• Six pipes in place along western portion of system• Historic capacity of ~6.5 Bcf/d• Long haul decontracting between 2005 and 2013
eliminated need to maintain historic capacity• Restoration of capacity entails integrity program and
compressor overhauls• Requires firm long-term contracts
• Coastal GasLink• 670 km (416 mi) pipeline from Dawson Creek, B.C. to
LNG Canada proposed facility in Kitimat, B.C.
• Fully permitted
• No development cost risk and minimal capital cost risk• Continue to work with LNG Canada towards a Final
Investment Decision in 2018
Canadian Mainline
Coastal GasLink
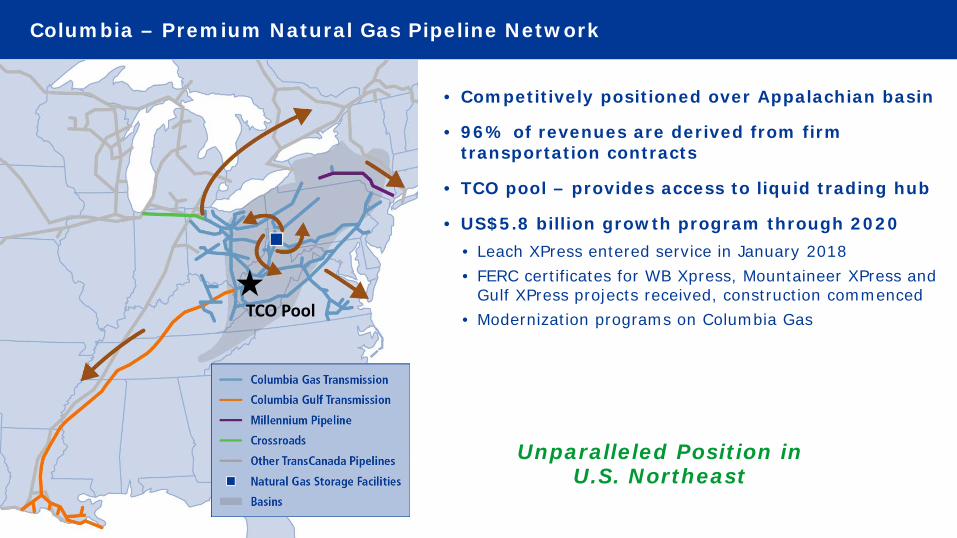
Columbia – Premium Natural Gas Pipeline Network
• Competitively positioned over Appalachian basin
• 96% of revenues are derived from firm transportation contracts
• TCO pool – provides access to liquid trading hub
• US$5.8 billion growth program through 2020• Leach XPress entered service in January 2018• FERC certificates for WB Xpress, Mountaineer XPress and
Gulf XPress projects received, construction commenced• Modernization programs on Columbia Gas
Unparalleled Position in U.S. Northeast
TCO Pool

FERC Actions
March 15, 2018 FERC Actions Include
• Revised Policy Statement - No longer permits MLPs to recover income tax allowance in cost of service rates• Notice of Proposed Rulemaking (NOPR) - Proposes process to address impact of federal income tax rate
reduction and revised Policy Statement for MLPs on interstate pipelines ratemaking
Response and Next Steps
• Filed Request for Clarification and If Necessary Rehearing of the FERC Policy Statement • Submitted comments on the NOPR; expect FERC to issue final order(s) in late summer or early fall 2018
Implications if Enacted as Proposed
TransCanada
• Expect no material impact to earnings and cash flow from directly-held U.S. natural gas pipelines• Drop downs to TC PipeLines not considered a viable funding lever at this time
• Not a material funding source in prior guidance; numerous other levers available
TC PipeLines
• Pipelines owned through TC PipeLines could be materially adversely impacted in absence of mitigation• Estimated annual revenue reduction of up to US$100 million• Reduced quarterly cash distributions to unitholders by 35 percent
• TransCanada owns 26 percent of TC PipeLines therefore impact not expected to be significant at TransCanada level
Expect No Material Financial Impact to TransCanada
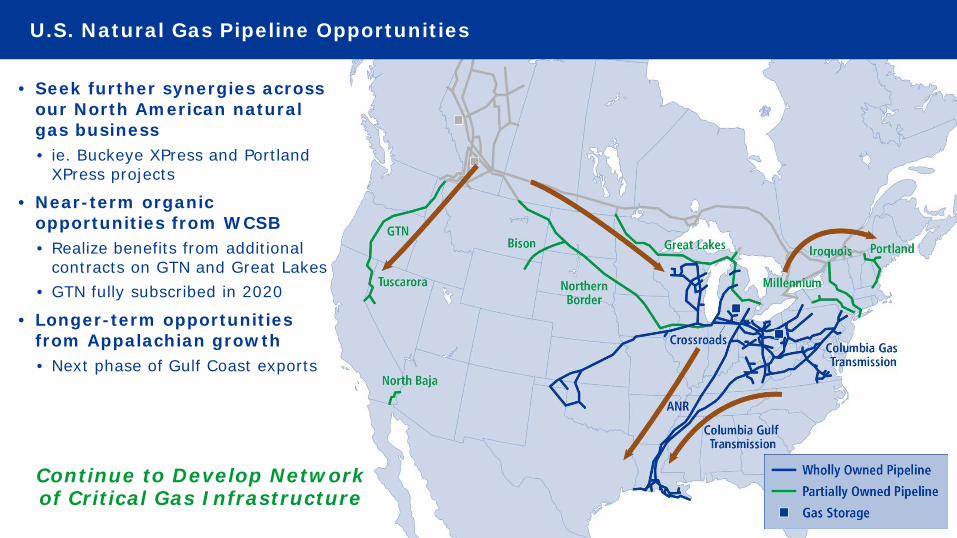
U.S. Natural Gas Pipeline Opportunities
• Seek further synergies across our North American natural gas business• ie. Buckeye XPress and Portland
XPress projects
• Near-term organic opportunities from WCSB• Realize benefits from additional
contracts on GTN and Great Lakes• GTN fully subscribed in 2020
• Longer-term opportunities from Appalachian growth• Next phase of Gulf Coast exports
Continue to Develop Network of Critical Gas Infrastructure

Mexico – Solid Position and Growing
• Four revenue-generating pipelines• Tamazunchale • Guadalajara• Mazatlán • Topolobampo
• Three new projects expected to enter service which will increase portfolio to ~US$5 billion• Tula – US$0.7 billion• Villa de Reyes – US$0.8 billion• Sur de Texas – US$1.3 billion*
• All underpinned by long-term contracts with the Comisión Federal de Electricidad
• Well positioned to connect U.S. natural gas supply to growing power generation and industrial markets in central Mexico
Developing an Integrated Natural Gas Delivery System
* TransCanada’s 60% share
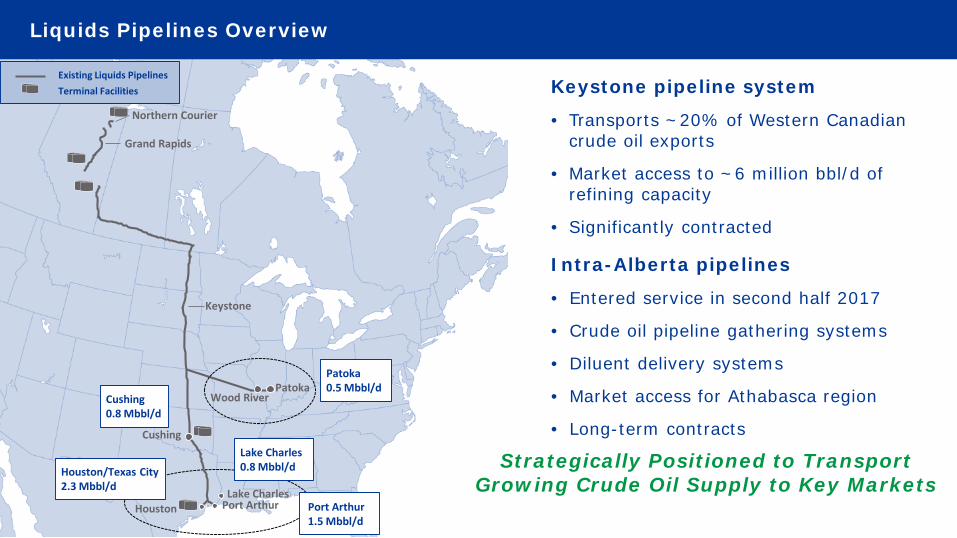
Liquids Pipelines Overview
Northern Courier
Grand Rapids
Keystone
Houston Port Arthur
Cushing
PatokaWood RiverCushing
0.8 Mbbl/d
Patoka0.5 Mbbl/d
Houston/Texas City2.3 Mbbl/d
Lake Charles0.8 Mbbl/d
Lake CharlesPort Arthur1.5 Mbbl/d
Strategically Positioned to Transport Growing Crude Oil Supply to Key Markets
Existing Liquids PipelinesTerminal Facilities Keystone pipeline system
• Transports ~20% of Western Canadian crude oil exports
• Market access to ~6 million bbl/d of refining capacity
• Significantly contracted
Intra-Alberta pipelines
• Entered service in second half 2017
• Crude oil pipeline gathering systems
• Diluent delivery systems
• Market access for Athabasca region
• Long-term contracts
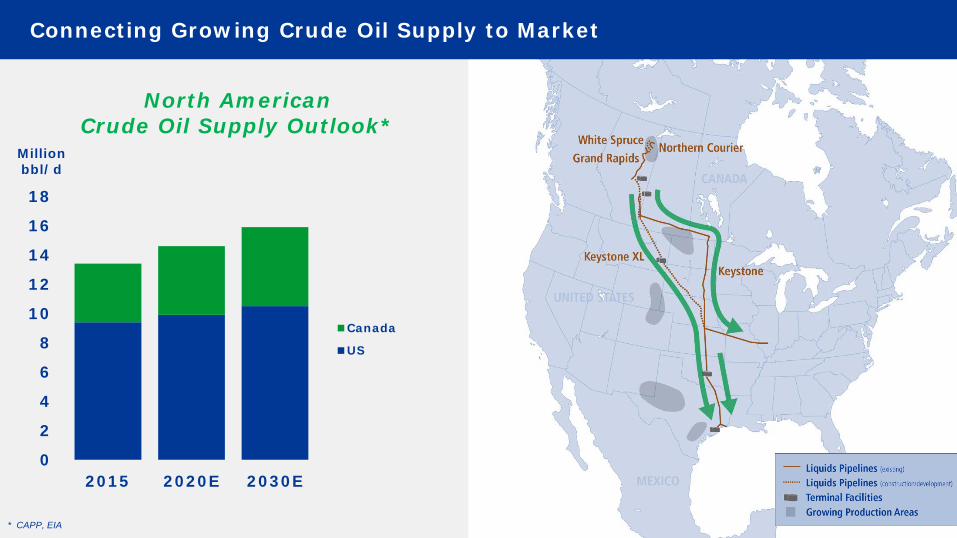
Connecting Growing Crude Oil Supply to Market
North American Crude Oil Supply Outlook*
* CAPP, EIA
0
2
4
6
8
10
12
14
16
18
2015 2020E 2030E
Canada
US
Million bbl/d
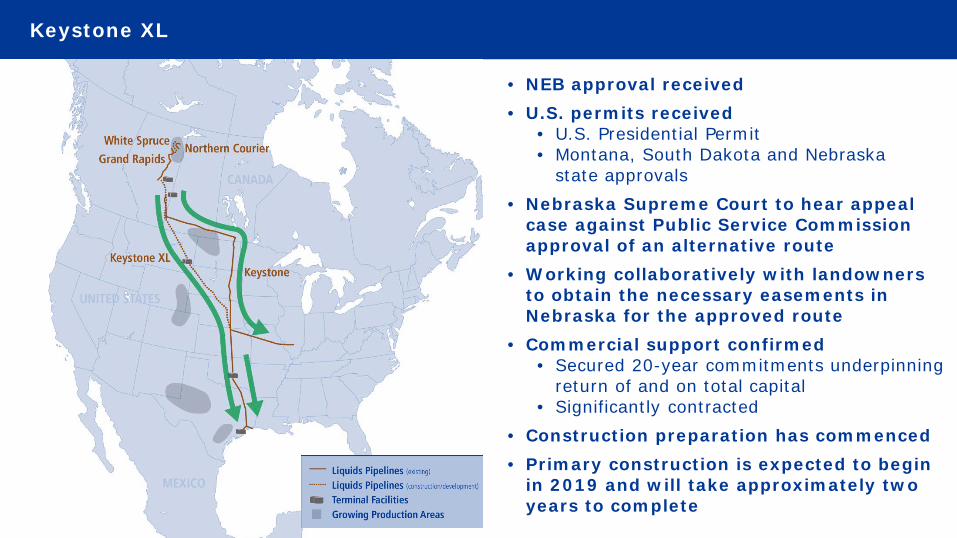
Keystone XL
• NEB approval received• U.S. permits received
• U.S. Presidential Permit• Montana, South Dakota and Nebraska
state approvals • Nebraska Supreme Court to hear appeal
case against Public Service Commission approval of an alternative route
• Working collaboratively with landowners to obtain the necessary easements in Nebraska for the approved route
• Commercial support confirmed• Secured 20-year commitments underpinning
return of and on total capital• Significantly contracted
• Construction preparation has commenced • Primary construction is expected to begin
in 2019 and will take approximately two years to complete
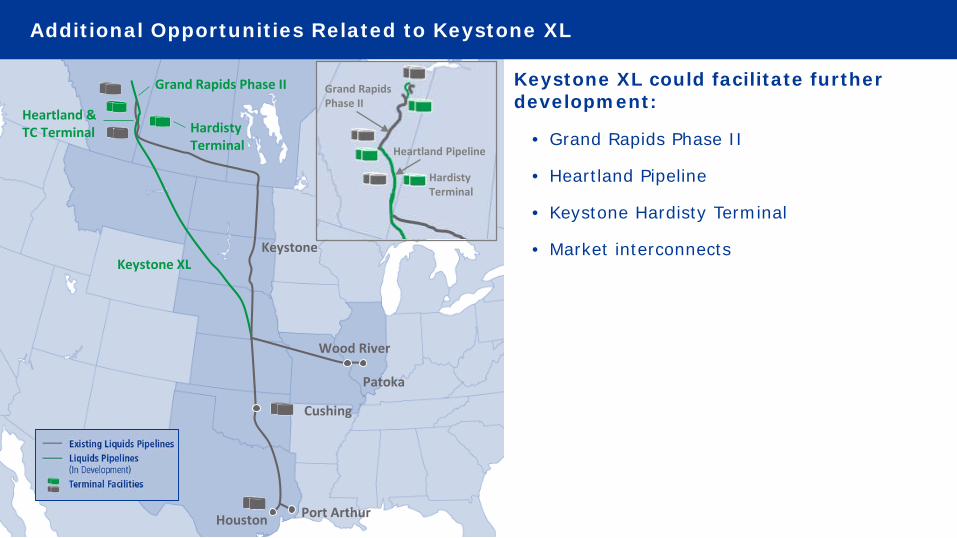
Cushing
Patoka
Wood River
Houston Port Arthur
Keystone XLKeystone
Hardisty Terminal
Heartland & TC Terminal
Additional Opportunities Related to Keystone XL
Keystone XL could facilitate further development:
• Grand Rapids Phase II
• Heartland Pipeline
• Keystone Hardisty Terminal
• Market interconnects
Hardisty Terminal
Heartland Pipeline
Grand Rapids Phase II
Grand Rapids Phase II
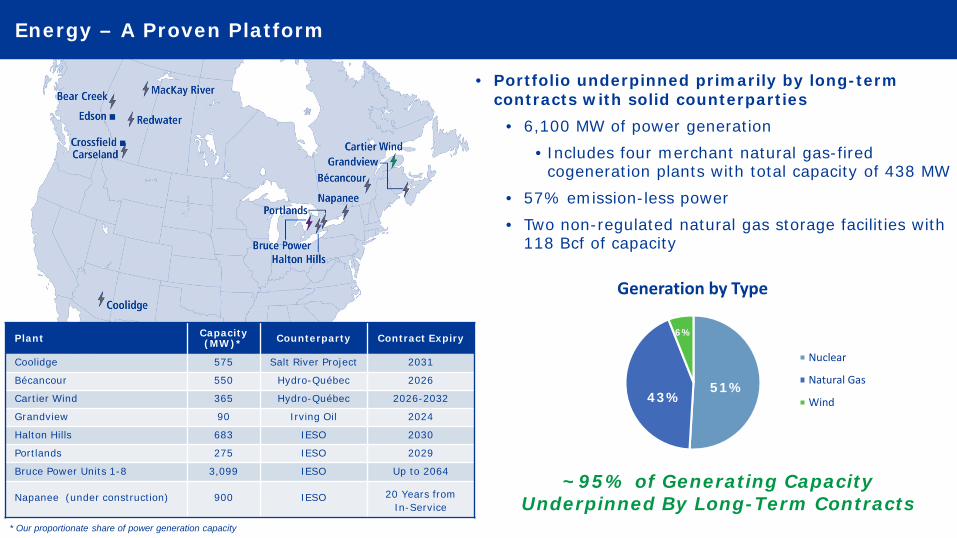
* Our proportionate share of power generation capacity
Plant Capacity (MW)* Counterparty Contract Expiry
Coolidge 575 Salt River Project 2031
Bécancour 550 Hydro-Québec 2026
Cartier Wind 365 Hydro-Québec 2026-2032
Grandview 90 Irving Oil 2024
Halton Hills 683 IESO 2030
Portlands 275 IESO 2029
Bruce Power Units 1-8 3,099 IESO Up to 2064
Napanee (under construction) 900 IESO 20 Years from In-Service
• Portfolio underpinned primarily by long-term contracts with solid counterparties
• 6,100 MW of power generation• Includes four merchant natural gas-fired
cogeneration plants with total capacity of 438 MW• 57% emission-less power• Two non-regulated natural gas storage facilities with
118 Bcf of capacity
Energy – A Proven Platform
~95% of Generating Capacity Underpinned By Long-Term Contracts
Generation by Type
Nuclear
Natural Gas
Wind51%
43%
6%
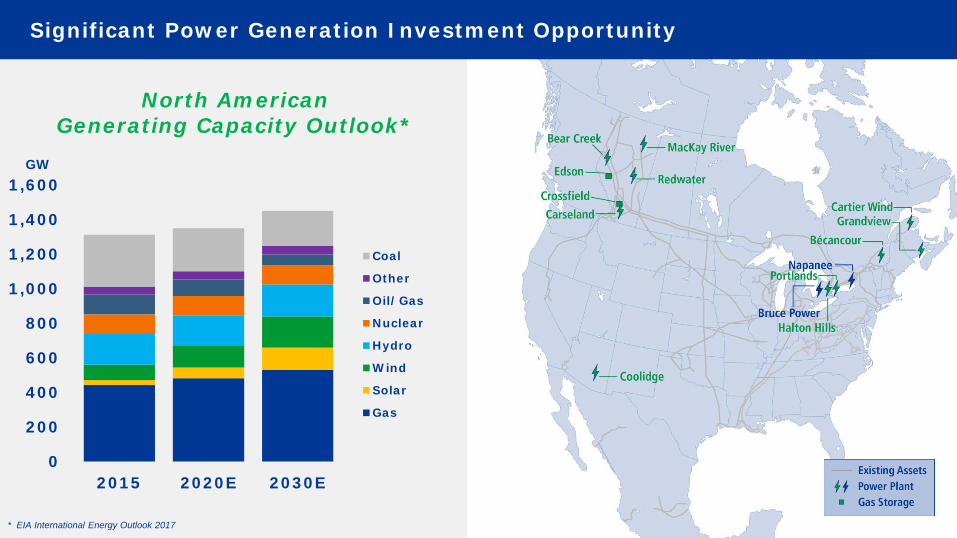
Significant Power Generation Investment Opportunity
North American Generating Capacity Outlook*
GW
* EIA International Energy Outlook 2017
0
200
400
600
800
1,000
1,200
1,400
1,600
2015 2020E 2030E
Coal
Other
Oil/Gas
Nuclear
Hydro
Wind
Solar
Gas
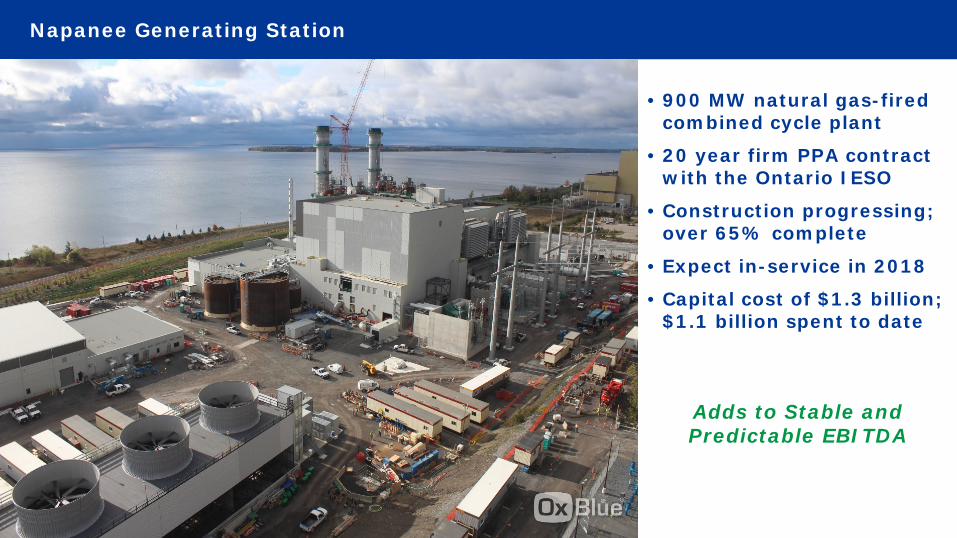
Napanee Generating Station
• 900 MW natural gas-fired combined cycle plant
• 20 year firm PPA contract with the Ontario IESO
• Construction progressing; over 65% complete
• Expect in-service in 2018
• Capital cost of $1.3 billion; $1.1 billion spent to date
Adds to Stable and Predictable EBITDA
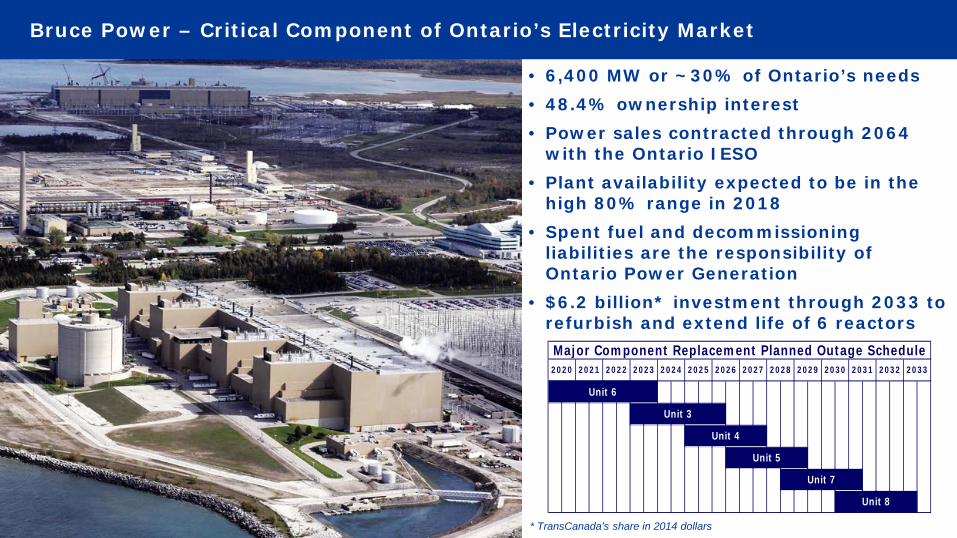
Bruce Power – Critical Component of Ontario’s Electricity Market
• 6,400 MW or ~30% of Ontario’s needs • 48.4% ownership interest• Power sales contracted through 2064
with the Ontario IESO• Plant availability expected to be in the
high 80% range in 2018• Spent fuel and decommissioning
liabilities are the responsibility of Ontario Power Generation
• $6.2 billion* investment through 2033 to refurbish and extend life of 6 reactors
* TransCanada’s share in 2014 dollars
Unit 5
Unit 7
Unit 8
Major Component Replacement Planned Outage Schedule2030 2031 2032 2033
Unit 6
Unit 4
2025 2026 2027 2028 2029
Unit 3
2020 2021 2022 2023 2024
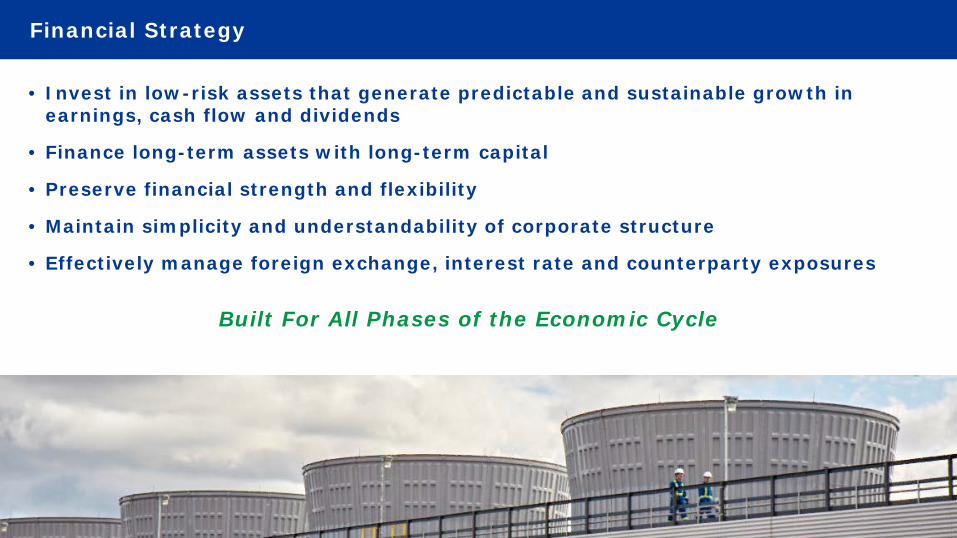
Financial Strategy
• Invest in low-risk assets that generate predictable and sustainable growth in earnings, cash flow and dividends
• Finance long-term assets with long-term capital
• Preserve financial strength and flexibility
• Maintain simplicity and understandability of corporate structure
• Effectively manage foreign exchange, interest rate and counterparty exposures
Built For All Phases of the Economic Cycle

2015 Comparable EBITDA 2020E Comparable EBITDA
Columbia Acquisition & Near-term Capital Program Drive Significant Growth
Over 95% of Comparable EBITDA to come from Regulated or Long-term Contracted Assets
$5.9 Billion
~$9.5 Billion
~10% CAGR
*Comparable EBITDA is a non-GAAP measure. See the non-GAAP measures slide at the front of this presentation for more information.
Canadian Natural Gas Pipelines
U.S. Natural Gas Pipelines
Mexico Natural Gas Pipelines
Liquids Pipelines
Contracted Energy
Merchant Energy
Liquids Pipelines
Mexico Natural Gas Pipelines
U.S. Natural Gas Pipelines
Canadian Natural Gas Pipelines
Contracted EnergyMerchant Energy
-
2
4
6
8
10
12
14
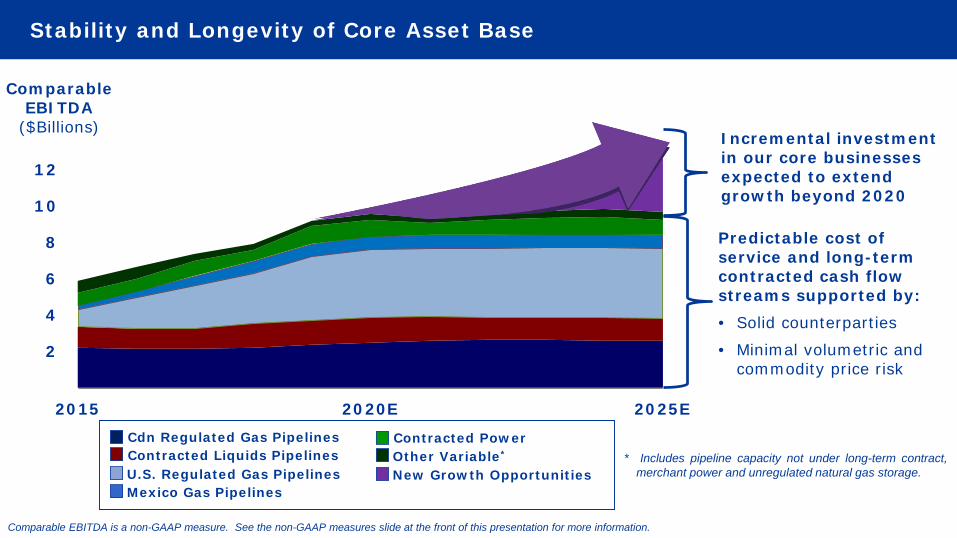
2015 2020E 2025E
Stability and Longevity of Core Asset Base
Predictable cost of service and long-term contracted cash flow streams supported by: • Solid counterparties
• Minimal volumetric and commodity price risk
Cdn Regulated Gas PipelinesContracted Liquids PipelinesU.S. Regulated Gas Pipelines Mexico Gas Pipelines
Contracted PowerOther Variable*
New Growth Opportunities* Includes pipeline capacity not under long-term contract,
merchant power and unregulated natural gas storage.
Comparable EBITDA is a non-GAAP measure. See the non-GAAP measures slide at the front of this presentation for more information.
Incremental investment in our core businesses expected to extend growth beyond 2020
Comparable EBITDA
($Billions)
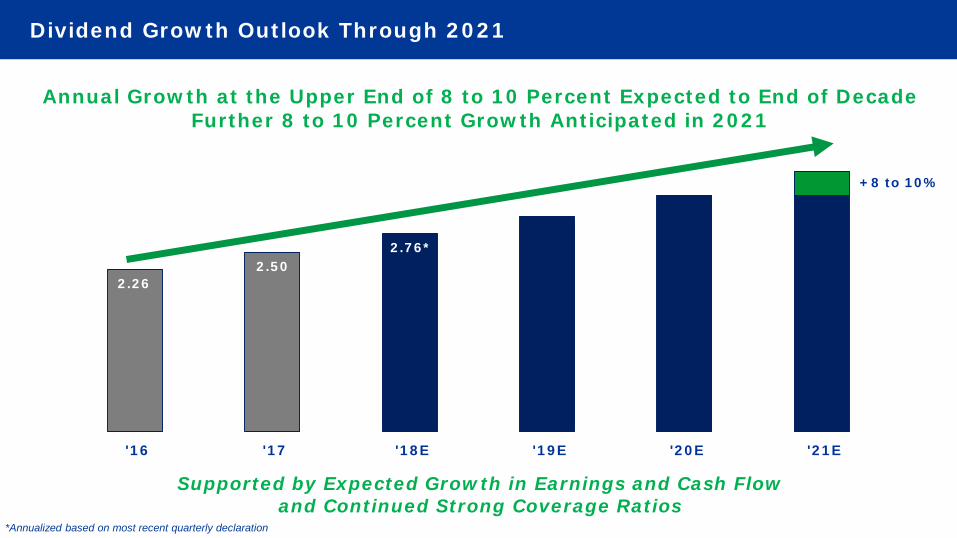
'16 '17 '18E '19E '20E '21E
Dividend Growth Outlook Through 2021
Annual Growth at the Upper End of 8 to 10 Percent Expected to End of DecadeFurther 8 to 10 Percent Growth Anticipated in 2021
Supported by Expected Growth in Earnings and Cash Flow and Continued Strong Coverage Ratios
+8 to 10%
2.262.50
2.76*
*Annualized based on most recent quarterly declaration
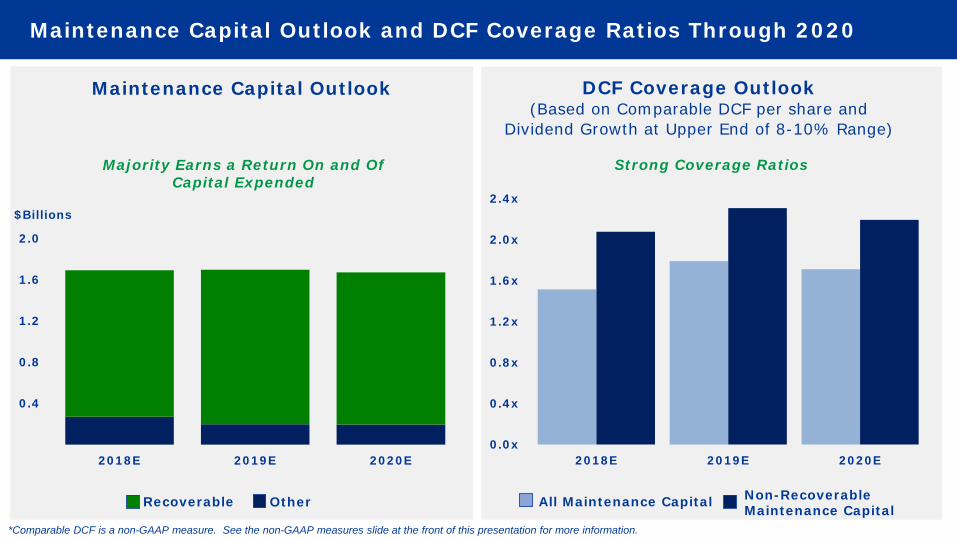
0.0
0.4
0.8
1.2
1.6
2.0
2018E 2019E 2020E
Recoverable
Maintenance Capital Outlook and DCF Coverage Ratios Through 2020
Maintenance Capital Outlook
Other
$Billions
*Comparable DCF is a non-GAAP measure. See the non-GAAP measures slide at the front of this presentation for more information.
Majority Earns a Return On and Of Capital Expended
DCF Coverage Outlook(Based on Comparable DCF per share and
Dividend Growth at Upper End of 8-10% Range)
Strong Coverage Ratios
All Maintenance Capital Non-Recoverable Maintenance Capital
0.0x
0.4x
0.8x
1.2x
1.6x
2.0x
2.4x
2018E 2019E 2020E
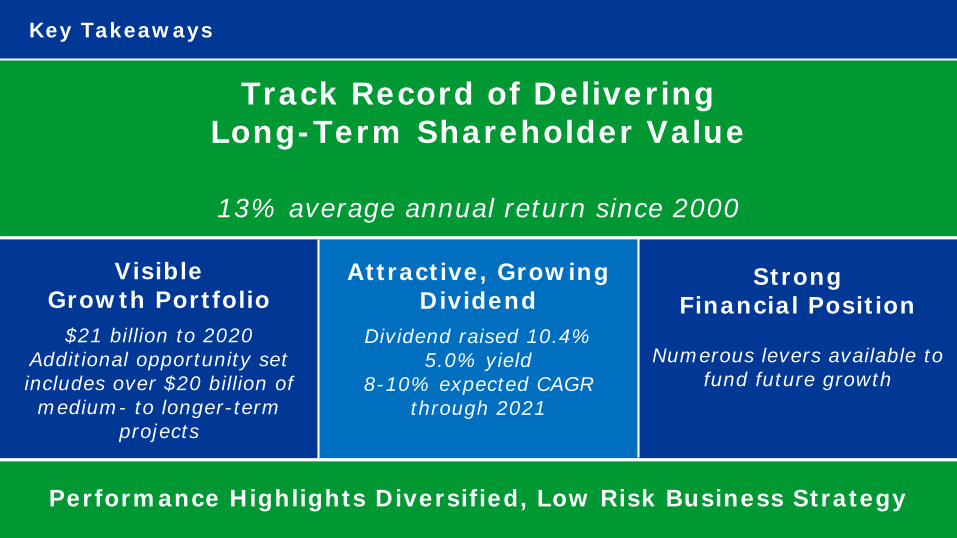
Key Takeaways
StrongFinancial Position
Numerous levers available to fund future growth
Track Record of Delivering Long-Term Shareholder Value
13% average annual return since 2000
VisibleGrowth Portfolio
$21 billion to 2020Additional opportunity set includes over $20 billion of medium- to longer-term
projects
Attractive, Growing Dividend
Dividend raised 10.4%5.0% yield
8-10% expected CAGR through 2021
Performance Highlights Diversified, Low Risk Business Strategy

Appendix

Appendix – Reconciliation of Non-GAAP Measures(millions of dollars, except per share amounts)
Three months ended March 31
2018 2017
Net Income Attributable to Common Shares 734 643Specific items (net of tax):Risk management activities 136 21Integration and acquisition related costs - Columbia - 24Loss on sales of U.S. Northeast power generation assets - 10Keystone XL asset costs - 7Keystone XL income tax recoveries - (7)
Comparable Earnings(1) 870 698
Net Income Per Common Share $0.83 $0.74Specific items (net of tax):Risk management activities 0.15 0.03Integration and acquisition related costs - Columbia - 0.03Loss on sales of U.S. Northeast power generation assets - 0.01Keystone XL asset costs - 0.01Keystone XL income tax recoveries - (0.01)
Comparable Earnings Per Common Share(1) $0.98 $0.81
Weighted Average Basic Common Shares Outstanding (millions) 885 866
(1) Non-GAAP measure. For additional information on these items see the April 26, 2018 Quarterly Report to Shareholders
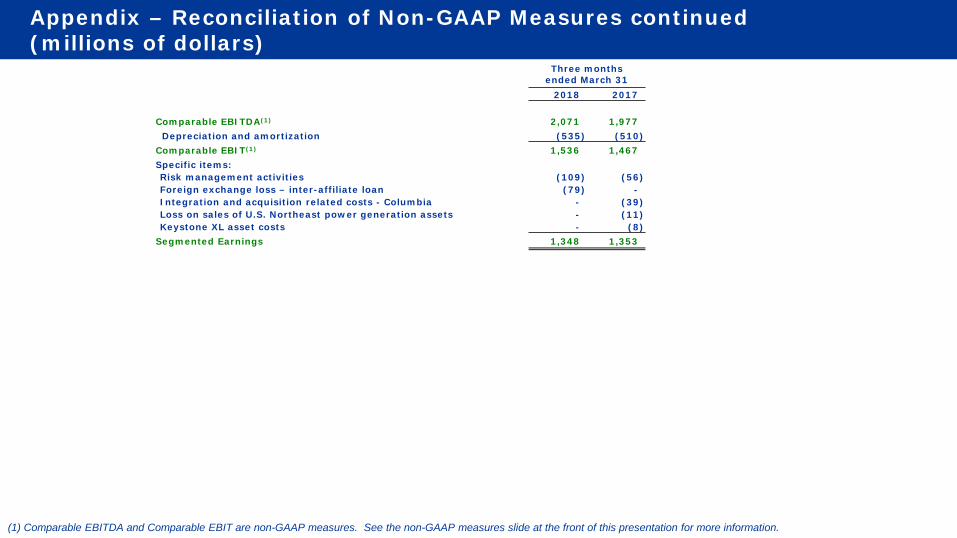
Appendix – Reconciliation of Non-GAAP Measures continued(millions of dollars)
(1) Comparable EBITDA and Comparable EBIT are non-GAAP measures. See the non-GAAP measures slide at the front of this presentation for more information.
Three months ended March 31
2018 2017
Comparable EBITDA(1) 2,071 1,977Depreciation and amortization (535) (510)
Comparable EBIT(1) 1,536 1,467Specific items:Risk management activities (109) (56)Foreign exchange loss – inter-affiliate loan (79) -Integration and acquisition related costs - Columbia - (39)Loss on sales of U.S. Northeast power generation assets - (11)Keystone XL asset costs - (8)
Segmented Earnings 1,348 1,353
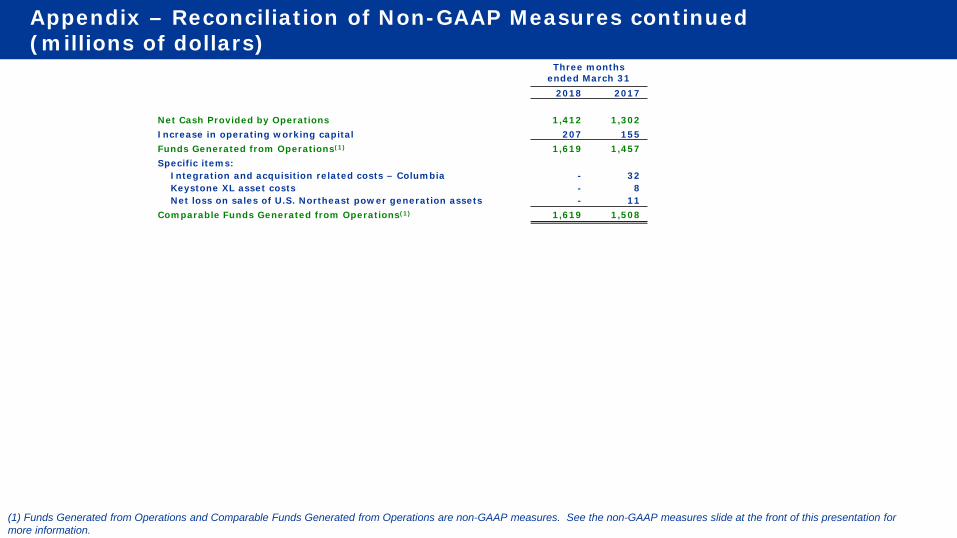
Appendix – Reconciliation of Non-GAAP Measures continued(millions of dollars)
(1) Funds Generated from Operations and Comparable Funds Generated from Operations are non-GAAP measures. See the non-GAAP measures slide at the front of this presentation for more information.
Three months ended March 31
2018 2017
Net Cash Provided by Operations 1,412 1,302Increase in operating working capital 207 155Funds Generated from Operations(1) 1,619 1,457Specific items:
Integration and acquisition related costs – Columbia - 32Keystone XL asset costs - 8Net loss on sales of U.S. Northeast power generation assets - 11
Comparable Funds Generated from Operations(1) 1,619 1,508

Corporate ProfileJune 2018