Embed Size (px)
Citation preview
30 S
epte
mbe
r 201
5
PREPARED FOR THE STATE OF ALASKA
TRANSCANADA PARTICIPATION DECISION IMPACT ON STATE OF ALASKA
2
TRAN
SCAN
ADA
PART
ICIP
ATIO
N IN
AKL
NG
TR
ANSC
ANAD
A PA
RTIC
IPAT
ION
IN A
KLN
G
Background & Description of TC Decision
Overview of TC’s current role and State’s
alternatives related to TC participation
Some key factors for State to consider in TC
participation decision
PRESENTATION OVERVIEW
3
TRAN
SCAN
ADA
PART
ICIP
ATIO
N IN
AKL
NG
TR
ANSC
ANAD
A PA
RTIC
IPAT
ION
IN A
KLN
G
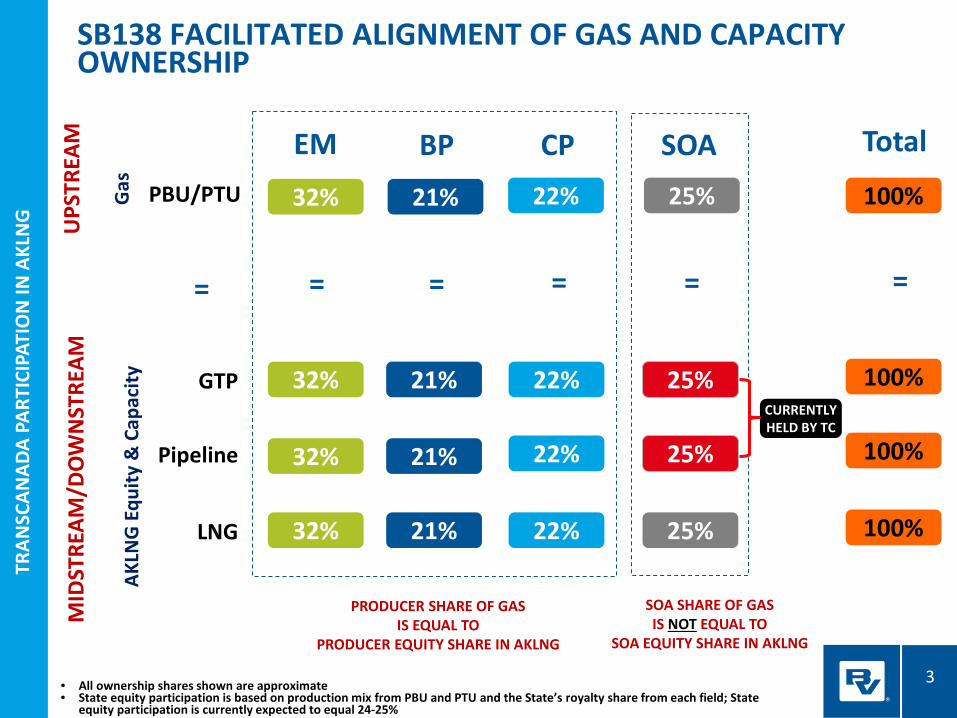
SB138 FACILITATED ALIGNMENT OF GAS AND CAPACITY OWNERSHIP
3
32%
EM BP CP SOA
= = = =
UPS
TREA
M
GTP
Pipeline
LNG
32%
32%
32%
21%
21%
21%
21%
22%
22%
22%
22%
25%
25%
25%
25%
100%
Total
=
100%
100%
100%
MID
STRE
AM/D
OW
NST
REAM
=
PRODUCER SHARE OF GAS IS EQUAL TO
PRODUCER EQUITY SHARE IN AKLNG
SOA SHARE OF GAS IS NOT EQUAL TO
SOA EQUITY SHARE IN AKLNG
CURRENTLY HELD BY TC
PBU/PTU
AKLN
G E
quity
& C
apac
ity
Gas
• All ownership shares shown are approximate • State equity participation is based on production mix from PBU and PTU and the State’s royalty share from each field; State
equity participation is currently expected to equal 24-25%
4
TRAN
SCAN
ADA
PART
ICIP
ATIO
N IN
AKL
NG
TR
ANSC
ANAD
A PA
RTIC
IPAT
ION
IN A
KLN
G
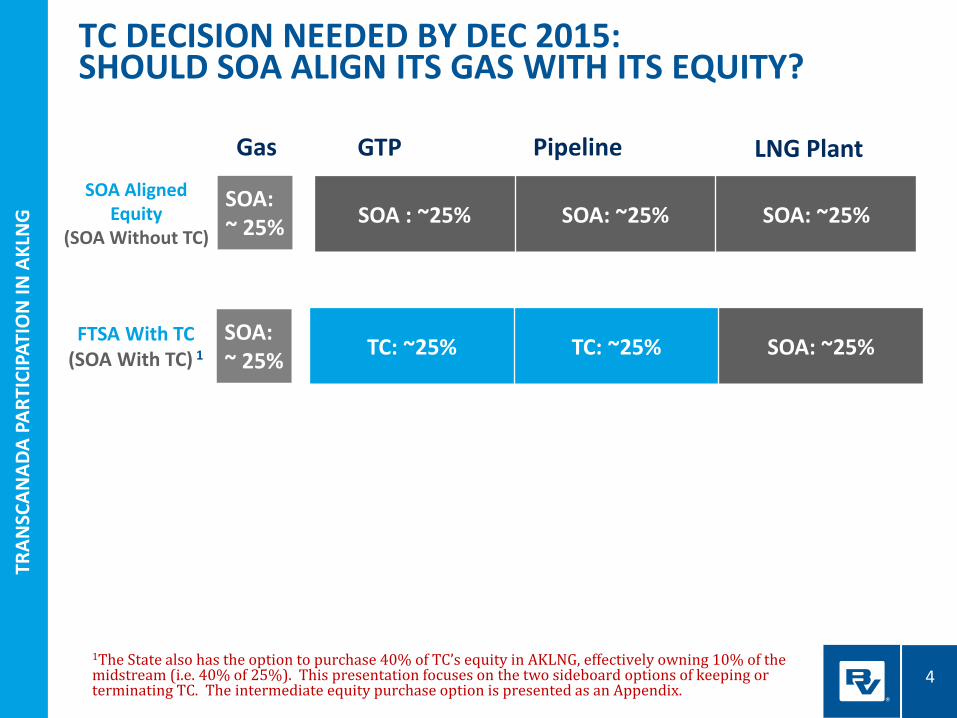
TC DECISION NEEDED BY DEC 2015: SHOULD SOA ALIGN ITS GAS WITH ITS EQUITY?
4
SOA : ~25% SOA: ~25% SOA: ~25%
TC: ~25% TC: ~25% SOA: ~25%
GTP Pipeline LNG Plant SOA Aligned
Equity (SOA Without TC)
FTSA With TC (SOA With TC) 1
1The State also has the option to purchase 40% of TC’s equity in AKLNG, effectively owning 10% of the midstream (i.e. 40% of 25%). This presentation focuses on the two sideboard options of keeping or terminating TC. The intermediate equity purchase option is presented as an Appendix.
Gas
SOA: ~ 25%
SOA: ~ 25%
5
TRAN
SCAN
ADA
PART
ICIP
ATIO
N IN
AKL
NG
TR
ANSC
ANAD
A PA
RTIC
IPAT
ION
IN A
KLN
G
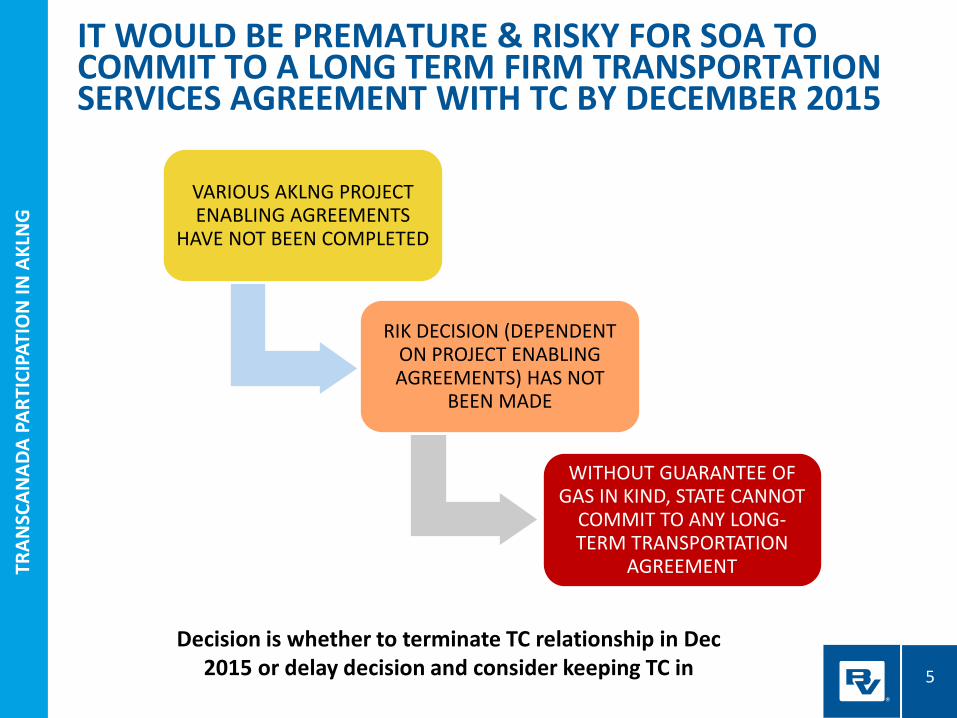
IT WOULD BE PREMATURE & RISKY FOR SOA TO COMMIT TO A LONG TERM FIRM TRANSPORTATION SERVICES AGREEMENT WITH TC BY DECEMBER 2015
5
VARIOUS AKLNG PROJECT ENABLING AGREEMENTS
HAVE NOT BEEN COMPLETED
RIK DECISION (DEPENDENT ON PROJECT ENABLING AGREEMENTS) HAS NOT
BEEN MADE
WITHOUT GUARANTEE OF GAS IN KIND, STATE CANNOT
COMMIT TO ANY LONG-TERM TRANSPORTATION
AGREEMENT
Decision is whether to terminate TC relationship in Dec 2015 or delay decision and consider keeping TC in
6
TRAN
SCAN
ADA
PART
ICIP
ATIO
N IN
AKL
NG
TR
ANSC
ANAD
A PA
RTIC
IPAT
ION
IN A
KLN
G
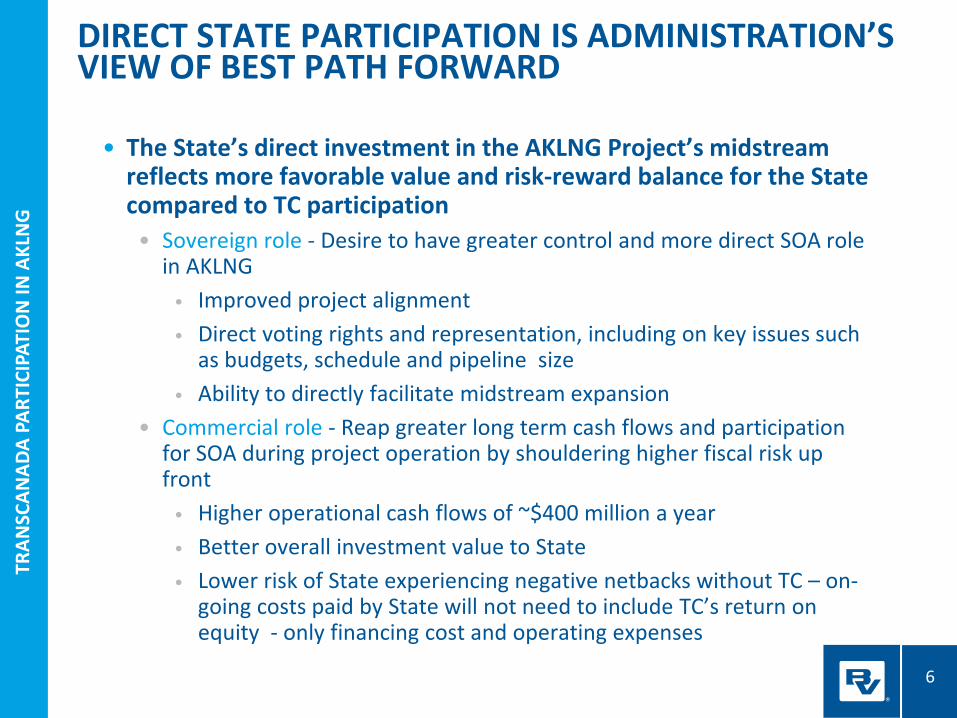
• The State’s direct investment in the AKLNG Project’s midstream reflects more favorable value and risk-reward balance for the State compared to TC participation • Sovereign role - Desire to have greater control and more direct SOA role
in AKLNG • Improved project alignment • Direct voting rights and representation, including on key issues such
as budgets, schedule and pipeline size • Ability to directly facilitate midstream expansion
• Commercial role - Reap greater long term cash flows and participation for SOA during project operation by shouldering higher fiscal risk up front • Higher operational cash flows of ~$400 million a year • Better overall investment value to State • Lower risk of State experiencing negative netbacks without TC – on-
going costs paid by State will not need to include TC’s return on equity - only financing cost and operating expenses
DIRECT STATE PARTICIPATION IS ADMINISTRATION’S VIEW OF BEST PATH FORWARD
7
TRAN
SCAN
ADA
PART
ICIP
ATIO
N IN
AKL
NG
TR
ANSC
ANAD
A PA
RTIC
IPAT
ION
IN A
KLN
G
Background & Description of TC Decision
Overview of TC’s current role and State’s
alternatives related to TC participation
Some key factors for State to consider in TC
participation decision
PRESENTATION OVERVIEW
8
TRAN
SCAN
ADA
PART
ICIP
ATIO
N IN
AKL
NG
TR
ANSC
ANAD
A PA
RTIC
IPAT
ION
IN A
KLN
G
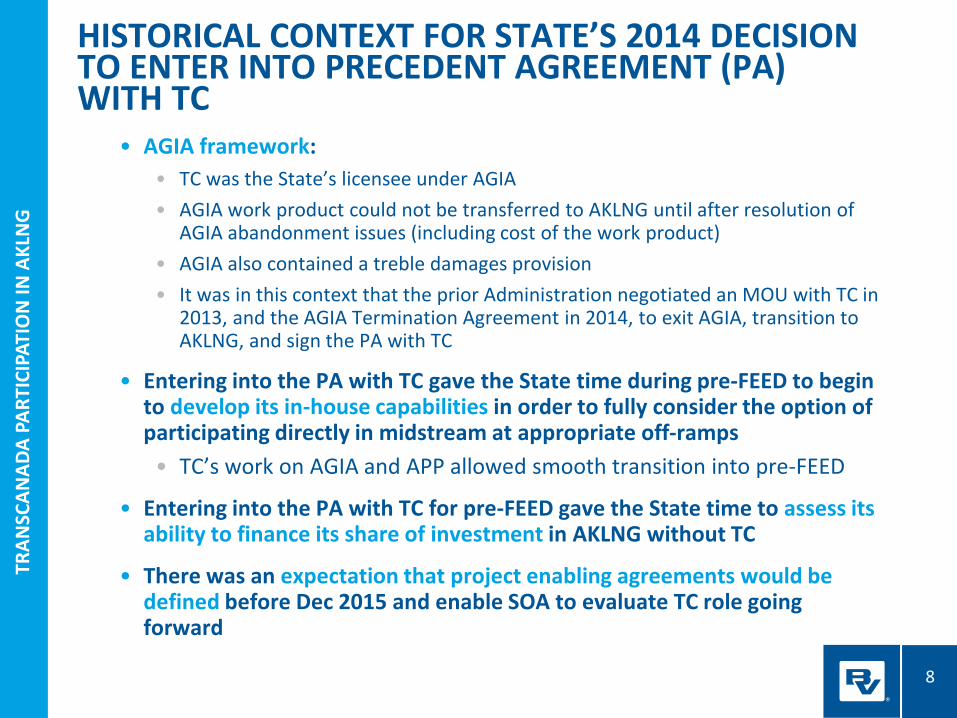
• AGIA framework: • TC was the State’s licensee under AGIA • AGIA work product could not be transferred to AKLNG until after resolution of
AGIA abandonment issues (including cost of the work product) • AGIA also contained a treble damages provision • It was in this context that the prior Administration negotiated an MOU with TC in
2013, and the AGIA Termination Agreement in 2014, to exit AGIA, transition to AKLNG, and sign the PA with TC
• Entering into the PA with TC gave the State time during pre-FEED to begin to develop its in-house capabilities in order to fully consider the option of participating directly in midstream at appropriate off-ramps • TC’s work on AGIA and APP allowed smooth transition into pre-FEED
• Entering into the PA with TC for pre-FEED gave the State time to assess its ability to finance its share of investment in AKLNG without TC
• There was an expectation that project enabling agreements would be defined before Dec 2015 and enable SOA to evaluate TC role going forward
HISTORICAL CONTEXT FOR STATE’S 2014 DECISION TO ENTER INTO PRECEDENT AGREEMENT (PA) WITH TC
9
TRAN
SCAN
ADA
PART
ICIP
ATIO
N IN
AKL
NG
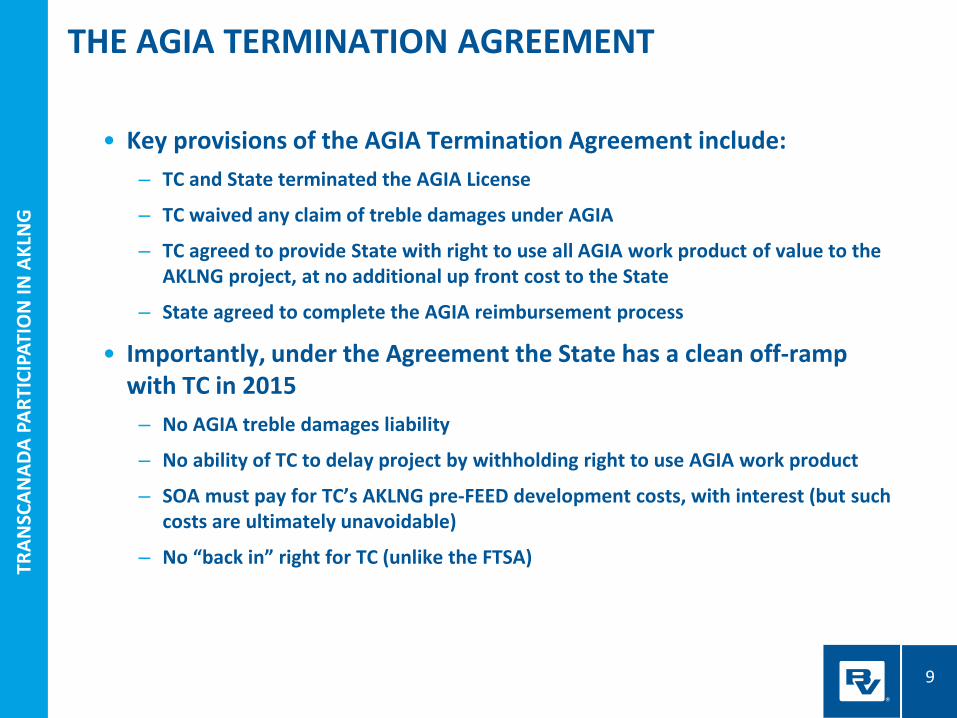
THE AGIA TERMINATION AGREEMENT
• Key provisions of the AGIA Termination Agreement include: ‒ TC and State terminated the AGIA License
‒ TC waived any claim of treble damages under AGIA
‒ TC agreed to provide State with right to use all AGIA work product of value to the AKLNG project, at no additional up front cost to the State
‒ State agreed to complete the AGIA reimbursement process
• Importantly, under the Agreement the State has a clean off-ramp with TC in 2015 ‒ No AGIA treble damages liability
‒ No ability of TC to delay project by withholding right to use AGIA work product
‒ SOA must pay for TC’s AKLNG pre-FEED development costs, with interest (but such costs are ultimately unavoidable)
‒ No “back in” right for TC (unlike the FTSA)
10
TRAN
SCAN
ADA
PART
ICIP
ATIO
N IN
AKL
NG
TR
ANSC
ANAD
A PA
RTIC
IPAT
ION
IN A
KLN
G
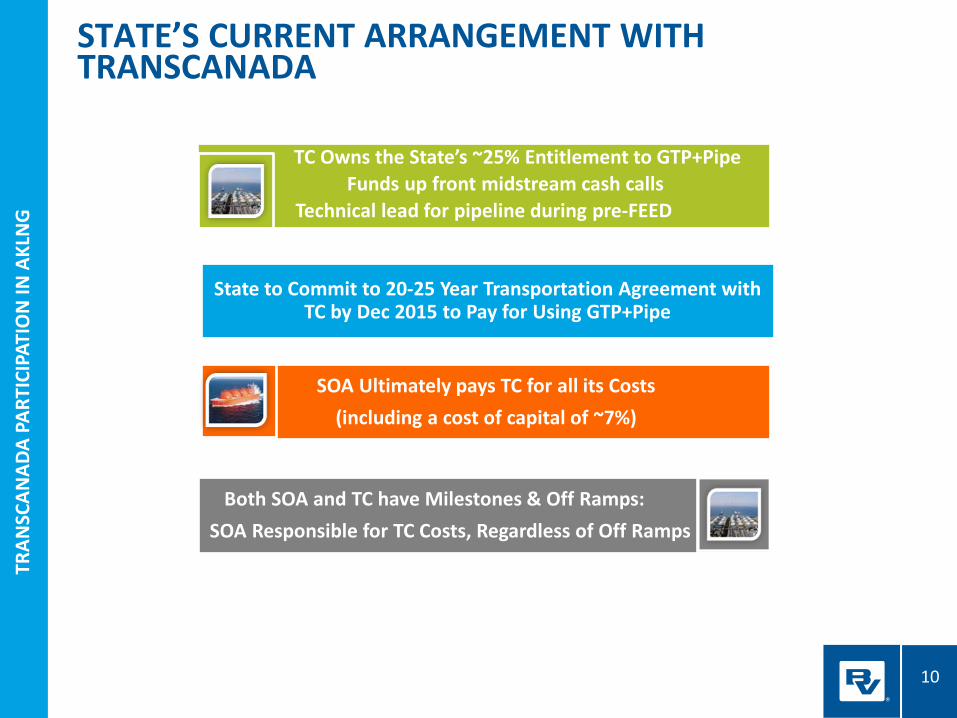
STATE’S CURRENT ARRANGEMENT WITH TRANSCANADA
TC Owns the State’s ~25% Entitlement to GTP+Pipe Funds up front midstream cash calls
Technical lead for pipeline during pre-FEED
State to Commit to 20-25 Year Transportation Agreement with TC by Dec 2015 to Pay for Using GTP+Pipe
SOA Ultimately pays TC for all its Costs (including a cost of capital of ~7%)
Both SOA and TC have Milestones & Off Ramps: SOA Responsible for TC Costs, Regardless of Off Ramps
11
TRAN
SCAN
ADA
PART
ICIP
ATIO
N IN
AKL
NG
TR
ANSC
ANAD
A PA
RTIC
IPAT
ION
IN A
KLN
G
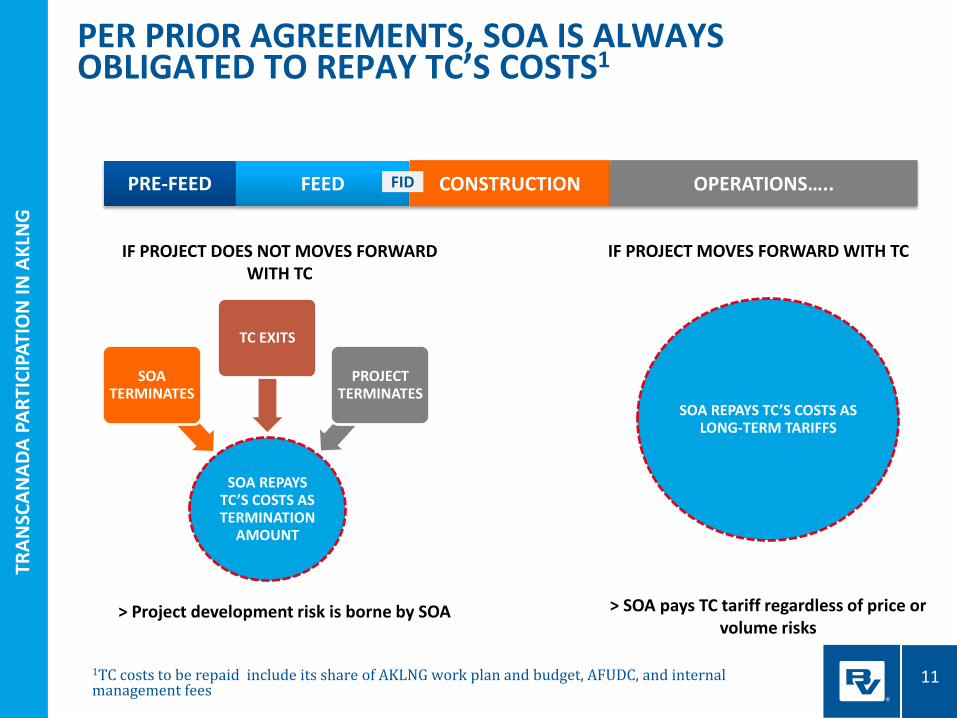
PER PRIOR AGREEMENTS, SOA IS ALWAYS OBLIGATED TO REPAY TC’S COSTS1
PRE-FEED FEED CONSTRUCTION OPERATIONS….. FID
SOA REPAYS TC’S COSTS AS TERMINATION
AMOUNT
SOA TERMINATES
TC EXITS
PROJECT TERMINATES
SOA REPAYS TC’S COSTS AS LONG-TERM TARIFFS
IF PROJECT DOES NOT MOVES FORWARD WITH TC
IF PROJECT MOVES FORWARD WITH TC
> Project development risk is borne by SOA > SOA pays TC tariff regardless of price or volume risks
1TC costs to be repaid include its share of AKLNG work plan and budget, AFUDC, and internal management fees
12
TRAN
SCAN
ADA
PART
ICIP
ATIO
N IN
AKL
NG
TR
ANSC
ANAD
A PA
RTIC
IPAT
ION
IN A
KLN
G
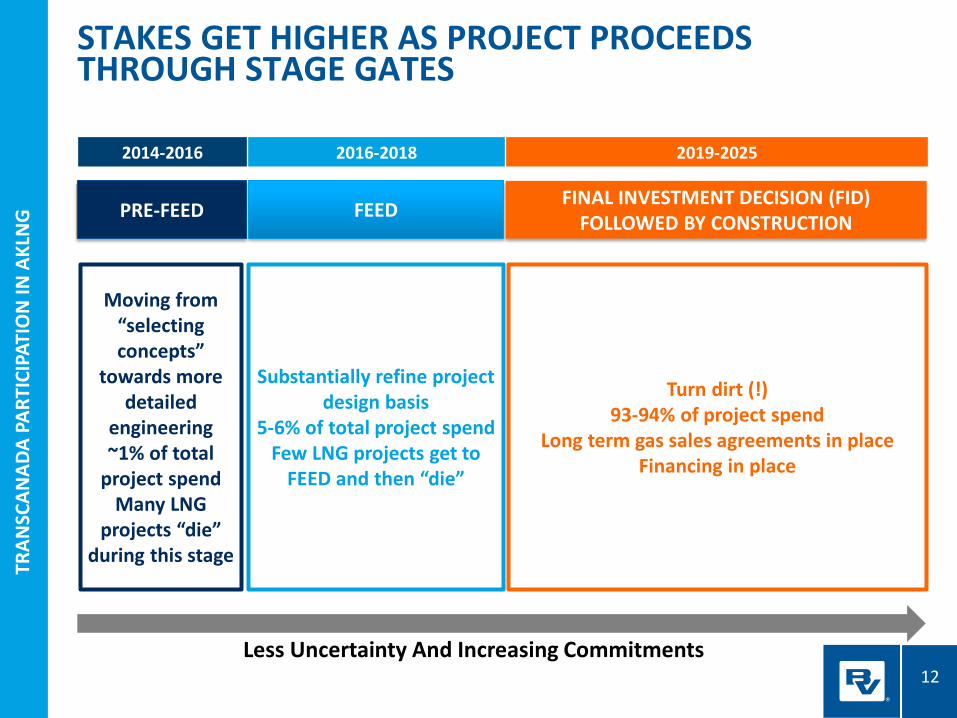
STAKES GET HIGHER AS PROJECT PROCEEDS THROUGH STAGE GATES
PRE-FEED FEED FINAL INVESTMENT DECISION (FID) FOLLOWED BY CONSTRUCTION
Moving from “selecting concepts”
towards more detailed
engineering ~1% of total
project spend Many LNG
projects “die” during this stage
Substantially refine project design basis
5-6% of total project spend Few LNG projects get to
FEED and then “die”
Turn dirt (!) 93-94% of project spend
Long term gas sales agreements in place Financing in place
2014-2016 2016-2018 2019-2025
Less Uncertainty And Increasing Commitments
13
TRAN
SCAN
ADA
PART
ICIP
ATIO
N IN
AKL
NG
TR
ANSC
ANAD
A PA
RTIC
IPAT
ION
IN A
KLN
G
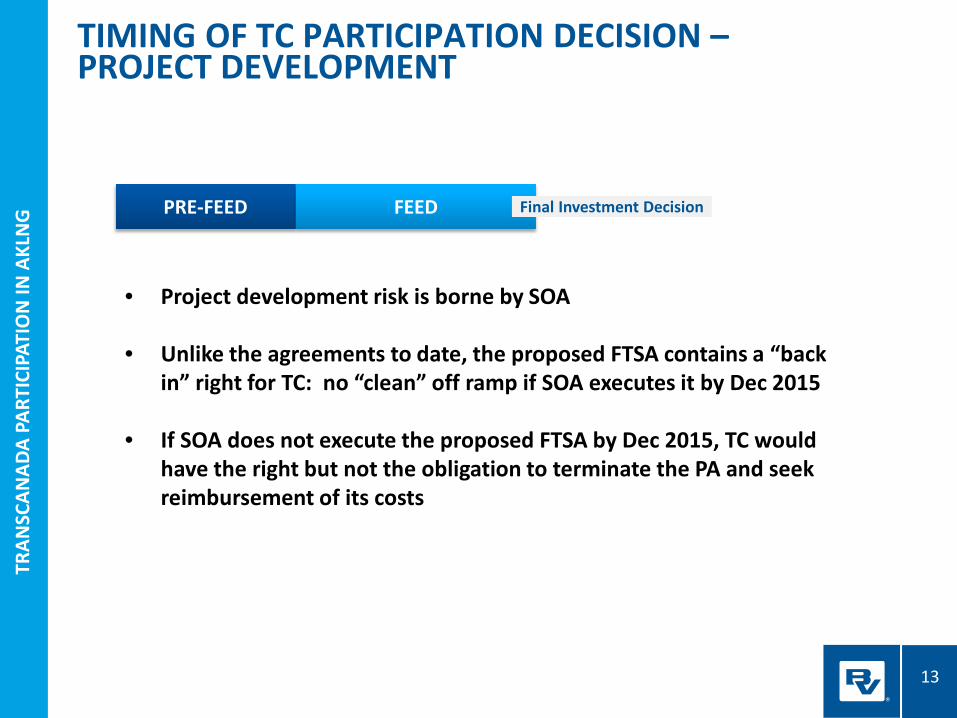
TIMING OF TC PARTICIPATION DECISION – PROJECT DEVELOPMENT
PRE-FEED FEED
• Project development risk is borne by SOA
• Unlike the agreements to date, the proposed FTSA contains a “back in” right for TC: no “clean” off ramp if SOA executes it by Dec 2015
• If SOA does not execute the proposed FTSA by Dec 2015, TC would have the right but not the obligation to terminate the PA and seek reimbursement of its costs
Final Investment Decision
14
TRAN
SCAN
ADA
PART
ICIP
ATIO
N IN
AKL
NG
TR
ANSC
ANAD
A PA
RTIC
IPAT
ION
IN A
KLN
G
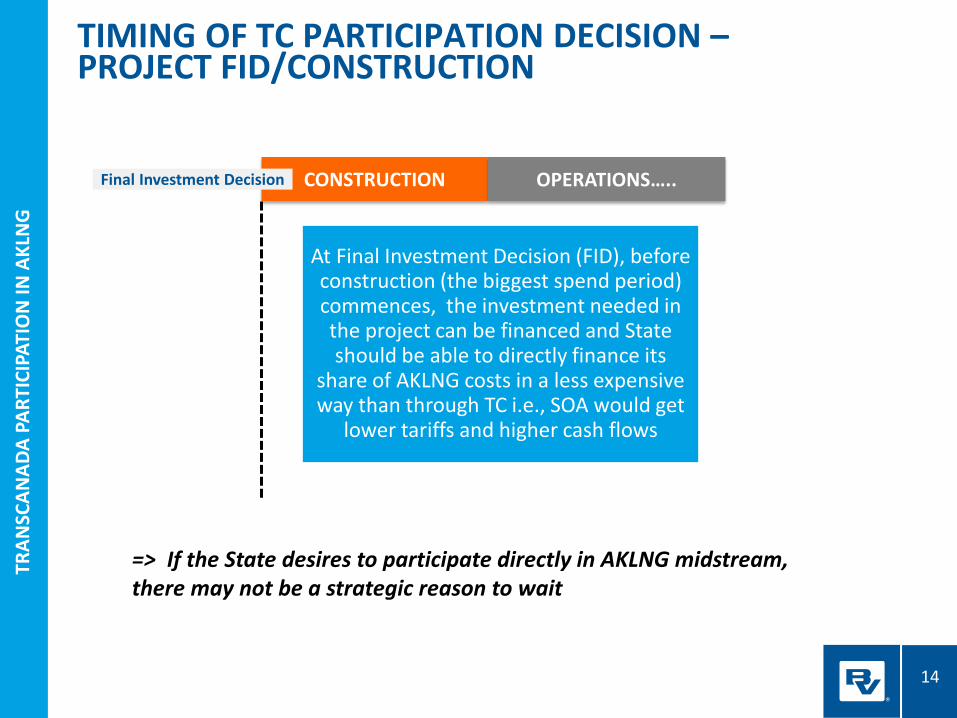
TIMING OF TC PARTICIPATION DECISION – PROJECT FID/CONSTRUCTION
CONSTRUCTION OPERATIONS…..
At Final Investment Decision (FID), before construction (the biggest spend period) commences, the investment needed in the project can be financed and State should be able to directly finance its
share of AKLNG costs in a less expensive way than through TC i.e., SOA would get
lower tariffs and higher cash flows
=> If the State desires to participate directly in AKLNG midstream, there may not be a strategic reason to wait
Final Investment Decision
15
TRAN
SCAN
ADA
PART
ICIP
ATIO
N IN
AKL
NG
TR
ANSC
ANAD
A PA
RTIC
IPAT
ION
IN A
KLN
G
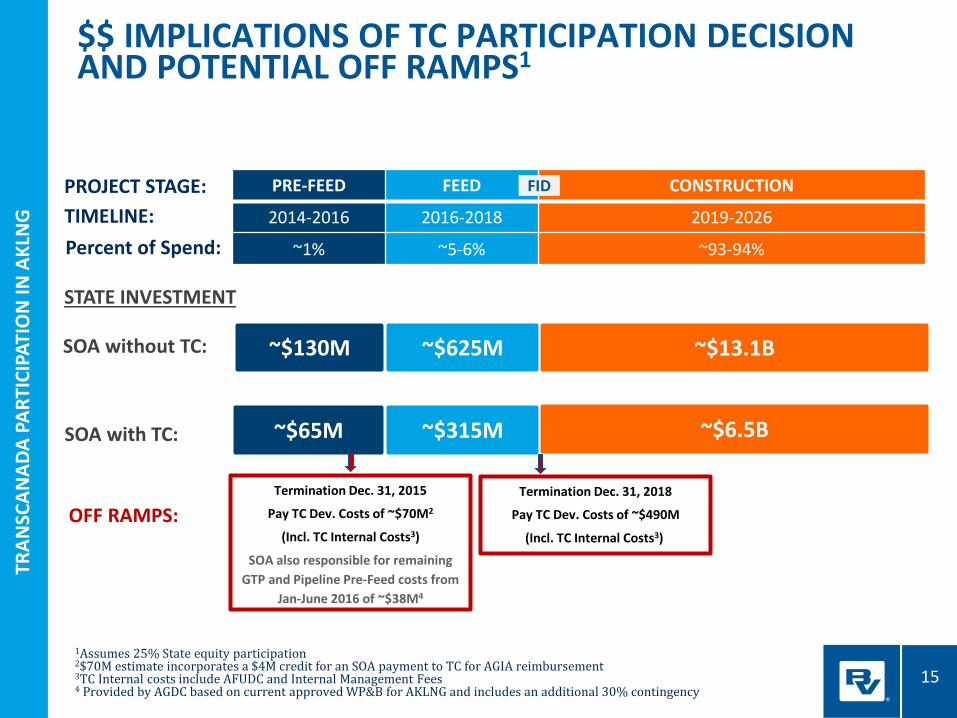
$$ IMPLICATIONS OF TC PARTICIPATION DECISION AND POTENTIAL OFF RAMPS1
~$130M ~$625M ~$13.1B SOA without TC:
Termination Dec. 31, 2015
Pay TC Dev. Costs of ~$70M2
(Incl. TC Internal Costs3)
SOA also responsible for remaining GTP and Pipeline Pre-Feed costs from
Jan-June 2016 of ~$38M4
Termination Dec. 31, 2018
Pay TC Dev. Costs of ~$490M
(Incl. TC Internal Costs3)
SOA with TC: ~$65M ~$315M ~$6.5B
PRE-FEED FEED CONSTRUCTION
2014-2016 2016-2018 2019-2026
~1% ~5-6% ~93-94%
TIMELINE: PROJECT STAGE:
STATE INVESTMENT
1Assumes 25% State equity participation 2$70M estimate incorporates a $4M credit for an SOA payment to TC for AGIA reimbursement 3TC Internal costs include AFUDC and Internal Management Fees 4 Provided by AGDC based on current approved WP&B for AKLNG and includes an additional 30% contingency
Percent of Spend:
FID
OFF RAMPS:
16
TRAN
SCAN
ADA
PART
ICIP
ATIO
N IN
AKL
NG
TR
ANSC
ANAD
A PA
RTIC
IPAT
ION
IN A
KLN
G
Background & Description of TC Decision
Overview of TC’s current role and State’s
alternatives related to TC participation
Some key factors to consider for State’s TC
participation decision
PRESENTATION OVERVIEW
17
TRAN
SCAN
ADA
PART
ICIP
ATIO
N IN
AKL
NG
TR
ANSC
ANAD
A PA
RTIC
IPAT
ION
IN A
KLN
G
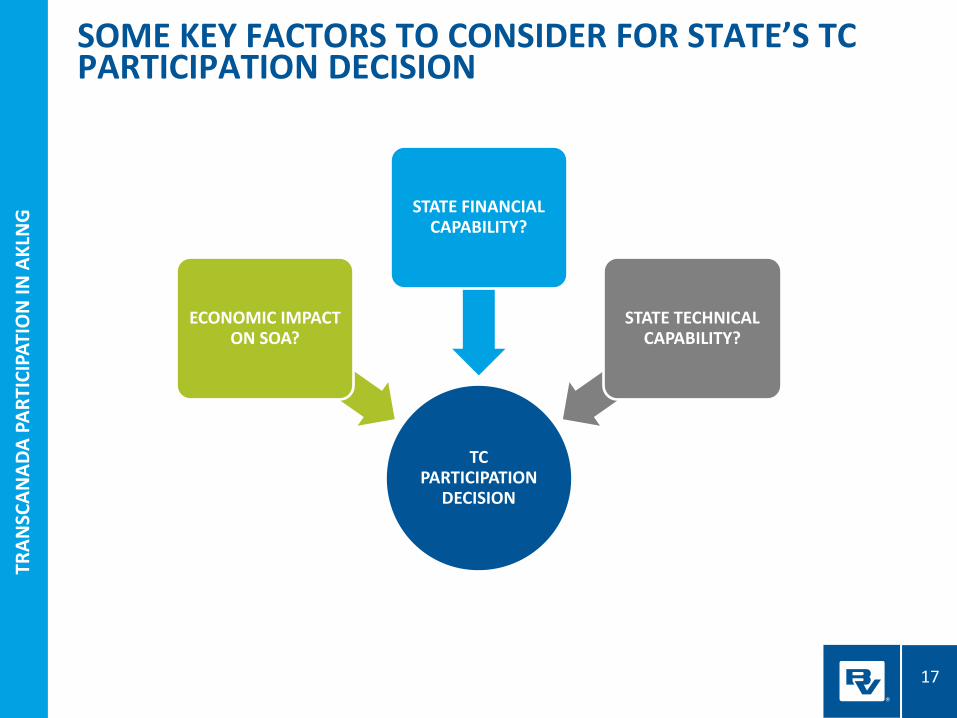
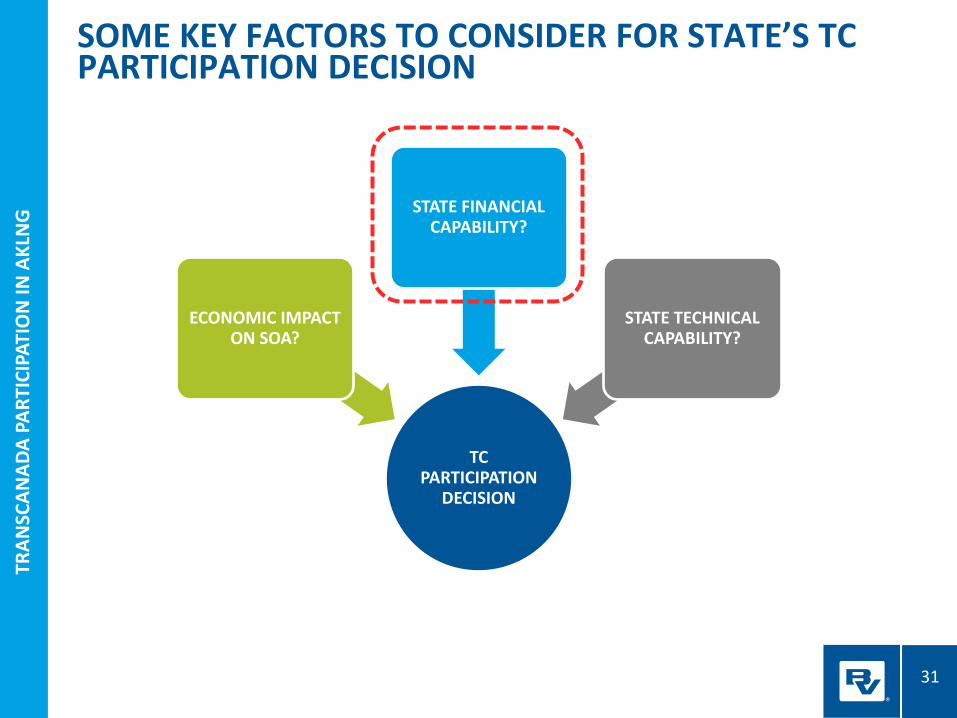
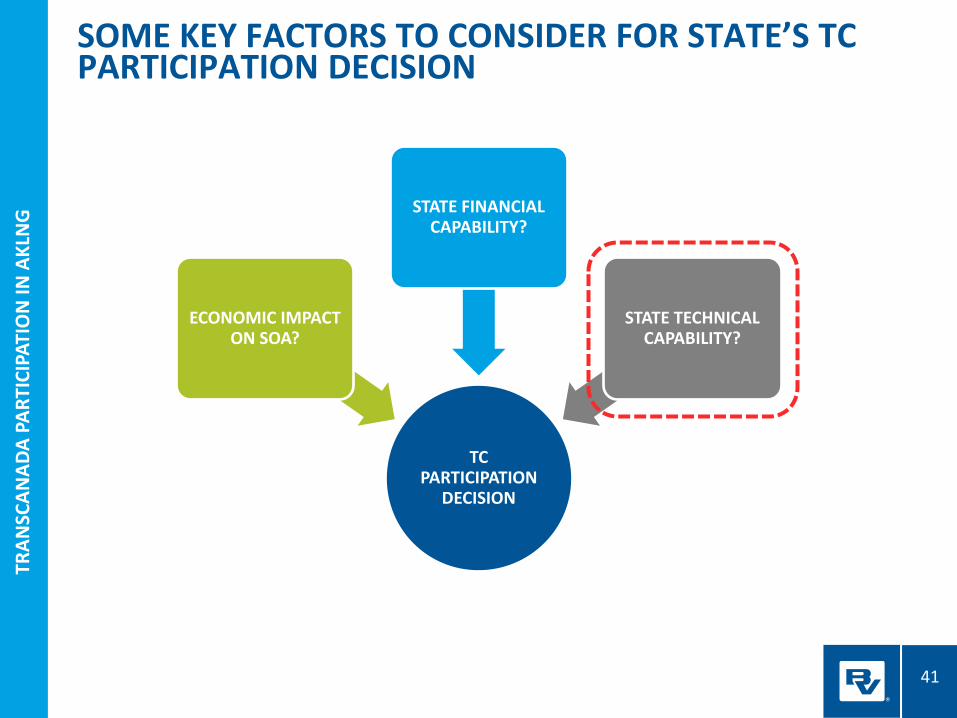
SOME KEY FACTORS TO CONSIDER FOR STATE’S TC PARTICIPATION DECISION
TC PARTICIPATION
DECISION
ECONOMIC IMPACT ON SOA?
STATE FINANCIAL CAPABILITY?
STATE TECHNICAL CAPABILITY?
18
TRAN
SCAN
ADA
PART
ICIP
ATIO
N IN
AKL
NG
18
TRAN
SCAN
ADA
PART
ICIP
ATIO
N IN
AKL
NG
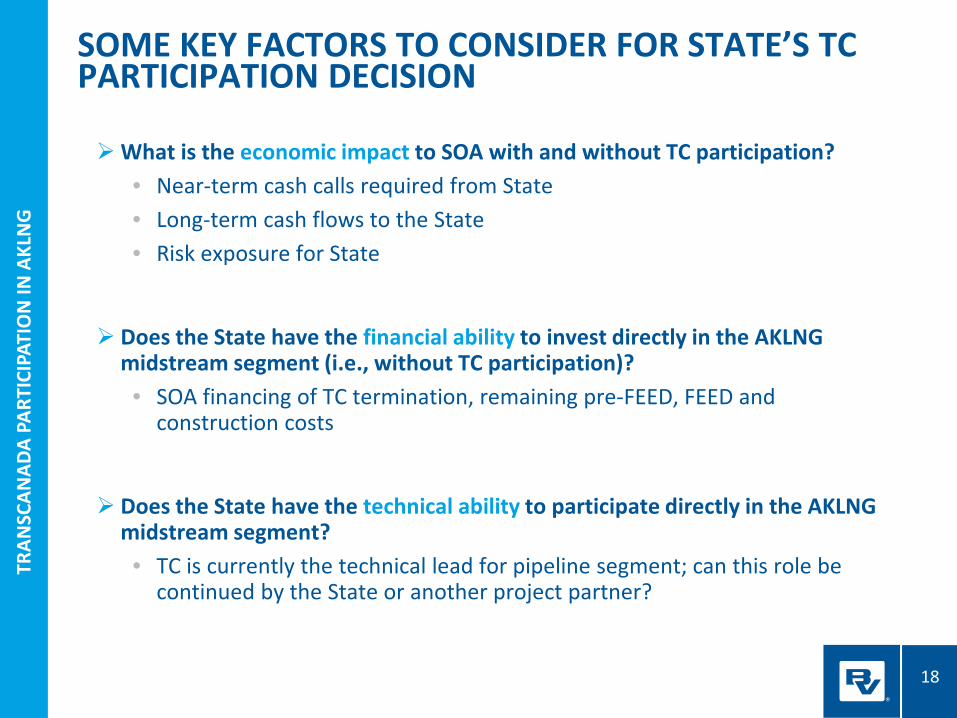
SOME KEY FACTORS TO CONSIDER FOR STATE’S TC PARTICIPATION DECISION
What is the economic impact to SOA with and without TC participation? • Near-term cash calls required from State • Long-term cash flows to the State • Risk exposure for State
Does the State have the financial ability to invest directly in the AKLNG midstream segment (i.e., without TC participation)? • SOA financing of TC termination, remaining pre-FEED, FEED and
construction costs
Does the State have the technical ability to participate directly in the AKLNG midstream segment? • TC is currently the technical lead for pipeline segment; can this role be
continued by the State or another project partner?
19
TRAN
SCAN
ADA
PART
ICIP
ATIO
N IN
AKL
NG
TR
ANSC
ANAD
A PA
RTIC
IPAT
ION
IN A
KLN
G
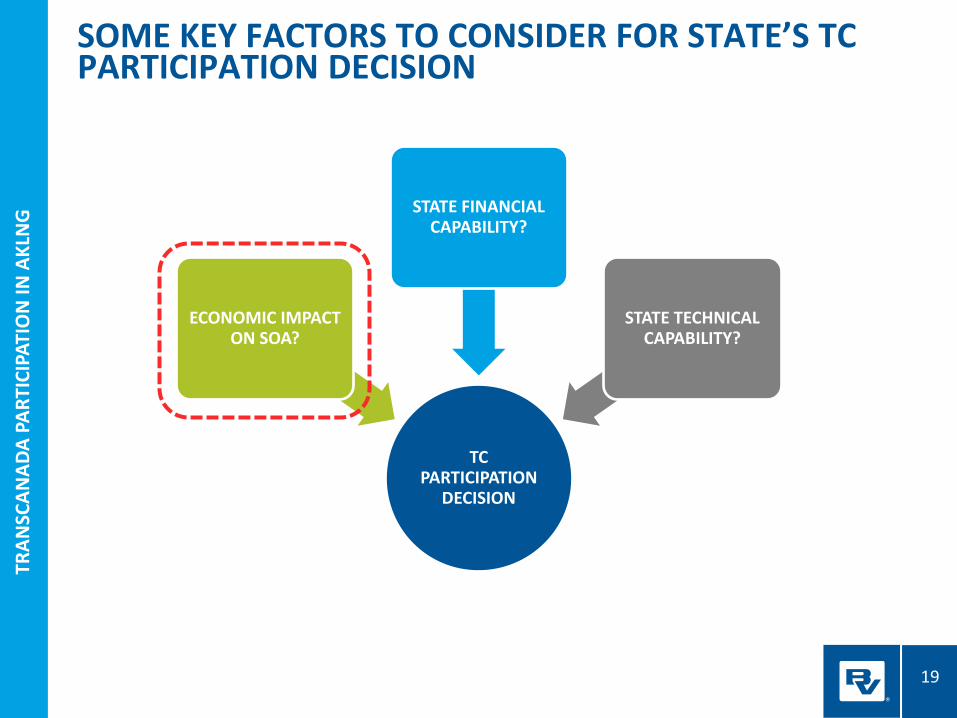
SOME KEY FACTORS TO CONSIDER FOR STATE’S TC PARTICIPATION DECISION
TC PARTICIPATION
DECISION
ECONOMIC IMPACT ON SOA?
STATE FINANCIAL CAPABILITY?
STATE TECHNICAL CAPABILITY?
20
TRAN
SCAN
ADA
PART
ICIP
ATIO
N IN
AKL
NG
TR
ANSC
ANAD
A PA
RTIC
IPAT
ION
IN A
KLN
G
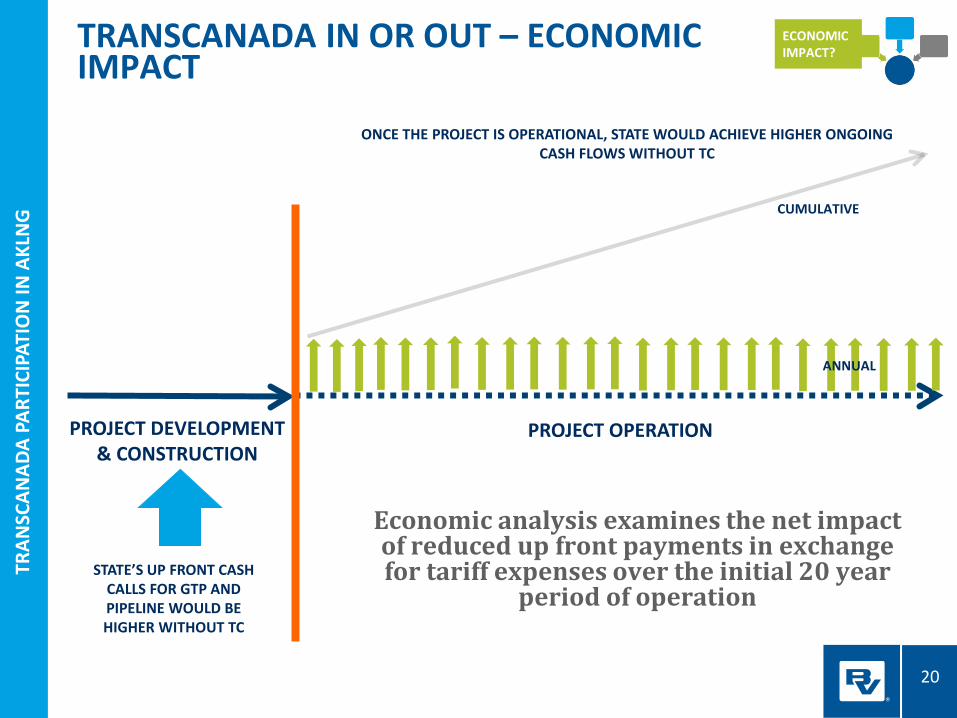
Economic analysis examines the net impact of reduced up front payments in exchange for tariff expenses over the initial 20 year
period of operation
TRANSCANADA IN OR OUT – ECONOMIC IMPACT
STATE’S UP FRONT CASH CALLS FOR GTP AND PIPELINE WOULD BE HIGHER WITHOUT TC
PROJECT DEVELOPMENT & CONSTRUCTION
PROJECT OPERATION
ONCE THE PROJECT IS OPERATIONAL, STATE WOULD ACHIEVE HIGHER ONGOING CASH FLOWS WITHOUT TC
ECONOMIC IMPACT?
CUMULATIVE
ANNUAL
21
TRAN
SCAN
ADA
PART
ICIP
ATIO
N IN
AKL
NG
21
TRAN
SCAN
ADA
PART
ICIP
ATIO
N IN
AKL
NG
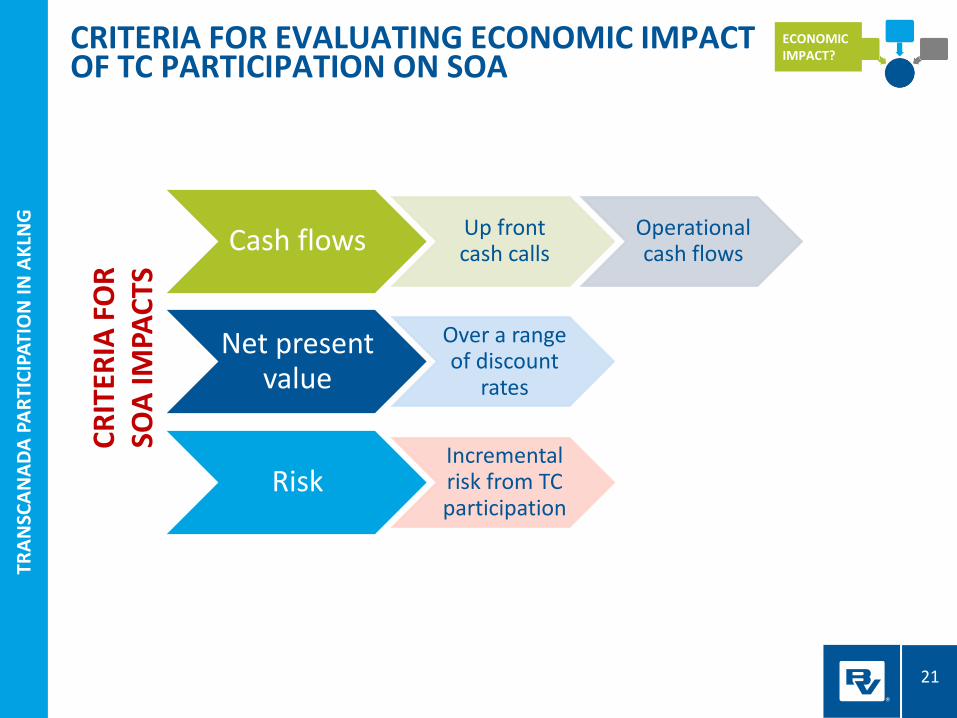
CRITERIA FOR EVALUATING ECONOMIC IMPACT OF TC PARTICIPATION ON SOA
Cash flows Up front cash calls
Operational cash flows
Net present value
Over a range of discount
rates
Risk Incremental risk from TC participation
CRIT
ERIA
FO
R SO
A IM
PACT
S
ECONOMIC IMPACT?
22
TRAN
SCAN
ADA
PART
ICIP
ATIO
N IN
AKL
NG
TR
ANSC
ANAD
A PA
RTIC
IPAT
ION
IN A
KLN
G
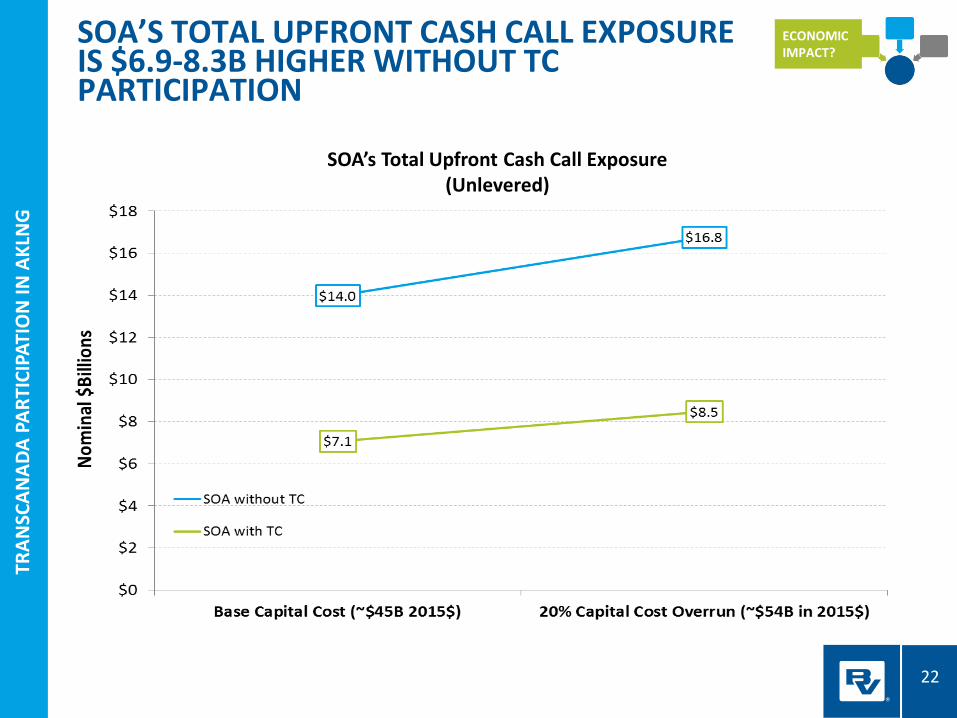
SOA’S TOTAL UPFRONT CASH CALL EXPOSURE IS $6.9-8.3B HIGHER WITHOUT TC PARTICIPATION
ECONOMIC IMPACT?
SOA’s Total Upfront Cash Call Exposure (Unlevered)
23
TRAN
SCAN
ADA
PART
ICIP
ATIO
N IN
AKL
NG
HO
USE
FIN
ANCE
CO
MM
ITTE
E –
TRAN
SCAN
ADA
PART
ICIP
ATIO
N
TRAN
SCAN
ADA
PART
ICIP
ATIO
N IN
AKL
NG
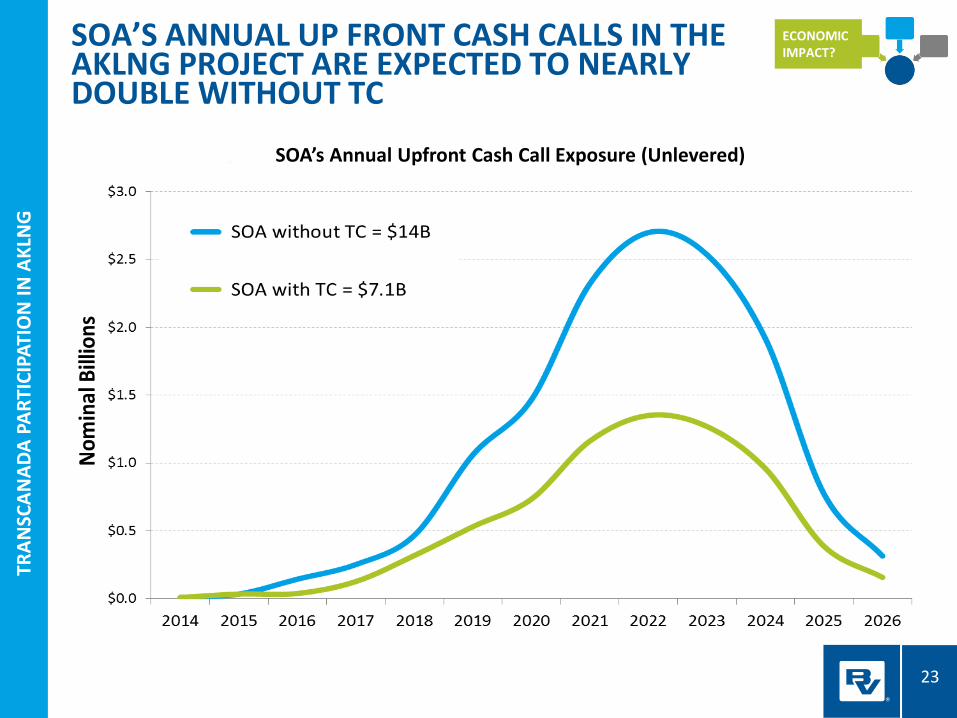
SOA’S ANNUAL UP FRONT CASH CALLS IN THE AKLNG PROJECT ARE EXPECTED TO NEARLY DOUBLE WITHOUT TC
ECONOMIC IMPACT?
SOA’s Annual Upfront Cash Call Exposure (Unlevered)
24
TRAN
SCAN
ADA
PART
ICIP
ATIO
N IN
AKL
NG
TR
ANSC
ANAD
A PA
RTIC
IPAT
ION
IN A
KLN
G
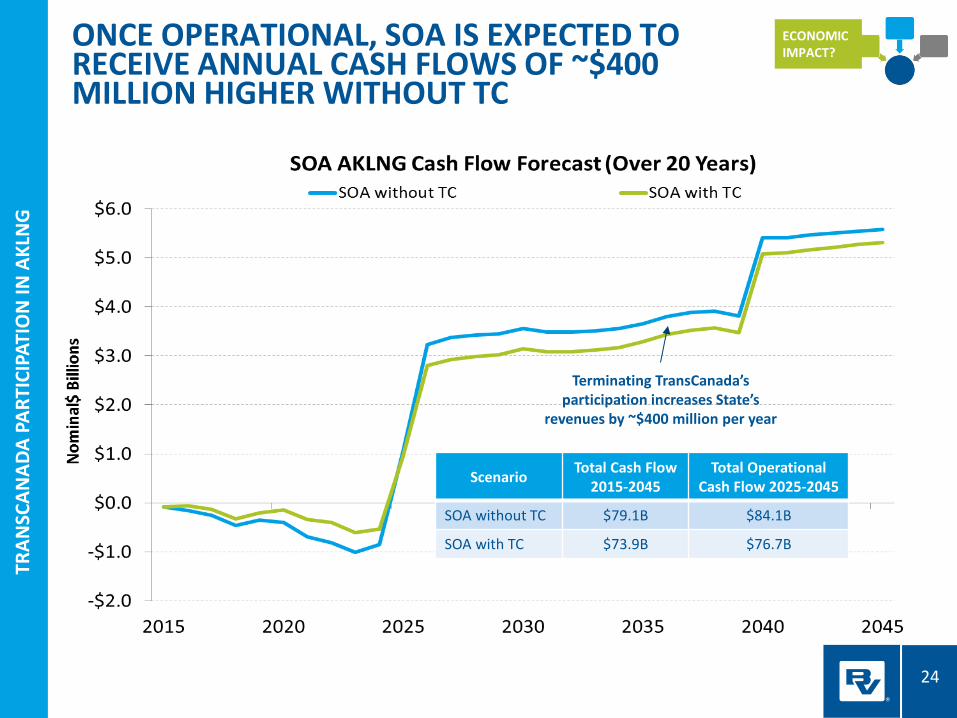
ONCE OPERATIONAL, SOA IS EXPECTED TO RECEIVE ANNUAL CASH FLOWS OF ~$400 MILLION HIGHER WITHOUT TC
ECONOMIC IMPACT?
Terminating TransCanada’s participation increases State’s
revenues by ~$400 million per year
Scenario Total Cash Flow 2015-2045
Total Operational Cash Flow 2025-2045
SOA without TC $79.1B $84.1B
SOA with TC $73.9B $76.7B
25
TRAN
SCAN
ADA
PART
ICIP
ATIO
N IN
AKL
NG
TR
ANSC
ANAD
A PA
RTIC
IPAT
ION
IN A
KLN
G
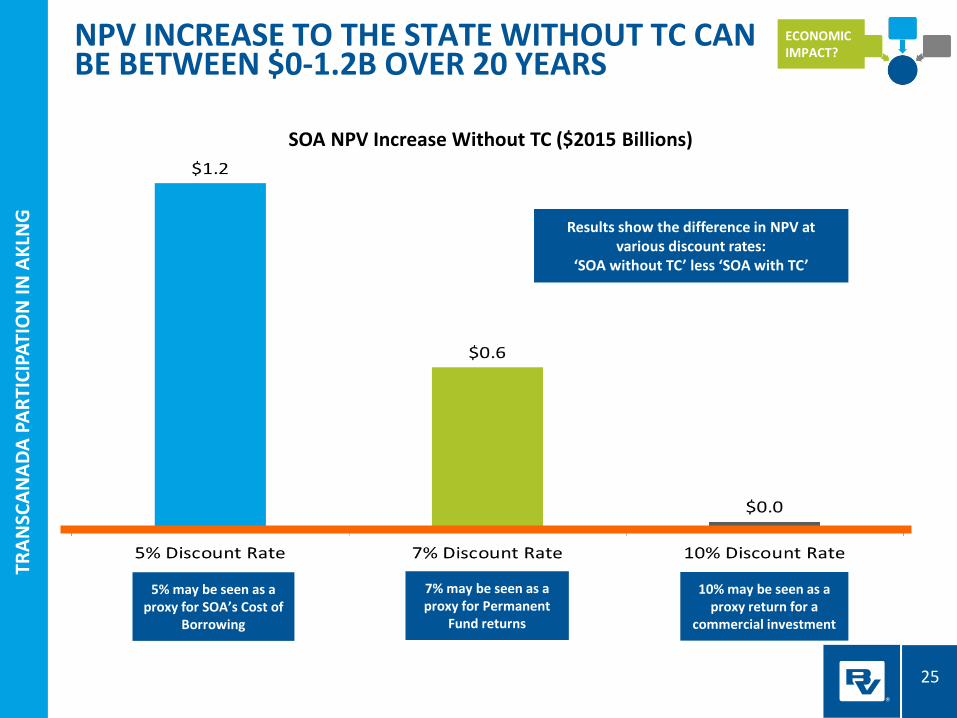
NPV INCREASE TO THE STATE WITHOUT TC CAN BE BETWEEN $0-1.2B OVER 20 YEARS
ECONOMIC IMPACT?
5% may be seen as a proxy for SOA’s Cost of
Borrowing
7% may be seen as a proxy for Permanent
Fund returns
10% may be seen as a proxy return for a
commercial investment
SOA NPV Increase Without TC ($2015 Billions)
Results show the difference in NPV at various discount rates:
‘SOA without TC’ less ‘SOA with TC’
26
TRAN
SCAN
ADA
PART
ICIP
ATIO
N IN
AKL
NG
TR
ANSC
ANAD
A PA
RTIC
IPAT
ION
IN A
KLN
G
• With an RIK election, the State could be exposed to negative netback if the revenue from its sale of RIK + TAG gas/LNG volumes is insufficient to cover its cost obligations as a shipper
• The State’s midstream cost obligations as a shipper are directly affected by midstream ownership (State Midstream Company, TransCanada) • Many of the cost obligations would be the same regardless of who owns the
midstream assets. These include any upstream expenses, midstream O&M costs, marketing costs, and LNG liquefaction and shipping costs
• Differences in the obligations arise from factors including how the project is financed, income tax, property tax, and return on equity
• Note: During the sale of RIK and TAG gas and LNG , market pricing mechanisms such as price collars may be available to help manage the State’s negative netback risk. The risk management available and associated costs to the State from such mechanisms will be evaluated during the marketing process and are not considered here. This analysis simply looks at the level of negative netback risk for the State that will need to be managed, with and without TC.
TC INVOLVEMENT AND THE RISK OF NEGATIVE NETBACK FOR THE STATE
ECONOMIC IMPACT?
27
TRAN
SCAN
ADA
PART
ICIP
ATIO
N IN
AKL
NG
HO
USE
FIN
ANCE
CO
MM
ITTE
E –
TRAN
SCAN
ADA
PART
ICIP
ATIO
N
TRAN
SCAN
ADA
PART
ICIP
ATIO
N IN
AKL
NG
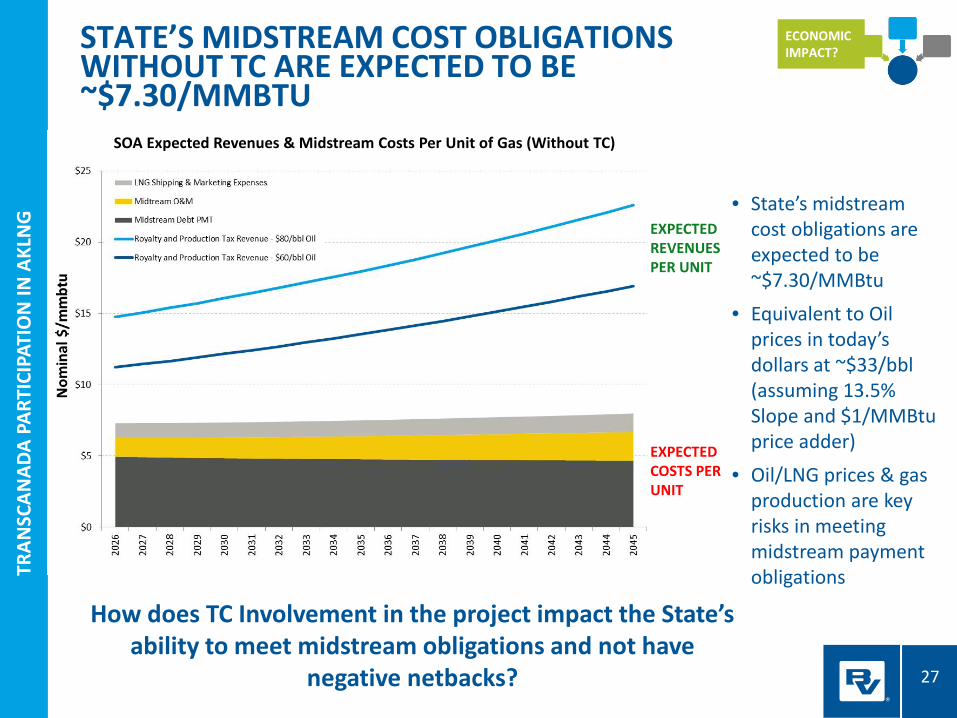
SOA Expected Revenues & Midstream Costs Per Unit of Gas (Without TC)
STATE’S MIDSTREAM COST OBLIGATIONS WITHOUT TC ARE EXPECTED TO BE ~$7.30/MMBTU
• State’s midstream cost obligations are expected to be ~$7.30/MMBtu
• Equivalent to Oil prices in today’s dollars at ~$33/bbl (assuming 13.5% Slope and $1/MMBtu price adder)
• Oil/LNG prices & gas production are key risks in meeting midstream payment obligations
How does TC Involvement in the project impact the State’s ability to meet midstream obligations and not have
negative netbacks?
ECONOMIC IMPACT?
EXPECTED REVENUES PER UNIT
EXPECTED COSTS PER UNIT
28
TRAN
SCAN
ADA
PART
ICIP
ATIO
N IN
AKL
NG
HO
USE
FIN
ANCE
CO
MM
ITTE
E –
TRAN
SCAN
ADA
PART
ICIP
ATIO
N
TRAN
SCAN
ADA
PART
ICIP
ATIO
N IN
AKL
NG
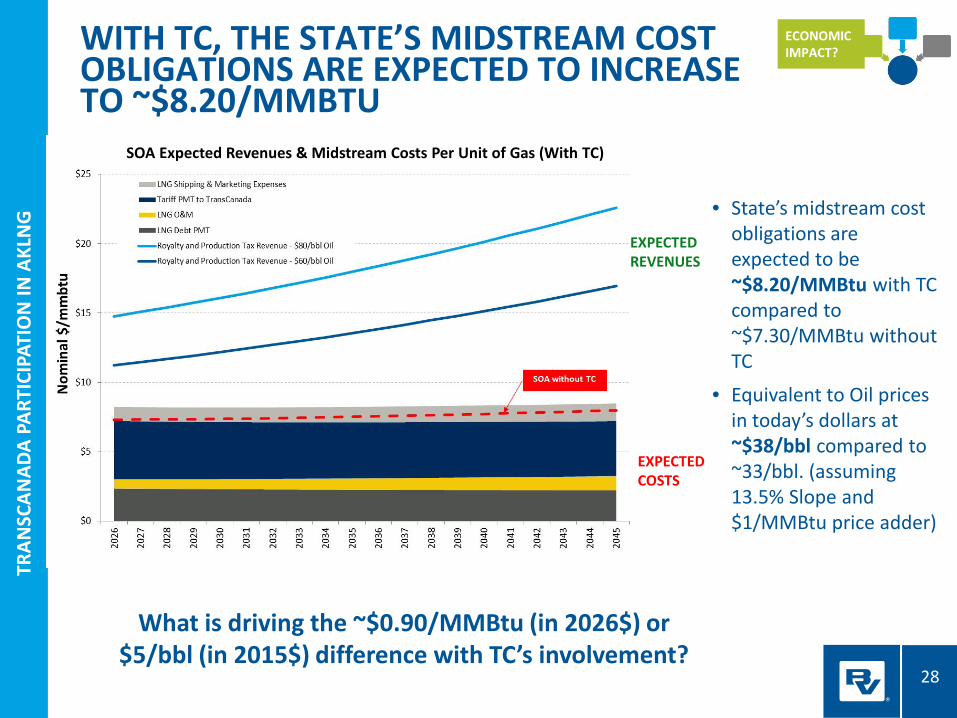
WITH TC, THE STATE’S MIDSTREAM COST OBLIGATIONS ARE EXPECTED TO INCREASE TO ~$8.20/MMBTU
• State’s midstream cost obligations are expected to be ~$8.20/MMBtu with TC compared to ~$7.30/MMBtu without TC
• Equivalent to Oil prices in today’s dollars at ~$38/bbl compared to ~33/bbl. (assuming 13.5% Slope and $1/MMBtu price adder)
What is driving the ~$0.90/MMBtu (in 2026$) or $5/bbl (in 2015$) difference with TC’s involvement?
ECONOMIC IMPACT?
SOA Expected Revenues & Midstream Costs Per Unit of Gas (With TC)
EXPECTED REVENUES
EXPECTED COSTS
29
TRAN
SCAN
ADA
PART
ICIP
ATIO
N IN
AKL
NG
TR
ANSC
ANAD
A PA
RTIC
IPAT
ION
IN A
KLN
G
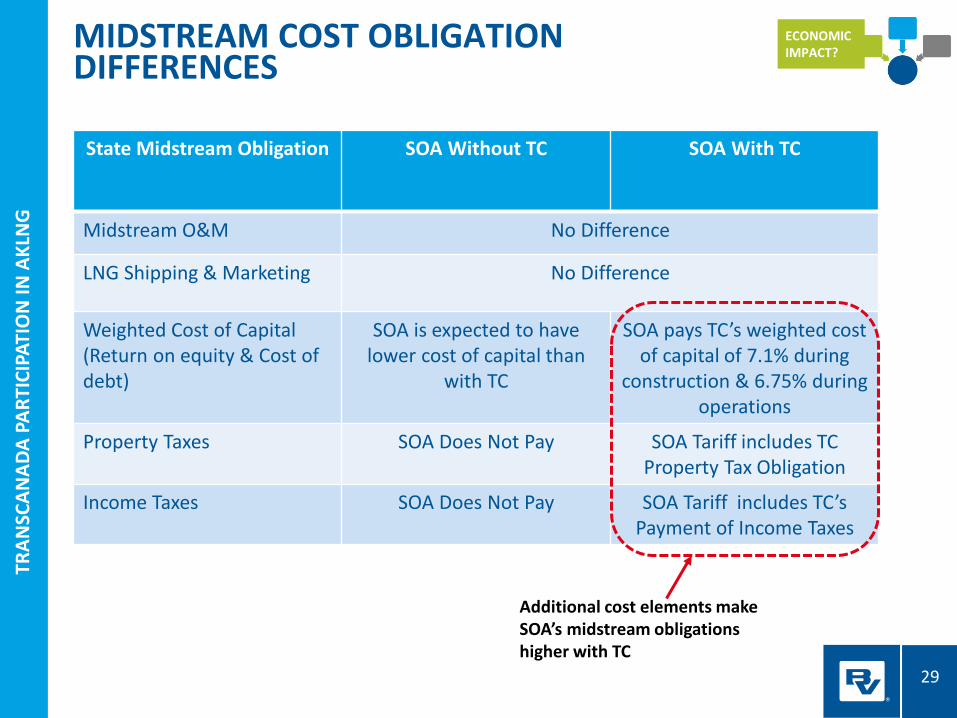
MIDSTREAM COST OBLIGATION DIFFERENCES
State Midstream Obligation SOA Without TC SOA With TC
Midstream O&M No Difference
LNG Shipping & Marketing No Difference
Weighted Cost of Capital (Return on equity & Cost of debt)
SOA is expected to have lower cost of capital than
with TC
SOA pays TC’s weighted cost of capital of 7.1% during
construction & 6.75% during operations
Property Taxes SOA Does Not Pay SOA Tariff includes TC Property Tax Obligation
Income Taxes SOA Does Not Pay SOA Tariff includes TC’s Payment of Income Taxes
ECONOMIC IMPACT?
Additional cost elements make SOA’s midstream obligations higher with TC
30
TRAN
SCAN
ADA
PART
ICIP
ATIO
N IN
AKL
NG
TR
ANSC
ANAD
A PA
RTIC
IPAT
ION
IN A
KLN
G
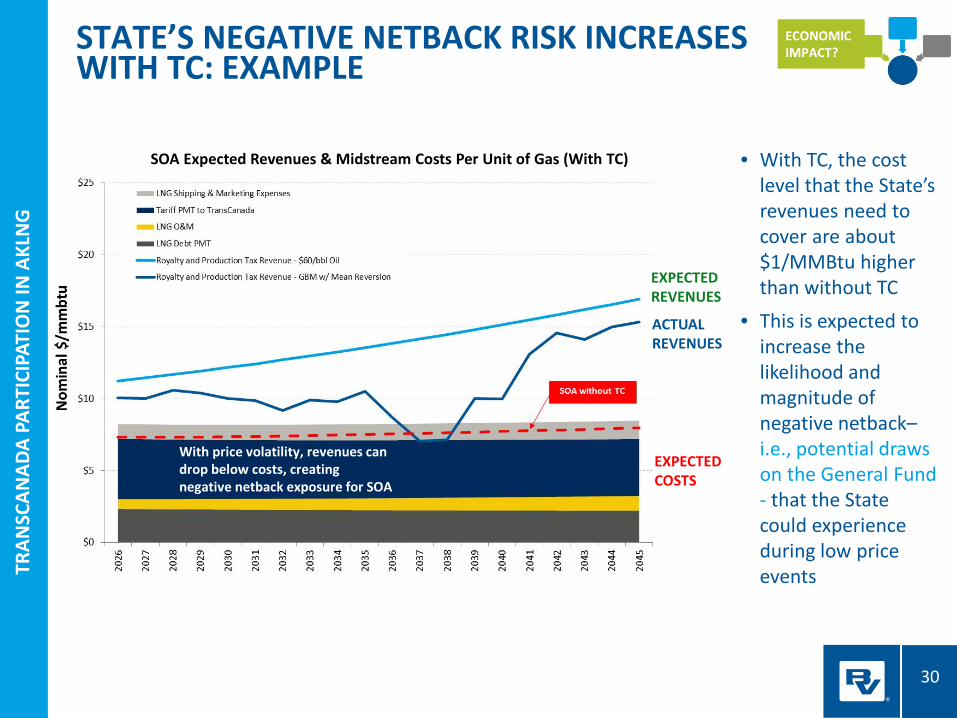
STATE’S NEGATIVE NETBACK RISK INCREASES WITH TC: EXAMPLE
• With TC, the cost level that the State’s revenues need to cover are about $1/MMBtu higher than without TC
• This is expected to increase the likelihood and magnitude of negative netback– i.e., potential draws on the General Fund - that the State could experience during low price events
ECONOMIC IMPACT?
EXPECTED REVENUES
EXPECTED COSTS
With price volatility, revenues can drop below costs, creating negative netback exposure for SOA
SOA Expected Revenues & Midstream Costs Per Unit of Gas (With TC)
ACTUAL REVENUES
31
TRAN
SCAN
ADA
PART
ICIP
ATIO
N IN
AKL
NG
TR
ANSC
ANAD
A PA
RTIC
IPAT
ION
IN A
KLN
G
SOME KEY FACTORS TO CONSIDER FOR STATE’S TC PARTICIPATION DECISION
TC PARTICIPATION
DECISION
ECONOMIC IMPACT ON SOA?
STATE FINANCIAL CAPABILITY?
STATE TECHNICAL CAPABILITY?
32
TRAN
SCAN
ADA
PART
ICIP
ATIO
N IN
AKL
NG
TR
ANSC
ANAD
A PA
RTIC
IPAT
ION
IN A
KLN
G
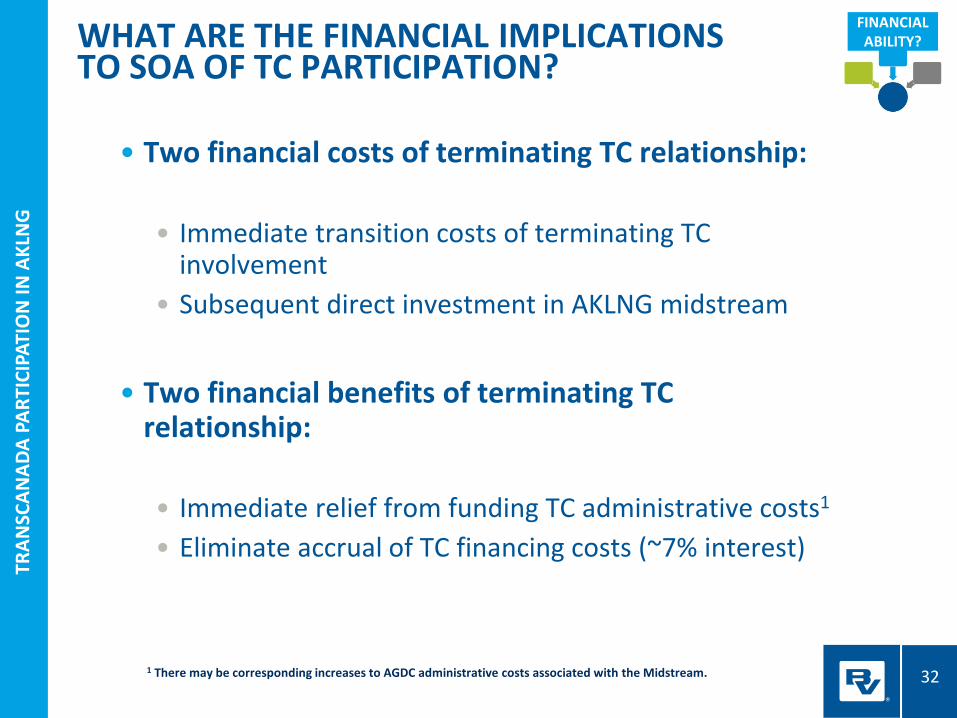
• Two financial costs of terminating TC relationship:
• Immediate transition costs of terminating TC involvement
• Subsequent direct investment in AKLNG midstream
• Two financial benefits of terminating TC relationship:
• Immediate relief from funding TC administrative costs1
• Eliminate accrual of TC financing costs (~7% interest)
WHAT ARE THE FINANCIAL IMPLICATIONS TO SOA OF TC PARTICIPATION?
FINANCIAL ABILITY?
1 There may be corresponding increases to AGDC administrative costs associated with the Midstream.
33
TRAN
SCAN
ADA
PART
ICIP
ATIO
N IN
AKL
NG
TR
ANSC
ANAD
A PA
RTIC
IPAT
ION
IN A
KLN
G
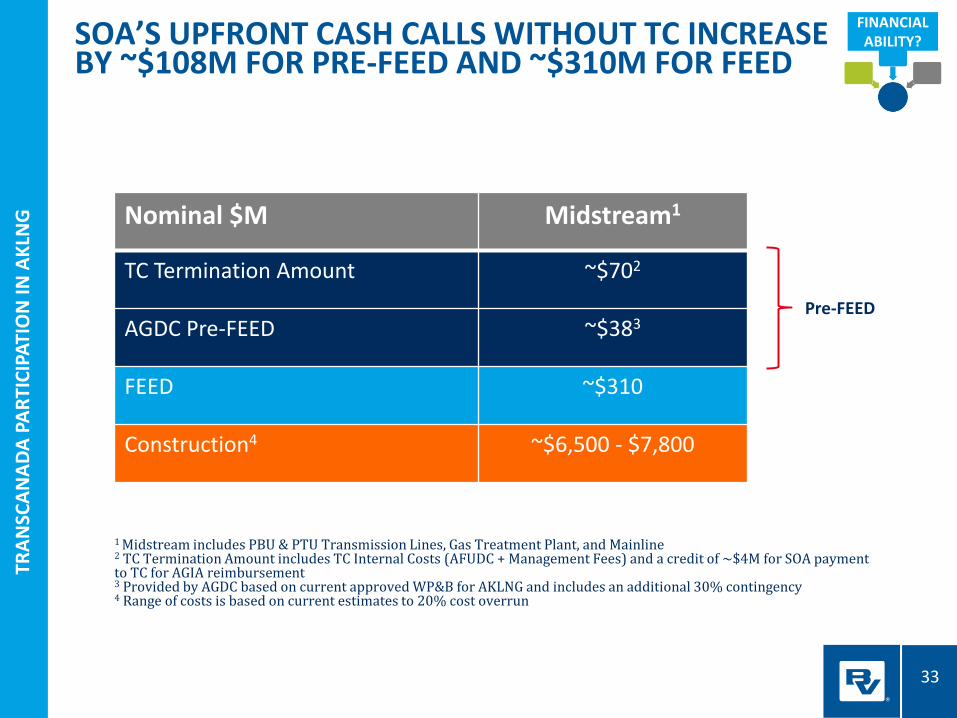
1 Midstream includes PBU & PTU Transmission Lines, Gas Treatment Plant, and Mainline 2 TC Termination Amount includes TC Internal Costs (AFUDC + Management Fees) and a credit of ~$4M for SOA payment to TC for AGIA reimbursement 3 Provided by AGDC based on current approved WP&B for AKLNG and includes an additional 30% contingency 4 Range of costs is based on current estimates to 20% cost overrun
SOA’S UPFRONT CASH CALLS WITHOUT TC INCREASE BY ~$108M FOR PRE-FEED AND ~$310M FOR FEED
Nominal $M Midstream1
TC Termination Amount ~$702
AGDC Pre-FEED ~$383
FEED ~$310
Construction4 ~$6,500 - $7,800
FINANCIAL ABILITY?
Pre-FEED
34
TRAN
SCAN
ADA
PART
ICIP
ATIO
N IN
AKL
NG
TR
ANSC
ANAD
A PA
RTIC
IPAT
ION
IN A
KLN
G
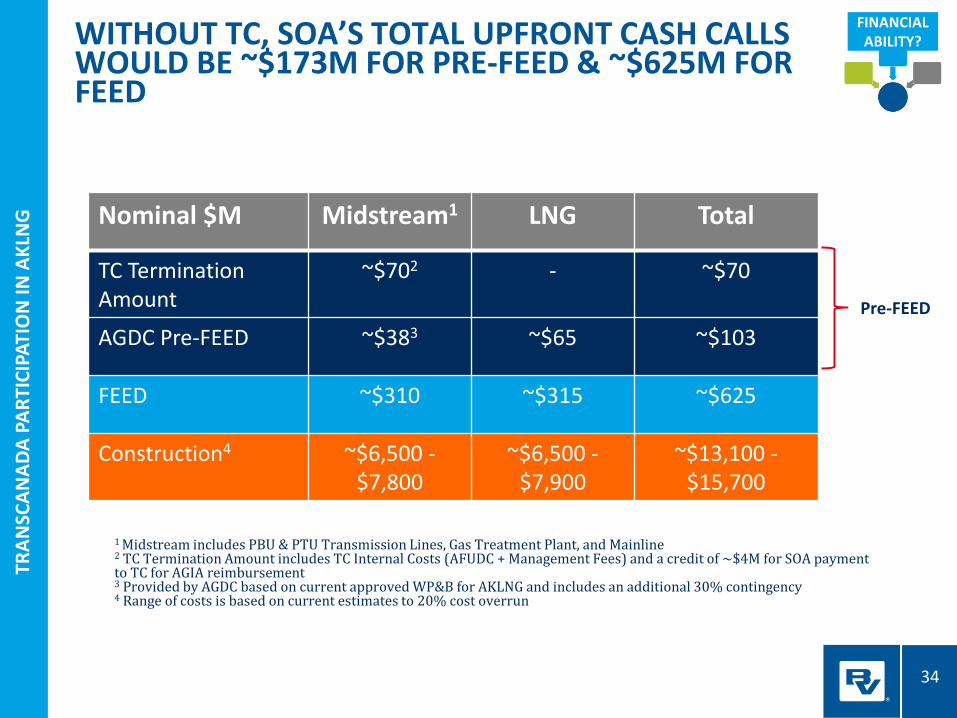
WITHOUT TC, SOA’S TOTAL UPFRONT CASH CALLS WOULD BE ~$173M FOR PRE-FEED & ~$625M FOR FEED
Nominal $M Midstream1 LNG Total
TC Termination Amount
~$702 - ~$70
AGDC Pre-FEED ~$383 ~$65 ~$103
FEED ~$310 ~$315 ~$625
Construction4 ~$6,500 - $7,800
~$6,500 - $7,900
~$13,100 - $15,700
FINANCIAL ABILITY?
Pre-FEED
1 Midstream includes PBU & PTU Transmission Lines, Gas Treatment Plant, and Mainline 2 TC Termination Amount includes TC Internal Costs (AFUDC + Management Fees) and a credit of ~$4M for SOA payment to TC for AGIA reimbursement 3 Provided by AGDC based on current approved WP&B for AKLNG and includes an additional 30% contingency 4 Range of costs is based on current estimates to 20% cost overrun
35
TRAN
SCAN
ADA
PART
ICIP
ATIO
N IN
AKL
NG
TR
ANSC
ANAD
A PA
RTIC
IPAT
ION
IN A
KLN
G
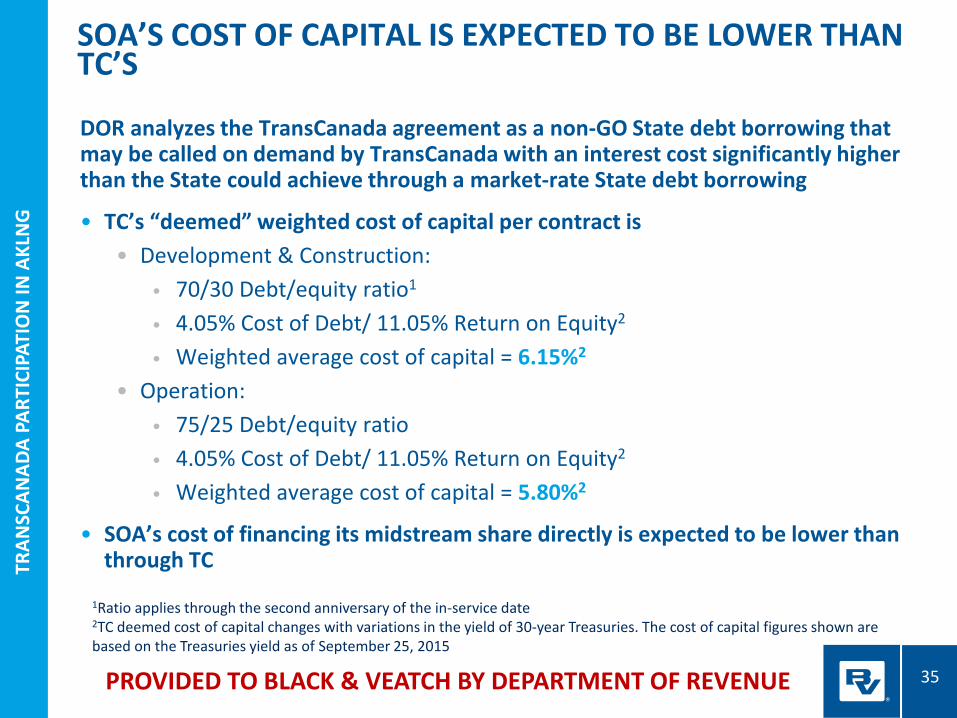
DOR analyzes the TransCanada agreement as a non-GO State debt borrowing that may be called on demand by TransCanada with an interest cost significantly higher than the State could achieve through a market-rate State debt borrowing
• TC’s “deemed” weighted cost of capital per contract is • Development & Construction:
• 70/30 Debt/equity ratio1 • 4.05% Cost of Debt/ 11.05% Return on Equity2
• Weighted average cost of capital = 6.15%2
• Operation: • 75/25 Debt/equity ratio • 4.05% Cost of Debt/ 11.05% Return on Equity2
• Weighted average cost of capital = 5.80%2
• SOA’s cost of financing its midstream share directly is expected to be lower than through TC
SOA’S COST OF CAPITAL IS EXPECTED TO BE LOWER THAN TC’S
PROVIDED TO BLACK & VEATCH BY DEPARTMENT OF REVENUE
1Ratio applies through the second anniversary of the in-service date 2TC deemed cost of capital changes with variations in the yield of 30-year Treasuries. The cost of capital figures shown are based on the Treasuries yield as of September 25, 2015
36
TRAN
SCAN
ADA
PART
ICIP
ATIO
N IN
AKL
NG
TR
ANSC
ANAD
A PA
RTIC
IPAT
ION
IN A
KLN
G
PROVIDED TO BLACK & VEATCH BY DEPARTMENT OF REVENUE
• The costs for the TC termination amount through pre-FEED to date will need to be funded through legislative appropriation
• Legislature has a number of viable readily implemented funding options available to it for the TransCanada reimbursement of Developments Costs. • The Legislature could appropriate funds from the CBRF or authorize a short or
intermediate term borrowing with non-GO State debt (moral obligation or certificates of participation)
• The Legislature could also do a combination of the two, with initial funding from the CBRF to be reimbursed by a non-GO State debt issuance or proceeds from financing provided by future equity partners and/or LNG buyers
• Note that given the relatively small size of the TransCanada reimbursement, the State could consider both bank financing and municipal market bonding
• First Southwest believes that a State borrowing could be feasible and would result in materially lower interest costs to the State than under the TransCanada agreement
• Interest payments on any State borrowing would be funded by annual appropriation, with the anticipation that principal repayment would be rolled into a future long term financing if the Project reaches FID
STATE’S ABILITY TO FUND TERMINATION AMOUNT FOR TC
FINANCIAL ABILITY?
37
TRAN
SCAN
ADA
PART
ICIP
ATIO
N IN
AKL
NG
TR
ANSC
ANAD
A PA
RTIC
IPAT
ION
IN A
KLN
G
• AGDC’s remaining midstream Pre-FEED JVA costs will need to be funded through legislative appropriations
• The funding could be done in the same way as the current AGDC Downstream Pre-FEED JVA costs are funded
• Alternatively, the same funding program identified for the TransCanada reimbursement of Development Costs could be utilized • The Legislature could appropriate funds from the CBRF or authorize a
short or intermediate term borrowing with non-GO State debt or a combination of the two
STATE’S ABILITY TO FINANCE ITS SHARE OF AKLNG COSTS – PRE-FEED
FINANCIAL ABILITY?
PROVIDED TO BLACK & VEATCH BY DEPARTMENT OF REVENUE
38
TRAN
SCAN
ADA
PART
ICIP
ATIO
N IN
AKL
NG
TR
ANSC
ANAD
A PA
RTIC
IPAT
ION
IN A
KLN
G
• The AGDC Downstream and Midstream FEED costs will need to be funded through legislative appropriations
• It is anticipated that the SOA total share of FEED amount could approach $625 million, an increase of $310 million without TC
• For the AGDC Downstream and Midstream FEED costs, the Legislature would have the same options available to fund such costs as outlined in the funding program identified for the TransCanada reimbursement
• In addition, given the additional time available before the FEED funding decision is ripe, the Legislature could consider proposing a GO debt offering which would require a voter referendum approval • The State would have the option to issue annual tranches of debt to meet
the annual appropriation requirements or a single tranche to fund the total FEED period costs.
• Interest payments could be funded by annual appropriation, with the anticipation that principal repayment would be rolled in a future long term financing.
STATE’S ABILITY TO FINANCE ITS SHARE OF AKLNG COSTS – FEED
FINANCIAL ABILITY?
PROVIDED TO BLACK & VEATCH BY DEPARTMENT OF REVENUE
39
TRAN
SCAN
ADA
PART
ICIP
ATIO
N IN
AKL
NG
TR
ANSC
ANAD
A PA
RTIC
IPAT
ION
IN A
KLN
G
• The state may also be able to obtain financing from future equity investors and/or LNG buyers
• Under the existing agreements with TC, the State has to support its obligations under the PA and FTSA with the full faith and credit of the State of Alaska or provide other credit support acceptable to TC • The State is expected to obtain less expensive borrowing on its own in
the debt market
• Given that the State’s financial consultants, First Southwest and Lazard, advise that the State would have the ability to access the bank debt and municipal bond market for funds to replace the TransCanada debt, DOR is comfortable the State can readily fund AGDC’s share of costs through FEED at a lower overall cost to the State
STATE’S ABILITY TO FINANCE ITS SHARE OF AKLNG COSTS – FEED (CONT.)
FINANCIAL ABILITY?
PROVIDED TO BLACK & VEATCH BY DEPARTMENT OF REVENUE
40
TRAN
SCAN
ADA
PART
ICIP
ATIO
N IN
AKL
NG
TR
ANSC
ANAD
A PA
RTIC
IPAT
ION
IN A
KLN
G
• The AGDC Downstream and Midstream post-FID construction costs will need to be funded through legislative appropriations
• It is anticipated that this amount could approach $13.1-15.7 billion
• The Legislature would have the same options as for FEED costs to fund construction costs
• Given the magnitude of the expenditures, the borrowing plan would look more to the municipal bond market than to bank borrowing
• It is anticipated that at the time of placement of the Project into operation, the State would re-finance outstanding debt with long term municipal bond market borrowing or a Permanent Fund investment or a combination of both
• SOA/AGDC would not have the option to access project financing under our understanding of the current Constitution’s limitations against pledging State royalties and tax revenues. • A Constitutional Amendment would be required specifically to allow a pledge of
RIK/TAG revenues to enable an SOA/AGDC borrowing for the AKLNG Project
STATE’S ABILITY TO FINANCE ITS SHARE OF AKLNG COSTS – CONSTRUCTION
FINANCIAL ABILITY?
PROVIDED TO BLACK & VEATCH BY DEPARTMENT OF REVENUE
41
TRAN
SCAN
ADA
PART
ICIP
ATIO
N IN
AKL
NG
TR
ANSC
ANAD
A PA
RTIC
IPAT
ION
IN A
KLN
G
SOME KEY FACTORS TO CONSIDER FOR STATE’S TC PARTICIPATION DECISION
TC PARTICIPATION
DECISION
ECONOMIC IMPACT ON SOA?
STATE FINANCIAL CAPABILITY?
STATE TECHNICAL CAPABILITY?
42
TRAN
SCAN
ADA
PART
ICIP
ATIO
N IN
AKL
NG
TR
ANSC
ANAD
A PA
RTIC
IPAT
ION
IN A
KLN
G
• TC is highly experienced in northern pipelines and leads the pipeline technical work for AKLNG
• TC in its current role performs or has performed several functions including the following: • Holds State of Alaska’s midstream equity in AKLNG as signatory to the
JVA • Is SOA's midstream participant in JVA Governance and decision making • Provided the majority of the pipeline SMEs that were seconded to the
JVA PMT • Provided technical advice to the State of Alaska on midstream design,
especially the 48 inch pipe position • Helpful assistance and input on negotiation of key agreements like
Expansion • Coordinated FERC NEPA Process
CAN THE STATE PROCEED WITHOUT TC – TECHNICAL ABILITY?
TECHNICAL ABILITY?
43
TRAN
SCAN
ADA
PART
ICIP
ATIO
N IN
AKL
NG
TR
ANSC
ANAD
A PA
RTIC
IPAT
ION
IN A
KLN
G
• The end of the pre-FEED stage in the AKLNG Project’s development is a natural transition point in activities
• Project delay is not expected if TC agreement is terminated in December 2015, as the pre-FEED work products near completion
• The AKLNG Project producer partners have worldwide experience and resources to be able to step into the pipeline technical lead role played by TC • The #2 on the Pipeline Team is an EM employee with significant
experience • The GTP, which is part of Midstream is already being managed by
an EM secondee • Exxon designed and built TAPS and thus has Alaska-relevant
experience on midstream
• AKLNG may be able to hire pipeline employees currently seconded to the project by TC
MIDSTREAM CAPABILITIES WITHIN AKLNG TECHNICAL ABILITY?
44
TRAN
SCAN
ADA
PART
ICIP
ATIO
N IN
AKL
NG
TR
ANSC
ANAD
A PA
RTIC
IPAT
ION
IN A
KLN
G
• AGDC has completed Pre-FEED and FEED work on ASAP
• Practical knowledge/experience with the proposed RoW on ASAP – already have all the State lands RoW granted to them and expect the Federal portion to be granted as soon as the NEPA process is completed in mid 2016
• Experienced in the NEPA process although ASAP is under USACE and not FERC – AGDC has filed an EIS
• AGDC’s ERL person has taken over the permitting from the TC person who had led that effort
• Challenges/gaps – • Limited current experience on the GTP - AGDC is expected to add
staff/contractors to close this gap • Limited direct experience with 48” pipelines in northern conditions
AGDC CAPABILITIES IN MIDSTREAM TECHNICAL ABILITY?
45
TRAN
SCAN
ADA
PART
ICIP
ATIO
N IN
AKL
NG
TR
ANSC
ANAD
A PA
RTIC
IPAT
ION
IN A
KLN
G
• Both the State Gas Team and AGDC have strong midstream regulatory and commercial skills to participate in regulatory processes as well as in commercial negotiations with Producers
• Negotiations with Producers on project expansion
and third party access issues are being led by the State Gas Team and AGDC using legal resources and SMEs where appropriate for support
OTHER CAPABILITIES – COMMERCIAL TECHNICAL ABILITY?
46
TRAN
SCAN
ADA
PART
ICIP
ATIO
N IN
AKL
NG
TR
ANSC
ANAD
A PA
RTIC
IPAT
ION
IN A
KLN
G
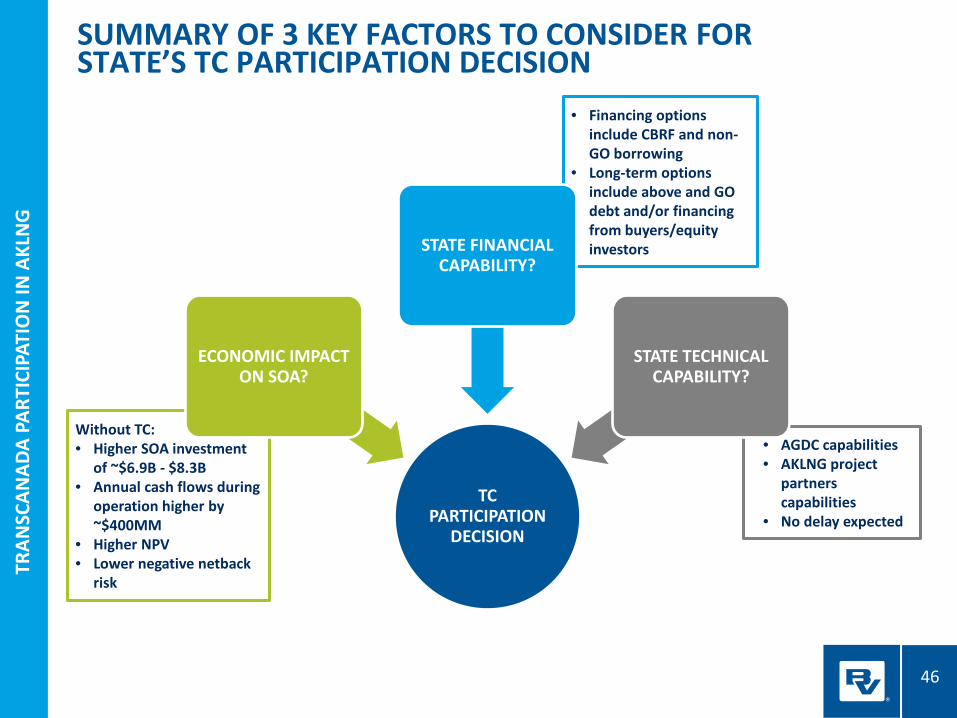
• Financing options include CBRF and non-GO borrowing
• Long-term options include above and GO debt and/or financing from buyers/equity investors
• AGDC capabilities • AKLNG project
partners capabilities
• No delay expected
Without TC: • Higher SOA investment
of ~$6.9B - $8.3B • Annual cash flows during
operation higher by ~$400MM
• Higher NPV • Lower negative netback
risk
SUMMARY OF 3 KEY FACTORS TO CONSIDER FOR STATE’S TC PARTICIPATION DECISION
TC PARTICIPATION
DECISION
ECONOMIC IMPACT ON SOA?
STATE FINANCIAL CAPABILITY?
STATE TECHNICAL CAPABILITY?
47
TRAN
SCAN
ADA
PART
ICIP
ATIO
N IN
AKL
NG
47
TRAN
SCAN
ADA
PART
ICIP
ATIO
N IN
AKL
NG
This presentation was prepared for the State of Alaska (“Client”) by Black & Veatch Corporation (“Black & Veatch”) and is based in part on information not within the control of Black & Veatch.
In conducting our analysis, Black & Veatch has made certain assumptions with respect to conditions, events, and circumstances that may occur in the future. The methodologies we utilize in performing the analysis and making these projections follow generally accepted industry practices. While we believe that such assumptions and methodologies as summarized in this report are reasonable and appropriate for the purpose for which they are used; depending upon conditions, events, and circumstances that actually occur but are unknown at this time, actual results may materially differ from those projected.
Readers of this presentation are advised that any projected or forecast price levels and price impacts reflect the reasonable judgment of Black & Veatch at the time of the preparation of such information and are based on a number of factors and circumstances beyond our control. Accordingly, Black & Veatch makes no assurances that the projections or forecasts will be consistent with actual results or performance. To better reflect more current trends and reduce the chance of forecast error, we recommend that periodic updates of the forecasts contained in this presentation be conducted so recent historical trends can be recognized and taken into account.
Neither this presentation, nor any information contained herein or otherwise supplied by Black & Veatch in connection with the services, shall be released or used in connection with any proxy, proxy statement, and proxy soliciting material, prospectus, Securities Registration Statement, or similar document without the written consent of Black & Veatch.
Use of this presentation, or any information contained therein, shall constitute the user’s waiver and release of Black & Veatch from and against all claims and liability, including, but not limited to, any liability for special, incidental, indirect or consequential damages, in connection with such use. In addition, use of this presentation or any information contained therein shall constitute an agreement by the user to defend and indemnify Black & Veatch from and against any claims and liability, including, but not limited to, liability for special, incidental, indirect or consequential damages, in connection with such use. To the fullest extent permitted by law, such waiver and release, and indemnification shall apply notwithstanding the negligence, strict liability, fault, or breach of warranty or contract of Black & Veatch. The benefit of such releases, waivers or limitations of liability shall extend to Black & Veatch’s related companies, and subcontractors, and the directors, officers, partners, employees, and agents of all released or indemnified parties. USE OF THIS PRESENTATION SHALL CONSTITUTE AGREEMENT BY THE USER THAT ITS RIGHTS, IF ANY, IN RELATION TO THIS PRESENTATION SHALL NOT EXCEED, OR BE IN ADDITION TO, THE RIGHTS OF THE CLIENT.
BLACK & VEATCH STATEMENT
HOU
SE F
INAN
CE C
OM
MIT
TEE
– TR
ANSC
ANAD
A PA
RTIC
IPAT
ION
TR
ANSC
ANAD
A PA
RTIC
IPAT
ION
IN A
KLN
G
ALA
SKA
NO
RT
H S
LOP
E R
OY
ALT
Y G
AS
STU
DY
48
APPENDICES
49
TRAN
SCAN
ADA
PART
ICIP
ATIO
N IN
AKL
NG
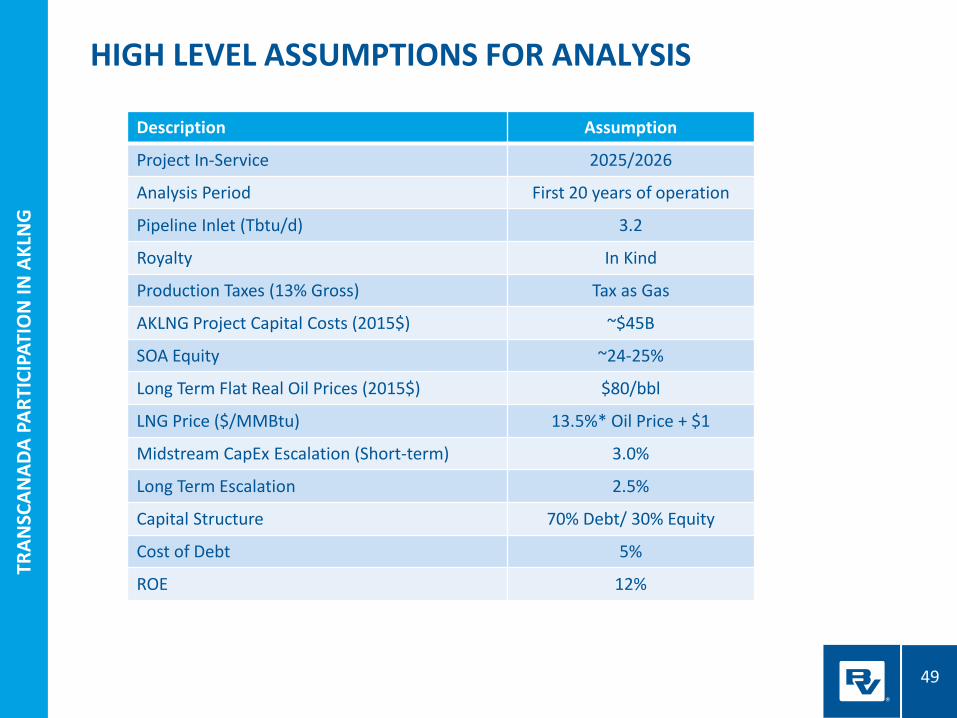
HIGH LEVEL ASSUMPTIONS FOR ANALYSIS
Description Assumption
Project In-Service 2025/2026
Analysis Period First 20 years of operation
Pipeline Inlet (Tbtu/d) 3.2
Royalty In Kind
Production Taxes (13% Gross) Tax as Gas
AKLNG Project Capital Costs (2015$) ~$45B
SOA Equity ~24-25%
Long Term Flat Real Oil Prices (2015$) $80/bbl
LNG Price ($/MMBtu) 13.5%* Oil Price + $1
Midstream CapEx Escalation (Short-term) 3.0%
Long Term Escalation 2.5%
Capital Structure 70% Debt/ 30% Equity
Cost of Debt 5%
ROE 12%
50
TRAN
SCAN
ADA
PART
ICIP
ATIO
N IN
AKL
NG
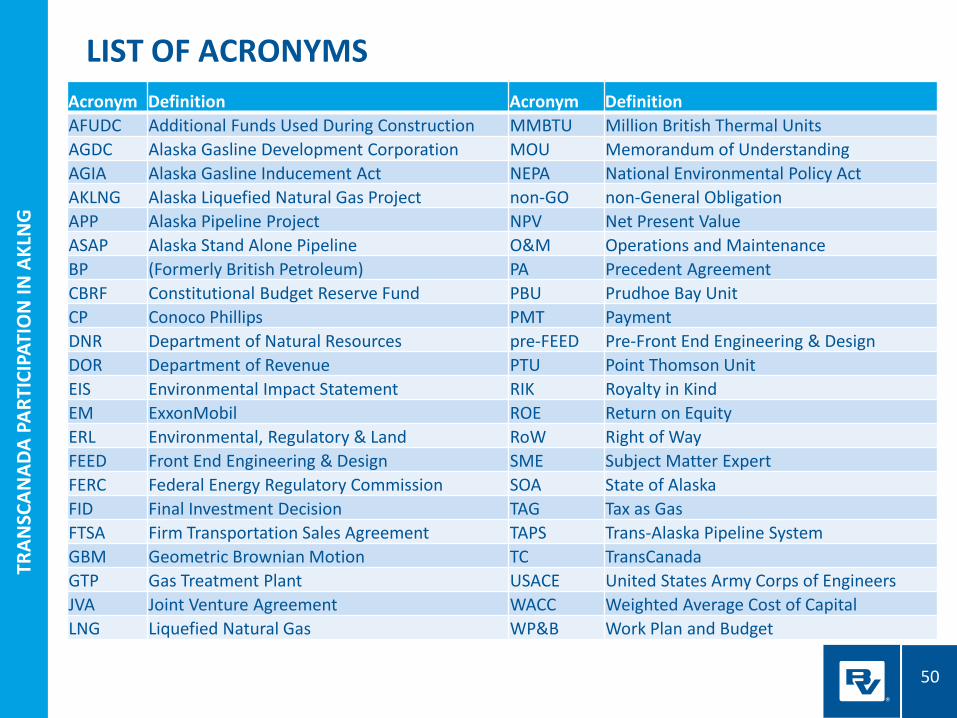
LIST OF ACRONYMS
Acronym Definition Acronym Definition AFUDC Additional Funds Used During Construction MMBTU Million British Thermal Units AGDC Alaska Gasline Development Corporation MOU Memorandum of Understanding AGIA Alaska Gasline Inducement Act NEPA National Environmental Policy Act AKLNG Alaska Liquefied Natural Gas Project non-GO non-General Obligation APP Alaska Pipeline Project NPV Net Present Value ASAP Alaska Stand Alone Pipeline O&M Operations and Maintenance BP (Formerly British Petroleum) PA Precedent Agreement CBRF Constitutional Budget Reserve Fund PBU Prudhoe Bay Unit CP Conoco Phillips PMT Payment DNR Department of Natural Resources pre-FEED Pre-Front End Engineering & Design DOR Department of Revenue PTU Point Thomson Unit EIS Environmental Impact Statement RIK Royalty in Kind EM ExxonMobil ROE Return on Equity ERL Environmental, Regulatory & Land RoW Right of Way FEED Front End Engineering & Design SME Subject Matter Expert FERC Federal Energy Regulatory Commission SOA State of Alaska FID Final Investment Decision TAG Tax as Gas FTSA Firm Transportation Sales Agreement TAPS Trans-Alaska Pipeline System GBM Geometric Brownian Motion TC TransCanada GTP Gas Treatment Plant USACE United States Army Corps of Engineers JVA Joint Venture Agreement WACC Weighted Average Cost of Capital LNG Liquefied Natural Gas WP&B Work Plan and Budget
51
TRAN
SCAN
ADA
PART
ICIP
ATIO
N IN
AKL
NG
HO
USE
FIN
ANCE
CO
MM
ITTE
E –
TRAN
SCAN
ADA
PART
ICIP
ATIO
N
TRAN
SCAN
ADA
PART
ICIP
ATIO
N IN
AKL
NG
TC WITH 40% EQUITY OPTION
52
TRAN
SCAN
ADA
PART
ICIP
ATIO
N IN
AKL
NG
TR
ANSC
ANAD
A PA
RTIC
IPAT
ION
IN A
KLN
G
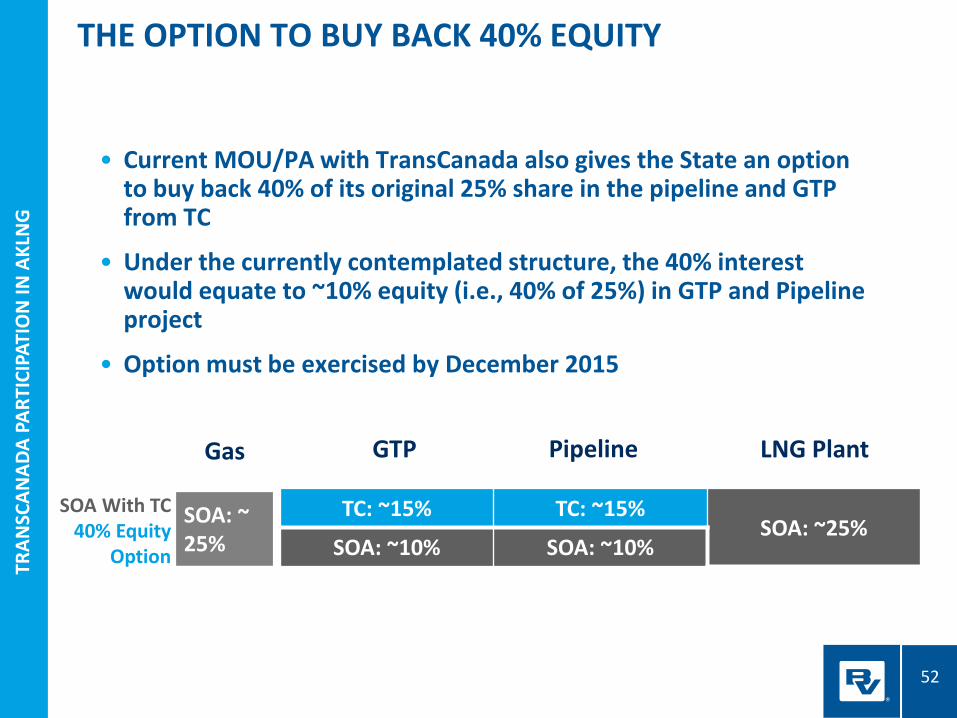
• Current MOU/PA with TransCanada also gives the State an option to buy back 40% of its original 25% share in the pipeline and GTP from TC
• Under the currently contemplated structure, the 40% interest would equate to ~10% equity (i.e., 40% of 25%) in GTP and Pipeline project
• Option must be exercised by December 2015
THE OPTION TO BUY BACK 40% EQUITY
TC: ~15% TC: ~15% SOA: ~25%
SOA: ~10% SOA: ~10%
Pipeline LNG Plant GTP
SOA With TC 40% Equity
Option
SOA: ~ 25%
Gas
53
TRAN
SCAN
ADA
PART
ICIP
ATIO
N IN
AKL
NG
TR
ANSC
ANAD
A PA
RTIC
IPAT
ION
IN A
KLN
G
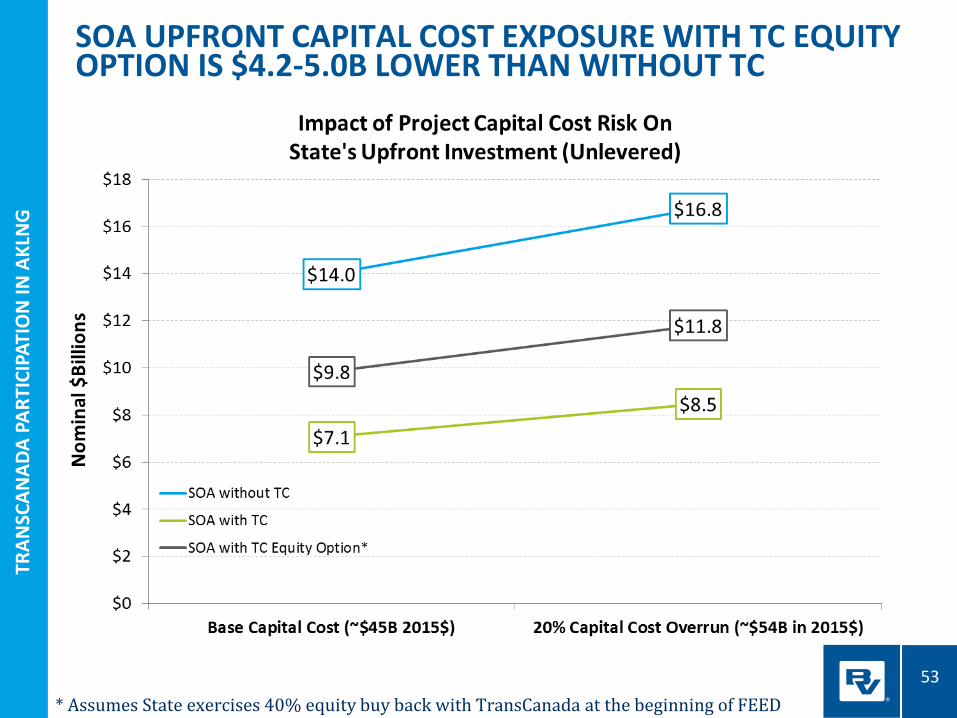
* Assumes State exercises 40% equity buy back with TransCanada at the beginning of FEED
SOA UPFRONT CAPITAL COST EXPOSURE WITH TC EQUITY OPTION IS $4.2-5.0B LOWER THAN WITHOUT TC
54
TRAN
SCAN
ADA
PART
ICIP
ATIO
N IN
AKL
NG
HO
USE
FIN
ANCE
CO
MM
ITTE
E –
TRAN
SCAN
ADA
PART
ICIP
ATIO
N
TRAN
SCAN
ADA
PART
ICIP
ATIO
N IN
AKL
NG
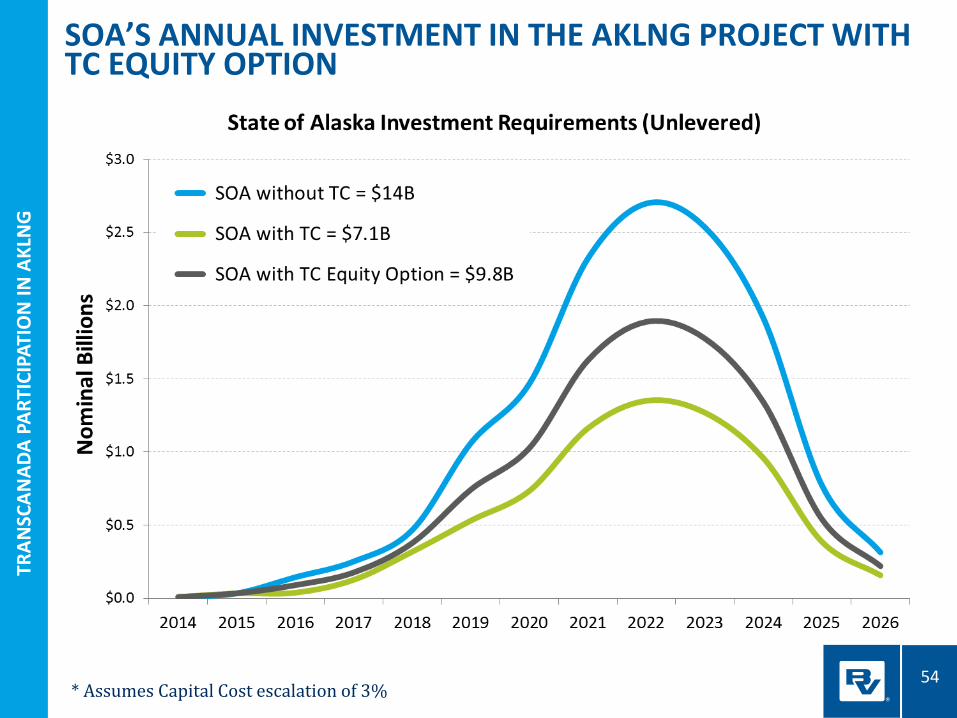
SOA’S ANNUAL INVESTMENT IN THE AKLNG PROJECT WITH TC EQUITY OPTION
* Assumes Capital Cost escalation of 3%
55
TRAN
SCAN
ADA
PART
ICIP
ATIO
N IN
AKL
NG
TR
ANSC
ANAD
A PA
RTIC
IPAT
ION
IN A
KLN
G
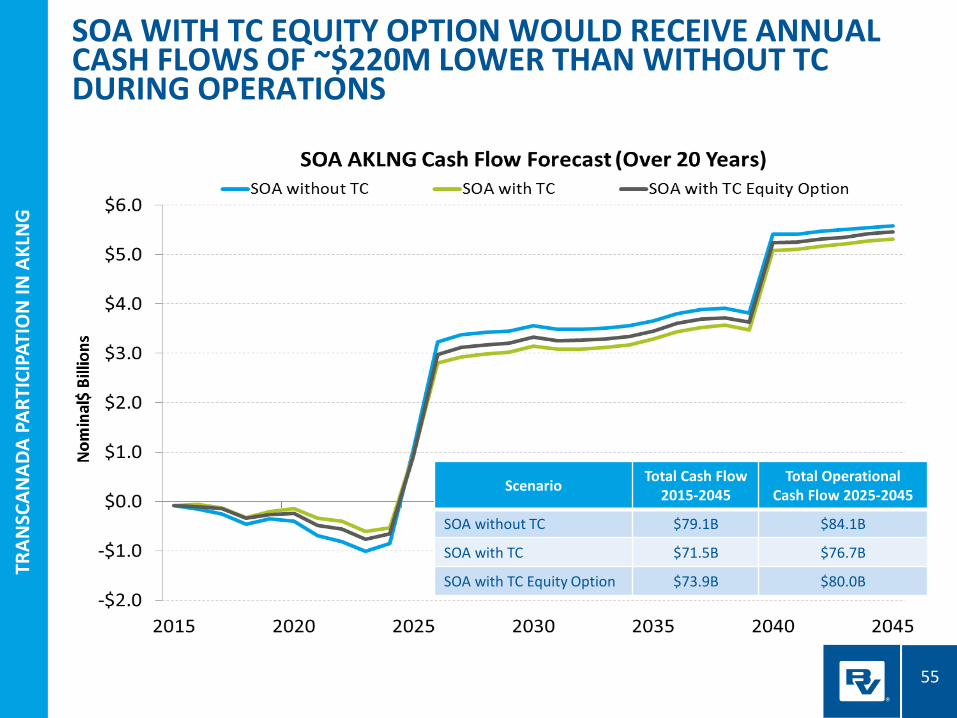
SOA WITH TC EQUITY OPTION WOULD RECEIVE ANNUAL CASH FLOWS OF ~$220M LOWER THAN WITHOUT TC DURING OPERATIONS
Scenario Total Cash Flow 2015-2045
Total Operational Cash Flow 2025-2045
SOA without TC $79.1B $84.1B
SOA with TC $71.5B $76.7B
SOA with TC Equity Option $73.9B $80.0B
56
TRAN
SCAN
ADA
PART
ICIP
ATIO
N IN
AKL
NG
TR
ANSC
ANAD
A PA
RTIC
IPAT
ION
IN A
KLN
G
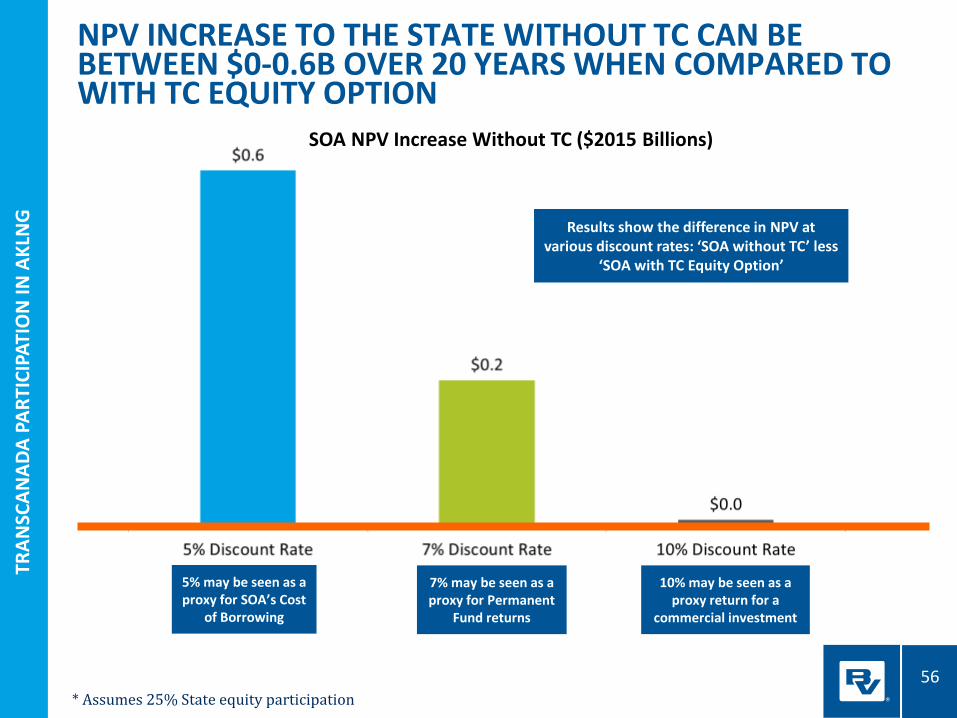
NPV INCREASE TO THE STATE WITHOUT TC CAN BE BETWEEN $0-0.6B OVER 20 YEARS WHEN COMPARED TO WITH TC EQUITY OPTION
* Assumes 25% State equity participation
5% may be seen as a proxy for SOA’s Cost
of Borrowing
7% may be seen as a proxy for Permanent
Fund returns
10% may be seen as a proxy return for a
commercial investment
Results show the difference in NPV at various discount rates: ‘SOA without TC’ less
‘SOA with TC Equity Option’
SOA NPV Increase Without TC ($2015 Billions)