Embed Size (px)
Citation preview
TransCanada Corporation
Can We Make Energy Infrastructure
Great Again? Corey Goulet Senior Vice-President, Major Projects
University of Denver 2016 Pipeline Leadership Conference November 15, 2016
Forward-Looking Information
This presentation includes certain forward looking information to help current and potential investors understand management’s assessment of our future plans and financial outlook, and our future prospects overall. Statements that are forward-looking are based on certain assumptions and on what we know and expect today and generally include words like anticipate, expect, believe, may, will, should, estimate or other similar words. Forward-looking statements do not guarantee future performance. Actual events and results could be significantly different because of assumptions, risks or uncertainties related to our business or events that happen after the date of this presentation. Our forward-looking information is based on the following key assumptions: planned monetization of our U.S. Northeast power assets and a minority interest in our Mexican natural gas pipeline business, inflation rates, commodity prices and capacity prices, timing of financings and hedging, regulatory decisions and outcomes, foreign exchange rates, interest rates, tax rates, planned and unplanned outages and the use of our pipeline and energy assets, integrity and reliability of our assets, access to capital markets, anticipated construction costs, schedules and completion dates, acquisitions and divestitures.
Our forward looking information is subject to risks and uncertainties, including but not limited to: our ability to successfully implement our strategic initiatives and whether they will yield the expected benefits including the expected benefits of the acquisition of Columbia, timing and execution of our planned asset sales, the operating performance of our pipeline and energy assets, economic and competitive conditions in North America and globally, the availability and price of energy commodities and changes in market commodity prices, the amount of capacity sold and rates achieved in our pipeline businesses, the amount of capacity payments and revenues we receive from our energy business, regulatory decisions and outcomes, outcomes of legal proceedings, including arbitration and insurance claims, performance of our counterparties, changes in the political environment, changes in environmental and other laws and regulations, construction and completion of capital projects, labour, equipment and material costs, access to capital markets, interest and foreign exchange rates, weather, cyber security and technological developments. You can read more about these risks and others in our Quarterly Report to shareholders dated July 27, 2016 and 2015 Annual Report filed with Canadian securities regulators and the U.S. Securities and Exchange Commission (SEC) and available at www.transcanada.com.
As actual results could vary significantly from the forward-looking information, you should not put undue reliance on forward-looking information and should not use future-oriented information or financial outlooks for anything other than their intended purpose. We do not update our forward-looking statements due to new information or future events, unless we are required to by law.
This presentation contains reference to certain financial measures (non-GAAP measures) that do not have any standardized meaning as prescribed by U.S. generally accepted accounting principles (GAAP) and therefore may not be comparable to similar measures presented by other entities. These non-GAAP measures may include Comparable Earnings, Comparable Earnings per Share, Earnings Before Interest, Taxes, Depreciation and Amortization (EBITDA), Comparable EBITDA, Adjusted EBITDA, Earnings Before Interest and Taxes (EBIT), Comparable EBIT, Distributable Cash Flow, Comparable Distributable Cash Flow, Distributable Cash Flow per Share, Comparable Distributable Cash Flow per Share, Comparable Interest Expense, Comparable Interest Income and Other, Comparable Income Tax Expense, Comparable Net Income Attributable to Non-Controlling Interests, Comparable Net Income from Equity Investments, Comparable Depreciation and Amortization, and Funds Generated from Operations. Reconciliations to the most closely related GAAP measures are included in our Quarterly Report to shareholders dated July 27, 2016 filed with Canadian securities regulators and the SEC and available at www.transcanada.com.

TransCanada Corporation (TSX/NYSE: TRP)
One of North America’s Largest Natural Gas Pipeline Networks
• Operating 90,300 kms (56,100 miles) of pipelines
• Transports more than 25 per cent of continental demand
North America’s Largest Natural Gas Storage Operator
• More than 664 Bcf of capacity
Canada’s Largest Private Sector Power Generator
• 17 power facilities, 10,500 MW
• Diversified portfolio, including wind, hydro, nuclear, solar and natural gas
Premier Liquids Pipeline System
• Keystone Pipeline System: 4,300 km (2,700 miles), 545,000 bbl/d contracted capacity
• Safely delivered more than 1.3 billion barrels of Canadian oil to U.S. markets since 2010
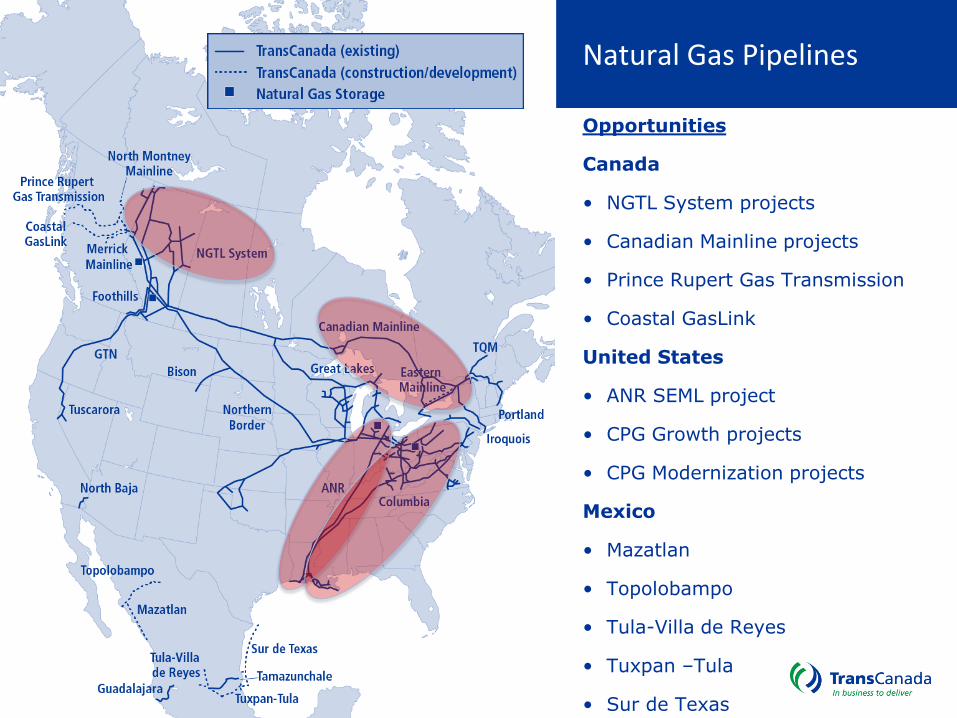
Natural Gas Pipelines
Opportunities
Canada
• NGTL System projects
• Canadian Mainline projects
• Prince Rupert Gas Transmission
• Coastal GasLink
United States
• ANR SEML project
• CPG Growth projects
• CPG Modernization projects
Mexico
• Mazatlan
• Topolobampo
• Tula-Villa de Reyes
• Tuxpan –Tula
• Sur de Texas

Liquids Pipelines
Opportunities
Canada
• Northern Courier
• Grand Rapids
• Energy East
• Heartland and TC Terminal
• Upland
United States
• Houston Lateral and Terminal
• Cushing Marketlink Receipt Facility
• Keystone XL

Committed to Responsible Development
• Safely delivering energy to meet North American demand in an economically, environmentally and socially responsible manner
• Receives recognition for Corporate Social Responsibility efforts from third-party investment rating agencies
• Visit csrreport.transcanada.com to learn more about our corporate social responsibility practices

Committed to Safety
• Top industry safety record
• Strive for zero safety incidents
• Investing heavily in research and development to enhance safety, integrity and quality of assets and improve standards industry-wide
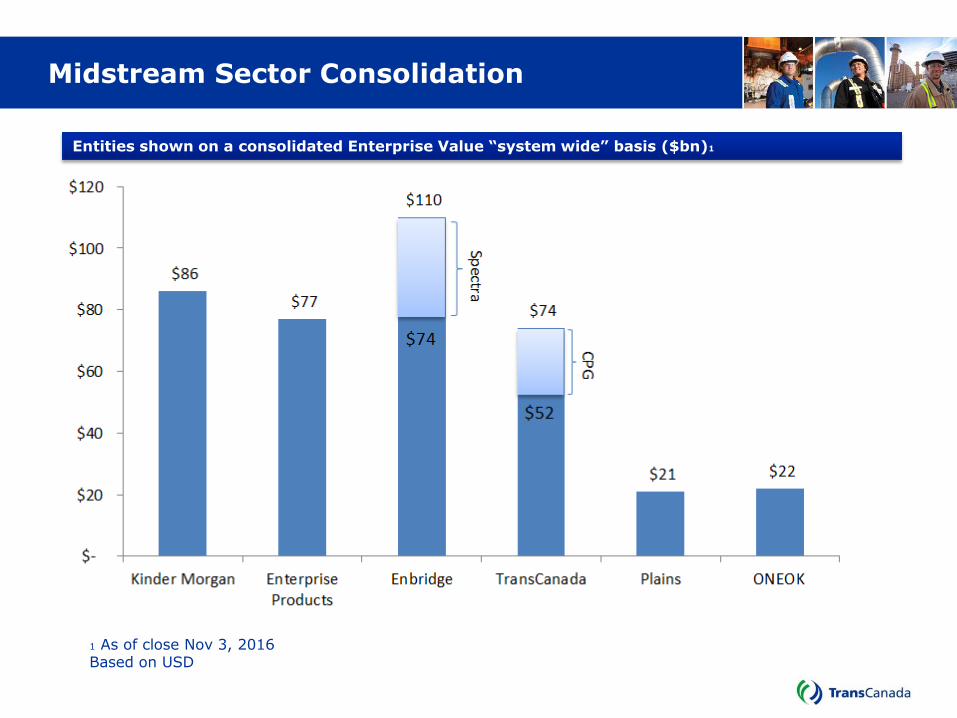
Midstream Sector Consolidation
Entities shown on a consolidated Enterprise Value “system wide” basis ($bn)1
1 As of close Nov 3, 2016 Based on USD

The MPL/Yield-Co Business Model is Being Questioned
“The model is now being questioned by investors. With double-digit yields, the ability for some MPLs to access the equity market on economic terms is impaired – at least for now” “Does the precedent cut of Kinder Morgan lead to many more dividend reductions or a trend toward much reduces dependence on capital markets (means much lower section distribution growth)” “Dividend and distribution cuts have become potential reality, which bags the question of, how do you value them?”
Acquisition Opportunities in Midstream and Power/Yield-Co Sectors

Well Positioned for Growing Equity Investor Risk Aversion
2
1 3
4 5
Market Shockwaves
WTI trades below US$40
Energy Transfer announces acquisition of Williams
Kinder Morgan lowers dividend growth guidance to 6-10% from 10%
Moody’s downgrades Kinder Morgan after it announces acquisition of majority interest in NGPL
5 1
2
3
4
TRP extends 8-10%annual dividend growth rate through 2020
TRP announces NCIB & private agreement to buy back up to 6.6 million shares

Strategic Rationale for Acquisition of Columbia Pipeline
• TransCanada to acquire Columbia Pipeline Group, Inc. (CPGX or Columbia) for US$25.50 per CPGX share in an all-cash deal
• Acquisition creates one of North America’s largest regulated natural gas transmission businesses
• Expected to be accretive to earnings per share in the first full year of ownership
• Premium natural gas pipeline and storage assets
• Extensive position in Marcellus and Utica basins
• FERC regulated assets generate stable and predictable earnings and cash flow
• US$7.3 billion portfolio of growth initiatives and modernization investments
• Complements our existing regulated natural gas pipeline and storage assets
• Long-term, fee-based contracts
• Diversified customer base
• Adds to basin diversification and access to large markets
Illustrates the configuration of material pipeline systems and
projects within TransCanada’s natural gas pipeline network
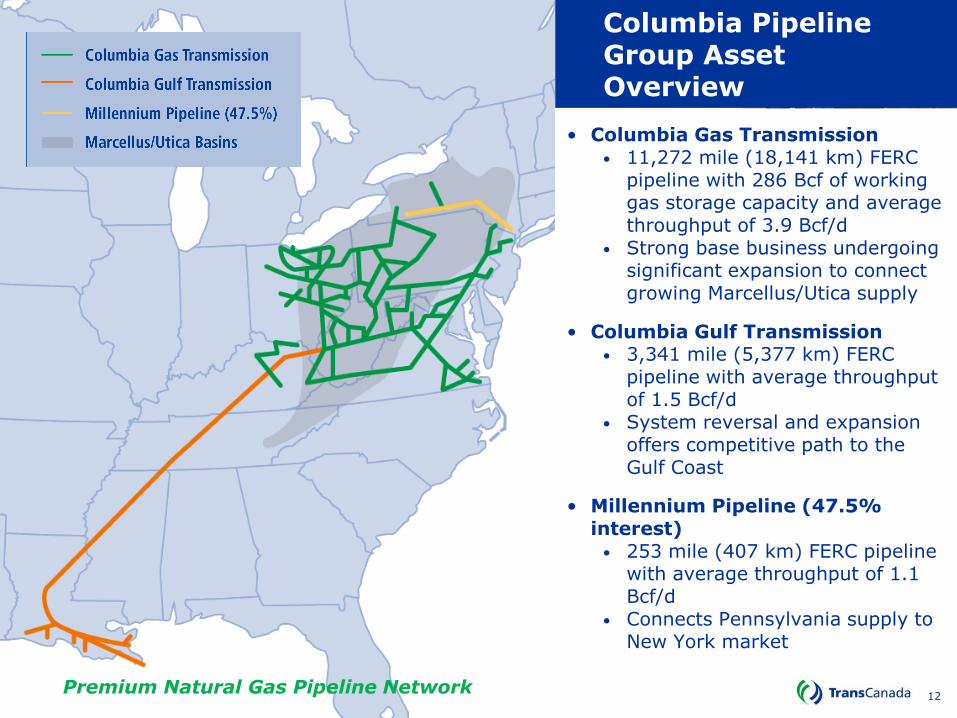
Columbia Pipeline Group Asset Overview
• Columbia Gas Transmission • 11,272 mile (18,141 km) FERC
pipeline with 286 Bcf of working gas storage capacity and average throughput of 3.9 Bcf/d
• Strong base business undergoing significant expansion to connect growing Marcellus/Utica supply
• Columbia Gulf Transmission • 3,341 mile (5,377 km) FERC
pipeline with average throughput of 1.5 Bcf/d
• System reversal and expansion offers competitive path to the Gulf Coast
• Millennium Pipeline (47.5% interest)
• 253 mile (407 km) FERC pipeline with average throughput of 1.1 Bcf/d
• Connects Pennsylvania supply to New York market
Premium Natural Gas Pipeline Network 12

13
CPG Acquisition - Timeline
Q1 2016 Q2 2016 Q3 2016
January – Inception • Negotiations
commenced between TransCanada and CPG
Mid-January to February • 40 day Due Diligence
March 17- Offer • TransCanada
announced merger agreement and purchase plans to acquire CPG
July 1- Closing • TransCanada
announced the completion of the transaction to acquire CPG for US$13 Billion
June 22 • Acquisition of CPG
receives stockholder support
May 16/17 • CFIUS clearance • Early termination of
waiting period under the HSR Act

1
Engage And Develop
Our Team
2
Strengthen Our Execution
Focus
3
Deepen Our Growth
Inventory
4
Enhance The Customer
Experience
Deliver
Results
CPG Integration Priorities

15
Engage & Develop our Team
•Realize integration synergies •Develop & implement our tactical plan •Sustainable, repeatable processes •Engage in Business Transformation
•Align our common values •Become a nimble, results-oriented organization •Consistently set and then meet or exceed expectations •Understand our role as part of the larger TransCanada family
•Attract and retain talent •Identify and mentor high performers •Further build bench strength and depth •Expand business acumen across the organization Build a Common Culture & Identity
Continue to Develop Our Team
Execute Transformative Change
Build
Develop
Execute
Deliver

Integration Resourcing Roadmap
On Track
BY JULY 1, 2016 Vice-President Level Organization Structure and Leadership Announced
BY JULY 29, 2016 Director-Level Organization Structure and Leadership Announced
BY SEPT 30, 2016 Organizational Changes and Personal Impacts Communicated at All Levels
BY MID-2017 Business Optimization completed
12 Day one 30 Days 100 days 12 months

17
Integration – HR, IS, Supply Chain & COE
Q4 2016 Q1 2017 Q2 2017 Q3-4 2017
FEB-APRIL SAP TRAINING
APRIL 3 SAP GO-LIVE
March to April • All TC HR practices and HR
policies take effect • SCM System integration : MRC
Global, Fieldglass • Assignment of ASL • Vendor, Supplier and Material
Master Data integration
BY DEC 31, 2016 • Plan for HR programs,
policies and practices communicated
• Technical COE priorities identified, plans approved
• Email roll-out complete
End of 2017 • COE
Implementation completed
• All Total TC rewards programs in place

Historical Issues facing the Industry
18
• Environmental interest in our industry is not new
• Opponents capitalized on three major events
1. Deepwater Horizon oil spill
2. Enbridge’s Kalamazoo oil spill
3. San Bruno explosion
• Fear and concern about the energy industry is now at the forefront
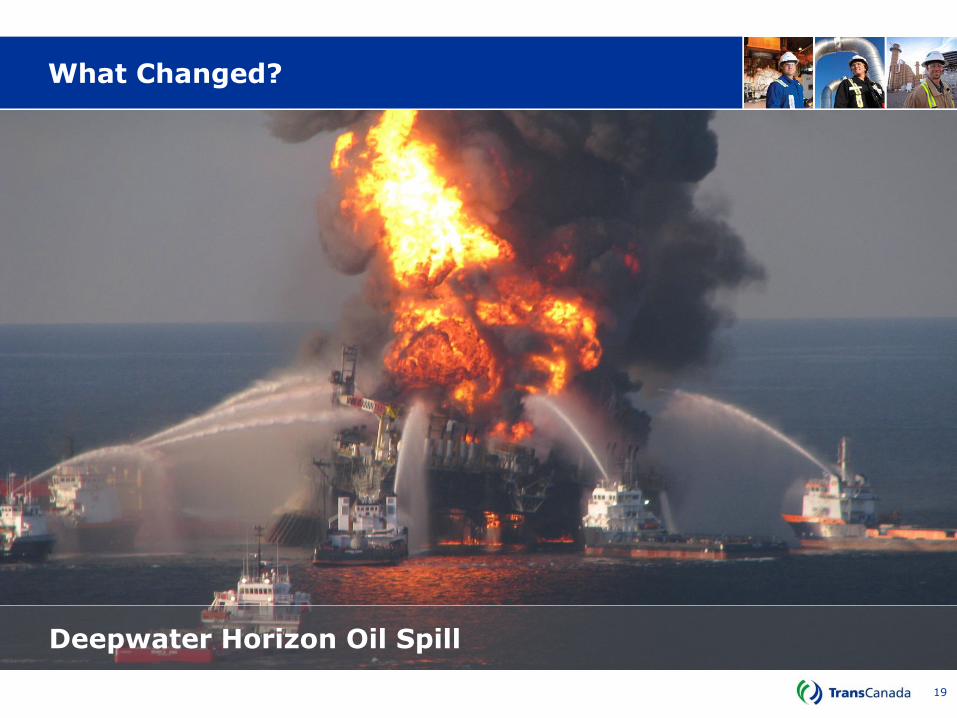
What Changed?
19
Deepwater Horizon Oil Spill

What Changed?
20
Kalamazoo Oil Spill

What Changed?
21
San Bruno Explosion

ENGO Activism
22
Source: Rockefeller Brothers Fund – The Tar Sands Campaign

Misguided Protest
23
Regulatory, Permitting Timelines & Costs Rising
Lack Of Deadline For Action
Increasing Risk Activists Have Learned That Delay = Denial

Dakota Access Pipeline Protest

Legitimate Concern
25
• Is the public’s concern legitimate? Absolutely!
• Our industry is committed to protecting the environment
• Doing everything possible to ensure these events don’t occur
• TransCanada has a goal of achieving zero incident rates
• Investing billions of dollars in new technology and processes to make these
systems as safe as possible
• Since 2001, liquid pipeline-related incidents have decreased by 62%

26
Calgary Herald Cartoon
THE MEDIA
?

Global Energy Demand
27
Global Energy Demand by Fuel (million tones of oil equivalent)
Source: IEA World Energy Outlook 2015, New Policies Case
0
1
2
3
4
5
6
Oil Coal Gas Bioenergy Nuclear Hydro Renewables
2040
2013
28
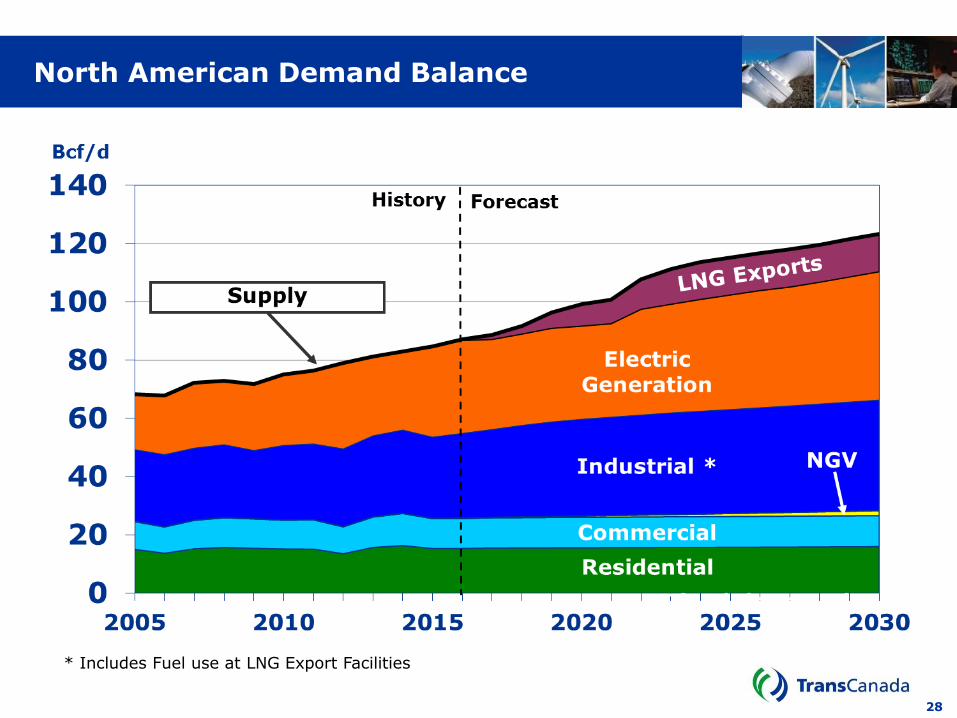
North American Demand Balance
* Includes Fuel use at LNG Export Facilities

North America’s Energy Infrastructure Requirements
29
$- $2 $4 $6 $8 $10 $12
North America
Europe
Pacific
Eastern Europe
Developing Asia
Middle East
Africa
Latin America
Inter-Regional Transport
Trillion
Coal
Oil
Gas
Power
Biofuels
Source: IEA World Energy Outlook 2012

Questions
30