Embed Size (px)
Citation preview

1
Does Diversification Benefit Health Insurers?
Bo Shi
Assistant Professor of Finance
Department of Accounting, Economics & Finance
Morehead State University, Combs 316
Morehead, Kentucky 40351
(606) 783-2475
Dr. Etti G. Baranoff, FLMI
Associate Professor of Insurance and Finance
Department of Finance, Insurance and Real Estate
School of Business
Virginia Commonwealth University
Snead Hall,
301 West Main Str., Suite B4167
Richmond VA 23284-4000
Tel: 804-828-3187, Fax: 804-828-3972
Cell: 512-750-6782
www.professorofinsurance.com
[email protected] or [email protected]
&
Research Director, Insurance and Finance
The Geneva Association
Dr. Dalit Baranoff
Post-Doctoral Fellow
Johns Hopkins Institute for Applied Economics,
Global Health and the Study of Business Enterprise.
(301)949-2590
Thomas W. Sager
Professor of Statistics
Department of Information, Risk, and Operations Management
The University of Texas at Austin, CBA 5.202
Austin, Texas 78712-1175
(512) 471-3322
2
Does Diversification Benefit Health Insurers?
Abstract
This paper is a study of the effects of economies of scope and scale on the financial
performance of U.S. health insurers from 2001-2011. In the finance literature, there has been
considerable debate about the effects of scope (i.e., diversification) on firm performance in
various industries, but there has been no previous study of health insurers. We proxy scope by
two Herfindahl measures of diversification: by insured populations (individual comprehensive,
group comprehensive, federal comprehensive, Medicare, and Medicaid) and by geography (50
States and the District of Columbia). We assess insurer performance by return on total assets
and return on capital as well as by risk adjusted return on assets and capital. In the presence of
appropriate controls, we find that small insurers benefit from population diversification, but not
from geographic diversification. For large insurers, the opposite results obtain. In addition,
reductions in volatility of return on assets and capital are associated with population
diversification for large insurers. Given the expansion of scope imposed by the Patient
Protection and Affordable Care Act (ACA), especially of Medicaid and individual
comprehensive insurance, we expect that these results will be of interest to both insurers and
regulators.
3
Does Diversification Benefit Health Insurers?
I. Introduction
In this study we explore the effects of population mix and geographical diversification on the
performance of U.S. health insurers during 2001-2011. We investigate both economies of
scope, and of scale within an industry currently undergoing massive changes due to The Patient
Protection and Affordable Care Act (ACA) of 2010. In recent months we have also witnessed a
major shift towards large mergers and acquisitions in the U.S. health insurance industry. This
study considers the potential implication of such consolidation in relation to the ACA and
within the larger body of research in economies of scale and scope.
In their endless pursuit of greater value and returns corporations undergo a constant churning
process, shifting from one strategy to another—leading to periodic waves of conglomeration,
followed by divestitures and concentration on core business, and then, inevitably back to
expansion. Business historians can trace this process back to the late 19th
century and the
emergence of the first “big business” firms, the large industrial concerns that gained an
advantage through vertical integration and horizontal expansion. (Chandler, 1977, 1990).
By the early twentieth century, many capital-intensive industries were dominated by a few
oligopolistic firms. Through the 1910s however, most large firms concentrated on a single
industry. This began to change during the 1920s as firms began to diversify—primarily into
related product areas where they already had some expertise—allowing them to achieve greater
economies of scope. As they searched for additional growth areas, many U.S. firms also
expanded internationally. After World War II, this quest for growth led corporations to further
diversify—this time into unrelated industries and products. (Chandler, 1977, 1990).
Historically, corporate diversification has been a growth strategy that inevitably peaks and then
reverses itself. The conglomerate wave of the 1960s was followed by a renewed focus on core
business during the divestitures of the 1980s. The current trend of health insurance mergers
indicates that in today’s health insurance market, diversification is considered a growth
strategy. Media coverage of recent health insurance mergers (and attempted mergers) draws a
clear connection between the ACA and insurance industry consolidation. In the June 23, 2015
New York Times, Andrew Sorkin wrote:
“All of this deal-making is largely the result of the Affordable Care Act, which in effect
constrains the amount of profit hospitals and insurers can generate, leading both to seek
additional scale in hopes of generating higher margins by squeezing additional savings out of
a broader customer base.”1
A July 3, 2015 Wall Street Journal article, announcing the merger of Aetna and Humana,
explained the consolidation trend as “being fed by a desire to diversify and cut costs, amid a
landscape changed by the Affordable Care Act. Insurers are eager to reduce expenses and
1 Sorkin, Andrew Ross, “Health Care Law Spurs Merger Talks for Insurers,” New York Times, June 23, 2015
4
build scale that will help them face off against health-care providers that are bulking up.”2 The
Aetna-Humana merger is driven by Aetna’s desire to expand (and diversify) into the rapidly
growing Medicare Advantage market, where Humana is currently the second-largest insurer. A
combined Aetna-Humana would be the market leader.
While diversification is driving the current merger trend in the health insurance industry, no
scholar has yet studied the effects this diversification might have on the performance of health
insurers themselves.3 A larger body of research does exist on diversification in other industries.
It is part of a broad literature on economies of scope and scale, covering many industries and
countries, and representing the perspectives of several academic fields, ranging from strategic
management to financial economics. While we cannot cover all aspects of this vast scholarship,
we review some of the more significant work on diversification and firm value in the literature
review (section II). These studies, however, provide little consensus on whether diversification
is beneficial for either performance or risk reduction.
As our focus is on the health insurance industry, the literature review also provides more
comprehensive summaries of studies looking at diversification in the insurance industry. But,
most of this scholarship focuses on property and liability insurance or the insurance industry
more generally. No one has yet explored the effects of diversification on health insurance firms.
This study not only fills this gap, but also contributes to the larger discussions of both
diversification and the health insurance industry in the U.S.
While the term “diversification” can have a variety of meanings, the economic and finance
literature we review here focuses primarily on two types of diversification, product
diversification and geographic diversification. In studies of insurance firms, the term “product
diversification” usually refers to diversification into different lines of insurance, such as auto,
homeowners, etc. For product diversification, our study, however, looks at a single line—health
insurance. In this case, firms diversify not by expanding into other lines, but by offering health
insurance coverage to different populations—or what we call “population diversification.” Our
study also looks at geographical diversification across the states.
To quantify insurers’ product underwriting exposure, we use the total premium written scaled
by an insurer’s total assets, ProdExposure, as an exposure-based proxy. Since we focus on
insurers specialized in comprehensive coverage (Individual Comprehensive, Group
Comprehensive, FEHBPs, Medicare, and Medicaid) in our study, the total premium written
refers to these five products only.
In this study we hypothesize that both economy of scope (diversification both by population
and geography) and scale (size) are related positively to health insurers’ performance. We also
2 Hoffman, Liz, Dana Mattioli and Anna Wilde Mathews “Aetna Agrees to Buy Humana for $34.1 Billion” By Liz
Hoffman,” Wall Street Journal July 3, 2015 http://www.wsj.com/articles/aetna-nears-deal-to-buy-humana-
1435883861 3 Related literature on consolidation in the health insurance industry focuses on the effects on consumers. Most of
these studies find that the fewer insurers in a market the higher premiums they are able to charge. Whether this
relationship persists under the ACA remains to be seen. With insurer profits capped under the ACA, better
performance by insurers may even translate into lower premiums. For more details on the health insurance
consolidation literature see the literature review (section II).
5
hypothesize that the volatility of performance is lowered for greater diversification of both
types.
We use the National Association of Insurance Commissioners (NAIC) health insurers’ annual
filing data from 2001 to 2011. Detailed data is available for Comprehensive coverage for
individuals and groups in the workforce (as one group of working population), comprehensive
coverage for Federal Employee Health Benefit Plans (FEHBPs), and coverage for the
Medicare, and Medicaid populations’ health insurance.4 Differences among the populations are
the basis for diversification since health insurance products exhibit similarities in coverage,
methods of utilization review and managed care networks and systems. These differences are
along income levels (Medicaid), working status (comprehensive for all working people), age
(Medicare) and working for the federal government. Because of the population differences, the
reimbursement methods are different leading to the diversification and as we hypothesize to
economies of scope in health insurance. Our study uses performance measures to examine the
effect of economies of diversification (by population and geography). Performance is proxied
by return on assets (ROA), risk adjusted return on assets (RAROA), return on capital (ROC)
and risk adjusted return on capital (RAROC).
We hypothesize that the geographic diversification is probably less important since “people are
people” no matter where they are. There may be pockets of more illness in the country where
only large health insurers may be exposed to these greater risks. But, the risk pooling may
mitigate the levels of exposure to sickness.5 For these health insurers, geographic
diversification may be an added value to the insurer in reducing the overall risk of the health
insurance coverage to a larger pool of patients.
Using regression analysis with fixed effects for performance as the dependent variable with
diversification and many regular control variables as the independent variables, our results
show:
1. The performance of small health insurers is positively related to the population
diversification. We can see that the population diversification actually benefits small
insurers in terms of ROA and RAROA. It is interesting to see that the population
diversification helped small insurers improve performance during the crisis years.
2. The performance of large health insurers is positively related to the geographic
diversification level – as hypothesized. The geographic diversification benefits large
insurers in terms of ROA and ROC. And the geographic diversification is associated
with improved large insurers’ performance during the crisis years.
3. The population diversification reduces large health insurers’ performance volatility. And
population diversification helps large insurers reduce the performance volatility,
consistent with our risk-reduction hypothesis.
We see strong evidence for economies of scale. Larger insurers do perform better than small
insurers after controlling for the other covariates. Controlling for the size effect, we find
5 See map of differences in Medicare Reimbursement at:
http://www.dartmouthatlas.org/data/topic/topic.aspx?cat=21
6
support for economies of scope. Consistent with the basic statistics in Table 2 and figures 3-8
and with our observations in Section 5, health insurers with higher level of population
diversification perform better than specialized insurers.
These results can inform managers and regulators about the current merger and acquisition
activities in the health insurance industry in the aftermath of PPACA. Evidence that
diversification in health insurance helps in performance, movement toward M&A that increases
diversification can be helpful to the performance and thus indirectly benefit the systemic when
the financial intermediaries (see Figures 1 and 2) are healthier.
The paper is organized as follows: Section 2 provides a literature review and the hypotheses to
be tested. Section 3 describes the data and the proxies. Section 4 provides the methodology and
simple analyses. Section 5 describes the results of the models that test the hypotheses. Section 6
concludes the paper with implications.
Section 2. Literature Review and Hypotheses in Relation to Health Insurers
In this section, we begin by explaining the dual role of health insurers in the U.S. healthcare
delivery system—where they act as both financial intermediaries and healthcare service
managers. Next we review the literature regarding economies of scope and scale, focusing on the
relationship between diversification and performance, and the relationship between
diversification and firm risk. Finally, adapting this literature to the health insurance industry, we
pose three hypotheses.
Health insurance system in the U.S. before and after the ACA
The Patient Protection and Affordable Care Act (ACA) of 2010 has led to a major restructuring
of the U.S. healthcare system. As the financial intermediaries in this system, health insurers also
face significant change, most notably in the makeup/demographics of the insured population.
Two provisions of the ACA, Medicaid expansion and the requirement that all American’s carry
health insurance (the individual mandate) have altered the insurance industry’s customer base.
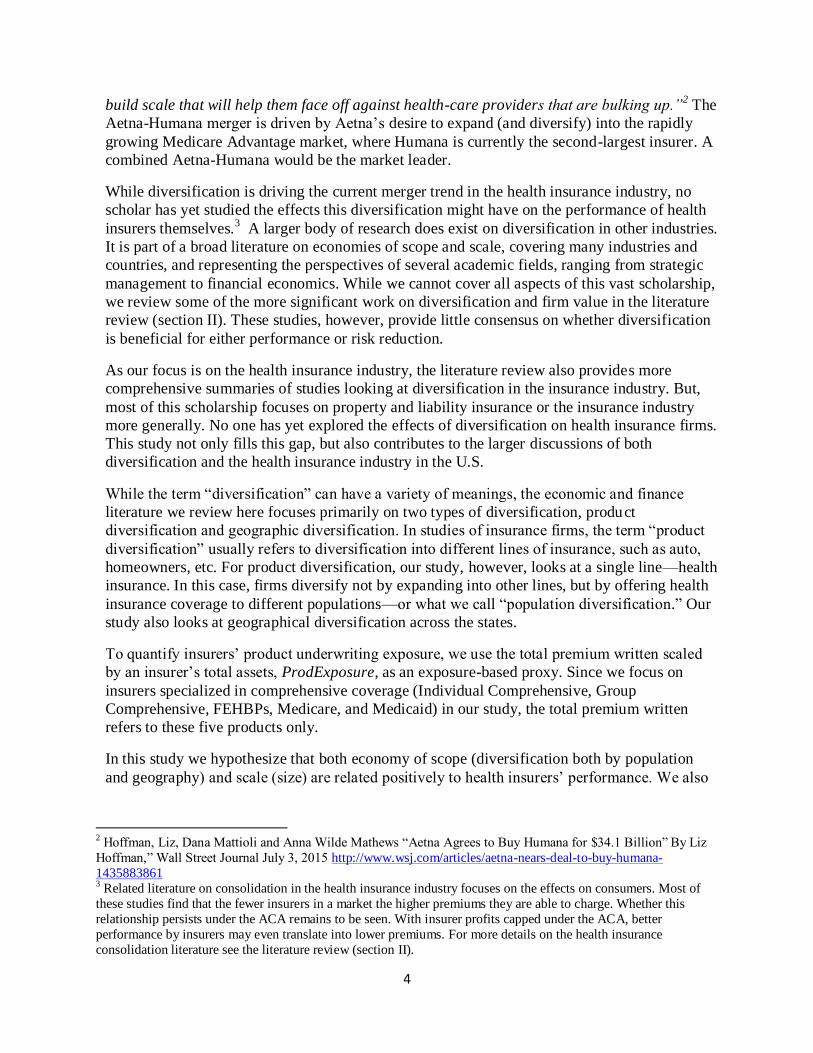
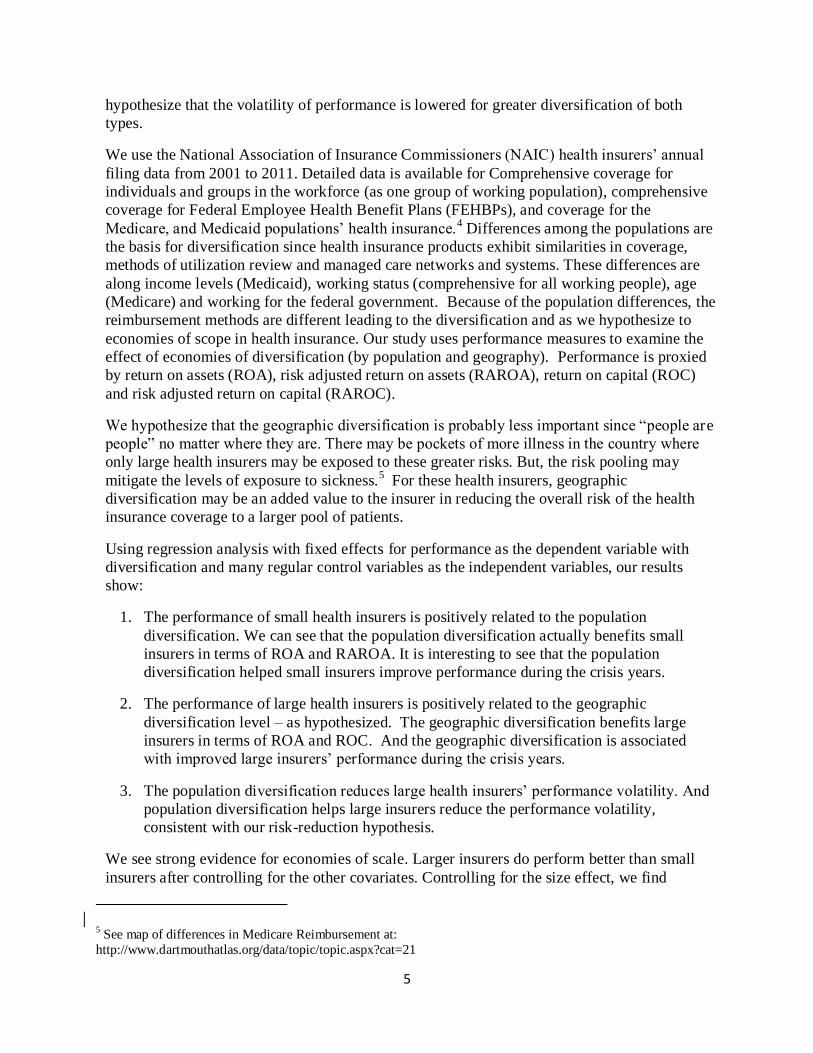
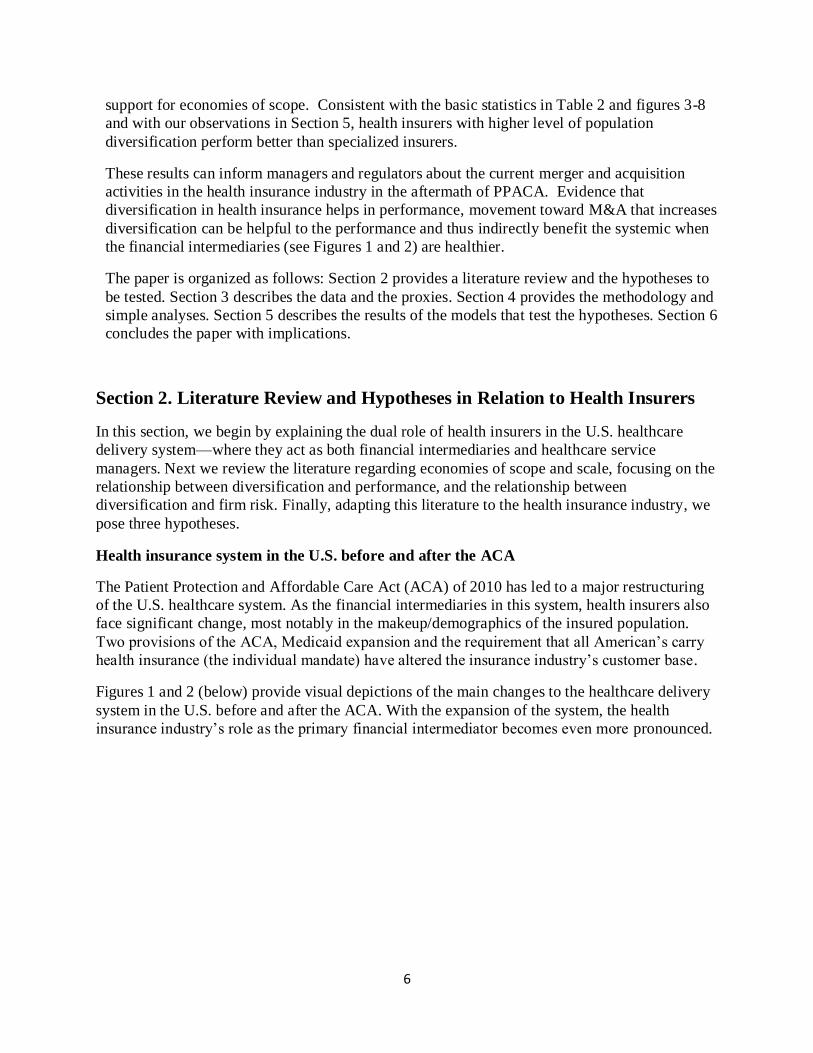
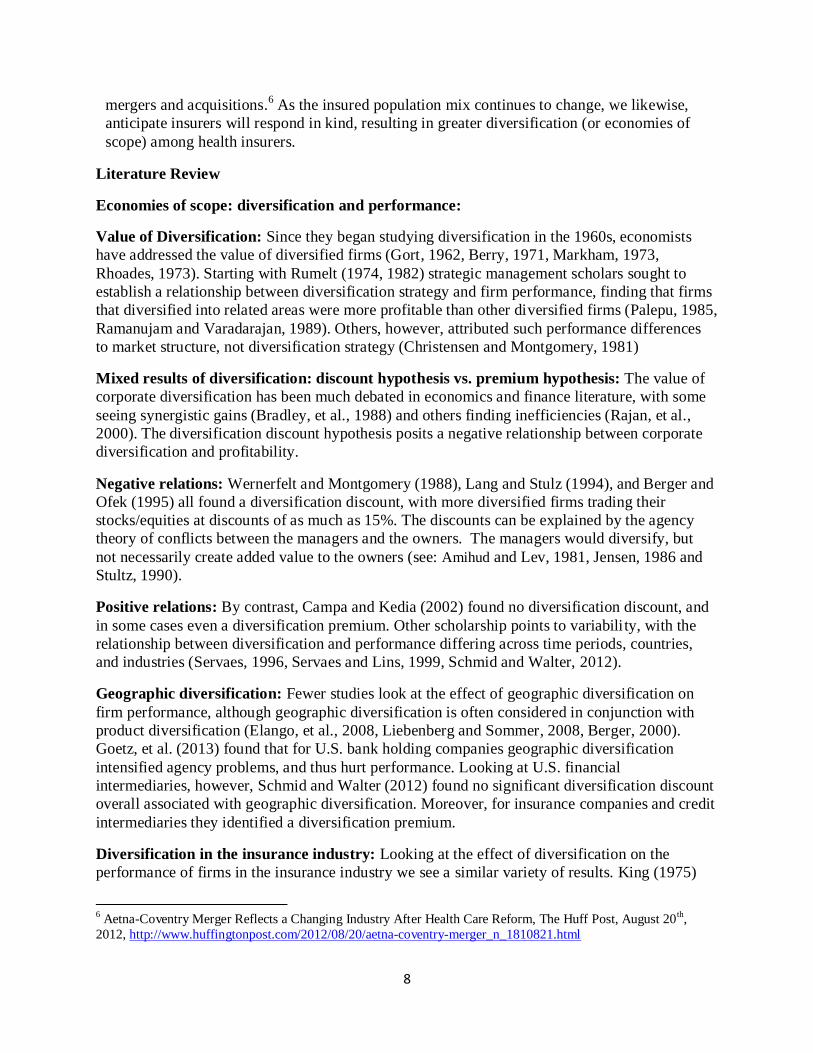
Figures 1 and 2 (below) provide visual depictions of the main changes to the healthcare delivery
system in the U.S. before and after the ACA. With the expansion of the system, the health
insurance industry’s role as the primary financial intermediator becomes even more pronounced.

7
Source: Figures 1 and 2 were developed for a presentation at a Town Hall Meeting on PPACA, held at the VCU
School of Business in April 2010.
In response to the changing population mix, insurers have begun to target certain growth areas,
such as Medicare and Medicaid, with insurers looking to strengthen these businesses through
Figure 1 - Health Care Delivery System Before The Patient Protection Act of 2010
Minimal or no Federal Regulation
State RegulationFinancial oversight,
Consumer Protection and Guarantee Funds
Health Care Providers
Consumers[via employers and individuals]
No Managed Care
Consumers
[Not in the system]
Insurers=Financial Intermediaries
Managed Care
Figure 2 - Health Care Delivery System With Patient Protection and Affordable Care Act of 2010
Federal Regulatory Oversight
State Regulation
States Exchanges
States Exchanges
Insurers=Financial Intermediaries
Managed Care
Health Care Providers
Federal High Risk Pool
Federal High Risk Pool
All Consumers[via employers and individuals]
8
mergers and acquisitions.6 As the insured population mix continues to change, we likewise,
anticipate insurers will respond in kind, resulting in greater diversification (or economies of
scope) among health insurers.
Literature Review
Economies of scope: diversification and performance:
Value of Diversification: Since they began studying diversification in the 1960s, economists
have addressed the value of diversified firms (Gort, 1962, Berry, 1971, Markham, 1973,
Rhoades, 1973). Starting with Rumelt (1974, 1982) strategic management scholars sought to
establish a relationship between diversification strategy and firm performance, finding that firms
that diversified into related areas were more profitable than other diversified firms (Palepu, 1985,
Ramanujam and Varadarajan, 1989). Others, however, attributed such performance differences
to market structure, not diversification strategy (Christensen and Montgomery, 1981)
Mixed results of diversification: discount hypothesis vs. premium hypothesis: The value of
corporate diversification has been much debated in economics and finance literature, with some
seeing synergistic gains (Bradley, et al., 1988) and others finding inefficiencies (Rajan, et al.,
2000). The diversification discount hypothesis posits a negative relationship between corporate
diversification and profitability.
Negative relations: Wernerfelt and Montgomery (1988), Lang and Stulz (1994), and Berger and
Ofek (1995) all found a diversification discount, with more diversified firms trading their
stocks/equities at discounts of as much as 15%. The discounts can be explained by the agency
theory of conflicts between the managers and the owners. The managers would diversify, but
not necessarily create added value to the owners (see: Amihud and Lev, 1981, Jensen, 1986 and
Stultz, 1990).
Positive relations: By contrast, Campa and Kedia (2002) found no diversification discount, and
in some cases even a diversification premium. Other scholarship points to variability, with the
relationship between diversification and performance differing across time periods, countries,
and industries (Servaes, 1996, Servaes and Lins, 1999, Schmid and Walter, 2012).
Geographic diversification: Fewer studies look at the effect of geographic diversification on
firm performance, although geographic diversification is often considered in conjunction with
product diversification (Elango, et al., 2008, Liebenberg and Sommer, 2008, Berger, 2000).
Goetz, et al. (2013) found that for U.S. bank holding companies geographic diversification
intensified agency problems, and thus hurt performance. Looking at U.S. financial
intermediaries, however, Schmid and Walter (2012) found no significant diversification discount
overall associated with geographic diversification. Moreover, for insurance companies and credit
intermediaries they identified a diversification premium.
Diversification in the insurance industry: Looking at the effect of diversification on the
performance of firms in the insurance industry we see a similar variety of results. King (1975)
6 Aetna-Coventry Merger Reflects a Changing Industry After Health Care Reform, The Huff Post, August 20
th,
2012, http://www.huffingtonpost.com/2012/08/20/aetna-coventry-merger_n_1810821.html
9
established a relationship between market performance and diversification in property and
liability insurance firms. Fiegenbaum and Thomas (1990) found greater returns for insurers that
diversified across product lines, compared to firms that concentrated on either life or property
lines. Tombs and Hoyt (1994) also saw a positive relationship between product diversification
and profitability of insurers. Liebenberg and Sommers (2008), however, found the opposite—
that property and liability insurers which diversified across lines, performed more poorly than
those who did not, results which were confirmed by Cummins, et al. (2010) for both P-L and
Life insurers. They concluded that strategic focus was superior to conglomeration in the
insurance industry. A more complex picture, however, emerges from Elango, et al. (2008), who
found that for P-L firms, “product diversification shares a complex and nonlinear relationship
with firm performance” and that the positive effects of product diversification were related to a
firm’s level of geographic diversification. None of the literature, however, looks at health
insurance industry exclusively, and no studies exist on diversification solely within the health
insurance industry.
Economies of scope and scale for the health insurance industry in the US
The diversification proxies for economies of scope in our study are based on population and
geography as will be further explained in the data section. The difference among the population
is emphasized since health insurance products exhibit differences in relationship to customer
base.
For the health insurance industry, geographical diversification may expose the insurers to greater
variation in medical cost. Using the Dartmouth Medicare map of the U.S.,7 we can see that in
some areas, the cost of medical care is much larger than in others. On the other hand, the pooling
is larger, allowing reduction of the risks.
The study uses performance measures explained in the data section to examine the impact of the
scope economies (by population and geography).
We test two hypotheses using population diversification and geographic diversification because
economies of scale provide firms with more accesses to capital, lower cost of financing, and
stronger market power, which results in better performance. Thus,
Hypothesis 1 states: Diversification (both population-wise and geography-wise) is expected to be
positively related to performance.
Relations between diversification and variability in performance: The relationship between
diversification and firm performance is only half the story. The connection between
diversification and risk-reduction is another area of scholarly interest. Risk reduction is often
cited as a motivation for a firm’s diversification strategy (Amihud and Lev, 1981). Bettis (1981,
1982, 1985) sought to demonstrate a link between diversification and volatility while Bowman
(1980) countered that firms could simultaneously increase profitability and reduce risk through
diversification. Testing “Bowman’s paradox,” Fiegenbaum and Thomas (1986) found mixed
results. More recently, Berger, et al., (2010) also had inconclusive results when they looked at
the risk-diversification for Russian banks. Hoyt and Trieschmann (1991) found that more
diversified firms had lower returns and higher risk when firms operate in only one insurance
7 http://www.dartmouthatlas.org/data/topic/topic.aspx?cat=21

10
market rather than many. Tombs and Hoyt (1994) found significant negative results for P-L
insurers. But Berry-Stoltz et al. (2012), who also looked at P-L insurance, found little
relationship between diversification and risk.
Similarly, for health insurers, we pose
Hypothesis 2 states: Diversification (both population-wise and geography-wise) is expected to be
negatively related to performance variability.
Diversification and Economies of Scale: Economy of scale can be realized when a firm
becomes the dominant supplier in a geographic or product market. The impact of firm size is
studied intensively in the finance and economics literature. Due to less cost of asymmetric
information, large firms may have more access to capital with lower cost of financing (Slovin, et
al., 1992, Berger and Udell, 1995, and Beck and Demirguc-Kunt, 2006). Moreover, large firms
may possess stronger market power (Bain, 1951 and Barla, 2000).
In health insurance: Larger health insurers pool larger customer basis and can enjoy the effects
of the law of large numbers (Baranoff, Brockett and Kahanee,2009). Usually, large health
insurers maintain bigger healthcare provider networks, which enable health insurers to navigate
patients more efficiently on their physician networks and to improve performance. Both
Sorensen (2003) and Wu (2009) identified health insurers’ ability to channel patients among
hospitals on their network. Also, health insurers with large insureds base may possess strong
bargaining power in negotiation with hospitals for a lower price per unit of healthcare services
(Sorensen, 2003 and Wu, 2009). Thus,
Hypothesis 3 states: Greater positive relation between diversification and performance is
expected for larger health insurers.
Section 3. Data
Our dataset was extracted from the annual statements filed with the National Association of
Insurance Commissioners (NAIC) for 2001 – 2011 by U.S. insurers filing in the Health
category. We focus on insurers that generate the majority of their business from underwriting
health insurance in four categories: comprehensive coverage for individuals and groups in the
workforce (Comprehensive), comprehensive coverage for Federal Employee Health Benefit
Plans (FEHBPs), and coverage for the Medicare, and Medicaid populations. Health insurer
filings for 2001 – 2011 provide 9,060 firm-years of data.
For each insurer, we calculate the ratio of the sum of premium income from Comprehensive,
FEHBPs, Medicare, and Medicaid to the total premium income of the company. If the ratio is
greater than 70%, we retain the insurers in our sample.8 In addition, we apply two criteria in the
sample selection. First, insurers have to file continuously. We omit insurers with one or more
years’ gap in filing. Second, we focus on insurers with at least four years of continuous filings
in order to apply various returns and return volatilities calculation. The sample selection ensures
8 70% follows Baranoff, Sager and Witt (1999) and indicates a strong focus on health insurance. So by business
strategy, such focused insurers may be expected to behave consistently as health insurers.
11
that we focus on stable survivors in the health insurance industry for the study of the
relationship between population diversification and performance. We end up with 4,551 firm-
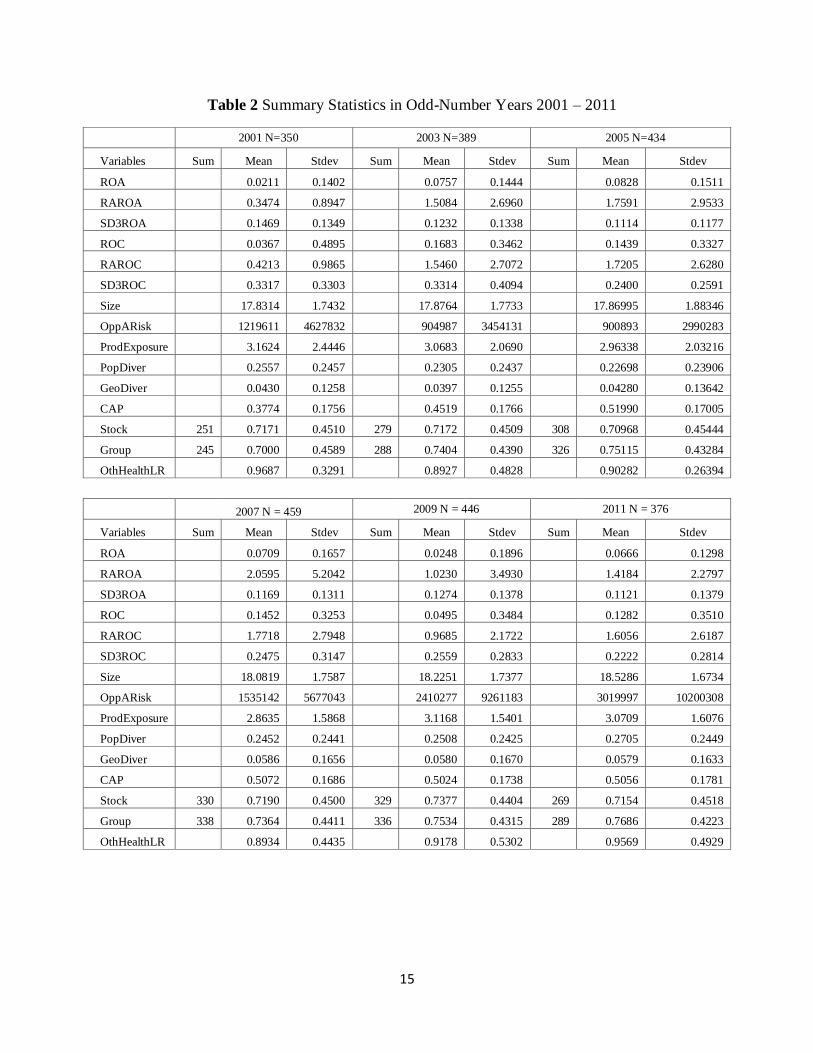
years. The definitions of variables used in this study are provided in Table 1. The summary
statistics of these variables are provided in Table 2.
Diversification Measures
The Herfindahl-Hirschman Index (HHI) is a commonly used measure for the level of
diversification in industrial organization studies in economics. Researchers in finance and
insurance industries also employ HHI or modified versions of HHI in product line mix and
concentration research (Tombs and Hoyt, 1994, Sommer, 1996, Pottier and Sommer, 1997, and
Elango, et al., 2008). In our study, we use the primary HHI measure for the level of
product/population diversification. Following Berry (1971) and Fiegenbaum and Thomas
(1990), we define the level of population diversification as:
Pop
Pi represents the premium written for insured population i in proportion to total premium
written of all n insured populations. For each insurer in the sample, insured populations include
Individual Comprehensive, Group Comprehensive, FEHBPs, Medicare, and Medicaid
coverage.9
We also include the level of geographic diversification in our study. Health insurers’ managed
care expertise and bargaining or negotiation skills are applicable across geographic regions. In
fact, coverage of broader geographic regions may strengthen insurers’ bargaining power in
negotiating with healthcare providers for healthcare cost. In this way, operating in diversified
geographic areas can be treated as the application of economies of scope. In the meantime,
higher monitoring cost and agency problems across geographic regions may dampen the benefit
of geographic diversification.10
Therefore, the impact of the geographical diversification on the
firm performance is uncertain. However, economies of scale can to some extent alleviate the
high monitoring cost and agency problems. Thus we expect to see a positive impact of
geographic diversification on large insurers’ performance. Regarding the risk-reduction effect,
underwriting results in different geographic areas may reduce the overall return volatility or the
firm risk. However, the variation of demographics in different geographical areas may result in
more volatile underwriting results. And the risk-reduction effect of the geographical
diversification is unclear from these perspectives. We calculate the level of geographic
diversification as:
9 ProdDiver = 1 – (Individual Comprehensive Premium Written2 + Group Comprehensive Premium Written2 + FEHBPs
Premium Written2 + Medicare Premium Written2 + Medicaid Premium Written2)/(Individual Comprehensive Premium Written +
Group Comprehensive Premium Written + FEHBPs Premium Written + Medicare Premium Written + Medicaid Premium Written)2. Therefore, the minimum of the level of population diversification is 0, which means the insurer focuses on one line of
business only. The maximum of the level of population diversification is 0.8, which means that the insurer writes all five lines of
business evenly in terms of premium. The higher value of Diver means higher level of diversification. 10
Existing literature argues that operating in various geographic locations allows for greater managerial discretion, which incurs
higher monitoring cost and thus reduces financial performance (Mayers and Smith 1988 and Pottier and Sommer 1997). In their study of the banking industry, Goetz, et al. (2013) found that geographic diversification intensified the agency problem.
n
i
iPDiver1
21
12
Pi represents the premium written in state i in proportion to total premium written in all states.
Schedule T of health insurers’ annual filings to NAIC provides premium written information
allocated by states and territories. If an insurer writes policies in only one state, GeoDiver will
be 0. Thus, the more geographically diversified an insurer, the higher the level of GeoDiver
Performance Measure
We use two major types of performance measures:
1. Return on asset (ROA) and return on capital (ROC). These are commonly used financial
performance measures, which could be either book or market value-based (Amit and Livnat,
1988, Brown, Carson, and Hoyt, 2001, Lai and Limpaphayom, 2003). We calculate ROA as the
current year net income divided by the book value of total assets and ROC as the current year
net income divided by the book value of capital.
2. Risk-Adjusted ROA (RAROA) or risk adjusted ROC (RAROC). This measure
incorporates return volatility over a period of time (Browne, et al., 2000, Elango, et al., 2008,
and Berger et al., 2010).11
Randomly high or low returns result from the business activity risk-
taking and underwriting and asset portfolio investment. RAROA and RAROC remove the risk-
taking impact and focus on returns that may be related more to stable business features, such as
the diversification.
Performance variability - Volatility
We also use the volatility of ROA and ROC as proxies for insurer’s risks and examine whether
diversification reduces the firm risk under the second set of hypotheses as explained in Section
II. Following Elango, et al. (2008), we compute the standard deviation of ROA and ROC in the
past three years (SD3ROA and SD3ROC) as the volatility of ROA and ROC.
Thus, RAROA or RAROC are calculated as the current year ROA or ROC divided by SD3ROA
or SD3ROC.
Firm Size
We also test economies of scale for US health insurers. In previous diversification-performance
literature firm size is commonly used as the proxy for economies of scale. In studying scope
economies in the US insurance industry, Cummins, et al. (2010) differentiated scale versus
scope economics and used logarithm of total assets to measure firm size. Liebenberg and
Sommer (2008) also used natural logarithm of total assets and found a positive relationship
between firm size and performance in US property-liability insurance industry. In our study, we 11
Performance measures we do not use in this study are: Tobin’s q (a ratio of firm assets in relation to its market value) is a
widely used market value-based measure in the finance literature (Lang and Stultz 1994, Villalonga 2004, and Goetz and Levine 2013). Liebenberg and Sommer (2008) used Tobin’s q as the performance measure when studying the U.S. property-liability
insurance industry from 1995 – 2004. Other insurance industry studies utilize efficiency-based measures Chen, et al. (2005)
studied efficiency performance and economies of scope in the U.S. property-liability insurance industry using Data Envelopment
Analysis (DEA) and the stochastic frontier approach. Cummins, et al. (2010) used DEA to examine profit efficiency for both the U.S. life-health and property-liability insurance industries.
n
i
iPGeoDiver1
21
13
use the geometric mean of total assets, total liabilities, and total premium incomes as the proxy
for the firm size.
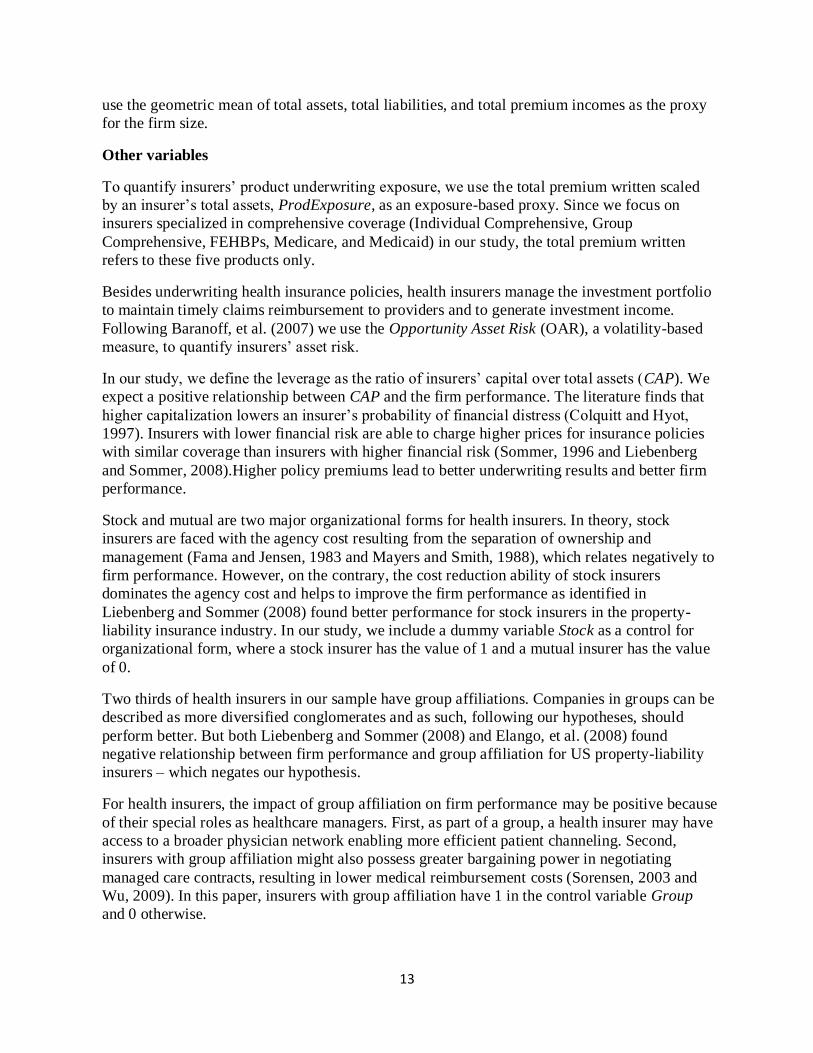
Other variables
To quantify insurers’ product underwriting exposure, we use the total premium written scaled
by an insurer’s total assets, ProdExposure, as an exposure-based proxy. Since we focus on
insurers specialized in comprehensive coverage (Individual Comprehensive, Group
Comprehensive, FEHBPs, Medicare, and Medicaid) in our study, the total premium written
refers to these five products only.
Besides underwriting health insurance policies, health insurers manage the investment portfolio
to maintain timely claims reimbursement to providers and to generate investment income.
Following Baranoff, et al. (2007) we use the Opportunity Asset Risk (OAR), a volatility-based
measure, to quantify insurers’ asset risk.
In our study, we define the leverage as the ratio of insurers’ capital over total assets (CAP). We
expect a positive relationship between CAP and the firm performance. The literature finds that
higher capitalization lowers an insurer’s probability of financial distress (Colquitt and Hyot,
1997). Insurers with lower financial risk are able to charge higher prices for insurance policies
with similar coverage than insurers with higher financial risk (Sommer, 1996 and Liebenberg
and Sommer, 2008).Higher policy premiums lead to better underwriting results and better firm
performance.
Stock and mutual are two major organizational forms for health insurers. In theory, stock
insurers are faced with the agency cost resulting from the separation of ownership and
management (Fama and Jensen, 1983 and Mayers and Smith, 1988), which relates negatively to
firm performance. However, on the contrary, the cost reduction ability of stock insurers
dominates the agency cost and helps to improve the firm performance as identified in
Liebenberg and Sommer (2008) found better performance for stock insurers in the property-
liability insurance industry. In our study, we include a dummy variable Stock as a control for
organizational form, where a stock insurer has the value of 1 and a mutual insurer has the value
of 0.
Two thirds of health insurers in our sample have group affiliations. Companies in groups can be
described as more diversified conglomerates and as such, following our hypotheses, should
perform better. But both Liebenberg and Sommer (2008) and Elango, et al. (2008) found
negative relationship between firm performance and group affiliation for US property-liability
insurers – which negates our hypothesis.
For health insurers, the impact of group affiliation on firm performance may be positive because
of their special roles as healthcare managers. First, as part of a group, a health insurer may have
access to a broader physician network enabling more efficient patient channeling. Second,
insurers with group affiliation might also possess greater bargaining power in negotiating
managed care contracts, resulting in lower medical reimbursement costs (Sorensen, 2003 and
Wu, 2009). In this paper, insurers with group affiliation have 1 in the control variable Group
and 0 otherwise.

14
The loss ratio is defined as the underwriting loss divided by the premium income.12
Even
though we focus on insurers generating a majority of premium income from Comprehensive,
FEHBPs, Medicare, and Medicaid, we control for the performance of the other products sold by
health insurers by OthHealthLR, where we calculate the total underwriting losses of all the other
health insurance products except Comprehensive, FEHBPs, Medicare, and Medicaid divided by
the corresponding premium incomes.
Table 1 Variable Definitions
Variables Definition
Dep
end
ent
ROA Net income / total assets
SD3ROA Three-year standard deviation of ROA including the current year
RAROA ROA / SD3ROA
ROC Net income / Book capital
SD3ROC Three-year standard deviation of ROC including the current year
RAROC ROC / SD3ROC
Ind
epen
den
t
Size log(Total assets*Total premiums*Total liabilities)/3
AssetRisk log(Opportunity asset risk / Total invested assets)
ProdExposure Total premium written in Comprehensive, FEHBPs, Medicare, and
Medicaid / Total Assets
PopDiver Herfindahl index of Comprehensive, FEHBPs, Medicare, and Medicaid
Premium Written
GeoDiver Herfindahl index of total premium written in Comprehensive, FEHBPs,
Medicare, and Medicaid in each state
CAP Book capital / Total Assets
Stock Organizational type (1 = Stock)
Group Group affiliation (1 = Yes)
OthHealthLR Dental, Vision, and Other health insurance weighted loss ratio
12
Total underwriting deduct information can be found on ‘Analysis of Operation by Lines of Business’ on NAIC
health insurers’ annual filing. It includes total hospital and medical related expenses, claim adjustment expenses,
administrative expenses, and increase in reserve.
15
Table 2 Summary Statistics in Odd-Number Years 2001 – 2011
2001 N=350 2003 N=389 2005 N=434
Variables Sum Mean Stdev Sum Mean Stdev Sum Mean Stdev
ROA 0.0211 0.1402 0.0757 0.1444 0.0828 0.1511
RAROA 0.3474 0.8947 1.5084 2.6960 1.7591 2.9533
SD3ROA 0.1469 0.1349 0.1232 0.1338 0.1114 0.1177
ROC 0.0367 0.4895 0.1683 0.3462 0.1439 0.3327
RAROC 0.4213 0.9865 1.5460 2.7072 1.7205 2.6280
SD3ROC 0.3317 0.3303 0.3314 0.4094 0.2400 0.2591
Size 17.8314 1.7432 17.8764 1.7733 17.86995 1.88346
OppARisk 1219611 4627832 904987 3454131 900893 2990283
ProdExposure 3.1624 2.4446 3.0683 2.0690 2.96338 2.03216
PopDiver 0.2557 0.2457 0.2305 0.2437 0.22698 0.23906
GeoDiver 0.0430 0.1258 0.0397 0.1255 0.04280 0.13642
CAP 0.3774 0.1756 0.4519 0.1766 0.51990 0.17005
Stock 251 0.7171 0.4510 279 0.7172 0.4509 308 0.70968 0.45444
Group 245 0.7000 0.4589 288 0.7404 0.4390 326 0.75115 0.43284
OthHealthLR 0.9687 0.3291 0.8927 0.4828 0.90282 0.26394
2007 N = 459 2009 N = 446 2011 N = 376
Variables Sum Mean Stdev Sum Mean Stdev Sum Mean Stdev
ROA 0.0709 0.1657 0.0248 0.1896 0.0666 0.1298
RAROA 2.0595 5.2042 1.0230 3.4930 1.4184 2.2797
SD3ROA 0.1169 0.1311 0.1274 0.1378 0.1121 0.1379
ROC 0.1452 0.3253 0.0495 0.3484 0.1282 0.3510
RAROC 1.7718 2.7948 0.9685 2.1722 1.6056 2.6187
SD3ROC 0.2475 0.3147 0.2559 0.2833 0.2222 0.2814
Size 18.0819 1.7587 18.2251 1.7377 18.5286 1.6734
OppARisk 1535142 5677043 2410277 9261183 3019997 10200308
ProdExposure 2.8635 1.5868 3.1168 1.5401 3.0709 1.6076
PopDiver 0.2452 0.2441 0.2508 0.2425 0.2705 0.2449
GeoDiver 0.0586 0.1656 0.0580 0.1670 0.0579 0.1633
CAP 0.5072 0.1686 0.5024 0.1738 0.5056 0.1781
Stock 330 0.7190 0.4500 329 0.7377 0.4404 269 0.7154 0.4518
Group 338 0.7364 0.4411 336 0.7534 0.4315 289 0.7686 0.4223
OthHealthLR 0.8934 0.4435 0.9178 0.5302 0.9569 0.4929
16
Section 4. Methodology and Preliminary Analysis
In the first part of this section, we discuss the model used to test major hypotheses and
statistical methods in the analysis. In the second part, the preliminary analysis, we present
intuitive observations by examining various summary statistics of health insurers in the sample.
Methodology
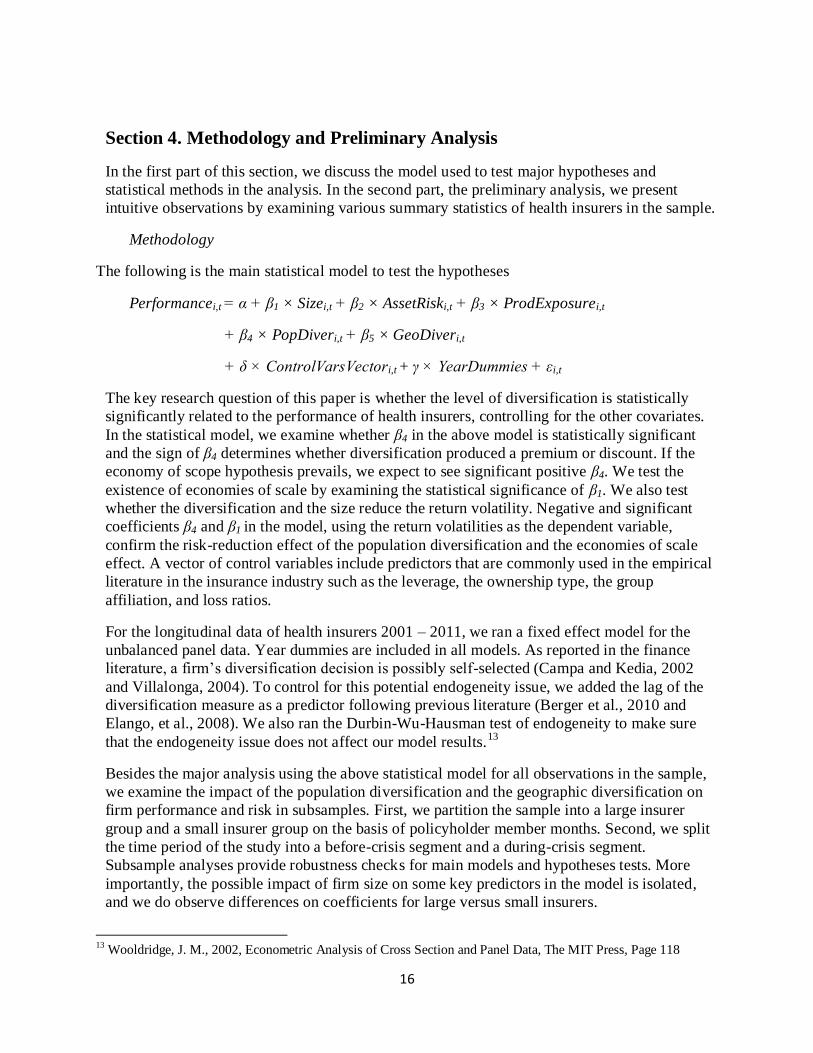
The following is the main statistical model to test the hypotheses
Performancei,t = α + β1 × Sizei,t + β2 × AssetRiski,t + β3 × ProdExposurei,t
+ β4 × PopDiveri,t + β5 × GeoDiveri,t
+ δ × ControlVarsVectori,t + γ × YearDummies + εi,t
The key research question of this paper is whether the level of diversification is statistically
significantly related to the performance of health insurers, controlling for the other covariates.
In the statistical model, we examine whether β4 in the above model is statistically significant
and the sign of β4 determines whether diversification produced a premium or discount. If the
economy of scope hypothesis prevails, we expect to see significant positive β4. We test the
existence of economies of scale by examining the statistical significance of β1. We also test
whether the diversification and the size reduce the return volatility. Negative and significant
coefficients β4 and β1 in the model, using the return volatilities as the dependent variable,
confirm the risk-reduction effect of the population diversification and the economies of scale
effect. A vector of control variables include predictors that are commonly used in the empirical
literature in the insurance industry such as the leverage, the ownership type, the group
affiliation, and loss ratios.
For the longitudinal data of health insurers 2001 – 2011, we ran a fixed effect model for the
unbalanced panel data. Year dummies are included in all models. As reported in the finance
literature, a firm’s diversification decision is possibly self-selected (Campa and Kedia, 2002
and Villalonga, 2004). To control for this potential endogeneity issue, we added the lag of the
diversification measure as a predictor following previous literature (Berger et al., 2010 and
Elango, et al., 2008). We also ran the Durbin-Wu-Hausman test of endogeneity to make sure
that the endogeneity issue does not affect our model results.13
Besides the major analysis using the above statistical model for all observations in the sample,
we examine the impact of the population diversification and the geographic diversification on
firm performance and risk in subsamples. First, we partition the sample into a large insurer
group and a small insurer group on the basis of policyholder member months. Second, we split
the time period of the study into a before-crisis segment and a during-crisis segment.
Subsample analyses provide robustness checks for main models and hypotheses tests. More
importantly, the possible impact of firm size on some key predictors in the model is isolated,
and we do observe differences on coefficients for large versus small insurers.
13
Wooldridge, J. M., 2002, Econometric Analysis of Cross Section and Panel Data, The MIT Press, Page 118
17
It is necessary to examine the impact of diversification for small versus large insurers because
economies of scale and scope might interact for large insurers.
Table 3 Correlation Matrix of Population diversification, Geographic Diversification and Size
All Insurers
PopDiver GeoDiver Size
PopDiver 1 0.0633 0.5332
GeoDiver 0.0633 1 0.1177
Size 0.5332 0.1177 1
Large Insurers in Member Month Small Insurers in Member Month
PopDiver GeoDiver Size PopDiver GeoDiver Size
PopDiver 1 0.0168 0.4499 PopDiver 1 0.0344 0.3037
GeoDiver 0.0168 1 0.0420 GeoDiver 0.0344 1 0.10351
Size 0.4499 0.0420 1 Size 0.3037 0.10351 1
All correlation coefficients are significant at 5% level
The correlation matrix in Table 3 sheds light on the positive correlation between firm size and
population diversification. Various theories also explain this positive correlation. On the one
hand, economies of scale are more likely to be realized for large insurers within individual lines
of business because large insurers underwrite more insurance policies and maintain larger
physician networks. On the other hand, large insurers possess marketing, physician network,
administration cost, and managed care technique advantages, which are sharable across their
lines of business. Therefore, in theory, large insurers are more likely to benefit from economies
of scope. In other words, the positive impact on the firm performance contributed by economies
of scope is hard to differentiate from economies of scale. But for small insurers, the
diversification impact should be identified with much less interaction with size.
We further separate the sample in time-series and examine the impact of the diversification on
performance before versus during the financial crisis. The risk-reduction effect predicts that
more diversified insurers experience less income volatility. To interpret ‘less income volatility’
in another way, we are expecting to see relatively better performance of diversified insurers
when the industry performed poorly on average in crisis years. During crisis years, insurers
with historically more stable financial status are even more appealing to policyholders, which
possibly enables diversified insurers to expand the product exposure or charge higher
premiums. In this way, risk-reduction may contribute to the profit or the performance.
Preliminary Analysis
In this part, we examine some summary statistics. The major research question in this study are
relationships between the diversification and the performance and the firm risk. The
performance and variability in performance is explained above. We use ROA and ROC to
measure returns. We use SD3ROA and SD3ROC to measure the firm risk. We find that
insurers that are more diversified in product and geography experienced better returns and
18
lower firm risks in 2001 – 2011. From the perspective of economies of scale, large insurers also
experienced better returns and lower firm risks in 2001 – 2011. Table 4 presents a snapshot of
the health insurance industry (by size and performance) for insurers included in our study. Size
is represented by mean total assets, mean comprehensive products total premium, and mean
comprehensive products total member months. Performance is measured by the mean return on
asset and the mean return on capital.
Table 4 Summary mean data for insurers with more than 70% of premium written in
Comprehensive (Individual and Group), FEHBPs, Medicare, and Medicaid
Year N Total Assets
Comprehensive
Products Total Premium
Underwritten
Comprehensive
Products Total Member
Months
Return
On
Asset
Return
On
Capital
2001 350 $ 52,577,836,735 $126,937,203,729 719,528,169 2.11% 3.67%
2002 363 $ 56,877,947,352
$144,395,973,936 746,003,444 4.49% 9.10%
2003 389 $ 67,289,454,425
$157,531,659,461 745,953,992 7.57% 16.83%
2004 401 $ 75,690,650,496
$179,397,683,157 774,647,914 8.68% 17.84%
2005 434 $ 90,753,798,543
$202,556,928,564 808,963,951 8.28% 14.39%
2006 449 $ 101,740,843,417
$221,948,777,824 810,978,555 5.82% 12.75%
2007 459 $ 110,514,981,110
$241,763,087,173 830,711,121 7.09% 14.52%
2008 464 $ 108,054,315,304 $256,594,550,014 832,142,860 4.56% 7.86%
2009 446 $ 116,650,790,970 $276,041,457,506 845,891,373 2.48% 4.95%
2010 420 $ 124,686,892,403
$276,518,616,532 821,450,174 5.85% 10.11%
2011 376 $ 127,232,296,478
$276,781,070,629 787,546,985 6.66% 12.82%
Theoretical foundations support that both economies of scope and scale can possibly improve a
firm’s return and reduce the firm risk. In the following, we separate insurers in our sample in
three dimensions: the population diversification level (PopDiver), the geographic
diversification level (GeoDiver), and the size measured by total member months. For each
dimension, we compare the historical mean returns and return volatilities.
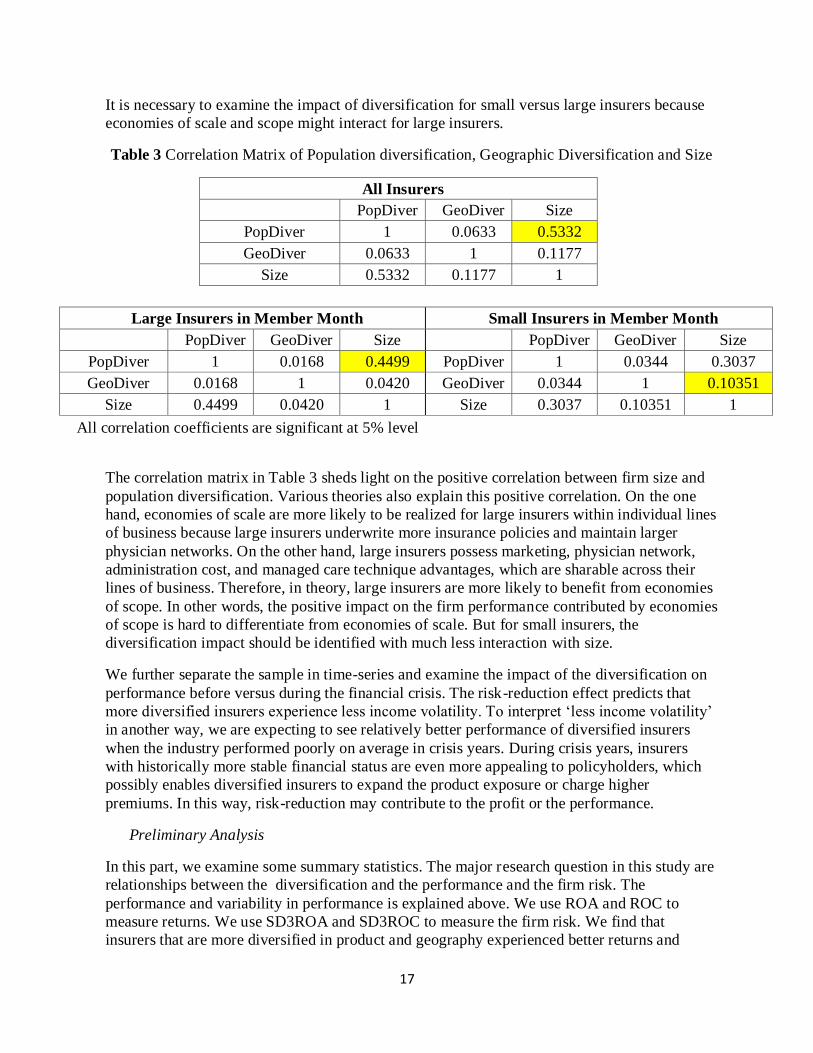
Product-Diversified vs. Product-Specialized
To qualify as a product-diversified insurer, an insurer has a population diversification measure
(PopDiver) of at least 0.5. Product-specialized insurers are defined as insurers with more than
70% of the premium written focusing on one of Comprehensive (individual and group),
FEHBPs, Medicare, or Medicaid. Figure 3a shows mean ROA and ROC comparison of
product-diversified vs. product specialized insurers. And Figure 3b shows the return volatilities
(SD3ROA and SD3ROC) comparison. Product-diversified insurers experienced higher returns
and lower return volatilities on average.
19
Figure 3a Mean ROA and Mean ROC Comparison between Product-Diversified vs. Product-
Specialized Insurers
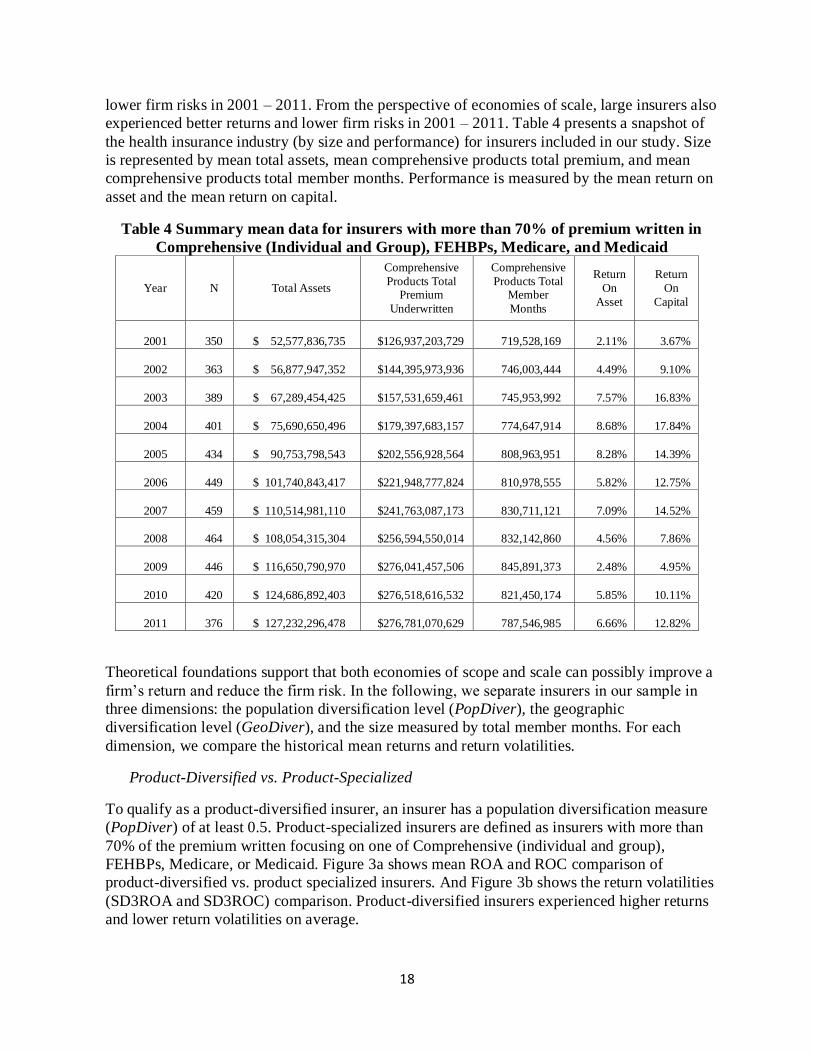
Figure 3b Mean SD3ROA and Mean SD3ROC Comparison between Product-Diversified vs.
Product-Specialized Insurers
Geographic-Diversified vs. Geographic-Focused
Per Schedule T of the NAIC annual filing, where insurers record the geographic allocation of
the premium written separated by product, most health insurers operate in one state. Therefore,
we treat insurers operating in only one state as Geographic-Focused and the rest of insurers as
Geographic-Diversified. Figure 4a shows the mean ROA and ROC comparison and Figure 4b
compares the return volatilities. Geographic-diversified insurers experienced better returns and
lower return volatilities. However, the difference between the two groups is not as significant
as that found for population diversification.
Figure 4a Mean ROA and Mean ROC Comparison between Geographic-Diversified vs.
Geographic-Focused Insurers
20
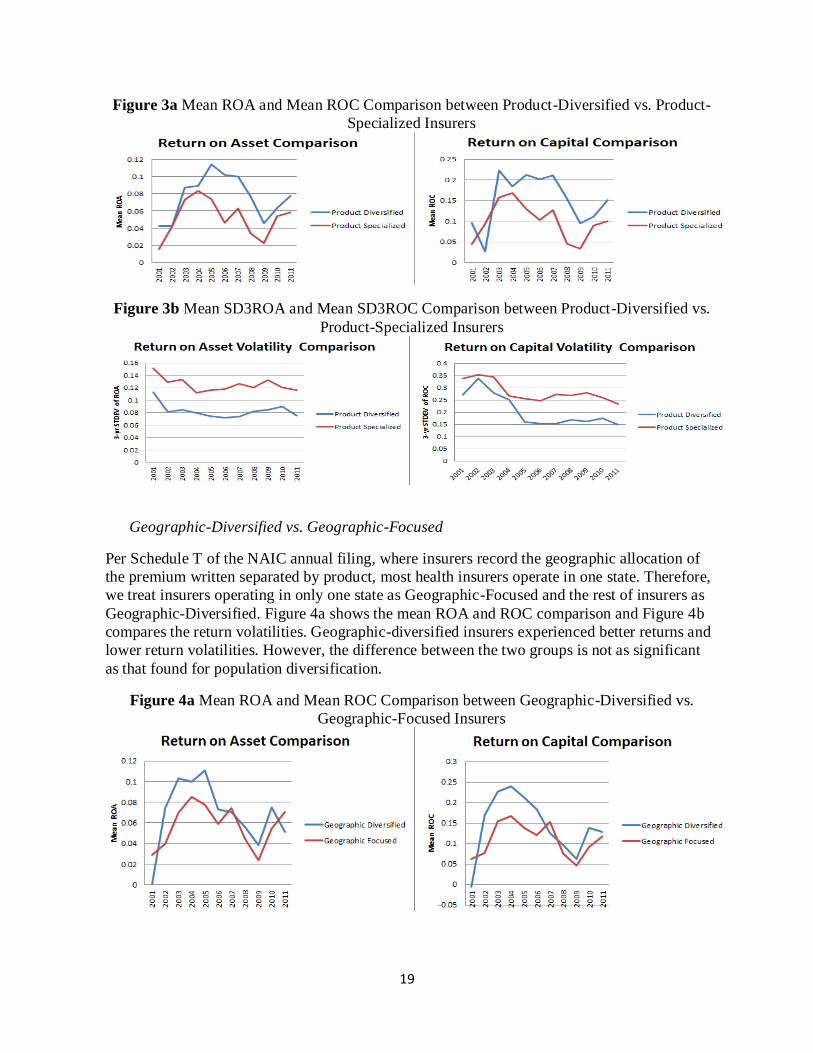
Figure 4b Mean SD3ROA and Mean SD3ROC Comparison between Geographic-Diversified
vs. Geographic-Focused Insurers
Large vs. Small
We examine the total member months to separate insurers into large versus small, designating
an insurer as large if its total member months underwritten is above the third quartile of the
entire industry. Figure 5a shows mean ROA and ROC comparison of large vs. small insurers.
And Figure 5b shows the return volatilities (SD3ROA and SD3ROC) comparison. Large
insurers experienced higher returns and lower return volatilities significantly.
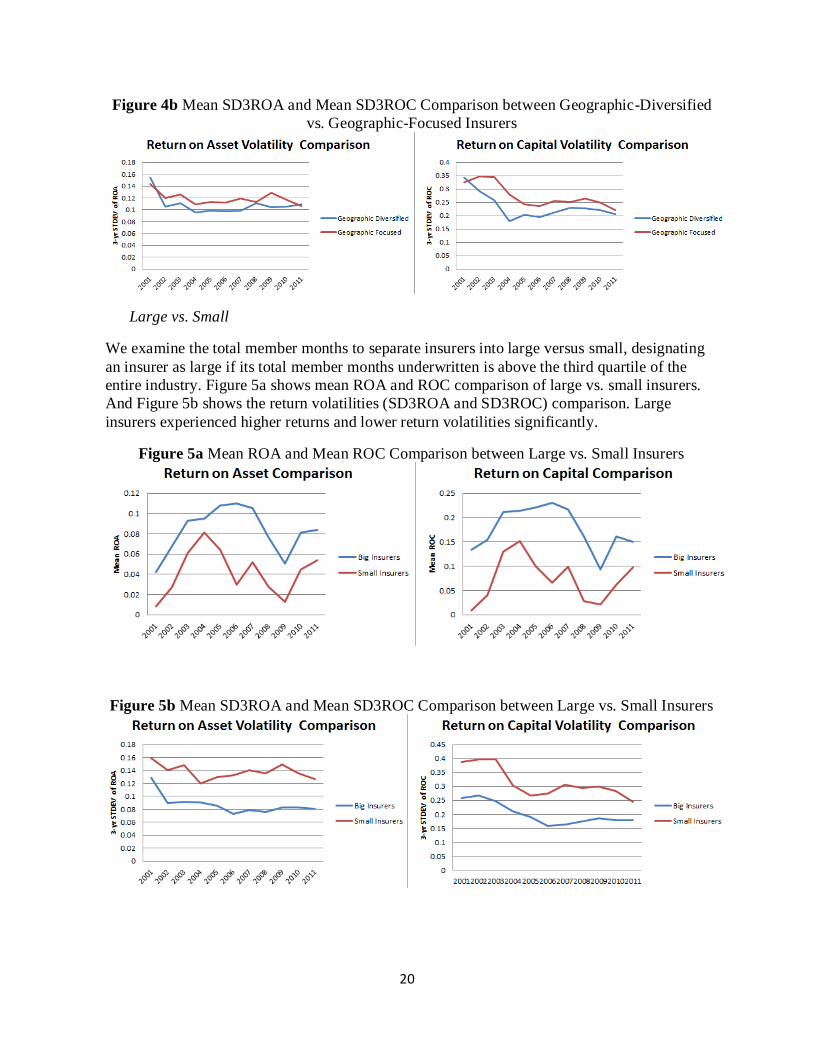
Figure 5a Mean ROA and Mean ROC Comparison between Large vs. Small Insurers
Figure 5b Mean SD3ROA and Mean SD3ROC Comparison between Large vs. Small Insurers
21
Section 5. Results
Performance – Diversification Relationship for All Insurers in the Sample
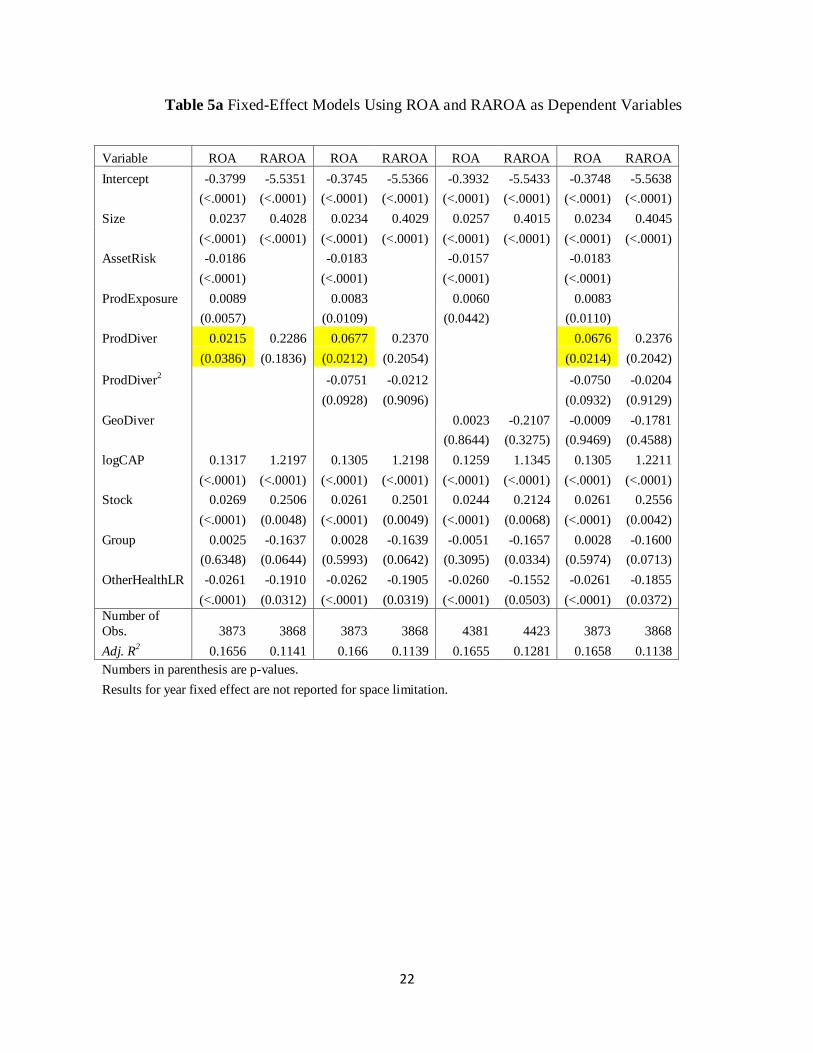
Table 5 shows empirical results of the fixed effect model for all 4,551 firm-years in our study.
We run four models: the main model with lagged population diversification proxy PopDiver as
one of the predictors; the model with an additional quadratic term – PopDiver2; the model with
the geographic diversification proxy GeoDiver; and the model with all three diversification
proxies. Table 5a uses the return on assets (ROA) and the risk-adjusted return on assets
(RAROA) as dependent variables. And Table 5b uses the return on capital (ROC) and the risk-
adjusted return on assets (RAROC) as dependent variables. In the model using RAROA or
RAROC as the dependent variable, asset risk-taking (AssetRisk) and the product risk-taking
(ProdExposure) are left out because the left-hand-side return measure has been adjusted for
risk.
Estimation results show strong evidence for economies of scale since the coefficients of Size
are always positive and statistically significant at 1% level. Larger insurers do perform better
than small insurers controlling for the other covariates. Controlling for the size effect, we find
support for economies of scope. The coefficient of PopDiver is significant at 5% level using
ROA. Consistent with the basic statistics observations in Section 4, health insurers with higher
levels of population diversification perform better than specialized insurers. Results in Table 5a
show just marginal support for the non-linear relationship between population diversification
and firm performance as Elango, et al. (2008) found for US property-liability insurers. But
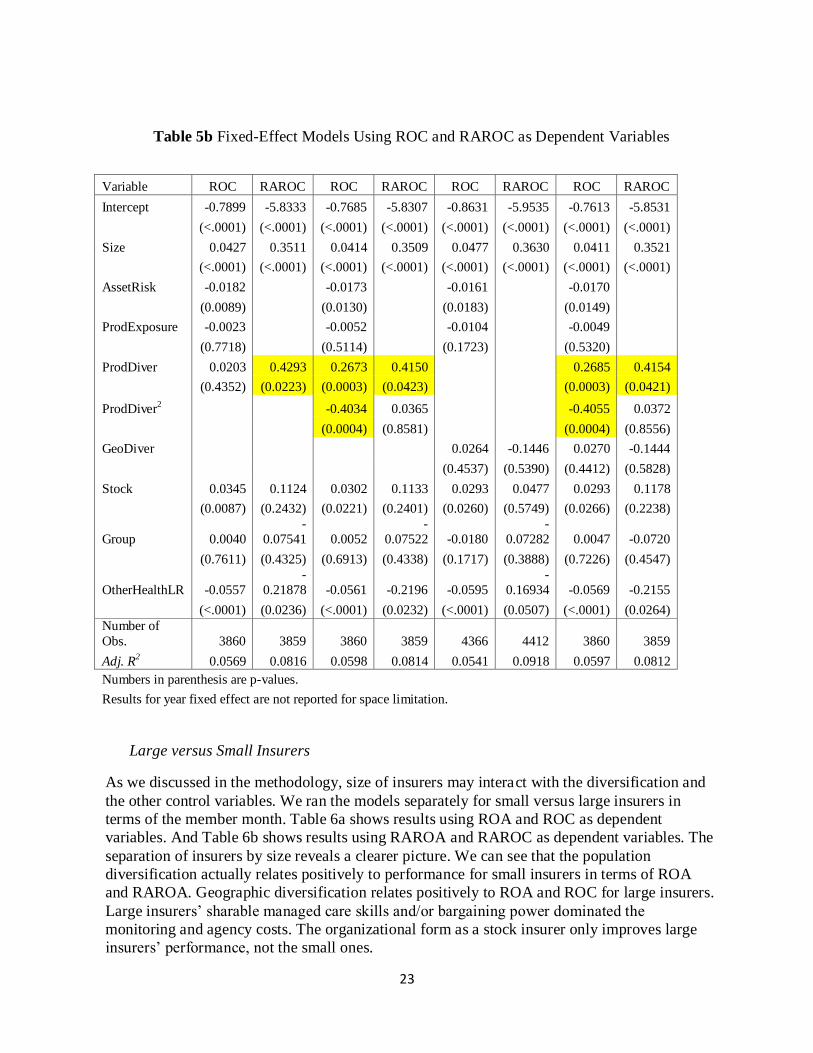
results in Table 5b show significant coefficient for the quadratic terms. Therefore, there is not
conclusive support for the non-linear relationship between the level of diversification and the
firm performance for health insurers, either. Besides, we find that geographic diversification
(GeoDiver) does not have statistically significant relationship with health insurers’ performance
in terms of ROA and RAROA. Health insurers that took more investment risks (AssetRisk)
achieved poorer performance. Well capitalized insurers (logCAP) performed better on average.
Consistent with the finding of Liebenberg and Sommer (2008) for property-liability insurance
industry, stock insurers performed better than mutual insurers for the health insurance industry.
But the group affiliation did not help performance.
22
Table 5a Fixed-Effect Models Using ROA and RAROA as Dependent Variables
Variable ROA RAROA ROA RAROA ROA RAROA ROA RAROA
Intercept -0.3799 -5.5351 -0.3745 -5.5366 -0.3932 -5.5433 -0.3748 -5.5638
(<.0001) (<.0001) (<.0001) (<.0001) (<.0001) (<.0001) (<.0001) (<.0001)
Size 0.0237 0.4028 0.0234 0.4029 0.0257 0.4015 0.0234 0.4045
(<.0001) (<.0001) (<.0001) (<.0001) (<.0001) (<.0001) (<.0001) (<.0001)
AssetRisk -0.0186 -0.0183 -0.0157 -0.0183
(<.0001) (<.0001) (<.0001) (<.0001)
ProdExposure 0.0089 0.0083 0.0060 0.0083
(0.0057) (0.0109) (0.0442) (0.0110)
ProdDiver 0.0215 0.2286 0.0677 0.2370
0.0676 0.2376
(0.0386) (0.1836) (0.0212) (0.2054)
(0.0214) (0.2042)
ProdDiver2 -0.0751 -0.0212
-0.0750 -0.0204
(0.0928) (0.9096)
(0.0932) (0.9129)
GeoDiver
0.0023 -0.2107 -0.0009 -0.1781
(0.8644) (0.3275) (0.9469) (0.4588)
logCAP 0.1317 1.2197 0.1305 1.2198 0.1259 1.1345 0.1305 1.2211
(<.0001) (<.0001) (<.0001) (<.0001) (<.0001) (<.0001) (<.0001) (<.0001)
Stock 0.0269 0.2506 0.0261 0.2501 0.0244 0.2124 0.0261 0.2556
(<.0001) (0.0048) (<.0001) (0.0049) (<.0001) (0.0068) (<.0001) (0.0042)
Group 0.0025 -0.1637 0.0028 -0.1639 -0.0051 -0.1657 0.0028 -0.1600
(0.6348) (0.0644) (0.5993) (0.0642) (0.3095) (0.0334) (0.5974) (0.0713)
OtherHealthLR -0.0261 -0.1910 -0.0262 -0.1905 -0.0260 -0.1552 -0.0261 -0.1855
(<.0001) (0.0312) (<.0001) (0.0319) (<.0001) (0.0503) (<.0001) (0.0372)
Number of
Obs. 3873 3868 3873 3868 4381 4423 3873 3868
Adj. R2 0.1656 0.1141 0.166 0.1139 0.1655 0.1281 0.1658 0.1138
Numbers in parenthesis are p-values.
Results for year fixed effect are not reported for space limitation.
23
Table 5b Fixed-Effect Models Using ROC and RAROC as Dependent Variables
Variable ROC RAROC ROC RAROC ROC RAROC ROC RAROC
Intercept -0.7899 -5.8333 -0.7685 -5.8307 -0.8631 -5.9535 -0.7613 -5.8531
(<.0001) (<.0001) (<.0001) (<.0001) (<.0001) (<.0001) (<.0001) (<.0001)
Size 0.0427 0.3511 0.0414 0.3509 0.0477 0.3630 0.0411 0.3521
(<.0001) (<.0001) (<.0001) (<.0001) (<.0001) (<.0001) (<.0001) (<.0001)
AssetRisk -0.0182 -0.0173 -0.0161 -0.0170
(0.0089) (0.0130) (0.0183) (0.0149)
ProdExposure -0.0023 -0.0052 -0.0104 -0.0049
(0.7718) (0.5114) (0.1723) (0.5320)
ProdDiver 0.0203 0.4293 0.2673 0.4150 0.2685 0.4154
(0.4352) (0.0223) (0.0003) (0.0423) (0.0003) (0.0421)
ProdDiver2 -0.4034 0.0365 -0.4055 0.0372
(0.0004) (0.8581) (0.0004) (0.8556)
GeoDiver 0.0264 -0.1446 0.0270 -0.1444
(0.4537) (0.5390) (0.4412) (0.5828)
Stock 0.0345 0.1124 0.0302 0.1133 0.0293 0.0477 0.0293 0.1178
(0.0087) (0.2432) (0.0221) (0.2401) (0.0260) (0.5749) (0.0266) (0.2238)
Group 0.0040
-
0.07541 0.0052
-
0.07522 -0.0180
-
0.07282 0.0047 -0.0720
(0.7611) (0.4325) (0.6913) (0.4338) (0.1717) (0.3888) (0.7226) (0.4547)
OtherHealthLR -0.0557
-
0.21878 -0.0561 -0.2196 -0.0595
-
0.16934 -0.0569 -0.2155
(<.0001) (0.0236) (<.0001) (0.0232) (<.0001) (0.0507) (<.0001) (0.0264)
Number of
Obs. 3860 3859 3860 3859 4366 4412 3860 3859
Adj. R2 0.0569 0.0816 0.0598 0.0814 0.0541 0.0918 0.0597 0.0812
Numbers in parenthesis are p-values.
Results for year fixed effect are not reported for space limitation.
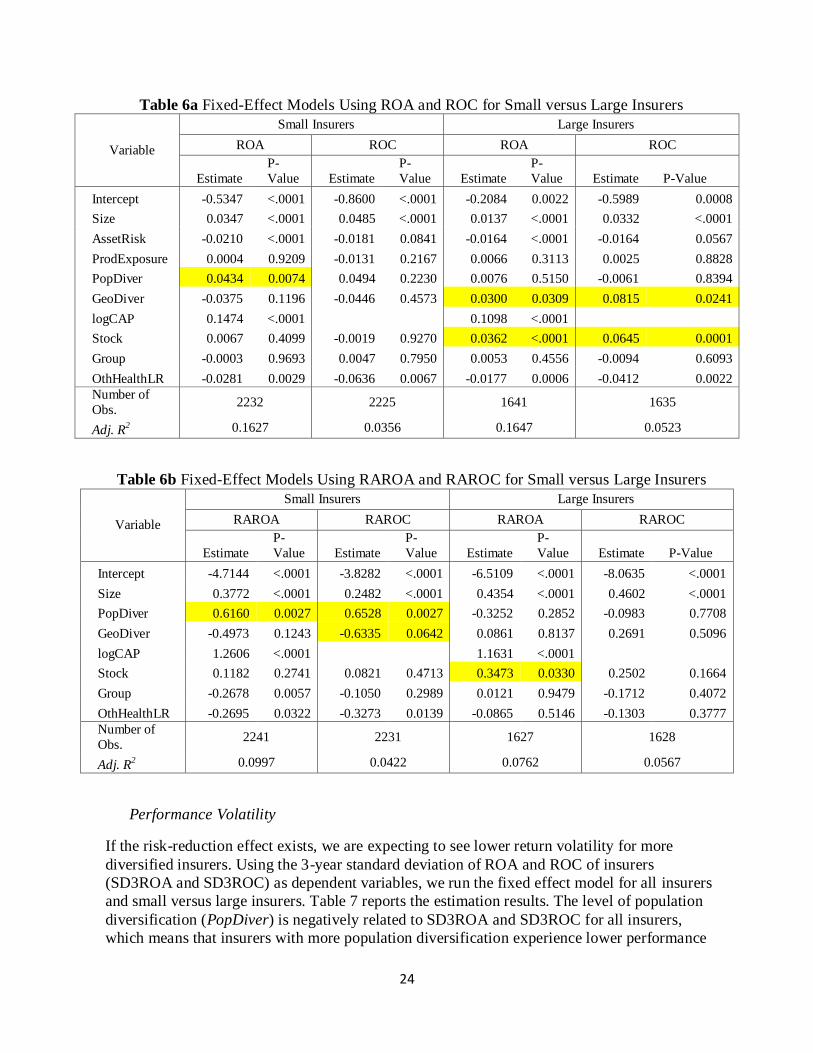
Large versus Small Insurers
As we discussed in the methodology, size of insurers may interact with the diversification and
the other control variables. We ran the models separately for small versus large insurers in
terms of the member month. Table 6a shows results using ROA and ROC as dependent
variables. And Table 6b shows results using RAROA and RAROC as dependent variables. The
separation of insurers by size reveals a clearer picture. We can see that the population
diversification actually relates positively to performance for small insurers in terms of ROA
and RAROA. Geographic diversification relates positively to ROA and ROC for large insurers.
Large insurers’ sharable managed care skills and/or bargaining power dominated the
monitoring and agency costs. The organizational form as a stock insurer only improves large
insurers’ performance, not the small ones.
24
Table 6a Fixed-Effect Models Using ROA and ROC for Small versus Large Insurers
Variable
Small Insurers Large Insurers
ROA ROC ROA ROC
Estimate
P-
Value Estimate
P-
Value Estimate
P-
Value Estimate P-Value
Intercept -0.5347 <.0001 -0.8600 <.0001 -0.2084 0.0022 -0.5989 0.0008
Size 0.0347 <.0001 0.0485 <.0001 0.0137 <.0001 0.0332 <.0001
AssetRisk -0.0210 <.0001 -0.0181 0.0841 -0.0164 <.0001 -0.0164 0.0567
ProdExposure 0.0004 0.9209 -0.0131 0.2167 0.0066 0.3113 0.0025 0.8828
PopDiver 0.0434 0.0074 0.0494 0.2230 0.0076 0.5150 -0.0061 0.8394
GeoDiver -0.0375 0.1196 -0.0446 0.4573 0.0300 0.0309 0.0815 0.0241
logCAP 0.1474 <.0001 0.1098 <.0001
Stock 0.0067 0.4099 -0.0019 0.9270 0.0362 <.0001 0.0645 0.0001
Group -0.0003 0.9693 0.0047 0.7950 0.0053 0.4556 -0.0094 0.6093
OthHealthLR -0.0281 0.0029 -0.0636 0.0067 -0.0177 0.0006 -0.0412 0.0022
Number of
Obs. 2232 2225 1641 1635
Adj. R2 0.1627 0.0356 0.1647 0.0523
Table 6b Fixed-Effect Models Using RAROA and RAROC for Small versus Large Insurers
Variable
Small Insurers Large Insurers
RAROA RAROC RAROA RAROC
Estimate
P-
Value Estimate
P-
Value Estimate
P-
Value Estimate P-Value
Intercept -4.7144 <.0001 -3.8282 <.0001 -6.5109 <.0001 -8.0635 <.0001
Size 0.3772 <.0001 0.2482 <.0001 0.4354 <.0001 0.4602 <.0001
PopDiver 0.6160 0.0027 0.6528 0.0027 -0.3252 0.2852 -0.0983 0.7708
GeoDiver -0.4973 0.1243 -0.6335 0.0642 0.0861 0.8137 0.2691 0.5096
logCAP 1.2606 <.0001 1.1631 <.0001
Stock 0.1182 0.2741 0.0821 0.4713 0.3473 0.0330 0.2502 0.1664
Group -0.2678 0.0057 -0.1050 0.2989 0.0121 0.9479 -0.1712 0.4072
OthHealthLR -0.2695 0.0322 -0.3273 0.0139 -0.0865 0.5146 -0.1303 0.3777
Number of
Obs. 2241 2231 1627 1628
Adj. R2 0.0997 0.0422 0.0762 0.0567
Performance Volatility
If the risk-reduction effect exists, we are expecting to see lower return volatility for more
diversified insurers. Using the 3-year standard deviation of ROA and ROC of insurers
(SD3ROA and SD3ROC) as dependent variables, we run the fixed effect model for all insurers
and small versus large insurers. Table 7 reports the estimation results. The level of population
diversification (PopDiver) is negatively related to SD3ROA and SD3ROC for all insurers,
which means that insurers with more population diversification experience lower performance
25
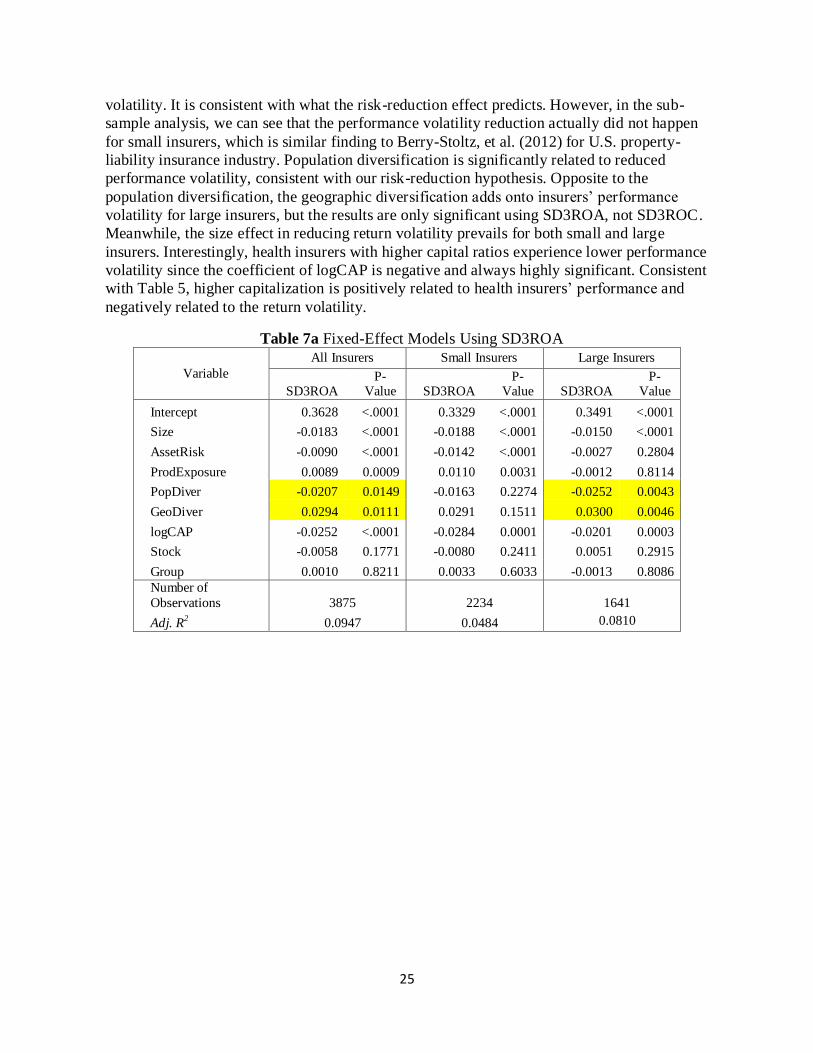
volatility. It is consistent with what the risk-reduction effect predicts. However, in the sub-
sample analysis, we can see that the performance volatility reduction actually did not happen
for small insurers, which is similar finding to Berry-Stoltz, et al. (2012) for U.S. property-
liability insurance industry. Population diversification is significantly related to reduced
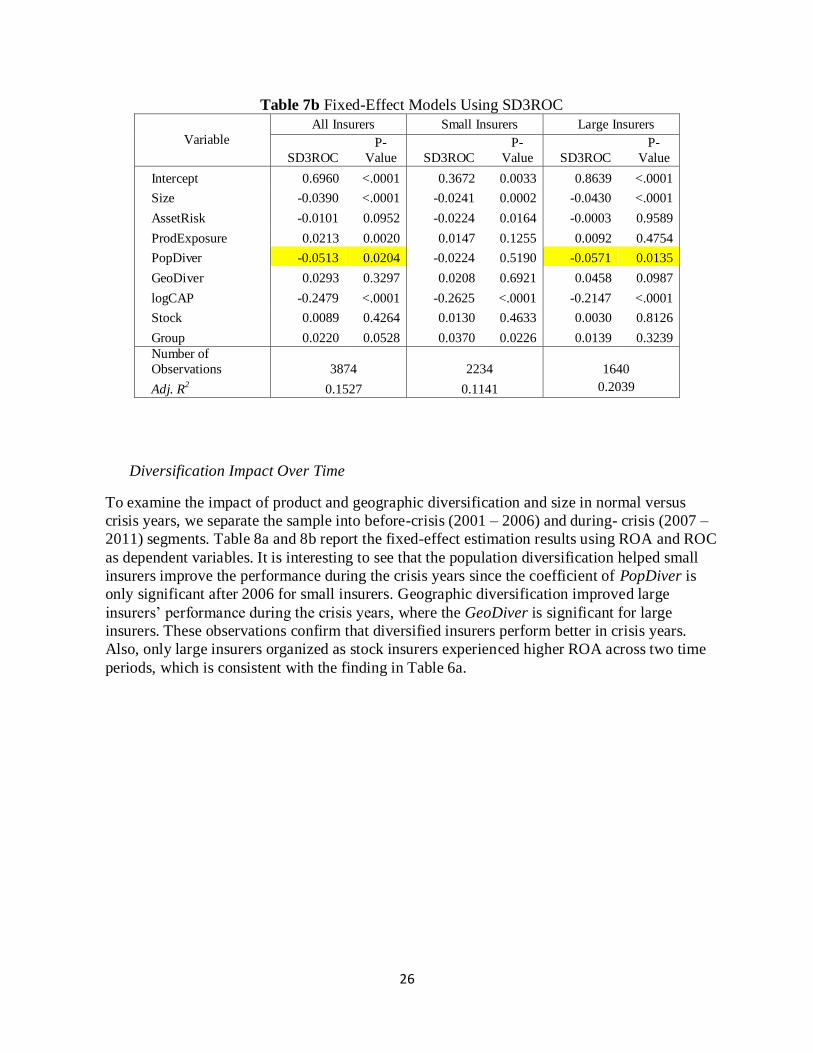
performance volatility, consistent with our risk-reduction hypothesis. Opposite to the
population diversification, the geographic diversification adds onto insurers’ performance
volatility for large insurers, but the results are only significant using SD3ROA, not SD3ROC.
Meanwhile, the size effect in reducing return volatility prevails for both small and large
insurers. Interestingly, health insurers with higher capital ratios experience lower performance
volatility since the coefficient of logCAP is negative and always highly significant. Consistent
with Table 5, higher capitalization is positively related to health insurers’ performance and
negatively related to the return volatility.
Table 7a Fixed-Effect Models Using SD3ROA
Variable
All Insurers Small Insurers Large Insurers
SD3ROA P-
Value SD3ROA P-
Value SD3ROA P-
Value
Intercept 0.3628 <.0001 0.3329 <.0001 0.3491 <.0001
Size -0.0183 <.0001 -0.0188 <.0001 -0.0150 <.0001
AssetRisk -0.0090 <.0001 -0.0142 <.0001 -0.0027 0.2804
ProdExposure 0.0089 0.0009 0.0110 0.0031 -0.0012 0.8114
PopDiver -0.0207 0.0149 -0.0163 0.2274 -0.0252 0.0043
GeoDiver 0.0294 0.0111 0.0291 0.1511 0.0300 0.0046
logCAP -0.0252 <.0001 -0.0284 0.0001 -0.0201 0.0003
Stock -0.0058 0.1771 -0.0080 0.2411 0.0051 0.2915
Group 0.0010 0.8211 0.0033 0.6033 -0.0013 0.8086
Number of
Observations 3875 2234 1641
Adj. R2 0.0947 0.0484 0.0810
26
Table 7b Fixed-Effect Models Using SD3ROC
Variable
All Insurers Small Insurers Large Insurers
SD3ROC
P-
Value SD3ROC
P-
Value SD3ROC
P-
Value
Intercept 0.6960 <.0001 0.3672 0.0033 0.8639 <.0001
Size -0.0390 <.0001 -0.0241 0.0002 -0.0430 <.0001
AssetRisk -0.0101 0.0952 -0.0224 0.0164 -0.0003 0.9589
ProdExposure 0.0213 0.0020 0.0147 0.1255 0.0092 0.4754
PopDiver -0.0513 0.0204 -0.0224 0.5190 -0.0571 0.0135
GeoDiver 0.0293 0.3297 0.0208 0.6921 0.0458 0.0987
logCAP -0.2479 <.0001 -0.2625 <.0001 -0.2147 <.0001
Stock 0.0089 0.4264 0.0130 0.4633 0.0030 0.8126
Group 0.0220 0.0528 0.0370 0.0226 0.0139 0.3239
Number of
Observations 3874 2234 1640
Adj. R2 0.1527 0.1141 0.2039
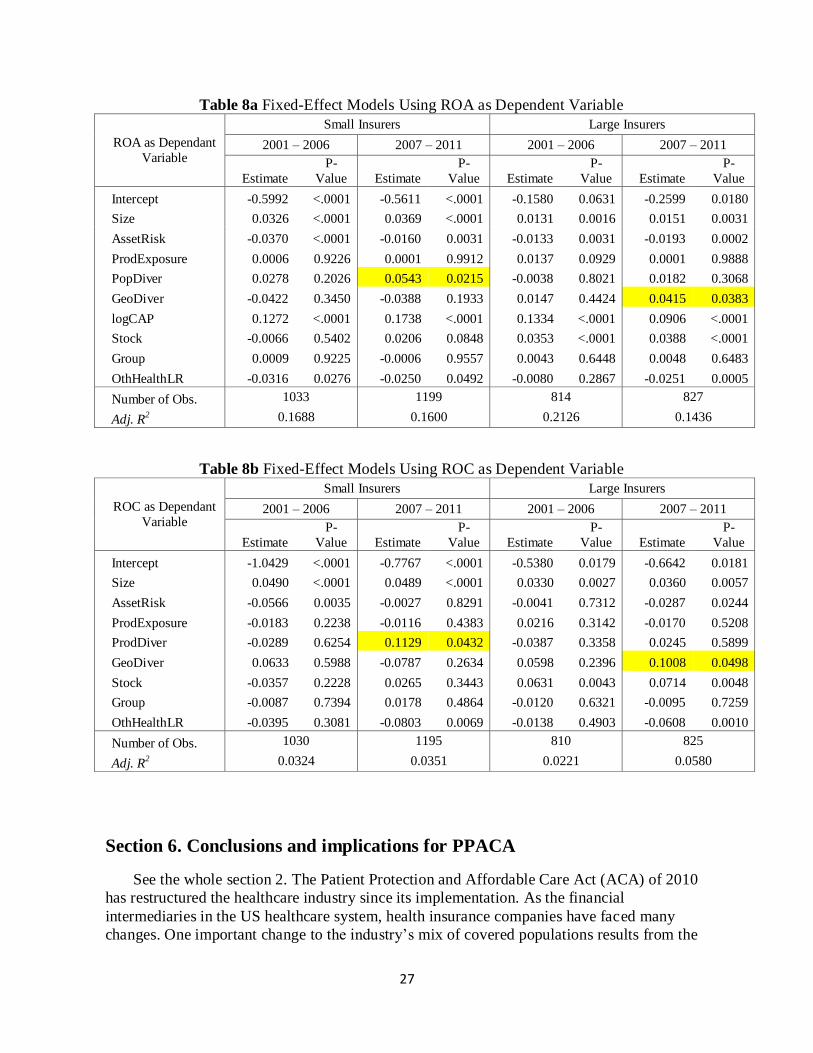
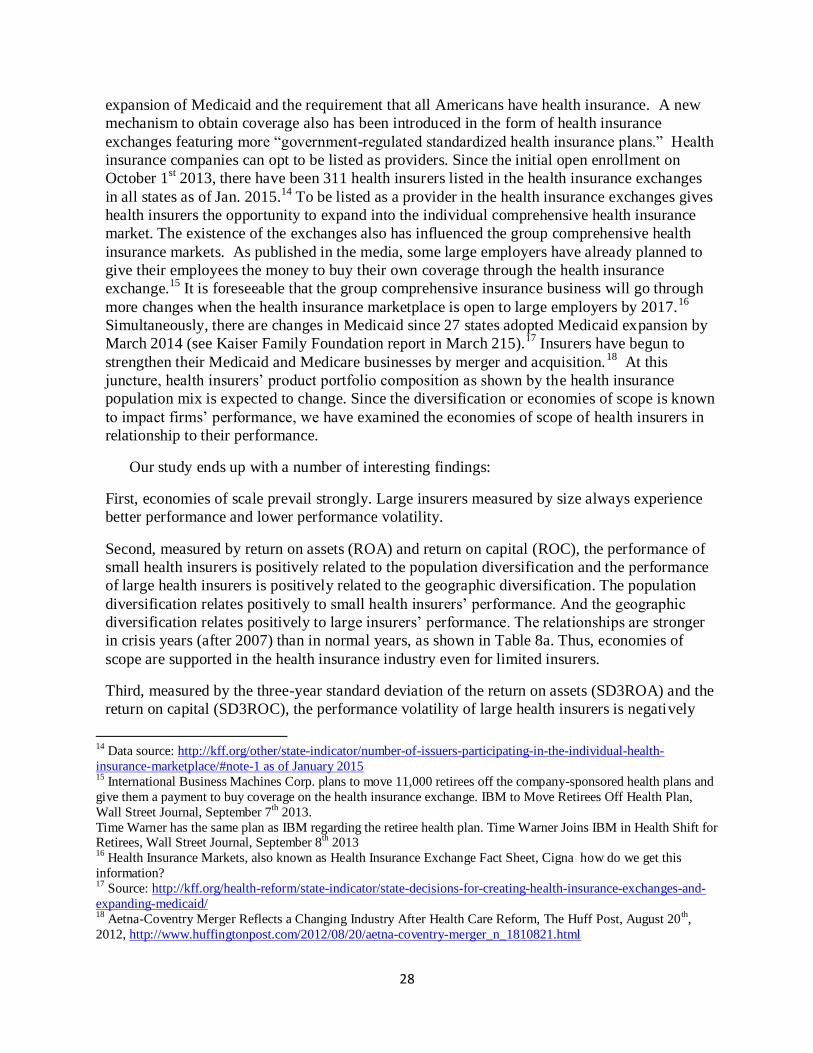
Diversification Impact Over Time
To examine the impact of product and geographic diversification and size in normal versus
crisis years, we separate the sample into before-crisis (2001 – 2006) and during- crisis (2007 –
2011) segments. Table 8a and 8b report the fixed-effect estimation results using ROA and ROC
as dependent variables. It is interesting to see that the population diversification helped small
insurers improve the performance during the crisis years since the coefficient of PopDiver is
only significant after 2006 for small insurers. Geographic diversification improved large
insurers’ performance during the crisis years, where the GeoDiver is significant for large
insurers. These observations confirm that diversified insurers perform better in crisis years.
Also, only large insurers organized as stock insurers experienced higher ROA across two time
periods, which is consistent with the finding in Table 6a.
27
Table 8a Fixed-Effect Models Using ROA as Dependent Variable
ROA as Dependant
Variable
Small Insurers Large Insurers
2001 – 2006 2007 – 2011 2001 – 2006 2007 – 2011
Estimate
P-
Value Estimate
P-
Value Estimate
P-
Value Estimate
P-
Value
Intercept -0.5992 <.0001 -0.5611 <.0001 -0.1580 0.0631 -0.2599 0.0180
Size 0.0326 <.0001 0.0369 <.0001 0.0131 0.0016 0.0151 0.0031
AssetRisk -0.0370 <.0001 -0.0160 0.0031 -0.0133 0.0031 -0.0193 0.0002
ProdExposure 0.0006 0.9226 0.0001 0.9912 0.0137 0.0929 0.0001 0.9888
PopDiver 0.0278 0.2026 0.0543 0.0215 -0.0038 0.8021 0.0182 0.3068
GeoDiver -0.0422 0.3450 -0.0388 0.1933 0.0147 0.4424 0.0415 0.0383
logCAP 0.1272 <.0001 0.1738 <.0001 0.1334 <.0001 0.0906 <.0001
Stock -0.0066 0.5402 0.0206 0.0848 0.0353 <.0001 0.0388 <.0001
Group 0.0009 0.9225 -0.0006 0.9557 0.0043 0.6448 0.0048 0.6483
OthHealthLR -0.0316 0.0276 -0.0250 0.0492 -0.0080 0.2867 -0.0251 0.0005
Number of Obs. 1033 1199 814 827
Adj. R2 0.1688 0.1600 0.2126 0.1436
Table 8b Fixed-Effect Models Using ROC as Dependent Variable
ROC as Dependant
Variable
Small Insurers Large Insurers
2001 – 2006 2007 – 2011 2001 – 2006 2007 – 2011
Estimate
P-
Value Estimate
P-
Value Estimate
P-
Value Estimate
P-
Value
Intercept -1.0429 <.0001 -0.7767 <.0001 -0.5380 0.0179 -0.6642 0.0181
Size 0.0490 <.0001 0.0489 <.0001 0.0330 0.0027 0.0360 0.0057
AssetRisk -0.0566 0.0035 -0.0027 0.8291 -0.0041 0.7312 -0.0287 0.0244
ProdExposure -0.0183 0.2238 -0.0116 0.4383 0.0216 0.3142 -0.0170 0.5208
ProdDiver -0.0289 0.6254 0.1129 0.0432 -0.0387 0.3358 0.0245 0.5899
GeoDiver 0.0633 0.5988 -0.0787 0.2634 0.0598 0.2396 0.1008 0.0498
Stock -0.0357 0.2228 0.0265 0.3443 0.0631 0.0043 0.0714 0.0048
Group -0.0087 0.7394 0.0178 0.4864 -0.0120 0.6321 -0.0095 0.7259
OthHealthLR -0.0395 0.3081 -0.0803 0.0069 -0.0138 0.4903 -0.0608 0.0010
Number of Obs. 1030 1195 810 825
Adj. R2 0.0324 0.0351 0.0221 0.0580
Section 6. Conclusions and implications for PPACA
See the whole section 2. The Patient Protection and Affordable Care Act (ACA) of 2010
has restructured the healthcare industry since its implementation. As the financial
intermediaries in the US healthcare system, health insurance companies have faced many
changes. One important change to the industry’s mix of covered populations results from the
28
expansion of Medicaid and the requirement that all Americans have health insurance. A new
mechanism to obtain coverage also has been introduced in the form of health insurance
exchanges featuring more “government-regulated standardized health insurance plans.” Health
insurance companies can opt to be listed as providers. Since the initial open enrollment on
October 1st 2013, there have been 311 health insurers listed in the health insurance exchanges
in all states as of Jan. 2015.14
To be listed as a provider in the health insurance exchanges gives
health insurers the opportunity to expand into the individual comprehensive health insurance
market. The existence of the exchanges also has influenced the group comprehensive health
insurance markets. As published in the media, some large employers have already planned to
give their employees the money to buy their own coverage through the health insurance
exchange.15
It is foreseeable that the group comprehensive insurance business will go through
more changes when the health insurance marketplace is open to large employers by 2017.16
Simultaneously, there are changes in Medicaid since 27 states adopted Medicaid expansion by
March 2014 (see Kaiser Family Foundation report in March 215).17
Insurers have begun to
strengthen their Medicaid and Medicare businesses by merger and acquisition.18
At this
juncture, health insurers’ product portfolio composition as shown by the health insurance
population mix is expected to change. Since the diversification or economies of scope is known
to impact firms’ performance, we have examined the economies of scope of health insurers in
relationship to their performance.
Our study ends up with a number of interesting findings:
First, economies of scale prevail strongly. Large insurers measured by size always experience
better performance and lower performance volatility.
Second, measured by return on assets (ROA) and return on capital (ROC), the performance of
small health insurers is positively related to the population diversification and the performance
of large health insurers is positively related to the geographic diversification. The population
diversification relates positively to small health insurers’ performance. And the geographic
diversification relates positively to large insurers’ performance. The relationships are stronger
in crisis years (after 2007) than in normal years, as shown in Table 8a. Thus, economies of
scope are supported in the health insurance industry even for limited insurers.
Third, measured by the three-year standard deviation of the return on assets (SD3ROA) and the
return on capital (SD3ROC), the performance volatility of large health insurers is negatively
14
Data source: http://kff.org/other/state-indicator/number-of-issuers-participating-in-the-individual-health-
insurance-marketplace/#note-1 as of January 2015 15
International Business Machines Corp. plans to move 11,000 retirees off the company-sponsored health plans and
give them a payment to buy coverage on the health insurance exchange. IBM to Move Retirees Off Health Plan,
Wall Street Journal, September 7th 2013.
Time Warner has the same plan as IBM regarding the retiree health plan. Time Warner Joins IBM in Health Shift for Retirees, Wall Street Journal, September 8
th 2013
16 Health Insurance Markets, also known as Health Insurance Exchange Fact Sheet, Cigna how do we get this
information? 17
Source: http://kff.org/health-reform/state-indicator/state-decisions-for-creating-health-insurance-exchanges-and-
expanding-medicaid/ 18
Aetna-Coventry Merger Reflects a Changing Industry After Health Care Reform, The Huff Post, August 20th
,
2012, http://www.huffingtonpost.com/2012/08/20/aetna-coventry-merger_n_1810821.html
29
related to population diversification and positively related to geographic diversification.
Population diversification is negatively related to large insurers’ performance volatility, which
supports the risk-reduction effect. However, geographic diversification is positively related to
the performance volatility.
Finally, we also find that capitalization is positively related to health insurers’ performance and
negatively related to the performance volatility. More investment risk-taking lowers health
insurers’ performance. Consistent with Liebenberg and Sommer (2008), stock insurers perform
better than mutual insurers in the health insurance industry, particularly for large insurers.
In financial service industries, the performance-diversification relationship has been studied in
the life/health insurance, the property-liability insurance, and the banking industries. Our work
enriches the insurance literature by examining the health insurance industry. We find evidence
of both economies of scale and economies of scope for the US health insurance industry.
Besides the industry-wide study, we examine large versus small insurers in terms of member
months. The finding shows the different impact of population diversification and geographic
diversification on small versus large insurers’ performance. Moreover, we examine the impact
of population and geographic diversification on large versus small insurers in different time
periods, which also supports our results. More importantly, we examine how performance
volatility is related to product and geographic diversification. We find support for the risk-
reduction effect of diversification in US health insurance industry.
References
Amihud, Y. and B. Lev, 1981, Risk Reduction As a Managerial Motive for Conglomerate
Mergers, The Bell Journal of Economics, 12(2): 605 – 617.
Amit, R. and J. Livnat,, 1988, Diversification and the Risk-Return Trade-Off, The Academy of
Management Journal, 31(1): 154 – 166.
Bain, J. S., 1951, Relationship of Profit Rate to Industry Concentration in American
Manufacturing 1936 – 1940, Quarterly Journal of Economics, 65: 293 – 324.
Baranoff, E.G., P.L. Brockett and Y. Kahane, 2009, “Risk Management for the Enterprise and
Individuals” Flatworld Knowledge.
Baranoff, E. G., S. Papadopoulos, and T. W. Sager, 2007, Capital and Risk Revisited: A
Structural Equation Model Approach for Life Insurers, Journal of Risk and Insurance, 74(3):
653 – 681
Baranoff, E.G., T. W. Sager, and R. C. Witt, 1999, Industry Segmentation and Predictor Motifs
for Solvency Analysis of the Life/Health Insurance Industry, Journal of Risk and Insurance,
66(1): 99-123.
30
Barla, P., 2000, Firm Size Inequality and Market Power, International Journal of Industrial
Organization, 18(5): 693 – 722.
Bary, Andrew, "Aetna-Humana Deal May Never Be Consummated" Barron's, July 6, 2015
http://online.barrons.com/articles/aetna-humana-merger-may-never-be-consummated-
1436219766
Beck, T. and A. Demirguc-Kunt, 2006, Small and Medium-Size Enterprises: Access to Finance
as a Growth Constraint, Journal of Banking and Finance, 30(2006): 2931 – 2943.
Berger, A. N., I. Hasan, I. Korhonen, and M. Zhou, 2010, Does Diversification Increase or
Decrease Bank Risk and Performance? Evidence on Diversification and Risk-Return Tradeoff
in Banking, Bank of Finland BOFIT discussion paper.
Berger, A. N. and G. E. Udell, 1995, Relationship Lending and Lines of Credit in small Firm
Finance, The Journal of Business, 68(3): 351 – 381.
Berger, P. G. and E. Ofek, 1995, Diversification’s Effect on Firm Value, Journal of Financial
Economics, 37: 39 – 65.
Berry, C. H., 1971, Corporate Growth and Diversification, Journal of Law and Economics,
14(2): 371 – 383.
Berry, C. H., 1975, Corporate Growth and Diversification, Princeton, NJ: Princeton University
Press.
Berry-Stoltz, T. R., A. P. Liebenberg, J. S. Ruhland, and D. W. Sommer, 2012, Determinants of
Corporate Diversification: Evidence from the Property-Liability Insurance Industry, Journal of
Risk and Insurance, 79(2): 381 – 413.
Bettis, A. R. 1981, Performance Differences in Related and Unrelated Diversified Firms,
Strategic Management Journal, 2: 379-393.
Bettis, A. R., & Hall, W. K. 1982, Diversification Strategy, Accounting Determined Risk, and
Accounting Determined Return, Academy of Management Journal, 25: 254-264.
Bettis, A. R., & Mahajan, V, 1985, Risk/Return Performance of Diversified Firms,
Management Science, 31: 785-799.
Bradley, M., A. Desai, A., and E. H. Kim, E.H., 1988. Synergistic Gains from Corporate
Acquisitions and Their Division Between the Stockholders of Target and Acquiring Firms,
Journal of Financial Economics, 21(1): 3 –40.
Bowman, E. H, 1980, A Risk/Return Paradox for Strategic Movement, Sloan Management
Review, 21(3): 27-31.

31
Browne, M. J., J. M. Carson, and R. E. Hyot, 2000, Dynamic Financial Models of Life Insurers,
Working Paper..
Campa, J. M. and S. Kedia, 2002, Explaining the Diversification Discount, Journal of Finance,
57(4): 1731 – 1762.
Chandler, A. D., 1977, The Visible Hand: The Managerial Revolution in American Business,
Cambridge, MA: Harvard University Press.
Chandler, A. D., 1990, Scale and Scope: The Dynamics of Industrial Capitalism, Cambridge,
MA: Harvard University Press.
Christensen, H, K. and C. A. Montgomery, 1981, Corporate Economic Performance:
Diversification Strategy Versus Market Structure, Strategic Management Journal, 2: 327-343.
Colquitt, L. L. and R. E. Hoyt, 1997, Determinants of Corporate Hedging Behavior: Evidence
from the Life Insurance Industry, Journal of Risk and Insurance, 64: 649 – 671.
Cummins, J. D. and P. Trainer, 2009, Securitization, Insurance, and Reinsurance, Journal of
Risk and Insurance, 76(3): 463 – 492.
Cummins, J.D., M. A. Weiss, X. Xie, and H. Zi, 2010, Economies of Scope in Financial
Services: A DEA Analysis of US Insurance Industry, Journal of Banking & Finance, 34: 1525
– 1539
Elango, B., Y. Ma, and N. Pope, 2008, An Investigation Into the Diversification-Performance
Relationship in the U.S. Property-Liability Insurance Industry, The Journal of Risk and
Insurance, 75(3): 567 – 591
Fama, E. F. and M. C. Jensen, 1983, Separation of Ownership and Control, Journal of Law and
Economics, 26: 291 – 325.
Fiegenbaum, A., and H. Thomas, 1986. Dynamic and Risk Return Measurement Perspectives
on Bowman's Risk-Return Paradox for Strategic Management: An Empirical Study, Strategic
Management Journal, 7: 395-407.
Fiegenbaum, A. and H. Thomas, 1990, Strategic Groups and Performance: The U.S. Insurance
Industry, 1970-84, Strategic Management Journal, 11: 197 – 215.
Goetz, M. R., L. Laeven, and R. Levine, 2013, Identifying the Value Effects and Agency Costs
of Corporate Diversification: Evidence from the Geographic Diversification of U.S. Banks,
Review of Financial Studies, 26(7): 1787 -1823.

32
Hoffman, Liz, Dana Mattioli and Anna Wilde Mathews “Aetna Agrees to Buy Humana for
$34.1 Billion”,Wall Street Journal July 3, 2015. http://www.wsj.com/articles/aetna-nears-deal-
to-buy-humana-1435883861
Hoyt, R. E., and J. S. Trieschmann, 1991, Risk/Return Relationships for Life-Health,Property-
Liability, and Diversified Insurers, Journal of Risk and Insurance, 58 (2): 322-330.
Jensen, M. C., 1986, Agency Cost of Free Cash Flow, Corporate Finance, and Takeovers,
American Economic Review, 76(2): 323 – 329.
King, A. L., 1975, The Market Performance of Diversified and Non-Diversified Organizations
Within the P-L Insurance Industry, Journal of Risk and Insurance, 42: 471-493.
Lai, G. C. and P. Limpaphayom, 2003, Organizational Structure and Performance: Evidence
from the Nonlife Insurance Industry in Japan, Journal of Risk and Insurance, 70(4): 735 – 757
Lang, L. H. P. and R. M. Stultz, 1994, Tobin’s q, Corporate Diversification, and Firm
Performance, Journal of Political Economy, 102(6): 1248 – 1280
Liebenberg, A. P. and D. W. Sommer, 2008, Effects of Corporate Diversification: Evidence
from the Property-Liability Insurance Industry, Journal of Risk and Insurance, 75(4):893 –
919 .
Markham, J. W. 1973. Conglomerate Enterprise and Economic Performance. Cambridge,
Mass.: Harvard University Press.
Mayers, D. and C. W. Smith, Jr., 1988, Ownership Structure Across Lines of Property-Casualty
Insurance, Journal of Law and Economics, 351 – 378.
Palepu, K. 1985, Diversification Strategy, Profit Performance, and the Entropy Measures,
Strategic Management Journal, 6: 239-255.
Rajan, R., H. Servaes, and L. Zingales, 2000, The Cost of Diversity: Diversification Discount
and Inefficient Investment, Journal of Finance, 55(1): 35 – 80.
Ramanujam, V., Varadarajan, P., 1989. Research On Corporate Diversification: A Synthesis,
Strategic Management Journal, 16 (4), 277– 299.
Rhoades, S. A. 1973, The Effect of Diversification on Industry Profit Performance in 241
Manufacturing Industries: 1963, Review of Economics and Statistics, 55(2): 146-155.
Roberts, Mark, “Pros and Cons to the Aetna-Humana Merger,” BenefitsProDaily July 10, 2015.
http://www.benefitspro.com/2015/07/10/pros-and-cons-to-the-aetna-humana-merger
Rumelt, R. P., 1974, Strategy, Structure, and Economic Performance. Cambridge, Mass.:
Harvard University Press.
33
Rumelt, R. P., 1982, Diversification Strategy and Profitability. Strategic Management Journal,
359-369.
Schmid, M. M. and I. Walter, 2012, Geographic Diversification and Firm Value in the
Financial Services Industry, Journal of Empirical Finance, 19(1): 109-122
Servaes, H., 1996. The Value of Diversification During the Conglomerate Merger Wave,
Journal of Finance, 51: 1201–1226.
Servaes, H., and K. Lins, 1999. International Evidence on the Value of Corporate
Diversification, Journal of Finance, 54: 2215–2240
Slovin, M. B., S. A. Johnson, and J. L. Glascock, 1992, Firm Size and the Information Content
of Bank Loan Announcements, Journal of Banking and Finance, 16(6): 1057 – 1071.
Sommer, D. W., 1996, The Impact of Firm Risk On Property-Liability Insurance Prices,
Journal of Risk and Insurance, 63: 501 – 514.
Sorensen, A. T., 2003, Insurer-Hospital Bargaining: Negotiated Discount in Post-Deregulation
Connecticut, Journal of Industrial Economics, 51(4): 469 – 490.
Sorkin, A. R., 2015 “Health Care Law Spurs Merger Talks for Insurers” New York Times, June
23, 2015.
Stultz, R. M., 1990, Managerial Discretion and Optimal Financing Policies, Journal of
Financial Economics, 26(1): 3 – 27.
Tombs, J. W. and R. E. Hyot, 1994, The Effect of Product Line Focus On Insurer Stock
Returns, Proceedings of the International Insurance Society, 331 – 339.
Villalonga, B., 2004, Does Diversification Cause the ‘Diversification Discount’? Financial
Management, 33(2): 5 – 27.
Wernerfelt, B. and C. A. Montgomery, 1988. Tobin’s q and the Importance Of Focus in Firm
Performance, American Economic Review, 78: 246–250.
Williamson, O. E., 1975, Markets and Hierarchies: Analysis And Anti-Trust Implication, New
York, Free Press.
Wooldbridge, J. M. 2002, Econometric Analysis of Cross Section and Panel Data, The MIT
Press.
Wu, V. Y., 2009, Managed Care’s Price Bargaining with Hospitals, Journal of Health
Economics, 28(2009): 350 – 360.