Embed Size (px)
Citation preview
International International Diversification Gains Diversification Gains
and Home Bias in and Home Bias in BankingBanking
Alicia García-Herrero (BIS)Alicia García-Herrero (BIS)
Francisco Vázquez (IMF)Francisco Vázquez (IMF)
Conference on Mergers and Acquisitions of Financial Institutions
L. William Seidman Center, Arlington
November 30-December 1, 2007
OverviewOverview
MotivationMotivation ObjectivesObjectives Related literatureRelated literature Overview of the sampleOverview of the sample Methodological aspects and resultsMethodological aspects and results
Econometric estimatesEconometric estimates Portfolio modelPortfolio model
ConclusionsConclusions
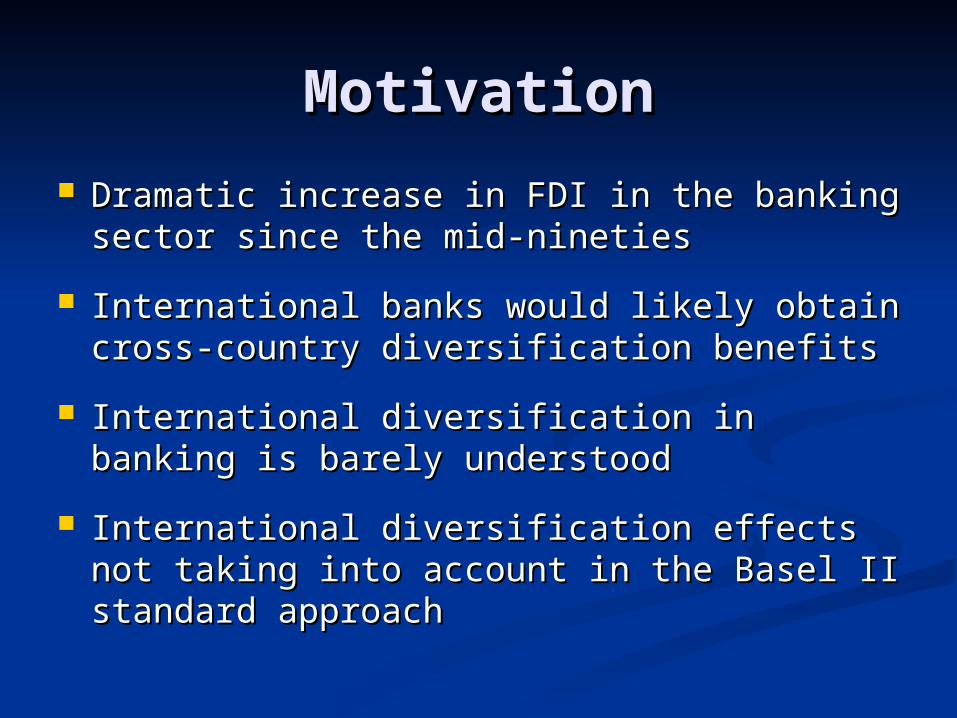
MotivationMotivation
Dramatic increase in FDI in the banking Dramatic increase in FDI in the banking sector since the mid-ninetiessector since the mid-nineties
International banks would likely obtain International banks would likely obtain cross-country diversification benefitscross-country diversification benefits
International diversification in banking is International diversification in banking is barely understoodbarely understood
International diversification effects not International diversification effects not taking into account in the Basel II standard taking into account in the Basel II standard approachapproach
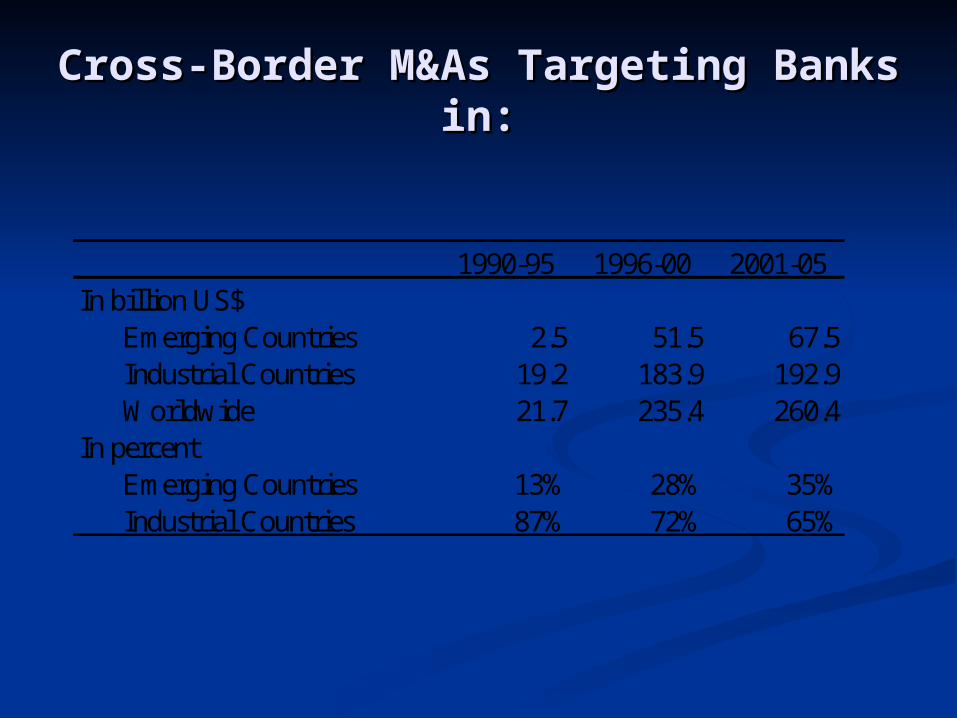
Cross-Border M&As Targeting Cross-Border M&As Targeting Banks in:Banks in:
1990-95 1996-00 2001-05In billion US$
Emerging Countries 2.5 51.5 67.5Industrial Countries 19.2 183.9 192.9Worldwide 21.7 235.4 260.4
In percentEmerging Countries 13% 28% 35%Industrial Countries 87% 72% 65%
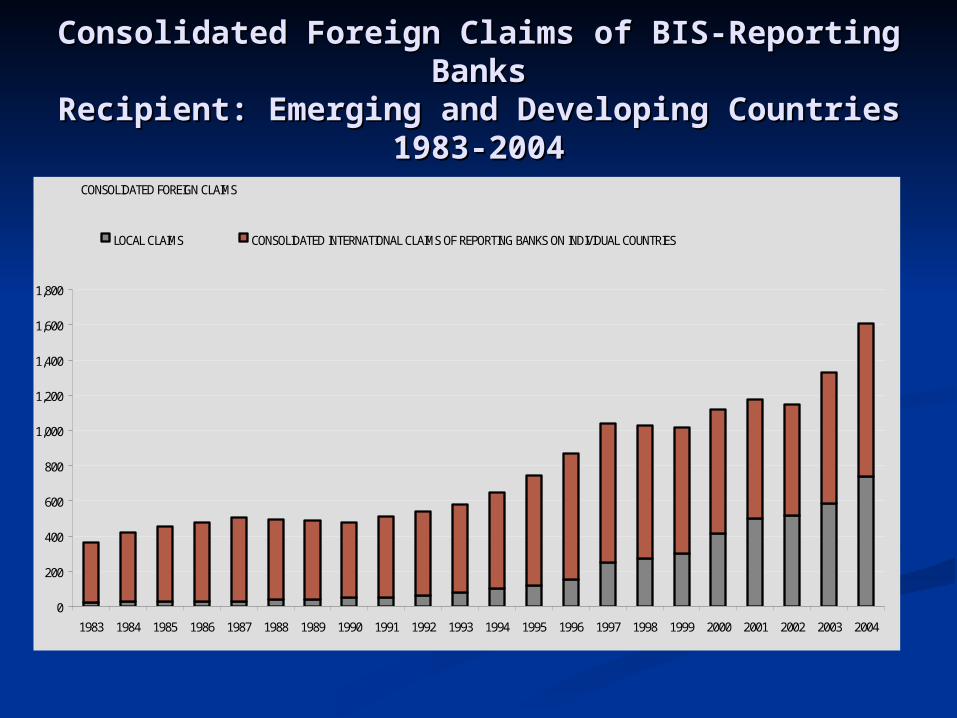
Consolidated Foreign Claims of BIS-Reporting Consolidated Foreign Claims of BIS-Reporting BanksBanks
Recipient: Emerging and Developing Recipient: Emerging and Developing CountriesCountries1983-20041983-2004
CONSOLIDATED FOREIGN CLAIMS
0
200
400
600
800
1,000
1,200
1,400
1,600
1,800
1983 1984 1985 1986 1987 1988 1989 1990 1991 1992 1993 1994 1995 1996 1997 1998 1999 2000 2001 2002 2003 2004
LOCAL CLAIMS CONSOLIDATED INTERNATIONAL CLAIMS OF REPORTING BANKS ON INDIVIDUAL COUNTRIES
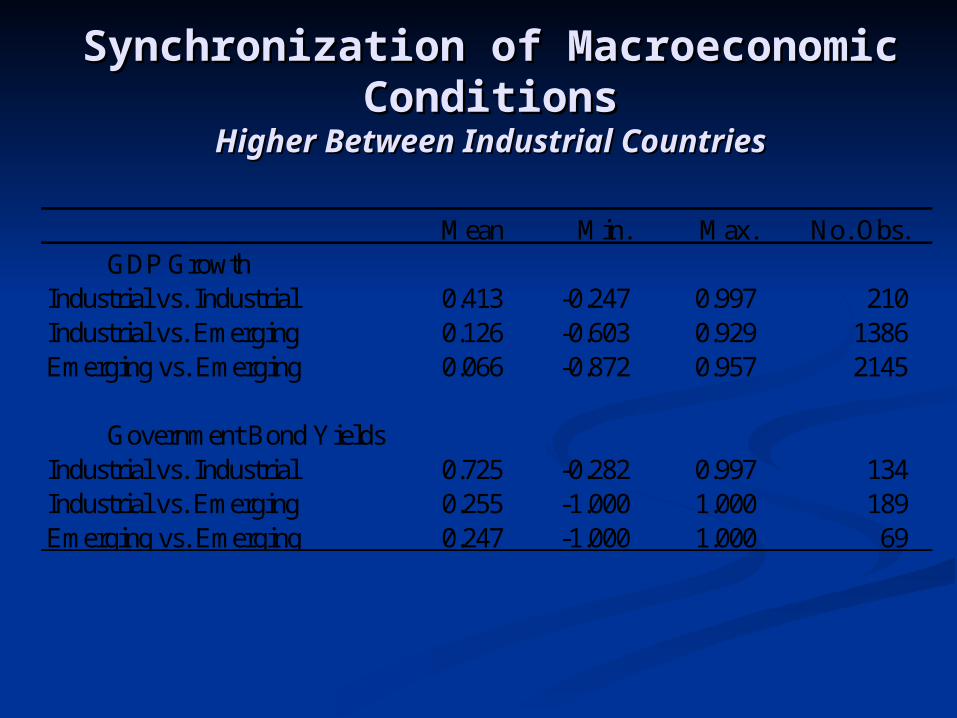
Synchronization of Macroeconomic Synchronization of Macroeconomic ConditionsConditions
Higher Between Industrial CountriesHigher Between Industrial Countries
Mean Min. Max. No. Obs.GDP Growth
Industrial vs. Industrial 0.413 -0.247 0.997 210Industrial vs. Emerging 0.126 -0.603 0.929 1386Emerging vs. Emerging 0.066 -0.872 0.957 2145
Government Bond YieldsIndustrial vs. Industrial 0.725 -0.282 0.997 134Industrial vs. Emerging 0.255 -1.000 1.000 189Emerging vs. Emerging 0.247 -1.000 1.000 69
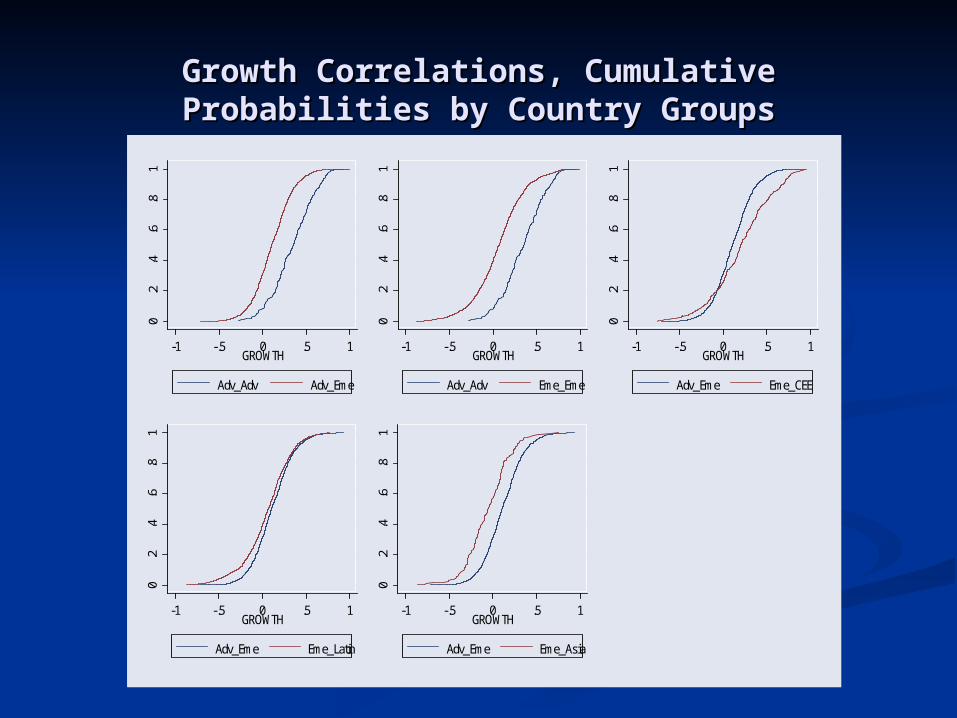
Growth Correlations, Cumulative Probabilities Growth Correlations, Cumulative Probabilities by Country Groupsby Country Groups
0.2
.4.6
.81
-1 -.5 0 .5 1GROWTH
Adv_Adv Adv_Eme0
.2.4
.6.8
1
-1 -.5 0 .5 1GROWTH
Adv_Adv Eme_Eme
0.2
.4.6
.81
-1 -.5 0 .5 1GROWTH
Adv_Eme Eme_CEE
0.2
.4.6
.81
-1 -.5 0 .5 1GROWTH
Adv_Eme Eme_Latin
0.2
.4.6
.81
-1 -.5 0 .5 1GROWTH
Adv_Eme Eme_Asia
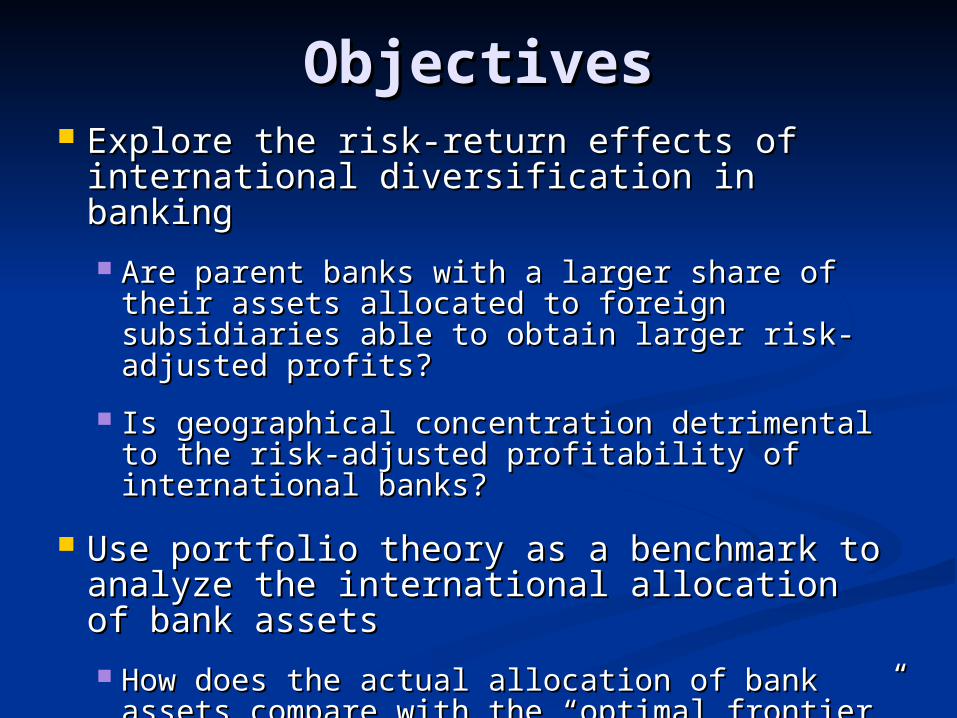
ObjectivesObjectives Explore the risk-return effects of Explore the risk-return effects of
international diversification in bankinginternational diversification in banking
Are parent banks with a larger share of Are parent banks with a larger share of their assets allocated to foreign subsidiaries their assets allocated to foreign subsidiaries able to obtain larger risk-adjusted profits?able to obtain larger risk-adjusted profits?
Is geographical concentration detrimental Is geographical concentration detrimental to the risk-adjusted profitability of to the risk-adjusted profitability of international banks?international banks?
Use portfolio theory as a benchmark to Use portfolio theory as a benchmark to analyze the international allocation of analyze the international allocation of bank assetsbank assets
How does the actual allocation of bank How does the actual allocation of bank assets compare with the “optimal frontier”assets compare with the “optimal frontier”
Related LiteratureRelated Literature Portfolio theory: (MarkovitzPortfolio theory: (Markovitz 1952, 1959) 1952, 1959)
International portfolio diversification: International portfolio diversification: (Grubel, 1968; Levy and Sarnat, 1970; (Grubel, 1968; Levy and Sarnat, 1970; Lessard, 1973)Lessard, 1973)
Geographical local diversification in Geographical local diversification in banking: (Acharya, Hasan, and Saunders, banking: (Acharya, Hasan, and Saunders, 2002; Morgan and Samolyk, 2003)2002; Morgan and Samolyk, 2003)
International diversification in banking: International diversification in banking: (Griffith-Jones, Segoviano and Spratt, 2002; (Griffith-Jones, Segoviano and Spratt, 2002; Buch, Discroll and Ostrgaard, 2005)Buch, Discroll and Ostrgaard, 2005)
SampleSample Source: BankScope; ZephyrSource: BankScope; Zephyr
Coverage:Coverage:
38 large international banks from G7 38 large international banks from G7 countries plus Spaincountries plus Spain
Their 399 subsidiaries overseasTheir 399 subsidiaries overseas
Sample unbalanced 1995-2004, with Sample unbalanced 1995-2004, with over 2,000 observationsover 2,000 observations
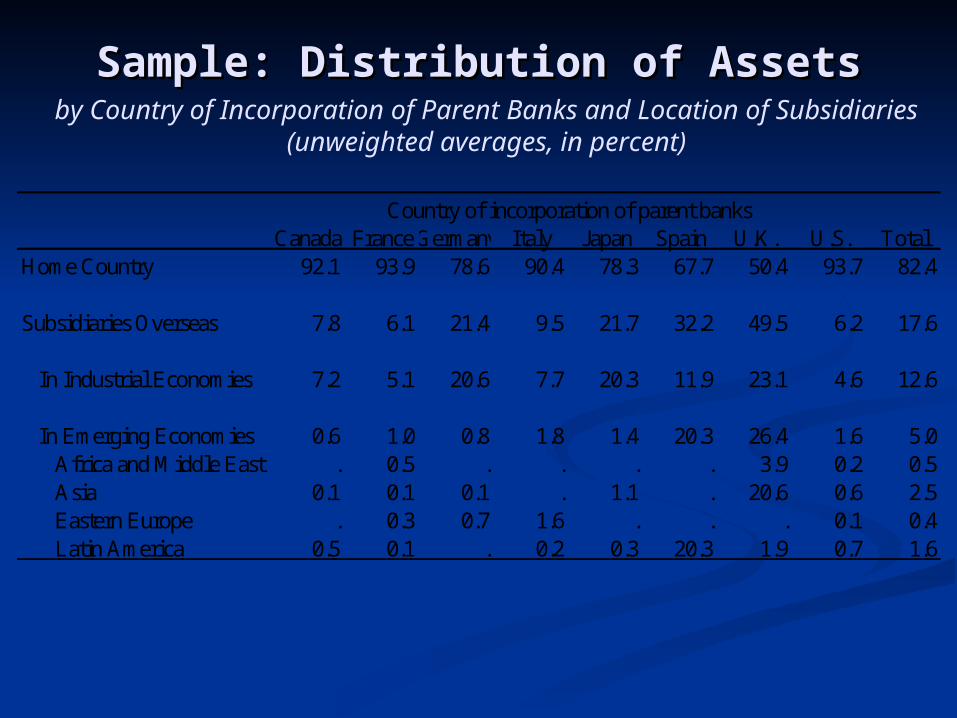
Sample: Distribution of AssetsSample: Distribution of Assetsby Country of Incorporation of Parent Banks and Location of Subsidiaries
(unweighted averages, in percent)
Country of incorporation of parent banksCanada France Germany Italy Japan Spain U.K. U.S. Total
Home Country 92.1 93.9 78.6 90.4 78.3 67.7 50.4 93.7 82.4
Subsidiaries Overseas 7.8 6.1 21.4 9.5 21.7 32.2 49.5 6.2 17.6
In Industrial Economies 7.2 5.1 20.6 7.7 20.3 11.9 23.1 4.6 12.6
In Emerging Economies 0.6 1.0 0.8 1.8 1.4 20.3 26.4 1.6 5.0Africa and Middle East . 0.5 . . . . 3.9 0.2 0.5Asia 0.1 0.1 0.1 . 1.1 . 20.6 0.6 2.5Eastern Europe . 0.3 0.7 1.6 . . . 0.1 0.4Latin America 0.5 0.1 . 0.2 0.3 20.3 1.9 0.7 1.6
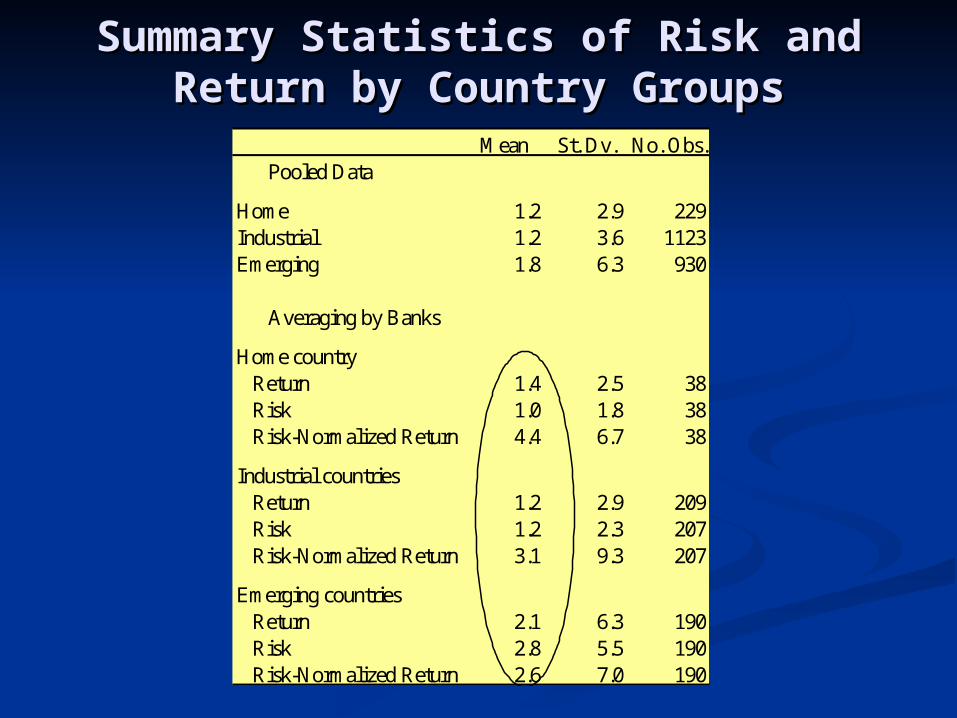
Summary Statistics of Risk and Summary Statistics of Risk and Return by Country GroupsReturn by Country Groups
Mean St. Dv. No. Obs.Pooled Data
Home 1.2 2.9 229Industrial 1.2 3.6 1123Emerging 1.8 6.3 930
Averaging by Banks
Home countryReturn 1.4 2.5 38Risk 1.0 1.8 38Risk-Normalized Return 4.4 6.7 38
Industrial countriesReturn 1.2 2.9 209Risk 1.2 2.3 207Risk-Normalized Return 3.1 9.3 207
Emerging countriesReturn 2.1 6.3 190Risk 2.8 5.5 190Risk-Normalized Return 2.6 7.0 190
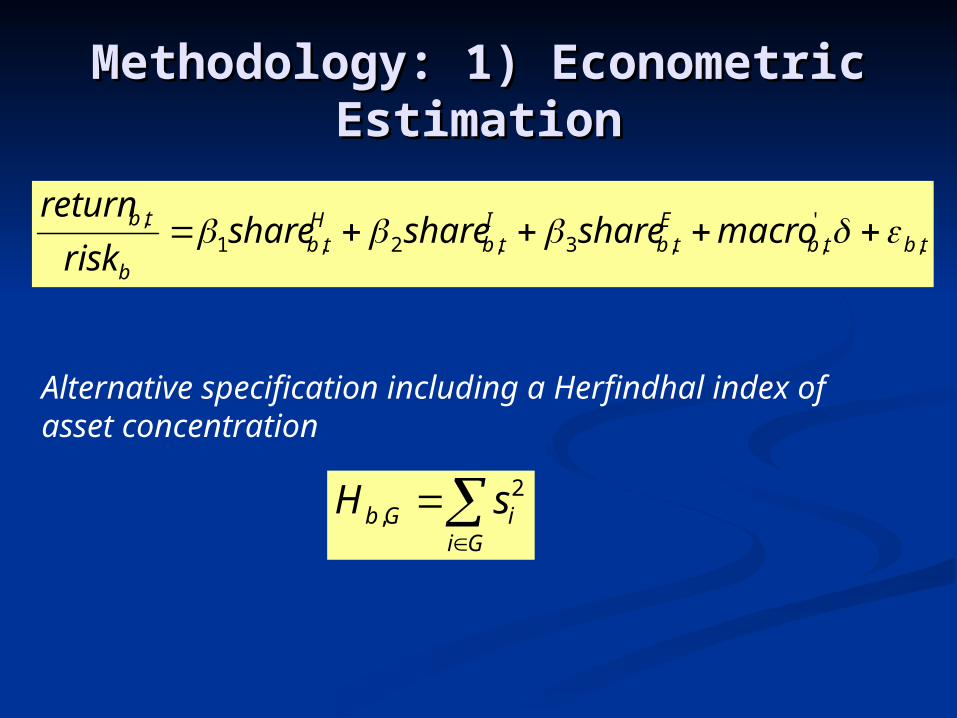
Methodology: 1) Econometric Methodology: 1) Econometric EstimationEstimation
2,b G i
i G
H s
tbtbEtb
Itb
Htb
b
tb macrosharesharesharerisk
return,
',,3,2,1
,
Alternative specification including a Herfindhal index of asset concentration
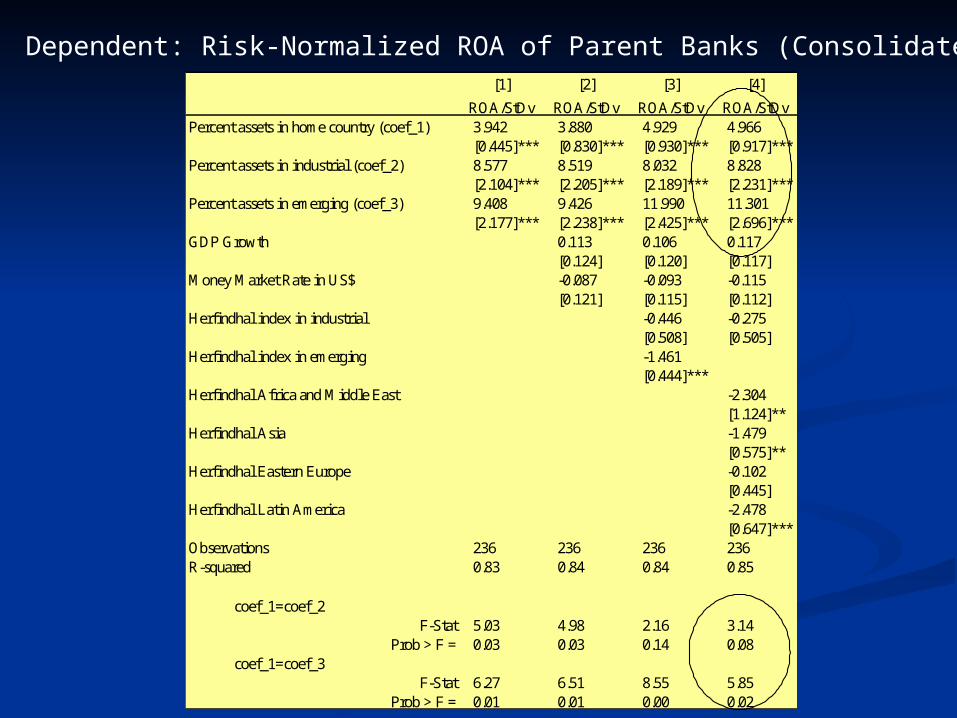
Dependent: Risk-Normalized ROA of Parent Banks (Consolidated)[1] [2] [3] [4]
ROA/StDv ROA/StDv ROA/StDv ROA/StDvPercent assets in home country (coef_1) 3.942 3.880 4.929 4.966
[0.445]*** [0.830]*** [0.930]*** [0.917]***Percent assets in industrial (coef_2) 8.577 8.519 8.032 8.828
[2.104]*** [2.205]*** [2.189]*** [2.231]***Percent assets in emerging (coef_3) 9.408 9.426 11.990 11.301
[2.177]*** [2.238]*** [2.425]*** [2.696]***GDP Growth 0.113 0.106 0.117
[0.124] [0.120] [0.117]Money Market Rate in US$ -0.087 -0.093 -0.115
[0.121] [0.115] [0.112]Herfindhal index in industrial -0.446 -0.275
[0.508] [0.505]Herfindhal index in emerging -1.461
[0.444]***Herfindhal Africa and Middle East -2.304
[1.124]**Herfindhal Asia -1.479
[0.575]**Herfindhal Eastern Europe -0.102
[0.445]Herfindhal Latin America -2.478
[0.647]***Observations 236 236 236 236R-squared 0.83 0.84 0.84 0.85
coef_1=coef_2F-Stat 5.03 4.98 2.16 3.14
Prob > F = 0.03 0.03 0.14 0.08coef_1=coef_3
F-Stat 6.27 6.51 8.55 5.85Prob > F = 0.01 0.01 0.00 0.02
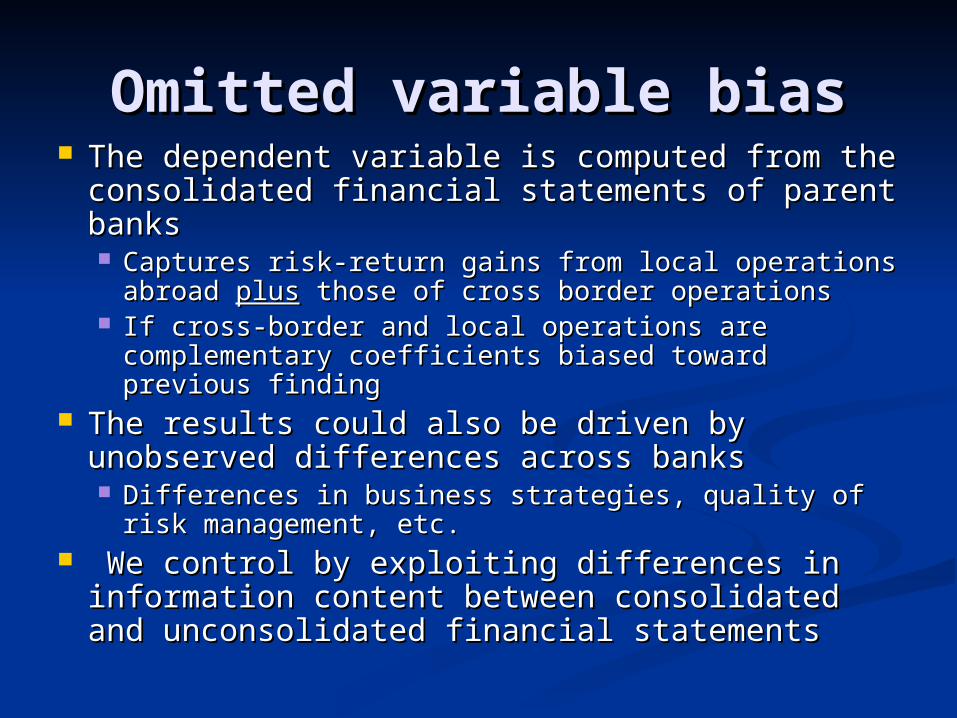
Omitted variable biasOmitted variable bias The dependent variable is computed from the The dependent variable is computed from the
consolidated financial statements of parent consolidated financial statements of parent banksbanks Captures risk-return gains from local operations Captures risk-return gains from local operations
abroad abroad plusplus those of cross border operations those of cross border operations If cross-border and local operations are If cross-border and local operations are
complementary coefficients biased toward previous complementary coefficients biased toward previous findingfinding
The results could also be driven by The results could also be driven by unobserved differences across banksunobserved differences across banks Differences in business strategies, quality of risk Differences in business strategies, quality of risk
management, etc.management, etc. We control by exploiting differences in We control by exploiting differences in
information content between consolidated and information content between consolidated and unconsolidated financial statementsunconsolidated financial statements
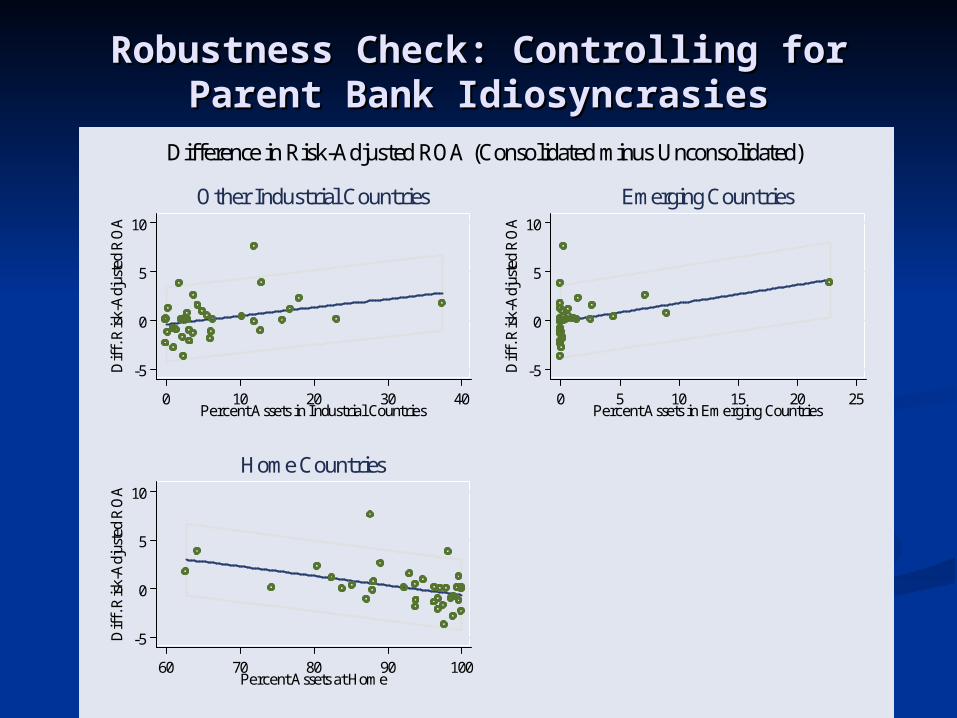
Robustness Check: Controlling for Robustness Check: Controlling for Parent Bank IdiosyncrasiesParent Bank Idiosyncrasies
-5
0
5
10
Dif
f. R
isk-
Adj
uste
d R
OA
0 10 20 30 40Percent Assets in Industrial Countries
Other Industrial Countries
-5
0
5
10
Dif
f. R
isk-
Adj
uste
d R
OA
0 5 10 15 20 25Percent Assets in Emerging Countries
Emerging Countries
-5
0
5
10
Dif
f. R
isk-
Adj
uste
d R
OA
60 70 80 90 100Percent Assets at Home
Home Countries
Difference in Risk-Adjusted ROA (Consolidated minus Unconsolidated)
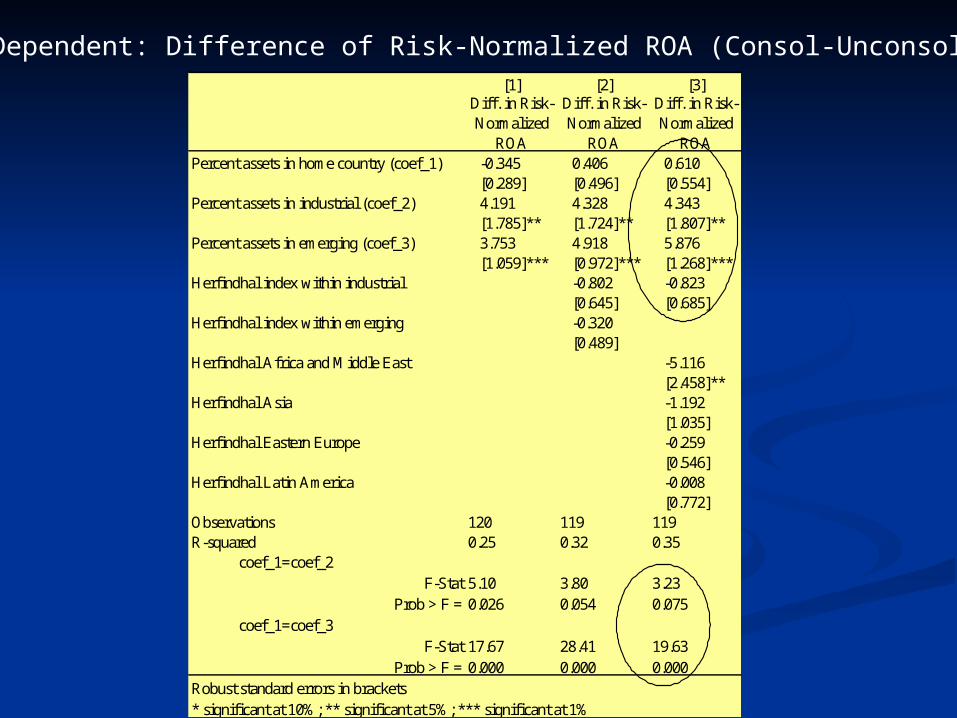
Dependent: Difference of Risk-Normalized ROA (Consol-Unconsol)[1] [2] [3]
Diff. in Risk-Normalized
ROA
Diff. in Risk-Normalized
ROA
Diff. in Risk-Normalized
ROAPercent assets in home country (coef_1) -0.345 0.406 0.610
[0.289] [0.496] [0.554]Percent assets in industrial (coef_2) 4.191 4.328 4.343
[1.785]** [1.724]** [1.807]**Percent assets in emerging (coef_3) 3.753 4.918 5.876
[1.059]*** [0.972]*** [1.268]***Herfindhal index within industrial -0.802 -0.823
[0.645] [0.685]Herfindhal index within emerging -0.320
[0.489]Herfindhal Africa and Middle East -5.116
[2.458]**Herfindhal Asia -1.192
[1.035]Herfindhal Eastern Europe -0.259
[0.546]Herfindhal Latin America -0.008
[0.772]Observations 120 119 119R-squared 0.25 0.32 0.35
coef_1=coef_2F-Stat 5.10 3.80 3.23
Prob > F = 0.026 0.054 0.075coef_1=coef_3
F-Stat 17.67 28.41 19.63Prob > F = 0.000 0.000 0.000
Robust standard errors in brackets* significant at 10%; ** significant at 5%; *** significant at 1%
Methodology: 2) Portfolio modelMethodology: 2) Portfolio model
Use portfolio theory as a normative benchmarkUse portfolio theory as a normative benchmark Treat foreign subsidiaries as single components of Treat foreign subsidiaries as single components of
the world portfolio of international banks the world portfolio of international banks Caveats:Caveats:
Transaction costs of entry/exit a given countryTransaction costs of entry/exit a given country Bank subsidiaries may not be perfect substitutesBank subsidiaries may not be perfect substitutes Time dimension is not balanced—difficult to Time dimension is not balanced—difficult to
compute variances and covariances of returns compute variances and covariances of returns across subsidiariesacross subsidiaries
Treatment:Treatment: Focus on portfolio optimization within the observed Focus on portfolio optimization within the observed
set of subsidiaries of each international bankset of subsidiaries of each international bank Aggregate returns of subsidiaries by regions Aggregate returns of subsidiaries by regions
(industrial vs. emerging)(industrial vs. emerging)
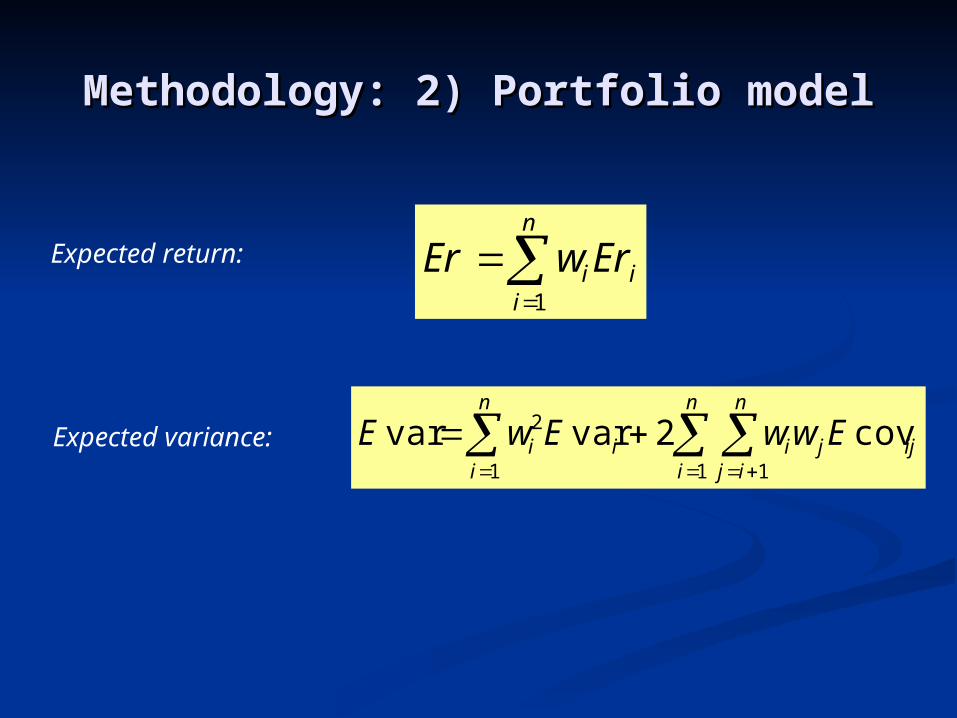
Methodology: 2) Portfolio modelMethodology: 2) Portfolio model
n
iiiErwEr
1
n
i
n
ijijji
n
iii EwwEwE
1 11
2 cov2varvar
Expected return:
Expected variance:
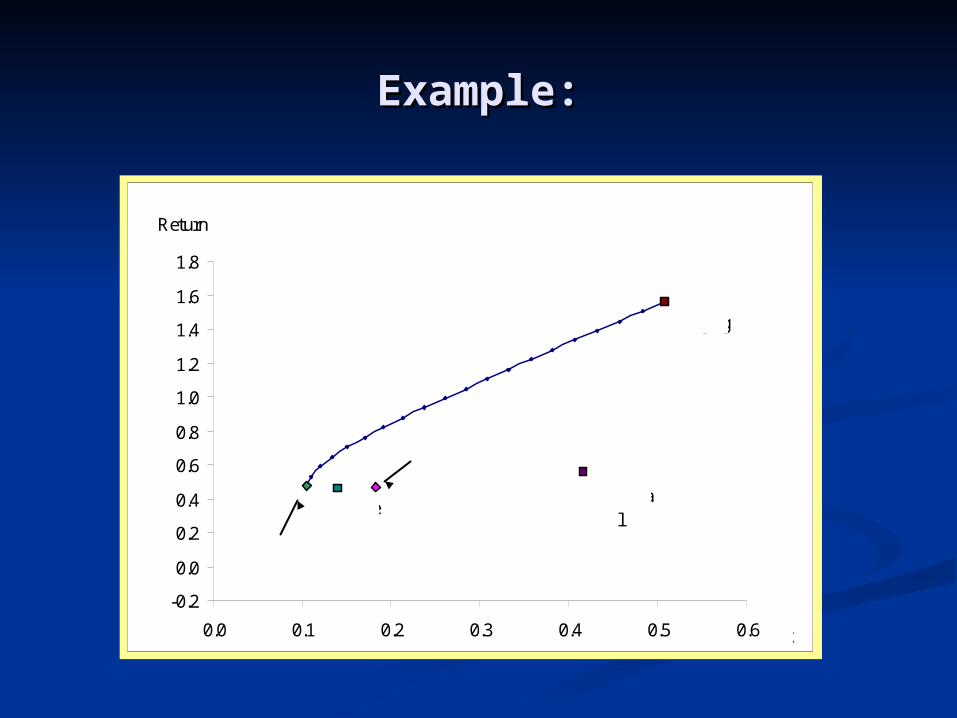
Example:Example:
-0.2
0.0
0.2
0.4
0.6
0.8
1.0
1.2
1.4
1.6
1.8
0.0 0.1 0.2 0.3 0.4 0.5 0.6
Return
Risk
Efficient Frontier
Home
Alternative Return-Equivalent Allocation
Observed Portfolio
Industrial
Emerging
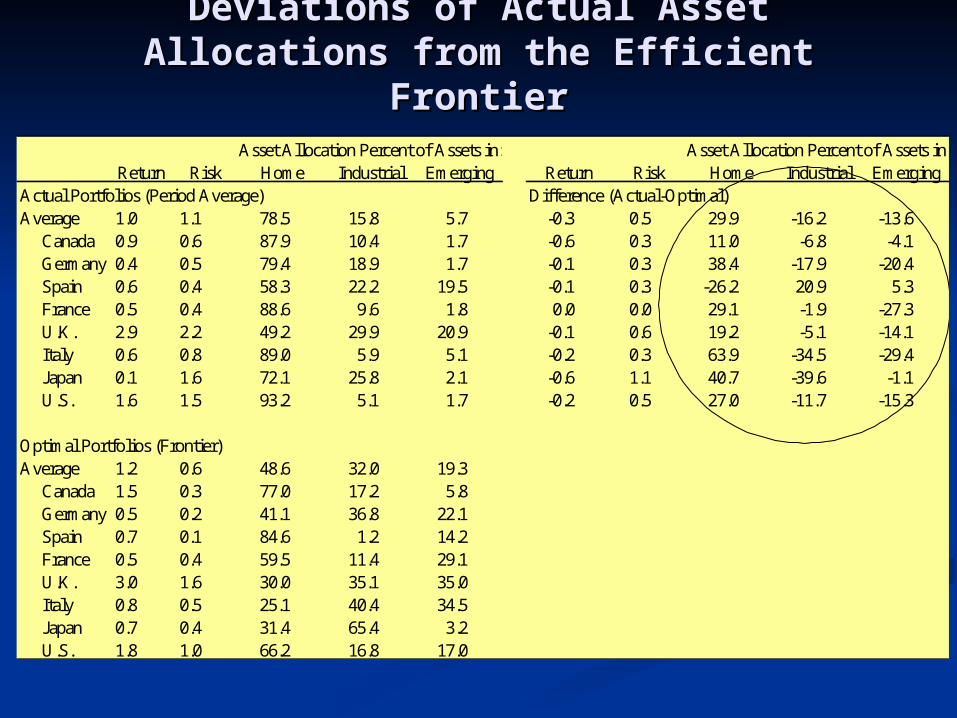
Deviations of Actual Asset Allocations Deviations of Actual Asset Allocations from the Efficient Frontierfrom the Efficient Frontier
Return Risk Home Industrial Emerging Return Risk Home Industrial EmergingActual Portfolios (Period Average) Difference (Actual-Optimal)Average 1.0 1.1 78.5 15.8 5.7 -0.3 0.5 29.9 -16.2 -13.6
Canada 0.9 0.6 87.9 10.4 1.7 -0.6 0.3 11.0 -6.8 -4.1Germany 0.4 0.5 79.4 18.9 1.7 -0.1 0.3 38.4 -17.9 -20.4Spain 0.6 0.4 58.3 22.2 19.5 -0.1 0.3 -26.2 20.9 5.3France 0.5 0.4 88.6 9.6 1.8 0.0 0.0 29.1 -1.9 -27.3U.K. 2.9 2.2 49.2 29.9 20.9 -0.1 0.6 19.2 -5.1 -14.1Italy 0.6 0.8 89.0 5.9 5.1 -0.2 0.3 63.9 -34.5 -29.4Japan 0.1 1.6 72.1 25.8 2.1 -0.6 1.1 40.7 -39.6 -1.1U.S. 1.6 1.5 93.2 5.1 1.7 -0.2 0.5 27.0 -11.7 -15.3
Optimal Portfolios (Frontier)Average 1.2 0.6 48.6 32.0 19.3
Canada 1.5 0.3 77.0 17.2 5.8Germany 0.5 0.2 41.1 36.8 22.1Spain 0.7 0.1 84.6 1.2 14.2France 0.5 0.4 59.5 11.4 29.1U.K. 3.0 1.6 30.0 35.1 35.0Italy 0.8 0.5 25.1 40.4 34.5Japan 0.7 0.4 31.4 65.4 3.2U.S. 1.8 1.0 66.2 16.8 17.0
Asset Allocation Percent of Assets in:Asset Allocation Percent of Assets in:
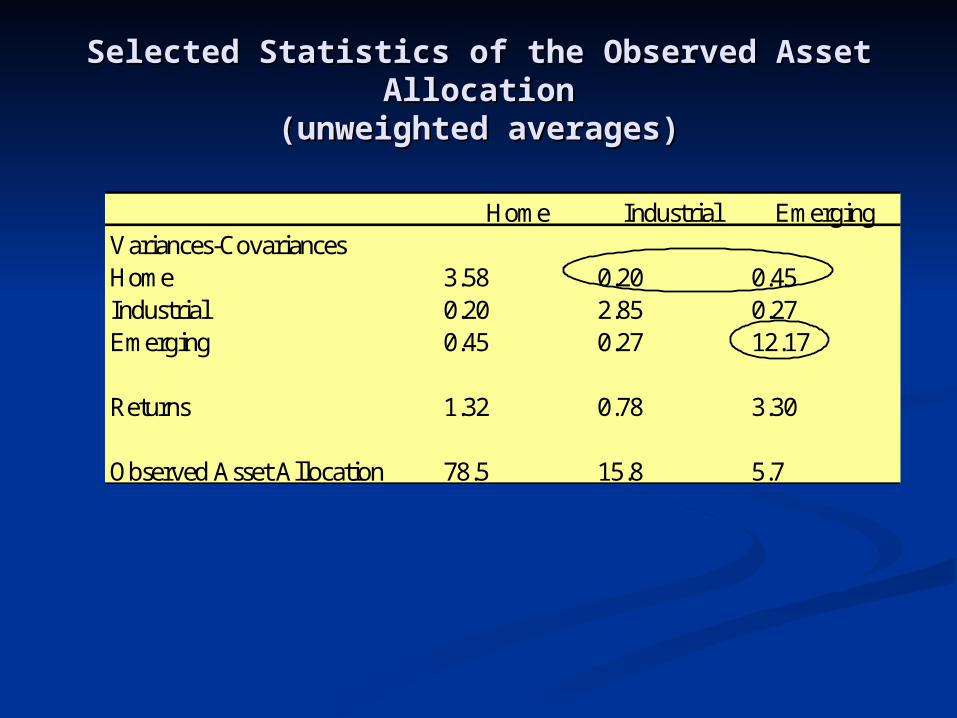
Selected Statistics of the Observed Asset Selected Statistics of the Observed Asset AllocationAllocation
(unweighted averages)(unweighted averages)
Home Industrial EmergingVariances-CovariancesHome 3.58 0.20 0.45Industrial 0.20 2.85 0.27Emerging 0.45 0.27 12.17
Returns 1.32 0.78 3.30
Observed Asset Allocation 78.5 15.8 5.7
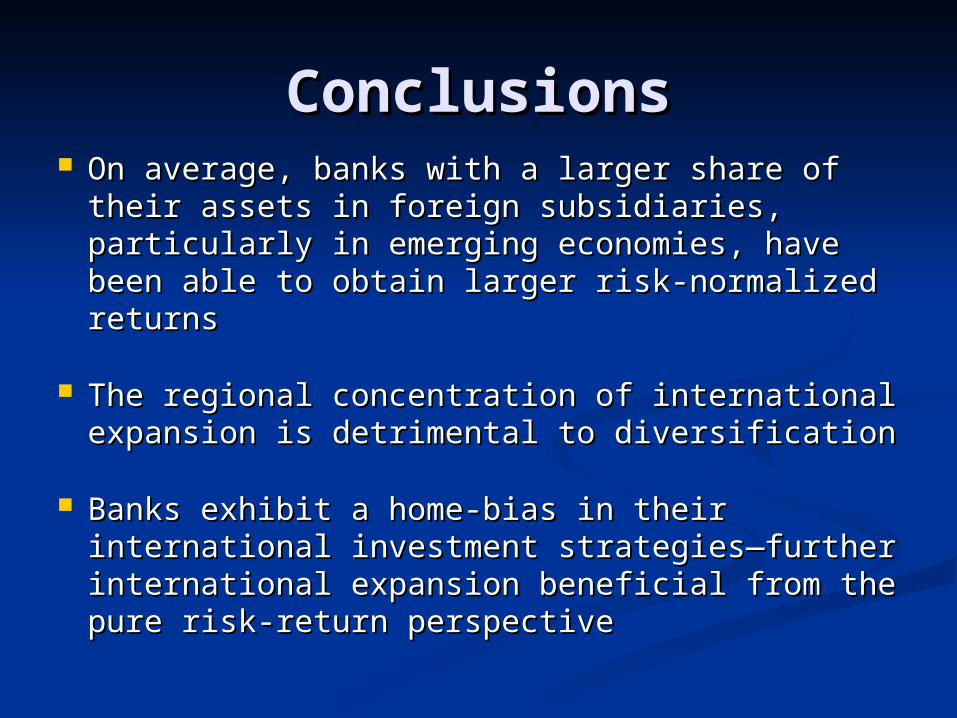
ConclusionsConclusions On average, banks with a larger share of On average, banks with a larger share of
their assets in foreign subsidiaries, their assets in foreign subsidiaries, particularly in emerging economies, have particularly in emerging economies, have been able to obtain larger risk-normalized been able to obtain larger risk-normalized returnsreturns
The regional concentration of international The regional concentration of international expansion is detrimental to diversificationexpansion is detrimental to diversification
Banks exhibit a home-bias in their Banks exhibit a home-bias in their international investment strategies—further international investment strategies—further international expansion beneficial from the international expansion beneficial from the pure risk-return perspectivepure risk-return perspective
Conclusions (Cont.)Conclusions (Cont.) The estimates strongly The estimates strongly
underestimate international underestimate international diversification benefitsdiversification benefits
Caveat: The data do not allow to Caveat: The data do not allow to disentangle cross-border investment disentangle cross-border investment by parent banks, which accounts for by parent banks, which accounts for a large part of international a large part of international exposuresexposures

Thank you!Thank you!