Embed Size (px)
Citation preview

Victorian Water Quality
Monitoring Network
Trend Analysis
Corangamite CatchmentManagement Authority Area
Produced for the Department of Natural Resourcesand Environment by Sinclair Knight Merz

Victorian Water Quality Monitoring Network Trend Analysis
Corangamite Catchment Management Authority Area
Other reports in this series:
Victorian Statewide SummaryEast Gippsland Catchment Management Authority AreaGlenelg Catchment Management Authority AreaGoulburn Catchment Management Authority AreaMallee Catchment Management Authority AreaNorth Central Catchment Management Authority AreaNorth East Catchment Management Authority AreaPort Phillip Catchment Management Authority AreaWest Gippsland Catchment Management Authority AreaWimmera Catchment Management Authority Area
Prepared by W.E. Smith and R.J. NathanSinclair Knight Merz

i
Executive Summary
The Victorian Water Quality Monitoring Network (VWQMN) consists of around280 stations located throughout Victoria. A range of water quality indicatorsare measured at these sites and data has been measured for up to 25 yearsat approximately monthly intervals. While this data set represents asubstantial body of information, to date there has been no systematic andconsistent analysis of the data that provides an assessment of the temporaland spatial variation of the indicators. Such analysis can provide valuableinformation regarding the impacts of past management practices oncatchment processes, the impact of land management practices andinterventions, and the likely direction of future water quality changes.
The scope of this report is to present the nature and significance of timetrends in water quality data recorded at VWQMN sites within the regioncontrolled by the Corangamite Catchment Management Authority. Onlystations with records greater than ten years were used, and the indicatorsconsidered were pH, turbidity, electrical conductivity (EC), total phosphorusand total nitrogen.
This study has been undertaken as part of a state-wide review of water qualitytrends, and companion reports have been prepared that present the trendresults for other Victorian Catchment Management Authorities. In addition, areport covering the whole State has been produced that summarises theresults obtained for the individual regions. This series of reports thus providescatchment managers with a valuable source document that containsinformation in a form that has not been previously available.
The GAM (Generalised Additive Model) approach was used to identify themagnitude and statistical significance of the time trends. The GAM approachhas a number of significant advantages over traditional trend detectiontechniques as it easily accommodates problems associated with periods ofmissing data, serial correlation, seasonality, climatic influences, and non-constant variance. Overall, the GAM approach is ideally suited to the analysisof “real world” data, and its ability to satisfy the required statisticalassumptions means that any inferences drawn regarding statisticalsignificance are robust and accurate.
The preferred GAM model adopted for the study incorporates spline functionsto account for the influence of both time and streamflow, and additionalfunctions were included to remove the effects of seasonality, serialdependence, and non-normality. In some cases there was insufficient data tofit the preferred model, and thus it was necessary to use functions based onpolynomial rather than spline terms.
For the Corangamite catchment, a substantial number of trends (for allpollutants) were of zero magnitude indicating no change in the pollutantlevels over time.

ii
Contents
Executive Summary i
1. Introduction 1
2. Data Availability 22.1 General 22.2 Length and Consistency of the Data Record 22.3 Data Below the Detection Limit 5
3. Model Selection and Formulation 63.1 General Requirements for Trend Analysis 63.2 Overview of the GAM Approach 73.3 Form of Adopted GAM Model 73.4 Model Application 93.5 Model assessment 103.6 Characterisation of Trend 13
3.6.1 Statistical Significance of Trends 133.6.2 Evaluation of Regional Trends 15
4. Results 17
5. Conclusions 24
Appendix A - Data Availability in the Corangamite CMA 25
Appendix B - Trend plots for stations in the Corangamite CMA 26

1
1. Introduction
The Victorian Water Quality Monitoring Network (VWQMN) consists of around280 stations throughout Victoria. A range of water quality indicators aremeasured at these sites, and data has been measured for up to 25 years atapproximately monthly intervals. While this data set represents a substantialbody of information, to date there has been no systematic and consistentanalysis of the data that provides an assessment of the temporal and spatialvariation of the indicators. Such analysis can provide valuable informationregarding the impacts of past management practices on catchmentprocesses, the impact of land management practices and interventions, andthe likely direction of future water quality changes.
The overall aim of this study was to investigate the nature and significance oftime trends in water quality data recorded at VWQMN sites throughoutVictoria. The indicators considered were pH, turbidity, electrical conductivity(EC), total phosphorus and total nitrogen, and in order to ensure that thetrend results were meaningful, only those stations with at least 10 years ofrecord were included in the analysis.
Rather than provide detailed trend results for all water quality sites acrossVictoria in a single report, it was decided to prepare separate documents foreach region controlled by the Catchment Management Authorities (CMAs).Thus, reports have been prepared for all CMA regions within Victoria, namely:¨ Corangamite¨ East Gippsland¨ Glenelg¨ Goulburn¨ Mallee¨ North Central¨ North East¨ Port Phillip¨ West Gippsland¨ Wimmera
In addition, a report covering the whole State has also been produced thatsummarises the results obtained for the individual regions. It is hoped thatthis series of reports will provides catchment managers with a valuablesource document that contains information in a form that has not beenpreviously available.
This report presents a summary of the data availability (Section 2), thegeneral approach used for the study (Section 3), and a description of theresults obtained (Section 4).
2
2. Data Availability
2.1 General
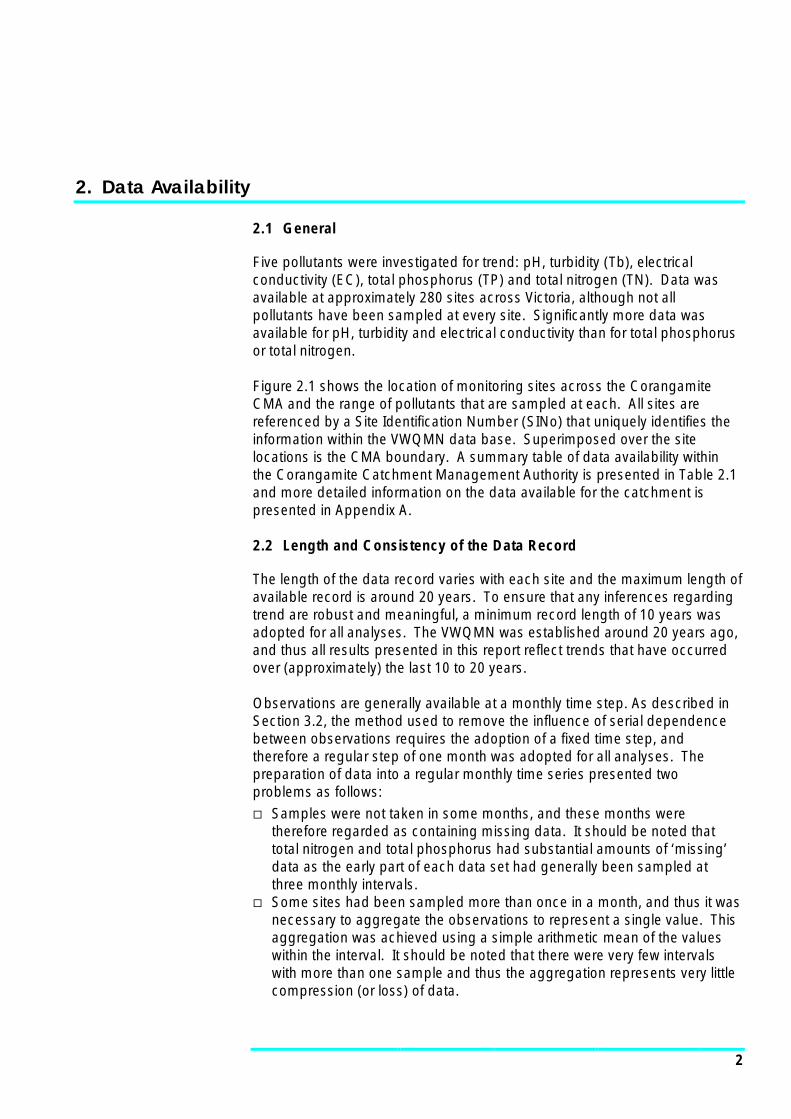
Five pollutants were investigated for trend: pH, turbidity (Tb), electricalconductivity (EC), total phosphorus (TP) and total nitrogen (TN). Data wasavailable at approximately 280 sites across Victoria, although not allpollutants have been sampled at every site. Significantly more data wasavailable for pH, turbidity and electrical conductivity than for total phosphorusor total nitrogen.
Figure 2.1 shows the location of monitoring sites across the CorangamiteCMA and the range of pollutants that are sampled at each. All sites arereferenced by a Site Identification Number (SINo) that uniquely identifies theinformation within the VWQMN data base. Superimposed over the sitelocations is the CMA boundary. A summary table of data availability withinthe Corangamite Catchment Management Authority is presented in Table 2.1and more detailed information on the data available for the catchment ispresented in Appendix A.
2.2 Length and Consistency of the Data Record
The length of the data record varies with each site and the maximum length ofavailable record is around 20 years. To ensure that any inferences regardingtrend are robust and meaningful, a minimum record length of 10 years wasadopted for all analyses. The VWQMN was established around 20 years ago,and thus all results presented in this report reflect trends that have occurredover (approximately) the last 10 to 20 years.
Observations are generally available at a monthly time step. As described inSection 3.2, the method used to remove the influence of serial dependencebetween observations requires the adoption of a fixed time step, andtherefore a regular step of one month was adopted for all analyses. Thepreparation of data into a regular monthly time series presented twoproblems as follows:¨ Samples were not taken in some months, and these months were
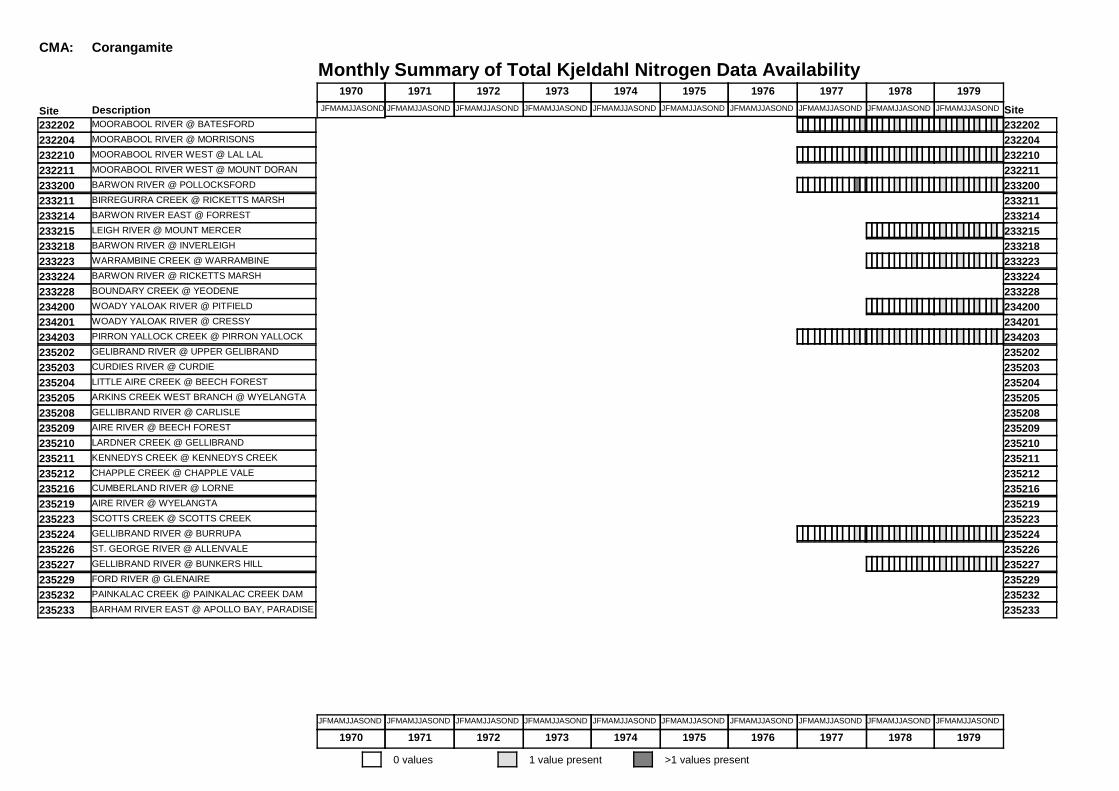
therefore regarded as containing missing data. It should be noted thattotal nitrogen and total phosphorus had substantial amounts of ‘missing’data as the early part of each data set had generally been sampled atthree monthly intervals.
¨ Some sites had been sampled more than once in a month, and thus it wasnecessary to aggregate the observations to represent a single value. Thisaggregation was achieved using a simple arithmetic mean of the valueswithin the interval. It should be noted that there were very few intervalswith more than one sample and thus the aggregation represents very littlecompression (or loss) of data.

#
#
#
#
#
#
#
#
#
#
#
#
#
#
#
##
#
#
#
#
#
#
##
##
#
#
#
#
#
#
#
232202
232204
232210
232211
233200
233214
233215
233218
233224
233228
234200
234201
234203
235202
235203
235204235205
235208
235209
235210
235211235212
235216
235219235224
235226235227
235229
235232
235233
233211
233223
235223
Location of Monitoring SitesCORANGAMITE CMACORANGAMITE CMA10 0 10 KilometersLocation of Monitoring Sites
i:\wcms\wc00838\cad\arcview\Corangam.apr; Monitoring
Figure 2.1

4
Table 2.1: Summary of data analysed for the Corangamite CMA
StationNumber
Station Name pH Tb EC TN Tp
232202 Moorabool River @ Batesford ü ü ü ü ü232204 Moorabool River @ Morrisons ü ü ü232210 Moorabool River West Branch @ Lal Lal ü ü ü ü ü232211 Moorabool River West Branch @ Mount Doran ü ü ü233200 Barwon River @ Pollocksford ü ü ü ü ü233211 Birregurra Creek @ Ricketts Marsh ü ü ü233214 Barwon River East Branch @ Forrest (Above Tunnel) ü ü ü233215 Leigh River @ Mount Mercer ü ü ü ü ü233218 Barwon River @ Inverleigh ü ü ü233223 Warrambine Creek @ Warrambine ü ü ü ü ü233224 Barwon River @ Ricketts Marsh ü ü ü233228 Boundary Creek @ Yeodene ü ü ü234200 Woady Yaloak River @ Pitfield ü ü ü ü ü234201 Woady Yaloak River @ Cressy (Yarima) ü ü ü234203 Pirron Yallock Creek @ Pirron Yallock ü ü ü ü ü235202 Gelibrand River @ Upper Gelibrand ü ü ü235203 Curdies River @ Curdie ü ü ü235204 Little Aire Creek @ Beech Forest ü ü ü235205 Arkins Creek West Branch @ Wyelangta ü ü ü235208 Gellibrand River @ Carlisle ü ü ü235209 Aire River @ Beech Forest ü ü ü235210 Lardner Creek @ Gellibrand ü ü ü235211 Kennedys Creek @ Kennedys Creek ü ü ü235212 Chapple Creek @ Chapple Vale ü ü ü235216 Cumberland River @ Lorne ü ü ü235219 Aire River @ Wyelangta ü ü ü235223 Scotts Creek @ Scotts Creek ü ü ü235224 Gellibrand River @ Burrupa ü ü ü ü ü235226 St. George River @ Allenvale ü ü ü235227 Gellibrand River @ Bunkers Hill ü ü ü ü ü235229 Ford River @ Glenaire ü ü ü235232 Painkalac Creek @ Painkalac Creek Dam ü ü ü235233 Barham River East Branch @ Apollo Bay, Paradise ü ü ü

5
2.3 Data Below the Detection Limit
Some data was reported as being less than a certain value (ie ‘< 0.005mg/l’)indicating that the measured concentration was less than the detection limitof the measuring technique. This was particularly a problem for the nutrientindicators, ie total phosphorus and oxidised nitrogen.
There are several possible approaches to dealing with this type of data. Forexample, the data could be treated as missing or else set to half themagnitude of the reporting limit.
There is no generally accepted approach to dealing with data below thereporting limit. While certain non-parametric approaches to trend analysis arenot affected by such observations, it is usually necessary to treat the data insome manner to ensure that systematic error is not introduced into theanalyses. For this study, all data recorded as being below the detection limitwere simply set equal to the detection limit. Across the whole State, datatreated in this manner represented less than 2% of the total sample, andtherefore the manner of treatment is not expected to influence the results.

6
3. Model Selection and Formulation
3.1 General Requirements for Trend Analysis
There are many techniques available for the analysis of trends in data, eachof which relies on different statistical assumptions. Differentiation betweenthe techniques is based largely on the power of each technique to correctlydetect trends given the properties of the particular data set underconsideration. For example, substantial periods of missing data, as arecommonly found in hydrologic time series, can drastically reduce the ability ofa particular technique to detect the trend.
In practice, the investigation of trends is problematic as hydrologic data aregenerally:¨ highly skewed (ie not normally distributed);¨ serially dependent (particularly when using data collected at monthly or
more frequent intervals);¨ markedly seasonal;¨ subject to periods of missing observations; and,¨ are affected by exogenous influences (ie factors other than time that
influence the response variable of interest).
Unfortunately, unless the correct preventative steps are taken, the abovecharacteristics generally violate some (or all) of the underlying assumptions ofall established trend detection techniques. Consequently, inferencesregarding the statistical significance of suspected trends are often incorrect.
Recently Morton (1996) demonstrated the advantages of a parametricmethod, the Generalised Additive Model (GAM), to estimate time trends inhydrologic time series data. Morton showed how the technique can easily beused to satisfy all required assumptions. In particular, he highlights that theGAM approach is generally more flexible, and allows non-linear time trendsand exogenous influences to be easily accommodated. Morton also makesthe important point that existing non-parametric techniques do not cope verywell with serially correlated data, a problem that is easily rectified with theGAM approach by the inclusion of an autoregressive term. An informaldescription of the GAM approach, and examples that illustrate application ofthe technique to a range of problems commonly encountered in hydrologictrend detection, is presented by Nathan et al. (1999).
In common with many trend tests, the main assumptions that need to besatisfied with the GAM technique are that the residuals must: (i) be normallydistributed, (ii) have constant variance, and (iii) be serially independent. Asdiscussed in Section 3.2, the latter assumption can usually be satisfied byjointly fitting a time series model. Errors associated with the remainingassumptions can usually be minimised by applying appropriatetransformations to the data.

7
3.2 Overview of the GAM Approach
A GAM model can be formulated as follows:
y = β0 + β1f(x1) + β2f(x2) + … βnf(xn) + f(ε) (1)
where y is the water quality time series suspected of containing a trend, x1, x2,x3 … . xn are explanatory variables, β0 is a constant, and ε is an error term. Inessence, the form of the model is similar to that used in multiple regression,though in the context of water quality trend detection, the explanatoryvariables may represent functional relationships between y and some otherhydrologic time series, or else they may represent some other time-basedfunction altogether. Importantly, all functional relationships incorporated intothe model are fitted jointly.
When used for trend detection, one of the explanatory variables that needs tobe included is an appropriate function of time. In its simplest formulation, thetime variable adopted could simply consist of the (decimalised) date of theobservation. If it is found that the time trend is non-linear over the period ofrecord, then a spline or polynomial function can be fitted to the timecomponent.
Other explanatory variables can be added successively as required. Forexample, if a water quality variable (such as turbidity) is dependent on flowmagnitude, then it will be necessary to include a functional relationshipbetween flow and turbidity. Other explanatory variables often required includeterms for explaining diurnal or seasonal variation, or terms for removing serialdependence between observations.
After identifying necessary explanatory variables and the appropriatefunctional forms, a GAM is fitted to the water quality time series of interest.The time trend curve is characterised by the variation in y with time accordingto the explanatory variable(s) representative of average conditions. If a linearfunction of time is used then it will only be possible to characterise trend by astraight line. However, if a non-linear function is used then the time trend canbe characterised as a smooth function varying over the period of record. Thestatistical significance of the time component is measured by the significanceof the relevant coefficient in the model. The distribution of the fittedcoefficients are based on the distribution of the random error term ε .
3.3 Form of Adopted GAM Model
In this study, the choice of explanatory variables was made on the basis ofpreliminary analysis of the data sets and previous experience. Streamflow,measured at the time of sampling of the pollutant was included as themagnitude of flow has a major influence on the pollutant concentration. Aseasonal component was also added to account for variability in the pollutant
8
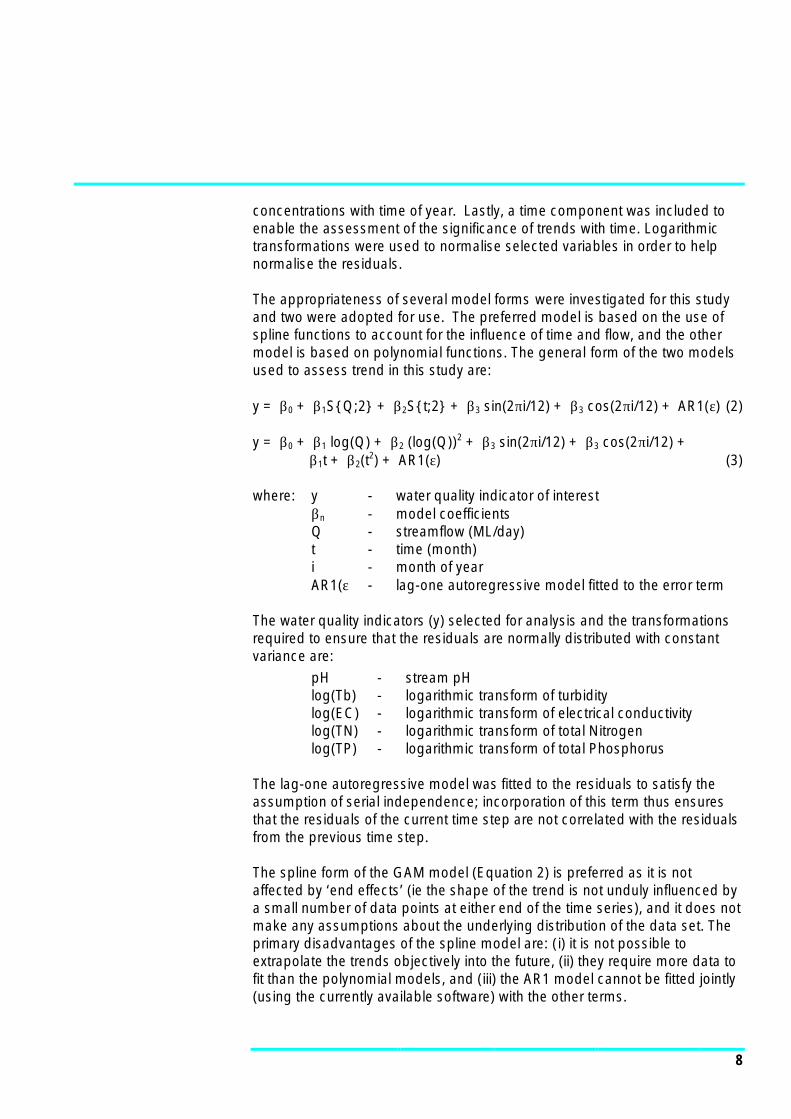
concentrations with time of year. Lastly, a time component was included toenable the assessment of the significance of trends with time. Logarithmictransformations were used to normalise selected variables in order to helpnormalise the residuals.
The appropriateness of several model forms were investigated for this studyand two were adopted for use. The preferred model is based on the use ofspline functions to account for the influence of time and flow, and the othermodel is based on polynomial functions. The general form of the two modelsused to assess trend in this study are:
y = β0 + β1S{Q;2} + β2S{t;2} + β3 sin(2πi/12) + β3 cos(2πi/12) + AR1(ε) (2)
y = β0 + β1 log(Q) + β2 (log(Q))2 + β3 sin(2πi/12) + β3 cos(2πi/12) +β1t + β2(t2) + AR1(ε) (3)
where: y - water quality indicator of interestβn - model coefficientsQ - streamflow (ML/day)t - time (month)i - month of yearAR1(ε) - lag-one autoregressive model fitted to the error term
The water quality indicators (y) selected for analysis and the transformationsrequired to ensure that the residuals are normally distributed with constantvariance are:
pH - stream pHlog(Tb) - logarithmic transform of turbiditylog(EC) - logarithmic transform of electrical conductivitylog(TN) - logarithmic transform of total Nitrogenlog(TP) - logarithmic transform of total Phosphorus
The lag-one autoregressive model was fitted to the residuals to satisfy theassumption of serial independence; incorporation of this term thus ensuresthat the residuals of the current time step are not correlated with the residualsfrom the previous time step.
The spline form of the GAM model (Equation 2) is preferred as it is notaffected by ‘end effects’ (ie the shape of the trend is not unduly influenced bya small number of data points at either end of the time series), and it does notmake any assumptions about the underlying distribution of the data set. Theprimary disadvantages of the spline model are: (i) it is not possible toextrapolate the trends objectively into the future, (ii) they require more data tofit than the polynomial models, and (iii) the AR1 model cannot be fitted jointly(using the currently available software) with the other terms.

9
The advantage of the polynomial function relates primarily to the ability to beable to extrapolate the trends. The primary disadvantage is that thepolynomial functions are subject to end-effects, ie a small number ofobservations at either end of the time series may unduly influence the shapeof the inferred trend. A further disadvantage of using the polynomial functionis that a particular shape of the data is assumed. For example, if a secondorder polynomial function is used (as adopted in Equation 3), the data setbeing modelled is assumed to have a parabolic shape.
3.4 Model Application
As indicated earlier, the spline model (Equation 2) was generally found to bemore robust, and consequently this model was used in preference to thepolynomial form (Equation 3). However, is some cases it was found that therewas insufficient information to fit the spline form of the model with theautoregressive term fitted to the residuals, and an alternative model had to beused.
The following process was adopted when applying the GAM models to thedata set:
1. Firstly, the spline model (as specified in Equation 2) was fitted to the data.Diagnostic plots were assessed to ensure that model assumptions werereasonably satisfied (see Section 3.5), and if acceptable the model resultswere adopted; as discussed below, outliers were excluded from themodel fit.
2. If there was insufficient data to evaluate the spline model coefficients,then the spline model was re-fitted without the autoregressive term fittedto the residuals (ie without the AR1(ε) term in Equation 2).
3. If the residuals were not found to exhibit appreciable serial correlation,then the results from Step 2 were adopted.
4. If the residuals were found to exhibit appreciable serial correlation, thenthe polynomial form of the model was adopted (Equation 3).
5. If there was insufficient data to evaluate the polynomial modelcoefficients, then the model was re-fitted without the autoregressive termfitted to the residuals (ie without the AR1(ε) term in Equation 3).
6. If the residuals were not found to exhibit appreciable serial correlation,then the results from Step 5 were adopted.
7. If the residuals displayed significant dependence and neither forms of themodel could be fitted, no assessment of trend was made, and the resultswere recorded as “not available”.
The spline model with AR1 term was successfully fitted in the majority ofcases (81%). Of the remaining stations, spline models with no AR1 term werefitted for 11% of cases and polynomial models with AR1 term were fitted forapproximately 3% of cases leaving only 6% of cases for which no modelcould be successfully fitted.

10
Initial modelling of the data indicated that in some cases the model fit wasunduly influenced by a small number of cases. In order to remove this bias,the outliers were excluded using an objective criterion based on Cook’sstatistic. Cook’s statistic evaluates the sensitivity of the model to outliers byconsidering the influence of each data point on the coefficients of the fit of thedata. A value of Cooks statistic greater than 2 was used as the basis foridentification of outliers (Hill et al. 1992).
3.5 Model assessment
Having fitted the GAM models to the data, it was necessary to check that themodel satisfied the required assumptions. The large number of models to befitted (around 1000 for the whole State) precluded the detailed trialling ofdifferent model forms and variable transformations, though software wasdeveloped to allow the rapid visual assessment of the residuals to ensure thatmodel assumptions (Section 3.1) were not appreciably violated.
An example of a GAM model fit to water quality data is provided in Figure 3.1,and examples of the diagnostic plots used to assess model validity areshown in Figures 3.2. The plots are based on electrical conductivity data fromsite number 235227, and an interpretation of the information is providedbelow.
Figure 3.1 shows the measured data, the fitted model and the time trend.This plot illustrates how well the data has been fitted and if there are anyerrors in either the model or the data. As can be seen from Figure 3.1, the fitfor this site is reasonable, with a large amount of variability in the data beingexplained by the adopted model.
A plot of residuals versus time is a useful visual tool for evaluating the fit of themodel over time and detecting the presence of underlying trends that mayrequire the use of other explanatory variables. Figure 3.2(a) illustrates aresiduals versus time plot, where it is seen that the residuals show constantvariance. With very few exceptions, the residuals were found to beindependent of time.
The constant variance assumption can be tested by examination of a plot ofresiduals against fitted values, an example of which is given in Figure 3.2(b).This figure illustrates that, as the data is evenly scattered around the ‘FittedEC’ axis, the residuals exhibit constant variance. For pH, the condition ofconstant variance was generally met. However, for turbidity, electricalconductivity, total nitrogen and total phosphorus, the residuals often showednon-constant variance. To rectify this problem, a log transformation of eachof these variables was tried resulting in significant improvement.

11
The assumption of no serial correlation was evaluated by plotting acorrelogram, as illustrated in Figure 3.2(c). Lag values of greater than anabsolute value of 0.2 (ie less than -0.2, or greater than +0.2) indicate that theresiduals exhibit significant serial correlation. Evaluation of the correlogramfor this site indicates that the fitting of a lag(1) AR model ensured that serialcorrelation was not a problem. However, as discussed in Section 3.4, somesites did not have sufficient data to allow the inclusion of an autoregressiveterm in the spline model, and the correlogram was used as the basis fordeciding which model form to adopt.
The assumption of normally distributed residuals was evaluated by using anormal probability plot, as shown in Figure 3.2(d). The proximity of the datato the 1:1 line indicates how well the residuals follow a normal distribution.The residuals were generally found to be normally distributed.
Figure 3.1: Fit and trend for electrical conductivity for station 235227

12
Figure 3.2: Diagnostic plots to evaluate the model assumptions
(a) (b)
(c) (d)

13
3.6 Characterisation of Trend
Both forms of the adopted GAM model (Equations 2 and 3) allow theevaluation of non-linear trends. Such models clearly illustrate the variation intrend over time, and in particular the spline form of the model allows a visualassessment of trend similar to that achieved using LOWESS plots (Cleveland,1979). While plots of non-linear time trends allow inferences to be maderegarding the nature (and hence possible causes) of trends over the historicperiod, they are not suited to providing a simple estimate of average annualtrends.
Consider the example given in Figure 3.3 for which there is a clear, non-lineartrend present in the data (as illustrated by the solid curvilinear line). Thevariation through time indicates a cyclic trend, in which an initial period ofincreasing trend is followed by decreasing values, and another subsequentperiod of increases. Such information, when combined with local knowledgeof land-use changes or operational conditions, can provide a valuable basison which to assess the causes of trends.
Figure 3.3 does not make it clear, however, whether there has been an overallincrease or decrease in the linear component of the observed trend. In orderto characterise this overall trend, a linear regression line has been fittedthrough the non-linear trend results, as illustrated by the broken line in Figure3.3. This estimate of the linear component of the trend has been used torepresent the overall trend at each site, and is used to construct “arrow” plotsthat reveal the degree of uniformity in trend results throughout a region (seeSection 3.6.2).
3.6.1 Statistical Significance of Trends
In addition to the magnitude of the trend, the statistical significance of thetrend also needs to be estimated. The significance indicates whether thetrend can be validly discerned from within the noise of the data. Consider, forexample, Figure 3.4. The plot shows the trend line though the data for sitenumber 231231 and the gradient of the line (or magnitude of the trend) hasbeen calculated as 16 µs/cm per annum. The significance of the trend hasbeen calculated as ‘nil’, indicating that although the trend line exhibits agradient, that gradient is not statistically significant.
Significance is determined from a t-test on the linear component of the timetrend in the GAM model. A t-test is an expression of the probability that thenature of the trend has been accurately discerned from the data. Thesignificance has therefore been reported at the 5% level (indicating a highprobability of significance), 10% level (indicating a medium level ofsignificance) and Nil (indicating that the trend is not significant).

14
Figure 3.3: Illustration of the non-linear and linear components oftrend (for electrical conductivity for station 229214 in the Port PhillipCMA).
0
20
40
60
80
100
120
1975 1980 1985 1990 1995 2000
Date
EC
(µs/
cm)
ObservationsNon-linear trend
Linear component of trend
Figure 3.4: Illustration of a trend with nil significance (for electricalconductivity at station 231231 in the Port Phillip CMA).
0
1000
2000
3000
4000
5000
6000
7000
8000
1982.00 1984.00 1986.00 1988.00 1990.00 1992.00 1994.00 1996.00 1998.00 2000.00
Date
ObservedTrend

15
3.6.2 Evaluation of Regional Trends
In addition to the reporting of trends at each site, maps indicating regionaltrends have also been produced. The maps use arrows to indicate the natureof the trend with the magnitude, direction and significance of the trend beingillustrated by the direction, size, and shading of the arrows. The consistencyof any regional trends are reflected in the consistency of the size anddirection of the arrows.
Consider Figure 3.5. A red arrow pointing vertically upwards indicates anupwards trend and a blue arrow pointing vertically downwards indicates adownwards trend. The size of the arrows indicates the relative magnitude ofthe overall linear trend. A green circle indicates that the magnitude of thetrend is approximately zero. Note that ‘zero’ has been set differently for eachpollutant based on reasonable detection limits for that pollutant and are listedas follows:
¨ pH : -0.025<limit<0.025 (/yr)¨ turbidity : -0.25<limit<0.025 (NTU/yr)¨ ec : -5.0<limit<5.0 (µs/cm/yr)¨ total phosphorus: -0.5<limit<0.5g/l (µg/l/yr)¨ total nitrogen: -0.003<limit<0.003 (mg/l/yr)
In addition to lower limits, upper limits have also been set (to prevent onearrow from completely dominating the map). These upper limits have beenset as follows:
¨ pH: 0.1 (/yr)¨ turbidity: 1 (NTU/yr)¨ ec: 25 (µs/cm/yr)¨ total phosphorus: 10.0 (µg/l/yr)¨ total nitrogen: 0.05 (mg/l/yr)
Note that the magnitude of trends that exceed the above limits have beenmarked near the station number on the arrow map.
If an arrow or circle is infilled with solid colour then the trend is significant atthe 5% level; if infilled with a shaded colour then the trend is significant at the10% level, and if there is no infilling then the trend is not significant.
It should be noted that stations for which the estimated trend was not reliabledo not have an arrow on the map, they simply have the station number.Station numbers have also been marked for total phosphorus and totalnitrogen where there was insufficient data for analysis.

16
Figure 3.3: Key for arrow plots
( s/cm/yr)µ
+/- 5
10%
10%
5
25
15
Magnitude of changeDirection and Significance of changeNIL 5%
5%NIL
Positive
Negative
KEY
17
4. Results
The results of the trend analysis have been presented in three differentformats. Table 4.1 summarises the magnitude of change and thesignificance of the trend for each station. Appendix B contains plots of thefitted trend line for each station and pollutant modelled in the CorangamiteCMA. Finally, the arrow plots are presented in Figures 4.1 to 4.5.
For pH (Figure 4.1) a large proportion of stations show no trend (ie themagnitude is zero and the trend is statistically significant). The remainder oftrends are decreasing with no increasing trends present. There appears tobe no spatial distribution of the trends with zero and decreasing trendsoccurring randomly throughout the CMA.
For turbidity (Figure 4.2) most trends are of zero magnitude and notstatistically discernible. The only statistically significant, non-zero trendoccurs at Painkalac Creek at Painkalac Dam (station number 235232) and isa large, positive trend.
Electrical conductivity (Figure 4.3) also has many trends that are notstatistically significant. It is notable that all trends in the south of the CMA areof zero magnitude and trends in the north are nearly all non-zero (a mix ofpositive and negative trends).
For total nitrogen and total phosphorus (Figures 4.4 and 4.5 respectively)there is too little data to discern regional trends. For the sites for which thereis data, most trends are not statistically significant.

18
Table 4.1: Trend Summary for Corangamite CMA
Station PH Turbidity ElectricalConductivity
Total Nitrogen TotalPhosphorus
Linear Sig. Linear Sig. Linear Sig. Linear Sig Linear Sig.Trend Trend Trend Trend Trend
Per Year Per Year Per Year Per Year Per Year(NTU) (µs/cm) (mg/l) (µg/l)
232202 -0.029 5% 0.000 5% 13 5% -0.006 Nil 0.0 Nil232204 -0.027 5% 0.000 Nil N/A N/A - - - -232210 -0.029 5% 0.000 Nil 0 Nil 0.006 Nil -1.0 Nil232211 -0.054 5% 0.000 Nil 9 5% - - - -233200 0.000 5% 0.000 10% -36 5% 0.029 5% 4.0 Nil233211 N/A N/A 0.000 Nil -85 5% - - - -233214 -0.026 5% 0.000 5% 0 Nil - - - -233215 0.000 5% 0.000 Nil 0 Nil 0.147 5% -18.0 10%233218 -0.027 5% 0.000 Nil -26 5% - - - -233223 0.000 Nil 0.000 10% N/A N/A 0.011 Nil 0.0 Nil233224 0.000 5% 0.000 Nil -5 Nil - - - -233228 -0.069 5% 0.000 Nil 0 Nil - - - -234200 0.000 5% 0.000 Nil -40 10% -0.030 5% 1.0 Nil234201 0.000 10% 0.000 5% 15 Nil - - - -234203 0.000 5% 0.000 Nil 0 Nil 0.018 Nil 1.0 5%235202 0.000 5% 0.000 10% 0 Nil - - - -235203 0.000 Nil 0.000 Nil 0 10% - - - -235204 -0.031 5% 0.000 Nil 0 5% - - - -235205 0.000 5% 0.000 5% 0 Nil - - - -235208 -0.033 5% 0.000 Nil 0 Nil - - - -235209 0.000 5% 0.000 Nil 0 5% - - - -235210 -0.044 5% 0.000 5% 0 Nil - - - -235211 0.000 5% 0.000 5% 0 Nil - - - -235212 -0.041 5% 0.000 5% 0 Nil - - - -235216 -0.046 5% 0.000 Nil 0 Nil - - - -235219 0.000 Nil 0.000 Nil 0 Nil - - - -235223 0.000 Nil -0.255 Nil N/A N/A - - - -235224 0.000 5% 0.000 5% 0 Nil 0.003 Nil 1.0 5%235226 N/A N/A 0.000 5% 0 Nil - - - -235227 0.000 5% 0.000 Nil 0 Nil 0.005 Nil 1.0 5%235229 0.000 Nil 0.000 Nil 0 10% - - - -235232 -0.066 5% 1.868 5% -13 5% - - - -235233 0.000 10% 0.000 10% 0 Nil - - - -
Note: - no data available N/A reliable results could not be determined

#
#
#
#
#
#
#
!
#
#
#
!#
#
!
#
!
!
!
!
232202
232204
232210
232211
233200
233214
233215
233218
233224
233228
234200
234201
234203
235202
235203
235204235205
235208
235209
235210
235211235212
235216
235219235224
235226235227
235229
235232
235233
233211
233223
235223
KEY
Negative
Positive
¬
NIL 5%
5%NIL
Direction and Significance of change Magnitude of change
¬
0.052
0.100
0.025¬
¬
¬
10%
10%
! #!+/- 0.025 #
Magnitude and significance of trend in pHCORANGAMITE CMACORANGAMITE CMA10 0 10 KilometersMagnitude and significance of trend in pH
i:\wcms\wc00838\cad\arcview\Corangam.apr; pH
(/yr)
Figure 4.1

#
!
!
!
#
#
!
!
!
!
!
#
!
#
!
!#
!
!
#
#
#
!
!#
#!
!
#
!
#
¬
!
!
!
!
232202
232204
232210
232211
233200
233214
233215
233218
233224
233228
234200
234201
234203
235202
235203
235204235205
235208
235209
235210
235211235212
235216
235219235224
235226235227
235229
235232
235233
233211
233223
235223 1.87
Magnitude and significance of trend in TurbidityCORANGAMITE CMACORANGAMITE CMA10 0 10 KilometersMagnitude and significance of trend in Turbidity
i:\wcms\wc00838\cad\arcview\Corangam.apr; Turb
KEY
Negative
Positive
¬
NIL 5%
5%NIL
Direction and Significance of change Magnitude of change
¬
1
0.25¬
¬
¬
10%
10%
! #!+/- 0.25 #
1
0.62
(NTU/yr)
Figure 4.2

!
!
!
¬
!
¬
!
!
#
#!
!
#
!
!
!
!
!!
!!
#
!
¬!
!
232202
232204
232210
232211
233200
233214
233215
233218
233224
233228
234200
234201
234203
235202
235203
235204235205
235208
235209
235210
235211235212
235216
235219235224
235226235227
235229
235232
235233
233211
233223
235223
-36.1-26.2
-40.1
-85.4
i:\wcms\wc00838\cad\arcview\Corangam.apr; EC
Magnitude and significance of trend in Electrical ConductivityCORANGAMITE CMACORANGAMITE CMA10 0 10 KilometersMagnitude and significance of trend in Electrical Conductivity
KEY
Negative
Positive
¬
NIL 5%
5%NIL
Direction and Significance of change Magnitude of change
¬
15
25
5¬
¬
¬
10%
10%
! #!+/- 5 #
( s/cm/yr)m
Figure 4.3

¬
¬
¬
¬¬
¬
¬
232202
232204
232210
232211
233200
233214
233215
233218
233224
233228
234200
234201
234203
235202
235203
235204235205
235208
235209
235210
235211235212
235216
235219235224
235226235227
235229
235232
235233
233211
233223
235223
0.147
Magnitude and significance of trend in Total NitrogenCORANGAMITE CMACORANGAMITE CMA10 0 10 KilometersMagnitude and significance of trend in Total Nitrogen
i:\wcms\wc00838\cad\arcview\Corangam.apr; TN
KEY
Negative
Positive
¬
NIL 5%
5%NIL
Direction and Significance of change Magnitude of change
¬
0.05
0.003¬
¬
¬
10%
10%
! #!+/- 0.003 #0.025
(mg/L/yr)
Figure 4.4

!
¬
¬
¬
!
¬
232202
232204
232210
232211
233200
233214
233215
233218
233224
233228
234200
234201
234203
235202
235203
235204235205
235208
235209
235210
235211235212
235216
235219235224
235226235227
235229
235232
235233
233211
233223
235223
-18
Magnitude and significance of trend in Total PhosphorusCORANGAMITE CMACORANGAMITE CMA10 0 10 KilometersMagnitude and significance of trend in Total Phosphorus
i:\wcms\wc00838\cad\arcview\Corangam.apr; TP
KEY
Negative
Positive
¬
NIL 5%
5%NIL
Direction and Significance of change Magnitude of change
¬
5
10
0.5¬
¬
¬
10%
10%
! #!+/- 0.5 #
( g/L/yr)m
Figure 4.5

24
5. Conclusions
Water quality data from the VWRMN (Victorian Water Resources MonitoringNetwork) for the Corangamite Region have been analysed to determinetrends. A total of 33 stations were investigated for trends in pH, turbidity andelectrical conductivity. Substantially less nutrient data (total phosphorus andtotal nitrogen) was available, with 9 stations analysed for trend.
The GAM (Generalised Additive Models) method was used to determine thetrends. GAM is particularly suited to investigating trends in water quality dataas it accounts for the effects of exogenous influences (such as streamflow)and it elegantly deals with the common problems of missing data and serialcorrelation.
For the Corangamite CMA a substantial number of trends (for all indicators)were of zero magnitude, indicating little change in the indicator levels overtime. A loose regional trend pattern was observed for electrical conductivitywith predominantly zero magnitude trends in the south of the CMA andpredominantly non-zero trends in the north.
Finally, it should be noted that there are companion reports to this document,detailing similar analyses for each of the other nine Catchment ManagementAuthorities. Additionally, there is a Statewide Summary, presenting anoverview of the trend analysis for the State.

25
Appendix A - Data Availability in the Corangamite CMA

CMA: Corangamite
Monthly Summary of Discharge Data Availability1970
Site JFMAMJJASOND
1971
JFMAMJJASOND
1972
JFMAMJJASOND
1973
JFMAMJJASOND
1974
JFMAMJJASOND
1975
JFMAMJJASOND
1976
JFMAMJJASOND
1977
JFMAMJJASOND
1978
JFMAMJJASOND
1979
JFMAMJJASONDDescription Site232202 MOORABOOL RIVER @ BATESFORD 232202232204 MOORABOOL RIVER @ MORRISONS 232204232210 MOORABOOL RIVER WEST @ LAL LAL 232210232211 MOORABOOL RIVER WEST @ MOUNT DORAN 232211233200 BARWON RIVER @ POLLOCKSFORD 233200233211 BIRREGURRA CREEK @ RICKETTS MARSH 233211233214 BARWON RIVER EAST @ FORREST 233214233215 LEIGH RIVER @ MOUNT MERCER 233215233218 BARWON RIVER @ INVERLEIGH 233218233223 WARRAMBINE CREEK @ WARRAMBINE 233223233224 BARWON RIVER @ RICKETTS MARSH 233224233228 BOUNDARY CREEK @ YEODENE 233228234200 WOADY YALOAK RIVER @ PITFIELD 234200234201 WOADY YALOAK RIVER @ CRESSY 234201234203 PIRRON YALLOCK CREEK @ PIRRON YALLOCK 234203235202 GELIBRAND RIVER @ UPPER GELIBRAND 235202235203 CURDIES RIVER @ CURDIE 235203235204 LITTLE AIRE CREEK @ BEECH FOREST 235204235205 ARKINS CREEK WEST BRANCH @ WYELANGTA 235205235208 GELLIBRAND RIVER @ CARLISLE 235208235209 AIRE RIVER @ BEECH FOREST 235209235210 LARDNER CREEK @ GELLIBRAND 235210235211 KENNEDYS CREEK @ KENNEDYS CREEK 235211235212 CHAPPLE CREEK @ CHAPPLE VALE 235212235216 CUMBERLAND RIVER @ LORNE 235216235219 AIRE RIVER @ WYELANGTA 235219235223 SCOTTS CREEK @ SCOTTS CREEK 235223235224 GELLIBRAND RIVER @ BURRUPA 235224235226 ST. GEORGE RIVER @ ALLENVALE 235226235227 GELLIBRAND RIVER @ BUNKERS HILL 235227235229 FORD RIVER @ GLENAIRE 235229235232 PAINKALAC CREEK @ PAINKALAC CREEK DAM 235232235233 BARHAM RIVER EAST @ APOLLO BAY, PARADISE 235233
JFMAMJJASOND JFMAMJJASOND JFMAMJJASOND JFMAMJJASOND JFMAMJJASOND JFMAMJJASOND JFMAMJJASOND JFMAMJJASOND JFMAMJJASOND JFMAMJJASOND
1970 1971 1972 1973 1974 1975 1976 1977 1978 1979
0 values 1 value present >1 values present

CMA: Corangamite
Monthly Summary of Discharge Data Availability1980
Site JFMAMJJASOND
1981
JFMAMJJASOND
1982
JFMAMJJASOND
1983
JFMAMJJASOND
1984
JFMAMJJASOND
1985
JFMAMJJASOND
1986
JFMAMJJASOND
1987
JFMAMJJASOND
1988
JFMAMJJASOND
1989
JFMAMJJASONDDescription Site232202 MOORABOOL RIVER @ BATESFORD 232202232204 MOORABOOL RIVER @ MORRISONS 232204232210 MOORABOOL RIVER WEST @ LAL LAL 232210232211 MOORABOOL RIVER WEST @ MOUNT DORAN 232211233200 BARWON RIVER @ POLLOCKSFORD 233200233211 BIRREGURRA CREEK @ RICKETTS MARSH 233211233214 BARWON RIVER EAST @ FORREST 233214233215 LEIGH RIVER @ MOUNT MERCER 233215233218 BARWON RIVER @ INVERLEIGH 233218233223 WARRAMBINE CREEK @ WARRAMBINE 233223233224 BARWON RIVER @ RICKETTS MARSH 233224233228 BOUNDARY CREEK @ YEODENE 233228234200 WOADY YALOAK RIVER @ PITFIELD 234200234201 WOADY YALOAK RIVER @ CRESSY 234201234203 PIRRON YALLOCK CREEK @ PIRRON YALLOCK 234203235202 GELIBRAND RIVER @ UPPER GELIBRAND 235202235203 CURDIES RIVER @ CURDIE 235203235204 LITTLE AIRE CREEK @ BEECH FOREST 235204235205 ARKINS CREEK WEST BRANCH @ WYELANGTA 235205235208 GELLIBRAND RIVER @ CARLISLE 235208235209 AIRE RIVER @ BEECH FOREST 235209235210 LARDNER CREEK @ GELLIBRAND 235210235211 KENNEDYS CREEK @ KENNEDYS CREEK 235211235212 CHAPPLE CREEK @ CHAPPLE VALE 235212235216 CUMBERLAND RIVER @ LORNE 235216235219 AIRE RIVER @ WYELANGTA 235219235223 SCOTTS CREEK @ SCOTTS CREEK 235223235224 GELLIBRAND RIVER @ BURRUPA 235224235226 ST. GEORGE RIVER @ ALLENVALE 235226235227 GELLIBRAND RIVER @ BUNKERS HILL 235227235229 FORD RIVER @ GLENAIRE 235229235232 PAINKALAC CREEK @ PAINKALAC CREEK DAM 235232235233 BARHAM RIVER EAST @ APOLLO BAY, PARADISE 235233
JFMAMJJASOND JFMAMJJASOND JFMAMJJASOND JFMAMJJASOND JFMAMJJASOND JFMAMJJASOND JFMAMJJASOND JFMAMJJASOND JFMAMJJASOND JFMAMJJASOND
1980 1981 1982 1983 1984 1985 1986 1987 1988 1989
0 values 1 value present >1 values present

CMA: Corangamite
Monthly Summary of Discharge Data Availability1990
Site JFMAMJJASOND
1991
JFMAMJJASOND
1992
JFMAMJJASOND
1993
JFMAMJJASOND
1994
JFMAMJJASOND
1995
JFMAMJJASOND
1996
JFMAMJJASOND
1997
JFMAMJJASOND
1998
JFMAMJJASOND
1999
JFMAMJJASONDDescription Site232202 MOORABOOL RIVER @ BATESFORD 232202232204 MOORABOOL RIVER @ MORRISONS 232204232210 MOORABOOL RIVER WEST @ LAL LAL 232210232211 MOORABOOL RIVER WEST @ MOUNT DORAN 232211233200 BARWON RIVER @ POLLOCKSFORD 233200233211 BIRREGURRA CREEK @ RICKETTS MARSH 233211233214 BARWON RIVER EAST @ FORREST 233214233215 LEIGH RIVER @ MOUNT MERCER 233215233218 BARWON RIVER @ INVERLEIGH 233218233223 WARRAMBINE CREEK @ WARRAMBINE 233223233224 BARWON RIVER @ RICKETTS MARSH 233224233228 BOUNDARY CREEK @ YEODENE 233228234200 WOADY YALOAK RIVER @ PITFIELD 234200234201 WOADY YALOAK RIVER @ CRESSY 234201234203 PIRRON YALLOCK CREEK @ PIRRON YALLOCK 234203235202 GELIBRAND RIVER @ UPPER GELIBRAND 235202235203 CURDIES RIVER @ CURDIE 235203235204 LITTLE AIRE CREEK @ BEECH FOREST 235204235205 ARKINS CREEK WEST BRANCH @ WYELANGTA 235205235208 GELLIBRAND RIVER @ CARLISLE 235208235209 AIRE RIVER @ BEECH FOREST 235209235210 LARDNER CREEK @ GELLIBRAND 235210235211 KENNEDYS CREEK @ KENNEDYS CREEK 235211235212 CHAPPLE CREEK @ CHAPPLE VALE 235212235216 CUMBERLAND RIVER @ LORNE 235216235219 AIRE RIVER @ WYELANGTA 235219235223 SCOTTS CREEK @ SCOTTS CREEK 235223235224 GELLIBRAND RIVER @ BURRUPA 235224235226 ST. GEORGE RIVER @ ALLENVALE 235226235227 GELLIBRAND RIVER @ BUNKERS HILL 235227235229 FORD RIVER @ GLENAIRE 235229235232 PAINKALAC CREEK @ PAINKALAC CREEK DAM 235232235233 BARHAM RIVER EAST @ APOLLO BAY, PARADISE 235233
JFMAMJJASOND JFMAMJJASOND JFMAMJJASOND JFMAMJJASOND JFMAMJJASOND JFMAMJJASOND JFMAMJJASOND JFMAMJJASOND JFMAMJJASOND JFMAMJJASOND
1990 1991 1992 1993 1994 1995 1996 1997 1998 1999
0 values 1 value present >1 values present

CMA: Corangamite
Monthly Summary of pH Data Availability1970
Site JFMAMJJASOND
1971
JFMAMJJASOND
1972
JFMAMJJASOND
1973
JFMAMJJASOND
1974
JFMAMJJASOND
1975
JFMAMJJASOND
1976
JFMAMJJASOND
1977
JFMAMJJASOND
1978
JFMAMJJASOND
1979
JFMAMJJASONDDescription Site232202 MOORABOOL RIVER @ BATESFORD 232202232204 MOORABOOL RIVER @ MORRISONS 232204232210 MOORABOOL RIVER WEST @ LAL LAL 232210232211 MOORABOOL RIVER WEST @ MOUNT DORAN 232211233200 BARWON RIVER @ POLLOCKSFORD 233200233211 BIRREGURRA CREEK @ RICKETTS MARSH 233211233214 BARWON RIVER EAST @ FORREST 233214233215 LEIGH RIVER @ MOUNT MERCER 233215233218 BARWON RIVER @ INVERLEIGH 233218233223 WARRAMBINE CREEK @ WARRAMBINE 233223233224 BARWON RIVER @ RICKETTS MARSH 233224233228 BOUNDARY CREEK @ YEODENE 233228234200 WOADY YALOAK RIVER @ PITFIELD 234200234201 WOADY YALOAK RIVER @ CRESSY 234201234203 PIRRON YALLOCK CREEK @ PIRRON YALLOCK 234203235202 GELIBRAND RIVER @ UPPER GELIBRAND 235202235203 CURDIES RIVER @ CURDIE 235203235204 LITTLE AIRE CREEK @ BEECH FOREST 235204235205 ARKINS CREEK WEST BRANCH @ WYELANGTA 235205235208 GELLIBRAND RIVER @ CARLISLE 235208235209 AIRE RIVER @ BEECH FOREST 235209235210 LARDNER CREEK @ GELLIBRAND 235210235211 KENNEDYS CREEK @ KENNEDYS CREEK 235211235212 CHAPPLE CREEK @ CHAPPLE VALE 235212235216 CUMBERLAND RIVER @ LORNE 235216235219 AIRE RIVER @ WYELANGTA 235219235223 SCOTTS CREEK @ SCOTTS CREEK 235223235224 GELLIBRAND RIVER @ BURRUPA 235224235226 ST. GEORGE RIVER @ ALLENVALE 235226235227 GELLIBRAND RIVER @ BUNKERS HILL 235227235229 FORD RIVER @ GLENAIRE 235229235232 PAINKALAC CREEK @ PAINKALAC CREEK DAM 235232235233 BARHAM RIVER EAST @ APOLLO BAY, PARADISE 235233
JFMAMJJASOND JFMAMJJASOND JFMAMJJASOND JFMAMJJASOND JFMAMJJASOND JFMAMJJASOND JFMAMJJASOND JFMAMJJASOND JFMAMJJASOND JFMAMJJASOND
1970 1971 1972 1973 1974 1975 1976 1977 1978 1979
0 values 1 value present >1 values present

CMA: Corangamite
Monthly Summary of pH Data Availability1980
Site JFMAMJJASOND
1981
JFMAMJJASOND
1982
JFMAMJJASOND
1983
JFMAMJJASOND
1984
JFMAMJJASOND
1985
JFMAMJJASOND
1986
JFMAMJJASOND
1987
JFMAMJJASOND
1988
JFMAMJJASOND
1989
JFMAMJJASONDDescription Site232202 MOORABOOL RIVER @ BATESFORD 232202232204 MOORABOOL RIVER @ MORRISONS 232204232210 MOORABOOL RIVER WEST @ LAL LAL 232210232211 MOORABOOL RIVER WEST @ MOUNT DORAN 232211233200 BARWON RIVER @ POLLOCKSFORD 233200233211 BIRREGURRA CREEK @ RICKETTS MARSH 233211233214 BARWON RIVER EAST @ FORREST 233214233215 LEIGH RIVER @ MOUNT MERCER 233215233218 BARWON RIVER @ INVERLEIGH 233218233223 WARRAMBINE CREEK @ WARRAMBINE 233223233224 BARWON RIVER @ RICKETTS MARSH 233224233228 BOUNDARY CREEK @ YEODENE 233228234200 WOADY YALOAK RIVER @ PITFIELD 234200234201 WOADY YALOAK RIVER @ CRESSY 234201234203 PIRRON YALLOCK CREEK @ PIRRON YALLOCK 234203235202 GELIBRAND RIVER @ UPPER GELIBRAND 235202235203 CURDIES RIVER @ CURDIE 235203235204 LITTLE AIRE CREEK @ BEECH FOREST 235204235205 ARKINS CREEK WEST BRANCH @ WYELANGTA 235205235208 GELLIBRAND RIVER @ CARLISLE 235208235209 AIRE RIVER @ BEECH FOREST 235209235210 LARDNER CREEK @ GELLIBRAND 235210235211 KENNEDYS CREEK @ KENNEDYS CREEK 235211235212 CHAPPLE CREEK @ CHAPPLE VALE 235212235216 CUMBERLAND RIVER @ LORNE 235216235219 AIRE RIVER @ WYELANGTA 235219235223 SCOTTS CREEK @ SCOTTS CREEK 235223235224 GELLIBRAND RIVER @ BURRUPA 235224235226 ST. GEORGE RIVER @ ALLENVALE 235226235227 GELLIBRAND RIVER @ BUNKERS HILL 235227235229 FORD RIVER @ GLENAIRE 235229235232 PAINKALAC CREEK @ PAINKALAC CREEK DAM 235232235233 BARHAM RIVER EAST @ APOLLO BAY, PARADISE 235233
JFMAMJJASOND JFMAMJJASOND JFMAMJJASOND JFMAMJJASOND JFMAMJJASOND JFMAMJJASOND JFMAMJJASOND JFMAMJJASOND JFMAMJJASOND JFMAMJJASOND
1980 1981 1982 1983 1984 1985 1986 1987 1988 1989
0 values 1 value present >1 values present

CMA: Corangamite
Monthly Summary of pH Data Availability1990
Site JFMAMJJASOND
1991
JFMAMJJASOND
1992
JFMAMJJASOND
1993
JFMAMJJASOND
1994
JFMAMJJASOND
1995
JFMAMJJASOND
1996
JFMAMJJASOND
1997
JFMAMJJASOND
1998
JFMAMJJASOND
1999
JFMAMJJASONDDescription Site232202 MOORABOOL RIVER @ BATESFORD 232202232204 MOORABOOL RIVER @ MORRISONS 232204232210 MOORABOOL RIVER WEST @ LAL LAL 232210232211 MOORABOOL RIVER WEST @ MOUNT DORAN 232211233200 BARWON RIVER @ POLLOCKSFORD 233200233211 BIRREGURRA CREEK @ RICKETTS MARSH 233211233214 BARWON RIVER EAST @ FORREST 233214233215 LEIGH RIVER @ MOUNT MERCER 233215233218 BARWON RIVER @ INVERLEIGH 233218233223 WARRAMBINE CREEK @ WARRAMBINE 233223233224 BARWON RIVER @ RICKETTS MARSH 233224233228 BOUNDARY CREEK @ YEODENE 233228234200 WOADY YALOAK RIVER @ PITFIELD 234200234201 WOADY YALOAK RIVER @ CRESSY 234201234203 PIRRON YALLOCK CREEK @ PIRRON YALLOCK 234203235202 GELIBRAND RIVER @ UPPER GELIBRAND 235202235203 CURDIES RIVER @ CURDIE 235203235204 LITTLE AIRE CREEK @ BEECH FOREST 235204235205 ARKINS CREEK WEST BRANCH @ WYELANGTA 235205235208 GELLIBRAND RIVER @ CARLISLE 235208235209 AIRE RIVER @ BEECH FOREST 235209235210 LARDNER CREEK @ GELLIBRAND 235210235211 KENNEDYS CREEK @ KENNEDYS CREEK 235211235212 CHAPPLE CREEK @ CHAPPLE VALE 235212235216 CUMBERLAND RIVER @ LORNE 235216235219 AIRE RIVER @ WYELANGTA 235219235223 SCOTTS CREEK @ SCOTTS CREEK 235223235224 GELLIBRAND RIVER @ BURRUPA 235224235226 ST. GEORGE RIVER @ ALLENVALE 235226235227 GELLIBRAND RIVER @ BUNKERS HILL 235227235229 FORD RIVER @ GLENAIRE 235229235232 PAINKALAC CREEK @ PAINKALAC CREEK DAM 235232235233 BARHAM RIVER EAST @ APOLLO BAY, PARADISE 235233
JFMAMJJASOND JFMAMJJASOND JFMAMJJASOND JFMAMJJASOND JFMAMJJASOND JFMAMJJASOND JFMAMJJASOND JFMAMJJASOND JFMAMJJASOND JFMAMJJASOND
1990 1991 1992 1993 1994 1995 1996 1997 1998 1999
0 values 1 value present >1 values present

CMA: Corangamite
Monthly Summary of Turbidity Data Availability1970
Site JFMAMJJASOND
1971
JFMAMJJASOND
1972
JFMAMJJASOND
1973
JFMAMJJASOND
1974
JFMAMJJASOND
1975
JFMAMJJASOND
1976
JFMAMJJASOND
1977
JFMAMJJASOND
1978
JFMAMJJASOND
1979
JFMAMJJASONDDescription Site232202 MOORABOOL RIVER @ BATESFORD 232202232204 MOORABOOL RIVER @ MORRISONS 232204232210 MOORABOOL RIVER WEST @ LAL LAL 232210232211 MOORABOOL RIVER WEST @ MOUNT DORAN 232211233200 BARWON RIVER @ POLLOCKSFORD 233200233211 BIRREGURRA CREEK @ RICKETTS MARSH 233211233214 BARWON RIVER EAST @ FORREST 233214233215 LEIGH RIVER @ MOUNT MERCER 233215233218 BARWON RIVER @ INVERLEIGH 233218233223 WARRAMBINE CREEK @ WARRAMBINE 233223233224 BARWON RIVER @ RICKETTS MARSH 233224233228 BOUNDARY CREEK @ YEODENE 233228234200 WOADY YALOAK RIVER @ PITFIELD 234200234201 WOADY YALOAK RIVER @ CRESSY 234201234203 PIRRON YALLOCK CREEK @ PIRRON YALLOCK 234203235202 GELIBRAND RIVER @ UPPER GELIBRAND 235202235203 CURDIES RIVER @ CURDIE 235203235204 LITTLE AIRE CREEK @ BEECH FOREST 235204235205 ARKINS CREEK WEST BRANCH @ WYELANGTA 235205235208 GELLIBRAND RIVER @ CARLISLE 235208235209 AIRE RIVER @ BEECH FOREST 235209235210 LARDNER CREEK @ GELLIBRAND 235210235211 KENNEDYS CREEK @ KENNEDYS CREEK 235211235212 CHAPPLE CREEK @ CHAPPLE VALE 235212235216 CUMBERLAND RIVER @ LORNE 235216235219 AIRE RIVER @ WYELANGTA 235219235223 SCOTTS CREEK @ SCOTTS CREEK 235223235224 GELLIBRAND RIVER @ BURRUPA 235224235226 ST. GEORGE RIVER @ ALLENVALE 235226235227 GELLIBRAND RIVER @ BUNKERS HILL 235227235229 FORD RIVER @ GLENAIRE 235229235232 PAINKALAC CREEK @ PAINKALAC CREEK DAM 235232235233 BARHAM RIVER EAST @ APOLLO BAY, PARADISE 235233
JFMAMJJASOND JFMAMJJASOND JFMAMJJASOND JFMAMJJASOND JFMAMJJASOND JFMAMJJASOND JFMAMJJASOND JFMAMJJASOND JFMAMJJASOND JFMAMJJASOND
1970 1971 1972 1973 1974 1975 1976 1977 1978 1979
0 values 1 value present >1 values present

CMA: Corangamite
Monthly Summary of Turbidity Data Availability1980
Site JFMAMJJASOND
1981
JFMAMJJASOND
1982
JFMAMJJASOND
1983
JFMAMJJASOND
1984
JFMAMJJASOND
1985
JFMAMJJASOND
1986
JFMAMJJASOND
1987
JFMAMJJASOND
1988
JFMAMJJASOND
1989
JFMAMJJASONDDescription Site232202 MOORABOOL RIVER @ BATESFORD 232202232204 MOORABOOL RIVER @ MORRISONS 232204232210 MOORABOOL RIVER WEST @ LAL LAL 232210232211 MOORABOOL RIVER WEST @ MOUNT DORAN 232211233200 BARWON RIVER @ POLLOCKSFORD 233200233211 BIRREGURRA CREEK @ RICKETTS MARSH 233211233214 BARWON RIVER EAST @ FORREST 233214233215 LEIGH RIVER @ MOUNT MERCER 233215233218 BARWON RIVER @ INVERLEIGH 233218233223 WARRAMBINE CREEK @ WARRAMBINE 233223233224 BARWON RIVER @ RICKETTS MARSH 233224233228 BOUNDARY CREEK @ YEODENE 233228234200 WOADY YALOAK RIVER @ PITFIELD 234200234201 WOADY YALOAK RIVER @ CRESSY 234201234203 PIRRON YALLOCK CREEK @ PIRRON YALLOCK 234203235202 GELIBRAND RIVER @ UPPER GELIBRAND 235202235203 CURDIES RIVER @ CURDIE 235203235204 LITTLE AIRE CREEK @ BEECH FOREST 235204235205 ARKINS CREEK WEST BRANCH @ WYELANGTA 235205235208 GELLIBRAND RIVER @ CARLISLE 235208235209 AIRE RIVER @ BEECH FOREST 235209235210 LARDNER CREEK @ GELLIBRAND 235210235211 KENNEDYS CREEK @ KENNEDYS CREEK 235211235212 CHAPPLE CREEK @ CHAPPLE VALE 235212235216 CUMBERLAND RIVER @ LORNE 235216235219 AIRE RIVER @ WYELANGTA 235219235223 SCOTTS CREEK @ SCOTTS CREEK 235223235224 GELLIBRAND RIVER @ BURRUPA 235224235226 ST. GEORGE RIVER @ ALLENVALE 235226235227 GELLIBRAND RIVER @ BUNKERS HILL 235227235229 FORD RIVER @ GLENAIRE 235229235232 PAINKALAC CREEK @ PAINKALAC CREEK DAM 235232235233 BARHAM RIVER EAST @ APOLLO BAY, PARADISE 235233
JFMAMJJASOND JFMAMJJASOND JFMAMJJASOND JFMAMJJASOND JFMAMJJASOND JFMAMJJASOND JFMAMJJASOND JFMAMJJASOND JFMAMJJASOND JFMAMJJASOND
1980 1981 1982 1983 1984 1985 1986 1987 1988 1989
0 values 1 value present >1 values present

CMA: Corangamite
Monthly Summary of Turbidity Data Availability1990
Site JFMAMJJASOND
1991
JFMAMJJASOND
1992
JFMAMJJASOND
1993
JFMAMJJASOND
1994
JFMAMJJASOND
1995
JFMAMJJASOND
1996
JFMAMJJASOND
1997
JFMAMJJASOND
1998
JFMAMJJASOND
1999
JFMAMJJASONDDescription Site232202 MOORABOOL RIVER @ BATESFORD 232202232204 MOORABOOL RIVER @ MORRISONS 232204232210 MOORABOOL RIVER WEST @ LAL LAL 232210232211 MOORABOOL RIVER WEST @ MOUNT DORAN 232211233200 BARWON RIVER @ POLLOCKSFORD 233200233211 BIRREGURRA CREEK @ RICKETTS MARSH 233211233214 BARWON RIVER EAST @ FORREST 233214233215 LEIGH RIVER @ MOUNT MERCER 233215233218 BARWON RIVER @ INVERLEIGH 233218233223 WARRAMBINE CREEK @ WARRAMBINE 233223233224 BARWON RIVER @ RICKETTS MARSH 233224233228 BOUNDARY CREEK @ YEODENE 233228234200 WOADY YALOAK RIVER @ PITFIELD 234200234201 WOADY YALOAK RIVER @ CRESSY 234201234203 PIRRON YALLOCK CREEK @ PIRRON YALLOCK 234203235202 GELIBRAND RIVER @ UPPER GELIBRAND 235202235203 CURDIES RIVER @ CURDIE 235203235204 LITTLE AIRE CREEK @ BEECH FOREST 235204235205 ARKINS CREEK WEST BRANCH @ WYELANGTA 235205235208 GELLIBRAND RIVER @ CARLISLE 235208235209 AIRE RIVER @ BEECH FOREST 235209235210 LARDNER CREEK @ GELLIBRAND 235210235211 KENNEDYS CREEK @ KENNEDYS CREEK 235211235212 CHAPPLE CREEK @ CHAPPLE VALE 235212235216 CUMBERLAND RIVER @ LORNE 235216235219 AIRE RIVER @ WYELANGTA 235219235223 SCOTTS CREEK @ SCOTTS CREEK 235223235224 GELLIBRAND RIVER @ BURRUPA 235224235226 ST. GEORGE RIVER @ ALLENVALE 235226235227 GELLIBRAND RIVER @ BUNKERS HILL 235227235229 FORD RIVER @ GLENAIRE 235229235232 PAINKALAC CREEK @ PAINKALAC CREEK DAM 235232235233 BARHAM RIVER EAST @ APOLLO BAY, PARADISE 235233
JFMAMJJASOND JFMAMJJASOND JFMAMJJASOND JFMAMJJASOND JFMAMJJASOND JFMAMJJASOND JFMAMJJASOND JFMAMJJASOND JFMAMJJASOND JFMAMJJASOND
1990 1991 1992 1993 1994 1995 1996 1997 1998 1999
0 values 1 value present >1 values present

CMA: Corangamite
Monthly Summary of Electrical Conductivity Data Availability1970
Site JFMAMJJASOND
1971
JFMAMJJASOND
1972
JFMAMJJASOND
1973
JFMAMJJASOND
1974
JFMAMJJASOND
1975
JFMAMJJASOND
1976
JFMAMJJASOND
1977
JFMAMJJASOND
1978
JFMAMJJASOND
1979
JFMAMJJASONDDescription Site232202 MOORABOOL RIVER @ BATESFORD 232202232204 MOORABOOL RIVER @ MORRISONS 232204232210 MOORABOOL RIVER WEST @ LAL LAL 232210232211 MOORABOOL RIVER WEST @ MOUNT DORAN 232211233200 BARWON RIVER @ POLLOCKSFORD 233200233211 BIRREGURRA CREEK @ RICKETTS MARSH 233211233214 BARWON RIVER EAST @ FORREST 233214233215 LEIGH RIVER @ MOUNT MERCER 233215233218 BARWON RIVER @ INVERLEIGH 233218233223 WARRAMBINE CREEK @ WARRAMBINE 233223233224 BARWON RIVER @ RICKETTS MARSH 233224233228 BOUNDARY CREEK @ YEODENE 233228234200 WOADY YALOAK RIVER @ PITFIELD 234200234201 WOADY YALOAK RIVER @ CRESSY 234201234203 PIRRON YALLOCK CREEK @ PIRRON YALLOCK 234203235202 GELIBRAND RIVER @ UPPER GELIBRAND 235202235203 CURDIES RIVER @ CURDIE 235203235204 LITTLE AIRE CREEK @ BEECH FOREST 235204235205 ARKINS CREEK WEST BRANCH @ WYELANGTA 235205235208 GELLIBRAND RIVER @ CARLISLE 235208235209 AIRE RIVER @ BEECH FOREST 235209235210 LARDNER CREEK @ GELLIBRAND 235210235211 KENNEDYS CREEK @ KENNEDYS CREEK 235211235212 CHAPPLE CREEK @ CHAPPLE VALE 235212235216 CUMBERLAND RIVER @ LORNE 235216235219 AIRE RIVER @ WYELANGTA 235219235223 SCOTTS CREEK @ SCOTTS CREEK 235223235224 GELLIBRAND RIVER @ BURRUPA 235224235226 ST. GEORGE RIVER @ ALLENVALE 235226235227 GELLIBRAND RIVER @ BUNKERS HILL 235227235229 FORD RIVER @ GLENAIRE 235229235232 PAINKALAC CREEK @ PAINKALAC CREEK DAM 235232235233 BARHAM RIVER EAST @ APOLLO BAY, PARADISE 235233
JFMAMJJASOND JFMAMJJASOND JFMAMJJASOND JFMAMJJASOND JFMAMJJASOND JFMAMJJASOND JFMAMJJASOND JFMAMJJASOND JFMAMJJASOND JFMAMJJASOND
1970 1971 1972 1973 1974 1975 1976 1977 1978 1979
0 values 1 value present >1 values present

CMA: Corangamite
Monthly Summary of Electrical Conductivity Data Availability1980
Site JFMAMJJASOND
1981
JFMAMJJASOND
1982
JFMAMJJASOND
1983
JFMAMJJASOND
1984
JFMAMJJASOND
1985
JFMAMJJASOND
1986
JFMAMJJASOND
1987
JFMAMJJASOND
1988
JFMAMJJASOND
1989
JFMAMJJASONDDescription Site232202 MOORABOOL RIVER @ BATESFORD 232202232204 MOORABOOL RIVER @ MORRISONS 232204232210 MOORABOOL RIVER WEST @ LAL LAL 232210232211 MOORABOOL RIVER WEST @ MOUNT DORAN 232211233200 BARWON RIVER @ POLLOCKSFORD 233200233211 BIRREGURRA CREEK @ RICKETTS MARSH 233211233214 BARWON RIVER EAST @ FORREST 233214233215 LEIGH RIVER @ MOUNT MERCER 233215233218 BARWON RIVER @ INVERLEIGH 233218233223 WARRAMBINE CREEK @ WARRAMBINE 233223233224 BARWON RIVER @ RICKETTS MARSH 233224233228 BOUNDARY CREEK @ YEODENE 233228234200 WOADY YALOAK RIVER @ PITFIELD 234200234201 WOADY YALOAK RIVER @ CRESSY 234201234203 PIRRON YALLOCK CREEK @ PIRRON YALLOCK 234203235202 GELIBRAND RIVER @ UPPER GELIBRAND 235202235203 CURDIES RIVER @ CURDIE 235203235204 LITTLE AIRE CREEK @ BEECH FOREST 235204235205 ARKINS CREEK WEST BRANCH @ WYELANGTA 235205235208 GELLIBRAND RIVER @ CARLISLE 235208235209 AIRE RIVER @ BEECH FOREST 235209235210 LARDNER CREEK @ GELLIBRAND 235210235211 KENNEDYS CREEK @ KENNEDYS CREEK 235211235212 CHAPPLE CREEK @ CHAPPLE VALE 235212235216 CUMBERLAND RIVER @ LORNE 235216235219 AIRE RIVER @ WYELANGTA 235219235223 SCOTTS CREEK @ SCOTTS CREEK 235223235224 GELLIBRAND RIVER @ BURRUPA 235224235226 ST. GEORGE RIVER @ ALLENVALE 235226235227 GELLIBRAND RIVER @ BUNKERS HILL 235227235229 FORD RIVER @ GLENAIRE 235229235232 PAINKALAC CREEK @ PAINKALAC CREEK DAM 235232235233 BARHAM RIVER EAST @ APOLLO BAY, PARADISE 235233
JFMAMJJASOND JFMAMJJASOND JFMAMJJASOND JFMAMJJASOND JFMAMJJASOND JFMAMJJASOND JFMAMJJASOND JFMAMJJASOND JFMAMJJASOND JFMAMJJASOND
1980 1981 1982 1983 1984 1985 1986 1987 1988 1989
0 values 1 value present >1 values present

CMA: Corangamite
Monthly Summary of Electrical Conductivity Data Availability1990
Site JFMAMJJASOND
1991
JFMAMJJASOND
1992
JFMAMJJASOND
1993
JFMAMJJASOND
1994
JFMAMJJASOND
1995
JFMAMJJASOND
1996
JFMAMJJASOND
1997
JFMAMJJASOND
1998
JFMAMJJASOND
1999
JFMAMJJASONDDescription Site232202 MOORABOOL RIVER @ BATESFORD 232202232204 MOORABOOL RIVER @ MORRISONS 232204232210 MOORABOOL RIVER WEST @ LAL LAL 232210232211 MOORABOOL RIVER WEST @ MOUNT DORAN 232211233200 BARWON RIVER @ POLLOCKSFORD 233200233211 BIRREGURRA CREEK @ RICKETTS MARSH 233211233214 BARWON RIVER EAST @ FORREST 233214233215 LEIGH RIVER @ MOUNT MERCER 233215233218 BARWON RIVER @ INVERLEIGH 233218233223 WARRAMBINE CREEK @ WARRAMBINE 233223233224 BARWON RIVER @ RICKETTS MARSH 233224233228 BOUNDARY CREEK @ YEODENE 233228234200 WOADY YALOAK RIVER @ PITFIELD 234200234201 WOADY YALOAK RIVER @ CRESSY 234201234203 PIRRON YALLOCK CREEK @ PIRRON YALLOCK 234203235202 GELIBRAND RIVER @ UPPER GELIBRAND 235202235203 CURDIES RIVER @ CURDIE 235203235204 LITTLE AIRE CREEK @ BEECH FOREST 235204235205 ARKINS CREEK WEST BRANCH @ WYELANGTA 235205235208 GELLIBRAND RIVER @ CARLISLE 235208235209 AIRE RIVER @ BEECH FOREST 235209235210 LARDNER CREEK @ GELLIBRAND 235210235211 KENNEDYS CREEK @ KENNEDYS CREEK 235211235212 CHAPPLE CREEK @ CHAPPLE VALE 235212235216 CUMBERLAND RIVER @ LORNE 235216235219 AIRE RIVER @ WYELANGTA 235219235223 SCOTTS CREEK @ SCOTTS CREEK 235223235224 GELLIBRAND RIVER @ BURRUPA 235224235226 ST. GEORGE RIVER @ ALLENVALE 235226235227 GELLIBRAND RIVER @ BUNKERS HILL 235227235229 FORD RIVER @ GLENAIRE 235229235232 PAINKALAC CREEK @ PAINKALAC CREEK DAM 235232235233 BARHAM RIVER EAST @ APOLLO BAY, PARADISE 235233
JFMAMJJASOND JFMAMJJASOND JFMAMJJASOND JFMAMJJASOND JFMAMJJASOND JFMAMJJASOND JFMAMJJASOND JFMAMJJASOND JFMAMJJASOND JFMAMJJASOND
1990 1991 1992 1993 1994 1995 1996 1997 1998 1999
0 values 1 value present >1 values present
CMA: Corangamite
Monthly Summary of Total Kjeldahl Nitrogen Data Availability1970
Site JFMAMJJASOND
1971
JFMAMJJASOND
1972
JFMAMJJASOND
1973
JFMAMJJASOND
1974
JFMAMJJASOND
1975
JFMAMJJASOND
1976
JFMAMJJASOND
1977
JFMAMJJASOND
1978
JFMAMJJASOND
1979
JFMAMJJASONDDescription Site232202 MOORABOOL RIVER @ BATESFORD 232202232204 MOORABOOL RIVER @ MORRISONS 232204232210 MOORABOOL RIVER WEST @ LAL LAL 232210232211 MOORABOOL RIVER WEST @ MOUNT DORAN 232211233200 BARWON RIVER @ POLLOCKSFORD 233200233211 BIRREGURRA CREEK @ RICKETTS MARSH 233211233214 BARWON RIVER EAST @ FORREST 233214233215 LEIGH RIVER @ MOUNT MERCER 233215233218 BARWON RIVER @ INVERLEIGH 233218233223 WARRAMBINE CREEK @ WARRAMBINE 233223233224 BARWON RIVER @ RICKETTS MARSH 233224233228 BOUNDARY CREEK @ YEODENE 233228234200 WOADY YALOAK RIVER @ PITFIELD 234200234201 WOADY YALOAK RIVER @ CRESSY 234201234203 PIRRON YALLOCK CREEK @ PIRRON YALLOCK 234203235202 GELIBRAND RIVER @ UPPER GELIBRAND 235202235203 CURDIES RIVER @ CURDIE 235203235204 LITTLE AIRE CREEK @ BEECH FOREST 235204235205 ARKINS CREEK WEST BRANCH @ WYELANGTA 235205235208 GELLIBRAND RIVER @ CARLISLE 235208235209 AIRE RIVER @ BEECH FOREST 235209235210 LARDNER CREEK @ GELLIBRAND 235210235211 KENNEDYS CREEK @ KENNEDYS CREEK 235211235212 CHAPPLE CREEK @ CHAPPLE VALE 235212235216 CUMBERLAND RIVER @ LORNE 235216235219 AIRE RIVER @ WYELANGTA 235219235223 SCOTTS CREEK @ SCOTTS CREEK 235223235224 GELLIBRAND RIVER @ BURRUPA 235224235226 ST. GEORGE RIVER @ ALLENVALE 235226235227 GELLIBRAND RIVER @ BUNKERS HILL 235227235229 FORD RIVER @ GLENAIRE 235229235232 PAINKALAC CREEK @ PAINKALAC CREEK DAM 235232235233 BARHAM RIVER EAST @ APOLLO BAY, PARADISE 235233
JFMAMJJASOND JFMAMJJASOND JFMAMJJASOND JFMAMJJASOND JFMAMJJASOND JFMAMJJASOND JFMAMJJASOND JFMAMJJASOND JFMAMJJASOND JFMAMJJASOND
1970 1971 1972 1973 1974 1975 1976 1977 1978 1979
0 values 1 value present >1 values present

CMA: Corangamite
Monthly Summary of Total Kjeldahl Nitrogen Data Availability1980
Site JFMAMJJASOND
1981
JFMAMJJASOND
1982
JFMAMJJASOND
1983
JFMAMJJASOND
1984
JFMAMJJASOND
1985
JFMAMJJASOND
1986
JFMAMJJASOND
1987
JFMAMJJASOND
1988
JFMAMJJASOND
1989
JFMAMJJASONDDescription Site232202 MOORABOOL RIVER @ BATESFORD 232202232204 MOORABOOL RIVER @ MORRISONS 232204232210 MOORABOOL RIVER WEST @ LAL LAL 232210232211 MOORABOOL RIVER WEST @ MOUNT DORAN 232211233200 BARWON RIVER @ POLLOCKSFORD 233200233211 BIRREGURRA CREEK @ RICKETTS MARSH 233211233214 BARWON RIVER EAST @ FORREST 233214233215 LEIGH RIVER @ MOUNT MERCER 233215233218 BARWON RIVER @ INVERLEIGH 233218233223 WARRAMBINE CREEK @ WARRAMBINE 233223233224 BARWON RIVER @ RICKETTS MARSH 233224233228 BOUNDARY CREEK @ YEODENE 233228234200 WOADY YALOAK RIVER @ PITFIELD 234200234201 WOADY YALOAK RIVER @ CRESSY 234201234203 PIRRON YALLOCK CREEK @ PIRRON YALLOCK 234203235202 GELIBRAND RIVER @ UPPER GELIBRAND 235202235203 CURDIES RIVER @ CURDIE 235203235204 LITTLE AIRE CREEK @ BEECH FOREST 235204235205 ARKINS CREEK WEST BRANCH @ WYELANGTA 235205235208 GELLIBRAND RIVER @ CARLISLE 235208235209 AIRE RIVER @ BEECH FOREST 235209235210 LARDNER CREEK @ GELLIBRAND 235210235211 KENNEDYS CREEK @ KENNEDYS CREEK 235211235212 CHAPPLE CREEK @ CHAPPLE VALE 235212235216 CUMBERLAND RIVER @ LORNE 235216235219 AIRE RIVER @ WYELANGTA 235219235223 SCOTTS CREEK @ SCOTTS CREEK 235223235224 GELLIBRAND RIVER @ BURRUPA 235224235226 ST. GEORGE RIVER @ ALLENVALE 235226235227 GELLIBRAND RIVER @ BUNKERS HILL 235227235229 FORD RIVER @ GLENAIRE 235229235232 PAINKALAC CREEK @ PAINKALAC CREEK DAM 235232235233 BARHAM RIVER EAST @ APOLLO BAY, PARADISE 235233
JFMAMJJASOND JFMAMJJASOND JFMAMJJASOND JFMAMJJASOND JFMAMJJASOND JFMAMJJASOND JFMAMJJASOND JFMAMJJASOND JFMAMJJASOND JFMAMJJASOND
1980 1981 1982 1983 1984 1985 1986 1987 1988 1989
0 values 1 value present >1 values present

CMA: Corangamite
Monthly Summary of Total Kjeldahl Nitrogen Data Availability1990
Site JFMAMJJASOND
1991
JFMAMJJASOND
1992
JFMAMJJASOND
1993
JFMAMJJASOND
1994
JFMAMJJASOND
1995
JFMAMJJASOND
1996
JFMAMJJASOND
1997
JFMAMJJASOND
1998
JFMAMJJASOND
1999
JFMAMJJASONDDescription Site232202 MOORABOOL RIVER @ BATESFORD 232202232204 MOORABOOL RIVER @ MORRISONS 232204232210 MOORABOOL RIVER WEST @ LAL LAL 232210232211 MOORABOOL RIVER WEST @ MOUNT DORAN 232211233200 BARWON RIVER @ POLLOCKSFORD 233200233211 BIRREGURRA CREEK @ RICKETTS MARSH 233211233214 BARWON RIVER EAST @ FORREST 233214233215 LEIGH RIVER @ MOUNT MERCER 233215233218 BARWON RIVER @ INVERLEIGH 233218233223 WARRAMBINE CREEK @ WARRAMBINE 233223233224 BARWON RIVER @ RICKETTS MARSH 233224233228 BOUNDARY CREEK @ YEODENE 233228234200 WOADY YALOAK RIVER @ PITFIELD 234200234201 WOADY YALOAK RIVER @ CRESSY 234201234203 PIRRON YALLOCK CREEK @ PIRRON YALLOCK 234203235202 GELIBRAND RIVER @ UPPER GELIBRAND 235202235203 CURDIES RIVER @ CURDIE 235203235204 LITTLE AIRE CREEK @ BEECH FOREST 235204235205 ARKINS CREEK WEST BRANCH @ WYELANGTA 235205235208 GELLIBRAND RIVER @ CARLISLE 235208235209 AIRE RIVER @ BEECH FOREST 235209235210 LARDNER CREEK @ GELLIBRAND 235210235211 KENNEDYS CREEK @ KENNEDYS CREEK 235211235212 CHAPPLE CREEK @ CHAPPLE VALE 235212235216 CUMBERLAND RIVER @ LORNE 235216235219 AIRE RIVER @ WYELANGTA 235219235223 SCOTTS CREEK @ SCOTTS CREEK 235223235224 GELLIBRAND RIVER @ BURRUPA 235224235226 ST. GEORGE RIVER @ ALLENVALE 235226235227 GELLIBRAND RIVER @ BUNKERS HILL 235227235229 FORD RIVER @ GLENAIRE 235229235232 PAINKALAC CREEK @ PAINKALAC CREEK DAM 235232235233 BARHAM RIVER EAST @ APOLLO BAY, PARADISE 235233
JFMAMJJASOND JFMAMJJASOND JFMAMJJASOND JFMAMJJASOND JFMAMJJASOND JFMAMJJASOND JFMAMJJASOND JFMAMJJASOND JFMAMJJASOND JFMAMJJASOND
1990 1991 1992 1993 1994 1995 1996 1997 1998 1999
0 values 1 value present >1 values present

CMA: Corangamite
Monthly Summary of Nitrate/Nitrite Data Availability1970
Site JFMAMJJASOND
1971
JFMAMJJASOND
1972
JFMAMJJASOND
1973
JFMAMJJASOND
1974
JFMAMJJASOND
1975
JFMAMJJASOND
1976
JFMAMJJASOND
1977
JFMAMJJASOND
1978
JFMAMJJASOND
1979
JFMAMJJASONDDescription Site232202 MOORABOOL RIVER @ BATESFORD 232202232204 MOORABOOL RIVER @ MORRISONS 232204232210 MOORABOOL RIVER WEST @ LAL LAL 232210232211 MOORABOOL RIVER WEST @ MOUNT DORAN 232211233200 BARWON RIVER @ POLLOCKSFORD 233200233211 BIRREGURRA CREEK @ RICKETTS MARSH 233211233214 BARWON RIVER EAST @ FORREST 233214233215 LEIGH RIVER @ MOUNT MERCER 233215233218 BARWON RIVER @ INVERLEIGH 233218233223 WARRAMBINE CREEK @ WARRAMBINE 233223233224 BARWON RIVER @ RICKETTS MARSH 233224233228 BOUNDARY CREEK @ YEODENE 233228234200 WOADY YALOAK RIVER @ PITFIELD 234200234201 WOADY YALOAK RIVER @ CRESSY 234201234203 PIRRON YALLOCK CREEK @ PIRRON YALLOCK 234203235202 GELIBRAND RIVER @ UPPER GELIBRAND 235202235203 CURDIES RIVER @ CURDIE 235203235204 LITTLE AIRE CREEK @ BEECH FOREST 235204235205 ARKINS CREEK WEST BRANCH @ WYELANGTA 235205235208 GELLIBRAND RIVER @ CARLISLE 235208235209 AIRE RIVER @ BEECH FOREST 235209235210 LARDNER CREEK @ GELLIBRAND 235210235211 KENNEDYS CREEK @ KENNEDYS CREEK 235211235212 CHAPPLE CREEK @ CHAPPLE VALE 235212235216 CUMBERLAND RIVER @ LORNE 235216235219 AIRE RIVER @ WYELANGTA 235219235223 SCOTTS CREEK @ SCOTTS CREEK 235223235224 GELLIBRAND RIVER @ BURRUPA 235224235226 ST. GEORGE RIVER @ ALLENVALE 235226235227 GELLIBRAND RIVER @ BUNKERS HILL 235227235229 FORD RIVER @ GLENAIRE 235229235232 PAINKALAC CREEK @ PAINKALAC CREEK DAM 235232235233 BARHAM RIVER EAST @ APOLLO BAY, PARADISE 235233
JFMAMJJASOND JFMAMJJASOND JFMAMJJASOND JFMAMJJASOND JFMAMJJASOND JFMAMJJASOND JFMAMJJASOND JFMAMJJASOND JFMAMJJASOND JFMAMJJASOND
1970 1971 1972 1973 1974 1975 1976 1977 1978 1979
0 values 1 value present >1 values present

CMA: Corangamite
Monthly Summary of Nitrate/Nitrite Data Availability1980
Site JFMAMJJASOND
1981
JFMAMJJASOND
1982
JFMAMJJASOND
1983
JFMAMJJASOND
1984
JFMAMJJASOND
1985
JFMAMJJASOND
1986
JFMAMJJASOND
1987
JFMAMJJASOND
1988
JFMAMJJASOND
1989
JFMAMJJASONDDescription Site232202 MOORABOOL RIVER @ BATESFORD 232202232204 MOORABOOL RIVER @ MORRISONS 232204232210 MOORABOOL RIVER WEST @ LAL LAL 232210232211 MOORABOOL RIVER WEST @ MOUNT DORAN 232211233200 BARWON RIVER @ POLLOCKSFORD 233200233211 BIRREGURRA CREEK @ RICKETTS MARSH 233211233214 BARWON RIVER EAST @ FORREST 233214233215 LEIGH RIVER @ MOUNT MERCER 233215233218 BARWON RIVER @ INVERLEIGH 233218233223 WARRAMBINE CREEK @ WARRAMBINE 233223233224 BARWON RIVER @ RICKETTS MARSH 233224233228 BOUNDARY CREEK @ YEODENE 233228234200 WOADY YALOAK RIVER @ PITFIELD 234200234201 WOADY YALOAK RIVER @ CRESSY 234201234203 PIRRON YALLOCK CREEK @ PIRRON YALLOCK 234203235202 GELIBRAND RIVER @ UPPER GELIBRAND 235202235203 CURDIES RIVER @ CURDIE 235203235204 LITTLE AIRE CREEK @ BEECH FOREST 235204235205 ARKINS CREEK WEST BRANCH @ WYELANGTA 235205235208 GELLIBRAND RIVER @ CARLISLE 235208235209 AIRE RIVER @ BEECH FOREST 235209235210 LARDNER CREEK @ GELLIBRAND 235210235211 KENNEDYS CREEK @ KENNEDYS CREEK 235211235212 CHAPPLE CREEK @ CHAPPLE VALE 235212235216 CUMBERLAND RIVER @ LORNE 235216235219 AIRE RIVER @ WYELANGTA 235219235223 SCOTTS CREEK @ SCOTTS CREEK 235223235224 GELLIBRAND RIVER @ BURRUPA 235224235226 ST. GEORGE RIVER @ ALLENVALE 235226235227 GELLIBRAND RIVER @ BUNKERS HILL 235227235229 FORD RIVER @ GLENAIRE 235229235232 PAINKALAC CREEK @ PAINKALAC CREEK DAM 235232235233 BARHAM RIVER EAST @ APOLLO BAY, PARADISE 235233
JFMAMJJASOND JFMAMJJASOND JFMAMJJASOND JFMAMJJASOND JFMAMJJASOND JFMAMJJASOND JFMAMJJASOND JFMAMJJASOND JFMAMJJASOND JFMAMJJASOND
1980 1981 1982 1983 1984 1985 1986 1987 1988 1989
0 values 1 value present >1 values present

CMA: Corangamite
Monthly Summary of Nitrate/Nitrite Data Availability1990
Site JFMAMJJASOND
1991
JFMAMJJASOND
1992
JFMAMJJASOND
1993
JFMAMJJASOND
1994
JFMAMJJASOND
1995
JFMAMJJASOND
1996
JFMAMJJASOND
1997
JFMAMJJASOND
1998
JFMAMJJASOND
1999
JFMAMJJASONDDescription Site232202 MOORABOOL RIVER @ BATESFORD 232202232204 MOORABOOL RIVER @ MORRISONS 232204232210 MOORABOOL RIVER WEST @ LAL LAL 232210232211 MOORABOOL RIVER WEST @ MOUNT DORAN 232211233200 BARWON RIVER @ POLLOCKSFORD 233200233211 BIRREGURRA CREEK @ RICKETTS MARSH 233211233214 BARWON RIVER EAST @ FORREST 233214233215 LEIGH RIVER @ MOUNT MERCER 233215233218 BARWON RIVER @ INVERLEIGH 233218233223 WARRAMBINE CREEK @ WARRAMBINE 233223233224 BARWON RIVER @ RICKETTS MARSH 233224233228 BOUNDARY CREEK @ YEODENE 233228234200 WOADY YALOAK RIVER @ PITFIELD 234200234201 WOADY YALOAK RIVER @ CRESSY 234201234203 PIRRON YALLOCK CREEK @ PIRRON YALLOCK 234203235202 GELIBRAND RIVER @ UPPER GELIBRAND 235202235203 CURDIES RIVER @ CURDIE 235203235204 LITTLE AIRE CREEK @ BEECH FOREST 235204235205 ARKINS CREEK WEST BRANCH @ WYELANGTA 235205235208 GELLIBRAND RIVER @ CARLISLE 235208235209 AIRE RIVER @ BEECH FOREST 235209235210 LARDNER CREEK @ GELLIBRAND 235210235211 KENNEDYS CREEK @ KENNEDYS CREEK 235211235212 CHAPPLE CREEK @ CHAPPLE VALE 235212235216 CUMBERLAND RIVER @ LORNE 235216235219 AIRE RIVER @ WYELANGTA 235219235223 SCOTTS CREEK @ SCOTTS CREEK 235223235224 GELLIBRAND RIVER @ BURRUPA 235224235226 ST. GEORGE RIVER @ ALLENVALE 235226235227 GELLIBRAND RIVER @ BUNKERS HILL 235227235229 FORD RIVER @ GLENAIRE 235229235232 PAINKALAC CREEK @ PAINKALAC CREEK DAM 235232235233 BARHAM RIVER EAST @ APOLLO BAY, PARADISE 235233
JFMAMJJASOND JFMAMJJASOND JFMAMJJASOND JFMAMJJASOND JFMAMJJASOND JFMAMJJASOND JFMAMJJASOND JFMAMJJASOND JFMAMJJASOND JFMAMJJASOND
1990 1991 1992 1993 1994 1995 1996 1997 1998 1999
0 values 1 value present >1 values present

CMA: Corangamite
Monthly Summary of Total Phosphorus Data Availability1970
Site JFMAMJJASOND
1971
JFMAMJJASOND
1972
JFMAMJJASOND
1973
JFMAMJJASOND
1974
JFMAMJJASOND
1975
JFMAMJJASOND
1976
JFMAMJJASOND
1977
JFMAMJJASOND
1978
JFMAMJJASOND
1979
JFMAMJJASONDDescription Site232202 MOORABOOL RIVER @ BATESFORD 232202232204 MOORABOOL RIVER @ MORRISONS 232204232210 MOORABOOL RIVER WEST @ LAL LAL 232210232211 MOORABOOL RIVER WEST @ MOUNT DORAN 232211233200 BARWON RIVER @ POLLOCKSFORD 233200233211 BIRREGURRA CREEK @ RICKETTS MARSH 233211233214 BARWON RIVER EAST @ FORREST 233214233215 LEIGH RIVER @ MOUNT MERCER 233215233218 BARWON RIVER @ INVERLEIGH 233218233223 WARRAMBINE CREEK @ WARRAMBINE 233223233224 BARWON RIVER @ RICKETTS MARSH 233224233228 BOUNDARY CREEK @ YEODENE 233228234200 WOADY YALOAK RIVER @ PITFIELD 234200234201 WOADY YALOAK RIVER @ CRESSY 234201234203 PIRRON YALLOCK CREEK @ PIRRON YALLOCK 234203235202 GELIBRAND RIVER @ UPPER GELIBRAND 235202235203 CURDIES RIVER @ CURDIE 235203235204 LITTLE AIRE CREEK @ BEECH FOREST 235204235205 ARKINS CREEK WEST BRANCH @ WYELANGTA 235205235208 GELLIBRAND RIVER @ CARLISLE 235208235209 AIRE RIVER @ BEECH FOREST 235209235210 LARDNER CREEK @ GELLIBRAND 235210235211 KENNEDYS CREEK @ KENNEDYS CREEK 235211235212 CHAPPLE CREEK @ CHAPPLE VALE 235212235216 CUMBERLAND RIVER @ LORNE 235216235219 AIRE RIVER @ WYELANGTA 235219235223 SCOTTS CREEK @ SCOTTS CREEK 235223235224 GELLIBRAND RIVER @ BURRUPA 235224235226 ST. GEORGE RIVER @ ALLENVALE 235226235227 GELLIBRAND RIVER @ BUNKERS HILL 235227235229 FORD RIVER @ GLENAIRE 235229235232 PAINKALAC CREEK @ PAINKALAC CREEK DAM 235232235233 BARHAM RIVER EAST @ APOLLO BAY, PARADISE 235233
JFMAMJJASOND JFMAMJJASOND JFMAMJJASOND JFMAMJJASOND JFMAMJJASOND JFMAMJJASOND JFMAMJJASOND JFMAMJJASOND JFMAMJJASOND JFMAMJJASOND
1970 1971 1972 1973 1974 1975 1976 1977 1978 1979
0 values 1 value present >1 values present

CMA: Corangamite
Monthly Summary of Total Phosphorus Data Availability1980
Site JFMAMJJASOND
1981
JFMAMJJASOND
1982
JFMAMJJASOND
1983
JFMAMJJASOND
1984
JFMAMJJASOND
1985
JFMAMJJASOND
1986
JFMAMJJASOND
1987
JFMAMJJASOND
1988
JFMAMJJASOND
1989
JFMAMJJASONDDescription Site232202 MOORABOOL RIVER @ BATESFORD 232202232204 MOORABOOL RIVER @ MORRISONS 232204232210 MOORABOOL RIVER WEST @ LAL LAL 232210232211 MOORABOOL RIVER WEST @ MOUNT DORAN 232211233200 BARWON RIVER @ POLLOCKSFORD 233200233211 BIRREGURRA CREEK @ RICKETTS MARSH 233211233214 BARWON RIVER EAST @ FORREST 233214233215 LEIGH RIVER @ MOUNT MERCER 233215233218 BARWON RIVER @ INVERLEIGH 233218233223 WARRAMBINE CREEK @ WARRAMBINE 233223233224 BARWON RIVER @ RICKETTS MARSH 233224233228 BOUNDARY CREEK @ YEODENE 233228234200 WOADY YALOAK RIVER @ PITFIELD 234200234201 WOADY YALOAK RIVER @ CRESSY 234201234203 PIRRON YALLOCK CREEK @ PIRRON YALLOCK 234203235202 GELIBRAND RIVER @ UPPER GELIBRAND 235202235203 CURDIES RIVER @ CURDIE 235203235204 LITTLE AIRE CREEK @ BEECH FOREST 235204235205 ARKINS CREEK WEST BRANCH @ WYELANGTA 235205235208 GELLIBRAND RIVER @ CARLISLE 235208235209 AIRE RIVER @ BEECH FOREST 235209235210 LARDNER CREEK @ GELLIBRAND 235210235211 KENNEDYS CREEK @ KENNEDYS CREEK 235211235212 CHAPPLE CREEK @ CHAPPLE VALE 235212235216 CUMBERLAND RIVER @ LORNE 235216235219 AIRE RIVER @ WYELANGTA 235219235223 SCOTTS CREEK @ SCOTTS CREEK 235223235224 GELLIBRAND RIVER @ BURRUPA 235224235226 ST. GEORGE RIVER @ ALLENVALE 235226235227 GELLIBRAND RIVER @ BUNKERS HILL 235227235229 FORD RIVER @ GLENAIRE 235229235232 PAINKALAC CREEK @ PAINKALAC CREEK DAM 235232235233 BARHAM RIVER EAST @ APOLLO BAY, PARADISE 235233
JFMAMJJASOND JFMAMJJASOND JFMAMJJASOND JFMAMJJASOND JFMAMJJASOND JFMAMJJASOND JFMAMJJASOND JFMAMJJASOND JFMAMJJASOND JFMAMJJASOND
1980 1981 1982 1983 1984 1985 1986 1987 1988 1989
0 values 1 value present >1 values present

CMA: Corangamite
Monthly Summary of Total Phosphorus Data Availability1990
Site JFMAMJJASOND
1991
JFMAMJJASOND
1992
JFMAMJJASOND
1993
JFMAMJJASOND
1994
JFMAMJJASOND
1995
JFMAMJJASOND
1996
JFMAMJJASOND
1997
JFMAMJJASOND
1998
JFMAMJJASOND
1999
JFMAMJJASONDDescription Site232202 MOORABOOL RIVER @ BATESFORD 232202232204 MOORABOOL RIVER @ MORRISONS 232204232210 MOORABOOL RIVER WEST @ LAL LAL 232210232211 MOORABOOL RIVER WEST @ MOUNT DORAN 232211233200 BARWON RIVER @ POLLOCKSFORD 233200233211 BIRREGURRA CREEK @ RICKETTS MARSH 233211233214 BARWON RIVER EAST @ FORREST 233214233215 LEIGH RIVER @ MOUNT MERCER 233215233218 BARWON RIVER @ INVERLEIGH 233218233223 WARRAMBINE CREEK @ WARRAMBINE 233223233224 BARWON RIVER @ RICKETTS MARSH 233224233228 BOUNDARY CREEK @ YEODENE 233228234200 WOADY YALOAK RIVER @ PITFIELD 234200234201 WOADY YALOAK RIVER @ CRESSY 234201234203 PIRRON YALLOCK CREEK @ PIRRON YALLOCK 234203235202 GELIBRAND RIVER @ UPPER GELIBRAND 235202235203 CURDIES RIVER @ CURDIE 235203235204 LITTLE AIRE CREEK @ BEECH FOREST 235204235205 ARKINS CREEK WEST BRANCH @ WYELANGTA 235205235208 GELLIBRAND RIVER @ CARLISLE 235208235209 AIRE RIVER @ BEECH FOREST 235209235210 LARDNER CREEK @ GELLIBRAND 235210235211 KENNEDYS CREEK @ KENNEDYS CREEK 235211235212 CHAPPLE CREEK @ CHAPPLE VALE 235212235216 CUMBERLAND RIVER @ LORNE 235216235219 AIRE RIVER @ WYELANGTA 235219235223 SCOTTS CREEK @ SCOTTS CREEK 235223235224 GELLIBRAND RIVER @ BURRUPA 235224235226 ST. GEORGE RIVER @ ALLENVALE 235226235227 GELLIBRAND RIVER @ BUNKERS HILL 235227235229 FORD RIVER @ GLENAIRE 235229235232 PAINKALAC CREEK @ PAINKALAC CREEK DAM 235232235233 BARHAM RIVER EAST @ APOLLO BAY, PARADISE 235233
JFMAMJJASOND JFMAMJJASOND JFMAMJJASOND JFMAMJJASOND JFMAMJJASOND JFMAMJJASOND JFMAMJJASOND JFMAMJJASOND JFMAMJJASOND JFMAMJJASOND
1990 1991 1992 1993 1994 1995 1996 1997 1998 1999
0 values 1 value present >1 values present

Appendix B - Trend plots for stations in the Corangamite CMA

1975 1980 1985 1990 1995 20000
1000
2000
3000
4000
EC
(µS
/cm
@ 2
5°C
)
1975 1980 1985 1990 1995 20000.0
0.4
0.8
1.2
1.6
2.0
TN (m
g/l)
1975 1980 1985 1990 1995 2000
Date
0.00
0.04
0.08
0.12
0.16
TP (m
g/l)
1975 1980 1985 1990 1995 20000
1
10
100
Turb
idity
(NTU
)
1975 1980 1985 1990 1995 20006.0
6.5
7.0
7.5
8.0
8.5
9.0
pH
Moorabool River @ Batesford (Station 232202)

1975 1980 1985 1990 1995 20000
400
800
1200
1600
2000
EC
(µS
/cm
@ 2
5°C
)
1975 1980 1985 1990 1995 20000.0
5.0
10.0
15.0
20.0
25.0
TN (m
g/l)
1975 1980 1985 1990 1995 2000
Date
0.00
5.00
10.00
15.00
20.00
25.00
TP (m
g/l)
1975 1980 1985 1990 1995 20000
1
10
100
Turb
idity
(NTU
)
1975 1980 1985 1990 1995 20006.5
7.0
7.5
8.0
8.5
9.0
pH
Moorabool River @ Morrisons (Station 232204)

1975 1980 1985 1990 1995 20000
1000
2000
3000
EC
(µS
/cm
@ 2
5°C
)
1975 1980 1985 1990 1995 20000.0
1.0
2.0
3.0
4.0
TN (m
g/l)
1975 1980 1985 1990 1995 2000
Date
0.00
0.02
0.04
0.06
0.08
0.10
TP (m
g/l)
1975 1980 1985 1990 1995 20001
10
100
Turb
idity
(NTU
)
1975 1980 1985 1990 1995 20006.0
6.5
7.0
7.5
8.0
8.5
9.0
pH
Moorabool River West Branch @ Lal Lal (Station 232210)
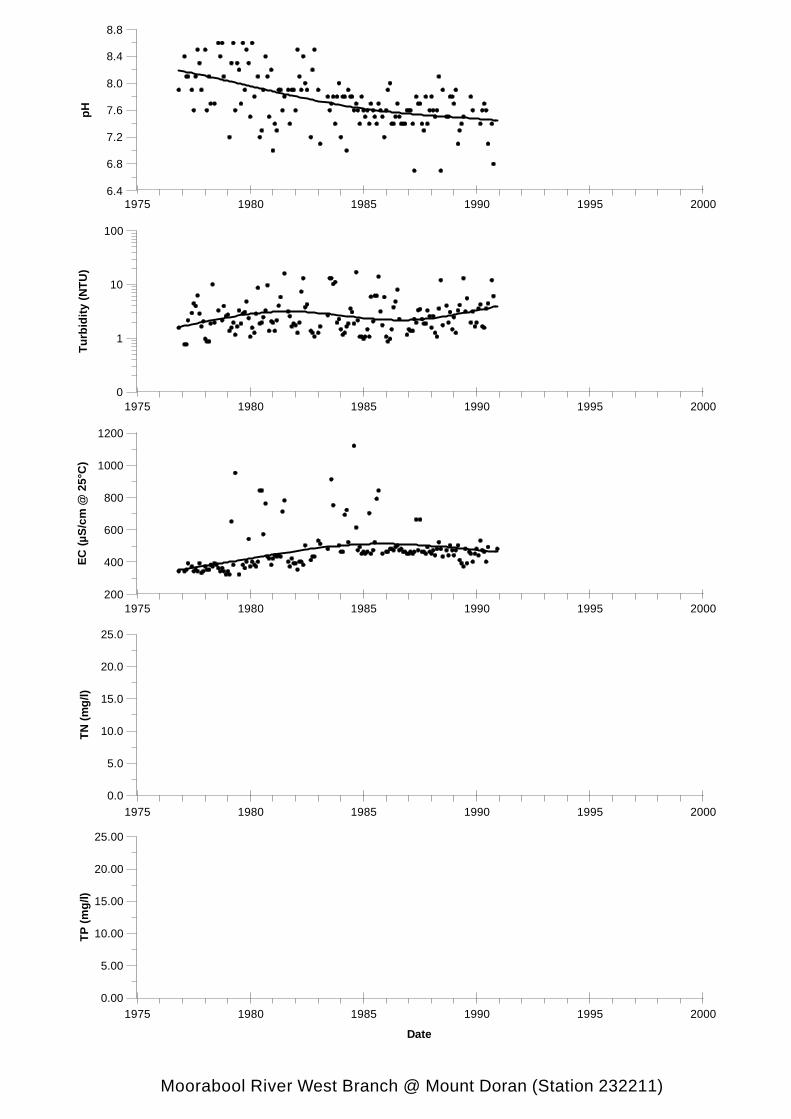
1975 1980 1985 1990 1995 2000200
400
600
800
1000
1200
EC
(µS
/cm
@ 2
5°C
)
1975 1980 1985 1990 1995 20000.0
5.0
10.0
15.0
20.0
25.0
TN (m
g/l)
1975 1980 1985 1990 1995 2000
Date
0.00
5.00
10.00
15.00
20.00
25.00
TP (m
g/l)
1975 1980 1985 1990 1995 20000
1
10
100
Turb
idity
(NTU
)
1975 1980 1985 1990 1995 20006.4
6.8
7.2
7.6
8.0
8.4
8.8
pH
Moorabool River West Branch @ Mount Doran (Station 232211)

1975 1980 1985 1990 1995 20000
1000
2000
3000
4000
5000
EC
(µS
/cm
@ 2
5°C
)
1975 1980 1985 1990 1995 20000.0
1.0
2.0
3.0
4.0
5.0
6.0
TN (m
g/l)
1975 1980 1985 1990 1995 2000
Date
0.00
0.20
0.40
0.60
0.80
TP (m
g/l)
1975 1980 1985 1990 1995 20000
1
10
100
1000
Turb
idity
(NTU
)
1975 1980 1985 1990 1995 20006.5
7.0
7.5
8.0
8.5
9.0
pH
Barwon River@Pollocksford (Station 233200)

1975 1980 1985 1990 1995 20000
10000
20000
30000
40000
50000
EC
(µS
/cm
@ 2
5°C
)
1975 1980 1985 1990 1995 20000.0
5.0
10.0
15.0
20.0
25.0
TN (m
g/l)
1975 1980 1985 1990 1995 2000
Date
0.00
5.00
10.00
15.00
20.00
25.00
TP (m
g/l)
1975 1980 1985 1990 1995 20000
1
10
100
1000
Turb
idity
(NTU
)
1975 1980 1985 1990 1995 20007.0
8.0
9.0
10.0
11.0
pH
Birregurra Creek @ Ricketts Marsh (Station 233211)

1975 1980 1985 1990 1995 200080
120
160
200
240
EC
(µS
/cm
@ 2
5°C
)
1975 1980 1985 1990 1995 20000.0
5.0
10.0
15.0
20.0
25.0
TN (m
g/l)
1975 1980 1985 1990 1995 2000
Date
0.00
5.00
10.00
15.00
20.00
25.00
TP (m
g/l)
1975 1980 1985 1990 1995 20001
10
100
1000
Turb
idity
(NTU
)
1975 1980 1985 1990 1995 20006.0
6.4
6.8
7.2
7.6
8.0
pH
Barwon River East Branch @ Forrest (Above Tunnel) (Station 233214)
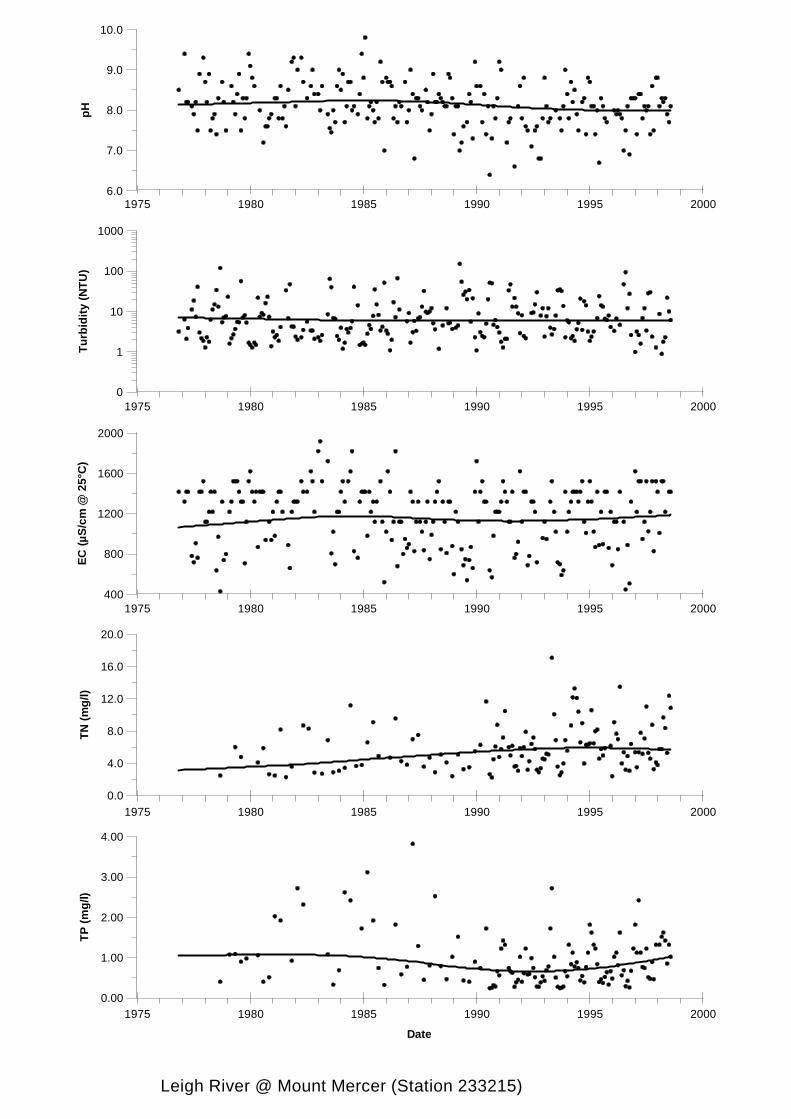
1975 1980 1985 1990 1995 2000400
800
1200
1600
2000
EC
(µS
/cm
@ 2
5°C
)
1975 1980 1985 1990 1995 20000.0
4.0
8.0
12.0
16.0
20.0
TN (m
g/l)
1975 1980 1985 1990 1995 2000
Date
0.00
1.00
2.00
3.00
4.00
TP (m
g/l)
1975 1980 1985 1990 1995 20000
1
10
100
1000
Turb
idity
(NTU
)
1975 1980 1985 1990 1995 20006.0
7.0
8.0
9.0
10.0
pH
Leigh River @ Mount Mercer (Station 233215)

1975 1980 1985 1990 1995 20000
2000
4000
6000
8000
10000
12000
EC
(µS
/cm
@ 2
5°C
)
1975 1980 1985 1990 1995 20000.0
5.0
10.0
15.0
20.0
25.0
TN (m
g/l)
1975 1980 1985 1990 1995 2000
Date
0.00
5.00
10.00
15.00
20.00
25.00
TP (m
g/l)
1975 1980 1985 1990 1995 20000
1
10
100
1000
Turb
idity
(NTU
)
1975 1980 1985 1990 1995 20006.0
6.5
7.0
7.5
8.0
8.5
9.0
pH
Barwon River @ Inverleigh (Station 233218)

1975 1980 1985 1990 1995 20000
2000
4000
6000
8000
10000
EC
(µS
/cm
@ 2
5°C
)
1975 1980 1985 1990 1995 20000.0
1.0
2.0
3.0
4.0
5.0
TN (m
g/l)
1975 1980 1985 1990 1995 2000
Date
0.00
0.04
0.08
0.12
0.16
0.20
0.24
TP (m
g/l)
1975 1980 1985 1990 1995 20000
1
10
100
1000
Turb
idity
(NTU
)
1975 1980 1985 1990 1995 20007.0
8.0
9.0
10.0
11.0
pH
Warrambine Creek @ Warrambine (Station 233223)

1975 1980 1985 1990 1995 20000
500
1000
1500
2000
2500
EC
(µS
/cm
@ 2
5°C
)
1975 1980 1985 1990 1995 20000.0
5.0
10.0
15.0
20.0
25.0
TN (m
g/l)
1975 1980 1985 1990 1995 2000
Date
0.00
5.00
10.00
15.00
20.00
25.00
TP (m
g/l)
1975 1980 1985 1990 1995 20001
10
100
1000
Turb
idity
(NTU
)
1975 1980 1985 1990 1995 20006.0
6.5
7.0
7.5
8.0
8.5
9.0
pH
Barwon River @ Ricketts Marsh (Station 233224)

1975 1980 1985 1990 1995 2000200
400
600
800
1000
1200
EC
(µS
/cm
@ 2
5°C
)
1975 1980 1985 1990 1995 20000.0
5.0
10.0
15.0
20.0
25.0
TN (m
g/l)
1975 1980 1985 1990 1995 2000
Date
0.00
5.00
10.00
15.00
20.00
25.00
TP (m
g/l)
1975 1980 1985 1990 1995 20001
10
100
Turb
idity
(NTU
)
1975 1980 1985 1990 1995 20003.0
4.0
5.0
6.0
7.0
8.0
pH
Boundary Creek @ Yeodene (Station 233228)

1975 1980 1985 1990 1995 20000
1000
2000
3000
4000
5000
EC
(µS
/cm
@ 2
5°C
)
1975 1980 1985 1990 1995 20000.0
0.4
0.8
1.2
1.6
2.0
TN (m
g/l)
1975 1980 1985 1990 1995 2000
Date
0.00
0.02
0.04
0.06
0.08
0.10
0.12
TP (m
g/l)
1975 1980 1985 1990 1995 20000
1
10
100
1000
Turb
idity
(NTU
)
1975 1980 1985 1990 1995 20006.8
7.2
7.6
8.0
8.4
pH
Woady Yaloak River @ Pitfield (Station 234200)

1975 1980 1985 1990 1995 20000
4000
8000
12000
EC
(µS
/cm
@ 2
5°C
)
1975 1980 1985 1990 1995 20000.0
5.0
10.0
15.0
20.0
25.0
TN (m
g/l)
1975 1980 1985 1990 1995 2000
Date
0.00
5.00
10.00
15.00
20.00
25.00
TP (m
g/l)
1975 1980 1985 1990 1995 20000
1
10
100
1000
Turb
idity
(NTU
)
1975 1980 1985 1990 1995 20006.5
7.0
7.5
8.0
8.5
9.0
pH
Woady Yaloak River @ Cressy (Yarima) (Station 234201)

1975 1980 1985 1990 1995 20000
1000
2000
3000
4000
EC
(µS
/cm
@ 2
5°C
)
1975 1980 1985 1990 1995 20000.0
1.0
2.0
3.0
4.0
TN (m
g/l)
1975 1980 1985 1990 1995 2000
Date
0.00
0.10
0.20
0.30
0.40
TP (m
g/l)
1975 1980 1985 1990 1995 20001
10
100
Turb
idity
(NTU
)
1975 1980 1985 1990 1995 20006.0
6.5
7.0
7.5
8.0
8.5
pH
Pirron Yallock Creek @ Pirron Yallock (Above H'Wy Br.) (Station 234203)

1975 1980 1985 1990 1995 200080
120
160
200
240
EC
(µS
/cm
@ 2
5°C
)
1975 1980 1985 1990 1995 20000.0
5.0
10.0
15.0
20.0
25.0
TN (m
g/l)
1975 1980 1985 1990 1995 2000
Date
0.00
5.00
10.00
15.00
20.00
25.00
TP (m
g/l)
1975 1980 1985 1990 1995 20001
10
100
Turb
idity
(NTU
)
1975 1980 1985 1990 1995 20005.6
6.0
6.4
6.8
7.2
7.6
8.0
pH
Gelibrand River @ Upper Gelibrand (Station 235202)

1975 1980 1985 1990 1995 2000400
800
1200
1600
2000
2400
EC
(µS
/cm
@ 2
5°C
)
1975 1980 1985 1990 1995 20000.0
5.0
10.0
15.0
20.0
25.0
TN (m
g/l)
1975 1980 1985 1990 1995 2000
Date
0.00
5.00
10.00
15.00
20.00
25.00
TP (m
g/l)
1975 1980 1985 1990 1995 20000
1
10
100
Turb
idity
(NTU
)
1975 1980 1985 1990 1995 20006.4
6.8
7.2
7.6
8.0
8.4
8.8
pH
Curdies River @ Curdie (Station 235203)

1975 1980 1985 1990 1995 200060
80
100
120
140
160
EC
(µS
/cm
@ 2
5°C
)
1975 1980 1985 1990 1995 20000.0
5.0
10.0
15.0
20.0
25.0
TN (m
g/l)
1975 1980 1985 1990 1995 2000
Date
0.00
5.00
10.00
15.00
20.00
25.00
TP (m
g/l)
1975 1980 1985 1990 1995 20001
10
100
Turb
idity
(NTU
)
1975 1980 1985 1990 1995 20005.5
6.0
6.5
7.0
7.5
8.0
pH
Little Aire Creek @ Beech Forest (Station 235204)

1975 1980 1985 1990 1995 200040
80
120
160
200
EC
(µS
/cm
@ 2
5°C
)
1975 1980 1985 1990 1995 20000.0
5.0
10.0
15.0
20.0
25.0
TN (m
g/l)
1975 1980 1985 1990 1995 2000
Date
0.00
5.00
10.00
15.00
20.00
25.00
TP (m
g/l)
1975 1980 1985 1990 1995 20000
1
10
Turb
idity
(NTU
)
1975 1980 1985 1990 1995 20005.5
6.0
6.5
7.0
7.5
8.0
pH
Arkins Creek West Branch @ Wyelangta (Station 235205)
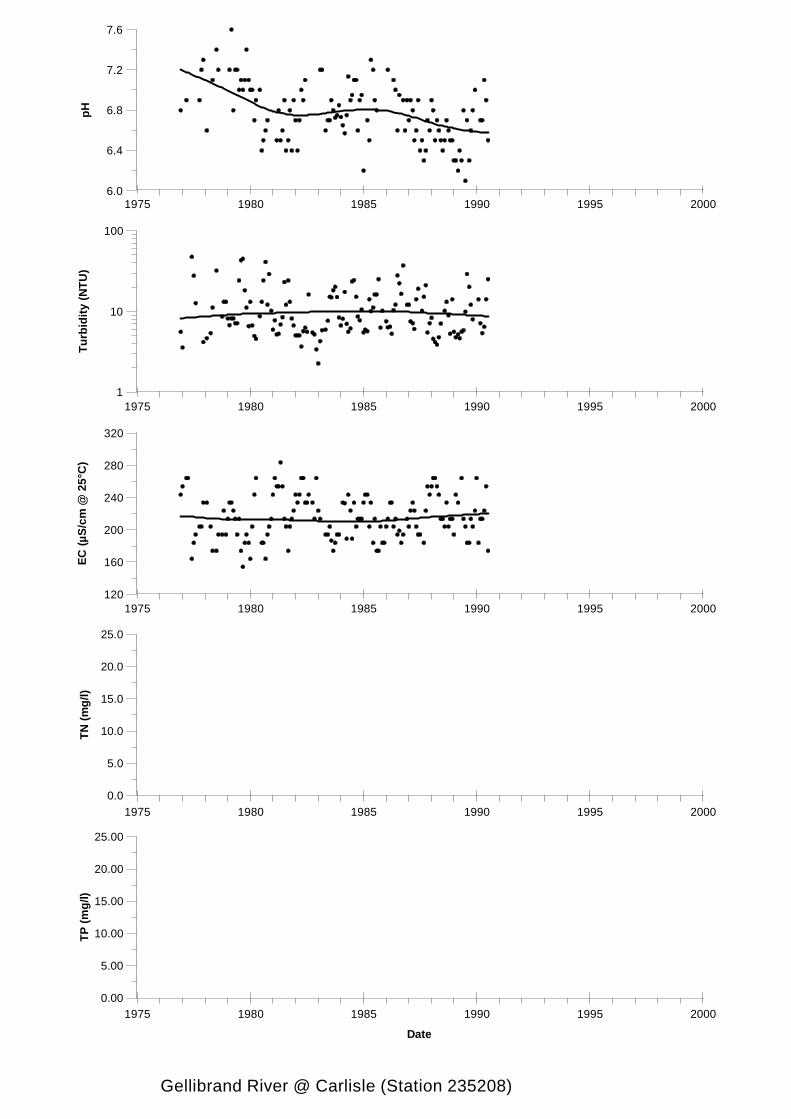
1975 1980 1985 1990 1995 2000120
160
200
240
280
320
EC
(µS
/cm
@ 2
5°C
)
1975 1980 1985 1990 1995 20000.0
5.0
10.0
15.0
20.0
25.0
TN (m
g/l)
1975 1980 1985 1990 1995 2000
Date
0.00
5.00
10.00
15.00
20.00
25.00
TP (m
g/l)
1975 1980 1985 1990 1995 20001
10
100
Turb
idity
(NTU
)
1975 1980 1985 1990 1995 20006.0
6.4
6.8
7.2
7.6
pH
Gellibrand River @ Carlisle (Station 235208)

1975 1980 1985 1990 1995 200080
100
120
140
160
180
EC
(µS
/cm
@ 2
5°C
)
1975 1980 1985 1990 1995 20000.0
5.0
10.0
15.0
20.0
25.0
TN (m
g/l)
1975 1980 1985 1990 1995 2000
Date
0.00
5.00
10.00
15.00
20.00
25.00
TP (m
g/l)
1975 1980 1985 1990 1995 20001
10
100
Turb
idity
(NTU
)
1975 1980 1985 1990 1995 20006.0
6.4
6.8
7.2
7.6
8.0
pH
Aire River @ Beech Forest (Station 235209)

1975 1980 1985 1990 1995 2000120
160
200
240
EC
(µS
/cm
@ 2
5°C
)
1975 1980 1985 1990 1995 20000.0
5.0
10.0
15.0
20.0
25.0
TN (m
g/l)
1975 1980 1985 1990 1995 2000
Date
0.00
5.00
10.00
15.00
20.00
25.00
TP (m
g/l)
1975 1980 1985 1990 1995 20001
10
100
Turb
idity
(NTU
)
1975 1980 1985 1990 1995 20006.0
6.4
6.8
7.2
7.6
8.0
pH
Lardner Creek @ Gellibrand (Station 235210)

1975 1980 1985 1990 1995 2000200
400
600
800
1000
1200
1400
EC
(µS
/cm
@ 2
5°C
)
1975 1980 1985 1990 1995 20000.0
5.0
10.0
15.0
20.0
25.0
TN (m
g/l)
1975 1980 1985 1990 1995 2000
Date
0.00
5.00
10.00
15.00
20.00
25.00
TP (m
g/l)
1975 1980 1985 1990 1995 20001
10
100
Turb
idity
(NTU
)
1975 1980 1985 1990 1995 20006.0
6.4
6.8
7.2
7.6
pH
Kennedys Creek @ Kennedys Creek (Station 235211)

1975 1980 1985 1990 1995 2000150
200
250
300
350
400
EC
(µS
/cm
@ 2
5°C
)
1975 1980 1985 1990 1995 20000.0
5.0
10.0
15.0
20.0
25.0
TN (m
g/l)
1975 1980 1985 1990 1995 2000
Date
0.00
5.00
10.00
15.00
20.00
25.00
TP (m
g/l)
1975 1980 1985 1990 1995 20001
10
100
Turb
idity
(NTU
)
1975 1980 1985 1990 1995 20006.0
6.4
6.8
7.2
7.6
8.0
pH
Chapple Creek @ Chapple Vale (Station 235212)

1975 1980 1985 1990 1995 200080
120
160
200
240
280
320
EC
(µS
/cm
@ 2
5°C
)
1975 1980 1985 1990 1995 20000.0
5.0
10.0
15.0
20.0
25.0
TN (m
g/l)
1975 1980 1985 1990 1995 2000
Date
0.00
5.00
10.00
15.00
20.00
25.00
TP (m
g/l)
1975 1980 1985 1990 1995 20000
1
10
100
Turb
idity
(NTU
)
1975 1980 1985 1990 1995 20005.0
6.0
7.0
8.0
9.0
pH
Cumberland River @ Lorne (Station 235216)

1975 1980 1985 1990 1995 200080
120
160
200
240
EC
(µS
/cm
@ 2
5°C
)
1975 1980 1985 1990 1995 20000.0
5.0
10.0
15.0
20.0
25.0
TN (m
g/l)
1975 1980 1985 1990 1995 2000
Date
0.00
5.00
10.00
15.00
20.00
25.00
TP (m
g/l)
1975 1980 1985 1990 1995 20001
10
100
Turb
idity
(NTU
)
1975 1980 1985 1990 1995 20006.0
6.4
6.8
7.2
7.6
8.0
pH
Aire River @ Wyelangta (Station 235219)

1975 1980 1985 1990 1995 20000
1000
2000
3000
4000
5000
EC
(µS
/cm
@ 2
5°C
)
1975 1980 1985 1990 1995 20000.0
5.0
10.0
15.0
20.0
25.0
TN (m
g/l)
1975 1980 1985 1990 1995 2000
Date
0.00
5.00
10.00
15.00
20.00
25.00
TP (m
g/l)
1975 1980 1985 1990 1995 20000
1
10
100
Turb
idity
(NTU
)
1975 1980 1985 1990 1995 20006.0
7.0
8.0
9.0
10.0
pH
Scotts Creek @ Scotts Creek (Station 235223)

1975 1980 1985 1990 1995 2000200
250
300
350
400
450
EC
(µS
/cm
@ 2
5°C
)
1975 1980 1985 1990 1995 20000.0
0.4
0.8
1.2
1.6
2.0
TN (m
g/l)
1975 1980 1985 1990 1995 2000
Date
0.00
0.04
0.08
0.12
0.16
0.20
TP (m
g/l)
1975 1980 1985 1990 1995 20001
10
100
Turb
idity
(NTU
)
1975 1980 1985 1990 1995 20006.0
6.4
6.8
7.2
7.6
pH
Gellibrand River @ Burrupa (Station 235224)

1975 1980 1985 1990 1995 2000100
150
200
250
300
350
400
EC
(µS
/cm
@ 2
5°C
)
1975 1980 1985 1990 1995 20000.0
5.0
10.0
15.0
20.0
25.0
TN (m
g/l)
1975 1980 1985 1990 1995 2000
Date
0.00
5.00
10.00
15.00
20.00
25.00
TP (m
g/l)
1975 1980 1985 1990 1995 20001
10
100
Turb
idity
(NTU
)
1975 1980 1985 1990 1995 20006.0
6.5
7.0
7.5
8.0
8.5
9.0
pH
St. George River @ Allenvale (Station 235226)

1975 1980 1985 1990 1995 2000100
200
300
400
500
EC
(µS
/cm
@ 2
5°C
)
1975 1980 1985 1990 1995 20000.0
0.4
0.8
1.2
1.6
TN (m
g/l)
1975 1980 1985 1990 1995 2000
Date
0.00
0.04
0.08
0.12
0.16
TP (m
g/l)
1975 1980 1985 1990 1995 20001
10
100
Turb
idity
(NTU
)
1975 1980 1985 1990 1995 20006.0
6.4
6.8
7.2
7.6
pH
Gellibrand River @ Bunkers Hill (Station 235227)

1975 1980 1985 1990 1995 2000140
160
180
200
220
240
EC
(µS
/cm
@ 2
5°C
)
1975 1980 1985 1990 1995 20000.0
5.0
10.0
15.0
20.0
25.0
TN (m
g/l)
1975 1980 1985 1990 1995 2000
Date
0.00
5.00
10.00
15.00
20.00
25.00
TP (m
g/l)
1975 1980 1985 1990 1995 20001
10
100
Turb
idity
(NTU
)
1975 1980 1985 1990 1995 20006.0
6.4
6.8
7.2
7.6
pH
Ford River @ Glenaire (Station 235229)

1975 1980 1985 1990 1995 20000
200
400
600
800
1000
EC
(µS
/cm
@ 2
5°C
)
1975 1980 1985 1990 1995 20000.0
5.0
10.0
15.0
20.0
25.0
TN (m
g/l)
1975 1980 1985 1990 1995 2000
Date
0.00
5.00
10.00
15.00
20.00
25.00
TP (m
g/l)
1975 1980 1985 1990 1995 20001
10
100
1000
Turb
idity
(NTU
)
1975 1980 1985 1990 1995 20006.0
6.5
7.0
7.5
8.0
8.5
pH
Painkalac Creek @ Painkalac Creek Dam (Station 235232)

1975 1980 1985 1990 1995 2000120
160
200
240
280
EC
(µS
/cm
@ 2
5°C
)
1975 1980 1985 1990 1995 20000.0
5.0
10.0
15.0
20.0
25.0
TN (m
g/l)
1975 1980 1985 1990 1995 2000
Date
0.00
5.00
10.00
15.00
20.00
25.00
TP (m
g/l)
1975 1980 1985 1990 1995 20000
1
10
100
Turb
idity
(NTU
)
1975 1980 1985 1990 1995 20006.0
6.4
6.8
7.2
7.6
8.0
pH
Barham River East Branch @ Apollo Bay, Paradise (Station 235233)