Embed Size (px)
Citation preview

Copyright Warning & Restrictions
The copyright law of the United States (Title 17, United States Code) governs the making of photocopies or other
reproductions of copyrighted material.
Under certain conditions specified in the law, libraries and archives are authorized to furnish a photocopy or other
reproduction. One of these specified conditions is that the photocopy or reproduction is not to be “used for any
purpose other than private study, scholarship, or research.” If a, user makes a request for, or later uses, a photocopy or reproduction for purposes in excess of “fair use” that user
may be liable for copyright infringement,
This institution reserves the right to refuse to accept a copying order if, in its judgment, fulfillment of the order
would involve violation of copyright law.
Please Note: The author retains the copyright while the New Jersey Institute of Technology reserves the right to
distribute this thesis or dissertation
Printing note: If you do not wish to print this page, then select “Pages from: first page # to: last page #” on the print dialog screen

The Van Houten library has removed some of the personal information and all signatures from the approval page and biographical sketches of theses and dissertations in order to protect the identity of NJIT graduates and faculty.

ABSTRACT
PROGRAMMING LANGUAGE TRENDS: AN EMPIRICAL STUDY
by
Yaofei Chen
Predicting the evolution of software engineering technology trends is a dubious
proposition. The recent evolution of software technology is a prime example; it is fast
paced and affected by many factors, which are themselves driven by a wide range of
sources. This dissertation is part of a long term project intended to analyze software
engineering technology trends and how they evolve. Basically, the following questions
will be answered: How to watch, predict, adapt to, and affect software engineering
trends?
In this dissertation, one field of software engineering, programming languages,
will be discussed. After reviewing the history of a group of programming languages, it
shows that two kinds of factors, intrinsic factors and extrinsic factors, could affect the
evolution of a programming language. Intrinsic factors are the factors that can be used to
describe the general design criteria of programming languages. Extrinsic factors are the
factors that are not directly related to the general attributes of programming languages,
but still can affect their evolution. In order to describe the relationship of these factors
and how they affect programming language trends, these factors need to be quantified. A
score has been assigned to each factor for every programming language. By collecting
historical data, a data warehouse has been established, which stores the value of each

factor for every programming language. The programming language trends are described
and evaluated by using these data.
Empirical research attempts to capture observed behaviors by empirical laws. In
this dissertation, statistical methods are used to describe historical programming language
trends and predict the evolution of the future trends. Several statistics models are
constructed to describe the relationships among these factors. Canonical correlation is
used to do the factor analysis. Multivariate multiple regression method has been used to
construct the statistics models for programming language trends. After statistics models
are constructed to describe the historical programming language trends, they are extended
to do tentative prediction for future trends. The models are validated by comparing the
predictive data and the actual data.

PROGRAMMING LANGUAGE TRENDS: AN EMPIRICAL STUDY
byYaofei Chen
A DissertationSubmitted to The Faculty of
New Jersey Institute of TechnologyIn Partial Fulfillment of the Requirements for the Degree ofDoctor of Philosophy in Computer and Information Science
College of Computer Science
August 2003

Copyright© 2003 by Yaofei Chen
ALL RIGHTS RESERVED

APPROVAL PAGE
PROGRAMMING LANGUAGE TRENDS: AN EMPIRICAL STUDY
Yaofei Chen
DateProfessor of Computer Science, NJIT
Joseph Leung, Committe Member Dateistinguished Professor of computer Science, NJIT, Newark, NJ
Dr. Rose Dios, Committee Member DateAssociate Professor of Mathematics, NJIT
Dr. Elsa Gunter, Committee Member DateAssociate Professor of Computer Science, NJIT
Dr. Vincent Oria, Committee Member DateAssistant Professor of Computer Science, NJIT

BIOGRAPHICAL SKETCH
Author: Yaofei Chen
Degree: Doctor of Philosophy
Date: August, 2003
Undergraduate and Graduate Education:
Doctor of Philosophy in Computer and Information Science,New Jersey Institute of Technology, Newark, NJ, 2003
Master of Engineering in Computer Science,Sichuan University, Chengdu, Sichuan, P.R. China, 1999
Bachelor of Engineering in Computer Science,Sichuan University, Chengdu, Sichuan, P.R. China, 1996
Major: Computer Science
Publications & Presentations:
Yaofei Chen, Ali Mili, Rose Dios, Lan Wu, Kefei Wang, "Programming LanguageTrends: An Empirical Study", Submitted to 26th International Conference onSoftware Engineering.
Yaofei Chen, Wanxue Li, Lin Wang, "Component-Based Software Engineering &Applications on Internet", Journal of Sichuan University, 1999.
Yaofei Chen, Jianping Fan, Wanxue Li, "High Availability (HA) System", Presentationin Conference of Chinese Academy of Science, 1996.
iv

This dissertation is dedicated tomy beloved parents
v

ACKNOWLEDGMENT
The author would like to take great pleasure in acknowledging his academic advisor, Dr.
Ali Milli, for his kind assistance and remarkable contribution to this dissertation. He not
only served as the author's academic advisor, but also gave the author support,
encouragement, and reassurance. Without his help, this dissertation could not be finished.
The author appreciates Dr. Rose Dios, who helped a lot in constructing the statistics
model. Many thanks to Dr. Joseph Leung, Dr. Elsa Gunter, and Dr. Vincent Oria for
actively participating in the author's Ph.D. dissertation committee. Mr. Kefei Wang
helped the author a lot in statistics models. His work is a great contribution to this
dissertation. The author also would like to thank all the members in the programming
language trends research group, Ms. Lan Wu, Ms. Krupa Doshi, Mr. Ray Lin, Mr. Ashish
Chopra, and Mr. P. S. Subramaniam. They have done a lot of work in the surveys.
Special thanks are given to the author's parents, who gave the author life, who gave the
author courage when he faced challenges, who gave the author inspiration when he met
problems. The author cannot thank more for what they have done for him.
vi

TABLE OF CONTENTS
Chapter Page
1 SOFTWARE ENGINEERING TRENDS 1
1.1 Introduction 1
1.2 Questionnaire Structure 3
1.3 Watching Software Engineering Trends 4
1.4 Predicting Software Engineering Trends 5
1.5 Adapting to Software Engineering Trends 6
1.6 Affecting Software Engineering Trends 7
1.7 Conclusion 7
2 FOCUS ON A FAMILY OF TRENDS: PROGRAMMING LANGUAGES 9
2.1 Introduction 9
2.2 History of Programming Languages 10
2.3 Programming Language Trends 13
2.4 Research Methods 14
3 SELECTING RELEVANT FACTORS 15
3.1 Intrinsic Factors 15
3.1.1 Generality 17
3.1.2 Orthogonality 18
3.1.3 Reliability 19
3.1.4 Maintainability 20
3.1.5 Efficiency 21
vii

TABLE OF CONTENTS(Continued)
Chapter Page
3.1.6 Simplicity 22
3.1.7 Machine Independence 22
3.1.8 Implementability 23
3.1.9 Extensibility 24
3.1.10 Expressiveness 24
3.1.11 Influence/Impact 25
3.2 Extrinsic Factors 26
3.2.1 Institutional Support 27
3.2.2 Industrial Support 28
3.2.3 Governmental Support 28
3.2.4 Organizational Support 28
3.2.5 Grassroots Support 29
3.2.6 Technology Support 29
4 QUANTIFYING RELEVANT FACTORS 30
4.1 Quantifying Intrinsic Factors 30
4.2 Quantifying Extrinsic Factors 34
5 DATA COLLECTION 35
5.1 Language List 35
viii

TABLE OF CONTENTS(Continued)
Chapter Page
5.2 Watching Programming Language Trends 35
5.2.1 ADA 35
5.2.2 ALGOL 37
5.2.3 APL 39
5.2.4 BASIC 40
5.2.5 C 41
5.2.6 C++ 43
5.2.7 COBOL 44
5.2.8 EIFFEL 46
5.2.9 FORTRAN 47
5.2.10 JAVA 50
5.2.11 LISP 52
5.2.12 ML 55
5.2.13 MODULA 55
5.2.14 PASCAL 57
5.2.15 PROLOG 58
5.2.16 SMALLTALK 59
5.2.17 SCHEME 60
5.3 Data Collection 62
5.3.1 Data Collection for Intrinsic Factors 62
5.3.2 Data Collection for Extrinsic Factors 64
ix
TABLE OF CONTENTS(Continued)
Chapter Page
6 SURVEY RESULTS 65
6.1 Survey Results for Grassroots Support 65
6.2 Survey Results for Institutional Support 71
6.3 Survey Results for Industrial Support 73
6.4 Survey Results for Governmental Support 76
6.5 Survey Results for Organizational Support 77
6.6 Survey Results for Technology Support 78
7 DATA ANALYSIS & MODEL CONSTRUCTION 79
7.1 Statistics Models 79
7.1.1 General Model 80
7.1.1 Possible Statistics Models 81
7.2 Data Analysis 84
7.2.1 Factor Analysis 84
7.2.2 Canonical Correlation Analysis 89
7.2.3 Statistics Conclusion 92
7.3 Model Construction 93
7.3.1 Multivariate Multiple Regression Model 93
7.3.2 Regression Model for Historical Trends 95
8 TOWARDS A PREDICTIVE MODEL 99
8.1 Model Derivation 99

TABLE OF CONTENTS(Continued)
Chapter Page
8.2 Predictive Model 101
9 MODEL VALIDATION & IMPROVEMENT 107
9.1 Model Validation 107
9.2 Model Improvement 109
9.2.1 Weakness 109
9.2.2 Possible Improvement 111
10 CONCLUSION AND FUTURE WORK 118
10.1 Summary 118
10.2 Evaluation 120
10.3 Future Work 121
APPENDIX A WEB-BASED SURVEY 123
APPENDIX B PREDICTIVE MODEL SIMULATION 128
REFERENCES 140
xi

LIST OF TABLES
Table Page
3.1 Lines of Code per Function Unit 24
3.2 Number of Descendents for Programming Languages 25
4.1 Features Used to Quantify Generality 31
4.2 Features Used to Quantify Orthogonality 31
4.3 Features Used to Quantify Reliability 32
4.4 Features Used to Quantify Maintainability 32
4.5 Features Used to Quantify Efficiency 32
4.6 Features Used to Quantify Simplicity 33
4.7 Features Used to Quantify Implementability 33
4.8 Features Used to Quantify Machine Independence 33
4.9 Features Used to Quantify Extensibility 33
4.10 Features Used to Quantify Expressiveness 34
4.11 Features Used to Quantify Impact/influence 34
5.1 Scores of Intrinsic Factors 63
7.1 Factor Analysis for Intrinsic Factor Matrix 85
7.2 Rotated Factor Pattern for Intrinsic Factors 86
7.3 Factor Analysis for Extrinsic Factor Matrix 87
7.4 Rotated Factor Pattern for Extrinsic Factors 88
7.5 Sample Correlation Results For Intrinsic Factors Only 90
7.6 Sample Correlation Results for all Factors 91
9.1 Difference between Actual Value and Predictive Value in 2003 108
ii

LIST OF FIGURES
Figure Page
2.1 History of high level programming languages 12
6.1 How many people consider this language as primary one from 1993 to 2003 65
6.2 Trends of most popular programming languages from 1993 to 2003 67
6.3 How many people know this language from 1993 to 2003 68
6.4 Trends of most-people-known languages from 1993 to 2003 70
6.5 Number of institutions use this language as introductory languagefrom 1993 to 2003 71
6.6 Number of students use this language for any of their coursesfrom 1993 to 2003 72
6.7 Number of companies use this language as primary languagefrom 1993 to 2003 73
6.8 Number of developers use this language as primary languagefrom 1993 to 2003 74
6.9 Number of commercial applications developed by this languagefrom 1993 to 2003 75
6.10 How much code is written by government in this languagefrom 1993 to 2003 76
6.11 Number of conferences for each language from 1993 to 2003 77
7.1 General models used to analyze data 80
7.2 Regression model for programming language trends 95
7.3 Sample SAS regression model report for one extrinsic factor 97
8.1 How many people consider this language as primary one in 2008 102
LIST OF FIGURES(Continued)
Figure Page
8.2 Trends of most popular programming languages from 1993 to 2008 103
8.3 How many people will know this language in 2008 104
8.4 Trends of most-people-known languages from 1993 to 2008 105
10.1 General lifecycle of a programming language 121
A.1 Web-based programming languages survey 123
A.2 Sample survey question 1 124
A.3 Sample survey question 2 125
A.4 Sample survey question 3 126
A.5 Survey results 127
B.1 Language selection 134
B.2 Language factors 135
B.3 Projection year 136
B.4 Projection results 137
B.5 Projection graph 138
xiv

CHAPTER 1
SOFTWARE ENGINEERING TRENDS
1.1 Introduction
Software engineering is an engineering discipline whose goal is the cost-effective
development of software systems. It was first proposed in 1968 at a conference held to
discuss what was then called the "software crisis". Tremendous progress has been
achieved since 1968 and the development of the software engineering discipline has
markedly improved the practice of software development. A much better understanding
of the activities involved in software development has been observed in past years.
Although there is a lot of progress, many researchers still consider software engineering
as a relatively young discipline. After a period of research about software engineering,
there are more and more interests on the evolution of software engineering.
Predicting the evolution of software engineering technology is, at best, a dubious
proposition. The recent evolution of software technology is a prime example; it is fast
paced and affected by many factors, which are themselves driven by a wide range of
sources. Many of the factors are outside the arena of software engineering and most of
them cannot even be identified. Right now, this doctoral work is at the early, and
tentative, stages of a project to analyze software engineering technology trends and how
they evolve. In this dissertation, the author will discuss the tentative venture in this
domain and sketch prospects for future research.
The purpose of this software engineering trends project is to analyze technology
trends and try to gain some insight into how they evolve. While this doctoral dissertation
1

2
is at the very early, and very tentative, stages of the whole project, research approaches of
this problem could be characterized by two premises:
1, Structuring the problem. When approaching the problem of software
engineering technology watch, there are many questions that beg for answers.
All of these questions are interrelated: some questions refine others; some
questions complement others; some questions provide the background for
others; some questions overlap with others, etc. The first order of business, for
this project, is to build a questionnaire structure, which arranges all these
questions in a way that attempts to highlight their interrelations. Also,
questionnaire structure should be improved by refining questions that are too
vague, merging identical questions, or synthesizing related questions.
2. Specifying the solution. Three research methods should be distinguished:
analytical research, which attempts to understand the phenomena that underlie
observed behavior, and build models that capture these phenomena; empirical
research, which makes no attempt to understand cause/effect relationships, but
merely attempts to capture observed behaviors by empirical models;
experimental research, which intervenes after analytical or empirical research
to validate the proposed models. For each issue, it is useful to deploy a
judicious combination of these three methods, or some subset thereof.

3
For the details of these research methods, they will be discussed later in this
dissertation. These methods will be used as tools to analyze the evolution of software
engineering.
1.2 Questionnaire Structure
To focus the effort on specific issues and to lend some structures to this inherently
complex problem, a questionnaire has been built on a hierarchy of the following
questions:
• How to watch software engineering trends? This question deals with what
indicators are needed to monitor, where to find them, and how to interpret
them.
• How to predict software engineering trends? This question deals with what
lifecycle do software engineering trends follow, and what triggers the passage
of a trend from one phase to another along the lifecycle.
• How to adapt to software engineering trends? This question deals with how
does one define institutional strategy in such a way as to maximize benefit
from what is known about a trend and minimize risk from what is not known
about it.
• How to affect software engineering trends? Perhaps more crucial is whether
trends can in fact be affected by any single entity. This question tries to
identify where, in the cycle of a trend, is it possible to alter the course of the
trend, and eventually how and by whom.

4
At the center of this hierarchy is the question of how to predict software
engineering trends. If this question can be understood well, the others can be answered
with adequate precision.
For each question, a judicious combination of the following three research
methods or some subset thereof will be used:
• Analytical research, which attempts to understand the phenomena that
underlie observed behavior, and build models that capture these phenomena.
• Empirical research, which makes no attempt to understand cause/effect
relationships, but merely attempts to capture observed behaviors by empirical
laws.
• Experimental research, which intervenes after analytical or empirical research
to validate the proposed models.
1.3 Watching Software Engineering Trends
The general goal of watching software engineering trends is to determine what
information must be maintained in order to gain a comprehensive view of the discipline
and its evolution. The information in question must be sufficiently rich to support
discipline-wide assessments as well as trend-specific analysis. The following questions
will be asked to watch software engineering trends:
• What is the relevant information that must be collected/monitored?
• Where this information could be found, or where did it infer from?
• How to interpret this information?
• How often does it need to update this information?

5
A number of software engineering-specific, and technology-generic indicators
have been identified, which have been divided into the following categories:
Classification Standing, Research and Development, Science and Technology Output,
Human Resources, Costs and Funding, Standards and Regulations, and Best Practices. [I]
Watching software engineering trends is the first step for the research on software
engineering trends. Basically, the purpose of watching software engineering trends is to
see the history of software engineering and analyze how it evolves. Then, a better
understanding can be gained and some conclusions can be drawn. Watching software
engineering trends is helpful to understand the future trends of software engineering.
1.4 Predicting Software Engineering Trends
The general goal of predicting software engineering trends is probably the most important
and the most difficult goal of this whole study. The focus of this goal is on identifying a
lifecycle that all trends follow. Once this lifecycle is identified, the software engineering
trends can be predicted based on it.
Based on previous research, the lifecycle, which software engineering trends will
follow, was recognized to be the following three cycles:
• Research Trends, which are a favorite topic of panel sessions and surveys.
• Technology Trends, which are driven by the maturation of applicable research
ideas, and by the successful evolution of the idea to a useful, technologically
viable, product.
• Market Trends, which are created either by the supply side or by the demand
side in different situations.

6
For different trends, different methods will be used to analyze and predict them.
In the author's point of view, empirical methods should be used to analyze research
trends and technology trends, analytical research should be used for market trends. There
are already some good analytical models for market trends, such as the Chasm Theory by
Geoffrey A. Moore. This tentative research concentrates on research trends and
technology trends.
1.5 Adapting to Software Engineering Trends
The general goal of adapting to software engineering trends is: "how to adapt to a trend if
the trend has been known?" For example, a corporate manager hears about a particular
trend (e.g. XML, .NET, Linux) and wants to know what to do about it: Ignore it? Adapt
the corporate products and support it? Develop a new set of products that support it? Etc.
When a party has a particular sake in the evolution of a trend, he/she may need a distinct
information profile to make a judicious decision.
Adapting to technology trends depends to a large extent on watching technology
trends and on predicting technology trends. If a corporate manager wants to make a
decision on a given trend, what does he/she need to know about it? It is recognized that
several features must be analyzed and/or quantified in order to provide support for this
kind of decisions:
• What are the stakes of this trend for the organization?
• What are the intrinsic technical merits of this trend?
• What are the adoption costs of this trend?
• What are the adoption risks of this trend?

7
• What are the adoption benefits of this trend?
• How long is the trend expected to have an impact?
• What is the optimal time to make an adoption decision?
1.6 Affecting Software Engineering Trends
In this aspect of the project, there is an interest in analyzing to what extent it is possible
to affect/control technology trends. It is not sufficient to have an impact on a trend. It is
more important that the impact can be premeditated and preplanned.
Detailing the general goals discussed above, the following questions have been
derived:
• Is it possible to affect technology trends?
• Who can affect technology trends?
• How can technology trends be affected?
• How to quantify the impact?
1.7 Conclusion
Software engineering trends were briefly discussed in this chapter. The following is what
need to be done in this tentative effort.
• First, try to formulate the problem of technology watch in terms of a hierarchy of
increasingly specific questions. This hierarchy of questions serves two purposes:
first to focus the effort on specific issues that need to be addressed; second to lend
some structure to this inherently complex problem.

8
• Second, show how a systematic combination of empirical, experimental, and
analytical approaches can give the researchers means to gain some understanding
of the problem. Analytical approaches, mostly inspired from earlier work, will be
used to derive candidate models for the complex evolution of software
engineering- trends; empirical approaches will be used to derive evolutionary
models, or model aspects, without emphasis on analytical explanation of the
models; and experimental approaches will be used to collect the necessary data to
fill in the parameters of the candidate models and to test them for adequacy.

CHAPTER 2
FOCUS ON A FAMILY OF TRENDS: PROGRAMMING LANGUAGES
2.1 Introduction
At the early stage of the software engineering trends project, it is a good practice to
concentrate on one particular field first. For example, what is the evolution process of
operating system, computer networking, or database? This dissertation will focus on a
family of software engineering trends: programming language trends.
Why programming languages should be selected as the first sample set for
software engineering trends project? The followings are the reasons:
• First, it is well known that computer software consists of computer programs and
associated documentation. Computer software is created in one or more
programming languages and programming languages go hand-in-hand with
software engineering.
• Second, it is also very important that programming language is a fundamental
aspect of general-purpose computing, in contrast with e.g., networks, operating
systems, and databases.
• Third, the development of programming language in fact influenced the
development of software engineering. By reviewing the history of programming
language, a somewhat clearer view on software engineering could emerge.
• Fourth, hundreds of programming languages were created in the past, some of
them were very successful, and some of them failed although a lot of resources
were spent on them.
9

10
For the above reasons, it is clear that there is a good set and a rich history of
programming languages that are well worth discussing. So, programming languages will
be used as a good sample set for this research project.
2.2 History of Programming Languages
The original computer programming languages were the so-called machine languages.
The human beings and the computers use the same language for programming. Machine
language is great for computers but not so great for humans since the instructions are
very simple and so many instructions are required. When programmers do programming,
they have to spend a lot of time and energy to understand the machine language that is
not very understandable for human beings. Machine language is also called First
Generation Programming Language.
Second Generation Programming Languages were called assembly language. It's
not easy for human beings to understand machine language, so researchers want to find
other ways around for programmers. Assembly language turns the sequences of Os and is
into human words like 'add' that is much easier to understand by programmers. Assembly
language could always be translated back into machine code by programs called
assemblers.
Third Generation Programming Languages, which were also called High-Level
Languages (HLL), were introduced for ease of programmability by humans. FORTRAN
(FORmula TRANslator) was the first high-level language, which was developed in 1957
by a team led by Backus at IBM. [32] FORTRAN programs were translated or compiled
into machine language to be executed. They didn't run as fast as hand-coded machine

11
language programs, but FORTRAN nonetheless caught on very quickly because
FORTRAN programmers were much more productive. There are many High-Level
programming languages right now. C, C++, and Java are all Third Generation
Programming Languages.
Fourth Generation Programming Languages (4GL) are programming languages
closer to human languages than typical high-level programming languages. Most 4GLs
are used to access databases. SQL is a Fourth Generation Programming Language. For
example, a typical 4GL command is: FIND ALL RECORDS WHERE NAME IS
"SMITH". As you see here, it is just the same as human language. So, 4GL is very easy
to learn and programmer can have a better performance by using it.
Since most of existing programming languages are Third Generation
Programming Languages, and they are also the most popular ones, only the Third
Generation Programming Languages will be discussed in this dissertation. To avoid bias
in some special fields, only the general-purpose programming languages will be
discussed. Figure 2.1 shows the brief history of general-purpose High-Level
Programming Languages (HLPL).

Figure 2.1 History of high level programming languages.
12

13
2.3 Programming Language Trends
Because programming language trends are part of software engineering trends, similar
methods will be used to analyze them. This dissertation will concentrate on how to watch,
predict, adapt to, and affect programming language trends.
The methods of how to watch, predict, adapt to, and affect software engineering
trends have been discussed in chapter one. The historical trends of programming
language will be discussed in the similar way. After having better understanding on the
past trends, the author will concentrate on how to predict programming language trends.
Empirical method will be used in this project.
To research the programming language trends, the following questions should be
answered:
• Is it possible to predict if a programming language will succeed or fail?
• How to define success or failure?
• What are the possible factors that can affect the trend?
• What information should be collected in order to determine if a programming
language succeed or fail?
• What are the factors that determine the successlfailure?
• How to quantify the factors and find a modellfunction to predict the trends?
• How early can such factors be assessed?
• How early can the successlfailure be predicted?
In this dissertation, all of these questions will be discussed. The answers of all
these questions will form an outline for the whole programming language trends.

14
2.4 Research Methods
In this dissertation, the author will concentrate on how to watch, predict, adapt to, and
affect programming language trends. From the evolution of software technology, the
author think this evolution is affected by a dizzying array of factors, which are
themselves driven by a wide range of sources. Monitoring programming language trends
is not as untraceable as it may sound, that it does not have to be an ad-hoc, erratic
process.
The following are the research methods:
• Find out the possible factors that maybe affect programming language trends
• Quantify those factors
• Analyze the history of programming languages
• Build statistical model(s) to watch evolution of programming languages
• Predict the future trends of programming languages
• Validate the statistical model(s)
Although it is impossible to find out "exact accurate" models for programming
language trends, these models are useful and can be used to describe the history of
programming languages. By extending the historical models, it could also be used to
predict the future evolution of programming languages.
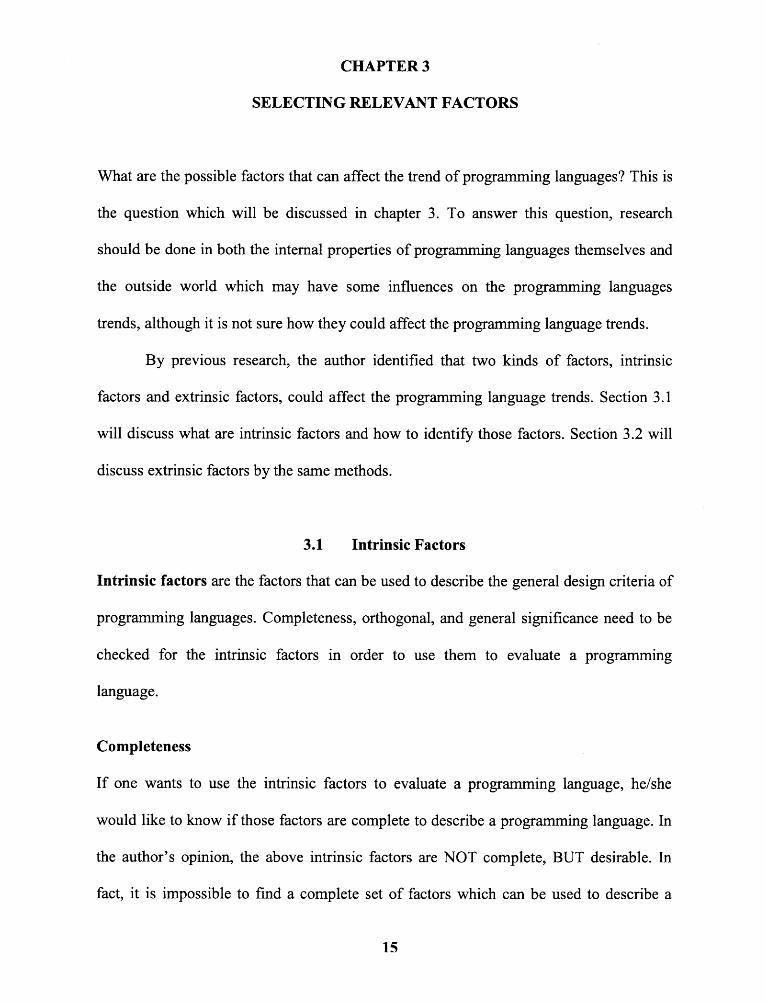
CHAPTER 3
SELECTING RELEVANT FACTORS
What are the possible factors that can affect the trend of programming languages? This is
the question which will be discussed in chapter 3. To answer this question, research
should be done in both the internal properties of programming languages themselves and
the outside world which may have some influences on the programming languages
trends, although it is not sure how they could affect the programming language trends.
By previous research, the author identified that two kinds of factors, intrinsic
factors and extrinsic factors, could affect the programming language trends. Section 3.1
will discuss what are intrinsic factors and how to identify those factors. Section 3.2 will
discuss extrinsic factors by the same methods.
3.1 Intrinsic Factors
Intrinsic factors are the factors that can be used to describe the general design criteria of
programming languages. Completeness, orthogonal, and general significance need to be
checked for the intrinsic factors in order to use them to evaluate a programming
language.
Completeness
If one wants to use the intrinsic factors to evaluate a programming language, helshe
would like to know if those factors are complete to describe a programming language. In
the author's opinion, the above intrinsic factors are NOT complete, BUT desirable. In
fact, it is impossible to find a complete set of factors which can be used to describe a
15
16
programming language because there will always be new features as the development of
a programming language. Just like what has been described in "Extensibility", which is
one of the intrinsic factors. A programming language needs to be extended in the future.
Someone may will ask this question: " How can you use these factors to evaluate a
programming language if they are not complete?" The answer is: "Although the set is not
complete, it could still be used." Why? Because these factors are widely considered
desirable for most of the general-purpose programming languages and they are all
important concern. The purpose of this project is to find out a useful framework which
can be used to evaluate a programming language. These factors are definitely useful for
this purpose.
Orthogonality
Another concern is about Orthogonality of these factors. Internal features of a
programming language should not be mixed. In this chapter, a detailed definition has
been given to each intrinsic factor. From the definition, it is clear that each factor is
concentrating on one particular part of a programming language. Different factors are
dealing with different aspects. Of course, nobody can guarantee that these factors are
totally independent. Factor analysis will be used to solve this dependency.
General Significance
For all of these intrinsic factors, they should have general significance for every
programming language. Basically, it should be fair for every programming language and
no factors are "designed" for a specific language.

17
Because intrinsic factors are the factors that are used to describe the general
design criteria of programming languages, they are constants for each programming
language and will not change during the time. The following eleven factors have been
identified as intrinsic factors of programming languages.
3.1.1 Generality
A programming language achieves generality by avoiding special cases in the availability
or use of constructs and by combining closely related constructs into a single, more
general one. ([11] pp. 52-53)
A language shall also provide generality to the extent necessary to satisfy the
needs of embedded computer applications. Such applications involve real-time control,
self-diagnostics, input-output to nonstandard peripheral devices, parallel processing,
numeric computation, and file processing. [12]
Examples:
1) Pascal has procedure declarations and procedure value parameters, but no
procedure variables. Thus the notion of procedure in Pascal lacks generality. This
restriction is not in Modula-2, but remains in Ada where there are no procedure
parameters. [13][14][15][18]
2) Pascal has no variable-length arrays, so arrays lack generality. C and Ada do
have variable-length arrays, and Modula-2 and FORTRAN have the ability to pass
variable-length array parameters, but cannot define variable-length array types.
[13][14][18]

18
3) In Pascal and Modula-2 the equality operator "=" can be applied only to
scalars, pointers, and sets, but not to arrays or records. Thus the "=" operator lacks
generality. A similar restriction applies to C. Ada doesn't have this kind of restriction.
[13][14][15][18]
4) In FORTRAN, there is only one parameter passing mechanism, pass by
reference. Algo168, on the other hand, has only one parameter passing mechanism-pass
by value- but achieves generality by allowing a pointer to any object to be passed by a
value. FORTRAN has no such facility. [13][14][15][18]
5) In FORTRAN, named constants do not exist. In Pascal constants may not be
expressions, while in Modula-2, constant expressions may not include function calls.
Ada, however, has a completely general constant declaration facility. [13][14][15][18]
3.1.2 Orthogonality
Orthogonality in a programming language means that language constructs can be
combined in any meaningful way and that the interaction of constructs, or the context of
use, should not cause unexpected restrictions or behaviors. ([11] pp.53-54) [12]
Examples:
1) In PASCAL, functions can return only scalar or pointer types as values. In C,
values of all data types except array types can be returned from a function (indeed arrays
are treated in C differently from all other types). Ada doesn't have this limitation.
[13][14]
2) In PASCAL, file types have a special status and thus cause a number of
nonorthogonalities. For example, files cannot be passed by value to procedures, and

19
assignment to file variables is prohibited. In many other languages files are part of a
(system dependent) library instead of the language definition, thus avoiding such
nonorthogonalities. [13] [14] [15]
3) In Modulate, strings can be assigned to string variables of greater length, but
not vice versa; this is the only case in Modulate where assignment works for unequal-size
objects.
4) In C, there is a nonorthogonality in parameter passing: C passes all parameters
by value except array, which is passed by reference. [13]
3.1.3 Reliability
A language should be designed to avoid error prone features and to maximize automatic
detection of programming errors. A language should aid the design and development of
reliable programs. A language should also require some redundant, but not duplicative,
specifications in programs. Translators should produce explanatory diagnostic and
warning messages, but should not attempt to correct programming errors.
Examples:
1) Ada requires separate specifications for all modules other than stand-alone
subprograms.
2) C and C++ contain many well-known traps (= vs. ==, & vs. &&, premature
semicolon in control structures, fall-through behavior in switch statements when "break"
is omitted); some were removed or made less likely in Java but others were not.
3) C permits separate specifications (through prototypes) but optional; function
names are globally accessible by default and can be incorrectly redefined. C++ supports

20
separate specifications and has a slightly tighter type system than C. Also, good use of
C++'s object-oriented features should increase the likelihood of compile-time detection of
some kinds of errors. Java automatically generates specifications (as opposed to using
redundant specifications).
4) C and C++ do little checking at run-time. Both Ada and Java perform a number
of run-time checks (e.g. bounds checking and checks for null values) to detect errors
early. [13][14][15][18]
3.1.4 Maintainability
A language should emphasize program readability (i.e., clarity, understandability, and
modifiability of programs). A language should promote ease of program maintenance.
The language should encourage user documentation of programs. It shall require explicit
specification of programmer decisions and shall provide defaults only for instances where
the default is stated in the language definition, is always meaningful, reflects the most
frequent usage in programs, and may be explicitly overridden. [12] [11](p.52)
Examples:
1) Ada was originally designed with readability in mind. C was not, and can
easily be abused to make impenetrable code.
2) C (and hence C++ and Java) includes a great deal of terse notation which
reduces readability (e.g. the "for" loop notation, using "&&" instead of "and", and
3) C++'s object-oriented features, if used, are likely to improve maintainability
(because they force interfaces to be defined and used). Java's document comments (ll*)

21
and standard documentation conventions aid in readability. Note that "readability" of a
programming language is extremely subjective - well-structured programs can be read
and maintained in any language by someone who knows the language, and no language
can prevent all poor approaches. At issue in this requirement is how strongly the
language encourages readable and maintainable code. [13][14][15][18]
3.1.5 Efficiency
Features should be chosen to have a simple and efficient implementation in many object
machines, to avoid execution costs for available generality where it is not needed, to
maximize the number of safe optimizations available to translators, and to ensure that
unused and constant portions of programs will not add to execution costs. Constructs that
have unexpectedly expensive implementations should be easily recognizable by
translators and by users. Execution time support packages of the language shall not be
included in object code unless they are called. A language design should aid the
production of efficient programs.
Examples:
1) Ada functions returning unbounded size objects usually have hidden extra
efficiency costs (access types can be used where this is important).
2) C++ implicit conversion operations may be activated in situations not easily
recognizable by its users. ClC++ pointer arithmetic and aliasing prohibit some
optimizations.
3) Java's garbage collection raises questions about efficiency and guaranteed
timing, especially in real-time systems. [13][14][15][18]

22
3.1.6 Simplicity
A language should not contain unnecessary complexity. A language should have a
consistent semantic structure that minimizes the number of underlying concepts. A
language should be as small as possible consistent with the needs of the intended
applications. A language should have few special cases and should be composed from
features that are individually simple in their semantics. A language should have uniform
syntactic conventions and should not provide several notations for the same concept. No
arbitrary restriction should be imposed on a language feature. [11] (p. 55) [12]
Examples:
1) Ada includes both Ada 83's discriminated records and the newer (00) tagged
types (these have many similarities).
2) C is a very simple language (though not necessarily simple to use). C++ has C
operations and its own operations (newldelete vs. malloclfree, cout vs. print).
[13][14][15][18]
3.1.7 Machine Independence
A language should not dictate the characteristics of object machines or operating systems
except to the extent that such characteristics are implied by the semantics of control
structures and built-in operations. A language should attempt to avoid features whose
semantics depend on characteristics of the object machine or of the object machine
operating system. Nevertheless, there shall be a facility for defining those portions of
programs that are dependent on the object machine configuration and for conditionally

23
compiling programs depending on the actual configuration. The design of a language
should strive for machine independence. [12] [M(:, 56)
Examples:
1) Ada includes a number of mechanisms to query the underlying configuration
(such as bit ordering conventions) and ClC++ include some querying mechanisms.
2) Conditional compilation in Ada and Java is handled through "if (constant)"
statements (this does not permit conditional compilation in cases where "if' statements
are not permitted).
3) Java has few mechanisms for querying the underlying configuration and
imposes requirements on bit length and semantics of numeric types that must be
supported. Java strives for machine independence by hiding the underlying machine.
[13][14][15][18]
3.1.8 Implementability
A language should be composed from features that are understood and can be
implemented. The semantics of each feature should be sufficiently well specified and
understandable that it will be possible to predict its interaction with other features. To the
extent that it does not interfere with other requirements, the language should facilitate the
production of translators that are easy to implement and are efficient during translation.
There should be no language restrictions that are not enforceable by translators. [12]
[11](p.51)

24
3.1.9 Extensibility
This principle advocates that there should be some general mechanism for the user to add
features to a language. C++ added object-oriented feature to C which shows that C has a
good extensibility. It is also relatively easy to add new structures and third-party libraries
for C++. JAVA also has good extensibility by including useful library in its language
3.1.10 Expressiveness
Expressiveness is the ease with which a language can express complex processes and
structures. It could be measured by the lines of code (LOC) per function unit. Table 3.1
[86] shows the average LOC per function unit for different generations of programming
languages. It is clear that 3 rd and 4th generation languages are more expressive than 1 st
and 2nd generation languages.
Table 3.1 Lines of Code per Function Unit
One of the original advances in expressiveness was the addition of recursion to
programming languages. LISP is expressive in both data and program. Expressiveness
25
can conflict with simplicity: LISP, Prolog, and A1go168 are extremely expressive that are
not simple.
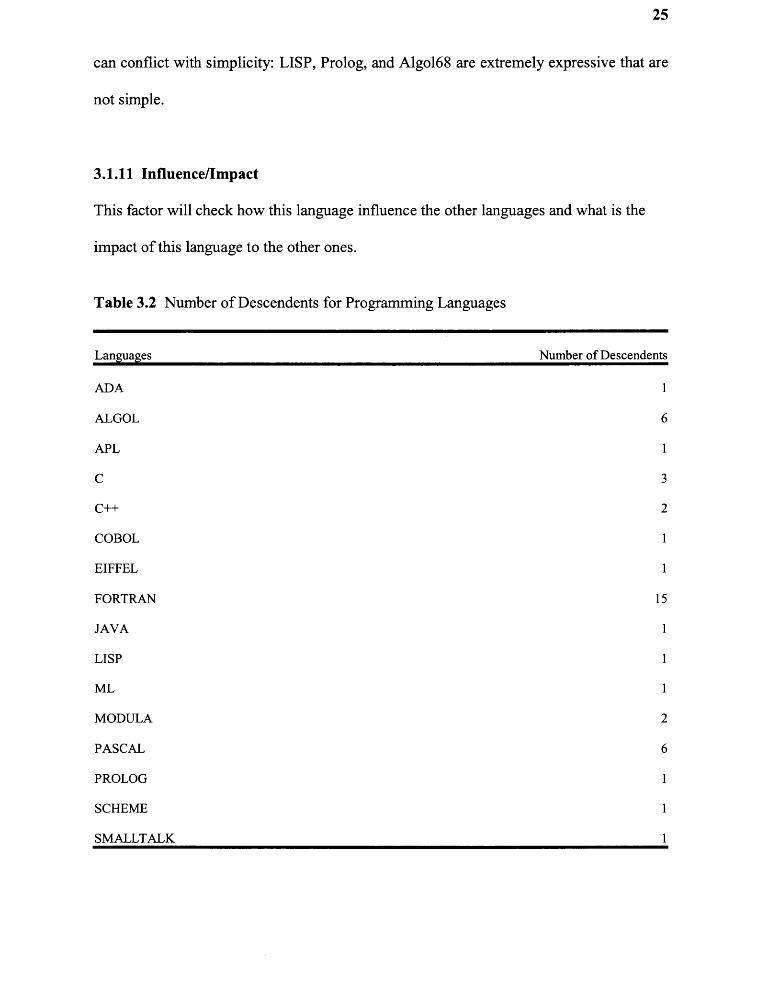
3.1.11 Influence/Impact
This factor will check how this language influence the other languages and what is the
impact of this language to the other ones.
Table 3.2 Number of Descendents for Programming Languages

26
Basically, the author will check how many dialects a programming language has;
how many descendents a programming language has; how many languages are directly
influenced by a programming language, etc. Table 3.2 shows the number of descendents
for some programming languages.
3.2 Extrinsic Factors
From the previous section, it shows that intrinsic factors are the attributes of a
programming language itself. After identifying a set of intrinsic factors, the following
questions need to be asked:
1) Are intrinsic factors enough to determine the future of a programming
language?
2) Are there any other factors that can also affect the trend of a programming
language?
3) If the answer is "Yes" for 2), what should the other factors be?
The recent evolution of programming language is a prime example of this
evasiveness, because this evolution is affected by a dizzying array of factors, which are
themselves driven by a wide range of sources, such as market forces, corporations,
government agencies, standards bodies, universities, etc. In the author's point of view,
the outside world will also have big impact on the trend of each programming language.
So, what could be the possible outside factors in the world that could affect the
trends of programming languages? The rest of the chapter three will discuss this question.

27
Extrinsic factors are the factors that are not directly related to the general
attributes of a programming language, but still can affect the trend of programming
language. The author's purpose is to find out as many as possible factors from "outside
world" which may affect the trend of a programming language. Right now, the extrinsic
factors have been classified into the following seven categories: Institutional Support,
Industrial Support, Governmental Support, Organizational Support, Grassroots Support,
and Technology Support. Each category includes several questions.
3.2.1 Institutional Support
• Is this language introduced and supported by any institution? (Genesis of this
language)
• How many institutions use this language as the support for introductory
programming courses?
• How many students have used this language for their introductory
programming courses?
• How many institutions use this language as the support for any courses?
• How many students have used this language for any of their courses?
• How many research projects use this language as support?
• How many research projects deal with this language as subject?

28
3.2.2 Industrial Support
• Is this language introduced and supported by any Company?
• Are there any industrial standards for this language (defined by standards
bodies)?
• How many companies use this language as primary language to develop
products?
• How many developers consider this language as their primary language?
• How many companies use this language as support for any of their products?
• How many developers know about this language?
• How many commercial applications are developed by using this language?
3.2.3 Governmental Support
• Is this language introduced and supported by any governmentlagency?
• Are there any government standards for this language?
• How much has the government invested in this language?
• How much code is written for government in this language?
3.2.4 Organizational Support
• Is this language introduced and supported by any (international) organization?
• Are there any organizational standards?
• How many conferences are held for this programming language?

29
• How many conference paperslarticles are published on this programming
language?
• How many conference papers/articles are published by using this
programming language as support?
3.2.5 Grassroots Support
• How many people know this Language?
• How many people consider this Language as their primary programming
Language?
• How much code is written in this Language?
• How many user groups are dedicated to this language?
3.2.6 Technology Support
• How many compilerslInterpreters are available for this language?
• How many debuggers are available for this language?
• How many IDEslCASE tools available for this language?
• How many libraries (including third-party libraries) are available for this
language?
• How many operating systems support this language?
In the author's point of view, both intrinsic factors and extrinsic factors could
impact on the evolution of programming languages. Identifying these factors is the first
step for this empirical study.

CHAPTER 4
QUANTIFYING RELEVANT FACTORS
As discussed before, empirical method will be used in this dissertation to analyze the
data. So, after selecting a set of factors, a new question comes up: How to quantify these
factors?
In this chapter, the question above will be divided into two questions: How to
quantify intrinsic factors and how to quantify extrinsic factors?
4.1 Quantifying Intrinsic Factors
All of the intrinsic factors should be considered when one designs a programming
language. So, all features of a programming language should be checked to see if it
matches these factors. In this section, the author will check each intrinsic factor and
discuss how to quantify it.
Table 4.1 shows how to quantify "generality". Table 4.1 shows that the following
sub-factors could be examined in order to give a score to "generality" because each of the
following sub-factors shows some kind of "generality". They will be sorted from weakest
to strongest and assign a score for each of these sub-factors. For example, abstract data
template (ADT), which represents high-level generality, should be checked in order to
measure generality of a programming language.
For other intrinsic factors, the similar methods will be used to quantify them.
Please check Table 4.2 to Table 4.11 for details.
30

Table 4.1 Features Used to Quantify Generality
31
Table 4.2 Features Used to Quantify Orthogonality

Table 4.3 Features Used to Quantify Reliability
32
Table 4.4 Features Used to Quantify Maintainability
Table 4.5 Features Used to Quantify Efficiency

Table 4.6 Features Used to Quantify Simplicity
33

Table 4.10 Features Used to Quantify Expressiveness
34
How many dialects for this programming language?
How many descendents for this programming language?
How many languages are directly influenced by this programming language?
4.2 Quantifying Extrinsic Factors
Extrinsic factors are not like intrinsic factors. Basically, they are questions for different
fields. Most of the questions are asking for the numbers, so the numbers can be directly
used as the value of this extrinsic factor. No specific method needed for quantifying
extrinsic factors.
Although extrinsic factors don't need quantification, how to get the answers of
these factors is still a big problem. Chapter five will discuss how to collect data for both
intrinsic and extrinsic factors.

CHAPTER 5
DATA COLLECTION
5.1 Language List
To watch and predict the trends of programming languages, a set of programming
languages should be selected as samples. By analyzing this set of programming
languages, statistics models will be constructed to describe the past trends of
programming languages. By extending the statistics models, they will also be used to
predict the future trend of a programming language.
In this chapter, the following programming languages will be investigated:
After reviewing the brief
history and language features of each programming language, how to collect data for
intrinsic factors and extrinsic factors will be discussed. [67]
5.2 Watching Programming Languages
5.2.1 ADA
The Ada language is the result of the most extensive and most expensive language design
effort ever undertaken. Up until 1974 half of the applications at The Department of
Defense (DoD) were embedded systems. An embedded system is one where the
computer hardware is embedded in the device it controls. More than 450 programming
languages were used to implement different DoD projects, and none of them were
standardized. Because of this, software was rarely reused. For these reasons, the Army,
35

36
Navy, and Air Force proposed to develop a high-level language for embedded systems.
[67]
By 1977, a complete language design specification for Ada was created. In April
1977, four proposing contractors were chosen to produce Phase I of the language design.
In February 1977, Phase I of the language design was complete. Following this was a
two-month evaluation period where 400 volunteers in 80 teams chose two out of the four
as being the best language designs. These two companies were then given the go ahead to
produce Phase II of the project. At the end of Phase II, another two-month evaluation
period took place. In May of 1979 the Cii HoneywelllBull (the only foreign contractor)
language design was chosen as the winner. Phase III of the project began after the winner
was selected. After a winner was selected, the language design was published by the
ACM. In November 1979, over 500 language reports were received from 15 different
countries. Most of the reports suggested minor changes in the design, none real drastic.
Based on these suggestions, a revised language design was published in February of
1980. After some minor changes to this document over the next few years, the final
official version of the language was settled upon. The Ada language was then frozen for
the next five years.
Ada has the following significant language features:
• Packages: Data types, data objects, and procedure specifications can be
encapsulated into a package. This supports the program design of data
abstraction.
• Exception Handling: Ada has very good exception handling capabilities which
allow the program to handle its own run-time errors.

37
• Generic Program Units: It is possible to write a procedure (for example, a
sorting procedure) which does not require a data type to be specified.
• Parallel / Concurrent Processing: Ada supports parallel and concurrent
execution of tasks.
• Ada 95 Added:
o Support for object-oriented programming
o More flexible libraries
o Better control mechanisms for shared data
5.2.2 ALGOL
ALGOL (ALGOrithmic Language) is one of several high level languages designed
specifically for programming scientific computations. It started out in the late 1950's, first
formalized in a report titled ALGOL 58, and then progressed through reports ALGOL 60,
and ALGOL 68. It was designed by an international committee to be a universal
language. Their original conference, which took place in Zurich, was one of the first
formal attempts to address the issue of software portability. ALGOL's machine
independence permitted the designers to be more creative, but it made implementation
much more difficult. Although ALGOL never reached the level of commercial popularity
of FORTRAN and COBOL, it is considered the most important language of its era in
terms of its influence on later language development. ALGOL's lexical and syntactic
structures became so popular that virtually all languages designed since have been
referred to as "ALGOL - like"; that is they have been hierarchical in structure with
nesting of both environments and control structures. [67]

38
ALGOL was the first second-generation programming language and its
characteristics are typical of the entire generation. First consider the data structures,
which are very close to first generation structures. In ALGOL 60 the block structure was
introduced: the ability to create blocks of statements for the scope of variables and the
extent of influence of control statements. Along with that, two different means of passing
parameters to subprograms; call by value and call by name. Structured control
statements: if - then - else and the use of a general condition for iteration control were
also features, as was the concept of recursion: the ability of a procedure to call itself.
One of the greatest impacts ALGOL 60 had was a result of its description as
found in Naur (1963). A major contribution of this report was the introduction of BNF
notation for defining the syntax of the language. Overall, ALGOL is considered to be
perhaps the most orthogonal programming language, meaning it has a relatively small
number of basic constructs and a set of rules for combining those constructs. Every
construct has a type associated with it and there are no restrictions on those types. In
addition, most constructs produce values. Several of ALGOL's other characteristics are
listed below:
• Dynamic Arrays: one for which the subscript range is specified by variables
so that the size of the array is set at the time storage is allocated.
• Reserved Words: the symbols used for keywords are not allowed to be used as
identifiers by the programmer.
• User defined data types: allow the user to design data abstractions that fit
particular problems very closely.

39
ALGOL was used mostly by research computer scientists in the United States and
in Europe. Its use in commercial applications was hindered by the absence of standard
inputloutput facilities in its description and the lack of interest in the language by large
computer vendors. ALGOL 60 did however become the standard for the publication of
algorithms and had a profound effect on future language development.
5.2.3 APL
APL stands for "A Programming Language." Ken Iverson and his colleagues at IBM
created it in the 1960's. [67]
Mathematically inspired, APL's main purpose was to serve as a powerful
executable notation for mathematical algorithms. What APL is best known for is its use
of non-ASCII symbols, including some Greek letters, and the scale of its operation. It is a
dynamically typed interactive, array-oriented language with a dynamic scope. In APL, all
expressions are evaluated from right to left.
APL has the following significant language features:
• Non-Standard Character Set: APL makes use of a character set which contains
some non-ASCII characters, including some Greek letters.
• Dynamic Array Universe: APL's environment consists of arrays, created
dynamically.
• Interaction: APL is an interactive language.

40
5.2.4 BASIC
BASIC (standing for Beginner's All Purpose Symbolic Instruction Code) is a system
developed at Dartmouth College in 1964 under the directory of J. Kemeney and T. Kurtz.
It was implemented for the G.E.225. It was meant to be a very simple language to learn
and also one that would be easy to translate. Furthermore, the designers wished it to be a
stepping-stone for students to learn the more powerful languages such as FORTRAN or
ALGOL. [67]
Different BASIC versions were originated from Gordon Eubanks (The CEO and
president of Symantec) who, in 1970, developed BASIC-E. BASIC-E used a technique
similar to the one currently used by Java; instructions were transformed into a kind of
intermediate code and then converted into machine readable code. Eubanks also did not
protect BASIC-E but he did with his following version, CBASIC. CBASIC was marketed
by his company, Compiler Systems (which in 1981 was acquired by Digital Research).
BASIC versions were so rapidly appearing that ANSI (American National Standard
Institute) recognized in 1974 the need for a standard implementation of the BASIC
language. A committee started working on two standard one called minimal BASIC and
the other Standard BASIC. Standardization was completed long after the use of BASIC
had spread worldwide, and Standard BASIC never appeared. ANSI issued two
specifications: one for Minimal Basic in 1978 (specification X3.60-1978) and the other in
1987 for the Standard BASIC (specification X3.113-1987). These standards were also
issued by the ISO (ISO 6373-1984 for the Minimal BASIC and ISO 10279-1991 for the
Full BASIC).

41
Since the early-1980s the history of BASIC and computing followed a tightly-
bound and parallel course. IBM on the PC released an interpreted BASIC on ROM which
could be enhanced by loading an additional extension known as BASICA. Essentially
BASICA, which was on every PC-DOS distribution diskettes set, and its MS-DOS
analog, the Gee-Witz (or GW) BASIC, dominated the market in the PC market. In 1984
Microsoft released the BASIC compiler (known as BASCOM from the .exe file) which
again permitted compiled BASIC. This was a new breakpoint in BASIC's history. From
that time on new powerful versions of BASIC appeared on the market every few months.
Microsoft Quick BASIC launched in 1985 as version 1.0, reached version 4.5 in
1988. In the meanwhile BASIC changed a lot, acquiring structured syntax, sub-functions,
user defined data, multi-file programs and, in 1990 with the Microsoft BASIC
Professional Development System 7.1, gained even full access to the memory outside
64K. Again the operating system for computers drove the direction of BASIC when the
Windows platform was introduced. This resulted in the development of Visual BASIC
which was designed for GUI applications. Visual BASIC claims also to be an object-
oriented language although many programmers do not completely agree on this. They
mean Visual Basic is only object based.
5.2.5 C
Dennis Ritchie developed C at Bell Laboratories in 1972. Many of its principles and
ideas were taken from the earlier language B and B's earlier ancestors BCPL and CPL.
CPL (Combined Programming Language) was developed with the purpose of creating a
language that was capable of both high level, machine independent programming and

42
would still allow the programmer to control the behavior of individual bits of
information. The one major drawback of CPL was that it was too large for use in many
applications. In 1967, BCPL (Basic CPL) was created as a scaled down version of CPL
while still retaining its basic features. In 1970, Ken Thompson, while working at Bell
Labs, took this process further by developing the B language. B was a scaled down
version of BCPL written specifically for use in systems programming. Finally in 1972, a
co-worker of Ken Thompson, Dennis Ritchie, returned some of the generality found in
BCPL to the B language in the process of developing the language that is known as C
right now. [67]
C's power and flexibility soon became apparent. Because of this, the Unix
operating system which was originally written in assembly language, was almost
immediately re-written in C (only the assembly language code needed to "bootstrap" the
C code was kept). During the rest of the 1970's, C spread throughout many colleges and
universities because of it's close ties to Unix and the availability of C compilers. Soon,
many different organizations began using their own versions of C causing compatibility
problems. In response to this in 1983, the American National Standards Institute (ANSI)
formed a committee to establish a standard definition of C which became known as ANSI
Standard C. Today C is in widespread use with a rich standard library of functions.
C is a powerful, flexible language that provides fast program execution and
imposes few constraints on the programmer. It allows low level access to information and
commands while still retaining the portability and syntax of a high level language. These
qualities make it a useful language for both systems programming and general-purpose
programs.

43
C's power and fast program execution come from it's ability to access low level
commands, similar to assembly language, but with high level syntax. It's flexibility
comes from the many ways the programmer has to accomplish the same tasks. C includes
bitwise operators along with powerful pointer manipulation capabilities. C imposes few
constraints on the programmer. The main area this shows up is in C's lack of type
checking. This can be a powerful advantage to an experienced programmer but a
dangerous disadvantage to a novice.
Another strong point of C is its use of modularity. Sections of code can be stored
in libraries for re-use in future programs. This concept of modularity also helps with C's
portability and execution speed. The core C language leaves out many features included
in the core of other languages. These functions are instead stored in the C Standard
Library where they can be called on when needed.. An example of this concept would be
C's lack of built in Il0 capabilities. 110 functions tend to slow down program execution
and also be machine independent when running optimally. For these reasons, they are
stored in a library separately from the C language and only included when necessary.
5.2.6 C++
The C++ programming language is an extension of C that was developed by Bjarne
Stroustrup in the early 1980s at Bell Laboratories. C++ provides a number of features that
"spruce up" the C language, but more importantly, it provides capabilities for object-
oriented programming. [67]

44
Object-oriented programs are easier to understand, correct and modify. Many
other object-oriented languages have been developed, including most notably, Smalitalk.
The best features of C++ are:
• C++ is a hybrid language-it is possible to program in either a C-like style, an
object-oriented style, or both.
• C++ programs consist of pieces called classes and functions. You can program
each piece you may need to form a C++ program. The advantage of creating your
own functions and classes is that you will know exactly how they work. You will
be able to examine the C++ code.
C++ provides a collection of predefined classes, along with the capability of user-
defined classes. The classes of C++ are data types, which can be instantiated any number
of times. Class definitions specify data objects (called data members) and functions
(called member function). Classes can name one or more parent classes, providing
inheritance and multiple inheritances, respectively.
5.2.7 COBOL
COBOL (Common Business Oriented Language) was one of the earliest high-level
programming languages. It was developed in 1959 by a group of computer professionals
called the Conference on Data Systems Languages (CODASYL). Since 1959 it has
undergone several modifications and improvements. In an attempt to overcome the
problem of incompatibility between different versions of COBOL, the American National
Standards Institute (ANSI) developed a standard form of the language in 1968. This

45
version was known as American National Standard (ANS) COBOL. In 1974, ANSI
published a revised version of (ANS) COBOL, containing a number of features that were
not in the 1968 version. In 1985, ANSI published still another revised version that had
new features not in the 1974 standard. The language continues to evolve today. Object-
oriented COBOL is a subset of COBOL 97, which is the fourth edition in the continuing
evolution of ANSUISO standard COBOL. COBOL 97 includes conventional
improvements as well as object-oriented features. Like the C++ programming language,
object-oriented COBOL compilers are available even as the language moves toward
standardization. [67]
COBOL, long associated with green screens, core dumps, and traditional
mainframe connections, may at first glance seem at odds with object technology, push-
button graphical interfaces, and interactive development environments. This perceived
incongruity, however, is more a reflection of the mainframe's ability to keep pace with
the innovations of desktop and client-server computing than a flaw in the COBOL
language. The following are the significant features for COBOL:
• The language that automated business
• Allows names to be truly connotative: permits both long names (up to 30
characters) and word-connector characters (dashes)
• Every variable is defined in detail: this includes number of decimal digits and the
location of the implied decimal point
• File records are also described with great detail, as are lines to be output to a
printer - ideal for printing accounting reports
• Offers object, visual programming environments

46
• Class Libraries
• Rapid Application Capabilities
• Integration with the World Wide Web
COBOL is ideally suited for the solution of business problems. For example, if a
company wanted to keep track of its employees' annual wages, COBOL would be ideal
language for implementation. It is interesting to note that COBOL was the first
programming language whose use was mandated by the Department of Defense (DAD).
5.2.8 EIFFEL
The Eiffel programming language was created by Bertrand Meyer and developed by his
company, Interactive Software Engineering (ISE) of Goleta, CA in 1985. Eiffel has
evolved continually since its conception on September 14, 1985 and its first introduction
in 1986. Eiffel is named after Gustave Eiffel, the engineer who designed the Eiffel
Tower. The developers of Eiffel like to compare themselves to the well-built structure of
the Eiffel Tower. The Eiffel Tower was completed on time and within budget, which
should happen if you use Eiffel for your software projects. There are several significant
language features of Eiffel: [67]
• Portable: this language is available for major industry platforms, such as
Windows, OSl2, Linux, UNIX, VMS, etc...
• Open System: includes a C and C++ interface making it easily possible to
reuse code previously written.

47
• "Melting Ice Technology": combines compilation, for the generation of
efficient code, with byte-code interpretation, for fast turnaround after a
change.
• "Design by Contract": enforced through assertions such as class invariants,
preconditions and post-conditions.
• Automatic Documentation ("Short Form"): abstract yet precise documentation
produced by the environment at the click of a button.
• Multiple Inheritance: a class can inherit from as many parents as necessary.
• Repeated Inheritance: a class inherits from another through two or more
parents.
• Statically Typed: ensure that errors are caught at compile time, rather than run
time.
• Dynamically Bound: guarantees that the right version of an operation will
always be applied depending on the target object.
5.2.9 FORTRAN
One of the oldest programming languages, the FORTRAN was developed by a team of
programmers at IBM led by John Backus, and was first published in 1957. The name
FORTRAN is an acronym for FORmula TRANslation, because it was designed to allow
easy translation of math formulas into code. [67]
Often referred to as a scientific language, FORTRAN was the first high-level
language, using the first compiler ever developed. Prior to the development of
FORTRAN computer programmers were required to program in machinelassembly code,

48
which was an extremely difficult and time consuming task, not to mention the dreadful
chore of debugging the code. The objective during it's design was to create a
programming language that would be: simple to learn, suitable for a wide variety of
applications, machine independent, and would allow complex mathematical expressions
to be stated similarly to regular algebraic notation. It is still almost as efficient in
execution as assembly language. Since FORTRAN was so much easier to code,
programmers were able to write programs 500% faster than before, while execution
efficiency was only reduced by 20%, this allowed them to focus more on the problem
solving aspects of a problem, and less on coding.
FORTRAN was so innovative not only because it was the first high-level
language, but also because of it's compiler, which is credited as giving rise to the branch
of computer science now known as compiler theory. Several years after it's release
FORTRAN had developed many different dialects, (due to special tweaking by
programmers trying to make it better suit their personal needs) making it very difficult to
transfer programs from one machine to another.
These problems lead the American Standards Association (now known as the
American National Standards Association) to release it's first Standard for a
Programming Language in 1966. This first standardized version has come to be known as
FORTRAN '66 (aka.. FORTRAN IV).
Despite this standardization, a few years later, various new dialects began to
surface again, requiring the Standards Association review the language again. This
version is known as FORTRAN '77. This version was released in 1978 (it was called '77
because the Association began it's review in 1977), with several new features. Some of

49
the more notable properties were; new error handling methods, and mechanisms for
managing large-scale programs. The latest version; Fortran '90 (released in 1990, using
the new capitalization scheme) added even more new features, such as support for:
recursion, pointers, and for programmer-defined data types. Some of the more significant
features of Fortran are as listed below:
• Simple to learn: when FORTRAN was design one of the objectives was to
write a language that was easy to learn and understand.
• Machine Independent: allows for easy transportation of a program from one
machine to another.
• More natural ways to express mathematical functions: FORTRAN permits
even severely complex mathematical functions to be expressed similarly to
regular algebraic notation.
• Problem orientated language
• Remains close to and exploits the available hardware
• Efficient execution: there is only an approximate 20% decrease in efficiency
as compared to assemblylmachine code.
• Ability to control storage allocation: programmers were able to easily control
the allocation of storage (although this is considered to be a dangerous
practice today, it was quite important some time ago due to limited memory.
• More freedom in code layout: unlike assemblylmachine language, code does
not need to be laid out in rigidly defined columns, (though it still must remain
within the parameters of the FORTRAN source code form).

50
FORTRAN is useful for a wide variety of applications. Some of the more
outstanding ones are as follows:
• Number crunching: due to the more natural (like it's true algebraic form)
way of expressing complex mathematical functions and it's quick
execution time, FORTRAN is easy and efficient at processing
mathematical equations.
• Scientific, mathematical, statistical, and engineering type procedures: due
to it's rapid number-crunching ability FORTRAN is a good choice for
these type of applications.
Basically FORTRAN is most useful for applications that are "computational-
bound" rather than "IlO bound".
5.2.10 JAVA
The Java programming Language evolved from a language named Oak. Oak was
developed in the early nineties at Sun Microsystems as a platform-independent language
aimed at allowing entertainment appliances such as video game consoles and VCRs to
communicate. Oak was first slated to appear in television set-top boxes designed to
provide video-on-demand services. Just as the deals with the set-top box manufacturers
were falling through, the World Wide Web was coming to life. As Oak's developers
began to re cognize this trend, their focus shifted to the Internet and WebRunner, an Oak-
enabled browser, was born. Oak's name was changed to Java and WebRunner became
the HotJava web browser. The excitement of the Internet attracted software vendors such

51
that Java a development tools from many vendors quickly became available. That same
excitement has provided the impetus for a multitude of software developers to discover
Java and its many wonderful features. Java has the following significant features: [67]
• Platform Independence: Java compilers do not produce native object code for
a particular platform but rather 'byte code' instructions for the Java Virtual
Machine (JVM). Making Java code work on a particular platform is then
simply a matter of writing a byte code interpreter to simulate a JVM. What
this all means is that the same compiled byte code will run unmodified on any
platform that supports Java.
• Object Orientation: Java is a pure object-oriented language. This means that
everything in a Java program is an object and everything is descended from a
root object class.
• Rich Standard Library: One of Java's most attractive features is its standard
library. The Java environment includes hundreds of classes and methods in six
major functional areas.
o Language Support classes for advanced language features such as
strings, arrays, threads, and exception handling.
o Utility classes like a random number generator, date and time
functions, and container classes.
o Inputloutput classes to read and write data of many types to and from a
variety of sources.
o Networking classes to allow inter-computer communications over a
local network or the Internet.

52
o Abstract Window Toolkit for creating platform-independent GUI
applications.
o Applet is a class that lets you create Java programs that can be
downloaded and run on a client browser.
• Applet Interface: In addition to being able to create stand-alone applications,
Java developers can create programs that can be downloaded from a web page
and run on a client browser.
• Familiar C++-like Syntax: One of the factors enabling the rapid adoption of
Java is the similarity of the Java syntax to that of the popular C++
programming language.
• Garbage Collection: Java does not require programmers to explicitly free
dynamically allocated memory. This makes Java programs easier to write and
less prone to memory errors.
5.2.11 LISP
Interest in artificial intelligence first surfaced in the mid 1950. Linguistics, psychology,
and mathematics were only some areas of application for AI. Linguists were concerned
with natural language processing, while psychologists were interested in modeling human
information and retrieval. Mathematicians were more interested in automating the
theorem proving process. The common need among all of these applications was a
method to allow computers to process symbolic data in lists. [67]
IBM was one of the first companies interested in AI in the 1950s. At the same
time, the FORTRAN project was still going on. Because of the high cost associated with

53
producing the first FORTRAN compiler, they decided to include the list processing
functionality into FORTRAN. The FORTRAN List Processing Language (FLPL) was
designed and implemented as an extension to FORTRAN.
In 1958 John McCarthy took a summer position at the IBM Information Research
Department. He was hired to create a set of requirements for doing symbolic
computation. The first attempt at this was differentiation of algebraic expressions. This
initial experiment produced a list of language requirements, most notably was recursion
and conditional expressions. At the time, not even FORTRAN (the only high-level
language in existence) had these functions.
It was at the 1956 Dartmouth Summer Research Project on Artificial Intelligence
that John McCarthy first developed the basics behind Lisp. His motivation was to
develop a list processing language for Artificial Intelligence. By 1965 the primary dialect
of Lisp was created (version 1.5). By 1970 special-purpose computers known as Lisp
Machines, were designed to run Lisp programs. 1980 was the year that object-oriented
concepts were integrated into the language. By 1986, the X3J13 group formed to produce
a draft for ANSI Common Lisp standard. Finally in 1992, X3J13 group published the
American National Standard for Common Lisp. Lisp has the following significant
features:
• Atoms & Lists: Lisp uses two different types of data structures, atoms and
lists. Atoms are similar to identifiers, but can also be numeric constants. Lists
can be lists of atoms, lists, or any combination of the two
• Functional Programming Style: all computation is performed by applying
functions to arguments. Variable declarations are rarely used.

54
• Uniform Representation of Data and Code: example: the list (A B C D) . It
is a list of four elements (interpreted as data). It is also the application of the
function named A to the three parameters B, C, and D (interpreted as code)
• Reliance on Recursion: a strong reliance on recursion has allowed Lisp to be
successful in many areas, including Artificial Intelligence.
• Garbage Collection: Lisp has built-in garbage collection, so programmers do
not need to explicitly free dynamically allocated memory.
Lisp totally dominated Artificial Intelligence applications for a quarter of a
century, and is still the most widely used language for AI. In addition to its success in AI,
Lisp pioneered the process of Functional Programming. Many programming language
researchers believe that functional programming is a much better approach to software
development, than the use of Imperative Languages (Pascal, C++, etc).
Below is a short list of the areas where Lisp has been used:
• Artificial Intelligence
• Air Defense Systems
• Implementation of Real-Time, embedded Knowledge-Based Systems
• List Handling and Processing
• Tree Traversal (BreathlDepth First Search)
• Educational Purposes (Functional Style Programming)

55
5.2.12 ML
ML (standing for "Meta-Language") is a functional programming language developed in
the early 1980s at Edinburgh University. Today there are several languages in the ML
family; the most popular are SML (Standard ML) and Ocami. [67]
Standard ML of New Jersey (abbreviated SML/NJ) is a compiler for the Standard
ML '97 programming language with associated libraries, tools, and documentation.
SMLlNJ is free, open source software. Moscow ML is a light-weight implementation of
Standard ML (SML), a strict functional language widely used in teaching and research.
Version 2.00 implements the full SML language, including SML Modules, and much of
the SML Basis Library. PolylML is a full implementation of Standard ML available as
open-source.
Objective CAML, also known as Ocaml or O'Caml for short (or some other
alternative spelling), is an advanced programming language based on the ML family. To
the functional and imperative features of Standard ML, it adds object-oriented concepts.
Ocaml provides both a bytecode compiler and a native code compiler, and the
latter has been ported to a large number of platforms. The code generated by the native
compiler is typically comparable to ClC++ in speed. [67]
5.2.13 MODULA
In the mid 1970's, after the language Pascal was designed, Niklaus Wirth was
experimenting with concurrency that led to the design of Modula. Modula was never
released and its development was discontinued after its publication. Wirth then built a
language that was meant to be the single language for the new computer system called

56
Lilith. Even though the computer was never a success, his new language Modulate was
released in 1980.
Modulate was designed based on Pascal and Modula but its improvements over
Pascal included modules, low level features, coroutines, and syntactic features.
• Modules: a tool for expressing the relations between major parts of programs and
provide support for abstract data types.
• Low Level Features: small language that can be implemented on a wide variety of
microcomputers contains facilities for high level and low level programming.
• Coroutines: used for embedded systems that require concurrency without the
overhead of large operating systems or large languages.
• Syntactic Features: has a small vocabulary and consists of few sentence
structures, contains simple and consistent rules of syntax that makes it easy to
learn.
Modulate is a simple but yet a powerful language that is suitable for a wide range
of applications.
• Systems Programming
• Concurrent Programming
• Embedded Systems
• Software Engineering
• Education

57
5.2.14 PASCAL
The Pascal programming language was originally developed by Niklaus Wirth, a member
of the International Federation of Information Processing (IFIP) Working Group 2.1.
Professor Niklaus Wirth developed Pascal to provide features that were lacking in other
languages of the time. His principal objectives for Pascal were for the language to be
efficient to implement and run, allow for the development of well-structured and well-
organized programs, and to serve as a vehicle for the teaching of the important concepts
of computer programming. Pascal, which was named after the mathematician Blaise
Pascal, is a direct descendent from ALGOL 60, which Wirth helped develop. Pascal also
draws programming components from ALGOL 68 and ALGOL-W. The original
published definition for the Pascal language appeared in 1971 with latter revisions
published in 1973. It was designed to teach programming techniques and topics to college
students and was the language of choice to do so from the late 1960's to the late 1980's.
[67]
Pascal contains some significant language features that allow it to used as a
powerful learning tool in introducing structured programming techniques to students:
• Built in Data Types: Pascal contains its own built in data types of Integer, Real,
Character, and Boolean.
• User defined Data Types: Has the ability to define scalar types as well as
subranges of those data types.
• Provides a defined set of Data Structures: These data structures include Arrays,
Records, Files and Sets.

58
• Has a strong data typing element: Pascal compliers can diagnose an incompatible
assignment of one type to a variable to another type.
• Supports Structured Programming: This is accomplished through the use of
subprograms called procedures and functions.
• Simplicity and Expressiveness: Because the language is simple and expressive in
nature it allows for effective teaching of computer programming techniques.
The Prime area of application that Pascal entails is the learning environment. This
language was not really developed to be used for anything other than teaching students
the basics of programming. After all it was originally developed for this purpose. In the
early 1970's to the early 1990's Pascal was the language of choice for most major colleges
and universities for teaching college level programming techniques. Now with the
growing popularity of Object Orient Programming Pascal has taken a back seat to other
languages such as C++ and Visual Basic.
5.2.15 PROLOG
Prolog (PROgramming LOGic) rose within the realm of Artificial Intelligence (AI). It
originally became popular with AI researchers, who know more about "what" than "how"
intelligent behavior is achieved. The philosophy behind it deals with the logical and
declarative aspects. Prolog represents a fundamentally new approach to computing and
became a serious competitor to LISP. [67]
Prolog is a rich collection of data structures in the language and human reasoning,
and a powerful notation for encoding end-user applications. It has its logical and
declarative aspects, interpretive nature, compactness, and inherent modularity.

59
• Intelligent Systems: programs that perform useful tasks by utilizing artificial
intelligence techniques.
• Expert Systems: intelligent systems which reproduce decision-making at the level
of a human expert.
• Natural Language Systems: which can analyze and respond to statements made in
ordinary language as opposed to approved keywords or menu selections.
• Relational Database Systems•
Prolog is the highest level general-purpose language widely used today. It is
taught with a strong declarative emphasis on thinking of the logical relations between
objects or entities relevant to a given problem, rather than on procedural steps necessary
to solve it. The system decides the way to solve the problem, including the sequences of
instructions that the computer must go through to solve it. It is easier to say what the
programmers want done and leave it to the computer to do it. Since a major criterion in
the commercial world today is speed of performance, Prolog is an ideal prototyping
language. Its concept makes use of parallel architectures. It solves problems by searching
a knowledge base (or more correctly a database) that would be greatly improved if
several processors were made to search different parts of the database.
5.2.16 SMALLTALK
The Learning Research Group at Xerox PARC designed a language to support Alan
Kay's programming paradigm. This led to the Smalitalk-72 software. After experiments
were performed on Smalltalk-72, a sequence of languages ending in Smalltalk-80 were
developed. Smailtalk has the following significant language features: [67]
60
• Object-Oriented: Smalltalk is a language in which reusable objects exchange
messages.
• Graphical Programming Environment: First look at cutlcopylpaste in
programming language for most people.
• Versatile: Has many applications and uses.
• Graphic primitives and drawing programs: Supports quickly and easily
created graphics.
The demand for Smalitalk programmers is growing in areas where the
telecommunications industry is strong.
• Business Information System
o Chosen because of Technical merit and flexibility
o Well suited for large projects
• Embedded in an oscilloscope
• Manages the telephone system of an entire country
• Batch programs for large mainframes
5.2.17 SCHEME
Scheme started as an experiment in programming language design by challenging some
fundamental design assumptions. It emerged from MIT in the mid-1970's. It is a dialect
of the Lisp Programming Language invented by Guy Lewis Steele Jr. and Gerald Jay
Sussman. Originally called Schemer, it was shortened to Scheme because of a 6-character
limitation on file names. Scheme is a small, exceptionally clean language that is fun to

61
use. The language was designed to have very few, regular constructs which compose well
to support a variety of programming styles including functional, object-oriented, and
imperative. [67]
Scheme has lexical scoping, uniform evaluation rules, and uniform treatment of
data types. Scheme does not have the concept of a pointer, uninitialized variables,
specialized looping constructs, or explicit storage management. In Scheme, all data types
are equal. What one can do to one data type, one can do to all data types. There are seven
kinds of expressions: Constant, Variable reference, Procedure creation, Procedure
application, Conditional, Assignment, and Sequence. Scheme also has the usual
assortment of data types: Characters, Strings, Arrays, Lists, Numbers, Functions (also
called procedures), Boolean, Ports, and Symbols. Numbers are especially interesting in
that an integer is a rational and a real is a complex. Scheme requires no looping
constructs. Any function that calls itself in the "tail" position is just a loop. Scheme has
several important advantages. It is elegantly simple in that regular structure and trivial
syntax avoids "special case" confusion. Its expressiveness means that one spends little
time trying to work around the language--it lets users concentrate on what they want to
say rather than on how to say it. Its support of a variety of styles (including object-
oriented) allows users to better match their solution style to the style of the problems to
be solved. Its formal underpinnings make reasoning about programs much easier. Its
abstractive power makes it easy to separate system specific optimizations from reusable
code. Its composability makes it easy to construct systems from well-tested components.
Scheme is currently gaining favor as a first programming language in universities
and is used in industry by such companies as DEC, TI, Tektronix, HP, and Sun.

62
5.3 Data Collection
In chapter four, the methods of how to quantify intrinsic factors and extrinsic factors have
been defined. In this section, how to collect data based on these rules will be discussed.
Data collection is a hard and time-consuming job. Because there is no database
for most of the questions, they have to be answered from the very beginning. Due to
limited resources, the programming language trends group could only do random surveys
and use survey results to answer the questions. During the past year, several surveys have
been done. By doing these surveys and analyzing each programming language, a lot of
data have been collected for both intrinsic factors and extrinsic factors. To store all of
these data, a data warehouse is established in software engineering lab in New Jersey
Institute of Technology. For the details, please visit http:llwww.cs.njit.edultechwatch and
http:llswlab.nj it. edultechwatch.
By analyzing the data in this data warehouse, good understanding could be gained
in historical trends of each programming language. The whole empirical study will be
based on this data warehouse.
5.3.1 Data Collection for Intrinsic Factors
To collect data for intrinsic factors, the programming language trends research group uses
the textbook for the first version of each programming language and tries to evaluate
intrinsic factors based on these textbooks. All of these intrinsic factors have been
considered. One will try to go over all features of a programming language to check if it
matches these factors, and then give it a score. Please check table 5-1 for details.

Table 5.1 Scores of Intrinsic Factors
63

64
5.3.2 Data Collection for Extrinsic Factors
In order to collect data for extrinsic factors, the programming language trends group was
divided by factors instead of programming languages. The reason is, for each extrinsic
factor (question), each person should concentrate on one field (such as institutions,
industries, governments, etc) and collecting data for all languages in this particular field.
Surveys have been done for each field of extrinsic factors in 1993, 1998 and 2003.
Please check http:llswlab.njit.edultechwatchlsurvey.asp and see the survey for grassroots
support. The other surveys are similar to the previous one, and the only difference is that
they are in different fields.

CHAPTER 6
SURVEY RESULTS
This chapter will discuss the raw data that have been collected in the data warehouse. The
programming language trends group is very interested in the survey results they got and
would like to discuss some of the questions. To check complete survey results for all
questions, please visit the website http:llswlab.njit.edu/techwach.
6.1 Survey Results for Grassroots Support
The first question for grassroots support is: "How many people consider this Language as
their primary programming Language?"

66
Figure 6.1 How many people consider this language as primary language in 1993, 1998,and 2003.(Continued)

Figure 6.2 Trends of most popular programming languages from 1993 to 2003.

68
Another interesting question for grassroots support is: "How many people know
this Language". Figure 6.3 shows what happened in 1993, 1998, and 2003.

69
Figure 6.3 How many people know this language in 1993, 1998, and 2003.(Continued)
From the graph above, the top 5 programming languages people knew in 1993
are:
(23.68%). The top 5 programming languages people knew in 1998 are: C (75.93%),
BASIC (61.86%), PASCAL (59.32%), C++ (53.39%), FORTRAN (36.95%). The top 5
programming languages people know in 2003 are:
The following graph shows the trends of most-people-known programming
languages from 1993 to 2003.
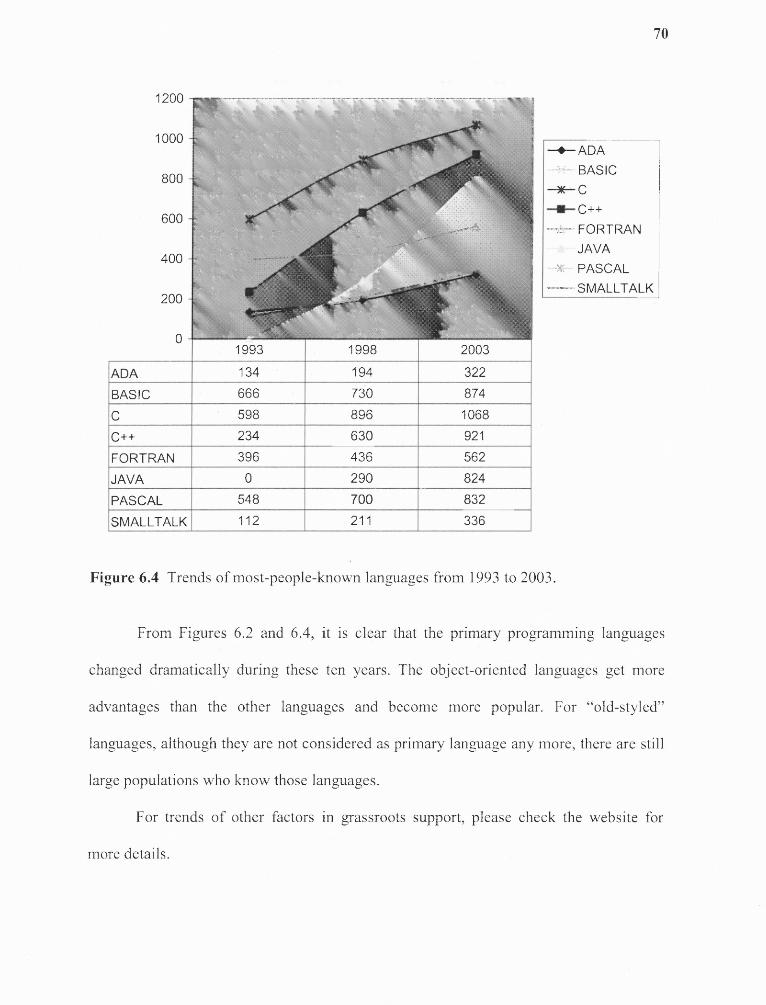
70
Figure 6.4 Trends of most-people-known languages from 1993 to 2003.
From Figures 6.2 and 6.4, it is clear that the primary programming languages
changed dramatically during these ten years. The object-oriented languages get more
advantages than the other languages and become more popular. For "old-styled"
languages, although they are not considered as primary language any more, there are still
large populations who know those languages.
For trends of other factors in grassroots support, please check the website for
more details.

71
6.2 Survey Results for Institutional Support
The question for institutional support is: "How many institutions use this language for
their introductory programming language courses?" Please check what happened in 1993,
1998, and 2003.
In 1993, Pascal has been used extensively than other languages even though C++
has been used to some extent. Ada also has been used in 1998 and 2003. But in 1998 C++
has been used more than other languages. In 2003 JAVA has taken up the position since
it become very popular in recent years.

72
Figure 6.6 shows how many students use this language for any of their courses.
Students used Pascal, C and C++ extensively in the year 1993. In 1998, JAVA had
considerably improved its popularity among students. In 2003 JAVA has been improved
as well and becomes the most preferred language. ClC++ and FORTRAN are almost the
same for all the three years taken into consideration. For more survey results in
institutional support, please check the website.
Figure 6.6 Numbers of students use this language for any of their courses from 1993 to
2003.

73
6.3 Survey Results for Industrial Support
This section will watch the trends of programming languages in industry. How many
companies use this language as primary programming language to develop products? The
graph below shows that in year 1993 there were more companies (around 36% of them)
using C for their products development. Next in that was C++ with around 24%. In the
year 1998, C++ was used in up to 48% of the companies and C was in around 31% of the
companies. It is clear that in 1998 the other languages did not make a significant impact
in the development of products in companies. In 2003 almost half of the companies used
JAVA and C++ is used by around 44% of the companies.
Figure 6.7 Numbers of companies use this language as primary language from 1993 to
2003.

74
Figure 6.8 shows how many developers consider this language as their primary
language. In 1993, developers felt comfortable with C that 34% of the developers used.
The second position was C++ that was preferred at around 32%. Pascal was in third place
with 16%. Around 12% of the developers preferred BASIC. In 1998 around 40% of the
developers preferred C++ and 26% of them preferred C. But in 2003 the usage of JAVA
dramatically increased among the programmers and around 45% of the programmers
used JAVA. C++ remains the second while approximately 41% of programmers consider
it as their primary language.
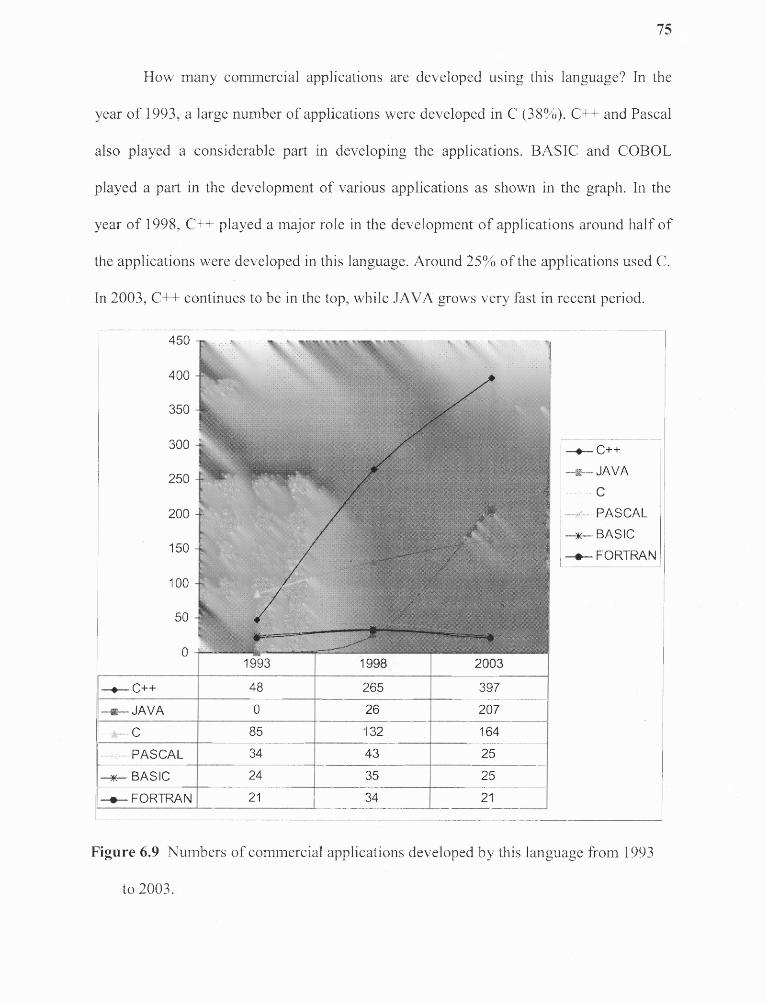
75
How many commercial applications are developed using this language? In the
year of 1993, a large number of applications were developed in C (38%). C++ and Pascal
also played a considerable part in developing the applications. BASIC and COBOL
played a part in the development of various applications as shown in the graph. In the
year of 1998, C++ played a major role in the development of applications around half of
the applications were developed in this language. Around 25% of the applications used C.
In 2003, C++ continues to be in the top, while JAVA grows very fast in recent period.
Figure 6.9 Numbers of commercial applications developed by this language from 1993
to 2003.

76
6.4 Survey Results for Governmental Support
How much code is written by government in this language? As in the graph, the
maximum number of code is written in the language ADA with 36.78% for the year
1993, followed by 24.05% for C. 16.76% of code are written in COBOL, while 14.47%
are written in FORTRAN in 1993. In the year 1998, ADA still had the maximum of
33.07%, C with 20.44% followed by COBOL with 15.45% and FORTRAN with 13.67%.
Also in the year 2003 ADA has 30.74%, C with 16,53, C++ with 15.84%, COBOL with
13.56% and FORTRAN with 11.47%. Figure 6.10 shows the graph for all the three years
put together for the number of lines of code written for a particular language.

77
6.5 Survey Results for Organizational Support
Figure 6.11 shows the graphs for the number of conferences in the three years. C++ is the
largest at 18.6% in the year 1993. PASCAL is at approximately 14%. COBOL comes
next to PASCAL at 11.63%. Next is ADA with approximately 9.5% of the conferences.
In the year 1998, there has been a great increase in the conferences in JAVA to 45%
followed by ADA with nearly 40% of the conferences. In 2003, JAVA has the highest
number of conferences with as many as 40%. Next is C++ with nearly 19%. The next is
Small talk with approximately 12%.
78
6.6 Survey Results for Technology Support
For technical support, no graph will be drawn here for each question because there are
not too many changes during the time and the number change is small.
In the survey, C and C++ consistently have the higher percentage of compilers
than other languages. Around 22% of the compilers were C and C++ compilers. The
number of debuggers for C and C++ are also the highest among all languages. BASIC,
FORTRAN and PASCAL come after C and C++. After JAVA was introduced in 1995,
SUN is the major provider for compiler, interpreter, and debugger. The other companies
generally will use SUN's technology and provide some CASE tools.
It is notable that ClC++ have much more third-parties library than the other
languages. JAVA includes a lot of libraries as its own language features while the other
language does not. For operating systems, almost every OS will support all of these
languages. JAVA has more advantage in networking support while ClC++ get more
support in database fields.

CHAPTER 7
DATA ANALYSIS & MODEL CONSTRUCTION
In the previous chapters, the following questions have been discussed: how to find out the
relevant factors, how to quantify those relevant factors, and how to collect data for them.
After the data warehouse has been established, the new questions are: how to analyze
these data, how to construct the proper statistics models that can be used to describe the
history of programming languages, and how to extend the statistics models to predict the
trends of programming languages.
7.1 Statistics Models
In this project, SAS statistic toolbox will be used to help describe historical programming
language trends and predict the evolution of future trends. First, the data collected in the
data warehouse will be analyzed to extract some descriptive properties to characterize the
evolution of programming language over time. Second, infer on available data to predict
the future trends of programming languages. Chapter seven will try to analyze data and
construct the statistics model for historical and current trends. In chapter eight, the
statistics models will be extended to predict future trends.
Regression models will be used to analyze the historical data. As an empirical
modeling approach, regression uses polynomials as local approximations to the true
inputloutput relationship. This empirical approach is often adequate for process
improvement in an industrial setting.
79

80
In scientific applications there is usually relevant theory that allows us to make a
mechanistic model. Often such models are linear or nonlinear in the unknown parameters.
Nonlinear models are more difficult to fit, requiring iterative methods that start with an
initial guess of the unknown parameters. Each iteration alters the current guess until the
algorithm converges.
7.1.1 General Model
What is the general model that can be used to describe the past programming language
trends and predict the future trends of programming languages? Let's check the following
general model:
Figure 7.1 General models used to analyze data.

81
From the above general model, the following questions will be asked:
• What are the input factors?
• What are the output factors?
• What is F ( )?
In author's point of view, intrinsic factors and past extrinsic factors should be
used as input factors, while current extrinsic factors should be used as output factors. The
input factors and output factors are used to construct the statistics models. Section 7.2
will discuss how to analyze factors, and how to construct models will be discussed in
section 7.3.
7.1.2 Possible Statistics Models
General models are used to describe the relationships between input and output factors.
What kind of statistics models could be used to construct the general models?
It is well known that the general purpose of regression is to use the known
relationship between independent and dependent variables to predict the future. In most
applications, regression models are merely useful approximations. Reality is often so
complicated that you cannot know what the true model is. One may have to choose a
model more on the basis of what variables can be measured and what kinds of models can
be estimated than on a rigorous theory that explains how the universe really works.
However, even in cases where theory is lacking, a regression model may be an excellent
predictor of the response if the model is carefully formulated from a large sample. In this

82
project, regression is chosen to cons trust the model. The following are the possible
regression models that could be used to describe programming language trends.
Linear Regression Model
Linear models are problems that take the form:
where
• Y is an n by 1 vector of observations
• X is the n by p design matrix for the model
• p is a p by 1 vector of parameters
• e is an n by 1 vector of random disturbances
Linear regression attempts to explain the relationship with a straight line fit to the
data by the condition that the sum of the square residuals is as small as possible. One-way
analysis of variance (ANOVA), two-way ANOVA, polynomial regression, and multiple
linear regression are specific cases of the linear model.

83
Nonlinear Regression Model
The statistic toolbox has functions for fitting nonlinear models of the form:
where
• Y is an n by 1 vector of observations
• f is any function of X and f3
• X is an n by p matrix of input variables
• 13 is a p by 1 vector of unknown parameters to be estimated
• e is an n by 1 vector of random disturbances
The goal of nonlinear regression is to fit a model to the data. The program finds
the best-fit values of the variables in the model (perhaps rate constants, affmities,
receptor number, etc.), which the researcher can interpret scientifically. Choosing a
model is a scientific decision. One should base hislher choice on hislher understanding of
chemistry or physiology (or genetics, etc.). The choice should not be based solely on the
shape of the graph. Some programs automatically fit data to hundreds or thousands of
equations and then present the equations that fit the data best.
84
7.2 Data Analysis
7.2.1 Factor Analysis
The factor analysis is used to do the startup research on raw data. The independence of
the variables in groups is evaluated for further research. The relatively small number of
latent factors proved that many variables are highly correlated and need either adjustment
or combination, which make it necessary to do canonical analysis.
Factor analysis is a generic term for a family of statistical techniques concerned
with the reduction of a set of observable variables in terms of a small number of latent
factors. It has been developed primarily for analyzing relationships among a number of
measurable entities (such as survey items or test scores). The underlying assumption of
factor analysis is that there exist a number of unobserved latent variables (or "factors")
that account for the correlations among observed variables, such that if the latent
variables are partialled out or held constant, the partial correlations among observed
variables all become zero. In other words, the latent factors determine the values of the
observed variables. Each observed variable could be expressed as a weighted composite
of a set of latent variables. The primary purpose of factor analysis is data reduction and
summarization. Factor analysis has been widely used, especially in the behavioral
sciences, to assess the construct validity of a test or a scale.
Once the input data are prepared for the analysis, it is necessary to decide on a
factoring technique, that is, a method of extracting factors. There are a variety of different
methods of factor extraction available in the PROC FACTOR procedure in SAS:
principal component, principal factor, iterative principal factor, unweighted least-squares

85
factor, maximum-likelihood factor, alpha factor, image analysis, and Harris component
analysis. The two most commonly employed factor analytic techniques are principal
component and principal factor analysis. The different FA techniques employ different
criteria for extracting factors.
In this project, three sets of data (1993, 1998, and 2003), and 17 programming
languages will be used as observations. So in final model, the construction of each factor
is based on 51 observations.
Please check the following table. It will show the factor analysis for intrinsic
factors.
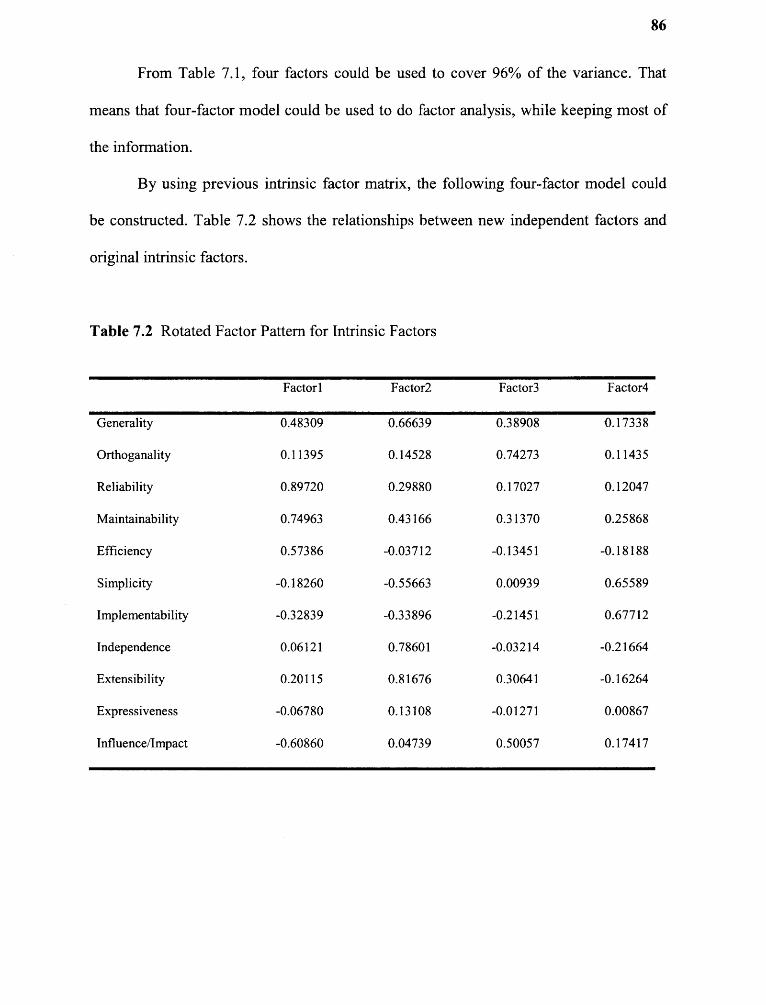
86
From Table 7.1, four factors could be used to cover 96% of the variance. That
means that four-factor model could be used to do factor analysis, while keeping most of
the information.
By using previous intrinsic factor matrix, the following four-factor model could
be constructed. Table 7.2 shows the relationships between new independent factors and
original intrinsic factors.

Table 7.3 Factor Analysis for Extrinsic Factor Matrix
87

Table 7.4 Rotated Factor Pattern for Extrinsic Factors
88

89
For extrinsic factors, the same method will be used. Table 7.3 shows the factor
analysis for extrinsic factors. From this table, following conclusion can be drawn. For the
extrinsic factors, seven extrinsic factors will cover 91.45% information. Also, an
interesting fact shows that 24 extrinsic factors will cover 100% information, so at least
four factors are constant and could be deleted from the model. Table 7.4 shows the seven-
factor models.
7.2.2 Canonical Correlation Analysis
There are several measures of correlation to express the relationship between two or more
variables. Canonical Correlation is an additional procedure for assessing the relationship
between variables. Specifically, this analysis allows us to investigate the relationship
between two sets of variables. For example, an educational researcher may want to
compute the (simultaneous) relationship between three measures of scholastic ability with
five measures of success in school. If the square root of the eigenvalues is taken, then the
resulting numbers can be interpreted as correlation coefficients. Because the correlations
pertain to the canonical varieties, they are called Canonical Correlations. Like the
eigenvalues, the correlations between successively extracted canonical variants are
smaller and smaller. Therefore, as an overall index of the canonical correlation between
two sets of variables, it is customary to report the largest correlation, that is, the one for
the first root. However, the other canonical variants can also be correlated in a
meaningful and interpretable manner.
In this project, canonical correlation is used to analyze the relationship among all
factors. Two kinds of canonical analysis have been done: one with only the factors in
intrinsic group, and the other with both intrinsic and extrinsic factors.

90
The first is done to seek the interest relationships between intrinsic features of
language and performance of them. Most result showed a relationship, which counts for
part of the feature. Different intrinsic factors of a programming language do have
different impact on the overall performance by using this model. Let's check table 7-5 for
the question: "How many developers consider this language as primary language?"
Table 7.5 shows that machine independence, extensibility and generality have
more impact to this extrinsic factor than other intrinsic factors. Please notice that year
will also have relatively big impact to the trends. In the long term, older programming
language will lose its popularity during the time.

91
The second model is done to show the correlations between all variables,
including both intrinsic and extrinsic factors. Most of the time, the relationships in the
first part now are not in the first rank. Some relationships are very interesting, like those
relations with variables from technology groups, some are just shows the highly related
facts between some variables. However, these are still important information in the
prediction model construction.
Let's analyze the result of canonical correlation analysis by using all factors for
the extrinsic factor: "How many developers consider this language as primary language?"
The correlation results shows that intrinsic factors don't have much impact on this
extrinsic factor. Instead, those extrinsic factors like: "How many companies use this
language as primary language", "How many compiler available for this programming
language", and "How many people consider this language as their primary language", are
highly related with this extrinsic factor. Table 7.6 shows some of the correlation results.

92
7.2.3 Statistics Conclusion
First, for intrinsic factors, the factor analysis showed that only four intrinsic variables are
enough to contain more than 95% of the language internal information. So, it shows that
the 11 latent intrinsic factors are highly correlated and they are not independent from
each other. To construct useful regression model for the historical trends, the independent
factors, instead of original factors, will be used. From the factor analysis, it shows that
intrinsic variables do represent important features of the language.
Second, for extrinsic factors, the factor analysis showed that only seven extrinsic
variables are enough to contain more than 95% information of all extrinsic factors. That
means most of the 30 extrinsic factors are also related to each other. The high correlation
between all extrinsic variables represent that there are some highly-correlated variables in
the extrinsic group. It makes sense. For example, the more institutions use a
programming language as introductory teaching language, the more students will know
this programming language; the more companies use a programming language to develop
their software, the more developers will consider this programming language as their
primary language.
The canonical correlation analysis result shows that which factors are mostly
related and how much are they related. Thus manifest the relationship between intrinsic
factors and extrinsic factors quantitatively. It is also a good startup to construct regression
model, because the newly constructed independent factors, instead of the original factors,
will be used to construct the regression model.
93
7.3 Model Construction
After factor analysis has been done, the independent intrinsic and extrinsic factors have
been constructed. By doing canonical correlation analysis, two correlation models for
intrinsic factors only and for all factors have been made to show the correlation among
those factors. Section 7-3 will discuss how to construct regression models by using these
independent intrinsic and extrinsic factors.
7.3.1 Multivariate Multiple Regression Model
Regression analyses are a set of statistical techniques that allow one to assess the
relationship between one dependent variable (DV) and several independent variables
(IVs). Multiple regression is an extension of bivariate regression in which several
independent variables are combined to predict the dependent variable. Regression may be
assessed in a variety of manners, such as:
• Partial regression and correlation: Isolates the specific effect of a
particular independent variable controlling for the effects of other independent
variables. To find out the relationship between pairs of variables while
recognizing the relationship with other variables.
• Multiple regression and correlation: Combined effect of all the variables
acting on the dependent variable; for a net, combined effect. The resulting R2
value provides an indication of the goodness of fit of the model.

94
The multivariate regression equation is of the form:
where:
Y = the predicted value on the DV,
A = the Y intercept, the value of Y when all Xs are zero,
X = the various IVs,
B = the various coefficients assigned to the IVs during the regression,
E = an error term.
Accordingly, a different Y value is derived for each different case of independent
variable. The goal of the regression is then to derive the B values, the regression
coefficients, or beta coefficients. The beta coefficients allow the computation of
reasonable Y values with the regression equation, and provide that calculated values are
close to actual measured values.
Computation of the regression coefficients provides two major results:
• Minimization of deviations (residuals) between predicted and obtained Y
values for the data set,
• Optimization of the correlation between predicted and obtained Y values
for the data set.

95
As a result, the correlation between the obtained and predicted values for Y
relates the strength of the relationship between the dependent variable and independent
variables. Although regression analysis reveals relationships between variables, this does
not imply that the relationships are causal. Demonstration of causality is not a statistical
problem, but an experimental and logical problem. Multiple regression is a good choice
for us to analyze the programming trends.
7.3.2 Regression Model for Historical Trends
In this project, multivariate multiple regression model is used to analyze the data. Please
check Figure 7te.
Figure 7.2 Regression model for programming language trends.

96
In this model, all of the intrinsic factors will be considered as input factors.
Extrinsic factors, which will changed by time, will be consider as both input and output
factors. Normally, the earlier history data will be considered as input factors and the later
data will be considered as output factors.
Input data: Intrinsic factors and Extrinsic factors
Output data: Extrinsic factors
The general purpose of multivariate multiple regression is to learn more about the
relationship between several independent or predictor variables and a dependent or
criterion variable. Multivariate multiple regression can easily be extended to deal with
situations where the response consists of p > 1 different variables. The input matrix will
be constructed by factors got from factor analysis, this analysis is necessary to make
independent factors so the regression model can be made and interpreted.
Multivariate multiple regression model for programming trends consists 30 parts,
one for each extrinsic variables. Due to the number of factors used in the model, there
will be a balance between model reliability and the information completion. The more
factors you used, the more information will be included, but regression model will be less
reliable. The fewer factors you used, the less information will be included, but the
regression model will be more reliable.
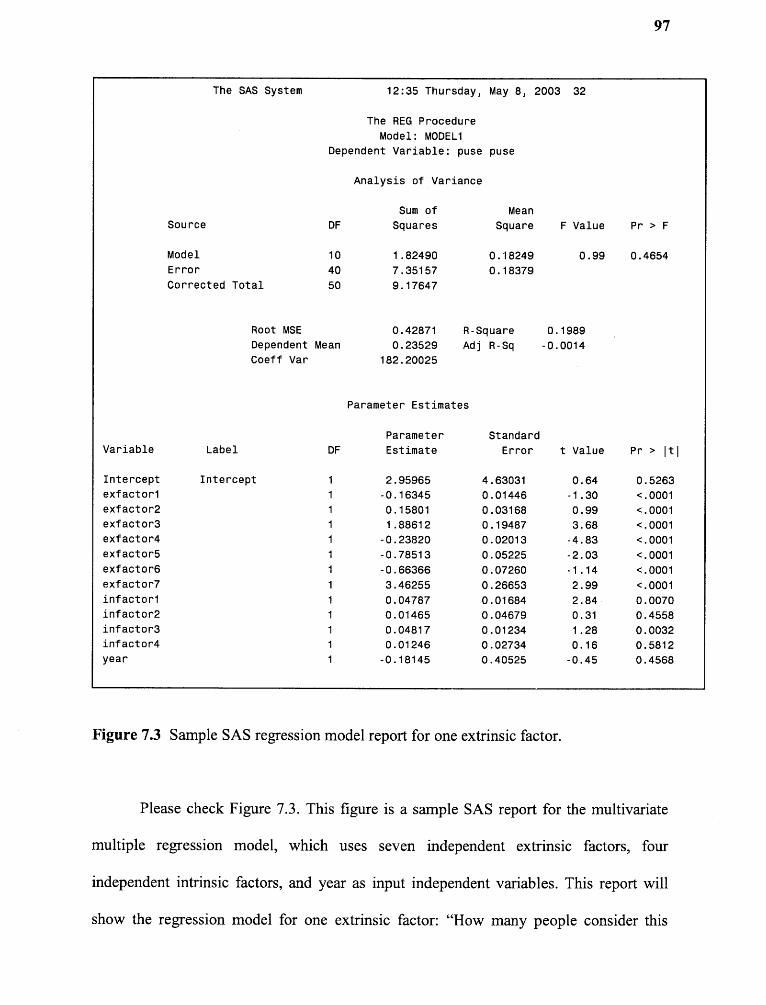
97
Figure 7.3 Sample SAS regression model report for one extrinsic factor.
Please check Figure 7.3. This figure is a sample SAS report for the multivariate
multiple regression model, which uses seven independent extrinsic factors, four
independent intrinsic factors, and year as input independent variables. This report will
show the regression model for one extrinsic factor: "How many people consider this

98
language as primary language." The parameter will show the impact of each input
independent factor to the output extrinsic factor. The other regression reports can be
found in the website of this project. By using all of the parameters, the regression models
are constructed for historical programming language trends.
In a word, this multivariate multiple regression models are used to describe the
historical trends of every programming languages. This statistics models are very helpful
to see the relationships among all factors and how they affect the programming language
trends.
CHAPTER 8
TOWARDS A PREDICTIVE MODEL
8.1 Model Derivation
In order to predict the future trends of programming languages, the original multivariate
multiple regression models should be revised. The model derivations are divided into
three parts: data reorganization, variable choosing & primary model calculation, and
variables reselection & final model calculation.
The first step is data reorganization. In this step, the factors will be redefined. For
example, the variable PUSE means "how many people know this language at a specific
time?" And this variable used to have 51 observations for 17 programming languages in 3
periods (1993, 1998, 2003). Now, this factor will be divided into PUSE93, PUSE98 and
PUSEO3, each has 17 observations for each period (1993, 1998 and 2003). In this way,
only the extrinsic factors need be reorganized. Intrinsic factors do not need reorganization
because they will not change with time. In this way, the whole structure of the data is
changed like the following. There are only 17 observationsllanguages, but much more
variables, because the number of extrinsic variables has been tripled. This will cause
special model calculation methods in the future.
For variable choosing and model primary calculation, the following steps will be
done. Refer to the correlation coefficients got by canonical analysis, two to three
variables will be chosen from each group, such as grassroots support group, the standard
is to choose the most highly related ones. The choosing will continue until there are more
than 16 variables in the PROC REG in SAS. Then the first calculation will begin by
99

100
running the PROC. SAS will automatically check the variables, decide which to keep and
which to delete. The Result will be a list that shows that some variables are dependent on
others and should be erased from the model.
The last step is variables reselection and the final model calculation. All
dependent variables should be deleted from the original model. It will be only 16
variables left on the right side of the equation mark. Now run the PROC again and get the
final model. The coefficients for each variable are now fixed and can be recorded.
By doing so, derivative regression models are constructed like the following:
Where:
Eno: Value of extrinsic factors in 2003
I: Value of intrinsic factors
A: Parameter matrix for intrinsic factors
E1998: Value of extrinsic factors in 1998
B: Parameter matrix for extrinsic factors in 1998
E 1993 : Value of extrinsic factors in 1993
C: Parameter matrix for extrinsic factors in 1993
D: Constant value

101
SAS is used to calculate the parameter matrix Please notice that there exists more
than one parameter matrix for this model because the number of parameter is greater than
the number of observation. Although multiple parameter matrices exist in this derivative
model, they are still useful and can be used to describe the historical trends of
programming languages.
8.2 Predictive Model
From previous section, the derivative prediction models have been constructed for each
extrinsic factor in 2003. Based on the assumption that the whole language trends from
1998 to 2008 should be similar like those from 1993 to 2003, the following derivative
models will be used to predict the value of each extrinsic factor in 2008 by submitting the
value in 98 to the 93 position and 03 to the 98 position in the model.
where:
E2008: Value of extrinsic factors in 2008
I: Value of intrinsic factors
A: Parameter matrix for intrinsic factors
Eno: Value of extrinsic factors in 2003
B: Parameter matrix for extrinsic factors in 2003
E 1998 : Value of extrinsic factors in 1998

102
C: Parameter matrix for extrinsic factors in 1998
D: Constant value
Some of the predictions are showed in the rest of this chapter. Let's check "How
many people will consider this language as their primary programming Language in
2008?" The following is the predictive results:
Figure 8.1 How many people consider this language as primary language in 2008.
From above graphs, the five most popular languages in 2008 will be: JAVA

103
(8.08%). Figure 8.2 shows the trends of most popular programming languages from 1993
to 2008.
Figure 8.2 Trends of most popular programming languages from 1993 to 2008.
Figure 8.2 shows interesting trends for programming language. It seems like from
2003 to 2008, JAVA will be the only language that is still in increasing period. All the
other languages will decline and begin to enter a stable period where the percentage
won't change too much.
Please notice that this prediction is based on historical trends. That means if future
trends remain the same as current trends, JAVA will still keep growing. But it's maybe

104
not true because nobody can guarantee that the future trends of next five years will be the
same like last five years, and the newest language (like C#) is not considered.
Figure 8.3 shows another interesting question for grassroots support: "How many
people know this Language in 2008?"
From above graphs, the top five most-people-known languages in 2008 will be:

105
Figure 8.3 shows JAVA will bypass C as the most-people-known language in
2008. Figure 8.4 shows the trends of most-people-known programming languages from
1993 to 2008.
Figure 8.4 Trends of most-people-known languages from 1993 to 2008.
Figure 8.4 also shows interesting trends for programming language. It seems like
from 2003 to 2008, JAVA still growing very fast while the other languages won't change
much. Although ADA ranks No. 3 as primary language, but not much people know it.

106
The best explanation is that certain group of people likes ADA very much while the other
people even won't bother to learn it.
A very important fact is that the parameter matrices are not unique. All of these
parameter matrices could be used to describe past and current trends of programming
languages, because that is how they are constructed. But by replacing the data of 1993 by
those of 1998 and replacing the data of 1998 by those of 2003, the results of 2008 are not
the same by using different parameter matrices. That means each predictive derivation
model will generate different prediction results. Although the predictions are not unique,
these derivative models are still very helpful for researchers to understand the trends.
After collecting more data in the future, these derivative models can be refined.

CHAPTER 9
MODEL VALIDATION & IMPROVEMENT
9.1 Model Validation
In this empirical study, programming language trends were considered, their evolution
over time was observed, the evolution by means of time series was recorded, and the
general statistics models for how these trends evolve have been constructed.
After the statistics models for programming language trends have been
constructed, a number of methods need to be introduced to assess the reliability of these
models. Assessing the quality of a model is called model validation. Model validation is
something that needs to be done both by producers and users of models. A model is just a
human being's hypothesis of a simplified representation of the real world, so it is always
a good practice to do validation to check the reliability of a model.
In this project, the following methods will be used to validate the statistics
models:
• Check the difference between the actual values and the predictive values
from the statistical models.
• Use historical data of the other programming languages that are not in our
language list to validate and correct the model.
• Revise these models based on the newest evolution of programming
languages.
107
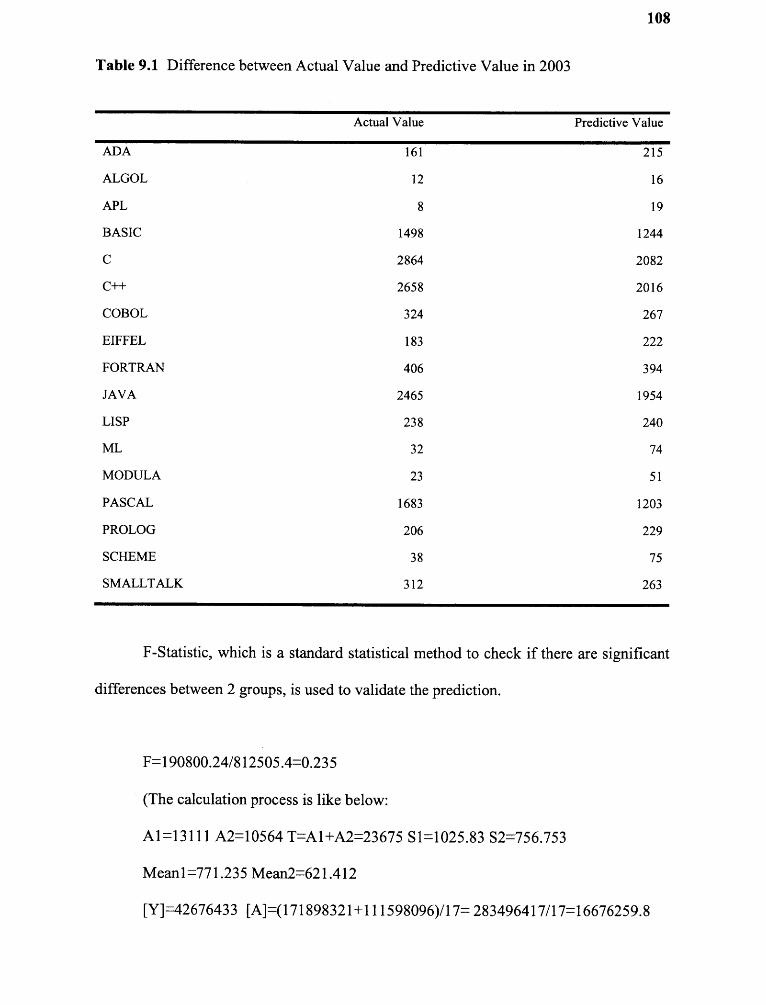
Table 9.1 Difference between Actual Value and Predictive Value in 2003
108
F-Statistic, which is a standard statistical method to check if there are significant
differences between 2 groups, is used to validate the prediction.

In the F-table, a=0.05, F>4.49 to reject Hypothesis, so F value is much less. The
hypothesis is validated, since there is no significant difference between these 2 groups.
The prediction is very well when tested with actual value.
Table 9.1 shows the difference between the actual values and the predictive
values for the extrinsic factor: "How many people know this programming language in
2003?" It shows that the predictive values match actual values very well and this
statistical model is valid to describe the historical and current trends of programming
languages.
9.2 Model Improvement
9.2.1 Weakness
There no perfect statistics models exist. A famous statistic statement is: "All models are
wrong, but they are useful." Instead of perfect models, reasonable models are maintained
to describe the historical trends and current evolution of programming languages.
Somehow, these models can also be used as good references to predict the future trends
of programming languages. This multiple regression model for programming language
trends has the following weaknesses.
110
The first weakness of the regression model is that the number of the variables is
larger than the number of observations. It makes the regression models to be not unique.
To avoid that problem, two ways will be used to refine the models. Most correlated
variables are always manually selected into the model first. SAS will also automatically
delete the dependent variables until 17 variables (equal to the number of the
observations) can be decided. In the future, it is hoped that more language will be
included into the research so the number of observation can increase and make the model
sounder.
The second weakness is that the data may not in proper format or not complete. In
the data survey process, some problems are difficult to solve. And bias may be caused.
For example, not every company responds to the survey, so the information is
incomplete. If the silent companies are tending more to use one kind of specific language,
a bias will be caused by the available data. Also, it is hard to get cooperation from
government, because they are not willing to participate the survey.
Also, some historical data are hard to find and the expression maybe not good.
For example, as the variable PUSE is considered, it will vary a lot in different periods.
The 300 users in 1980 may consist 90% of all programmers, so C++ should be
considered to be prevailing at that time. However, it will be considered as much less
important comparing to the 3000 users for JAVA in 2003 just because of the small
number. But in the year of 2003, 3000 users may just consist a small proportion of the
programmers. Due to the dramatic development of computer science and technology, the
number may not be a good measure. But, if percentage is used instead of number,

111
information of number growth will be lost. So, both number and percentage should be
considered when analyzing the data and constructing the statistics models.
The features of the programming languages may prove that multiple multivariate
regression models are not the best method for analysis. The feature of a new
programming language may appear to be like the description below:
"A programming language will first expand after it's created, increasing even in
exponent way. Then, it goes to the summit in a few years. As time is going on and newer
language coming out, it begins a decrease period. Then after a change period, it keeps
somehow constant. There will not have much vibration for the rest of its life. The
lifecycle of a programming language likes a bell curve."
This description is reasonable based on the common sense of a programming
language. However, it is far from what we get in this multiple multivariate models. So
that multiple multivariate regression may not be very appropriate here, or can be
considered just as an approximation. However, we need more data to track the whole
process instead of 3 periods. If we have more data, we will use time series method to
reanalyze it.
9.2.2 Possible Improvement
To investigate the future data, more observations are needed. And based on more data,
TIME SERIES method can be used to construct better statistics models. There are two
main goals of time series analysis: identifying the nature of the phenomenon represented
by the sequence of observations, and predicting future values of the time series variable.
Both of these goals require that the pattern of observed time series data is identified and
more or less formally described.
112
Time series data often arise when monitoring industrial processes or tracking
corporate business metrics. Time series analysis accounts for the fact that data points
taken over time may have an internal structure, such as autocorrelation, trend or seasonal
variation. The below introduction of Time Series: [66]
Time series model is an ordered sequence of values of a variable at equally spaced
time intervals. The usage of time series models is twofold:
• Obtain an understanding of the underlying forces and structure that
produced the observed data
• Fit a model and proceed to forecasting, monitoring or even feedback and
feedforward control.
The fitting of time series models can be an ambitious undertaking. There are
many methods of model, such as Box-Jenkins ARIMA models, Box-Jenkins Multivariate
Models, Holt-Winters Exponential Smoothing (single, double, triple), and Box-Jenkins
ARIMA models.
The term "univariate time series" refers to a time series that consists of single
(scalar) observations recorded sequentially over equal time increments. Some examples
are monthly CO 2 concentrations and southern oscillations to predict el nino effects.
Although a univariate time series data set is usually given as a single column of
numbers, time is in fact an implicit variable in the time series. If the data are equi-spaced,
the time variable, or index, does not need to be explicitly given. The time variable may
sometimes be explicitly used for plotting the series. However, it is not used in the time
series model itself.

113
Box-Jenkins Multivariate Models
The multivariate form of the Box-Jenkins univariate models is sometimes called the
ARMAV model, for Auto Regressive Moving Average Vector or simply vector ARMA
process.
The ARMAV model for a stationary multivariate time series, with a zero mean
vector, represented by
where
are n x n matrices for autoregressive and moving average parameters

114
The estimation of the matrix parameters and covariance matrix is complicated and
very difficult without computer software. The estimation of the Moving Average matrices
is especially an ordeal. If we opt to ignore the MA components we are left with the ARV
model given by:

115
A model with p autoregressive matrix parameters is an ARV(p) model or a vector
AR model. The parameter matrices may be estimated by multivariate least squares, but
there are other methods such as maximum likelihood estimation.
There are a few interesting properties associated with the phi or AR parameter
matrices. Consider the following example for a bivariate series with n =2, p = 2, and q =
0. The ARMAV(2,0) model is:

116
Without loss of generality, assume that the X series is input and the Y series are
output and that the mean vector = (0,0). Therefore, transform the observation by
subtracting their respective averages.
The diagonal terms of each Phi matrix are the scalar estimates for each series, in
this case:
The lower off-diagonal elements represent the influence of the input on the
output. This is called the transfer mechanism or transfer-function model as discussed by
Box and Jenkins in Chapter 11. The otherms here correspond to their terms.
The upper off-diagonal terms represent the influence of the output on the input.
This is called "feedback". The presence of feedback can also be seen as a high value for a
coefficient in the correlation matrix of the residuals. A "true" transfer model exists when
there is no feedback. This can be seen by expressing the matrix form into scalar form:

117
Finally, delay or "dead' time can be measured by studying the lower off-diagonal
elements again. If, for example, 01.21 is non-significant, the delay is 1 time period.
Holt-Winters Exponential Smoothing (single, double, triple)
This is a very popular scheme to produce a smoothed Time Series. Whereas in Single
Moving Averages the past observations are weighted equally, Exponential Smoothing
assigns exponentially decreasing weights as the observation get older. In other words,
recent observations are given relatively more weight in forecasting than the older
observations.
In the case of moving averages, the weights assigned to the observations are the
same and are equal to 1lN. In exponential smoothing, however, there are one or more
smoothing parameters to be determined (or estimated) and these choices determine the
weights assigned to the observations.
By previous analysis, Time Series method can focus on the internal trend of the
data, which is just our interest — to find the internal trend of the development of a
programming language. However, Time Series requires much more data then we now
have. It needs a long time following and correct recording. We will choose time series
method when the pre-requirement is met.

CHAPTER 10
CONCLUSION AND FUTURE WORK
10.1 Summary
In this dissertation, a tentative effort has been discussed to analyze programming
language trends and how they evolve. The topics studied here include: what are the
factors that could affect the programming language trends; how to quantify these factors;
how to collect data for these factors; how to construct statistics models to describe the
evolution of programming languages; how to use these models to predict the future
trends; and how to validate and improve the statistics models.
As part of software engineering technology trends, this dissertation is
concentrated on a family of the trends: programming languages. First, the author
discussed what could be the possible factors that can affect the trends of programming
languages. The evolution of programming languages is affected by a dizzying array of
factors, which are themselves driven by a wide range of sources, such as market forces,
corporations, government agencies, standards bodies, universities, etc. In author's point
of view, both intrinsic factors and extrinsic factors would have impact on the trends of
programming languages. After discussing the definition of intrinsic factors and extrinsic
factors, a group of factors that could be used to watch programming languages trends are
identified.
In order to use empirical method to analyze the trends, a way must be found to
quantify intrinsic factors and extrinsic factors of programming languages. To quantify
intrinsic factors, all features of a programming language should be reviewed to check if
118

119
they match these factors, and scores will be assign for them. Extrinsic factors are not the
same as intrinsic factors. Basically, they are questions for different fields. Extrinsic
factors are questions that ask for the numbers, so the answers will be used as the value of
this extrinsic factor.
By using this quantifying method, a couple of surveys have been done to collect
necessary data for both intrinsic factors and extrinsic factors. A set of programming
languages has been selected, and intrinsic factors are evaluated based on the first version
of each programming language. For extrinsic factors, surveys have been done for each
field of them in 1993, 1998 and 2003. The value of intrinsic factor will not change during
the time, while the value of extrinsic factor does change in different period. All data are
stored in a data warehouse. Please check the complete survey results at
http:llswlab.nj it.edultechwatch.
Based on this data warehouse, statistics methods are used to analyze these data.
Several statistics models are constructed to describe the relationships among these factors
and the historical trends of each programming language. Canonical correlation is used to
do the factor analysis. Correlation among these factors has been analyzed and new
independent factors are constructed by using factor analysis. Multivariate multiple
regression method has been used to construct the statistics models for programming
language trends.
After statistics models are constructed to describe the historical programming
language trends, they will be extended to do tentative prediction for future trends. The
prediction model can be validated by future data.

120
10.2 Evaluation
In this empirical study for programming language trends, the author merely attempt to
capture observed behaviors by empirical laws. After having collected enough data and
constructed statistics models, the trends of programming languages could be understood
better. By factor analysis, each factor gets a parameter. The guess is that the factors with
larger parameter will have bigger impact to evolution of programming languages. By this
means, the following conclusion can be drawn:
• From the statistics models, generally, the parameters of extrinsic factors are
greater than the parameters of intrinsic factors. So, extrinsic factors have
bigger impact than intrinsic factors.
• Extrinsic factors can be used to check if a programming language succeeds or
fails. They are also very important factors to predict the future evolution of a
programming language. In author's point of view, if a programming language
can earn support from the majority of one field, it can be called a successful
language, such as ADA, SMALLTALK. If a programming language can earn
support from the majority of grassroots and every field, it can be considered as
very successful programming language, such as C++, JAVA.
• Although intrinsic factors have less impact than extrinsic factors, they do
impact the trends of programming languages, especially machine
independence, extensibility, and generality.
Another very important factor is the time. The survey results show that the feature
of a new programming language may appear to be like the description below: When a

121
programming language is introduced, there are some enthusiasts who are willing to learn
it. The language could expand at first, increases even in exponent way. After a while,
there will be more people who would like to use this programming language. Then, as
newer language coming out, the older language will pass its summit and begin to
decrease. After a changing period, it keeps somewhat constant because there are certain
group of people who would like to stick to this language. The language will exist without
much vibration in the rest of its life. The life cycle of a programming language are very
similar with Geoffrey A. Moore's technology adoption life cycle (TALC [4]). Figure 10.1
shows the general lifecycle of a programming language.
Figure 10.1 General lifecycle of a programming language.
The bell curve in Figure 10.1 is very useful as the general analytical model for the
trends of programming languages. The empirical results could be used to explain why a
successful programming language could earn the support from majority programmer and
why the other ones failed although a lot of innovators support them.

122
10.3 Future Work
A lot of data and interesting survey results have been collected in this empirical research
for programming language trends, but they are still not enough. If more data could be
collected in the future, they can be used to improve current statistics models. Instead of
using correlation and regression models, more advanced statistics methods, such as time
series method, can be used to improve current models in the future.
Empirical study for programming languages is just a tentative beginning of the
whole project of software engineering trends. After using empirical method, analytical
method will be used for programming language trends. Future work will not only attempt
to capture observed behaviors by empirical laws, but also attempts to understand the
phenomena that underlie observed behavior and build models that capture these
phenomena.
After studying the trends of programming languages, the other fields of software
engineering will be done in near future. For example: the trends of operating system, the
trends of networking, the trends of database, etc. All of these trends will use the similar
methods to analyze. Generally, empirical method will be used first. After having better
understanding of trends behavior, analytical method will used for them to understand the
causeleffect relationships.

APPENDIX A
WEB-BASED SURVEY
The Web-based Programming Languages Survey asks a particular set of questions to the
user bout the programming languages, which the user has learnt. The system then stores
the information given to it by the user. In the first step the system asks whether the user
knows at-least any one of the following Programming Languages:

124
If user chooses YES, the page that contains the first part of the survey is
displayed. If the user selects NO, the survey ends by thanking the user for participation.
At any point in the course of the survey the user can return back to the previous screen to
modify the input. Programming Languages Survey asks several questions for 2003, 1998,
and 1993.
In the first question, user is asked to select hislher primary programming language
from a given set of seventeen programming languages. User can choose only one
language from the seventeen languages, which helshe considers as primary programming
language. If the user is not familiar with any of the languages then helshe can opt for the
choice "None of the above".

125
In the second question, user will be asked to select all the languages, which helshe
has learnt. Unlike the first question, user can select multiple languages indicating all the
languages which the user has learnt. If user had not learnt any of the languages, helshe
can also select the choice "None of the above" as in the previous question.
In the third question, user is asked to select the percentage of code, which helshe
has written in all the languages. User must mark the approximate percentage of code
written in all the languages helshe has programmed. The total percentage of code given

126
by the user for all the programming languages must sum up to 100%. If not, there will be
a failing message which requests user to fill again till the total is exactly 100%.
If user has not programmed in any of the languages displayed, then helshe can
select the choice "None of the above" and give 100% in that box.
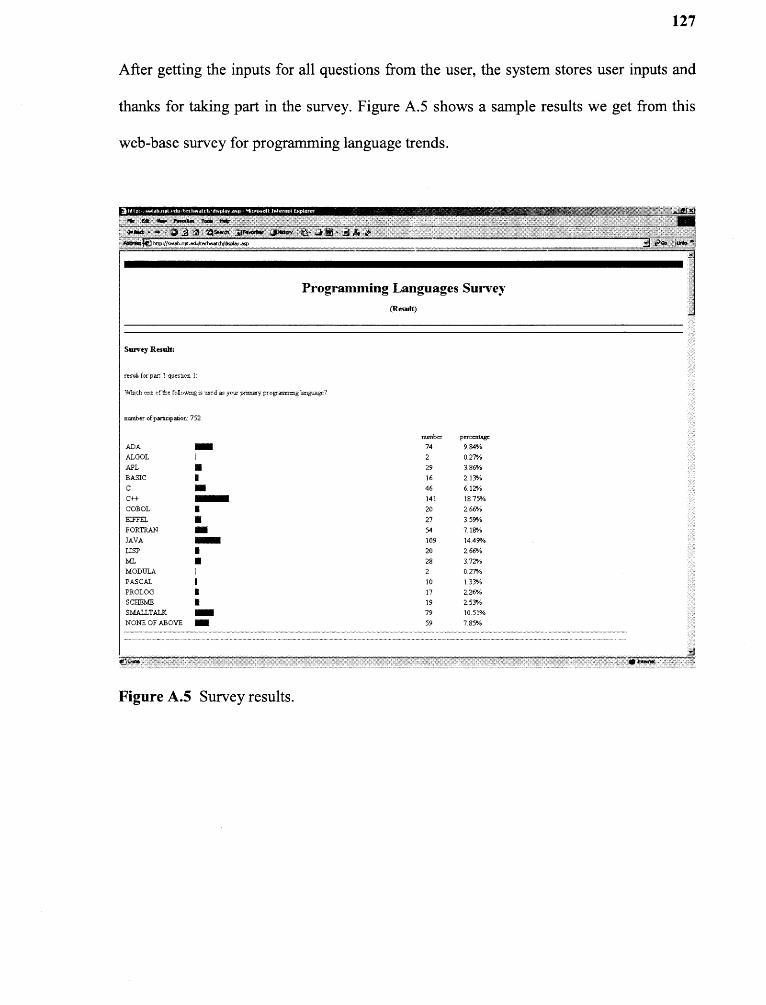
127
After getting the inputs for all questions from the user, the system stores user inputs and
thanks for taking part in the survey. Figure A.5 shows a sample results we get from this
web-base survey for programming language trends.
APPENDIX B
PREDICTIVE MODEL SIMULATION
1. Functions Performed
1.1 Language Selection
The web-based predictive model for programming language trends allows users to select
the desired programming languages and see what are the future trends for these
programming languages. Users are also allowed to make a selection of any language from
a given set of programming languages:
Once user selects one of the above languages, the selected programming language
will be used throughout the session for input, calculations and prediction. Users have
opted to use the model for the selected language for the current session.
At any point during the session of the application, the user can choose to return to
language selection page, and restart the whole process by selecting a different
programming language. Users can also change the internal value of a language to create
their own user-defined programming languages.
128

129
1.2 Display Factors
After users have made a choice for a particular language, this feature allows the users to
view the factors (parameters) of the selected language. The values for the following
factors of a language will be displayed.
Intrinsic Factors:
Generality
Orthogonality
Reliability
Maintainability
Efficiency
Simplicity
Implementability
Machine Independence
Extensibility
Expressiveness
InfluencelImpact
Extrinsic Factors
For Extrinsic Factors the values will be displayed in groups:

130
Grassroots Support
How many people consider this Language their primary programming Language?
How many people know this language?
How many percentage of code is written in this language?
How many user groups dedicated in this language?
Governmental Support:
Is this language introduced by any governmentlagency?
How many government standards for this language?
How much code is written by government in this language? (in million)
Industrial Support:
Is this language introduced and supported by any Company?
How many companies use this language as primary language to develop
products?
How many developers consider this language as their primary language?
How many companies use this language as support for any of their products?
How many developers know about this language?
How many commercial applications are developed by using this language?

131
Institutional Support:
Is this language introduced and supported by any institution?
How many institutions use this language as the support for introductory
programming courses?
How many students have used this language for their introductory programming
courses?
How many institutions use this language as the support for any courses?
How many students have used this language for any of their courses?
How many research projects use this language as support?
How many research projects deal with this language as subject?
Organizational Support:
Is this Language Introduced by an Organization?
Is this Language Supported by an Organization?
Does this Language have any standards?
Number of Conferences of this Language
Number of PaperslArticles on this Language
Number of PaperslArticles using this Language
Technology Support:
How many compilerslInterpreters are available for this language?
How many debuggers are available for this language?
How many IDEslCASE tools available for this language?

132
How many libraries (including third-party libraries) are available for this
language?
How many operating systems support this language?
The values displayed are the default values from the data warehouse.
1.3 Updating Factors
User is allowed to make changes, if desired, to the default factor values that are displayed
from the database. This functionality allows the user to adjust or tune the value of any
parameter and see the effect this change would have on the projected results from the
statistical model. Thus, the user can test several combinations of factor parameters and
see the projected results from the combinations.
1.4 Year Selection
User is allowed to select the year for which the projection for the language has to be
calculated. The year of projection needs to be selected from a list of years, which is from
the next year till the year 2008. Once the user makes the selection for the year, the
calculations of prediction will be done for the extrinsic factors of this particular
programming language in that particular year.
1.5 View Results
After making a language selection, viewing and updating the factors (parameters) of a
programming language, and selecting the year to do prediction for, users can choose to

133
view the predictive results for this language in the chosen year. The system takes the
inputs that the user has provided thus far and calculates the projections for the extrinsic
factors of the language for the selected year. These calculations are done based on
formulas derived from the multivariate multiple regression model. For example, to
predict the values for an extrinsic factor in the year of 2008, a formula like the following
will be used:
Where
E2008 = Extrinsic factor for the year 2008
I = Intrinsic factor for this language
E2003 = Extrinsic factor for the year 2003
E1998 = Extrinsic factor for the year 1998
A, B, C are parameter matrix
The predictive results are displayed according to the extrinsic factor groups.
1.6 View Graph
For each extrinsic factor of a programming language, the system provides the
functionality to view the results of the prediction for the factor in a graphical
representation. The graph displayed is a two-dimensional bar chart for the extrinsic factor

134
selected. The X-Axis is a time line in years and has the years 1993, 1998, 2003 and the
year of prediction selected The Y-Axis is the value of the extrinsic factor plotted to scale
as a vertical bar in the graph. This graph helps in viewing the trends of the extrinsic factor
over the years of displayed data.
Figure B.1 Language selection.
The first step in the process of using the tool is choosing the language. The graph
above is the layout of the web page for language selection. User can select the language

135
from a list using the radio button control and register the selection using the submit
button control, which passes the selection into the next step. As shown above in Figure
B.1, user has made the selection of C programming language.
Figure B.2 Language factors.
The above layout shows the web page for displaying the intrinsic and extrinsic
factor values for the language selected in the previous page. The Intrinsic factors are
listed in a table, followed by extrinsic factors in separate table group-wise. The values are

136
shown in text box controls and user can edit the values displayed. As shown above in
Figure B.2, the user is changing the value of the Orthoganality.
2.3 Prediction Year Selection
Figure B.3 Projection year.
This is the layout for the year selection implemented as a drop down list control.
As shown above in Figure B.3, user can select the year for which the predictions of
factors for a selected language are desired. The figure shows that user has selected the
year of 2007 from the drop down list of Years.

137
Figure B.4 Projection results.
The above Figure B.4 is the web page layout of the results or output page of the
model simulation program. The layout shows the projection results of the extrinsic
factors of the language for the year selected previously. The values are shown as simple
text in tabular format.

Figure B.5 Prediction graph
The above Figure B.5 is the layout design of viewing the results of prediction in
graphical format. The trend graph for a particular extrinsic factor can be viewed from the
projection results using the link "View Graph" provided next to the displayed projected
value of the factor. The Graph is a bar graph in a new window. Figure B.5 shows the
graph chart for the Grassroots Support factor "How Many People know this language" As
shown, moving the cursor on the bar line shows the coordinates in numerical format.
138

139
Moving the cursor on the last bar line is showing the value in the chart for that bar as
(1068,2007).
3. Data Warehouse
The data that used for projection calculations was collected through surveys and
organized in an accessible format. For accessing this data from the web-based model, the
data is referenced from a set of Microsoft excel files stored on the web server. For
intrinsic factors, we have the following files:
The IntrinsicFactors.xls file has rows for each language of our set of languages
and the columns represent the Intrinsic Factors. Thus accessing the cell of the excel file
corresponding to a particular row and column gives us the value for that intrinsic factor
for the corresponding language.
Each of the extrinsic factor files is organized into 3 sheets of data, one each for
the years 1993, 1998 and 2003. The rows in each sheet are the languages from our set of
languages for which data was collected. The columns represent the extrinsic factor within
the particular group like Grassroots Support, etc. For ease of accessing extrinsic factors
for use in calculations of projections, the column headings for the factors have been
changed to the variable names used in the regression formulas. Thus we can access the
cell corresponding to the language name and variable name for the Extrinsic factor to get
the value to use in the Regression Formula for calculations.

REFERENCES
1. A. Milli, R. David Cowan, H. Ammar, A. McKendall Jr., L. Yang, D. Chen, and T.Spencer. "Software Engineering Technology Watch". IEEE Software, Voiumn19, Number 4, Jul./Aug. 2002, pp. 123-130.
2. A. Milli, S. Yacoub, E. Addy, and H. Milli. Towards an engineering discipline ofsoftware reuse. IEEE Software, 16(5):22-31, September/October 1999.
3. H. Milli, G. Milli, and A. Milli. Reusing software: Issues and research directions. IEEETransactions on Software Engineering, 21(6):528-562, June 1995.
4. G. Moore. Crossing the Chasm. Harper Business, 1999.
5. G. Moore. Living on the Fault Line. Harper Business, 2000.
6. J. Poulin. Reuse: Been there, done that. Communications of the ACM, 42(5), May1999.
7. S. Raghavan and D. Chand. Diffusing software-engineering methods. IEEE Software,pp. 81-90, July 1989.
8. S. Redwine and W. Riddle. Software technology maturation. In Proceedings of theEighth International conference on Software Engineering, pp. 189te00, LosAlamitos, CA, August 1985. IEEE Computer Society Press.
9. E. Rogers. Diffusion of Innovations. The Free Press, New York, NY, 4 th edition,1995.
10. M. Sitraman. Panel session: Issues and non-issues in software rescue. In Proceedings,1999 Symposium on Software Reuse, Los Angles, CA, May 1999, ACM Press.
11. K. Louden. Programming Language Principles and Practice. PWSPublishing Company, Boston, MA. 1993. ISBN 0-534-93277-0.
12. U.S. Department of Defense. June 1978. "Department of Defense Requirements forHigh Order Computer Programming Languages: "Steelman".
13. ISO. January 1995. Ada 95 Reference Manual. ANSIIISO/IEC-8652: 1995.
14. B. Kernighan, and D. Ritchie. 1988. " The C Programming Language" SecondEdition. ISBN 0-13-110362-8. Englewood Cliffs, NJ: Prentice-Hall.
15. ANSI C. 1989. ANSI X3. 159, 1989.
140

141
16. J. Sutherland. September 1996. "Smailtalk Manifesto". Object Magazine. NY, NY:SIGS Publications Inc.
17. D. Wheeler. Ada, C, C++, and Java vs. The Steelman. 1996.
18. G. Leavens. Introduction to the Literature On Programming Language Design.TR #93-01c 1999.
19. A. Hook, et al. A Survey of Computer Programming Languages Currently Used InThe Department of Defense An Executive Summary. 1995.
20. M. Feldman. Ada as a Foundation Programming Language. 2000.
21. C. Engle Jr. " An Educator's Perspective on Ada", Ada Information ClearinghouseNewsletter, Vol. XII, No 1 Winter 1995.
22. C. Horstmann. A Strategic C++ Subset forCS 1 Instruction. Input: A Newsletterfor Computer Science Educators, John Wiley and Sons, Inc. Nol, Fail 1994.
23. A. Konstam and J. Howland. "Teaching Computer Science Principles to Liberal ArtsStudents Using Scheme," SIGCSE Bulletin, Vol. 26, No. 4, December, 1994.
24. J. Noon. (ed.) "Teaching CS1: What is the Best Language", Computer ScienceProduct Companion, vol. 3, No. 3, 1994.
25. R. Robert. The Reid Report, 11th edition, October 6, 1994.
26. J. Reinfelds. " A Three Paradigm First Course for CS Majors: SIGCSE Bulletin,Vol. 27, No. 1, March 1995.
27. S. Levy. Computer Language Usage In CS 1: Survey Results. SIGCSE Bulletin,Voiume 27, Number 3, page 21te6. September 1995.
28. D. Cook. Evoiution of Programming Languages and Why a Language is Not Enoughto Solve Our Problems. 2000.
29. D. Reifer. Quantifying the Debate: Ada vs. C++. 1995.
30. J. Guyot, T. Estier and P. Crausaz. The BNF Web Club Language SQL, ADA, JAVA,MODULA2, PL'SQL, • • • 1994-1998 (http://cui.unige.chldb-research/Enseignementianalyseinfo/BNFweb.htmi Retrieved in Dec. 2002.)
31. A. Bonner, R. Woollard. Mastering COBOL. John Wiley & Sons; ISBN:0471159743; Diskette edition (December 1997)

142
32. L. Nyhoff, Sanford Leestma. FORTRAN 77 for Engineers and Scientists with anIntroduction to FORTRAN 90 (4th Edition) Prentice Hail; ISBN:013363003X; 4 edition (December 28, 1995).
33. P. Graham, ANSI Common LISP. Prentice Hail; ISBN: 0133708756; 1st edition(November 2, 1995).
34. E. Torgil, T. Eckman, C. Froberg. Introduction to A1gol Programming. OxfordUniversity Press; ASIN: 0195201280; 3 edition (September 1993).
35. V. Zwass, Programming in PASCAL. Barnes & Noble; ASIN: 006460201X;(January 1985).
36. B. Kernighan, D. Ritchie. C Programming Language (2nd Edition). Prentice HailPTR; ISBN: 0131103628; 2nd edition (March 22, 1988).
37. B. Stroustrup. The C++ Programming Language (Special 3rd Edition). Addison-Wesley Pub Co; ISBN: 0201700735; 3 edition (February 15, 2000).
38. K. Arnold, J. Gosling, David Holmes. The Java(TM) Programming Language(3rd Edition). Addison-Wesley Pub Co; ISBN: 0201704331; 3rd edition (June 5,2000).
39. J. G. P. Barnes. Programming in Ada 95. Addison-Wesley Pub Co; ISBN:0201877007; 1st edition (September 28, 1995).
40. R. Milner, Mads Tofte (Contributor), Robert Harper, David MacQueen(Contributor). The Definition of Standard ML - Revised. MIT Press; ISBN:0262631814; Revised edition (May 15, 1997).
41. J. A. Mason. Learning Api. John Wiley & Sons; ASIN: 0060442433; (January 1986).
42. L. Boszormenyi, C. Weich, N. Wirth. Programming in Modula-3: An Introduction inProgramming With Style. Springer Verlag; ISBN: 3540579125; (January 1997).
43. B. Meyer. Eiffel : The Language. Prentice Hall PTR; ISBN: 0132479257; 1 edition(October 1, 1991).
44. W. F. Clocksin, C. S. Mellish. Programming in Prolog. Springer Verlag; ISBN:3540583505; 4th edition (December 1994).
45. C. Liu. Smalltalk, Objects, and Design. iUniverse.com ; ISBN: 1583484906; (April2000).
46. H. Abelson (Editor), M. B. Eisenberg. Programming in Scheme. Scientific Press;ISBN: 0894261150; (December 1998).

143
47. P. Brereton, D. Budgen, K. Bennet, M. Munro, P. layzell, L. Macaulay, D. Griffiths,and C. Stannett. The future of software. Communications of the ACM, 42(12):78-84, December 1999.
48. B. R. Gaines. Modeling and forecasting the information sciences. Technical report,University of Calgary, Calgary, Alberta, September 1995.
49. R. L. Glass. Examining the effects of the application revoiution. Journal of Systemand Software, 46(1), April 1999.
50. S. Greenspan. Panel Session: The pitac software chailenge. In Proceeding, 21 st
International Conference on Software Engineering, Los Angeles, CA, May 1999.
51. Th. S. Kuhn. Structure of Scientific Revoiution. University of Chicago Press, 1996.
52. N. G. Leveson. Software Engineering: Stretching the limits of complexity.Communications of the ACM, 40(2): 129-131, February 1997.
53. T. G. Lewis. Ubinet: The ubiquitous internet will be wireless. IEEE Computer,32(10), October 1999.
54. S. McConnell. The art, science, and engineering of software development. IEEESoftware, 14(1): 120-118-119, Jan./Feb. 1998.
55. S. McConnell. Alchemy. In after the Gold Rush, chapter 14. Microsoft Press, 1999.
56. M. Zand. Panel session: Software reuse research-are we on track? In Proceedings,1997 Symposium on Software Reuse, Boston, MA, May 1997 ACM Press.
57. M. Zand. Panel session: Closing the gap between research and practice. InProceedings, Symposium on Software Reuse, Los Angels, CA, May 1999 ACMPress.
58. S. F. Zeigler: Comparing Development Costs of C and Ada, March 1995.Rational Software Corporation.
59. M. Paulk, et.al. "Capability Maturity Model for Software," Software EngineeringInstitute, Carnegie Mellon University, Pittsburgh, Pa. 1993.
60. M. Fowler. Analysis Patterns: Reusable Object Models Addison-Wesley, 1997.
61. R. Grauer, C. Villar, and A. R. Buss. COBOL From Micro to Mainframe, 3rd edition,Prentice Hail, 1998.
62. A. Davis, 201 Principles of Software Development, McGraw-Hill, 1995.

144
63. R. Pressman. Software Engineering: A Practitioner's Approach, 4th edition.McGraw Hill, 1997.
64. G. Booch. Software Engineering with Ada, 2nd edition. Benjamin Cummings, 1987.
65. F. Services and B. Jacobs, How To Design A Programming Language, 2002.
66. Time Series: http://www.itl.nist.gov/div898/handbook/pmc/section4/pmc4.htm .(Retrived in Jan. 2003).
67. The Language Guild http://www.engin.umd.umich.edu/CIS/course.des/cis400/(Retrieved in Nov. 2002).
68. S. Glantz, B. Slinker. Primer of Applied Regression & Analysis of variance 211c1
ed. 2001 McGraw.Hill Companies.
69. C. Lanczos. Applied Analysis Dover ed. 1988 Dover Publications Inc.
70. T. Anderson. The Statistical Analysis of Time Series 1971 John Wiley & Sons Inc.
71. J. Mandel The Statistical Analysis of Experimental Data Dover ed. 1964 DoverPublications Inc.
72. M. Bulmar. Principles of Statistics Dover ed. 1979 Dover publications Inc.
73. C. Cullen. Matrices and Linear Transformations 2 nd ed. 1972 Dover PublicationsInc.
74. A. Edwards. Multiple Regression And The Analysis Of Variance And Covariance2nd ed. 1979 W.H.freeman and Company.
75. Canonical Analysis http://www.statsoftinc.com/textbook/stcanan.htmi (Retrieved inFeb. 2003) StatSoft, Inc 1984te003.
76. Principal Components and Factor Analysis (Retrieved on Jan. 2003)http://www.statsoftinc.com/textbook/stfacan.htmi StatSoft, Inc 1984te003
77. J. Hair. Multivariate data analysis 3rd ed. 1992 New York: Macmillan.
78. J. Kettenring. Canonical Analysis of several sets of variables. 1971 Biometrika, 58,pp. 433--451.
79. P. Breretoni. "The Future of Software", Comm. ACM, vol. 42, no. 12, Dec. 1999,pp. 78-84.

145
80. M. Neumann, A comparison between BETA, C++, Eiffel, Java, Object Pascal,Ruby and Smalitalk (Retrieved in Dec. 2002)http://www.s-direktnet.de/homepages/neumann/lang cmp.en.htm .
81. J. Voegele, Programming Language Comparison. (Retrieved in Nov. 2002)http://www.jvoegele.com/software/langcomp.htmi
82. Principle for High Level Programming Language Design. (Retrieved in Nov. 2002)http://www2.tunes.org/HLL/principles.htmi
83. Smaliscript Corp. Programming Language Comparison, (Retrieved in Nov. 2002)http://www2.tunes.org/HLL/principles.htmi
84. M. Neumann. Programming Language Comparison, (Retrieved in Dec. 2002)http://www2.tunes.org/HLL/principles.htmi
85. E. Levenez. Programming Language History, (Retrieved in Dec. 2002)http://www.levenez.com/lang/
86. Software Productivity Research(SPR). Programming Languages Table, (Retrieved inDec. 2002) http://www.spr.com/products/programming.htm