Embed Size (px)
Citation preview
Copyright © D2Hawkeye, Inc. All rights reserved
Clinical applications of a medical rules-based predictive modeling system
Surya Singh, M.D.Chief Medical Officer, D2HawkeyeAdjunct Instructor of Medicine, Harvard Medical School
Shiva Gautam, Ph.D.Associate Professor of Biostatistics, Harvard Medical School
page 2Confidential and Proprietary Copyright © D2Hawkeye, Inc. All rights reserved
Presentation Outline
Objectives
Terminology and Structure of Medical Rules
Risk/Predictive Model Development
Analysis of “Impactable” Cost using the Risk Modeling System
Conclusions/Q and A

page 3Confidential and Proprietary Copyright © D2Hawkeye, Inc. All rights reserved
Overview of D2 Medical/Clinical Rules
The D2 diagnostic and procedural groupers underpin many of the rules that power our risk models
page 4Confidential and Proprietary Copyright © D2Hawkeye, Inc. All rights reserved
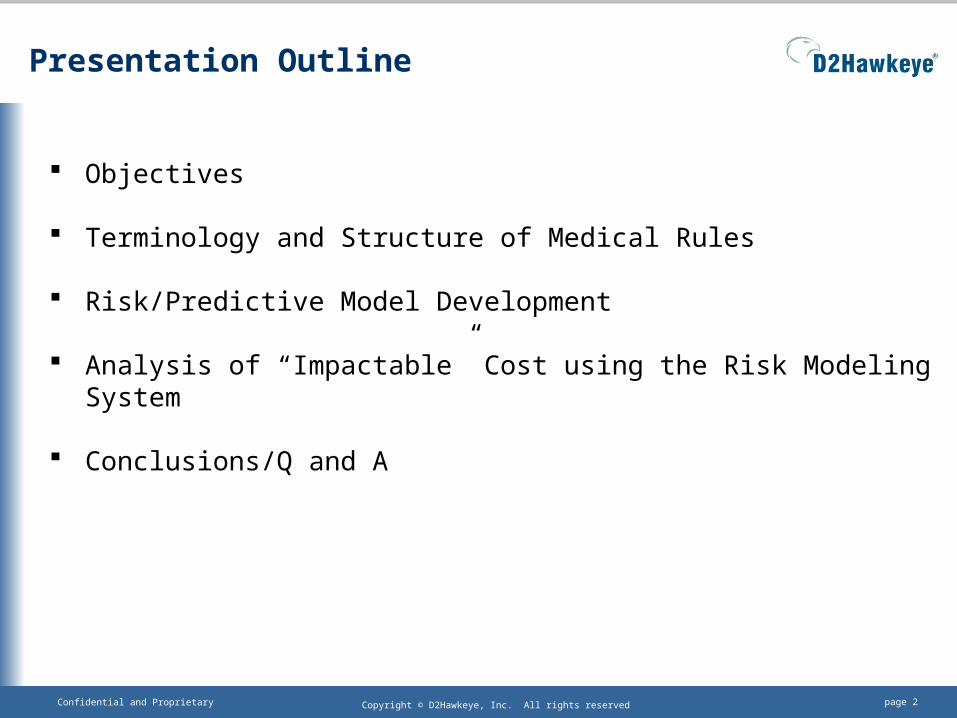
D2Hawkeye Medical/Clinical Rules
Overview of Care Gaps and Risk Measures
Medical rules are generated in the broad categories of Care Gaps and Risk Measures.
Care Gaps are specifically focused on evaluating, both at an individual and population/cohort level, the quality and appropriateness of care being delivered.
Risk Measures are focused on identifying patients with the highest disease burden from their diagnoses, procedures, and drugs, both independently and in combination. These measures are also performed at both the individual and population/cohort level.

page 5Confidential and Proprietary Copyright © D2Hawkeye, Inc. All rights reserved
D2 Individual Level Assessment
Individual Risk Index (RI)
Individual Risk Index (RI)
Individual Care Gap Index (CGI)
Individual Care Gap Index (CGI)
ARIARI

page 6Confidential and Proprietary Copyright © D2Hawkeye, Inc. All rights reserved
Summary of Risk Modeling System
Risk Index Care Gap Index
Tag-line The disease burden The intervention opportunity
What is it? A numeric score derived for each individual calculated by summing the “weight” allocated to each diagnosis, procedure (especially acute care utilization) and drug, or combination of these elements.
A numeric score assigned to each individual calculated by summing the weights assigned to each care gap present. Care gaps are derived from evidence-based guidelines, the primary medical literature, standard medical practice, and the D2 Medical Advisory Board.
Questions it Answers
• Who are our sickest members?
• How can we quantify the disease burden?
• What is the predicted cost for a given individual or group over the next 12 months?
• Who is missing important care opportunities?
• Which individuals should be targeted for intervention?
• What is the modifiable cost?
Predicts/Describes
Heavy disease burden, likelihood of high resource utilization and high future cost over the next 12 months.
Increased future health issues (and potentially acute service utilization) that can be attributed to care gaps or quality of care issues.
page 7Confidential and Proprietary Copyright © D2Hawkeye, Inc. All rights reserved
Presentation Outline
Objectives
Terminology and Structure of Medical Rules
Risk/Predictive Model Development
Analysis of “Impactable” Cost using the Risk Modeling System
Conclusions/Q and A
page 8Confidential and Proprietary Copyright © D2Hawkeye, Inc. All rights reserved
Risk Measure/Predictive Model Development
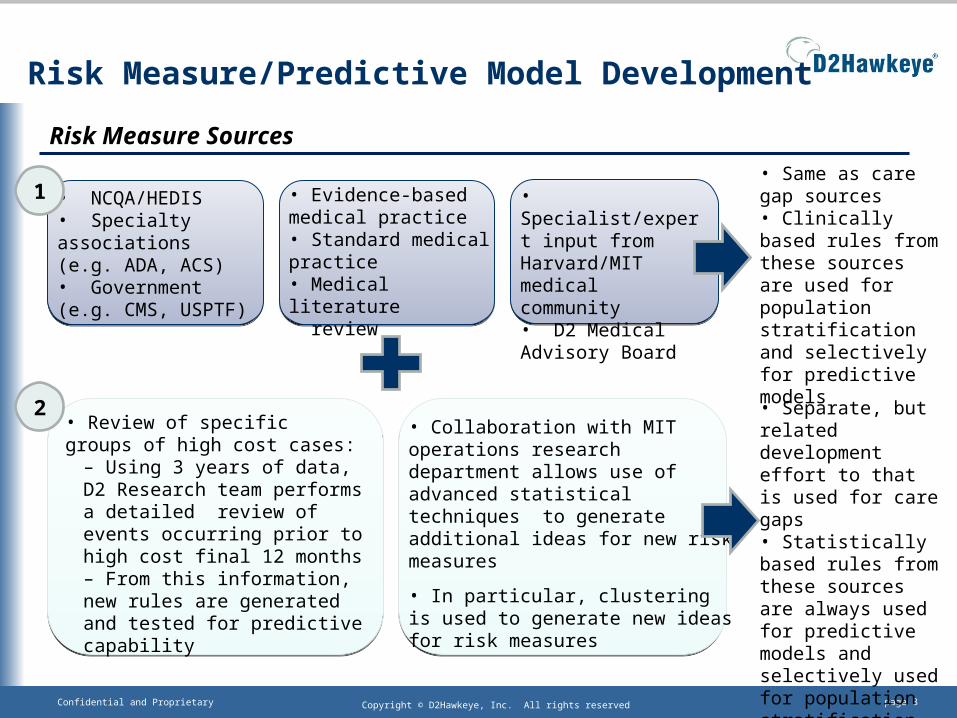
Risk Measure Sources
• NCQA/HEDIS• Specialty associations (e.g. ADA, ACS)• Government (e.g. CMS, USPTF)
• Evidence-based medical practice• Standard medical practice• Medical literature review
• Specialist/expert input from Harvard/MIT medical community• D2 Medical Advisory Board
1
• Review of specific groups of high cost cases:
– Using 3 years of data, D2 Research team performs a detailed review of events occurring prior to high cost final 12 months– From this information, new rules are generated and tested for predictive capability
• Collaboration with MIT operations research department allows use of advanced statistical techniques to generate additional ideas for new risk measures
• In particular, clustering is used to generate new ideas for risk measures
2 • Separate, but related development effort to that is used for care gaps• Statistically based rules from these sources are always used for predictive models and selectively used for population stratification
• Same as care gap sources• Clinically based rules from these sources are used for population stratification and selectively for predictive models
page 9Confidential and Proprietary Copyright © D2Hawkeye, Inc. All rights reserved
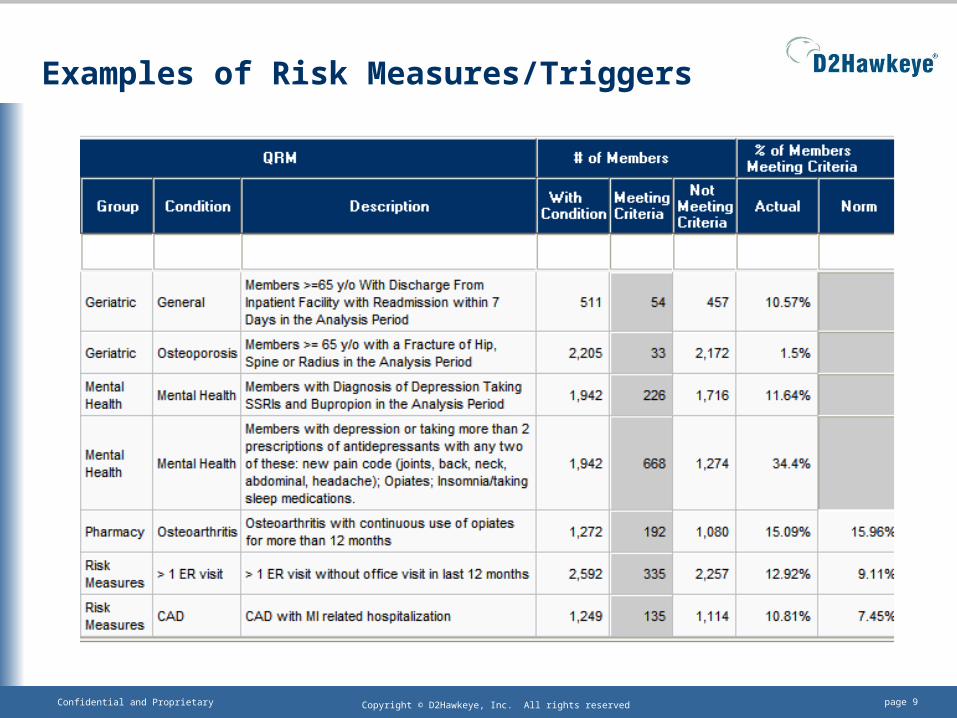
Examples of Risk Measures/Triggers
page 10Confidential and Proprietary Copyright © D2Hawkeye, Inc. All rights reserved
Statistical Methods Overview
Rule Building: Clustering is used alongside intensive case review/auditing, primary medical literature and expert input to generate new rules for assessing risk in the population.
Rule Testing: Logistic and linear regression are used to test the predictive capability of the proposed new rules. Those with the highest performance level are included in the models. Some other rules may be used for population stratification, but not used in our predictive models.
Model Building: Statistically developed, verified and tested rules are then integrated together using D2’s proprietary engine to assign final RI scores.
page 11Confidential and Proprietary Copyright © D2Hawkeye, Inc. All rights reserved
Presentation Outline
Objectives
Terminology and Structure of Medical Rules
Risk/Predictive Model Development
Analysis of “Impactable” Cost using the Risk Modeling System
Conclusions/Q and A

page 12Confidential and Proprietary Copyright © D2Hawkeye, Inc. All rights reserved
Analysis of Risk Modeling System: Data Preparation
Took random sample of our normative database (220,000 from overall size of 9.5M at time of analysis)
Using 3 years of data, created two time periods: Period 1: First 24 months (P1) Period 2: Last 12 months (P2)
Inclusion criteria included eligibility at the end of P1

page 13Confidential and Proprietary Copyright © D2Hawkeye, Inc. All rights reserved
Analysis of Risk Modeling System: RI grouping
In order to examine the “impactable” cost (as measured by the Care Gap Index), we group individuals by their degree of risk (as measured by the Risk Index) as shown below:
RI “Bucket” RI Range
% of Individuals
Average Age Characteristics of individuals and types of care gaps in each range
1 1-5 82% 30.7Need screening tests only
2 6-10 7% 45.6Need screening tests, some risk factor modification, and may have some chronic disease
3 11-14 5% 46.5Have chronic disease and need some recommended diagnostic testing and/or therapy
4 15-17 2% 50.6Have chronic disease, often with complications, and need more recommended diagnostic testing and/or therapy
5 18+ 4% 54.9Have chronic disease with complications, may also have some acute issues, and need more recommended diagnostic testing and/or therapy
page 14Confidential and Proprietary Copyright © D2Hawkeye, Inc. All rights reserved
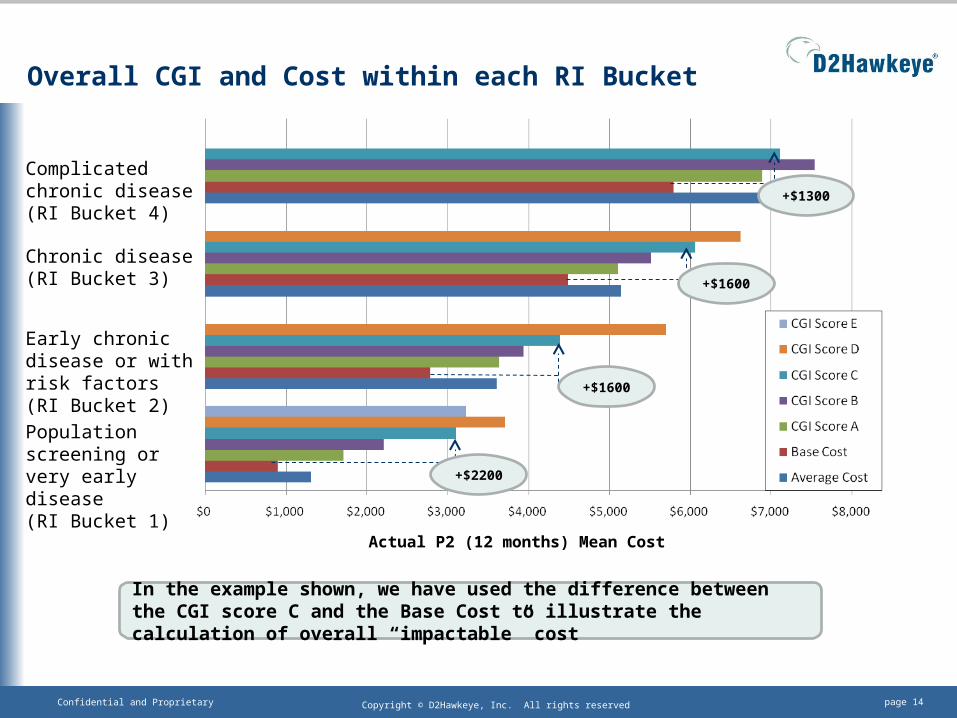
Overall CGI and Cost within each RI Bucket
+$2200
+$1600
+$1600
Complicated chronic disease(RI Bucket 4)
Chronic disease(RI Bucket 3)
Early chronic disease or with risk factors(RI Bucket 2)
Population screening or very early disease(RI Bucket 1)
Actual P2 (12 months) Mean Cost
+$1300
In the example shown, we have used the difference between the CGI score C and the Base Cost to illustrate the calculation of overall “impactable” cost
page 15Confidential and Proprietary Copyright © D2Hawkeye, Inc. All rights reserved
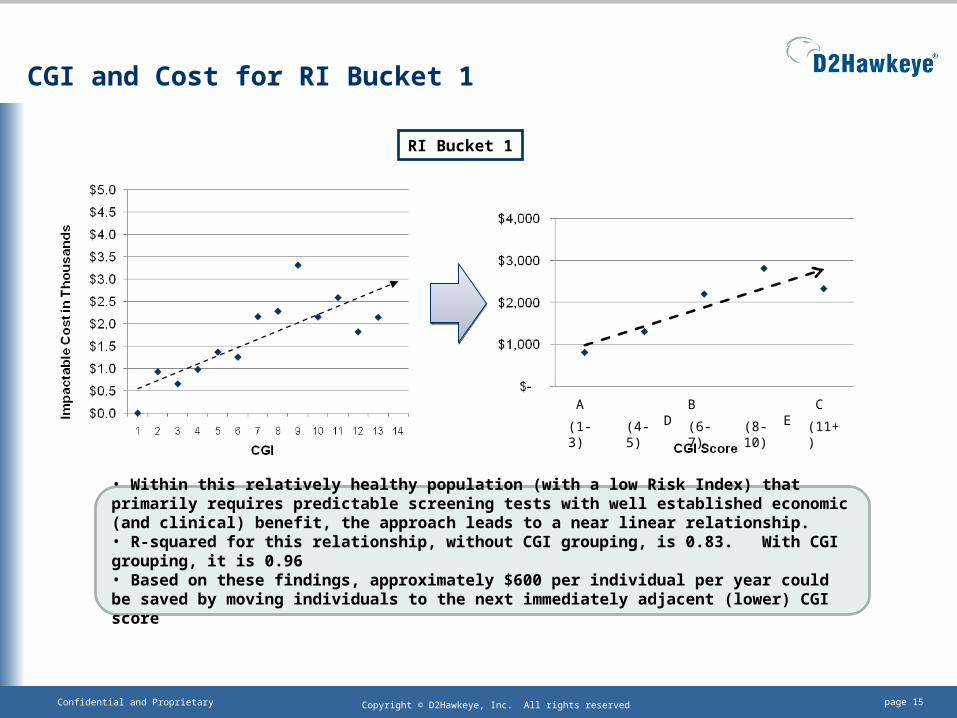
CGI and Cost for RI Bucket 1
RI Bucket 1
• Within this relatively healthy population (with a low Risk Index) that primarily requires predictable screening tests with well established economic (and clinical) benefit, the approach leads to a near linear relationship. • R-squared for this relationship, without CGI grouping, is 0.83. With CGI grouping, it is 0.96 • Based on these findings, approximately $600 per individual per year could be saved by moving individuals to the next immediately adjacent (lower) CGI score
(1-3) (4-5) (6-7) (8-10) (11+)
A B C D E
page 16Confidential and Proprietary Copyright © D2Hawkeye, Inc. All rights reserved
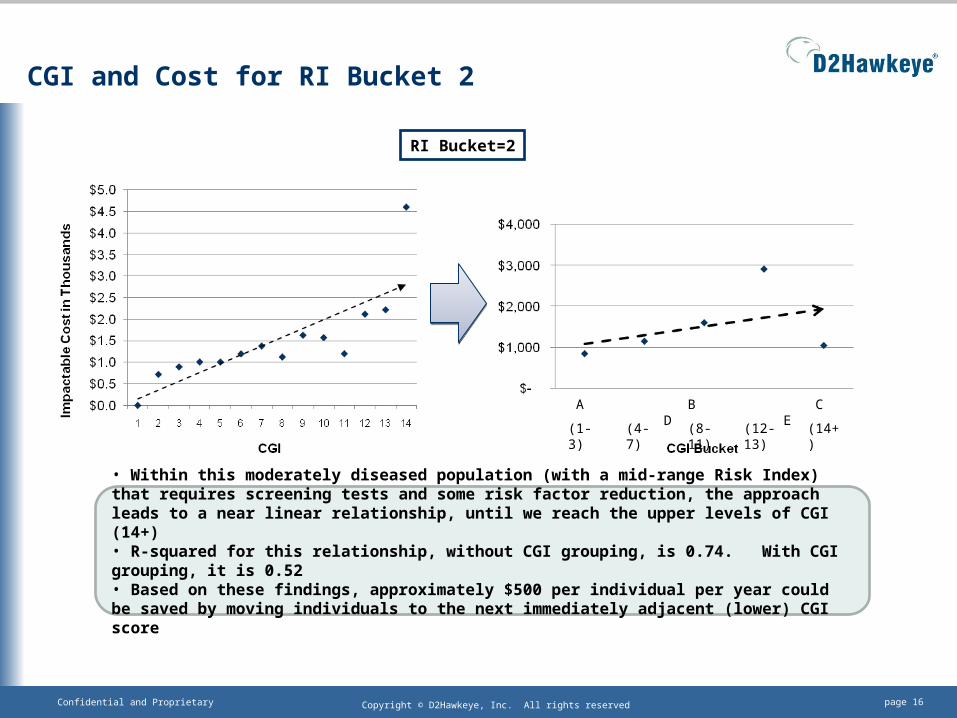
CGI and Cost for RI Bucket 2
RI Bucket=2
(1-3) (4-7) (8-11) (12-13) (14+)
A B C D E
• Within this moderately diseased population (with a mid-range Risk Index) that requires screening tests and some risk factor reduction, the approach leads to a near linear relationship, until we reach the upper levels of CGI (14+)• R-squared for this relationship, without CGI grouping, is 0.74. With CGI grouping, it is 0.52• Based on these findings, approximately $500 per individual per year could be saved by moving individuals to the next immediately adjacent (lower) CGI score

page 17Confidential and Proprietary Copyright © D2Hawkeye, Inc. All rights reserved
CGI and Cost for RI Bucket 3
(1-4) (5-8) (9-11) (12-17) (18+)
RI Bucket=3
A B C D E
• Within this diseased population (with a mid-range Risk Index) that requires screening tests, and some monitoring and therapy, the approach again leads to a near linear relationship• R-squared for this relationship, without CGI grouping, is 0.73. With CGI grouping, it is 0.97• Based on these findings, approximately $600 per individual per year could be saved by moving individuals to the next immediately adjacent (lower) CGI score
page 18Confidential and Proprietary Copyright © D2Hawkeye, Inc. All rights reserved
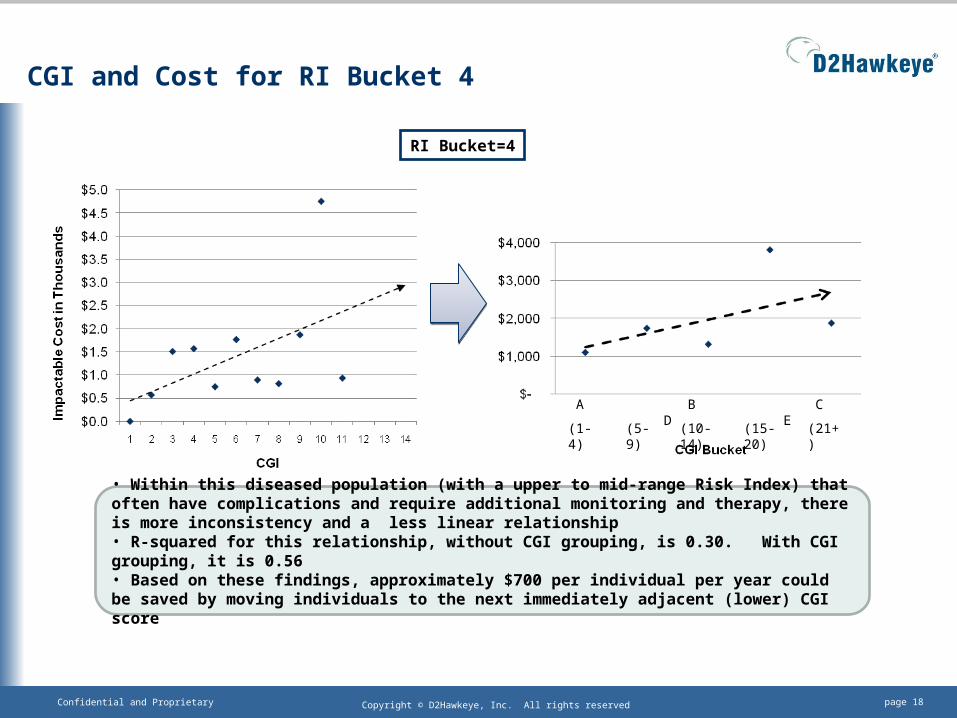
CGI and Cost for RI Bucket 4
RI Bucket=4
(1-4) (5-9) (10-14) (15-20) (21+)
A B C D E
• Within this diseased population (with a upper to mid-range Risk Index) that often have complications and require additional monitoring and therapy, there is more inconsistency and a less linear relationship• R-squared for this relationship, without CGI grouping, is 0.30. With CGI grouping, it is 0.56• Based on these findings, approximately $700 per individual per year could be saved by moving individuals to the next immediately adjacent (lower) CGI score

page 19Confidential and Proprietary Copyright © D2Hawkeye, Inc. All rights reserved
Conclusions
Our work to date demonstrates that there is a quantifiable cost associated with care gaps that exist in a commercially insured population
The estimated value of these gaps has been evaluated over a 12 month period
The value of closing care gaps depends on the population segment, as the relative proportion of different care gap types (screening, chronic disease diagnosis and monitoring, chronic disease therapy) varies
Additional study is needed to evaluate a longer follow-up time period (24 or 36 months) and to specifically track the performance of individual patients and cohorts as they move between CGI scores
Thanks for your time and attention!
page 20Confidential and Proprietary Copyright © D2Hawkeye, Inc. All rights reserved
Appendix
page 21Confidential and Proprietary Copyright © D2Hawkeye, Inc. All rights reserved
Key Findings from Risk Model Analysis
1) The D2 Longitudinal Database has been rigorously evaluated for group level cost prediction (size now 11M).
2) The Risk Index (RI) predicts PMPY cost (over the next 12 months) with high accuracy for large groups.
3) We have now defined the short term (next 12 months) amount of potentially “impactable” cost for various segments of the patient population
page 22Confidential and Proprietary Copyright © D2Hawkeye, Inc. All rights reserved
Key Finding 1: RI Group Level Prediction
Divided the random sample of the norm dataset into 2 halves
Used a linear regression model to evaluate the association between average P2 cost and RI for the first half (D2 NormA)
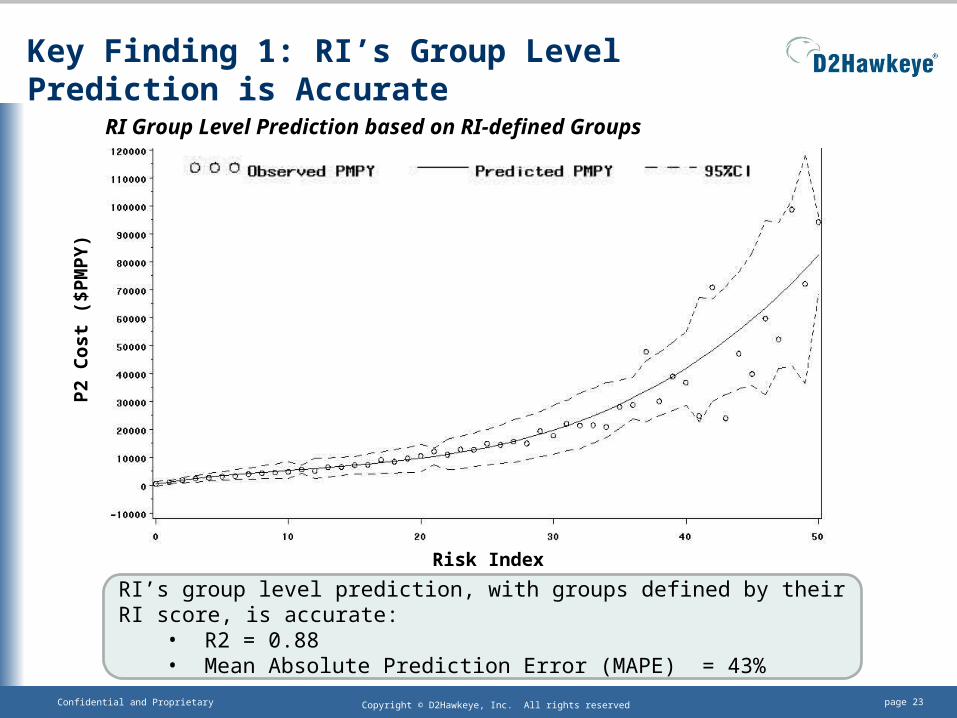
Used regression coefficients from this to predict P2 cost for the second half (D2 NormB) and compared this prediction with the actual observed values, producing: R2 = 0.88 Mean Absolute Prediction Error (MAPE) = 43%
page 23Confidential and Proprietary Copyright © D2Hawkeye, Inc. All rights reserved
Key Finding 1: RI’s Group Level Prediction is Accurate
Risk Index
P2
Co
st (
$PM
PY
)
RI’s group level prediction, with groups defined by their RI score, is accurate:• R2 = 0.88• Mean Absolute Prediction Error (MAPE) = 43%
RI Group Level Prediction based on RI-defined Groups
page 24Confidential and Proprietary Copyright © D2Hawkeye, Inc. All rights reserved
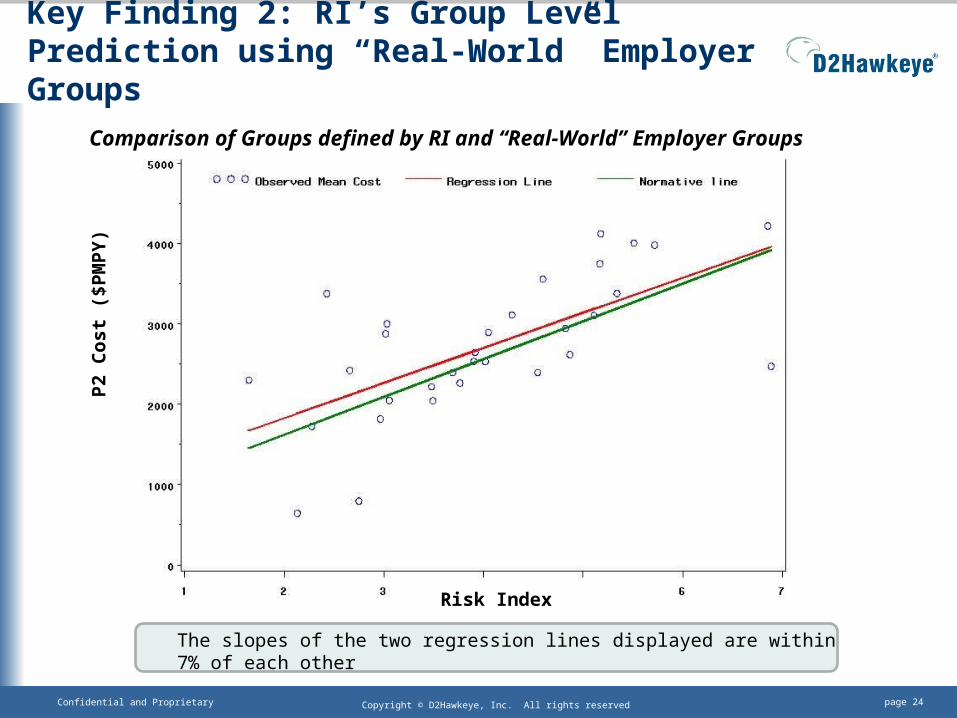
Key Finding 2: RI’s Group Level Prediction using “Real-World” Employer Groups
Risk Index
P2
Co
st (
$PM
PY
)
The slopes of the two regression lines displayed are within 7% of each other
Comparison of Groups defined by RI and “Real-World” Employer Groups

![Surya Lanka · vamana – these are detailed in the Surya Lanka medical booklet received by each guest [available in English and German]. Weather permitting, all meals are taken outside](https://img.pdfslide.us/doc/110x75/5f0f885a7e708231d444a1d6/surya-vamana-a-these-are-detailed-in-the-surya-lanka-medical-booklet-received.jpg)