Embed Size (px)
Citation preview

1
BEME Systematic Review: Predictive values of measurements obtained in medical schools and
future performance in medical practice
Topic Review Group (TRG) Hossam Hamdy1, Kameshwar Prasad2, M. Brownell Anderson3, Albert Scherpbier4, Reed
Williams5, Rein Zwierstra6 and Helen Cuddihy7
1Arabian Gulf University, Bahrain; 2All India Institute of Medical Sciences, New Delhi, India; 3Association of American Medical Colleges, Washington DC, USA; 4Maastricht University, Netherlands; 5University of Southern Illinois, USA; 6Groningen University, Netherlands; 7Monash University, Australia. Notes on contributors Hossam Hamdy MD, MCh, FRCS, PhD is Professor in the Department of Surgery & Medical Education, Dean, College of Medicine & Medical Sciences, Arabian Gulf University, BAHRAIN Kameshwar Prasad MD, DM, MSc is Professor in the Department of Neurology, All India Institute of Medical Sciences, New Delhi , INDIA M. Brownell Anderson M.Ed. is Senior Associate Vice President, Medical Education, Association of American Medical Colleges, Washington DC, USA Albert Scherpbier MD, PhD is Professor and Scientific Director, Medical Education Institute, Faculty of Medicine, Maastricht University, THE NETHERLANDS Reed Williams PhD is Professor and Vice Chairman for Educational Affairs, Department of Surgery, University of Southern Illinois, USA Rein Zwierstra MD - Director of Institute for Medical Education, Faculty of Medical Sciences, Groningen University, THE NETHERLANDS Helen Cuddihy MD, CCFP, FRACGP, PhD is in the Department of Epidemiology & Preventive Medicine, Monash University, Victoria, AUSTRALIA

2
Contents
Page
ABSTRACT …………………………………………………………… 4 INTRODUCTION ….……………………………………………………………… 6 Conceptual Framework of the Review ………………………………….……..………… 8 Review Question ………………………………………….…………….………. 9 Review Methodology ………………………………………….…………………..… 10 Data Management Techniques ………….……..…………………………………… 14 RESULTS ……………..…………………..…………………..……………………. 16 DISCUSSION ………………..…………………..…………………………………… 22 CONCLUSION ………………..…………………..………………………………….. 34 REFERENCES ………………..…………………..………………………………….. 35 CONTRIBUTORS …………………………………………………………. 45 ACKNOWLEDGEMENT …………………………………………………………. 45 FUNDING/SUPPORT ………………………………………………………………. 45 ETHICAL APPROVAL ……………………………………………………………… 45 ABBREVIATIONS ……………………………………………………………..……. 46 Appendices
Appendix 1 Initial Medline Search Result …………….……………………….………. 47 Appendix 2 Systematic Review Data Extraction Form ………………………………….. 48 Appendix 3 List of 38 Included Studies …………………….…….……………………. 51 Appendix 4 Predictors and Outcome Variables in the included Studies…….……………… 55 Appendix 5 Summary of Included Studies ………….………………………………….. 57

3
Page List of Figures & Tables Figure 1: Conceptual relation between assessment in
medical education of learning outcomes ‘predictors’ and “practice outcomes”.
…..……………….. 95
Figure 2: Correlation Coefficient between NBME I (predictor) and Supervisor rating (outcome) …..……………….. 95
Figure 3: Correlation Coefficient between NBME II (predictor) and Supervisor rating (outcome) …..……………….. 95
Figure 4: Correlation Coefficient between Clerkship GPA (predictor) and Supervisor rating (outcome) …..……………….. 96
Figure 5: Correlation Coefficient between OSCE (predictor) and Supervisor rating (outcome) …..……………….. 96
Figure 6: Correlation Coefficient between Ranking (Dean’s letter) (predictor) and Supervisor rating (outcome) …..……………….. 97
Figure 7: Correlation Coefficient between Pre-clinical GPA (predictor) and Supervisor rating (outcome) …..……………….. 97
Figure 8: Correlation Coefficient between NBME I (predictor) and NBME III (outcome) …..……………….. 97
Figure 9: Correlation Coefficient between NBME II (predictor) and NBME III (outcome) …..……………….. 98
Figure 10: Correlation Coefficient between NBME I (predictor) and American Board of Specialty Examination Scores (outcome)
…..……………….. 98
Figure 11: Correlation Coefficient between NBME II (predictor) and American Board of Specialty Examination Score (outcome)
…..……………….. 98
4
ABSTRACT
Background: Effectiveness of medical education programs is most meaningfully measured
as performance of its graduates.
Objectives: To assess the value of measurements obtained in medical schools in predicting
future performance in medical practice.
Methods:
• Search Strategy: We searched the English literature from 1955 to 2004 using
MEDLINE, Embase, Cochrane’s EPOC (Effective Practice and Organisation of Care
Group), Controlled Trial databases, ERIC, British Education Index, Psych Info,
Timelit, Web of Science and hand searching of medical education journals.
• Inclusion & Exclusions: Selected studies included students assessed or followed up to
internship, residency and/or practice after postgraduate training. Assessment systems
and instruments studied (Predictors) were the National Board Medical Examinations
(NBME) I and II, pre-clinical and clerkship grade-point average, Observed
Standardized Clinical Examination scores and Undergraduate Dean’s rankings and
honors society. Outcome measures were residency supervisor ratings, NBME III,
residency in-training examinations, American Specialty Board examination scores,
and on the job practice performance.
• Data Extraction: Data extraction by using a modification of the BEME data extraction
form study objectives, design, sample variables, statistical analysis and results. All
included studies are summarized in a tabular form.
• Data Analysis and Synthesis: Quantitative meta-analysis and qualitative approaches
were used for data analysis and synthesis including the methodological quality of the
included studies
Results: Of 569 studies retrieved with our search strategy, 175 full text studies were
reviewed. A total of 38 studies met our inclusion criteria and 19 had sufficient data to be
included in a meta-analysis of correlation coefficients. The highest correlation between

5
predictor and outcome was NBME Part II and NBME Part III, r = 0.72, 95% CI 0.30-0.49
and the lowest between NBME I and supervisor rating during residency, r=0.22, 95% CI
0.13-0.30. The approach to study the predictive value of assessment tools varied widely
between studies and no consistent approach could be identified. Overall, undergraduate
grades and rankings were moderately correlated with internship and residency performance.
Performance on similar instruments was more closely correlated. Studies assessing practice
performance beyond post-graduate training programs were few.
Conclusions: There is a need for a more consistent and systematic approach to studies of the
effectiveness of undergraduate assessment systems and tools and their predictive value.
Although, existing tools do appear to have low to moderate correlation with post-graduate
training performance, little is known about their relationship to longer-term practice patterns
and outcomes.

6
INTRODUCTION
Prediction is one of the major roles of assessment. Measurement of outcomes of medical
education and the predictive value of these measurements in relation to on-the-job
performance, i.e. postgraduate professional training and beyond, are fundamental issues in
medical education that still requires further study. Studies of academic success at medical
school and prediction of graduate’s subsequent performance have resulted in equivocal
conclusions (Pearson et al., 1998).
The multi-faceted and complex nature of being a doctor, combined with the diversity and
multi-dimensionality of the working environment, increases the difficulty of defining and
interpreting measurable and/or observable outcomes of medical education and training
programmes. A recent publication on identifying priority topics for conducting systematic
reviews in medical education listed as one of the first priority, “What are the outcomes we
should use to evaluate medical education and to what extent do measures obtained before and
in medical school predict these outcomes?” (Wolf, Shea & Albanese 2001).
Clinical competence, as outcomes of medical education, is increasingly being measured.
However, as with other concepts, there is a lack of precision and clear definition. Kane
(1992) defined clinical competency as “the degree to which an individual can use the
knowledge, skills and judgment associated with the profession to perform effectively in the
domain of possible encounters defining the scope of professional practice.” Substantial effort
has gone into defining measures of competencies in basic and higher medical education.
Epstein and Hundert (2002) defined professional competence which should be the outcome of
medical education programmes as “The habitual and judicious use of communication,
knowledge, technical skills, clinical reasoning, emotions, values and reflection in daily
practice for the benefit of the individual and community being served.” This definition
captures an important feature of professional competence which described it as a habit which
will need time to be developed.
The categories recorded for assessment of clinical competency in many programmes have
used general terms such as “knowledge base of basic and clinical sciences, history taking,
preventive care skills and ethical/legal principles.” These categories are too general to be
measured precisely and be predictive of the candidate’s future performance, which is a major

7
function of the examination. Some of the categories like skills assess the prerequisites of
performance rather than the performance itself, which includes processes and outputs (Cox
2000).
When looking into the predictive value of assessment measures in medical schools, it is
important to consider the time of measurement of outcomes along the continuum and time
line of a physician’s education, training and practice. Measurement can take place during or
at the end of undergraduate educational programmes, immediately after graduation
(internship or licensure examination), during and at the end of residency training and in
practice.
Ideally, an examination at the end of an undergraduate programme should predict whether a
student is competent and is ready for further practice and training. Competence may be
perceived in relation to a fixed reference point or, as a dynamic process in which
measurements vary in relation to the expected level of competence and the amount of
relevant experience. The measurement process should prevent false negative results, i.e.
failing a student who is competent and, in particular, false positive ones, i.e passing a student
who is incompetent, (van der Vleuten 2000).
Assessment of performance of medical school graduates during their first postgraduate year
(internship) provides an indicator of the quality of the undergraduate curriculum and
educational process, and serves as a quality assurance measure for those involved in
undergraduate and early postgraduate training (Rolfe et al., 1995). Medical school grades
are widely accepted measures of performance quality. It is assumed, without supportive
evidence, that the grades provide a basis for predicting future performance in the workplace.
The more we move away from the exiting point of the education programme, the more
difficult becomes the measurement, the “noise” increases (Gonnella et al., 1993).
Observation of performance for purposes of student appraisal in medical schools is done with
the goal of extrapolating and generalizing competence that extends beyond the tasks
observed.
8
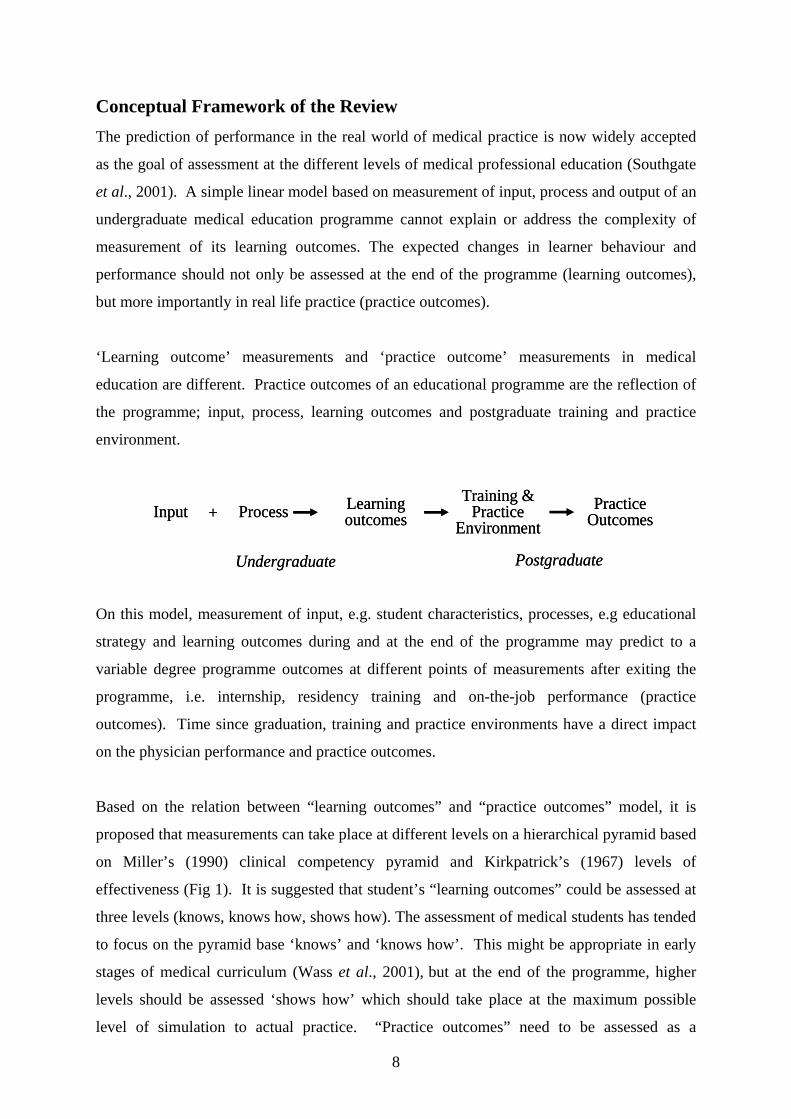
Conceptual Framework of the Review The prediction of performance in the real world of medical practice is now widely accepted
as the goal of assessment at the different levels of medical professional education (Southgate
et al., 2001). A simple linear model based on measurement of input, process and output of an
undergraduate medical education programme cannot explain or address the complexity of
measurement of its learning outcomes. The expected changes in learner behaviour and
performance should not only be assessed at the end of the programme (learning outcomes),
but more importantly in real life practice (practice outcomes).
‘Learning outcome’ measurements and ‘practice outcome’ measurements in medical
education are different. Practice outcomes of an educational programme are the reflection of
the programme; input, process, learning outcomes and postgraduate training and practice
environment.
Input Process Learning outcomes
Training & Practice
EnvironmentPractice
Outcomes+
Undergraduate Postgraduate
Input Process Learning outcomes
Training & Practice
EnvironmentPractice
Outcomes+
Undergraduate Postgraduate
On this model, measurement of input, e.g. student characteristics, processes, e.g educational
strategy and learning outcomes during and at the end of the programme may predict to a
variable degree programme outcomes at different points of measurements after exiting the
programme, i.e. internship, residency training and on-the-job performance (practice
outcomes). Time since graduation, training and practice environments have a direct impact
on the physician performance and practice outcomes.
Based on the relation between “learning outcomes” and “practice outcomes” model, it is
proposed that measurements can take place at different levels on a hierarchical pyramid based
on Miller’s (1990) clinical competency pyramid and Kirkpatrick’s (1967) levels of
effectiveness (Fig 1). It is suggested that student’s “learning outcomes” could be assessed at
three levels (knows, knows how, shows how). The assessment of medical students has tended
to focus on the pyramid base ‘knows’ and ‘knows how’. This might be appropriate in early
stages of medical curriculum (Wass et al., 2001), but at the end of the programme, higher
levels should be assessed ‘shows how’ which should take place at the maximum possible
level of simulation to actual practice. “Practice outcomes” need to be assessed as a

9
performance on-the-job ‘Does’. The impact of the performance could be considered as the
highest level of practice outcomes (Ram 1998). This model represents a combination of
assessment principles, the current development of theoretical views on medical expertise, and
takes account of the difference between competence and performance (Schmidt, Norman &
Boshuizen 1990; Rethans 1991).
The conceptual framework which guided the systematic review is looking primarily at the
predictive validity of scores or assessment of student performance in medical schools
generated by different assessment systems and instruments used in measuring learning
outcomes, “Predictors”, and future performance of the graduates and its ultimate impact on
health, “Practice Outcomes”
Fig 1: Conceptual relation between assessment in medical education of learning outcomes
‘predictors’ and “practice outcomes”.
Review Question
To what extent do measurements obtained in medical schools predict outcomes in clinical
practice: performance during internship, residency programmes, on-the-job and its impact on
health care?

10
Review Methodology
A) Inclusion Criteria
For studies to be eligible for inclusion in the systematic review, they must have all of
the following:
(i) Study subjects: Medical students assessed or followed up to internship,
residency and/or practice after postgraduate training
(ii) Predictors – Independent Student ratings/scores of assessments in
variables: ‘Learning medical schools, pre-clinical and clinical
outcomes’ phases and evaluation of student clinical
competencies
(iii) Outcome variables a) Assessment scores of performance
Dependent variables: in residency or internship programmes
‘Practice Outcomes’ b) Scores of medical licensure examination
or specialty board certification
examination
c) Health outcomes in terms of quality of
life of patients, mortality or patient
satisfaction, costs of care
(iv) Study design: Studies with the following designs will be
selected:
a) prospective follow-up study of medical
students up to internship/residency/ practice
b) retrospective analysis of correlation
between predictors and outcome variables

11
B) Exclusion criteria: Studies meeting the inclusion criteria will be excluded from the
review if they were only reviews, contained only interim analysis of some studies with
final analysis included through subsequent publication and if they were duplicate
publications.
C) Search Strategy and Sources: The search was conducted across a comprehensive
range of sources in several stages.
In 2001, an initial broad scoping search was performed across the key medical and
educational databases, ERIC, MEDLINE, Psych Info, Web of Science and Timelit.
Significant relevant papers were identified prior to this search, and strategies were
drawn up to ensure each of these papers would be retrieved by the scoping search. A
series of filtering strategies were developed to remove false hits.
The full search included electronic and non-electronic sources. Multiple Medline
searches were conducted and manageable results lists were reviewed. These searches
utilised the most appropriate subject headings available, and employed limits to handle
very large results sets. The Medline searches were enhanced by searches across other
databases, including Embase, Cochrane’s EPOC (Effective Practice and Organisation
of Care Group) and Controlled Trial databases, and the British Education Index.
The non-electronic search was critical in identifying papers that the databases were
unable to realistically produce in manageable quantities. In addition to
recommendations from experts, we also conducted hand-searches across key medical
education journals: Medical Teacher, Academic Medicine, Medical Education and
Teaching and Learning in Medicine.
An updating search was conducted in May 2004 to retrieve new research published
since the start of the group’s work. This search was limited from 2001 to the latest
citations and was run across Medline, Embase, Evidence Based Medicine Reviews
(including Cochrane), SPORTdiscus, AMED, HMIC, ERIC and BEI. The search
strategies used were sensitive, but were not designed for maximum sensitivity, given
the impracticality of the massive number of irrelevant citations that would have
resulted.

12
The Medline search strategy combined MeSH that described aspects of the study
population, predictors and outcomes; exp Professional Competence/, exp Education,
Medical, Undergraduate/, Internship and Residency, Schools, Medical/, Students,
Medical/ Achievement/, Certification/, Educational Measurement/, Forecasting/,
Longitudinal Studies/, Predictive Value of Tests/, Evaluation Studies/, Program
Evaluation.
To reinforce the results of all searches, a separate cited reference search was conducted
on the Web of Science. Each of the papers included for review from the first search
results (as well as several from the updating search) was searched for papers that cited
it and papers that it cited.
D) Selection methods: Selection of the studies was done by two independent reviewers
applying the above criteria to papers obtained through the search strategy outlined
above. Discrepancy in the list of included studies was resolved through discussion.
Inter-observer consistency was measured using kappa statistics.
E) Assessment of Methodological Quality of Included Studies: The methodological
quality of the included studies were appraised, guided by the questions developed by
BEME for assessing the quality of a research-based educational study (Harden et al.,
1999), using the following criteria:
1. Prospective or retrospective Cohort: Prospective Cohort studies collect data for the
purpose of correlating performance of students with their later performance as residents
and practitioners. The data obtained can be complete and of high quality through the use
of validated instruments and suitability for the purpose. Retrospective cohort studies
have to depend on the extent and type of data collected in the past and cannot have
control over their completeness or quality. Prospective studies therefore, were rated
higher than the retrospective studies.
2. Sample: Selection of subjects was considered unbiased if an entire batch of students are
included in a prospective follow-up study or all practitioners / residents or interns or a
random sample of those working in a setting are included in a retrospective study.

13
3. Data Collection:
a. Similarity of correlated construct: The degree of correlation depends on the extent of
similarity between the construct. For example, clinical competence shows stronger
correlation with clinical knowledge examination scores (e.g. NBME II) than with
basic science examination scores (NBME I). The studies correlating clinical
measures were rated higher than those correlating basic science knowledge with the
clinical measures after graduation.
b. Psychometric characteristics of measuring instruments: Reliability of the
instruments measuring the predictor and criterion variables affect the degree of
correlation between them. Generally, the correlation tends to be alternated because
the instruments are practically never perfectly reliable. Accordingly, the studies
reporting the reliability of the instruments were graded higher than those not
reporting it. The report, even if indicating low reliability, allows estimation of the
degree of attenuation and report disattenuated correlation. Similarly, the instruments
need to have established validity. Invalid instruments affect the magnitude of the
observed correlation.
4. Data Analysis:
a. Use of appropriate statistics: The choice of correlation statistics depends on the
distribution of scores and nature of relationship between the predictor and criterion
variables. For example, the Pearson product-moment correlation would be
appropriate if the distribution of both the predictor and criterion variables are
bivariate normal and if the relationship between the two are linear.
b. Attrition bias/Response Rate: Prospective studies may lose subjects during follow-
up and retrospective studies are influenced by natural attrition of subjects due to
summative evaluations at various stages after graduation. Thus the final set of data
may represent the restricted range of eligible subjects. The degree of attrition
bias/response rate may affect the magnitude of observed correlation.

14
c. Disattenuation of correlation co-efficient: Reporting disattenuation of correlation was
considered a quality issue as it would adjust the correlation coefficient for lack of
perfect reliability of the scores.
Data Management Techniques
A) Data Extraction
The data extraction form was developed, pre-tested and standardised to meet the
requirement of the review (Appendix 2). Two reviewers independently extracted the
data. The agreement between the two reviewers was assessed using Phi co-efficient
because Kappa gave misleadingly low values in presence of low marginal figures.
Both quantitative and qualitative data were extracted.
B) Data Analysis and Synthesis
1. Criteria for addressing the combinability of the studies
1.1. Similarity in timing of measurements: Studies to be combined were selected on
the basis of similarity in the timing of measurement of predictor(s) and the
outcome variables.
1.2. Similarity in assessment methods: The correlations between measures before
and after graduation depended on the degree of similarity between the methods
of assessment. For example, the knowledge in medical school assessed by
objective examinations would correlate better with the knowledge assessed by
objective examinations taken after graduation. Therefore, before combining the
results of the independent studies, the extent of similarity of assessment
methods was examined.
1.3. Inspection of point estimates and confidence intervals: The quantitative data
were displayed graphically as forest plot using meta-analysis software (initially
generated using Comprehensive Meta-Analysis version 1.0.23 (1998) and then
transferred to SPSS for Windows version 12 to generate the actual graphs).

15
The correlation coefficient point estimates were inspected to determine
closeness to each other. The overlap of their confidence intervals was
examined to determine the extent of similarity between the results of the
independent studies.
1.4. Test of homogeneity: Statistical tests of homogeneity “Q statistics” were
performed to examine whether the observed parameters are similar between the
independent studies. P-value of 0.1 or greater was accepted as indicating
‘homogeneity’.
2. Estimating the Combined Correlation Coefficient Point Estimates
These were determined using random or fixed effects model depending on the
results of the homogeneity test. If the P-value of the test was 0.1 or more, then
fixed effects model was used, whereas if it was less than 0.1, then random effects
model was used.
C) All included studies were summarized in a tabular format capturing main findings
relevant to the review.

16
RESULTS
Search Results
Over 20,000 unique hits were returned. Their titles were visually scanned to eliminate
obviously irrelevant results. Five hundred and sixty (2.8%) titles were considered potentially
relevant for abstracts review. The specificity of the scoping search (percentage of the total
that was relevant to the topic) was remarkably low. While this initial search did demonstrate
that the topic would prove problematic, it also revealed that there was a suitable amount of
evidence to assess for systematic review.
Selection of Studies
The reviewers scanned the titles and abstracts of the 569 papers retrieved by the search
strategy. One hundred and seventy five papers were considered potentially relevant for
further review. Full versions of the papers were obtained for evaluation. Two reviewers
independently applied the eligibility criteria on these papers. The inter-observer agreement
was substantial (kappa = 0.71; percent agreement 89%) All papers selected for inclusion or
exclusion by either of the reviewers was discussed. Differences were resolved through
discussion. The screening process eliminated 137 citations that did not meet the review
inclusion criteria. Thirty-eight citations were identified eligible for the review (Appendix 3
& 6).
Overview of the Studies Included in the Review
Thirty-eight studies were included: One paper appeared in 1956, three in 1960’s, two in
1970’s, six in 1980’s, 15 in 1990’s and 11 in the year 2000’s (up to 2004).
Thirty-two studies were from United States, three from Canada and one each from United
Kingdom, Australia and New Zealand.
Assessment of methodological quality of the studies Two reviewers independently applied the criteria for the assessment of methodological
quality of the included studies. For each of the quality criteria, the papers were rated as
‘met’, ‘not met’ or ‘unclear/not applicable’. One study met all the seven validity criteria

17
(Brailovsky et al, 2001), 16 studies met four criteria and 25 met two validity criteria. Twenty
nine studies were retrospective cohort, five survey studies (Peterson et al, 1956, Clute 1963,
Price, 1969, Fish et al, 2003 & Richards et al, 1962) and four prospective cohort studies
(Probert, et al, 2003, Zu et al, 1998, Gonella et al, 2004 & Wilkinson et al, 2004). Only one
study (Brailovsky et al., 2001) was prospective and reported the disattenuated correlation
coefficients. Thirty-five studies had at least one construct similarity between predictor and
outcome. The sample in all cohort studies consisted of an entire batch of students. All
studies had a percentage of non-respondents. Only one study (Pearson et al, 1993) presented
a comparison of the characteristics of respondents and non-respondents. However, we
analyzed all the papers, qualitatively and quantitatively, so long as they met the inclusion
criteria and had relevant data.
The inter observer agreement of the quality criteria were as follows: study design = 84%,
sample selection = 32%, Phi = 0.15, similarity of construct = 100%, reliability of instruments
= 79%, phi = 0.64, justification of statistics used = 21%, phi = -0.2, attrition/respondent bias
= 21%, phi = -0.2, dissatentuation = 100%. For study design, similarity of construct and
dissattentuation, phi coefficients were not estimable because one observer gave the same
value to all the studies. The disagreements were due to different interpretation and unclear
reporting in the studies of the quality criteria. However, all disagreements were resolved
through discussion.
A wide variation was found in the methods, scales of measurements, analytical strategies and
reporting styles. Psychometric characteristics of instruments were presented in a few studies.
The reliability of the measures of predictor variables was given in three papers, while that for
the outcome variables was given in five papers. The nature of the instruments was not
described in detail. Only one paper reported reliability of both predictor and outcome
variable. The most common outcome measure, “supervisor rating”, varied from study to
study (e.g. scales used 25 to 33 items).
Tables in Appendix 5 present main characteristics, results and summary of conclusions in the
38 included studies.
There was a large variation in the method of analysis as well. Nineteen studies reported
Pearson correlation coefficient and thirteen had regression analysis. The correlation

18
coefficients in the 19 studies formed the basis of our meta-analysis. They were organized
around three outcome variables, Figs 2 – 11).
A. Supervisor rating during residency: was the outcome variable in eight studies, four had
NBME I and NBME II as predictors, two had clerkship GPA as predictors and two had
all the three predictors. Results for each predictor are presented below:
i) NBME I : The Pearson correlation coefficients of the nine data sets in eight studies
are plotted in Figure 2. All the point-estimates indicate a positive correlation. The
confidence intervals of the results overlap with each other. The test of heterogeneity
is significant (Q value = 25.166, Df = 8, P = 0.0015) indicating lack of homogeneity
of the results, but visual inspection of the point estimates and the confidence interval
indicates an acceptable level of similarity in the results. The combined results (using
random effects model) yielded low correlation (Pearson r = 0.22; 95%, CI 0.13 to
0.30).
ii) NBME II : Results from seven data sets in six studies are shown in Figure 3. All the
point-estimates indicate a positive correlation. The confidence intervals of the five-
studies (except Smith, 1993) overlap with each other. The test of heterogeneity is
also significant (Q value = 26.539; Df = 6, P = 0.0002). The summary correlation
coefficient using random effects model is 0.27 (95%, CI 0.16 to 0.38) indicating a
low correlation.
iii) Clerkship GPA : The results from 11 data sets in ten studies are shown in Figure 4.
All the point estimates indicate a positive correlation in all the studies with
overlapping confidence intervals. The test of heterogeneity is also significant (Q
value = 46.87, Df = 10, P = 0.0005) but, visual inspection of the point estimates and
confidence intervals indicate an acceptable level of similarity in the results across the
studies. The combined correlation coefficient using random effects model showed a
low correlation (Pearson r = 0.28, 95%, CI 0.22 to 0.35).
iv) OSCE : Five studies had OSCE as the predictor variable as shown in Figure 5. The
correlation coefficients were similar. Test of heterogeneity was non-significant (Q
value = 1.0267, Df = 3, P = 0.7948). The combined correlation coefficient using
fixed effects model was low (Pearson r = 0.37; 95%, CI 0.22 to 0.50).

19
v) Ranks based on Dean’s letter: Three data sets from two studies lent themselves to
meta-analysis for this predictor. The correlation coefficients were similar as shown
in Figure 6. The test of heterogeneity was non-significant (Q value = 0.024, Df = 2,
P = 0.988). The combined estimate of correlation coefficient using fixed effects
model indicated low correlation (Pearson r = 0.22; 95%, CI 0.12 to 0.31).
vi) Pre-Clinical GPA : Only four studies, five data sets had this predictor with
supervisor rating as the outcome. All the point estimates indicated positive
correlation of similar magnitude as shown in Figure 7. The confidence intervals
were overlapping. The test of heterogeneity was non-significant (Q value = 0.7399,
Df = 4, P = 0.9463). The combined estimate, using fixed effects model, indicated
low correlation (Pearson r = 0.25; 95%, CI 0.19 to 0.31).
The reliability of the measuring scale of the supervisor ratings were given in four studies
(Markert 1993) 0.964, (Paolo et al., 2003) 0.98, (Fine et al., 1995) 0.8, (Hojat et al.,
1986), 0.86.
B. NBME III: Two studies correlated NBME I & II with NBME III scores. Both had a
large sample size: 628 for Markert et al., (1993) and 2368 for Hojat et al., (1993).
Between NBME I and NBME III, the correlation coefficients, in the two studies, were
similar as shown in Figure 8. Test of heterogeneity was statistically non-significant (Q
value = 1.798, Df = 1, P = 0.18). The combined correlation coefficient using fixed
effects model was 0.59 (95% CI 0.57 to 0.61). Between NBME II and NBME III, the
correlations were similar as shown in Figure 9. Test of heterogeneity was statistically
non-significant (Q value = 0.207, Df = 1, P = 0.649). The combined correlation
coefficient based on fixed effects model was (Pearson r = 0.72; 95%, CI 0.70 to 0.73).
These coefficients were substantially higher than the ones seen with the outcome
supervisor rating. One study with six data sets correlated clerkship examination scores
and NBME III (Rabinowitz, 1989). The correlation coefficient between different
clerkship scores (predictor) and NBME III ranged between r=0.32 to 0.49.
C. American Board of Specialty Examinations: Three studies, five data sets correlated
NBME I scores as predictor and American Board of Specialty Examination as outcomes
lent themselves for meta-analysis. The point estimates were close to each other and
confidence intervals were overlapping. The test of heterogeneity was non-significant (Q

20
value = 6.86, df = 3, P = 0.076). The combined correlation coefficient as shown in
Figure 10, using fixed effects model, was moderately good (Pearson r = 0.58; 95%, CI
0.54 to 0.62).
One study, (Figure 11), with three data sets correlated NBME II scores as predictor and
American Board of Medical Specialty examination scores. Point estimates were close to each
other and confidence intervals overlapping. Test of heterogeneity was significant. The
combined correlation coefficient using random effect model was moderately good (Pearson r
= 0.61, 95%, CI 0.51 to 0.70).
The reviewed studies and the meta-analysis showed that the correlations between the
predictor variables of assessment in undergraduate medical education and supervisor ratings
were lower than with NBME I and II as predictors and NBME III and American Board of
Medical Specialty Examinations as outcomes, although they were both statistically
significant.
Some of the main findings in other studies with predictors and outcomes not included in the
meta-analysis are summarized as follows:
The only study, (Brailovsky, 2001), giving disattentuated correlation coefficients showed
moderate to high correlation between script concordance scores at the end of clerkship and
clinical reasoning at the end of residency training.
Clerkship honor grades and honors society (Amos et al, 1996, Kron et al, 1985), student rank
(Amos et al, 1996, Blacklow et al, 1993) and clerkship GPA (Arnold et al, 1993) predicted
residency clinical performance and passing the written boards on the first attempt. Overall
GPA in medical schools can predict performance in internship (average r=0.4), (Fincher,
Lewis and Kuske, 1993).
The large study (6656 medical students) of Gonella, Erdmann and Hojat (2004) examined the
predictive value of number of grades in medical schools and performance on USMLE III and
supervisor rating during residency year one. They concluded that rating of clinical
competence beyond medical schools are predictive by number grades in medical schools.

21
The only recent study (Tamblyn et al, 2002) on predicting process of care from final year
MD examination scores showed statistically significant association (Table 33, Appendix 5).

22
DISCUSSION
This systematic review was conducted to determine to what extent measurements obtained in
medical schools can predict outcomes in clinical practice; performance during internship,
residency programmes, on-the-job and their potential impact on health. The effectiveness of
medical education programmes is inseparable from the effectiveness of their products and the
most meaningful measure of effectiveness is performance in practice.
The Search and Selection of Studies
Retrieving evidence for a systematic review in medical education is problematic, and the
work done by the BEME Collaboration has highlighted the difficulties with systematic
searching within the educational discipline (Haig & Dozier 2003). The sources of evidence
that contain medical education research (primarily databases of peer reviewed literature) are
either medical or educational, they rarely describe medical education content adequately –
and frequently even lack the descriptors to do so. In this review the search strategies were
made less sensitive (to reduce the number of false hits); some of the highly relevant papers
identified were invariably missed.
Additional methods were therefore required to augment the search. The group used a variety
of proven methods (hand-searches, experts in the field and cited reference searches) to
improve the comprehensiveness of the retrieval. Achieving a measure of absolute saturation
is rarely possible when systematically searching for evidence, but there are methods to realise
when further searching is likely to be redundant. One such example is reaching the point
where a cited reference search no longer produces unseen results from either the initial paper
or any of its derivatives. Although the review topic proved challenging, these additional
methods employed ensured that the outcome was systematic and most probably
comprehensive.
This BEME review group highlighted these problems. A systematic review requires a
comprehensive search of all relevant sources, yet without satisfactory descriptors, the
searching proved difficult. Where adequate descriptors did exist (e.g. for the undergraduate
population) they were applied sporadically while other key concepts had no satisfactory
descriptor (e.g. predictive values/indicators of future performance). Given enough resources
it would have been possible to sift through results lists numbering in the tens of thousands,

23
but this is unrealistic for a single review group. Indeed, even with a strategy designed for
maximum sensitivity it is unlikely that all relevant citations for this topic would be retrieved.
However, several problems were encountered. Out of the 175 potentially relevant reviewed
studies, only 38 were found suitable for inclusion despite multiple strategies used to identify
relevant studies. The inclusion criteria were identified in the light of the conceptual design of
the study mainly looking at the relation between measurement of learning outcomes as
predictors and practice outcomes including practice during residency training and beyond.
This approach led to the exclusion of other predictors like psychosocial characteristics of
students and other measures of outcomes, like board certification status, medical school
faculty appointments, speed of career progression, research publications and stress burnout
and satisfaction. All these have been reported in the literature as indicators of physician’s
professional success (Hojat et al, 1997, McManus, 2003, & West, 2001).
Assessment of the methodological quality of the studies
Lack of standard reporting style of the results and their statistical analysis made it difficult to
rank the studies according to their quality criteria. A quality criterion may or may not be met
based on the reporting style. The reporting is particularly limited in four elements of study
quality: a) the psychometric characteristics of the measures of predictors and outcomes; (b)
justification of statistics used; (c) comparison of characteristics of respondents and non-
respondents; and (d) disattenuation. The question whether a study was of poor quality or the
authors did not consider it important to report some of the above elements is difficult to
resolve. Recent studies have begun to address the above limitation (Brailovsky et al, 2001).
This review points to the need for regular reporting of the above elements of study quality in
correlation studies. Strict application of a high quality threshold would have excluded a large
number of the included studies. However, we have followed an inclusive approach as
recommended by BEME.
The relation between predictors and outcomes
The results of the systematic review indicated that analysis of the performance after
graduating from the medical school is complex and cannot be susceptible to one type of
measurement. Clinical competence is not uni-dimensional. It is a multifaceted entity, and the
strength of relationships with medical school performance measures varies depending upon
conceptual relevance of the measures taken during and after medical school (e.g., the pre-
clinical GPAs yields more overlap with physicians’ medical knowledge than with physicians’

24
interpersonal skills). This expected pattern of relationship has been empirically confirmed.
(Hojat et al, 1986, Hojat et al, 1993).
Medical education changes across the continuum of undergraduate medical education,
postgraduate training and unsupervised practice performance. The latter is difficult to
measure and predicting practice performance years after formal training is even more
difficult. In the 1960’s studies showed lack of relationship between medical school academic
performances (GPA) and practice performance (Price 1969). Although lack of correlation
was explained on the basis of restriction of range, Price et al., (1964) argued that it was
relatively unimportant.
In the 1970’s, Price et al., (1973) and Wingard & Williamson (1973), published two
evaluative literature reviews on grades as predictors of physicians’ career performance. The
main findings of these reviews indicated that, at that time, very little data on this subject
existed with little or no correlation between the two factors. However, these studies were
limited by the type of measures used to predict performance in practice.
In the 1980’s, studies have used a broader range of assessment procedures, including
clinically-based measures, to investigate the association between academic performance and
competence during the early postgraduate years (Gonnella & Hojat 1983). These studies
revealed weak relationships between medical school grades and performance in postgraduate
training (Erlandson et al., 1982). Quattlebaum (1989) supported the view that attempts to
predict performance during residency based largely on measures of cognitive ability have
been unsuccessful.
In the 1990’s Taylor & Albo (1993) studied physicians’ performances and their relations to
two predictors: performance of medical students in their academic years (one and two) and
their clinical years (three and four). In this study correlation between 167 physicians’
medical school grades and 61 composite performance scores ranged from -0.25 to 0.28. This
poor correlation also applied to sub-groups based on the number of practice years and
specialties. This position that performance during medical school does not differentiate
applicants who will perform well during residency from those who will perform poorly was
supported by Brown et al., (1993) and Borowitz et al,. (2000). These studies indicated that
the complex competencies needed for a physician to perform effectively are poorly measured
by academic scores obtained through measurements which examine a narrow band of the
25
extremely complex total spectrum of skills, abilities and performances of practicing
physicians.
There have been many explanations for the weak association between medical school and
postgraduate performance and the inconsistent findings of previous research (Wingard &
Williamson 1973; Gonnella et al., 1993). These include deficiencies in traditional grading
systems or an inherent inability of grades to indicate the transformation of potential into the
workplace, the effect of intervening experience between the time of academic training and
subsequent career evaluation, and the failure of the selection processes of traditional medical
schools to identify students with the characteristics which might be prerequisite for successful
performance (changing mind sets: knowledge, skills, behaviors, and professionalism) in the
work environment (Pearson et al., 1998).
The correlation between performance measures in medical school and in practice is always an
under-estimated index of relationship, because of the exclusion of those in the lower tail of
performance distribution in medical school due to attrition. Attrition always restricts the
range of the grade distribution, leading to less overlap and shrinkage of correlations. This and
other conceptual and methodological issues involved in predicting physician performance
from measures of attainment in medical school have been reported (Gonella et al, 1993).
Other researchers have established a moderate relationship between academic performance at
the medical school and practice performance, with higher correlations when an attribute is
evaluated by a similar assessment method (Hojat et al., 1993; Makert 1993).
Predicting Performance during Post-Graduate Training
In this systematic review we were able to combine in a meta-analysis the correlation
coefficients from only 19 out of the included 38 studies. This was due to:
1. Variability of the measured predictors in medical schools, 25 variables could be
identified from the included studies. Some had objective measurements e.g. NBME /
USMLE scores and other subjective measurements, e.g. ranking using Dean’s letter or
Honours Society ‘AOA’.
2. Variability of the outcomes and how they were measured. Four outcome measures
were identified in the included studies of the meta-analysis, NBME III, supervisor’s

26
ratings during internship and different years of residency training, in-training
examination of residents, and American Board of Medical Specialties Examination.
The meta-analysis demonstrated that summary correlations between NBME/USMLE I and
supervisor rating during internship or first year residency, was low (0.22), though statistically
significant and consistent with previous longitudinal study data of Hojat et al., (1993),
Gonnella et al., (1993) and Bermer et al., (1993). However, correlation of NBME I and
NBME II with NBME III and American Board of Specialty Examinations was moderately
high (0.6 – 0.7) and statistically significant.
Although significant improvement is taking place in student assessment in the clinical years,
the problem of measurement of clinical competence of physicians in training is a complex
and daunting task. The complexity of professional competence necessitates the use of
multiple assessment methods to evaluate performance. Despite the availability of several
evaluation tools, how objective resident supervisors are about the evaluation of the clinical
performance of their trainees remains unclear (Holmboe & Hawkins 1998).
It may be debatable whether specific assessment instruments like OSCE should be included
in the systematic review. We believe that OSCE is an important instrument relatively
recently incorporated in the assessment of medical students and its predictive validity should
be assessed. In this systematic review, the correlation coefficient between OSCE and
supervisor rating yielded a summary estimate of 0.30 (95%, CI 0.24 to 0.37) suggesting a low
correlation. The weak correlations, although statistically significant, obtained from several
studies looking into the predictive value of constructs assessed by OSCE as interpersonal
skills, data collection and physical examination skills and residents supervisors rating could
be explained on the basis that assessment of residents does not evaluate objectively the same
constructs as assessed by the OSCE in the undergraduate programme. Another explanation
could be the failure to correct for disattenuation.
The study by Rutala et al., (1992) showed that OSCE scale was best predictor of performance
rated by the residency directors. The highest correlation was the one evaluating interpersonal
skills, r = .42. Other OSCE domains had a lower positive correlation, differential diagnosis r
= .28, decision making r = .28. The study by Probert et al., (2003) on 30 medical students
demonstrated that OSCE showed consistent positive association with consultant ratings of
their performance at the end of the pre-registration year. Other improved methods of

27
assessment of clinical competencies in medical schools, like the post-clerkship clinical
examination PCX, has demonstrated that the correlation with the first year residency
supervisors ratings ranged from .16 to .43, mean .32 (Vu et al., 1992).
Recent reports from the longitudinal study of the Jefferson Medical College showed that the
number grades in medical schools can predict the performance on medical licensure exams
and clinical competence ratings in the first postgraduate year (Gonnella et al., 2004).
Some studies explored how cognitive factors (data gathering and analysis skills, knowledge,
first to fourth year GPA and NBME I and II) and non-cognitive factors (interpersonal skills
and attitudes) assessed during medical student training predicted postgraduate clinical
competence (Heneman 1983; Martin et al., 1996). These studies showed that cognitive
factors can account for up to 51% of the variance in NBME III grade (Markert 1993).
Our results indicated the importance of measurements of similar constructs in order to find
out a positive and strong association. The correlation between clerkship GPA as predictor
and supervisor rating during residency as outcome (r=0.3) was higher than other predictors in
the preclinical phase (NBME I r=0.18). Studies in the 1960’s and 1970’s supported the view
that grades and evaluations during clinical clerkships correlated well with performance
during residency (Kegal-Flom 1975, Gough 1963, Richard 1962), particularly in the clerkship
related to the field of residency chosen by the student (Keck et al., 1979). Another predictor
which was not included in our study is evaluation by peers, which was found to be a better
predictor of future internship success than were estimated by preclinical and clinical faculty
(Korman, 1971).
The study by Brailovsky et al., (2001) on Script Concordance between students and final year
residents, demonstrated the importance of measurements of similar constructs at two different
levels of expected performance (medical students and final year residents) along the
continuum of medical education and practice. In this study, scores obtained by students at
the end of clerkship using script concordance (SC) test predicted their clinical reasoning
performance at the end of residency measured by OSCE, short answer management problems
and simulated office orals. They reported generalisability coefficiencies for OSCE 0.717
(n=181), short answer management problems 0.816 (n=769), and simulated office orals 0.478
(n-769).

28
Predicting On-The-Job Practice Performance
The complex nature of measuring performance in practice should consider the conceptual
difference between competence and performance of physicians. Competence “what a doctor
is capable of doing” i.e. under test conditions, and performance as ‘what he or she actually
does in day-to-day practice’ (Rethans 1991). This concept was further described by Epstein
and Hundert (2002) when defining professional competence as the habitual application of
knowledge, skills and attitudes in the care of patients. Competence and performance criteria
are structural and procedural measures, thus representing moderate variables in the sense of
surrogates for relevant and ultimate end points of measurement: the outcome criterion
“improvement or maintenance of patient’s health”.
Assessing the quality of health care as a reflection of impact of physician performance is
complicated. Donabedian (1998) argues that in measuring quality, we need to assess not only
the performance of practitioners but the contributions of patients and family, the structural
attribute of the health care setting, the process of care and its outcomes.
In this systematic review we were able to find few studies which looked into the relationship
between medical school measurements and on-the-job performance beyond residency. Four
studies fulfilled our inclusion criteria (Peterson et al., 1956, Clute, 1963, Price, 1964 and
Tamblyn et al., 2002). Tamblyn et al., (2002) investigated scores on Canadian licensure
examinations taken immediately at the end of medical school and prediction of clinical
behaviours 4-7 years later. This study was included in our systematic review as the Canadian
licensure examination could be considered similar to a final year MD examination which
measures students’ learning outcomes at the point of exiting from the programme. The study
showed that scores on the Canadian licensure examination were a significant predictor of
practice performance. In this study indicators of practice performance were selected on the
basis of unexplained practice variations, and/or their association with the outcomes or costs
of care: e.g. 1) Mammography screening rate was used to assess preventive care; 2)
Continuity of care because of its importance in prevention and chronic disease management;
3) The differences between disease-specific and symptom-relief prescribing rate and
contraindicated prescribing rate; 4) Contraindicated prescribing, which accounts for 20% of
drug related adverse events and 5) Consultation rate was used as an indicator of resource use
because referral determines access to higher cost specialty care.

29
Assessing the relationship between examination scores and more objective measures of
quality of care is difficult due to the complexity of evaluation of optimal and actual practice.
Setting standards of practice and its measurement should not only consider quantitative data
obtained from assessment scores commonly obtained from examinations which attempt to
measure “competence”, but should consider qualitative outcomes, like patient satisfaction,
efficiency, outcome of consultation and impact of health education (Prideaux et al., 2000,
Tamblyn et al, 1994). The process of care could also be considered as reflection of
performance, e.g. Screening and preventive services; diagnosis and management; prescribing;
counseling and condition-specific processes of care (e.g. whether diabetics receive foot
exams).
One of the main problems with studying postgraduate clinical performance is establishing a
comparable scoring system for assessing competence in the different specialties. This is
known as the “criterion problem” and confronts the predictions of success in all jobs, not only
medicine (Ferguson et al. 2002). One solution to this problem has been to develop
competency-based models of care and specific skills through detailed job analysis of
individual medical specialties (Viswesvaran et al., 1996, Patterson et al., 2000).
Instruments used in measuring performance of residents and practicing physicians should
have an acceptable degree of validity and reliability. Global rating which forms the primary
basis for appraising clinical skills suffer from several sources of bias which involve cognitive,
social and environmental factors which affect the rating, not only the instruments. Research
showed that patterns of measuring instruments account for no more than 8% of the variance
in performance ratings (Williams et al., 2003).
Standards of practice should be developed in relation to a core of common health problems or
presentations encountered in the specific domain of practice. Sampling performance in
relation to a core of health problems and health indicators should allow generalisation of the
results and avoid restricting the assessment to a small number of patients. Measurement of
performance should not be limited to technical aspects and knowledge, but should also
consider attitudes (Tamblyn 1994). An interesting study (Papadakis et al., 2004) looked into
the unprofessional behaviour of students in medical school and if it is associated with
subsequent disciplinary action by a state medical board. It was found that the prevalence of
problematic behaviour was 38% in the cases and 19% in the controls (odds ratio 2.15). These

30
findings indicated the importance of professionalism as an essential competency to be
demonstrated by a student to graduate from medical school.
Personal and psychosocial attributes are important facets of the physician’s clinical
competence which few empirical studies have looked into. With regard to issues of
psychosocial predictors of the academic and clinical performances of medical students, they
found that selected psychosocial attributes could significantly increase the validity of
predicting performances on objective examinations (Hojat et al., 1988, Hojat et al, 1993, and
Herman et al., 1983). Hojat, 1996 suggested that a significant link exists between selected
psychosocial measures and physician clinical competence. Although assessing psychosocial
attributes of the medical students was not part of the inclusion criteria in our systematic
review, it is important to be considered and needs to be further studied.
The studies included in the systematic review provided evidence to support a relationship
between measurements used in medical school and performance during residency. The
magnitude of the correlation was higher when the predictors and outcomes measurements
were based on objective written examination, e.g. NBME/USMLE I, II and III. On the other
hand, Fine, et al, (1995) suggested that academic performance measures have been over
emphasized as predictors of physicians performance in residency training.
Recent Developments in Outcome Measurements in Medical Education
During the late 1990’s the issue of measurements of educational outcomes of undergraduate
medical education and postgraduate residency training programmes, became an important
international activity of several organisations responsible for medical education. This global
activity is trying to look into three basic questions related to quality medical education: What
to measure?; How best can we measure? and Is there a relation between what is measured and
quality of practice.
In the US, the Accreditation Committee of Graduate Medical Educators (ACGME), the
American Board of Medical Specialties (ABMS) and the American Association of Medical
Colleges (AAMC), adopted six general competencies for evaluating residents and practicing
physicians. The American Association of Medical Colleges (AAMC) and its accreditation
committee (LCME) linked the medical school objectives to these competencies recognising
them as learning outcomes, but at a lower level of expectation than that of the residency
programmes (Stevens, 2000). In Canada, the Royal College of Surgeons (RCS) have

31
developed the CanMed 2000 which defines the expected competencies of residency
programmes. In Europe the General Medical Council (GMC) in the UK and the Royal
Colleges, have restructured their residency programmes. The World Federation for Medical
Education (1998, 2003) developed global standards for basic medical education, postgraduate
training and continuing professional development
In the Middle East the committee of Deans of Medical Colleges “Fourteen Colleges” in six
Gulf States, United Arab Emirates, Saudi Arabia, Qatar, Oman, Kuwait, and Bahrain,
developed accreditation standards and outcomes of undergraduate medical education
(Guideline on Minimum Standards for Establishing and Accrediting Medical Schools in the
Arabian Gulf Countries, 2001). The World Health Organization (WHO) Eastern
Mediterranean office (EMRO) is leading a multinational project in the region to develop
standards for accreditation of medical schools.
Defining global core of learning outcomes for undergraduate medical education, postgraduate
residency training and continuing professional development should be organized around
similar constructs. The six competencies of ACGME “Patient care, knowledge, ethics and
professionalism, communication skills, practice-based learning and system-based practice”
can be a model for such constructs which could be measured at different levels and phases of
the professional life of a physician. The Dreyfus and Dreyfus (2001) taxonomy of levels of
performance, which include novice, competent, proficient, expert, and master have the
implication on progressive proficiency and can help in measuring performance at the end of
medical school, residency training and beyond. The subjectivity of this taxonomy requires
the identification of descriptors to improve its objectivity and valid, reliable instruments of
measurements.
We hope that the conceptual model of this systematic review and its findings can provide the
best available evidence on the predictive values of current assessment measurement in
medical schools and future performance in medical practice which should be considered in
the measurement of quality in medical education

32
Limitations of the Systematic Review
1. An important limitation of this review is the language bias. It is highly probable that
there are publications on the topic elsewhere (Liu et al, 1990). Future cooperation with
Colleagues can help in reviewing publications in French, Spanish and German in future
updating of the review which we hope to do.
2. The results of this systematic review were based on studies mainly from the USA and the
assessment systems reported are only used in the USA like NBME/USMLE, honours
societies (AOA) and Dean’s letters. This raises the issue of generalisability of the
predictive validity of the assessment measurements. On the other hand, it is possible to
find similarity which could be generalized when looking at the construct to be measured,
eg. NBME I = Basic medical science knowledge; NBME II = application of knowledge in
clinical sciences.
3. Meta-analysis of regression coefficients from various studies were not done because the
reported regressions did not adjust for the same variables across different studies.
Future Direction
1. This systematic review emphasised the problems in retrieving evidence for medical
education as a whole. The importance of employing additional methods to enhance the
standard approach of searching a few core databases cannot be underestimated. While
these methods will obviously require additional skills, time and resources, they are vital
to ensuring that the systematic review is based on all available evidence. Not only are
these additional methods more effective than trying to process massive lists of false hits,
but they will almost certainly return relevant results that databases currently cannot.
Although the coverage and description of medical education content has improved
considerably in the last few years, there is substantial room for further improvement. By
drawing attention to these challenges, and continuing to make efforts, currently
underway, to overcome them (METRO Project 2004), the BEME Collaboration can make
a significant contribution to improving accessibility to the available evidence in medical
education.

33
2. The review identified some common measures of performance in practice beyond
residency training which might be considered for future studies. These include patient
outcomes and impact of the performance on health, like mortality and morbidity of
common health problems in a given community, newer outcomes like patient satisfaction,
functional status of patients, cost effectiveness of management or intermediate outcomes
like better control of diabetes, HbA1c and lipid levels of diabetics may give indirect
indication of physician performance and its impact.
3. Similarity of the data collection methods and statistical analysis of the results will help in
increasing the homogeneity between the research results and will allow for their
combinability which will increase the strength of the evidence. It is recommended that
studies should:
a) report reliability of the data collection method ‘measurement instrument’;
b) use similar statistical analysis, e.g. Pearson’s Correlation with report of confidence
interval;
c) cognitive, social and environmental sources of bias in performance ratings should be
considered in developing measurement instruments
d) disattenuated correlation coefficients needs to be reported.
e) whenever there are attrition and/or non-respondents in the studies, a comparison of
characteristics of respondents and non-respondents need to be presented to allow
assessment of attrition/respondents bias.
e) report the justifications of statistics used. For example, while using Pearson’s
correlation, an indicator of whether the relationship between predictor and outcome is
linear and their distribution is bivariate normal needs to be given.
4. Medical schools and residency training programmes need to conduct longitudinal studies
on their graduates. The Jefferson study is a model for this type of research (Gonnella et
al., 2004).

34
CONCLUSION
1. The studies included in the review and meta-analysis provided statistically significant
mild to moderate correlations between medical school assessment measurements and
performance in the internship and residency. Basic science grades and clinical grades can
predict residency performance.
2. Performances on similar instruments of measurements are better correlated such as:
NBME II scores with NBME III scores
Medical school clerkship grades and supervisor rating of residents
OSCE and supervisor rating of residents when similar constructs are assessed
3. No consistent statistical analysis was used in reporting the relationship between the
predictors and outcome variables. Only a few studies reported reliability of the
measurement instruments and disattenuation. The methodological shortcomings of past
research in testing predictive validity needs to be addressed and sound models for
assessing it needs to be further studied, e.g longitudinal profile development, cross
validation and inspection of the adjusted R2 (Renger R., et al, 1994).
4. Evidence on predictors of performance in practice beyond residency training is rare and
weak. New measures of performance in practice, such as ‘patient outcomes’ and ‘process
of care’ might be considered for future studies.
5. The difficulty in searching encountered in this systematic review indicated the importance
that medical education journals should encourage the use of an agreed controlled
vocabulary; Key words and MeSH words which describe instruments and variables used
in student and physician assessment and in reporting outcomes of medical education.

35
REFERENCES
Accreditation Council for Graduate Medical Education (ACGME) Outcome Project: General
Competencies. 2000) [Online]. Available at http://www.acqme.org/Outcome/.
Alexander, G.L., Davis, W.K., Yan, A.C. & Fantone, J.C. 2000, ‘Following Medical School
Graduates into Practice: Residency Directors’ Assessments after the First Year of Residency’,
Academic Medicine, vol. 75, no. 10, pp. S1517.
Amos, D.E. & Massagli, T.L. 1996, ‘Medical School Achievements as Predictors of
Performance in a Physical Medicine and Rehabilitation Residency’, Academic Medicine, vol.
71, no. 6, pp. 678-680.
Arnold, L. & Willoughby, T.L. 1993, ‘The Empirical Association between Student and
Resident Physician Performances’, Academic Medicine, vol. 68, no. 2, pp. S35-S40.
Bell, J.G., Kanellitsas, I., & Shaffer, L. 2002, ‘Selection of obstetrics and gynecology
residents on the basis of medical school performance’, Am J Obstet Gynecol, vol. 186, no. 5,
pp. 1091-94.
Best Evidence Medical Education, Centre for Medical Education, Dundee, UK. 2002
[Online] Available at: http://www.bemecollaboration.org.
Borowitz, S.M., Saulsbury F.T., & Wilson W.G. 2000, ‘Information collected during the
residency match process does not predict clinical performance’. Arch Pediatr Adolesc Med,
vol. 154, no 3, pp 256-60.
Blacklow, R.S., Goepp, C.E. & Hojat, M. 1993, ‘Further Psychometric Evaluations of a
Class-ranking Model as a Predictor of Graduates’ Clinical Competence in the First Year of
Residency’, Academic Medicine, vol. 68, no. 4, pp. 295-297.
Boyse, T.D., Patterson, S.K., Cohan, R.H., Korobkin, M., Fitzgerald, J.T., Oh, M.S., Gross,
G.H. & Quint, D.J. 2002, ‘Does Medical School Performance Predict Radiology Resident
Performance?’, Acad Radiol, vol. 9, pp 437-445.

36
Brailovsky, C., Charlin, B., Beausoleil, S., Cote, S. & Vleuten, Van der. 2001, ‘Measurement
of clinical reflective capacity early in training as a predictor of clinical reasoning performance
at the end of residency: An experimental study on the script concordance test’, Medical
Education, vol. 35, pp.430-436.
Callahan, C.A., Erdmann, J.B., Hojat, M., Veloski, J.J., Rattner, S., Nasca, T.J. & Gonnella,
J.S. 2000, ‘Validity of Faculty Ratings of Students’ Clinical Competence in Core Clerkships
in Relation to Scores on Licensing Examinations and Supervisors’ Ratings in Residency’,
Academic Medicine, vol. 75, no. 10, pp.S71-73.
Case, S.M. & Swanson, D.B. 1993, ‘Validity of NBME Part I and Part II Scores for
Selection of Residents in Orthopedic Surgery, Dermatology and Preventive Medicine’,
Academic Medicine, vol. 68, no. 2, pp. S51-S56.
Clute, K.F. 1963, ‘The General Practitioner: A Study of Medical Education and Practice in
Ontario and Nova Scotia. Toronto: University of Toronto Press.
Comprehensive Meta-Analysis Version 1.0.23 Biostat. 1998. [Online] Available at:
http://www.meta-analysis.com
Cox, K. 2000, ‘Examining and Recording Clinical Performance: A Critique and some
Recommendations’, Education for Health, vol. 13, no. 1, pp. 45-52.
Donabedian, A. 1998, ‘The Quality of Care’, JAMA, vol. 260, no. 12, pp. 1743-1748.
Dreyfus, S.E. & Dreyfus, H.L. 2001, ‘A five stage model of the mental activities involved in
directed skill acquisition. Unpublished manuscript supported by the Air Force Office of
Scientific Research under contract F49620-79-C-0063 with the University of California,
Berkeley. Dreyfus H. On the Internet. New York, NY: Routledge Press.
Epstein, R.M. & Hundert, E.M. 2002, ‘Defining and Assessing Professional Competence’,
JAMA, vol. 287, no 2, pp. 226-235.

37
Erlandson, E. E., Calhoun, J. G., Barrack, F. M., Hull, A. L., Youmans, L. C., Davis, W. K.
& Bartlett, R.H. 1982, ‘Resident selection: Applicant selection criteria compared with
performance’, Surgery, vol. 92, pp. 270-5.
Ferguson, E., James, D., Madeley, L. 2002, ‘Factors associated with success in medical
school: systematic review of the literature’, BMJ, vol. 324, pp. 952-957.
Fincher, R-M.E., Lewis, L.A. & Kuske, T.T. 1993, ‘Relationships of Interns’ Performances
to their Self-assessments of their Preparedness for Internship and to their Academic
Performances in Medical School’, Academic Medicine, vol. 68, no. 2, pp. S47-S50.
Fine, P.L. & Hayward, R.A. 1995, ‘Do the Criteria of Resident Selection Committees Predict
Residents’ Performances?’, Academic Medicine, vol. 70, no. 9, pp. S34-S38.
Fish, D.E., Radfar-Baublitz, L.S., Choi, H. & Felsenthal, G. 2003, ‘Correlation of
Standardized Testing Results with Success on the 2001 American Board of Physical
Medicine and Rehabilitation Part 1 Board Certificate Examination’, Am J Phys Med Rehab,
vol. 82. no. 9, pp 686-691.
Gonnella, J. S. & Hojat, M. 1983, ‘Relationship between performance in medical school and
postgraduate competence’, Medical Education, vol. 58, pp. 679-85.
Gonnella, J. S., Hojat M, Erdmann, J. B. & Veloski, J. J. 1993, ‘A case of mistaken identity.
Signal and noise in connecting performance assessments before and after graduation from
medical school’, Academic Medicine, vol. 68, pp. S9-16.
Gonnella, J.S., Erdmann, J.B. & Hojat M. 2004, ‘An empirical study of the predictive
validity of number grades in medical school using 3 decades of longitudinal data:
implications for a grading system’, Medical Education, vol. 38, pp. 425-434.
Guidelines for Basic Surgical Training. 1997 Edinburgh: The Royal College of Surgeons of
Edinburgh.

38
Gunzburger, L.K., Fraizier, R.G., Yang, L.M., Rainey, M.L. & Wronski. T. 1987,
‘Premedical and medical school performance in predicting first-year residency performance’,
Journal Medical Education, vol. 62, pp. 379-384.
Haig, A. & Dozier, M. 2003, BEME Guide No 3: Systematic Searching for Evidence in
Medical Education – Part 1: sources of information. Medical Teacher, vol. 25, no. 4, pp.
352-63.
Harden , R.M., Grant, J., Buckley, G., & Hart, I.R. 1999, ‘BEME Guide No 1: Best Evidence
Medical Education’. Medical Teacher, vol. 21, no. 6, pp 3-15.
Heneman, R.L. 1983, ‘The effects of time delay in rating and amount of information
observed on performance rating accuracy’, Academy of Management Journal, vol. 26, pp.
677-86.
Hermen, M.W., et al., (1983). ‘Validity and importance of low ratings given to medical
graduates in non-cognitive areas. Journal of Medical Education, vol. 58, pp 837-843.
Hojat, M., et al., (1997). The fate of medical students with different levels of knowledge: Are
the basic sciences relevant to physician competence. Advances in Health Sciences Education,
vol. 1, pp. 179-196.
Hojat, M., Gonnella, J. S., Veloski, J. J. & Erdmann, J. B. 1993, ‘Is the glass half full or half
empty? A re-examination of the association between assessment measures during medical
school and clinical competence after graduation’, Academic Medicine, vol. 68, no. 2, pp.
S69-76.
Hojat, M., Veloski, J.J. & Borenstein, B.D. 1986, ‘Components of clinical competence
ratings: An empirical approach. Education Psychology Measurements, vol. 46, pp. 761-9.
Holmboe, E.S. & Hawkins, R.E. 1998, ‘Methods of evaluating the clinical competence of
residents in internal medicine: A review’, Annals of Internal Medicine, vol. 129, pp. 42-8.

39
Kahn, M.J., Merrill, W.W., Anderson, D.S. & Szerlip, H.M. 2001, ‘Residency program
director evaluations do not correlate with performance on a required 4th-year objective
structured clinical examination’, Teaching & Learning in Medicine, vol. 13, no. 1, pp. 9-12.
Kane, M.T. 1992, ‘The assessment of professional competence’, Evaluation & the Health
Professions, vol. 15, pp.163-82.
Kirkpatrick, D.I. 1967, ‘Evaluation of Training’, in Training and development handbook,
eds. R Craig & I. Mittel. New York, McGraw Hill.
Korman, M., & Stubblefield, R.L. 1971, ‘Medical Schools Evaluation and Internship
Performance. Journal of Medical Education, vol. 46, pp. 670-73.
Kron, I.L., Kaiser, D.L., Nolan, S.P., Rudolf, L.E., Muller, W.H. & Jones, R,S. 1985, ‘Can
Success in the Surgical Residence be Predicted from Pre-residency Evaluation?’, Annual
Surgery, vol. 202, pp. 694-695.
Loftus, L.S., Arnold, L., Willoughby, T.L. & Connolly, A. 1992, ‘First-year Residents’
Performances Compared with their Medical School Class Ranks as Determined by Three
Ranking Systems’, Academic Medicine, vol. 67, no. 5, pp. 319-323.
Markert, R. J. 1993, ‘The relationship of academic measures in medical school to
performance after graduation’, Academic Medicine, vol. 68, no. 2, pp. S31-4.
Martin, J.A., Reznick, R.K., Rothman, A, Tamblyn, R.M. & Regehr, G. 1996, vol. 71, pp.
170-5.
McManus, I.C., Smithers, E., Partridge, P., Keeling, A., Fleming, P.R. 2003. ‘A levels and
intelligence as predictors of medical careers in UK doctors: 20 year prospective study’, BMJ,
vol. 327, pp 139-142.
METRO Project 2004. [Online, 7th June 2004). Available at:
http://srv1.mvm.ed.ac.uk/metro/index/asp

40
Miller, G.E. 1990, ‘The assessment of clinical skills/competence/performance’, Academic
Medicine, vol. 65, no. 9, pp. S63-S67.
Paolo, A.M. & Bonaminio, G.A. 2003, ‘Measuring Outcomes of Undergraduate Medical
Education: Residency Directors’ Ratings of First-Year Residents’, Academic Medicine, vol.
78, no. 1, pp. 90-95.
Papadakis, M.A., Hodgson, C.S., Teherani, A. & Kohatsu, N.D. 2004, ‘Unprofessional
behavior in medical school is associated with subsequent disciplinary action by a state
medical board’, Academic Medicine, vol. 79, No. 3. pp. 244-249.
Patterson, F., Ferguson, E., Lane, P., Farrell, K., Martlew, J., Wells, A. 2000, ‘A competency
model for general practice: implications for selection, training and development. Br J Gen
Pract, vol. 50, pp. 188 -93.
Pearson, S-A., Rolfe, I. E. & Henry, R. L. 1998, ‘The relationship between assessment
measures at Newcastle Medical School (Australia) and performance ratings during
internship’, Medical Education, vol. 32, pp. 40-45.
Peterson, O.L., Andrews, L.P., Spain, R.S. & Greenberg, B.G. 1956, ‘An Analytical Study of
North Carolina General Practice’ Part 2, J. Medical Education, vol. 31, pp. 1-165.
Price, P.B., Taylor, C.W., Nelson, D.E., Lewis, E.G., Loughmiller, G.C., Mathiesen, R.,
Murray, S.L. & Maxwell, J.G. 1973, ‘Measurement and predictors of physician performance:
Two decades of intermittently sustained research’, Salt Lake City, Utah: Aaron Press.
Price, P.B. 1969, ‘Search for excellence’, American Journal of Surgery, vol. 118, pp. 815-
821.
Price, P.B., Taylor, C.W., Richards, J.M. & Jacobsen, T.C. 1964, ‘Measurement of Physician
Performance’, J. Medical Education, vol. 39, pp. 203-211.
Prideaux, D., Alexander, H., Bower, A., Dacre, J., Haist, S., Holly, B., et al., 2000, ‘Clinical
teaching: maintaining an educational role for doctors in the new health care environment’,
Medical Education, vol. 34, no. 10, pp. 820-6.

41
Probert, C.S., Cahill, D.J., McCann, G.L. & Ben-Shlomo Y. 2003, ‘Traditional finals and
OSCEs in predicting consultant and self-reported clinical skills of PRHOs: a pilot study’,
Medical Education, vol. 37, pp. 597-602.
Rabinowitz, H.K., Hojat, M. A., 1989 ‘ Comparison of the modified essay question and
multiple choice question formats: their relationship to clinical performance. Family
Medicine, vol. 21, no 5, pp 364-367.
Ram, P. 1998, ‘Comprehensive assessment of general practitioners: a study on validity,
reliability and feasibility’, (Thesis) Maastricht.
Rethans, J-J. Does competence predict performance? Standardized patients as a mean to
investigate the relationship between competence and performance of general practitioners.
[Thesis] Amsterdam: Thesis Publishers 1991.
Renger, R., & Meadows, L. 1994 ‘Testing for Predictive Validity in Health Care Education
Research: A Critical Review’, Academic Medicine, vol. 69, no. 8, pp. 685-687.
Richards, J.M., Taylor, C.W. & Price, P.B. 1962, ‘The prediction of Medical Intern
Performance’, J Applied Psychology, vol. 46, pp. 142-146.
Rolfe, I.E., Andren, J.M., Pearson, S., Hensley, M.K. & Gordon, J.J. 1995, ‘Clinical
competence of interns in New South Wales, Australia’, Medical Education, vol. 29, pp. 225-
30.
Ronai, A.K., Golmon, M.E., Shanks, C.A., Schafer, M.F., Brunner, E.A., 1984, ‘Relationship
between past academic performance and results of specialty in-training examinations. J Med
Educ, vol. 59, no 4, pp 341-344.
Rutala, P.J., Fulginiti, J.V., McGeagh, A.M., Leko, E.O., Koff, N.A. & Witzke, D.B. 1992,
‘Validity studies using standardized-patient examinations: standardized patient potpourri’,
Academic Medicine, vol. 67, No. 10, pp. S60-62.

42
Schmidt, H., Norman, G., Boshuizen, H.A. 1990, ‘Cognitive perspective on medical
expertise: theory and implications’, Academic Medicine, vol. 65, pp. 611-21.
Sosenko J., Stekel K.W., Soto R., & Gelbard, M., 1993, ‘NBME Examination Part I as a
predictor of clinical and ABIM certifying examination performances. J Gen Intern Med, vol.
8, no 2, pp :86-8.
Smith, S.R. 1993, ‘Correlations between Graduates’ Performances as First-Year Residents
and their Performances as Medical Students’, Academic Medicine, vol.. 68, no. 8, pp. 633-
634.
Southgate, L., Hays, R. B., Norcini, J., Mulholland, H., Ayers, B., Wolliscroft, J. et al., 2001,
‘Setting performance standards for medical practice: a theoretical framework’, Medical
Education, vol. 35, pp. 474-481.
Stevens, D.P. 2000, ‘Three questions for the LCME’, Academic Medicine, vol. 75, no. 10,
pp. 960-1.
Tamblyn, R., Abrahamoqicz, M., Dauphinee, W.D., Hanley, J.A., Noricini, J., Girard, H.,
Grand Maison, P., Brailovski, C. 2002, ‘Association between licensure examination scores
and practice in primary care’, J American Medical Association, vol. 288, no. 23, pp. 3019-
3026.
Tamblyn, R.M. 1994, ‘Is the public being protected? Prevention of suboptimal medical
practice through training programs and credentialing examinations’, Evaluating Health
Professions, vol. 17, pp. 198-221.
Tamblyn, R.M., Benaroya, S., Snell, L., McLeod, P, Schnarch, B., Abrahamowicz, M. 1994.
‘The Feasibility and Value of Using Patient Satisfaction Ratings to Evaluate Internal
Medicine Residents’, Journal of General Internal Medicine, vol. 9, no. 3, pp. 146-152.
Taylor, C.W. & Albo, D. 1993, ‘Measuring and predicting the performances of practicing
physicians: An overview of two decades of research at the University of Utah’, Academic
Medicine, vol. 68, No. 2, pp. S65-67.

43
The Executive Council, The World Federation for Medical Education. 1998, International
standards in medical education: assessment and accreditation of medical schools’ educational
programs. A WFME position paper. Medical Education, vol. 32, pp. 549-58.
Tomorrow’s Doctors: Recommendations on Undergraduate Medical Education. Issued by
the Education Committee of the General Medical Council. 1993. [Online] Available at
http://www.gmc-uk.org/med_ed/tomdoc.htm
Van der Vleuten, C. 2000, ‘Validity of final examinations in undergraduate medical
training’, Bahrain Medical Journal, vol. 321, pp. 1217-19.
Viswesvaran, C., Ones, D. & Schmidt, F. 1996, ‘Comparative analysis of the reliability of
job performance ratings’, Journal of Applied Psychology, vol. 81, pp. 557-74.
Vu, N.V., Barrows, H.S., Marcy, M.L., Verhulst, S.J., Colliver, J.A. & Travis, T. 1992, ‘Six
years of comprehensive, clinical, performance-based assessment using standardized patients
at the Southern Illinois University School of Medicine’, Academic Medicine, vol. 67, No. 1,
pp. 42-50.
Vu, N.V., Distlehorst, L.H., Verhulst, S.J. & Colliver, J.A. 1993, ‘Clinical Performance-
based Test Sensitivity and Specificity in Predicting First-Year Residency Performance’,
Academic Medicine, vol. 68, no. 2, pp. S41-S45.
Wass, V., van der Vleuten, C., Shatzer, J. & Jones, R. 2001, ‘Assessment of clinical
competence’, The Lancet, vol. 357, pp. 945-949.
Wilkinson, T.J. & Frampton, C.M. 2004, ‘Comprehensive undergraduate medical
assessments improve prediction of clinical performance’, Medical Education, vol. 38,
pp.1111-16.
West, P.A. 2001, ‘Calibre of people recruited to medicine may be too high for the job
[letter]’, BMJ, vol 322, pp. 1361.

44
Williams, R.G., Klamen, D.A. & McGaghie, W.C. 2003, ‘Cognitive, Social and
Environmental Sources of Bias in Clinical Performance Ratings’, Teaching and Learning in
Medicine, vol. 15 No. 4, pp. 270-92.
Wingard, J. R., & Williamson, J. W. 1973, 'Grades as predictors of physicians career
performance. An evaluative literature review’, Medical Education, vol. 48, pp. 311-22.
Wolf, F.M., Shea, J. A. & Albanese, M. A. 2001, ‘Toward Setting a Research Agenda for
Systematic Reviews of Evidence of the Effects of Medical Education’, Teaching and
Learning in Medicine, vol. 13, no. 1, pp. 54-60.
World Federation for Medical Education. Postgraduate Medical Education. WFME Global
Standards for Quality Improvement. WFME, Copenhagen 2003. [Online] Available at:
http://www.wfme.org.
Yindra, K.J., Rosenfield, P.S. & Donnelly, M.B. 1998, ‘Medical School achievements as
predictors of residency performance’, Journal Medical Education, vol. 63, pp. 356-363.
Zu, G., Veloski J.J., & Hojat, M. 1998, ‘Board Certification: Associations with Physicians’
Demographics and Performances during Medical School and Residency’, Academic
Medicine, vol. 73, no. 12, pp.1283-1289.

45
CONTRIBUTIONS H. Hamdy and K. Prasad developed the systematic review protocol and worked on all aspects
of the review from conceptualization to the writing of the final manuscript. M.B. Anderson
contributed to the literature search and writing of the review. A. Scherpbier, R. Williams, R.
Zwierstra conducted the hand search and advised on the methodology and writing of the
review. H. Cuddihy contributed to the literature search and writing of the review.
ACKNOWLEDGEMENT The authors are grateful to Mr Alex Haig, Information Scientist, Lister Postgraduate Institute,
Edinburgh for his help in developing the search strategy and literature search. A special
thanks goes to Professor Joseph Gonella, Director, Center for Research in Medical Education
and Health Care, Thomas Jefferson University, USA and Professor Gordan Guyatt, Clinical
Epidemiology and Biostatistics and Medicine, Faculty of Health Sciences, McMaster
University, Canada, for their valuable comments. We would also like to thank Mr Emad
Maswadi for his valuable statistical support and in producing the plot graphs.
We would like to thank all the experts in Medical Education and the reviewers who provided
us with constructive advice.
A special thanks to Mrs Aldina Archibald and Mrs Olive Wagstaff for the typing of the
manuscript.
FUNDING This project was funded through the Research Fund of the Arabian Gulf University, Bahrain.
ETHICAL APPROVAL Approval was given by the BEME Organization and the Research and Ethics Committee of
the Arabian Gulf University in Bahrain.

46
ABBREVIATIONS AAMC = American Association of Medical Colleges
ABMS = American Board of Medical Specialties
ABS = American Board of Specialty
ACGME = Accreditation Committee of Graduate Medical Educators
AOA = Alpha Omega Association “Honors Society”
BEME = Best Evidence in Medical Education Collaboration
EMRO = Eastern Mediterranean Office
GMC = General Medical Council
NBME = National Board of Medical Examinations
RCS = Royal College of Surgeons
USMLE = US Medical Licensure Examinations
WFME = World Federation of Medical Education
WHO = World Health Organization

47
Appendix 1
Initial Medline Search Result
Terms used
Hits found
'Professional behavior' & 'Undergraduate Medical Education'
12
'Physician* Performance' & 'Clinical Performance' (Limitation- 23/5/1996-23/5/2001, Review, Human)
80
'Undergraduate Medical Education' & 'Clinical Performance'
549
'Physician* Performance' & 'Clinical Performance'
170
'Clinical Performance' & 'Undergraduate Medical Education'
3
'Physician* Performance' & 'Undergraduate Medical Education' (Limits 23/5/2000 - 2001/05/23, Review, Human)
12
'Clinician* Competence' & 'Undergraduate Medical Education'
21
'Professional Competence' & 'Undergraduate Medical Education'
1148
'Professional Competence' & 'Undergraduate Medical Education' (Limits: Review and Human)
23
'Process of Care' & 'Undergraduate Medical Education' (Limits: Review and Human)
5
'Clinical Practice' & 'Undergraduate Medical Education' (Limits: Review & Human)
30
'Clinical Behavior' & 'Undergraduate Medical Education' (Limits: Review & Human)
1
'Process of Care' & 'Undergraduate Medical Education'
131
'Clinical Behavior' & 'Undergraduate Medical Education'
41

48
Appendix 2 Systematic Review
Data Extraction Form 1. Study Number 2. Citation: _______________________________________________________________ 3. Reference: Year: ________ Vol: ________ No: ________ Pages: _________ 4. Timing of Assessment: Med School Internship Residency Practice 5. Research question(s)/hypotheses/objectives: ________________________________________________________________________ ________________________________________________________________________ 6. Study design: Prospective cohort Retrospective cohort Case control Unclear Others (please specify) _____________________________________________________ 7. Sampling & Sample size Random Sample Entire batch Unclear Others (please specify) ____________________________________________________ Sample Size: ________ 8. Reliability of instruments : Given Not given Instruments used: Reliability Coefficient: i) __________________________ _____________________________ ii) __________________________ ______________________________ iii) __________________________ ______________________________ iv) __________________________ ______________________________

49
Appendix 2
Correlation – Co-efficients
Outcome/Criterion Variables Predictor Variables P-value (C.I.) P-value (C.I.) P-value
(C.I.)
Regression – Co-efficients
Outcome/Criterion Variables Predictor Variables P-value (C.I.) P-value (C.I.) P-value
(C.I.)
Summary Statement: ______________________________________________________ ___________________________________________________________________________ Other Comments: ________________________________________________________ ___________________________________________________________________________
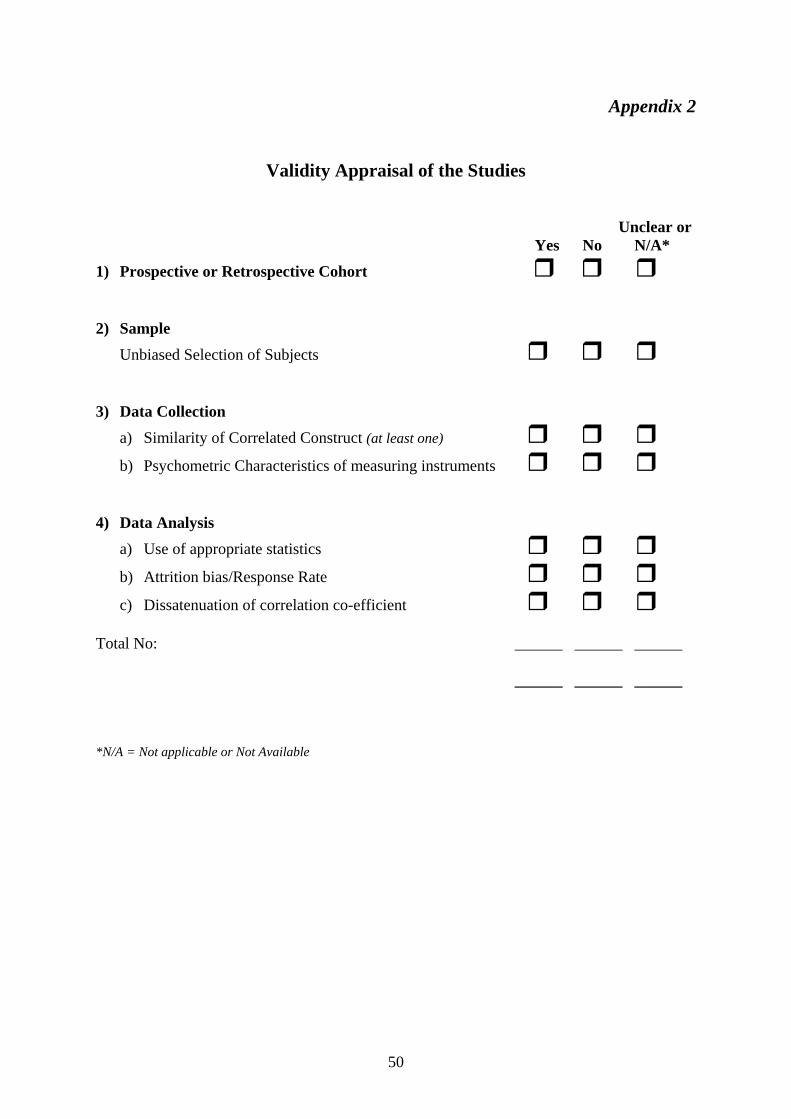
50
Appendix 2
Validity Appraisal of the Studies
Unclear or Yes No N/A* 1) Prospective or Retrospective Cohort 2) Sample Unbiased Selection of Subjects 3) Data Collection
a) Similarity of Correlated Construct (at least one)
b) Psychometric Characteristics of measuring instruments 4) Data Analysis
a) Use of appropriate statistics
b) Attrition bias/Response Rate
c) Dissatenuation of correlation co-efficient Total No: ______ ______ ______ ______ ______ ______ *N/A = Not applicable or Not Available

51
Appendix 3List of 38 Included Studies - (*) = studies included in Meta-Analysis (*) (*) (*) (*) (*)
Alexander, G.L., Davis, W.K., Yan, A.C. & Fantone, J.C. 2000, ‘Following Medical School Graduates into Practice: Residency Directors’ Assessments after the First Year of Residency’, Academic Medicine, vol. 75, no. 10, pp. S1517. Amos, D.E. & Massagli, T.L. 1996, ‘Medical School Achievements as Predictors of Performance in a Physical Medicine and Rehabilitation Residency’, Academic Medicine, vol. 71, no. 6, pp. 678-680. Arnold, L. & Willoughby, T.L. 1993, ‘The Empirical Association between Student and Resident Physician Performances’, Academic Medicine, vol. 68, no. 2, pp. S35-S40. Bell, J.G., Kanellitsas, I., & Shaffer, L. 2002, ‘Selection of obstetrics and gynecology residents on the basis of medical school performance’, Am J Obst Gynecol, vol. 186, no. 5, pp. 1091-94. Blacklow, R.S., Goepp, C.E. & Hojat, M. 1993, ‘Further Psychometric Evaluations of a Class-ranking Model as a Predictor of Graduates’ Clinical Competence in the First Year of Residency’, Academic Medicine, vol. 68, no. 4, pp. 295-297. Borowitz, S.M., Saulsbury, F.T., & Wilson, W.G. 2000, ‘Information collected during the residency match process does not predict clinical performance’, Arch Ped Adolesc Med, vol. 154, no. 3, pp. 256-260. Boyse, T.D., Patterson, S.K., Cohan, R.H., Korobkin, M., Fitzgerald, J.T., Oh, M.S., Gross, G.H. & Quint, D.J. 2002, ‘Does Medical School Performance Predict Radiology Resident Performance?’, Acad Radiol, vol. 9, pp 437-445. Brailovsky, C., Charlin, B., Beausoleil, S., Cote, S. & Vleuten, Van der. 2001, ‘Measurement of clinical reflective capacity early in training as a predictor of clinical reasoning performance at the end of residency: An experimental study on the script concordance test’, Medical Education, vol. 35, pp.430-436. Callahan, C.A., Erdmann, J.B., Hojat, M., Veloski, J.J., Rattner, S., Nasca, T.J. & Gonnella, J.S. 2000, ‘Validity of Faculty Ratings of Students’ Clinical Competence in Core Clerkships in Relation to Scores on Licensing Examinations and Supervisors’ Ratings in Residency’, Academic Medicine, vol. 75, no. 10, pp.S71-73. Case, S.M. & Swanson, D.B. 1993, ‘Validity of NBME Part I and Part II Scores for Selection of Residents in Orthopaedic Surgery, Dermatology and Preventive Medicine’, Academic Medicine, vol. 68, no. 2, pp. S51-S56. Clute, K.F. 1963, ‘The General Practitioner: A Study of Medical Education and Practice in Ontario and Nova Scotia. Toronto: University of Toronto Press. Fincher, R-M.E., Lewis, L.A. & Kuske, T.T. 1993, ‘Relationships of Interns’ Performances to their Self-assessments of their Preparedness for Internship and to their Academic Performances in Medical School’, Academic Medicine, vol. 68, no. 2, pp. S47-S50.

52
Appendix 3List of 38 Included Studies - (*) = studies included in Meta-Analysis (*) (*) (*)
Fine, P.L. & Hayward, R.A. 1995, ‘Do the Criteria of Resident Selection Committees Predict Residents’ Performances?’, Academic Medicine, vol. 70, no. 9, pp. S34-S38. Fish, D.E., Radfar-Baublitz, L.S., Choi, H. & Felsenthal, G. 2003, ‘Correlation of Standardized Testing Results with Success on the 2001 American Board of Physical Medicine and Rehabilitation Part 1 Board Certificate Examination’, Am J Phys Med Rehab, vol. 82. no. 9, pp 686-691. Gonnella, J.S., Erdmann, J.B. & Hojat M. 2004, ‘An empirical study of the predictive validity of number grades in medical school using 3 decades of longitudinal data: implications for a grading system’, Medical Education, vol. 38, pp. 425-434. Gunzburger, L.K., Fraizier, R.G., Yang, L.M., Rainey, M.L. & Wronski. T. 1987, ‘Premedical and medical school performance in predicting first-year residency performance’, Journal Medical Education, vol. 62, pp. 379-384. Hojat, M., Gonnella, J. S., Veloski, J. J. & Erdmann, J. B. 1993, ‘Is the glass half full or half empty? A re-examination of the association between assessment measures during medical school and clinical competence after graduation’, Academic Medicine, vol. 68, no. 2, pp. S69-76. Kahn, M.J., Merrill, W.W., Anderson, D.S. & Szerlip, H.M. 2001, ‘Residency program director evaluations do not correlate with performance on a required 4th-year objective structured clinical examination’, Teaching & Learning in Medicine, vol. 13, no. 1, pp. 9-12. Kron, I.L., Kaiser, D.L., Nolan, S.P., Rudolf, L.E., Muller, W.H. & Jones, R,S. 1985, ‘Can Success in the Surgical Residence be Predicted from Pre-residency Evaluation?’, Annual Surgery, vol. 202, pp. 694-695. Loftus, L.S., Arnold, L., Willoughby, T.L. & Connolly, A. 1992, ‘First-year Residents’ Performances Compared with their Medical School Class Ranks as Determined by Three Ranking Systems’, Academic Medicine, vol. 67, no. 5, pp. 319- 323. Markert, R. J. 1993, ‘The relationship of academic measures in medical school to performance after graduation’, Academic Medicine, vol. 68, no. 2, pp. S31-4. Paolo, A.M. & Bonaminio, G.A. 2003, ‘Measuring Outcomes of Undergraduate Medical Education: Residency Directors’ Ratings of First-Year Residents’, Academic Medicine, vol. 78, no. 1, pp. 90-95. Pearson, S-A., Rolfe, I. E. & Henry, R. L. 1998, ‘The relationship between assessment measures at Newcastle Medical School (Australia) and performance ratings during internship’, Medical Education, vol. 32, pp. 40-45. Peterson, O.L., Andrews, L.P., Spain, R.S. & Greenberg, B.G. 1956, ‘An Analytical Study of North Carolina General Practice’ Part 2, J. Medical Education, vol. 31, pp.1-

53
Appendix 3List of 38 Included Studies - (*) = studies included in Meta-Analysis (*) (*) (*) (*) (*) (*) (*)
165. Price, P.B., Taylor, C.W., Richards, J.M. & Jacobsen, T.C. 1964, ‘Measurement of Physician Performance’, J. Medical Education, vol. 39, pp. 203-211. Probert, C.S., Cahill, D.J., McCann, G.L. & Ben-Shlomo Y. 2003, ‘Traditional finals and OSCEs in predicting consultant and self-reported clinical skills of PRHOs: a pilot study’, Medical Education, vol. 37, pp. 597-602. Rabinowitz, H.K., Hojat, M. 1989, ‘A comparison of the modified essay question and multiple choice question formats: their relationship to clinical performance’, Family Medicine, vol. 21, no. 5, pp. 364-367. Richards, J.M., Taylor, C.W. & Price, P.B. 1962, ‘The prediction of Medical Intern Performance’, J Applied Psychology, vol. 46, pp. 142-146. Ronai, A.K., Golmon, M.E., Shanks, C.A., Schafer, M.F., & Brunner, E.A. 1984, ‘Relationship between past academic performance and results of specialty in-training examinations’, J Med Educ, vol. 59, no. 4, pp. 341-344. Rutala, P.J., Fulginiti, J.V., McGeagh, A.M., Leko, E.O., Koff, N.A. & Witzke, D.B. 1992, ‘Validity studies using standardized-patient examinations: standardized patient potpourri’, Academic Medicine, vol. 67, No. 10, pp. S60-62. Smith, S.R. 1993, ‘Correlations between Graduates’ Performances as First-Year Residents and their Performances as Medical Students’, Academic Medicine, vol. 68, no. 8, pp. 633-634. Sosenko, J., Stekel, K.W., Soto, R., & Gelbard, M. 1993, ‘NBME Examination Part I as a Predictor of Clinical and ABIM Certifying Examination Performances’, J Gen Int Med, vol. 8, no. 2, pp. 86-88. Tamblyn, R., Abrahamoqicz, M., Dauphinee, W.D., Hanley, J.A., Noricini, J., Girard, H., Grand Maison, P., Brailovski, C. 2002, ‘Association between licensure examination scores and practice in primary care’, JAMA, vol. 288, no. 23, pp. 3019-3026. Vu, N.V., Barrows, H.S., Marcy, M.L., Verhulst, S.J., Colliver, J.A. & Travis, T. 1992, ‘Six years of comprehensive, clinical, performance-based assessment using standardized patients at the Southern Illinois University School of Medicine’, Academic Medicine, vol. 67, No. 1, pp. 42-50. Vu, N.V., Distlehorst, L.H., Verhulst, S.J. & Colliver, J.A. 1993, ‘Clinical Performance-based Test Sensitivity and Specificity in Predicting First-Year Residency Performance’, Academic Medicine, vol. 68, no. 2, pp. S41-S45. Wilkinson, T.J. & Frampton, C.M. 2004, ‘Comprehensive undergraduate medical assessments improve prediction of clinical performance’, Medical Education, vol. 38, pp.1111-16.

54
Appendix 3List of 38 Included Studies - (*) = studies included in Meta-Analysis (*)
Yindra, K.J., Rosenfield, P.S. & Donnelly, M.B. 1998, ‘Medical School achievements as predictors of residency performance’, Journal Medical Education, vol. 63, pp. 356-363. Zu, G., Veloski J.J., & Hojat, M. 1998, ‘Board Certification: Associations with Physicians’ Demographics and Performances during Medical School and Residency’, Academic Medicine, vol. 73, no. 12, pp.1283-1289.

55
Appendix 4
Predictors and Outcome Variables in the included Studies
Study References Predictors Variables Outcome Variables
Hojat et al., 1993; Markert 1993 NBME I/USMLE I Hojat et al., 1993; Markert 1993 NBME II/USMLE II Hojat et al., 1993 Objective Clinical Exam Hojat et al., 1993 Exam Grades in Basic Sciences Markert 1993 Preclinical GPA
Markert 1993 Clerkship GPA (clinical performance/ scores)
Rabinowitz & Hojat, 1989
3rd Year Clerkship Examination Scores Modified essay questions in family medicine clerkship
NBME III
Blacklow, Goepp & Hojat 1993; Kron et al., 1985 Class Ranks
Sosenko 1993 ; Borowitz 2000 ; Markert 1993; Loftus et al., 1992; Smith 1993; Kahn et al., 2001; Yindra, Rosenfield & Donnelly 1998; Kron et al., 1985; Zu et al., 1998
NBME I/USMLE I
Fincher, Lewis & Kuske 1993 Cumulative GPA Markert 1993; Loftus et al., 1992; Richards et al., 1962 ; Zu et al., 1998 Preclinical GPA
Markert 1993, Loftus et al., 1992; Kahn et al., 2001; Callahan et al., 2000, Rabinowitz et al., 1989 ; Paolo et al., 1992 ; Zu et al., 1998
Clerkship GPA (clinical performance/ scores)
Vu et al., 1992 Vu et al., 1993
Clinical Competence (post-clerkship score)
Arnold & Willoughby 1993 Clerkship Rating Pearson, Rolfe & Henry 1998 Professional Skills Pearson, Rolfe & Henry 1998 Critical Reasoning Pearson, Rolfe & Henry 1998 Population Medicine Pearson, Rolfe & Henry 1998 Self-Directed Learning
Arnold & Willoughby 1993 Final Year MD Exam Scores and Subscores
Fincher, Lewis & Kuske 1993 Medical School GPA Ranking
Fincher, Lewis & Kuske 1993 First Year Student Self Assessment (readiness for internship)
Loftus et al., 1992; Kahn et al., 2001 First Year Student Ranking (using Dean’s Letter)
Loftus et al., 1992 Ranking with Criterion Reference Loftus et al., 1992 Ranking with Norm Reference Loftus et al., 1992; Kahn et al., 2001; Kron et al., 1985 Honours Society
Loftus et al., 1992; Kahn et al., 2001; Wilkinson & Frampton, 2004 ; Rutala et al., 1992
OSCE
Supervisor Rating during internship and residency programme
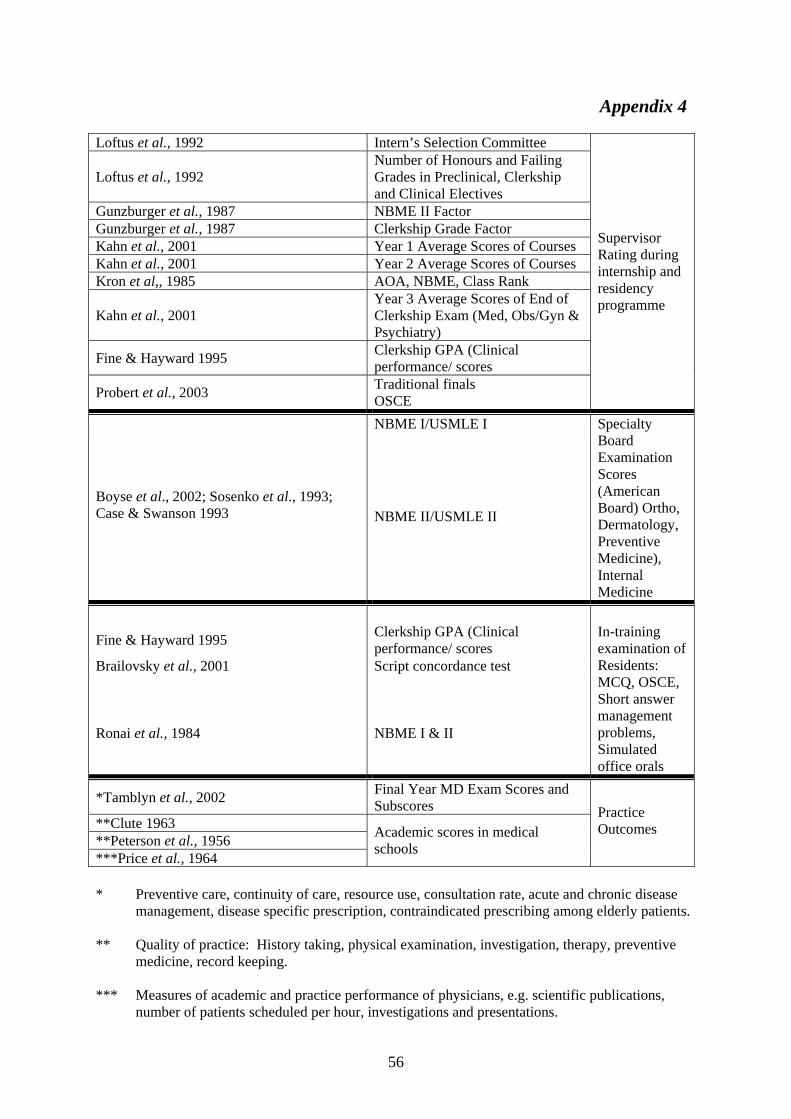
56
Appendix 4 Loftus et al., 1992 Intern’s Selection Committee
Loftus et al., 1992 Number of Honours and Failing Grades in Preclinical, Clerkship and Clinical Electives
Gunzburger et al., 1987 NBME II Factor Gunzburger et al., 1987 Clerkship Grade Factor Kahn et al., 2001 Year 1 Average Scores of Courses Kahn et al., 2001 Year 2 Average Scores of Courses Kron et al,, 1985 AOA, NBME, Class Rank
Kahn et al., 2001 Year 3 Average Scores of End of Clerkship Exam (Med, Obs/Gyn & Psychiatry)
Fine & Hayward 1995 Clerkship GPA (Clinical performance/ scores
Probert et al., 2003 Traditional finals OSCE
Supervisor Rating during internship and residency programme
NBME I/USMLE I
Boyse et al., 2002; Sosenko et al., 1993; Case & Swanson 1993 NBME II/USMLE II
Specialty Board Examination Scores (American Board) Ortho, Dermatology, Preventive Medicine), Internal Medicine
Fine & Hayward 1995
Clerkship GPA (Clinical performance/ scores
Brailovsky et al., 2001 Script concordance test
Ronai et al., 1984
NBME I & II
In-training examination of Residents: MCQ, OSCE, Short answer management problems, Simulated office orals
*Tamblyn et al., 2002 Final Year MD Exam Scores and Subscores
**Clute 1963 **Peterson et al., 1956 ***Price et al., 1964
Academic scores in medical schools
Practice Outcomes
* Preventive care, continuity of care, resource use, consultation rate, acute and chronic disease
management, disease specific prescription, contraindicated prescribing among elderly patients. ** Quality of practice: History taking, physical examination, investigation, therapy, preventive
medicine, record keeping. *** Measures of academic and practice performance of physicians, e.g. scientific publications,
number of patients scheduled per hour, investigations and presentations.

57
Appendix 5 SUMMARY OF INCLUDED STUDIES
( 1 ) Variables
Citation Time of Measurement
Research Question/ Purpose of Study Design Sample
Size Predictors Outcome
Statistical Analysis Used Results/Findings
Following Medial School Graduates Alexander, et al. Acad Med supp. 2000
1996-1998
To assess the contributions of academic assessments at various intervals during medical school to ratings of residency performance
Retrospective cohort
338
USMLE I USMLE II GPA year 2
clerkship year 3 composite
Cumulative composite score at graduation
Ranking Top third Middle third Lower third
Performance in residency, by supervisor rating in: Primary care residency Surgery
Cronbach’s alpha of supervisor rating 0.94 Pearson correlations ANOVA to compare sub-groups means
i.e. similarity in the subjective assessment by directors of residency programmes and attending ratings of students clinical performance
USMLE I - r =0.2 USMLE II - r = 0.24 GPA year 2 - r = 0.2 GPA year 3 - r = 0.41 clerkship Composite cumulative - r = 0.32 All GPA P = < .000 Year 2 GPA and resident humanistic quality r = 0.07; P = 0.12 /not significant
Conclusion: low magnitude correlations, but statistically significant except with humanistic quality
Academic performance explained less than 20% of the variance in residency performance
Strength of correlation between clerkship GPA and residency assessment may have been due to ‘method effect’ of the ratings.

58
Appendix 5 SUMMARY OF INCLUDED STUDIES
(2)
Variables Citation Time of
Measurement Research Question/ Purpose of Study Design Sample
Size Predictors Outcome
Statistical Analysis Used Results/Findings
Medical School Achievements as Predictors of Performance Amos, et al. Acad Med 1996
1959-1991
To determine the relationships between medical school achievements and clinical or academic performance of residents in physical medicine and rehabilitation, performance on board examination and entry into academic practice
Retrospective cohort
205 Residents
Age, Sex Research
experience Advanced
degree Failed
classes or clerkship
Honors grades, class rank
Annual evaluation scores of residents Publications GPA on masters degree Board scores Post-residency outcome variables: Fellowship, career selection (academic versus clinical)
Chi-square analysis of variance, linear and logistic regression
Clinical residency performance was predicted by clerkship honors grades (P = .0001)
Probation was predicted by failing a basic science course (P=.0001)
Written board performance was related to Alpha Omega Alpha status (P=.04)
Failing written boards on the first attempt was predicted by failing a basic science course (P=.05)
Entry into an academic PMR practice was predicted by an interest in the practice in personal statement of the residency application (P=.002) and writing a thesis in medical school (P=.03)

59
Appendix 5 SUMMARY OF INCLUDED STUDIES
( 3 ) Variables Citation
Time of
Measurement
Research Question/
Purpose of Study Design Sample Size
Predictors Outcome
Statistical Analysis Used Results/Findings
The Empirical Association between student and Resident physician Performance. Arnold & Willoughby; Acad Med supp. 1993
• Medical
School • (1980-1983) • Residency
Are categories of students performance levels associated with their standings on clinical performance ratings as residents? Is the association between performances in combined degree program residency stronger when measures are conceptually similar?
Retrospective cohort
298 (a combined degree program)
Clerkship GPA Clerkship rating Final Year MD exam scores and subscores
Supervisor rating for year one residency
Distribution free Statistics Chi-square Factors analysis
• 45% of subjects in same performance categories
as students and residents • Agreement between high and low levels of student
residency performance • Students clinical performance component was
strongest correlate of residency clinical performance (Contextual variables-) r = 0.3 P <.001

60
Appendix 5 SUMMARY OF INCLUDED STUDIES
( 4 ) Variables
Citation Time of Measurement
Research Question/ Purpose of Study Design Sample
Size Predictors Outcome
Statistical Analysis Used Results/Findings
Selection of obstetrics and gynecology residents Bell, et al. Am J Obs Gyn 2002
Medical School and Residency I Obstetrics & Gynecology 1995-1999
Whether USMLE scores predict residents in training examination scores
Retrospective cohort
24 Residents
USMLE I USMLE II Number of
hours in clinical rotations (five)
Global assessment of applicant composite score of selection
Supervisors ratings in PGY 1-4 four categories Clinical judgment Patient rapport Surgical ability Work ethics In-training examination PGYs 1-4 ‘GREOG’ Council on Residents Education in Obstetrics and Gynecology
Linear regression Spearman rank correlation to assess relationships among individual components and external measures ‘Contents and Construct Validity’
USMLE I significantly predicted performance on PGY 1-3 GREOG examination P < 0.05
USMLE II significantly predicted performance on GREOG examination in all 4 years P < 0.05
USMLE I did not correlate with PGY4 CREOG scores CREOG did not correlate with resident performance as measured by faculty evaluation
No association between medical student composite scores and resident performance scores.

61
Appendix 5 SUMMARY OF INCLUDED STUDIES
( 5 ) Variables Citation
Time of
Measurement Research Question/ Purpose of Study Design Sample Size
Predictors Outcome
Statistical Analysis Used Results/Findings
Further Psychometric Evaluations of a Class Ranking Model as a Predictor of Graduates’ Clinical Competence in First Year of Residency. Blacklow, Goepp, Hojat Acad Med 1993
1991, 1992, 1986-19
• Medical school • Internship
To investigate the psychometrics of a class ranking model Is there a linear relationship between class ranks and ratings of postgraduate competence
Retrospective Cohort Faculty judged graduates’ potential to become competent physicians. Student rankings compared to ratings received from faculty. Directors’ rated data-gathering skills of graduates at end of internship.
Part I 215 graduates of Jefferson Part II 598 graduates
• Class Ranks • Basic science
grades • Clerkship –
clinical ratings in 3rd year
Supervisor rating at the end of the first year of residency
Concordance rates between faculty ratings and class ranking model
The means of both measures of medical school performance increased significantly with increases in the levels of postgraduate clinical ratings, suggesting a linear relationship.
Concordance rate 85% between ranks and ratings support validity of ranking model.

62
Appendix 5 SUMMARY OF INCLUDED STUDIES
( 6 ) Variables
Citation Time of Measurement
Research Question/ Purpose of Study Design Sample
Size Predictors Outcome
Statistical Analysis Used Results/Findings
Information Collected During the Residency Match Process Does Not Predict Clinical Performance Borowitz, Saulsbury & Wilson. Arch Pediatr Adolesc, 2000
Pediatric residents over a 7 year period at the University of Virginia 1994 - 1997
To determine whether information collected during the national residency matching program predicts clinical performance during residency as evaluated by 10 faculty members
Retrospective Study
69 pediatric house officers
Rank on
matching list Score on NBME
I Grade on
pediatric and internal medicine clerkship
AOA Scores of faculty
interviews during interim application
Pediatric in service examination
Scores of American Board of Pediatrics
Supervisors ratings
of clinical performance
Kappa for
agreement between raters
Linear regression
T-test, analysis of variance
Medical School Grades, Performance on NBME
I, Interviews during the interim application process and match-list ranking are not predictors of clinical performance during residency.

63
Appendix 5 SUMMARY OF INCLUDED STUDIES
( 7 ) Variables Citation
Time of
Measurement Research Question/ Purpose of Study Design Sample
Size Predictors Outcome
Statistical Analysis Used Results/Findings
Does Medical School Performance Predict Radiology Boyse, et al. Acad Radiol 2002
1991-2000
To determine the relationships between medical school achievements and clinical or academic performance of residents in physical medicine and rehabilitation, performance on board examination and entry into academic practice
Retrospective cohort
77 Radiology Residents
Grades Dean’s letter Letters of
recommendation AOA NBME I &
USMLE I
Rotation evaluations supervisor rating Retrospective faculty recall scores American College of Radiology (ACR) American Board of Radiology (ABR) examination scores
Student to test Analysis of variance Correlation coefficients
Preclinical grades of honors or A Clinical grades of honors in medicine, surgery, high NBME/USMLE I predicted success on ABR written examination, but did not predict rotation performance
Dean’s letter, letter of recommendation AOA, high medical school prestige did not predict high examination scores or supervisor rotation performance.

64
Appendix 5 SUMMARY OF INCLUDED STUDIES
( 8 ) Variables
Citation Time of Measurement
Research Question/ Purpose of Study Design Sample
Size Predictors Outcome
Statistical Analysis Used Results/Findings
Measurement of clinical reflective capacity early in training as a predictor of clinical reasoning performance at the end of residency: An experimental study on the script concordance test Brailovsky, et al. Med Edu 2001
1996
To verify whether scores obtained by students at the end of the clerkship predict their clinical reasoning performance at the end of residency
Cohort comparative study prospective of scores
24 students
Scores on SC end of clerkship
Scores on Short answer management problem (SAMP’s) Simulated Office Orals (SOO) OSCE
Pearson correlation
SC and SAMP correlation r = .451 P = 0.01 SC and SOOs r=0.447 P = 0.015 with OSCE r = 0.340

65
Appendix 5 SUMMARY OF INCLUDED STUDIES
( 9 )
Variables Citation Time of
Measurement Research Question/ Purpose of Study Design Sample Size
Predictors Outcome
Statistical Analysis Used Results/Findings
Validity of faculty ratings of students’ clinical competence in core clerkship in relation to scores on licensing examinations and supervisors’ ratings in residency Callahan, et al. Acad Med supp. 2000
1989 – 1998 Medical School Residency
Examine the validity of faculty rating of students clinical competencies in core clinical clerkship in relation to student subsequent performances on medical licensing examination and program directors’ ratings.
Retrospective cohort
2158
Global ratings of student clinical competencies in six core clerkships
USMLE II USMLE III Supervisors ratings of clinical performance in year 1 Residency “data gathering skills Interpersonal skills and attitudes Socioeconomic aspects of patient care
Bivariate correlation Multiple regression analysis
All correlations reported are statistically significant, but of low effect size
Highest correlations 0.29 and 0.2 between internal medicine clerkship and steps 2 and 3 USMLE lowest correlations 0.17 psychiatry and 0.11 surgery clerkships
Correlations with postgraduate clinical competence statistically significant, but low effect size
Highest internal medicine clerkship and data gathering skills 0.27, lowest between surgery and psychiatry clerkship and postgraduate clinical competence 0.1 and 0.09

66
Appendix 5 SUMMARY OF INCLUDED STUDIES
( 10 ) Variables
Citation
Time of Measurement
Research Question/ Purpose of Study Design Sample Size
Predictors Outcome
Statistical Analysis Used Results/Findings
Validity of NBME part 1 and part II scores for selection of residents in orthopedic surgery, dermatology, preventive medicine. Case & Swanson, Acad Med supp. 1993
1991 • Medical
school • Residency
How accurately do NBME scores predict criterion measures of success in residency training?
Retrospective cohort
Ortho= 656 Derm= 219 Prev.=169
NBME I, II
Specialty Board Exam Scores
Regression analyses correlations
Patterns of high low scores on NBME Parts I and II generally related to skills required in the specialty areas. Is this a reflection of the examinee's preferred specialty or the programs selecting that person. NBME Parts I and II scores provided a good predictor of specialty board performance. Part II, generally better than part I. Part I or II scores below 400, examinee more likely to fail specialty boards. Predict BUT should not be sole criteria.

67
Appendix 5 SUMMARY OF INCLUDED STUDIES
( 11 ) Variables Citation
Time of
Measurement Research Question/ Purpose of Study Design Sample Size
Predictors Outcome
Statistical Analysis Used
Results/Findings
The General Practitioner: A study of medical education and practice in Ontario and Nova Scotia Clute, Univ Toronto 1963
1961 – 1963 • Medical School • General
Practice
To determine relationship between medical school academic marks and quality of practice in Ontario and Nova Scotia
Survey
85 Canadian GPs
Academic marks in clerkship
Quality of practice
Pearson correlation
Relationship between academic and career performance – slight, positive, significant correlation of .56 in Ontario (N – 23), but also strong negative relationship between age and grades and quality of practice; in Nova Scotia (N = 39), positive, non-significant correlation of .24.

68
Appendix 5 SUMMARY OF INCLUDED STUDIES
( 12 ) Variables Citation
Time of
Measurement Research Question/ Purpose of Study Design Sample Size
Predictors Outcome
Statistical Analysis Used Results/Findings
Relationships of intern's performance to their self-assessments of their preparedness for Internship and to their Academic Performances in Medical school Fincher, Lewis, Kuske Acad Med supp. 1993
• Medical
School • (1990-1991) • Internship
Do medical students' cumulative GPA correlate with performance assessments? Do medical students' self assessments of preparedness for internship correlate with internship directors' assessments? Does med school academic performance predict performance in specific competencies as assessed by program directors?
Retrospective cohort
138/114 (1990) 145/104 (1991) 133 self-rating
• Cumulative
GPA • Medial School
GPA rank • Student self-
assessment
Supervisor rating for year one residency
• Pearson
Correlation Coefficients
• Cross tabs • Chi-square • Multivariate • ANOVA
• GPAs of students who chose university based
residencies significantly higher than those who chose community based - GPA predicts overall performance in specific competences in internship year. r = 0.28–0.51
• Ranking between med school internship year was different rather inconclusive.
• Medical school academic performance relates significantly to performance in internship.

69
Appendix 5 SUMMARY OF INCLUDED STUDIES
( 13 )
Variables Citation Time of
Measurement Research Question/ Purpose of Study Design Sample Size
Predictors Outcome
Statistical Analysis Used Results/Findings
Do criteria predict resident performance Fine & Hayward, Acad Med supp. 1995
• Medical
School • Residency
Factors considered by Res. Programs when selecting residents and whether factors predict resident performance
Retrospective cohort
123 Residents 308 appl.
Clerkship GPA
Overall rating (over several years)
Multivariate liner regression
• Significant independent relationship between medical
school clerkship (International Medicine grade) and residency performance.
• ISCs over emphasize of AOA, scores of medical school
reputation. • Best predictor of overall residency performance were
internal medicine clerkship honors and graduation from home institution.

70
Appendix 5 SUMMARY OF INCLUDED STUDIES
( 14 )
Variables Citation Time of
Measurement Research Question/ Purpose of Study Design Sample Size
Predictors Outcome
Statistical Analysis Used Results/Findings
Correlation of Standardized Testing Results Fish, et al. Am J Phys Med Rehab 2003
2001 (POE)
To determine the relationships between medical school achievements and clinical or academic performance of residents in physical medicine and rehabilitation, performance on board examination and entry into academic practice
Survey
86 Residents
Self assessment
examination (SAE) USMLE I USMLE II USMLE III Comprehensive
Medical Licensing Exam (COMPLEX)
POE scores and ranking
Spearman rank correlation (rho) X2
12 Residents (14%) thought SAE correlated with POE; 53.5% ‘somewhat’ 32% did not correlate well. 60.5% thought the SAE was easy; 8.1% more difficult and 31.4% same difficulty
Participation in a board review courses did not correlate with quartile ranking on POE rs = -0.2
All residents in the lowest quartile failed the POE Higher performance on standardized test USMLE I, II, III/ COMPLEX, SAE correlate with POE
SAE rs = 0.581 P < 0.001 Passing 1st attempt all USMLE 0.295 P < .007

71
Appendix 5 SUMMARY OF INCLUDED STUDIES
( 15 ) Variables
Citation
Time of Measurement
Research Question/ Purpose of Study Design Sample Size
Predictors Outcome
Statistical Analysis Used
Results/Findings
An empirical study of the predictive validity of number grades in medical school using 3 decades of longitudinal data: implications for a grading system Gonnella, Erdmann & Hojat, Med Edu, 2004
1970 – 1999 • Medical School • PG 1
To examine predictive validity of number grades in medical school
Prospective cohort study
6656 medical students
GPA year 1 Number grades
GPA year 2 GPA clerkship Medical school class rank
USMLE 1, 2, 3 Supervisor rating PG 1
• Mean
comparison X2 ANOVA Effect size
Ratings of clinical competence beyond medical school are predicted by number grades in medical school

72
Appendix 5 SUMMARY OF INCLUDED STUDIES
( 16 )
Variables Citation Time of
Measurement Research Question/ Purpose of Study Design Sample Size
Predictors Outcome
Statistical Analysis Used Results/Findings
Premedical and Medical School Performance in Predicting First Yr Residency Performance. Gunzburger, et al. J Med Edu 1987
1982, 1984 (62) (123) • College • Medical School • Residency
(Internship)
Relationships among measures of college and medical school performance and competence in 18 medical care tasks in PGY I.
Retrospective Cohort
185 Graduates of Loyola
• NBME II
Scores • Clerkship
grade • NBME I • GPA • MCAT
• Rating by
supervisor for year one residency
• Factor analysis • Stepwise multiple
regression • Rash model item
analysis
• College and medical school academic
achievement not best predictors of resident’s competence. • High correlation found between: (1) NBME part II scores and residency
competence ratings (i.e. test measures what it should – MBA) P = .005
(2) Clerkship grades.

73
Appendix 5 SUMMARY OF INCLUDED STUDIES
( 17 )
Variables Citation Time of
Measurement Research Question/ Purpose of
Study Design Sample Size Predictors Outcome
Statistical Analysis Used Results/Findings
Is the Glass Hall Full or Half Empty? A Reexamination of the Associations Between Assessment Measures during Medical School and Clinical Competence after Graduation Hojat, et al. Acad Med supp. 1993
• Medical
School • Internship (1980 – 1990)
Investigate associations between performance during medical school and in the first year of residency. Hypotheses: 1) There is high correlation between medical school measures of performance and measures obtained at end of internship 2) Objective measures of medical knowledge attained during medical school and one year after graduation are highly correlated 3) Students’ low or high academic standings in medical school are directly and significantly associated with their subsequent clinical competence ratings as residents The association between academic standings in medical school and status on clinical competence ratings as residents is stronger for measurements that are conceptually more similar than dissimilar.
Retrospective cohort
1,724 graduates Total = 2368
• NBME I, II • Objective
Clinical Exam • Preclinical
exam Grades
NBME III
• Factor
analysis Distribution free statistical measures used
• Chi-square • Pearson
Product-moment correlations
Associations exist between performance measures in medical school and those after graduation.
Conceptually similar measures yield stronger associations than dissimilar ones. Need to refine assessment instruments.
Associations among performance measures in medical school increase drastically when selected measures of personality are included in prediction models.

74
Appendix 5 SUMMARY OF INCLUDED STUDIES
( 18 )
Variables Citation Time of
Measurement Research Question/ Purpose of Study Design Sample Size
Predictors Outcome
Statistical Analysis Used Results/Findings
Residency Program Director Evaluations Do not Correlate With Performance on a Required 4th Year OSCE . Kahn, et al. Teach & Learn in Med 2001
• (4th Year)
Medical School
• Internship
Correlate performance on 4th year OSCE with residency program director assessment also class rank and USMLE scores
Retrospective Cohort 25 highest scoring 25 lowest scoring examinees. 5 point Likert Scale used by program directors
50 Graduates from Tulane
NBME I, II Objective Clinical Exam in Senior year Class ranking
Supervisor rating for year one residency History taking PE, interpersonal skills and overall medical knowledge.
Mann-Whitney tests (ordinal data)
Pearson’s correlations
Spearman’s rho analysis
• Program directors scores did not correlate with class
rank or USMLE scores, < .26 or TOSCE < .27, P <.08.
• No individual score from prog. Director was significantly different between OSCEHI and OSCELO.
• Strong correlations between USMLE scores and class rank.
• Prog. Directors do poor job of assessing clinical comp.

75
Appendix 5 SUMMARY OF INCLUDED STUDIES
( 19 )
Variables Citation Time of
Measurement Research Question/ Purpose of Study Design Sample
Size Predictors Outcome
Statistical Analysis Used Results/Findings
Can Success in the Surgical Residency be Predicted from Pre-residency Evaluation? Kron, et al. Ann. Surg 1985
• 1973-1982 • Medical
School • Residency
Compared level of a clinical performance and success of residents in one training program with information from initial application and interview. Can level of performance in residency be predicted from data in application? Can successful completion of residency program be predicted from objective and subjective data from medical school?
Retrospective Cohort
62 • Medical school application info
• Election to AOA • NBME scores • Class rank
(honors in basic science and clinical subjects, letters of recommendation, scientific publication during medical school, research experience)
• Residency interview
• Rating by program director for year one residency level of clinical performance
Discriminant function analysis
No correlation between any of the selection factors and resident’s performance for the 42 who completed the program. Comparison of the 42 with 20 who were dismissed revealed AOA membership; high-class rank; clinical honors; and scientific publications during medical school predicted success with 89% accuracy. Personal interviews are not predictive of success, or performance.

76
Appendix 5 SUMMARY OF INCLUDED STUDIES
( 20 )
Variables Citation Time of
Measurement Research Question/ Purpose of Study Design Sample Size
Predictors Outcome
Statistical Analysis Used Results/Findings
First-Year Residents’ Performances Compared with Their Medical School Class Ranks. Loftus et al. Acad Med 1992
• Medical
school • Residency
Does student’s class rank bear strong relationship to subsequent residency performance? What class rank system yields most sig. Correlation with postgraduate med. outcomes Is there a way to strengthen the relationship
Retrospective cohort
124 graduates with med school records 102 for internship records
• Preclinical GPA • Clerkship GPA • NBME I/NBME II • First year student
ranking (Dean’s letter category index)
• Ranking with Criterion Ref.
• Ranking with Norm Ref.
• Honors Society Intern Selection Comm.
Rating by supervisor for year one residency 9 areas of clinical performance
Stepwise multiple regression Pearson’s correlation
Weighted combination of clinical performance measures bore strongest relationship to performance in residency. Low correlation of different ranking methods r (0.23–0.18) P < 0.05

77
Appendix 5 SUMMARY OF INCLUDED STUDIES
( 21 )
Variables Citation Time of
Measurement
Research Question/ Purpose
of Study Design Sample Size
Predictors Outcome
Statistical Analysis Used Results/Findings
The relationship of academic measures in medical school to performance after graduation – Markert, Acad Med supp. 1993
• Medical
School • Internship
(1980 - 1991)
Study 3 hypotheses: Measures of medical school academic performance will correlate significantly with postgraduate outcome. Relationship will be strongest for conceptually similar measures; Students categorized as high or low will be categorized similarly on post grad. outcome measures.
Retrospective cohort
947 (628=NBME II scores) (481= physician. Supervisor ratings)
• NBME I, II • Preclinical
GPA • Clerkship
GPA
• NBME III • Supervisor
Rating for year one residency
Pearson correlation Stepwise regression Factor analysis Chi-square
The medical school variables correlated significantly with NBME part III scores and physician supervisor ratings. First 2 hypotheses are supported. Medical School academic achievement significantly related to clinical competency in residency.

78
Appendix 5 SUMMARY OF INCLUDED STUDIES
( 22 ) Variables
Citation Time of Measurement
Research Question/ Purpose of Study Design Sample
Size Predictors Outcome
Statistical Analysis Used Results/Findings
Measuring Outcomes of Undergraduate Medical Education: Residency Directors’ Ratings of First-year Residents Paolo & Bonaminio Acad Med 2003
1998-=2000 Medical School First-year Residents
To assess reliability and validity of a residency rating scale (Psychometric) and provide a method for gathering comparison data
Retrospective cohort
382
Basic
Science GPA
Clinical GPA
USMLE I USMLE II
Supervisors ratings over 25 items based on the summative competency of the graduates using a Likert scale
Structure of rating scale was assessed using principal components analysis with varimax rotation Correlation rating scale with undergraduate performance Analysis of variance for group difference Independent t-test
Five items: Interpersonal communication Clinical skills Population based health care Record keeping skills Critical appraisal skills
Best explained the items and accounted for 86% of the variance Pearson correlations statistically significant ranging from 0.21 – 0.49 low to moderate relation between residency directors’ ratings and UME performance measures of UME clinical GPA had the highest correlation with all five factors.

79
Appendix 5 SUMMARY OF INCLUDED STUDIES
( 23 )
Variables Citation Time of
Measurement Research Question/ Purpose of Study Design Sample Size
Predictors Outcome
Statistical Analysis Used Results/Findings
The relationship between assessment measures of Newcastle Medical School (Australia) and performance ratings during internship. Pearson, Rolfe, & Henry Med Edu 1998
• Medical
School • Internship
1991, 1992
Predictive value of academic performance in last 2 years of 5 year program for ratings during internship.
Retrospective Cohort
64 Graduates n=112 eligible
• Professional
skills long case in each department
• Critical
reasoning • Population
medicine • Self-directed
learning • Identification
prevention and management of illness.
Supervisor rating for year one residency 13 competencies
ANOVA Linear regression
• Significant positive correlations between mean
ratings and examination scores from Domains 1,3,5.
• Professional skills; identification, prevention management of illness; self-directed learning.
• Best predictor of intern ratings was identified, prevention and management of illness r = 0.28 P < 0.01

80
Appendix 5 SUMMARY OF INCLUDED STUDIES
( 24 )
Variables Citation
Time of Measurement
Research Question/ Purpose of Study Design Sample
Size Predictors Outcome
Statistical Analysis Used
Results/Findings
An analytical study of North Carolina General Practice Peterson et al. Med Edu 1956
1956 • Medical
School • General
Practice
To determine relationship between medical school academic marks and quality of practice in North Carolina
Survey
94 GPs
Academic marks in clerkship
Quality of practice Career performance measures - Observation by internist of subject’s clinical history, physical examination, use of laboratory aids, use of therapeutic measures, preventive medicine, and clinical records. Observer made composite ratings on a predetermined scale which gave preponderant weight to the quality of the subject’s clinical history and physical examination.
Pearson correlation
Relationship between academic and career performance – slight, positive significance for younger doctors; no significance for older doctors.

81
Appendix 5 SUMMARY OF INCLUDED STUDIES
( 25 )
Variables Citation
Time of Measurement
Research Question/ Purpose of Study Design Sample
Size Predictors Outcome
Statistical Analysis Used
Results/Findings
Measurement of Physician Performance Price, et al. Med Edu 1964
1964 • Medical
School • General
Practice
To determine relationship between medical school GPA and academic and practice performance
Survey
215 GPs and 292 specialists
Medical school GPA’s First two years Last two years
Career performance measures – About 80 measures obtained from interviews, records, and colleagues’ opinions, for example, number of journals to which respondent’s subscribed, peer nominations for outstanding performance, hospital recognition, and publications; composite performance clusters developed with factor analytic techniques.
Pearson correlation Factor analysis
Performance – None; medical school grade point average (GPA), a factor almost completely independent of all factors having to do with professional performance

82
Appendix 5 SUMMARY OF INCLUDED STUDIES
( 26 )
Variables Citation Time of
Measurement Research Question/ Purpose of Study Design Sample
Size Predictors Outcome
Statistical Analysis Used Results/Findings
Traditional finals and OSCEs in Predicting Consultant and Self-reported Clinical Skills of PRHOs Probert, et al. Med Edu 2003
Medical School and PRHO 1999
To determine the relationships between medical school achievements and clinical or academic performance of residents in physical medicine and rehabilitation, performance on board examination and entry into academic practice.
Prospective cohort
20 PRHOs
OSCE Long case examination
Self assessment of clinical competencies Supervisor assessment of clinical competencies
Z score Pearson Correlation Kendall’s rank correlations Multiple variable logistic regression O.R. > 1 indicates better performance on examination; is associated with increase probability of being classified as better doctor
No correlation between PRHOs self reported performance and consultant reported performance
Traditional finals was inversely associated with consultant assessment. Better performing students were not rated as better doctors in surgery but not in medicine
OSCE showed positive associations with consultant ratings

83
Appendix 5 SUMMARY OF INCLUDED STUDIES
( 27 ) Variables
Citation Time of Measurement
Research Question/ Purpose of Study Design Sample
Size Predictors Outcome
Statistical Analysis Used Results/Findings
A Comparison of the Modified Essay Question and Multiple Choice Question Formats: Their Relationship to Clinical Performance Rabinowitz & Hojat. Fam Med, 1989.
1976 – 1985, Jefferson Medical College
Determine the relation between (1) MCQ examination in third year clerkship (2) Modified essay question final examination in family medicine (3) clinical performance in post-graduate training
Retrospective Cohort Study
1458 graduates
MCQ 3rd year
clerkship. Modified essay
examination in family medicine clerkship
NBME I, II, III Supervisor ratings in
residency
Pearson
correlation and
regression analysis
Grades on MCQ examination in internal
medicine clerkship consistently yielded the higher correlation with NBME scores I, II, III (r=0.59, 0.64 and 0.49). Modified essay in family medicine had the lowest correlation with NBME I, II, III (r=0.37, 0.37, 0.38).
Correlations of clerkship examination scores with post-graduate rating of competencies. Medical knowledge highest: internal medicine
clerkship 0.23, lowest: pediatrics 0.12 Data gathering highest: family medicine 0.19,
lowest: Ob/Gyn 0.15. Clinical judgment highest: family medicine
0.20, lowest: pediatrics 0.13 Professional attitudes, highest: 0.17, lowest:
pediatric 11

84
Appendix 5 SUMMARY OF INCLUDED STUDIES
( 28 )
Variables Citation
Time of Measurement
Research Question/ Purpose of Study Design Sample Size
Predictors Outcome
Statistical Analysis Used
Results/Findings
The prediction of Medical Intern Performance Richards, Taylor & Price Appl Psychol 1962
1955-1958 • Medical
School • Internship
To determine the relationship between medical school and GPA internship performance
Survey
139 Interns
GPA Years 1, 2, 3
Supervisor ratings of internship performance
Career performance measures – Evaluation of internship performance by hospital official; judges applied a rating scale to the letters of evaluation. An adjusted rating was also obtained by modifying the above unadjusted rating by an index of hospital quality.
Pearson correlation coefficient
Relationship between academic and career performance – Slight, positive significant correlations of .21 and .24 between first- and second-year grades, respectively, and adjusted rating; positive, significant correlation of .33 and .45 between third-year grades and unadjusted and adjusted ratings, respectively.

85
Appendix 5 SUMMARY OF INCLUDED STUDIES
( 29 )
Variables Citation Time of
Measurement Research Question/ Purpose of Study Design Sample
Size Predictors Outcome
Statistical Analysis Used Results/Findings
Relationship between past academic performance and results of specialty in-training examinations Ronai, Golmon, Shanks, Schafer & Brunner. J Med Educ, 1984
• 1966 – 1981
What is the relationship between College grades, medical school performance and the results of specialty in-training examination of residents in Anesthesia & Orthopedics.
Retrospective Cohort Study
63 graduates of North Western Univ
College Grade
GPA MCAT Scores NBME I NBMEII
Scores on the final
assessment of their residency in-training examination in Anesthesia & Orthopedics
T-test Pearson
correlation Multiple linear
regression for prediction
No significant difference between the GPA, MCAT scores and NBME I & II between the two groups.
Multiple linear regression analysis with stepwise forward inclusion. Best predictor of the anesthesia final in-training examination score was MCAT verbal ability 42%. For Orthopedic scores,
GPA-non science inclusion of all variables accounted for 40% of the variance for both groups. GPA non-science negative correlation.
NBME I and NBME II minimal effect in predicting in-training examination scores in anesthesia while significant information to the predictors of examination scores in orthopedics were found.

86
Appendix 5 SUMMARY OF INCLUDED STUDIES
( 30 )
Variables Citation
Time of Measurement
Research Question/ Purpose of Study Design Sample
Size Predictors Outcome
Statistical Analysis Used
Results/Findings
Validity studies using standardized-patient examinations: standardized patient potpourri Rutala, et al. Acad Med supp. 1992
1989-1990 •
To assess whether OSCE with standardized patients could predict performance during residency
Retrospective
76 students
OSCE – Standardized Patients: Interpersonal skills Database development Decision making
Residency directors questionnaire and rating
Pearson correlation coefficient
Correlation of OSCE with residency directors rating: Interpersonal skills - .42 Database development - .28 Decision making - .28
OSCE with SPs can measure what residency directors look for particularly in the domain of interpersonal skills.

87
Appendix 5 SUMMARY OF INCLUDED STUDIES
( 31 )
Variables Citation Time of
Measurement Research Question/ Purpose of Study Design Sample Size
Predictors Outcome
Statistical Analysis Used Results/Findings
Correlations between Graduates Performances as First Year Residents and Their Performances as Medical Students. Smith, Acad Med 1993
• Medical
School • Internship 1989 - 1991
Examine relationship (correlation) between performance in internship and Med School performance, on a clinical skill exam
Retrospective Cohort
203 Graduates of Brown University
Objective Clinical Exam in Senior Year (OSCE)
Honors and Failing Grades in Preclinical
Clerkship Clinical Electives
Supervisor Rating for year one residency
Pearson correlation coefficients
• Data collection score on the CSE correlated best
with internship performance. r = 0.273
• Correlations for clinical net score, number of honors grades in clinical electives, and interpersonal skills score closely clustered behind data collection score.
• Correlations for number of honor grades in preclinical courses and scores on NBME I and II was zero.

88
Appendix 5 SUMMARY OF INCLUDED STUDIES
( 32 ) Variables
Citation Time of Measurement
Research Question/ Purpose of Study Design Sample
Size Predictors Outcome
Statistical Analysis Used Results/Findings
NBME Examination Part I as Predictor of Clinical and ABIM Certifying Examination Performances Sosenko, Stekel, Soto & Gelbard. J Gen Int Med, 1993
1980 – 1988 Jackson Memorial Hospital
Whether scores from NBME I are predictive of competence in internal medicine as assessed by clinical performance ratings and American Boar d of Internal Medicine
Retrospective Cohort Study
117 internal medicine residents
NBME I
American Board of
Internal Medicine Scores
Supervisors rating of clinical competency during residency
Pearson
correlation
High correlation between ABIME and NBME I
(r = 0.57) Relation between clinical evaluations and the
NBME I were considerably weaker (r=0.27)

89
Appendix 5 SUMMARY OF INCLUDED STUDIES
( 33 )
Variables Citation Time of
Measurement Research Question/ Purpose of Study Design Sample
Size Predictors Outcome
Statistical Analysis Used Results/Findings
Association between licensure examination scores and practice in primary care. Tamblyn, et al. J Am Med Assoc 2002
1990-1993 - practice
To determine a sustained relationship between certification exam scores and practice performance. If licensing exams taken at end of medical school are predictive of future practice in primary care.
Retrospective cohort Cohort Outcome variables: 5 annual measures
912 FPs Final year MD Exam Scores and subscores
• Licensing
examinations
Practice Outcomes in Primary Care
Poisson regression
Multiple linear regression
• Relationships between certification exams were sustained through first 4-7 years of practice.
• Exams taken in final year of medical school were significant predictors of practice performance.
Outcomes
Preventive Care
Mammography Screening Rate
Coordination of Care
Continuity of Care, % of visits
Resource Use
Consultation Rate
Acute & Chronic Disease Management
Symptom-relief Prescribing Rate Among Elderly Patients
Disease-specific Prescription Rate Minus Symptom-Relief
Prescription Rate
Contraindicated Prescribing Among Elderly Patients
Continued Tamblyn, et al. J Am Med Assoc 2002 Predictors β (95% CI) P Value β (95% CI) P
Value β (95% CI) P Value β (95% CI) P Value β (95% CI) P Value β (95% CI) P Value
Overall score 16.81 (8.7 to 24.9)
< .001 0.2 (-0.4 to 0.8)
.52 4.93 (2.1 to 7.8
< .001 -7.15 (-15.0 to 1.0)
.08 4.83 (0.9 to 8.8)
.01 0.93 (0.82 to 1.05)
.21
Prevention subscore
8.10 (-1.0 to 17.2)
.08
Clinical Assessment subscore
11.54 (5.5 to 17.6)
.002
Management subscore
0.01 (-0.6 to 0.6)
.96 -7.0 (-14.0 to 2.2)
.15 3.0 (-1.0 to 6.9)
.15 0.91 (0.80 to 1.03)
.13
Diagnosis subscore
-5.1 (-12.0 to 2.3)
.18 3.80 (0.3 to 7.3)
.03 0.97 (0.86 to 1.10)
.67
Drug Knowledge subscore
-6.99 (-14.0 to 0.4)
.06 3.5 (0 to 7.1)
.05 0.88 (0.77 to 1.0)
.05

90
Appendix 5 SUMMARY OF INCLUDED STUDIES
( 34 )
Variables Citation Time of
Measurement Research Question/ Purpose of Study Design Sample
Size Predictors Outcome
Statistical Analysis Used Results/Findings
Clinical Performance - based test sensitivity and specificity in predicting first year residency performance. Vu, et al. Acad Med supp. 1993
• Medical
School (1987, 88, 90)
• Internship
To assess the utility of the post clerkship exam in predicting 1st year residency performance : 1) Students who would receive high 2) Students who would receive low.
Retrospective cohort
202 reduced to 133
Clinical Competence (Post-clerkship score
Supervisor rating for year one residency
• Supervisors are reluctant to give low ratings. • PCX = "Very sensitive"; Correctly identified 91%
of students who received high ratings. • Much lower specificity for low ratings received.

91
Appendix 5 SUMMARY OF INCLUDED STUDIES
( 35 )
Variables Citation
Time of Measurement
Research Question/ Purpose of Study Design Sample
Size Predictors Outcome
Statistical Analysis Used
Results/Findings
Six years of comprehensive, clinical, performance-based assessment using standardized patients at the Southern Illinois University School of Medicine Vu, et al. Acad Med 1992
1986-1991 •
To determine the validity and reliability of a post-clerkship clinical performance examination
Retrospective
405 students
scores on the PCX
NBME I NBME II Clerkship scores
First year resident supervisor rating
Pearson correlation coefficient
Clerkship rating r = .36 to .62 First year residency supervisor r = .16 to .43,
mean .32 NBME I r = .20 to .65, mean .42 NBME II r = 0.30 to .56, mean .40
All correlations were positive and significant, but they were relatively small, suggesting that the measures may assess different aspects of performance with small overlapping.

92
Appendix 5 SUMMARY OF INCLUDED STUDIES
( 36 )
Variables Citation Time of
Measurement Research Question/ Purpose of Study Design Sample
Size Predictors Outcome
Statistical Analysis Used Results/Findings
Comprehensive undergraduate medical assessments improve prediction of clinical performance Wilkinson & Frampton Med Edu 2004
2002 - 2003
High correlation
using the new assessment method during the intern year
OSCE has a higher predictive validity
Combining the results is better than relying on any single method
Prospective before and after cohort study
137 year 5 medical students followed into their trainee intern year
Essay
exam MCQ Modified
essay OSCE
Aggregated global
ratings by senior directors, junior doctors and nurses evaluating global clinical skills, global humanistic skills and total global score and comprehensive structured assessment
Comparison with the old written examination
Pearson’s
correlation Multiple
regression and partial correlation coefficient
Global total correlations: Old exam: written r = .17 New exam: written r = .54, OSCE r = .59 &
combined r = .60

93
Appendix 5 SUMMARY OF INCLUDED STUDIES
( 37 )
Variables Citation Time of
Measurement Research Question/ Purpose of Study Design Sample
Size Predictors Outcome
Statistical Analysis Used Results/Findings
Medical School Achievements as Predictors of Residency Performance. Yindra, Rosenfeld & Donnelly J Med Edu 1998
1983 and 1984 Medical School Internship
Relationships between academic achievement in med school : performance in internship, evaluated by program directors
Retrospective Cohort
119, 158
Medical school
performance Average course
grades years 1, 2, 3, 4
AOA Dean’s Letter
ranking NBME I NBME II
Performance
in first year residency
Multiple
regression Factor analysis t-tests ANOVA Pearson
correlation
Low correlation highest NBME Part II r =
0.37, but statistically significant relationships between measures of medical school performance and program directors’ ratings.
Confounding effects of specialty on resident’s ratings.

94
Appendix 5 SUMMARY OF INCLUDED STUDIES
( 38 )
Variables Citation Time of
Measurement Research Question/ Purpose of Study Design Sample
Size Predictors Outcome
Statistical Analysis Used Results/Findings
Board Certification: Associations with Physicians’ Demographics and Performances during Medical School and Residency Xu, Veloski & Hojat. Acad Med, 1988
1976 - 1985 • Jefferson
Medical School
• Specialty Board Certification
Do physicians who are board certified have records of higher academic credentials during medical school and in residency. Can academic credentials during medical school and residency predict future board-certification status What is the effect of age, sex, ethnicity on both questions
Prospective, Longitudinal study
1186
Grades of basic
medical sciences (BMS). Year 1 & 2
Grades of clinical sciences – Year 3
GPAs, BMS and clinical sciences
NBME I & II
Supervisor ratings
(Likert Scale) (PGY1) 33 statement 3 factors (data gathering and processing skills 60% of covariance). (interpersonal and attitudinal 5%), socioeconomic aspects of patient care (4%). Composite score of the three areas of postgraduate competence
Self reported practice specialty in family medicine, internal medicine
Board certification status
Chi-Square
tests for board certification and sex, age, race
T-test, mean differences between board certified and those not certified
Multiple linear regression models for correlation NBME and postgraduate clinical competence
Data on 95% of graduates (1,186). 1068 were board certified 90%
Rate of certification: 82% in surgery, 92% family practice, 94% internal medicine (x2 = 37.96,P<.001)
Differences in Mean Scores of medical schools scores: GPA “BMS”, GPA “CS”, NBME I, NBME II among certified and not certified physicians. Certified had higher academic credentials.
Similar certification rates for men and women Older graduates were less likely to be certified Much lower proportion of underrepresented
physicians achieved certification NBME Score II better predictor than NBME I
with ABM in medicine and surgery. In family medicine, neither NBME I or II was a significant predictor

95
Meta-Analysis of 19 Included Studies ( Figs 2 – 11)
Study name Sample size
Correlation(Random) 95% CI
Weight %
Correlation(Random) 95% CI
Markert 1993 481 14.95 0.20 [ 0.11 , 0.28]
Smith 1993 203 12.53 0.02 [-0.12 , 0.16]
Sosenko 1993 68 7.94 0.27 [0.03 , 0.48]
Kahn et al. 2001 50 6.57 0.08 [-0.20 , 0.35]
Yindra 1998 a 119 10.43 0.24 [ 0.06 , 0.40]
Yindra 1998 b 158 11.59 0.33 [ 0.18 , 0.46]
Alexander et al. 2000 338 14.11 0.20 [ 0.10 , 0.30]
Borowitz 2000 69 8.01 0.10 [-0.14 , 0.33]
Paolo et al. 2003 308 13.86 0.40 [ 0.30 , 0.49]
Total (95% CI) 1794
100.0 0.22 [0.13 , 0.30] Test of heterogeneity: Q-value = 25.166, Df = 8, P-value = 0.0015
– 1 – 0.5 0 0.5 1
Fig 2: Correlation Coefficient between NBME I (predictor) and Supervisor rating (outcome)
Study name Sample size Correlation(Random) 95% CI
Weight %
Correlation(Random) 95% CI
Markert 1993 481 17.08 0.24 [ 0.15 , 0.32]
Smith 1993 203 14.9 0.02 [-0.12 , 0.16]
Kahn et al. 2001 50 8.69 0.22 [-0.06 , 0.47]
Yindra 1998 a 119 12.86 0.37 [ 0.20 , 0.52]
Yindra 1998 b 158 14.01 0.37 [ 0.23 , 0.50]
Alexander et al. 2000 338 16.35 0.24 [ 0.14 , 0.34]
Paolo et al. 2003 308 16.12 0.42 [ 0.32 , 0.51]
Total (95% CI) 1657
100.0 0.27 [0.16 , 0.38] Test of heterogeneity: Q-value = 26.539, Df = 6, P-value = 0.0002
– 1 – 0.5 0 0.5 1
Fig 3: Correlation Coefficient between NBME II (predictor) and Supervisor rating (outcome)

96
Study name Sample size Correlation(Random)
95% CI Weight
% Correlation(Random)
95% CI Markert 1993 481 11.31 0.30 [ 0.22 , 0.38]
Smith 1993 203 9.09 0.29 [ 0.16 , 0.41]
Kahn et al. 2001 50 4.33 0.30 [ 0.02 , 0.53]
Yindra 1998 a 119 7.30 0.28 [ 0.11 , 0.44]
Yindra 1998 b 158 8.27 0.19 [ 0.04 , 0.34]
Alexander et al. 2000 338 10.52 0.32 [ 0.22 , 0.41]
Paolo et al. 2003 308 10.28 0.49 [ 0.40 , 0.57]
Callhan et al 2000 2158 13.10 0.20 [ 0.16 , 0.24]
Pearson et al 1998 64 5.13 0.27 [ 0.03 , 0.48]
Richard 1962 139 7.84 0.33 [ 0.17 , 0.47]
Rabinowitz 1989 1458 12.82 0.16 [ 0.11 , 0.21]
Total (95% CI) 5476
100.0 0.28 [ 0.22 , 0.35] Test of heterogeneity: Q-value = 46.87, Df = 10, P-value < 0.0005
– 1 – 0.5 0 0.5 1
Fig 4: Correlation Coefficient between Clerkship GPA (predictor) and Supervisor rating (outcome)
Study name Sample size Correlation(Fixed) 95% CI
Weight %
Correlation(Fixed) 95% CI
Smith 1993 203 22.6 0.27 [ 0.14 , 0.40]
Kahn et al. 2001 50 14.5 0.22 [-0.06 , 0.47]
VU, N.V et al 1992 405 24.7 0.32 [0.23, 0.40]
Rutala 1992 76 17.4 0.36 [0.15, 0.54]
Wilkinson 2004 137 20.8 0.59 [0.47, 0.69]
Total (95% CI) 734
100.0 0.37 [0.22 , 0.50] Test of heterogeneity: Q-value = 1.0267, Df = 3 P-value = 0.7948
– 1 – 0.5 0 0.5 1
Fig 5: Correlation Coefficient between OSCE (predictor) and Supervisor rating (outcome)

97
Study name Sample size Correlation(Fixed)
95% CI Weight
% Correlation(Fixed)
95% CI Loftus et al. 1992 102 26.8 0.23 [ 0.04 , 0.41]
Yindra 1998 a 119 31.4 0.21 [ 0.03 , 0.38]
Yindra 1998 b 158 41.9 0.22 [ 0.07, 0.36]
Total (95% CI) 379
100.0 0.22 [0.12 , 0.31]
Test of heterogeneity: Q-value = 0.024, Df = 2, P-value = 0.988
– 1 – 0.5 0 0.5 1
Fig 6: Correlation Coefficient between Ranking (Dean’s letter) (predictor) and Supervisor rating (outcome)
Study name Sample size Correlation(Fixed) 95% CI
Weight %
Correlation(Fixed) 95% CI
Markert 1993 481 48.52 0.25 [ 0.16 , 0.33]
Loftus et al 1992 102 10.07 0.20 [ 0.01 , 0.38]
Yindra 1998 a 119 11.80 0.28 [ 0.11 , 0.44]
Yindra 1998 b 158 15.77 0.29 [ 0.14 , 0.43]
Richard et al 1962 139 13.84 0.23 [ 0.07 , 0.38]
Total (95% CI) 1657
100.0 0.25 [ 0.19 , 0.31] Test of heterogeneity: Q-value = 0.7399, Df = 4, P-value = 0.9463
– 1 – 0.5 0 0.5 1
Fig 7: Correlation Coefficient between Pre-clinical GPA (predictor) and Supervisor rating (outcome)
Study name Sample size Correlation(Fixed) 95% CI
Weight %
Correlation(Fixed) 95% CI
Markert 1993 628 20.9 0.56 [ 0.50 , 0.61]
Hojat et al. 1993 2368 79.1 0.60 [ 0.57 , 0.63]
Total (95% CI) 2996
100.0 0.59 [0.57 , 0.61] Test of heterogeneity: Q-value = 1.798, Df = 1, P-value = 0.180
– 1 – 0.5 0 0.5 1
Fig 8: Correlation Coefficient between NBME I (predictor) and NBME III (outcome)
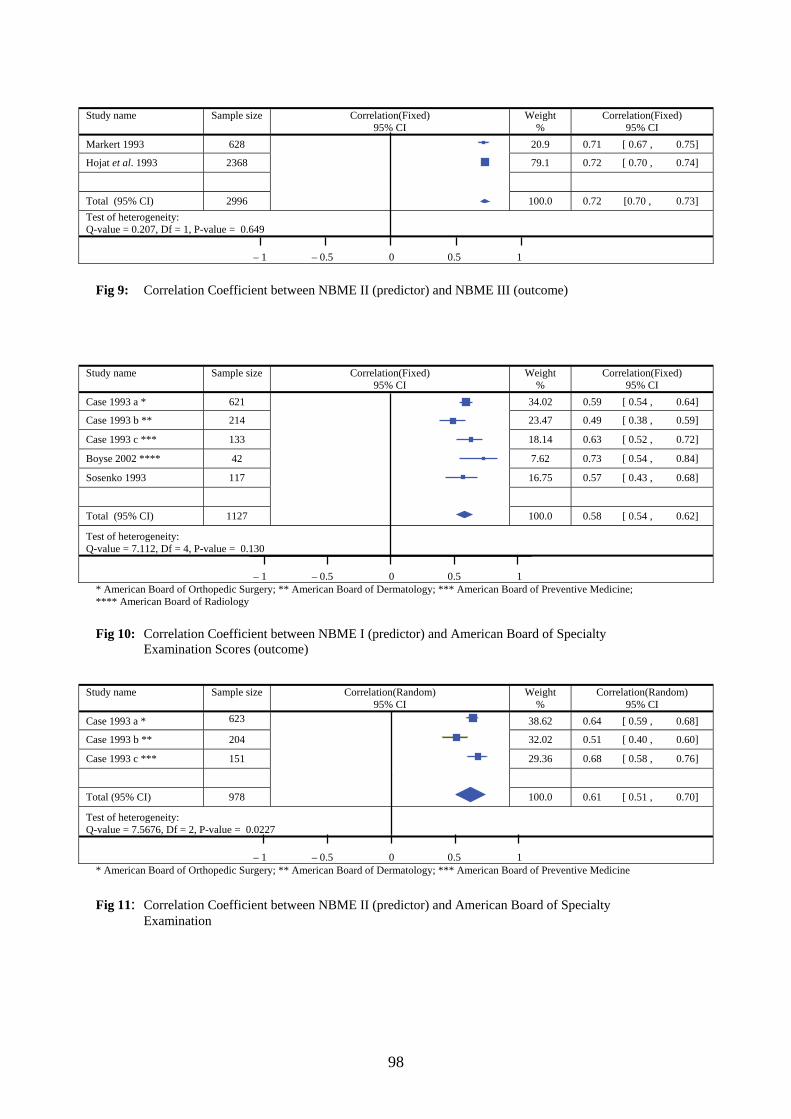
98
Study name Sample size Correlation(Fixed)
95% CI Weight
% Correlation(Fixed)
95% CI Markert 1993 628 20.9 0.71 [ 0.67 , 0.75]
Hojat et al. 1993 2368 79.1 0.72 [ 0.70 , 0.74]
Total (95% CI) 2996
100.0 0.72 [0.70 , 0.73] Test of heterogeneity: Q-value = 0.207, Df = 1, P-value = 0.649
– 1 – 0.5 0 0.5 1
Fig 9: Correlation Coefficient between NBME II (predictor) and NBME III (outcome)
Study name Sample size Correlation(Fixed) 95% CI
Weight %
Correlation(Fixed) 95% CI
Case 1993 a * 621 34.02 0.59 [ 0.54 , 0.64]
Case 1993 b ** 214 23.47 0.49 [ 0.38 , 0.59]
Case 1993 c *** 133 18.14 0.63 [ 0.52 , 0.72]
Boyse 2002 **** 42 7.62 0.73 [ 0.54 , 0.84]
Sosenko 1993 117 16.75 0.57 [ 0.43 , 0.68]
Total (95% CI) 1127
100.0 0.58 [ 0.54 , 0.62]
Test of heterogeneity: Q-value = 7.112, Df = 4, P-value = 0.130
– 1 – 0.5 0 0.5 1 * American Board of Orthopedic Surgery; ** American Board of Dermatology; *** American Board of Preventive Medicine; **** American Board of Radiology Fig 10: Correlation Coefficient between NBME I (predictor) and American Board of Specialty Examination Scores (outcome)
Study name Sample size Correlation(Random) 95% CI
Weight %
Correlation(Random) 95% CI
Case 1993 a * 623 38.62 0.64 [ 0.59 , 0.68]
Case 1993 b ** 204 32.02 0.51 [ 0.40 , 0.60]
Case 1993 c *** 151 29.36 0.68 [ 0.58 , 0.76]
Total (95% CI) 978
100.0 0.61 [ 0.51 , 0.70]
Test of heterogeneity: Q-value = 7.5676, Df = 2, P-value = 0.0227
– 1 – 0.5 0 0.5 1 * American Board of Orthopedic Surgery; ** American Board of Dermatology; *** American Board of Preventive Medicine Fig 11: Correlation Coefficient between NBME II (predictor) and American Board of Specialty Examination