Embed Size (px)
Citation preview

i
©Copyright 2015
Julee Alaina Floyd
ii
Drug Encapsulated Aerosolized Microspheres as a Biodegradable, Intelligent
Glioma Therapy
Julee Alaina Floyd
A dissertation
submitted in partial fulfillment of the
requirements for the degree of
Doctor of Philosophy
University of Washington
2015
Reading Committee:
Buddy D. Ratner, Chair
Suzie H. Pun
Shaoyi Jiang
Program Authorized to Offer Degree:
Chemical Engineering
iii
University of Washington
Abstract
Drug Encapsulated Aerosolized Microspheres as a Biodegradable, Intelligent Glioma Therapy
Julee Alaina Floyd
Chair of the Supervisory Committee:
Professor Buddy D. Ratner
Departments of Bioengineering and Chemical Engineering
The grim prognosis for patients diagnosed with malignant gliomas necessitates the development
of new therapeutic strategies for localized and sustained drug delivery to combat tumor drug
resistance and regrowth. Here we introduced the novel formulation of drug encapsulated
aerosolized microspheres as a biodegradable, intelligent glioma therapy (DREAM BIG Therapy)
that is applied post-resection. DREAM BIG Therapy consists of three types of microspheres
[poly(lactic acid) (PLA), poly(lactic-co-glycolic acid) (PLGA), and poly(ε-caprolactone) (PCL)]
containing various encapsulated chemotherapeutics, suspended in a degradable, aqueous poly(N-
isopropylacrylamide) (PNIPAM) solution. The thermoresponsive PNIPAM solution is capable of
suspending drug encapsulated microspheres at room temperature which can be “sprayed on” the
post-surgical site. The physiological temperature of the treatment site (37°C) would cause
PNIPAM solution to solidify and form an adherent gel layer with entrapped microspheres,
providing intimate contact with remaining tumor cells. Over time, PLGA (rapid degradation),
PLA (medium speed degradation), and then PCL (slow degradation) microspheres would break
iv
down, releasing their drug payloads in a sequential, multi-drug release directly to the tumor site,
addressing cancerous regrowth and tumor drug resistance. This dissertation will address the
development of DREAM BIG Therapy, from microsphere formulation to pilot in vivo studies.
Initial work focused on developing blank and drug encapsulated microspheres using emulsion
techniques. Preliminary studies utilized rhodamine B as a model drug for encapsulation in
PLGA, PLA, and PCL particles and optimized formulation parameters to achieve a high
encapsulation. Then, gefitinib, IgG, and lomustine were encapsulated in PLGA, PLA, and PCL
microspheres, respectively, achieving encapsulation efficiencies greater than 80% and drug
loadings greater than 0.3%. The in vitro release of gefitinib and IgG were also studied. Gefitinib
released from PLGA microspheres over 40 days while the release of IgG from PLA
microspheres was slower, over a year long period.
The microsphere-PNIPAM system was tested for aerosolized application ex vivo. The aqueous
PNIPAM solution suspended the microspheres and was aerosolized before phase transitioning to
an adherent gel layer on the tissue, entrapping the microspheres on the tissue surface. Finally,
when tested in vivo, the gefitinib encapsulated PLGA microspheres entrapped in PNIPAM
slowed the tumor volume growth of a subcutaneous C6 glioma in comparison to blank PLGA
microspheres entrapped in PNIPAM. Overall, this research confirms the potential of DREAM
BIG therapy for future use with multiple chemotherapeutics and microsphere types to combat
gliomas at a localized site.
v
Acknowledgements
This work would not have been possible without the support and guidance of my advisor, Dr.
Buddy Ratner. I am grateful to him for giving me the chance to work in his lab and on a project
from the concept stage progressing to the point of in vivo studies. Whenever I went down a rabbit
hole, Dr. Ratner was there with advice that would put me back on track. I would also like to
thank my committee members, Dr. Shaoyi Jiang, Dr. Suzie Pun, and Dr. Pierre Mourad. Your
guidance, expertise, and belief in my project’s potential were vital throughout the PhD process.
Thanks are given to my collaborators in the Department of Neurological Surgery, Dr. Rohan
Ramakrishna and Dr. Robert Rostomily, who with Dr. Ratner, originally came up with the
concept of the DREAM BIG Therapy. I would also like to acknowledge the National Science
Foundation Graduate Research Fellowship No. DGE-0718124, UWEB21, and the Michael and
Myrna Darland Endowment for their generous funding that made this work possible.
The Ratner lab group, both past and present, are thanked for providing insightful and helpful
discussions throughout this project. Specific thanks are given to Dr. Anna Galperin, my fellow
collaborator and polymer chemist who was always there to listen and give technical advice and
troubleshooting tips. This project would not have progressed so far without your help! Thanks
are also given to Colleen Irvin who provided vital assistance in all the in vivo work, listened to
my rants, and provided several sanity-checking moments. The undergraduate researcher
Douglas Chung is acknowledged for his rhodamine B encapsulation work and for teaching me
what it means to be a mentor.
vi
Outside of the lab, thanks are given to Susan Fredendall who listened to all my lab stories and
practice talks and who had the guts to read this entire dissertation, to my old Clemson lab
member, Joshua Barringer, who was there with ice cream to perk me up, and to Jason Murray,
my master statistician who taught me more than I ever wanted to know about t tests. Special
thanks are given to Dr. Michael Kilbey who first introduced me to research as an undergraduate
at Clemson University and who kept tabs on me throughout my entire PhD career. Your advice
for choosing a graduate school and project were spot on and I would not be here without your
guidance and enthusiasm for science.
To my friends, thank you for making sure I had a life outside of research, for randomly cooking
me dinners, and for making sure I had a memorable Seattle experience. Special thanks are given
to Salle Auriol Seattle and Magnolia Ridge Training Center for giving me opportunities to de-
stress, whether it was hitting someone with a metal stick or playing with horses. Finally, to my
family, thank you yet again for supporting me as I pursued another scientific endeavor. I would
not have survived without your continued encouragement and support throughout these studies.
vii
Table of Contents
Acknowledgements ......................................................................................................................... v
List of Abbreviations ..................................................................................................................... xi
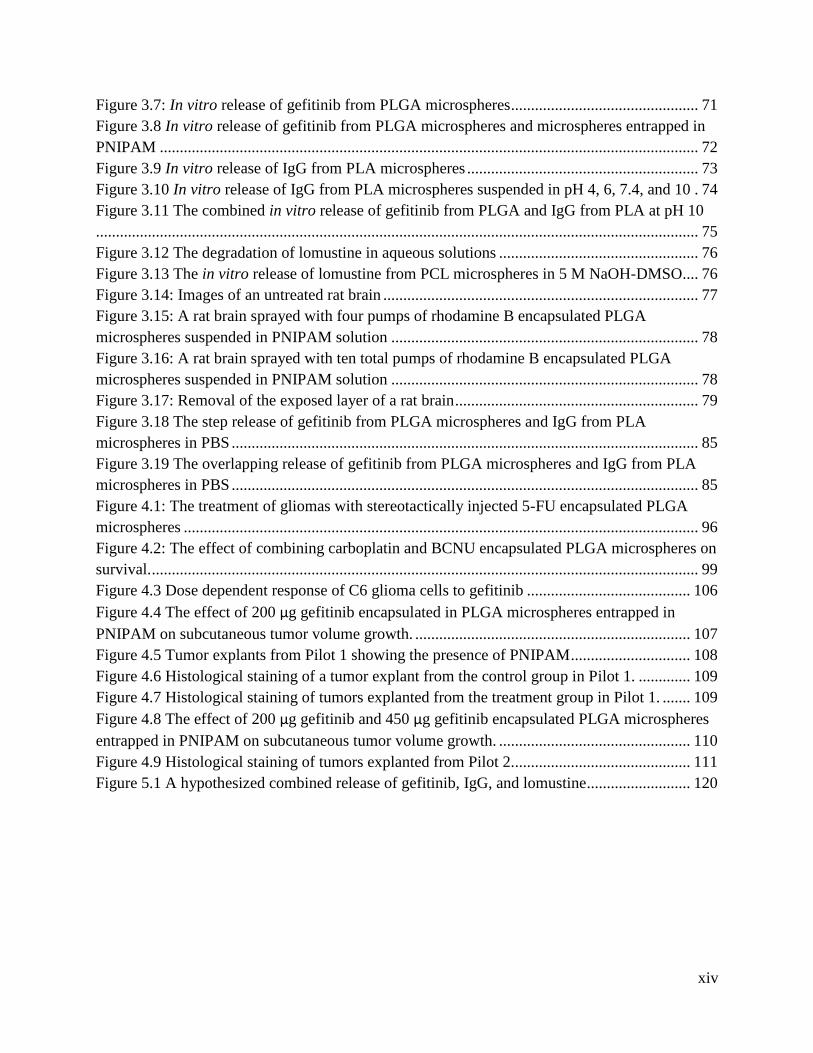
List of Figures .............................................................................................................................. xiii
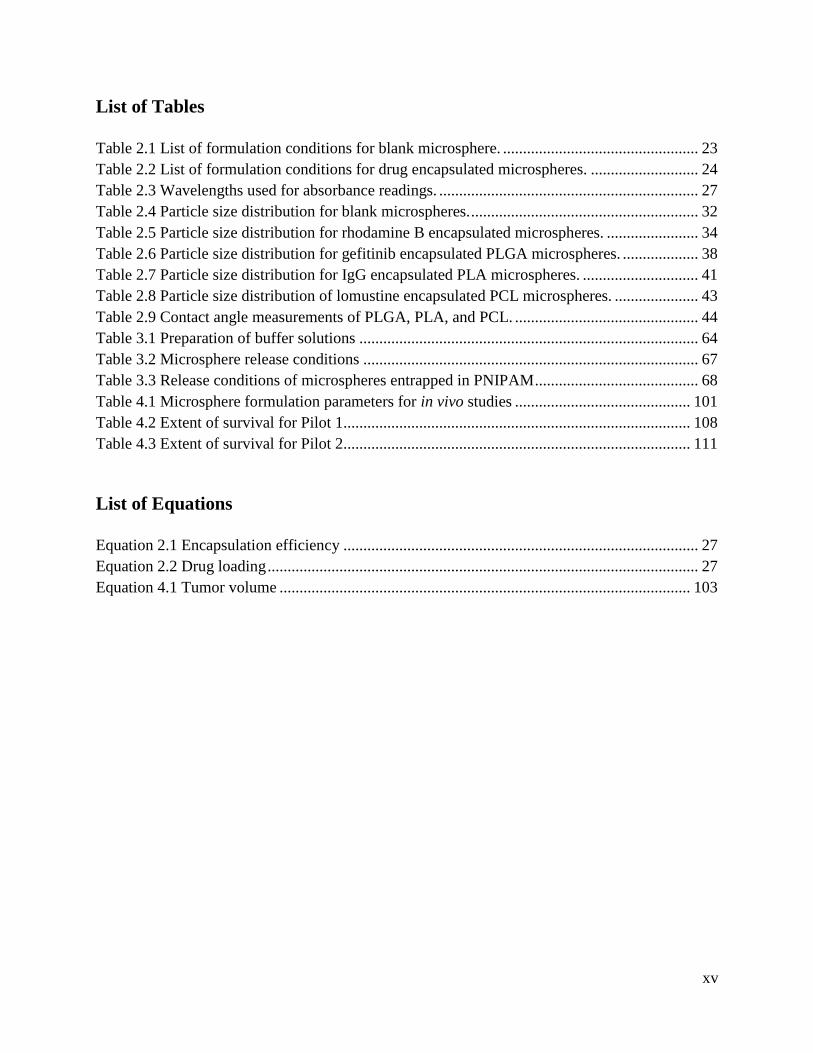
List of Tables ................................................................................................................................ xv
List of Equations ........................................................................................................................... xv
1 Introduction ............................................................................................................................. 1
1.1 Glioma Survival and Diagnosis............................................................................................. 1
1.2 Surgical Excision, Radiation Therapy, and Chemotherapy .................................................. 2
1.3 Limitations of Current Therapies .......................................................................................... 4
1.4 Intracerebral Drug Delivery Strategies for Glioma Treatment ............................................. 6
1.5 Drug Encapsulated Aerosolized Microspheres as a Biodegradable, Intelligent Glioma
Therapy........................................................................................................................................ 8
1.6 Overview ............................................................................................................................. 10
2 Formulation and Characterization of Blank and Drug Encapsulated Polymeric Microspheres
and Synthesis of Degradable PNIPAM ......................................................................................... 12
2.1 Background ......................................................................................................................... 12
2.1.1 Motivation .................................................................................................................... 12
2.1.2 Microsphere Formulation and Characterization ........................................................... 12
2.1.3 Chemotherapeutic Choice ............................................................................................. 18
2.1.4 Degradable PNIPAM .................................................................................................... 19
2.2 Hypothesis ........................................................................................................................... 20
2.3 Materials and Methods ........................................................................................................ 21
2.3.1 Materials ....................................................................................................................... 21
2.3.1.1 Materials for Microsphere Formulation ................................................................ 21
2.3.1.2 Materials for PNIPAM Synthesis ......................................................................... 21
2.3.2 Microsphere Formulation ............................................................................................. 22
2.3.3 Microsphere Characterization ....................................................................................... 25
2.3.3.1 Microscopy Characterization ................................................................................ 25
2.3.3.2 Particle Sizing ....................................................................................................... 25
2.3.3.3 Encapsulation Efficiency and Drug Loading ........................................................ 25
viii
2.3.4 Polymer Spin Coating and Contact Angle Measurements ........................................... 27
2.3.5 Synthesis of Linear PNIPAM ....................................................................................... 28
2.3.5.1 Synthesis of the Di-functional Macroinitiator ...................................................... 28
2.3.5.2 Synthesis of the Ligand Tris[2-(dimethylamino)ethyl]amine (ME6TREN) ......... 29
2.3.5.3 Synthesis of Linear PNIPAM (20k) ...................................................................... 29
2.3.6 Analysis of Macroinitiator, Ligand, and PNIPAM....................................................... 30
2.3.7 Testing Thermoresponsiveness of PNIPAM ................................................................ 31
2.4 Results ................................................................................................................................. 31
2.4.1 Non-encapsulated Polymeric Microsphere Formulation .............................................. 31
2.4.2 Rhodamine B Encapsulated Polymeric Microspheres.................................................. 33
2.4.3 Fluorescein Encapsulated Polymeric Microspheres ..................................................... 36
2.4.4 Gefitinib Encapsulated PLGA Microspheres ............................................................... 37
2.4.5 IgG Encapsulated PLA Microspheres .......................................................................... 40
2.4.6 Lomustine Encapsulated PCL Microspheres ................................................................ 42
2.4.7 Contact Angle Measurements of PLGA, PLA, and PCL ............................................. 44
2.4.8 Analysis of Macroinitiator, Ligand, and PNIPAM....................................................... 44
2.4.8.1 Di-functional Macroinitiator ................................................................................. 44
2.4.8.2 Ligand (Me6TREN) .............................................................................................. 45
2.4.8.3 PNIPAM ............................................................................................................... 45
2.4.9 Thermoresponsiveness of PNIPAM ............................................................................. 45
2.5 Discussion ........................................................................................................................... 46
2.6 Conclusions ......................................................................................................................... 56
3 Evaluation of the In Vitro Drug Release ............................................................................... 58
3.1 Background ......................................................................................................................... 58
3.1.1 Motivation .................................................................................................................... 58
3.1.2 In Vitro Release of Drugs from Polymeric Microspheres ............................................ 58
3.1.3 Aerosolized PNIPAM ................................................................................................... 62
3.2 Hypothesis ........................................................................................................................... 62
3.3 Materials and Methods ........................................................................................................ 63
3.3.1 Materials ....................................................................................................................... 63
3.3.1.1 Materials for In Vitro Drug Release...................................................................... 63
ix
3.3.2 Buffer Preparation ........................................................................................................ 64
3.3.3 In Vitro Drug Release ................................................................................................... 64
3.3.3.1 Release from Microspheres ................................................................................... 64
3.3.3.2 Release from Microspheres Entrapped in PNIPAM ............................................. 67
3.3.4 Ex Vivo Spray Application of Rhodamine B-PLGA Microspheres in PNIPAM ......... 68
3.4 Results ................................................................................................................................. 69
3.4.1 In Vitro Release of Rhodamine B from PLGA Microspheres and PLGA Microspheres
Entrapped in PNIPAM........................................................................................................... 69
3.4.2 In Vitro Release of Gefitinib from PLGA Microspheres and PLGA Microspheres
Entrapped in PNIPAM........................................................................................................... 71
3.4.3 In Vitro Release of IgG from PLA Microspheres ......................................................... 72
3.4.4 Combined In Vitro Release of Gefitinib from PLGA microspheres and IgG from PLA
Microspheres ......................................................................................................................... 74
3.4.5 In Vitro Release of Lomustine from PCL microspheres .............................................. 75
3.4.6 Aerosolized Application of Rhodamine B-PLGA Microspheres in Degradable
PNIPAM ................................................................................................................................ 77
3.5 Discussion ........................................................................................................................... 79
3.6 Conclusions ......................................................................................................................... 89
4 In Vivo Evaluation of Gefitinib Encapsulated PLGA Microspheres Entrapped in PNIPAM 92
4.1 Background ......................................................................................................................... 92
4.1.1 Motivation .................................................................................................................... 92
4.1.2 Drug Encapsulated Polymeric Microspheres for Intracranial Tumor Therapy: In Vivo
Results ................................................................................................................................... 92
4.2 Hypothesis ......................................................................................................................... 100
4.3 Materials and Methods ...................................................................................................... 100
4.3.1 Materials ..................................................................................................................... 100
4.3.1.1 Materials for Cell Culture and Gefitinib Testing ................................................ 100
4.3.1.2 Materials for C6 Subcutaneous Injection and Treatment ................................... 100
4.3.2 Cell Culture................................................................................................................. 101
4.3.3 Growth Inhibition of Free Gefitinib on C6 Cells In Vitro .......................................... 101
4.3.4 Gefitinib-PLGA-PNIPAM against Subcutaneous Glioma Tumor ............................. 102
4.3.4.1 Pilot 1 .................................................................................................................. 102
x
4.3.4.2 Pilot 2 .................................................................................................................. 104
4.3.5 Histology Analysis: Hematoxylin and Eosin Stain and Trichrome Stain .................. 105
4.4 Results ............................................................................................................................... 106
4.4.1 Growth Inhibition of Free Gefitinib on C6 Cells In Vitro .......................................... 106
4.4.2 Effect of GB-PLGA-PNIPAM on Subcutaneous Glioma Tumors: Pilot 1 ................ 106
4.4.3 Effect of GB-PLGA-PNIPAM on Subcutaneous Glioma Tumors: Pilot 2 ................ 109
4.5 Discussion ......................................................................................................................... 111
4.6 Conclusion ......................................................................................................................... 117
5 Conclusions and Future Directions...................................................................................... 119
Appendix 1: Standard curves ...................................................................................................... 124
Appendix 2: Initial microsphere attempts ................................................................................... 127
Appendix 3: Encapsulation efficiency values of rhodamine B encapsulated PLGA, PLA, and
PCL microspheres ....................................................................................................................... 128
Appendix 4: Drug loading values of rhodamine B encapsulated PLGA, PLA, and PCL
microspheres ............................................................................................................................... 129
Appendix 5: Encapsulation efficiency values of gefitinib in PLGA .......................................... 129
Appendix 6: Drug loading values of gefitinib in PLGA ............................................................. 130
Appendix 7: Total amount of gefitinib encapsualted in PLGA .................................................. 130
Appendix 8: Encapsulation efficiency values of IgG in PLA..................................................... 131
Appendix 9: Drug loading values of IgG in PLA ....................................................................... 131
Appendix 10: Total amount of IgG encapsualted in PLA .......................................................... 132
Appendix 11: Encapsulation efficiency values of LMT encapsulated in PCL ........................... 132
Appendix 12: Drug loading values of LMT encapsulated in PCL ............................................. 133
Appendix 13: Total amount of LMT encapsulated in PCL ........................................................ 133
Appendix 14: Time points for measurements in the in vitro drug release. ................................. 134
Appendix 15: In vitro release of rhodamine B from PLGA microspheres (44 ± 17 µm) in PBS
and microspheres entrapped in PNIPAM ................................................................................... 135
Appendix 16: In vitro release of IgG from PLA microspheres with cumulative error ............... 135
Appendix 17: In vitro release of free IgG from PNIPAM .......................................................... 136
Appendix 18: Individual tumor measurements of Pilot Study 1. ................................................ 136
Appendix 19: Vertebrate Animals .............................................................................................. 136
6 References ........................................................................................................................... 137
xi
List of Abbreviations
5-FU 5-fluouracil
ATRP Atomic transfer radical polymerization
BCNU Bis-chloroethylnitrosourea
CED Convection enhanced delivery
Cl-PCL-CL Poly(caprolactone) based di-functional macroinitiator
CT Computed tomography
CuCl Copper chloride
DCM Dichloromethane
DI Deionized
DL Drug loading
DMEM Dulbecco’s Modified Eagle Medium
DMF Dimethylformamide
DMSO Dimethyl sulfoxide
DREAM BIG Drug encapsulated aerosolized microspheres as a biodegradable,
intelligent glioma therapy
EE Encapsulation efficiency
EGFR Epidermal growth factor receptor
EHDA Electrohydrodynamic atomization
EU Endotoxin Unit
FBS Fetal bovine serum
FDA Food and drug administration
GB Gefitinib
GB-PLGA Gefitinib encapsulated PLGA microspheres
GB-PLGA-PNIPAM Gefitinib encapsulated PLGA microspheres in PNIPAM
GBM Glioblastoma multiforme
H&E Hematoxylin and eosin
HCl Hydrochloric acid
HPLC High performance liquid chromatography
IACUC Institutional animal care and use committee
IC50 Half maximal inhibitory concentration
IgG Immunoglobulin G
IgG-PLA Immunoglobulin G encapsulated PLA microspheres
ISO International Organization of Standardization
IUdR 5-iodo-2’-deoxyuridine
LCST Lower critical solution temperature
LMT Lomustine
LMT-PCL Lomustine encapsulated PCL microspheres
M Molar
xii
Me6TREN Tris[2-(dimethylamino)ethyl]amine
MgSO4 Magnesium sulfate
MRI Magnetic resonance imaging
MTT 3-(4,5-dimethylthiazol-2-yl)-2,5-diphenytltetrazolium bromide
Mw Molecular weight
NaBH4 Sodium borohydride
NaHCO3 Sodium bicarbonate
NaOH Sodium hydroxide
NIPAM N-isopropyl acrylamide
NMR Nuclear magnetic resonance
O Oil phase of an emulsion
O/W Oil in water
PBS Phosphate buffered saline
PCL Poly(ε-caprolactone)
PCL diol Poly(ε-caprolactone) diol
PF-4/CTF C-terminal fragment of platelet factor 4
PLA Poly(lactic acid)
PLGA Poly(lactic-go-glycolic acid)
PMM 2.1.2 Poly(methylidene malonate 2.1.2)
PNIPAM Poly(N-isopropylacrylamide)
PVA Poly(vinyl alcohol)
Q% Frequency distribution of the particle size
RAFT Reversible addition fragmentation transfer
RB Rhodamine B
RT Room temperature
SEM Scanning electron microscopy
Std Dev Standard deviation
TEA Triethylamine
TGP Thermo-reversible gelation polymer
THF Tetrahydrofuran
TREN Tris(2-aminoethyl)amine
UV-vis Ultraviolet-visible
v/v Volume by volume
W1 Inner water phase of an emulsion
W2 Outer water phase of an emulsion
W/O/W, W1/O/W2 Water in oil in water
w/v Weight by volume
w/w Weight by weight
xiii
List of Figures
Figure 1.1: Gliadel® wafers applied to a brain tumor resection cavity .......................................... 5
Figure 1.2: The release of chemotherapeutics from multiple microspheres ................................... 9
Figure 2.1: Schematic of the oil in water solvent evaporation technique for microsphere
formation ....................................................................................................................................... 14
Figure 2.2: Schematic of the water in oil in water (W/O/W) solvent evaporation technique for
microsphere formation .................................................................................................................. 15
Figure 2.3: Physical characterization of microspheres ................................................................. 16
Figure 2.4: Synthesis of the degradable, di-functional macroinitiator. ......................................... 28
Figure 2.5: Synthesis of the ligand ME6TREN. ............................................................................ 29
Figure 2.6: Synthesis of linear PNIPAM. ..................................................................................... 30
Figure 2.7: SEM micrographs of blank polymeric microspheres ................................................. 32
Figure 2.8: The particle size distribution of blank PLGA microspheres ...................................... 33
Figure 2.9: Fluorescence micrographs of rhodamine B encapsulated microspheres .................... 34
Figure 2.10: SEM micrographs of rhodamine B encapsulated polymeric microspheres ............. 34
Figure 2.11: The encapsulation efficiency of rhodamine B encapsulated PLGA, PLA, and PCL
microspheres. ................................................................................................................................ 35
Figure 2.12: The drug loading of rhodamine B encapsulated PLGA, PLA, and PCL
microspheres. ................................................................................................................................ 36
Figure 2.13: Fluorescence micrographs of fluorescein encapsulated microspheres ..................... 37
Figure 2.14: Characterization of gefitinib encapsulated PLGA microspheres ............................. 38
Figure 2.15: The particle size distribution of gefitinib encapsulated PLGA microspheres .......... 39
Figure 2.16: The encapsulation efficiency of gefitinib encapsulated PLGA microspheres. ........ 39
Figure 2.17: The drug loading of gefitinib encapsulated PLGA microspheres. ........................... 40
Figure 2.18: Characterization of IgG encapsulated PLA microspheres ....................................... 41
Figure 2.19: The encapsulation efficiency of IgG encapsulated PLA microspheres. ................... 41
Figure 2.20: The drug loading of IgG encapsulated PLA microspheres. ..................................... 42
Figure 2.21 Characterization of lomustine encapsulated PCL microspheres ............................... 43
Figure 2.22 The encapsulation efficiency of lomustine encapsulated PCL microspheres. .......... 43
Figure 2.23 The drug loading of lomustine encapsulated PCL microspheres. ............................. 44
Figure 2.24: The thermoresponsiveness of an aqueous solution of degradable PNIPAM in PBS 45
Figure 2.25 A comparison of rhodamine B encapsulated microspheres ...................................... 47
Figure 3.1: In vitro release profile of 5-fluorouracil from PLGA microspheres .......................... 59
Figure 3.2: Release profiles of doxorubicin from two different PLGA copolymer compositions 60
Figure 3.3: The effect of particle size on drug release .................................................................. 61
Figure 3.4: In vitro release of rhodamine B from PLGA microspheres ....................................... 70
Figure 3.5: In vitro release of rhodamine B from PLGA microspheres entrapped in PNIPAM .. 70
Figure 3.6: In vitro release of rhodamine B from PLGA microspheres and microspheres
entrapped in PNIPAM................................................................................................................... 71
xiv
Figure 3.7: In vitro release of gefitinib from PLGA microspheres ............................................... 71
Figure 3.8 In vitro release of gefitinib from PLGA microspheres and microspheres entrapped in
PNIPAM ....................................................................................................................................... 72
Figure 3.9 In vitro release of IgG from PLA microspheres .......................................................... 73
Figure 3.10 In vitro release of IgG from PLA microspheres suspended in pH 4, 6, 7.4, and 10 . 74
Figure 3.11 The combined in vitro release of gefitinib from PLGA and IgG from PLA at pH 10
....................................................................................................................................................... 75
Figure 3.12 The degradation of lomustine in aqueous solutions .................................................. 76
Figure 3.13 The in vitro release of lomustine from PCL microspheres in 5 M NaOH-DMSO .... 76
Figure 3.14: Images of an untreated rat brain ............................................................................... 77
Figure 3.15: A rat brain sprayed with four pumps of rhodamine B encapsulated PLGA
microspheres suspended in PNIPAM solution ............................................................................. 78
Figure 3.16: A rat brain sprayed with ten total pumps of rhodamine B encapsulated PLGA
microspheres suspended in PNIPAM solution ............................................................................. 78
Figure 3.17: Removal of the exposed layer of a rat brain ............................................................. 79
Figure 3.18 The step release of gefitinib from PLGA microspheres and IgG from PLA
microspheres in PBS ..................................................................................................................... 85
Figure 3.19 The overlapping release of gefitinib from PLGA microspheres and IgG from PLA
microspheres in PBS ..................................................................................................................... 85
Figure 4.1: The treatment of gliomas with stereotactically injected 5-FU encapsulated PLGA
microspheres ................................................................................................................................. 96
Figure 4.2: The effect of combining carboplatin and BCNU encapsulated PLGA microspheres on
survival. ......................................................................................................................................... 99
Figure 4.3 Dose dependent response of C6 glioma cells to gefitinib ......................................... 106
Figure 4.4 The effect of 200 µg gefitinib encapsulated in PLGA microspheres entrapped in
PNIPAM on subcutaneous tumor volume growth. ..................................................................... 107
Figure 4.5 Tumor explants from Pilot 1 showing the presence of PNIPAM .............................. 108
Figure 4.6 Histological staining of a tumor explant from the control group in Pilot 1. ............. 109
Figure 4.7 Histological staining of tumors explanted from the treatment group in Pilot 1. ....... 109
Figure 4.8 The effect of 200 µg gefitinib and 450 µg gefitinib encapsulated PLGA microspheres
entrapped in PNIPAM on subcutaneous tumor volume growth. ................................................ 110
Figure 4.9 Histological staining of tumors explanted from Pilot 2............................................. 111
Figure 5.1 A hypothesized combined release of gefitinib, IgG, and lomustine .......................... 120
xv
List of Tables
Table 2.1 List of formulation conditions for blank microsphere. ................................................. 23
Table 2.2 List of formulation conditions for drug encapsulated microspheres. ........................... 24
Table 2.3 Wavelengths used for absorbance readings. ................................................................. 27
Table 2.4 Particle size distribution for blank microspheres. ......................................................... 32
Table 2.5 Particle size distribution for rhodamine B encapsulated microspheres. ....................... 34
Table 2.6 Particle size distribution for gefitinib encapsulated PLGA microspheres. ................... 38
Table 2.7 Particle size distribution for IgG encapsulated PLA microspheres. ............................. 41
Table 2.8 Particle size distribution of lomustine encapsulated PCL microspheres. ..................... 43
Table 2.9 Contact angle measurements of PLGA, PLA, and PCL. .............................................. 44
Table 3.1 Preparation of buffer solutions ..................................................................................... 64
Table 3.2 Microsphere release conditions .................................................................................... 67
Table 3.3 Release conditions of microspheres entrapped in PNIPAM ......................................... 68
Table 4.1 Microsphere formulation parameters for in vivo studies ............................................ 101
Table 4.2 Extent of survival for Pilot 1....................................................................................... 108
Table 4.3 Extent of survival for Pilot 2....................................................................................... 111
List of Equations
Equation 2.1 Encapsulation efficiency ......................................................................................... 27
Equation 2.2 Drug loading ............................................................................................................ 27
Equation 4.1 Tumor volume ....................................................................................................... 103
1
1 Introduction
1.1 Glioma Survival and Diagnosis
Malignant tumors that originate in the brain and spinal cord will be diagnosed in over 20,000
men and women in the United States in 2015 [1, 2]. Over half of these will prove fatal to the
patient. The fastest growing and most common malignant tumors originate in the glial or support
cells of the brain. These include astrocytomas, oligodendrogliomas, ependymomas, and the most
common and aggressive type, glioblastoma multiforme (GBM) [2, 3]. After diagnosis of a GBM,
a 12-15 month survival period is expected despite maximal therapy [4, 5]. The median survival is
age dependent, with a five year survival rate of 17%, 6%, and 4% for 20-44, 45-54, and 55-64
year olds, respectively [2]. Even benign or non-cancerous tumors are cause for concern. If left
untreated, they can continuously grow, destroying normal brain tissue until it becomes a life-
threatening illness. While risk factors include family history, radiation exposure, and immune
disorders, there are no known causes for brain cancer and thus cannot be prevented.
Currently, there are no widely practiced methods to screen for brain tumors. Common indicative
symptoms include blurred visions, balance problems, headache, nausea, seizures, vomiting,
numbness in parts of the body, and changes in speech, hearing, personality, or moods [2, 6].
After performing neurological exams to test the central nervous systems, doctors can order
several different tests to image the brain, looking for abnormal tissue. The most commonly used
are magnetic resonance imaging (MRI) and computed tomography (CT) [2, 6]. MRIs utilize
radio waves and strong magnetic fields to image and differentiate between soft tissues of brain,
providing detailed images of the location and growth of abnormal tissue. However, they do not
look at bones or in this case, the skull, and require lengthy scans while the patient is confined in
2
a narrow tube. CTs, on the other hand, use x-rays to map out the soft tissue and bones of a
patient. While the image is not as detailed as an MRI, they take less time and patients are less
confined. Unfortunately, these imaging tests only tell that there may be a tumor present, but not
what type of tumor (benign or malignant). Therefore, a biopsy procedure entailing the physical
removal of a piece of the tumor tissue is performed and the sample tested to diagnose tumor type.
Other possible tests include a positron emission tomography scan as an imaging aide and lumbar
punctures to test for tumor cells in the cerebrospinal fluid.
1.2 Surgical Excision, Radiation Therapy, and Chemotherapy
After diagnosis of a brain tumor, treatment options include a combination of tumor resection,
radiation therapy, and both systemic and localized chemotherapy. If the tumor location is
operable, the first step is usually tumor resection. The surgeon removes as much of the tumor as
possible without causing a loss of brain function to the patient. While some types of brain tumors
like ependymomas and gangliogliomas are operable and may be cured from surgery alone,
astrocytomas, oligodendrogliomas, and GBMs are infiltrative and cannot be fully removed
without causing brain damage [2]. If left unchecked, the tumor remnants eventually grow back.
In general, tumor reoccurrence is within 2 cm of the primary tumor site due to this issue [7]. Side
effects of tumor resections include loss of brain function, general weakness and headaches, and
the possibility of infection and brain swelling [2, 6]. Yet, these risks are considered minor when
compared to the benefit of a reduced tumor mass.
Radiation therapy is another common treatment applied after tumor resection or as the main
treatment if the tumor is inoperable. High-energy rays are concentrated on the tumor location to
3
kill tumor cells over several sessions [2, 6]. While radiation therapy targets the tumor cells, it
can also be harmful to normal cells. Side effects include brain function loss, irritability, fatigue,
nausea, and vomiting. In addition, there is a risk that the radiation can cause a second tumor due
to damage of normal cell genes. Like tumor resection, these risks are balanced by the possibility
of killing tumor cells and needing less chemotherapy.
Chemotherapy is the third common treatment for tumors and requires the application of drugs to
kill cancer cells. This can be done systemically, either orally or intravenously, or locally at the
tumor site. The treatments can be done alone or in combination with tumor resection and
radiation therapy [2, 6, 8]. While there are many types of anti-cancer drugs, there are only a few
that are able to reach the brain when applied systemically due to the blood brain barrier. This
barrier consists of small blood vessels with tight junctions that surrounds and protect the brain,
maintaining metabolic balance. However, the characteristic tight junctions and selectivity of this
barrier makes it difficult for most drugs to penetrate from the blood stream to the brain.
Therefore, drug options are limited. A few of the currently used drugs include cisplatin,
temozolomide, vincristine, procarbazine, etoposide, carmustine, and carboplatin [2]. Common
side effects of chemotherapeutics applied intravenously include loss of appetite, headaches,
nausea, vomiting, fevers, weakness, infections, bruising, weakness, tiredness, hair loss, and
mouth sores [2, 6]. These side effects are due to the drugs indiscriminately targeting all rapidly
dividing cells which not only include tumor cells but also bone marrow, hair follicles, and the
lining of the mouth and intestines. When applied systemically, these drugs get the chance to
impact all of these cell types, lowering the overall quality of life for the patient. In addition, these
4
drugs are given in cycles that last for a few weeks, necessitating the patient to come into the
clinic several times to receive treatment.
The only FDA approved intracerebral or localized therapy is the application of Gliadel® wafers
to the site of tumor resection. Over a period of approximately two to four weeks, these wafers
degrade and release the anti-cancer drug, carmustine, in a controlled delivery to tumor remnants.
These wafers limit the severe side effects typical of systemic delivery by releasing their drug at a
localized site, which by-passes the blood brain barrier and reduces the total amount of drug
needed to reach therapeutic levels. The wafers are composed of a degradable, polymeric matrix
of 1,3-bis(p-carboxyphenoxy)propane and sebacic acid in a 20 to 80 molar ratio loaded with 7.7
mg carmustine [9]. Combined with tumor resection and radiation therapy, the GLIADEL®
wafers increased patient survival by approximately two months and are a current standard of care
for brain tumor patients [10]. Drawbacks may include the risk of infection, seizures, and brain
edemas [11].
1.3 Limitations of Current Therapies
Even when surgical excision, radiation therapy, and chemotherapy are applied in combination
and maximal treatment is given, the survival still remains poor at 12-15 months [4, 5]. The bleak
survival rate is attributed to such factors as tumor drug resistance, intracellular drug metabolism,
and limited drug uptake, in part due to the major obstacle of the blood brain barrier, and tumor
regrowth [12-15]. For example, consider the current gold standard of care for GBMs, which
includes the application of Gliadel® wafers after tumor excision. When implanted, these dime
sized wafers provide a controlled release to remaining tumor cells that could not be surgically
5
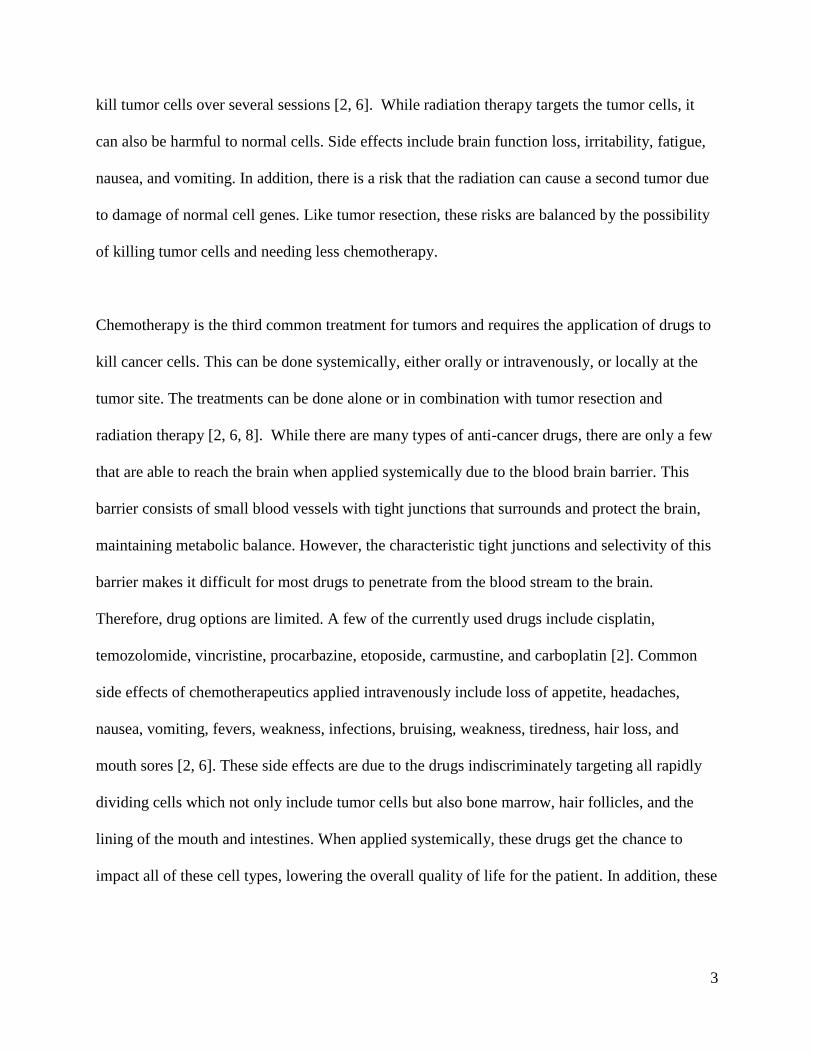
removed without causing loss of brain function. However, the wafers are not necessarily
impacting all the tumor cells. Due to the convoluted morphology of the brain and the tumor
resection cavity, these rigid, planar wafers are in poor surface contact with the brain tissue. As
shown in Figure 1.1, there are obvious areas where the wafers are not in contact with the tissue,
allowing tumor remnants to remain untreated.
Figure 1.1: Gliadel® wafers applied to a brain tumor resection cavity, showing sub-optimal
contact of the tissue and wafers [16]. Reprinted from Journal of Controlled Release, 159/1,
Wolinsky et al., Local drug delivery strategies for cancer treatment: Gels, nanoparticles,
polymeric films, rods, and wafers, 14-26, 2012, with permission from Elsevier.
Radiation therapy is also applied in combination with these wafers. However while radiation
therapy can cure some brain cancers such as medulloblastomas and germinomas, it will only
provide a limited control for astrocytomas, oligodendrogliomas, and ependymomas [17]. In
addition, there is the issue of drug resistance. Tumors can either develop a resistance to
chemotherapeutics or can be resistant to a range of anti-cancer drugs before chemotherapy is
even applied [15]. The drug encapsulated in the wafer, carmustine, has a potential resistance
mechanism through changes in O6-methylguanine-DNA methyltransferase, reduced
glutathione/glutathione-S-transferase, and protein kinase. Therefore, while the wafers may be
effective initially, they may not be effective long term. Even temozolomide, a very common and
popular chemotherapeutic applied systemically has a potential resistance mechanism through
6
changes in O6-methylguanine-DNA methyltransferase [15]. Greater drug sensitivity is achieved
when the promoter regions of the gene encoding the enzyme is methylated [18]. Therefore, a
multi-drug therapy is needed to overcome tumor drug resistance. However, the blood brain
barrier severely limits which drugs can be utilized. This presents the need for a sustained,
localized, multi-drug delivery system to overcome the blood brain barrier and the shortcomings
of the current therapies.
1.4 Intracerebral Drug Delivery Strategies for Glioma Treatment
To target the tumor remnants left after tumor resection and to bypass the blood brain barrier, the
scientific community has developed many different approaches for a localized drug delivery
system applied intracerebrally. These include manual injections, convection-enhanced delivery,
implantable reservoirs, and biodegradable drug carriers [5, 18-21]. While the manual injection of
chemotherapeutics to the cavity site is a simplistic approach, high risks of infections, edema, and
backflow limits it use today, especially with less invasive and more effective technique available
[5, 21].
Implantable reservoirs, such as the Ommaya reservoir, have also been used for malignant
gliomas. The Ommaya reservoir is a subcutaneous reservoir connected to a catheter that is
connected to the tumor bed through the skull [5, 21]. By manually compressing the reservoir,
chemotherapeutics are delivered through the catheter to the tumor bed. The risk of infection and
the inconvenience of having to refill the reservoir limits the wide scale clinical application of this
drug delivery device [21].
7
Biodegradable drug carriers such as the Gliadel® wafers have garnered much interest from the
scientific community due to their lack of systemic side effects, localized controlled drug release,
minimal complexity, and full biodegradation [19-21]. These carriers also include gels,
microcarriers, and nanocarriers [21]. However, biodegradable drug carriers have the distinct
drawback of a small penetration depth into the tissue from the site of injection, which coupled
with a high rate of elimination from the body, limits the therapeutic effectiveness of this
treatment [19, 21]. In addition, the biodegradable carrier size limits the amount of drug that can
be delivered.
To overcome limited diffusion and drug dosage, research has looked at convection enhanced
delivery (CED) [5, 19, 21, 22]. Using a pumping device connected to a stereotactically implanted
catheter, a drug solution is pressure driven into the cavity. This results in a larger volume of
drugs that can be “pumped” onto the brain that then spreads further, when compared to a
traditional diffusion drug delivery device such as the biodegradable carriers. However, a degree
of backflow is common in CED due to the pressure necessary to pump the fluid, up to 70 mmHg
[19]. This backflow could cause the drug to spread too much and lead to chemical meningitis and
neurotoxicity [5, 19, 22]. Other drawbacks include invasiveness, long infusion times, and high
intracranial pressure. Even so, CED is considered a potential therapy for GBM since it can
forcibly deliver drugs at high concentrations to the tumor and can easily be altered by the doctor
as needed [19].
Both biodegradable carriers and CED are promising methods of delivery, each with their own
drawbacks and advantages. As such, further research is still being conducted to overcome the
8
shortcomings discussed here and provide a therapy that can treat malignant gliomas and
ultimately, provide a long-term cure.
1.5 Drug Encapsulated Aerosolized Microspheres as a Biodegradable, Intelligent Glioma
Therapy
Even with the limited drug penetration depth, the biodegradable drug carriers such as the
Gliadel® wafers are promising avenues for intracranial delivery because of their controlled drug
release, minimization of systemic side effects by delivering to a localized site, bypassing the
blood brain barrier, and the potential for increased patient compliance by using a single treatment
that releases drug over several weeks to months. However, these wafers are only a two to four
week therapy. Therefore, biodegradable, drug encapsulated polymeric microspheres with a
longer, sustained release profile have received a lot of attention as an alternative type of drug
delivery vehicle [23-65].
Polymeric microspheres are well known for controlled drug delivery and review articles are
available [66-71]. Their implantation and degradation in the brain has been studied and
confirmed as biocompatible with experiments ranging from small animal experiments to Phase II
human trials [33, 34, 72-74]. As such, we will be utilizing microspheres as the vehicles for our
drug delivery to gliomas. However, instead of the commonly used single polymer type
microsphere, we will be utilizing three different, FDA recognized, biodegradable polymers:
poly(lactic-co-glycolic acid) (PLGA), poly(lactic acid) (PLA), and poly(ε-caprolactone) (PCL)
[75]. Each of these polymers has their own, unique degradation rate, resulting with a multi-
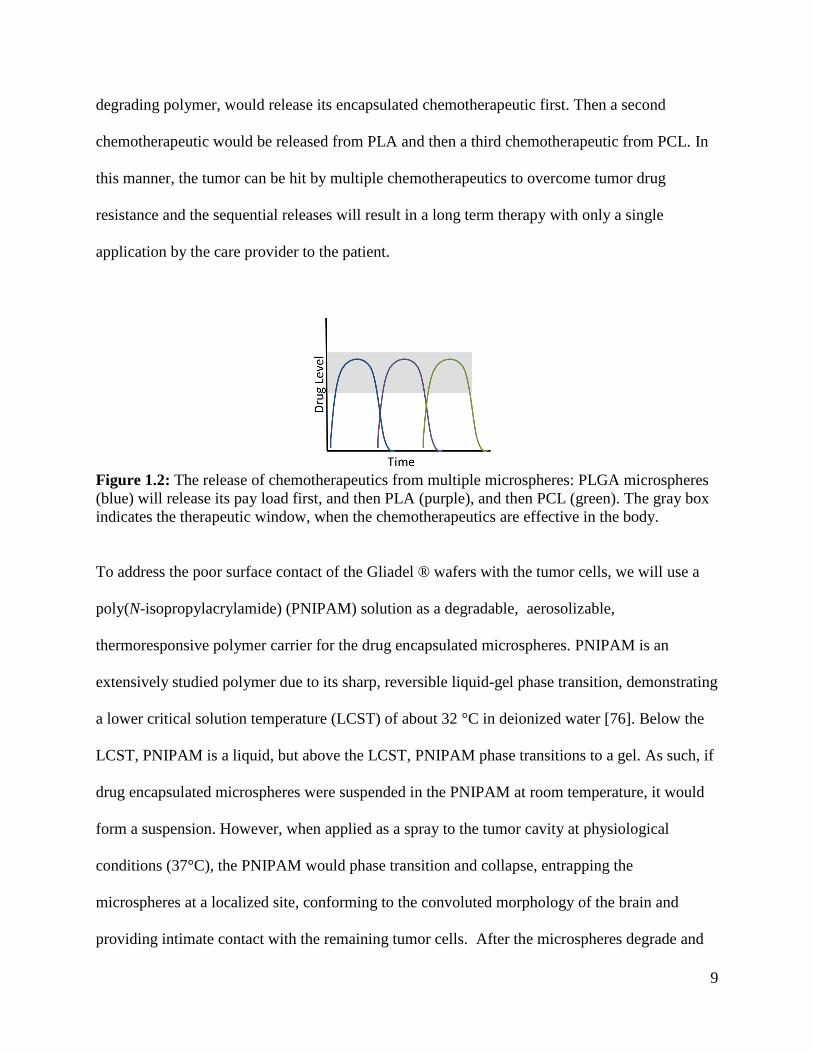
staged, sequential drug release when applied in combination (Figure 1.2). PLGA, the fastest
9
degrading polymer, would release its encapsulated chemotherapeutic first. Then a second
chemotherapeutic would be released from PLA and then a third chemotherapeutic from PCL. In
this manner, the tumor can be hit by multiple chemotherapeutics to overcome tumor drug
resistance and the sequential releases will result in a long term therapy with only a single
application by the care provider to the patient.
Figure 1.2: The release of chemotherapeutics from multiple microspheres: PLGA microspheres
(blue) will release its pay load first, and then PLA (purple), and then PCL (green). The gray box
indicates the therapeutic window, when the chemotherapeutics are effective in the body.
To address the poor surface contact of the Gliadel ® wafers with the tumor cells, we will use a
poly(N-isopropylacrylamide) (PNIPAM) solution as a degradable, aerosolizable,
thermoresponsive polymer carrier for the drug encapsulated microspheres. PNIPAM is an
extensively studied polymer due to its sharp, reversible liquid-gel phase transition, demonstrating
a lower critical solution temperature (LCST) of about 32 °C in deionized water [76]. Below the
LCST, PNIPAM is a liquid, but above the LCST, PNIPAM phase transitions to a gel. As such, if
drug encapsulated microspheres were suspended in the PNIPAM at room temperature, it would
form a suspension. However, when applied as a spray to the tumor cavity at physiological
conditions (37°C), the PNIPAM would phase transition and collapse, entrapping the
microspheres at a localized site, conforming to the convoluted morphology of the brain and
providing intimate contact with the remaining tumor cells. After the microspheres degrade and
10
release their payload, the PNIPAM would degrade, and hopefully, only cancer free tissue would
remain.
Overall, the novelty of drug encapsulated aerosolized microspheres as a biodegradable,
intelligent glioma therapy (DREAM BIG Therapy) is based on first, a multi-drug delivery system
using polymeric microspheres for a sequential therapy that can combat tumor drug resistance;
second, the PNIPAM transitions from an aerosolizable liquid to a conformal, adherent solid on
contact with the brain, providing an easy application to a complex, irregular surgical site; and
third, the entire system is fully biodegradable and only requires one application by the care giver
to the patient.
1.6 Overview
The purpose of the studies presented here is to develop a topical, slow release, degradable, multi-
drug delivery system applied post-surgically with the potential to significantly increase patient
life expectancy. This system consists of drug encapsulated PLGA, PLA, and PCL microspheres
suspended in a degradable, aerosolizable PNIPAM solution. At room temperature, the aqueous
PNIPAM solution suspends the drug encapsulated microspheres that can be “sprayed on” the
post-surgical site. The physiological temperature of the brain causes the thermoresponsive
PNIPAM to solidify and form an adherent gel layer with entrapped microspheres, providing
intimate contact with remaining tumor cells. Over time, PNIPAM degrades along with PLGA,
PLA, and then PCL microspheres, releasing multiple chemotherapeutics at different rates
directly to the tumor remnants to inhibit cancerous re-growth. Chapter 2 focuses on the
formulation and characterization of the drug encapsulated polymeric microspheres in addition to
11
the synthesis of the degradable PNIPAM. Chapter 3 addresses the in vitro drug release from the
formulated microspheres and the aerosolized delivery of PNIPAM to tissue at physiological
temperature ex vivo. Chapter 4 focuses on a subcutaneous tumor model that was used to test the
drug encapsulated PLGA microspheres entrapped in PNIPAM in vivo.
12
2 Formulation and Characterization of Blank and Drug
Encapsulated Polymeric Microspheres and Synthesis of
Degradable PNIPAM
2.1 Background
2.1.1 Motivation
There are numerous methods for formulating drug encapsulated polymeric microspheres and for
synthesizing PNIPAM. In this chapter, the methods chosen to formulate drug encapsulated
microspheres and to synthesize linear, degradable PNIPAM will be described and the results
discussed. In subsequent chapters, the products of these methods will be used for in vitro and in
vivo experiments.
2.1.2 Microsphere Formulation and Characterization
Polymeric microspheres for controlled drug delivery are well known and documented [66-68, 70,
77]. Their applications have ranged from the treatment of prostate cancer symptoms (Lupron
Depot®) to the treatment of alcoholism (Vivitrol®) and acromegaly (Somatuline Depot®) [70].
In most cases, these drug encapsulated microspheres are injectable, achieving a slow, sustained
release as the microsphere degrades. Unlike intravenous delivery where the drug is injected as a
bolus dosage and can be rapidly cleared by the body, the sustained release profile of
microspheres provides therapeutic levels long term, necessitating fewer treatments.
With the various applications of injectable microspheres achieving approval from the FDA for
drug delivery, it is not surprising that polymeric microspheres are used as a potential vehicle for
a localized, controlled release of chemotherapeutics for glioma therapy [23-65]. This type of

13
therapy has the advantage of being applied after tumor resection, overcoming the blood brain
barrier and enabling the delivery of drugs that have not successfully penetrated the blood brain
barrier. In addition, this type of therapy should have limited side effects when compared to
systemic delivery as the chemotherapeutics are localized to the tumor site and not circulating
throughout the entire body.
Some chemotherapeutics that have been successfully encapsulated in polymeric microspheres
include 5-fluoruracil (5-FU), bis-chloroethylnitrosourea (BCNU), camptothecin, carboplatin,
doxorubicin, imatinib mesylate, 5-iodo-2’-deoxyuridine (IUdR), mitoxantrone, paclitaxel,
temozolomide, C-terminal fragment of platelet factor 4, hemopexin, and antisense
oligonucleotides. The most common technique for formulating these drug encapsulated
microspheres is emulsion methodology [27-32, 37, 43-49, 78], while other options include
coacervation [38-40, 50] and spraying techniques [24, 51-54]. Since emulsion methodologies are
widely used for microspheres targeted for glioma therapy and are relatively simple to design and
carry out, they were used to create the drug encapsulated microspheres presented in this work.
The spraying techniques were not tested due to the necessary specialized equipment e.g. spray
dryers. Coacervation was as an alternative if the emulsion technique proved unsuccessful.
The emulsion methodology can either involve a single or a double emulsion depending on the
drug to be encapsulated. For hydrophobic chemotherapeutics, the single emulsion or oil in water
(O/W) emulsion is commonly used [27-30]. As shown in Figure 2.1, the polymer to form the
microsphere, PLGA or PLA for example, is dissolved in an organic solvent, usually methylene
chloride, along with the drug to be encapsulated. This “oil” solution is added to an aqueous
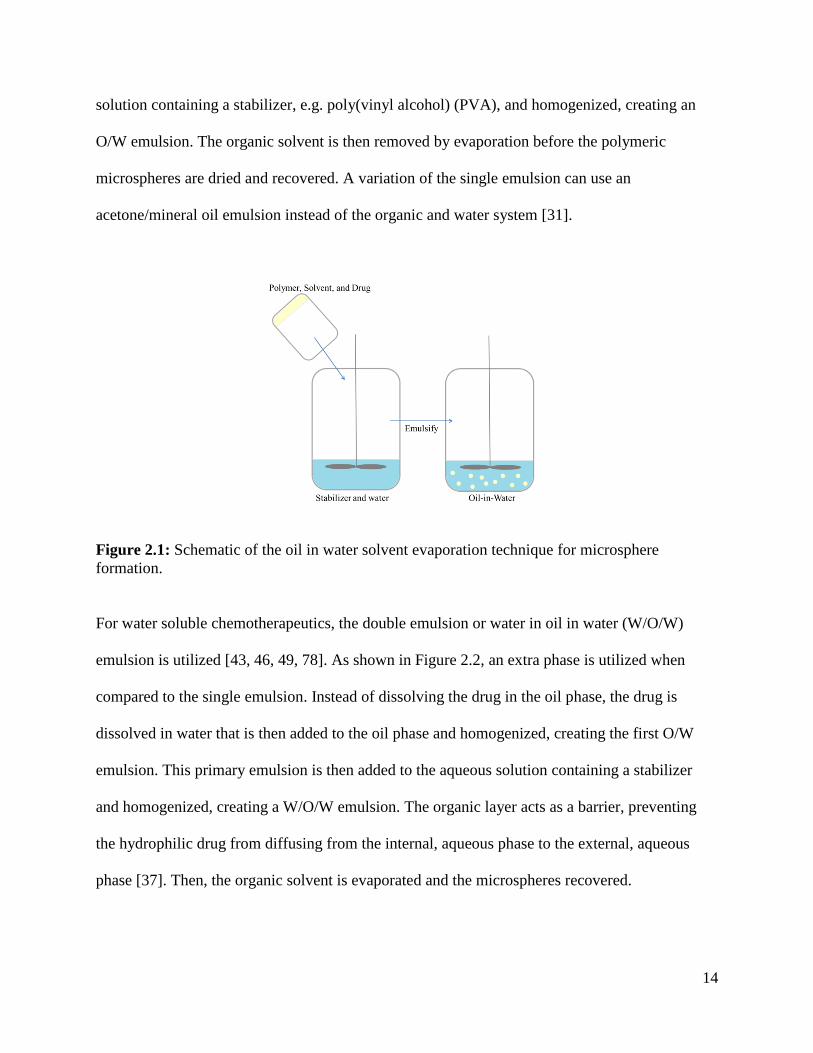
14
solution containing a stabilizer, e.g. poly(vinyl alcohol) (PVA), and homogenized, creating an
O/W emulsion. The organic solvent is then removed by evaporation before the polymeric
microspheres are dried and recovered. A variation of the single emulsion can use an
acetone/mineral oil emulsion instead of the organic and water system [31].
Figure 2.1: Schematic of the oil in water solvent evaporation technique for microsphere
formation.
For water soluble chemotherapeutics, the double emulsion or water in oil in water (W/O/W)
emulsion is utilized [43, 46, 49, 78]. As shown in Figure 2.2, an extra phase is utilized when
compared to the single emulsion. Instead of dissolving the drug in the oil phase, the drug is
dissolved in water that is then added to the oil phase and homogenized, creating the first O/W
emulsion. This primary emulsion is then added to the aqueous solution containing a stabilizer
and homogenized, creating a W/O/W emulsion. The organic layer acts as a barrier, preventing
the hydrophilic drug from diffusing from the internal, aqueous phase to the external, aqueous
phase [37]. Then, the organic solvent is evaporated and the microspheres recovered.
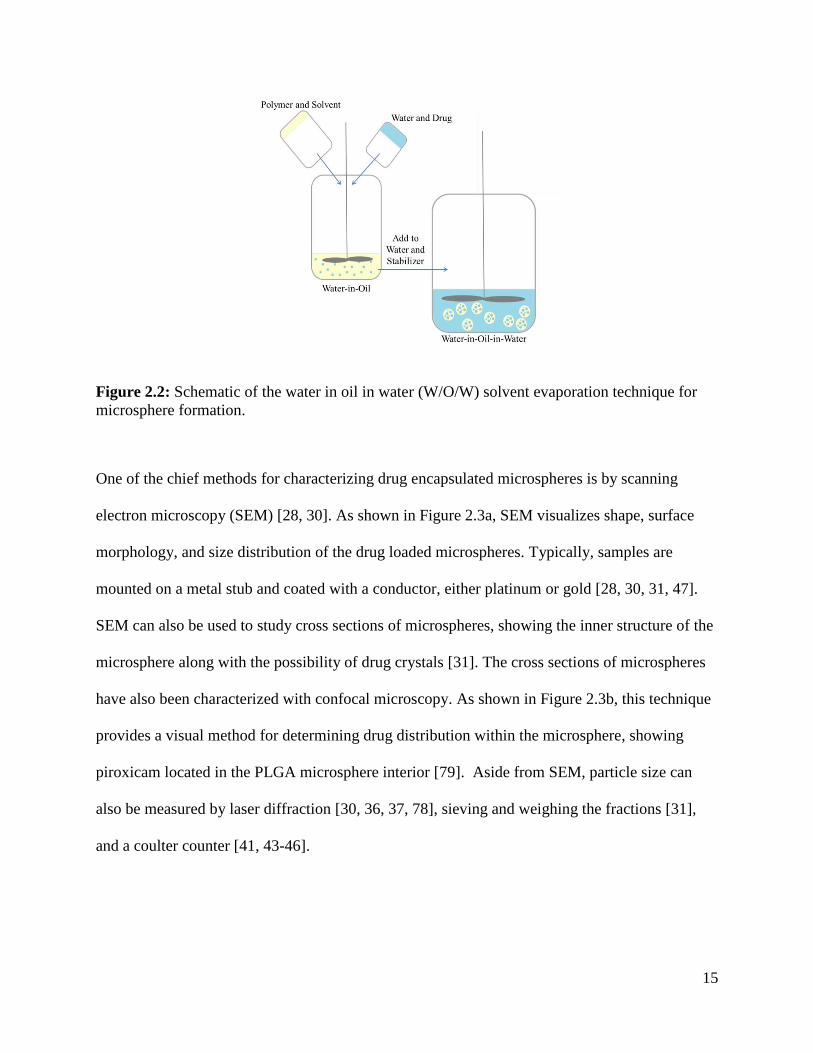
15
Figure 2.2: Schematic of the water in oil in water (W/O/W) solvent evaporation technique for
microsphere formation.
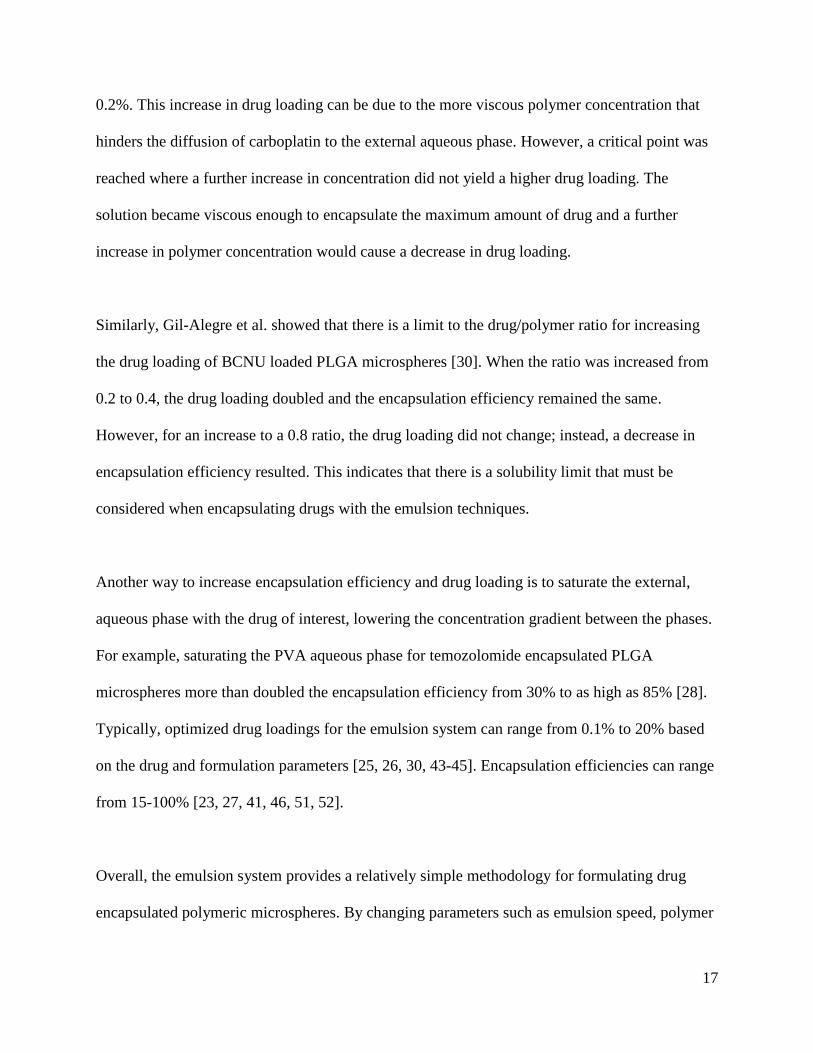
One of the chief methods for characterizing drug encapsulated microspheres is by scanning
electron microscopy (SEM) [28, 30]. As shown in Figure 2.3a, SEM visualizes shape, surface
morphology, and size distribution of the drug loaded microspheres. Typically, samples are
mounted on a metal stub and coated with a conductor, either platinum or gold [28, 30, 31, 47].
SEM can also be used to study cross sections of microspheres, showing the inner structure of the
microsphere along with the possibility of drug crystals [31]. The cross sections of microspheres
have also been characterized with confocal microscopy. As shown in Figure 2.3b, this technique
provides a visual method for determining drug distribution within the microsphere, showing
piroxicam located in the PLGA microsphere interior [79]. Aside from SEM, particle size can
also be measured by laser diffraction [30, 36, 37, 78], sieving and weighing the fractions [31],
and a coulter counter [41, 43-46].
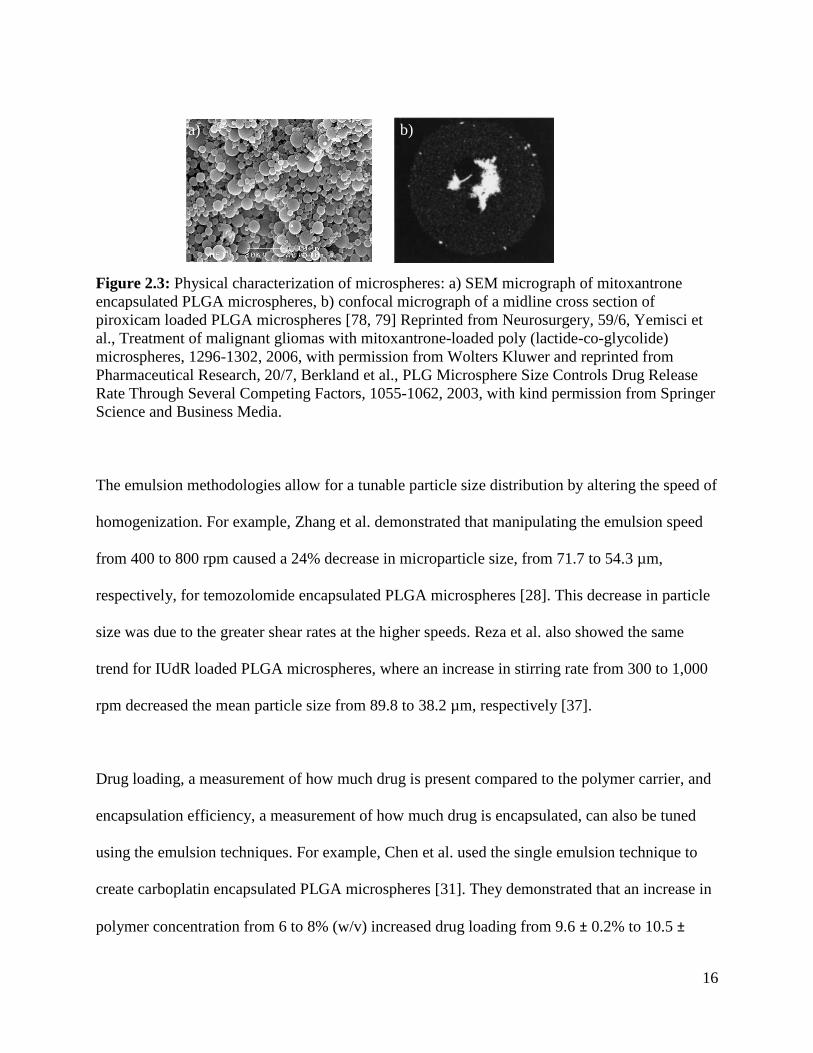
16
Figure 2.3: Physical characterization of microspheres: a) SEM micrograph of mitoxantrone
encapsulated PLGA microspheres, b) confocal micrograph of a midline cross section of
piroxicam loaded PLGA microspheres [78, 79] Reprinted from Neurosurgery, 59/6, Yemisci et
al., Treatment of malignant gliomas with mitoxantrone-loaded poly (lactide-co-glycolide)
microspheres, 1296-1302, 2006, with permission from Wolters Kluwer and reprinted from
Pharmaceutical Research, 20/7, Berkland et al., PLG Microsphere Size Controls Drug Release
Rate Through Several Competing Factors, 1055-1062, 2003, with kind permission from Springer
Science and Business Media.
The emulsion methodologies allow for a tunable particle size distribution by altering the speed of
homogenization. For example, Zhang et al. demonstrated that manipulating the emulsion speed
from 400 to 800 rpm caused a 24% decrease in microparticle size, from 71.7 to 54.3 µm,
respectively, for temozolomide encapsulated PLGA microspheres [28]. This decrease in particle
size was due to the greater shear rates at the higher speeds. Reza et al. also showed the same
trend for IUdR loaded PLGA microspheres, where an increase in stirring rate from 300 to 1,000
rpm decreased the mean particle size from 89.8 to 38.2 µm, respectively [37].
Drug loading, a measurement of how much drug is present compared to the polymer carrier, and
encapsulation efficiency, a measurement of how much drug is encapsulated, can also be tuned
using the emulsion techniques. For example, Chen et al. used the single emulsion technique to
create carboplatin encapsulated PLGA microspheres [31]. They demonstrated that an increase in
polymer concentration from 6 to 8% (w/v) increased drug loading from 9.6 ± 0.2% to 10.5 ±
a) b)
17
0.2%. This increase in drug loading can be due to the more viscous polymer concentration that
hinders the diffusion of carboplatin to the external aqueous phase. However, a critical point was
reached where a further increase in concentration did not yield a higher drug loading. The
solution became viscous enough to encapsulate the maximum amount of drug and a further
increase in polymer concentration would cause a decrease in drug loading.
Similarly, Gil-Alegre et al. showed that there is a limit to the drug/polymer ratio for increasing
the drug loading of BCNU loaded PLGA microspheres [30]. When the ratio was increased from
0.2 to 0.4, the drug loading doubled and the encapsulation efficiency remained the same.
However, for an increase to a 0.8 ratio, the drug loading did not change; instead, a decrease in
encapsulation efficiency resulted. This indicates that there is a solubility limit that must be
considered when encapsulating drugs with the emulsion techniques.
Another way to increase encapsulation efficiency and drug loading is to saturate the external,
aqueous phase with the drug of interest, lowering the concentration gradient between the phases.
For example, saturating the PVA aqueous phase for temozolomide encapsulated PLGA
microspheres more than doubled the encapsulation efficiency from 30% to as high as 85% [28].
Typically, optimized drug loadings for the emulsion system can range from 0.1% to 20% based
on the drug and formulation parameters [25, 26, 30, 43-45]. Encapsulation efficiencies can range
from 15-100% [23, 27, 41, 46, 51, 52].
Overall, the emulsion system provides a relatively simple methodology for formulating drug
encapsulated polymeric microspheres. By changing parameters such as emulsion speed, polymer
18
concentration, drug concentration, etc., we can formulate microspheres with tunable properties
such as particle size, encapsulation efficiency, and drug loading.
2.1.3 Chemotherapeutic Choice
With the wide range of chemotherapeutics that are available to encapsulate by using the
emulsion techniques, it was left to our collaborator, Dr. Rohan Ramakrishna (University of
Washington Department of Neurological Surgery), to determine which chemotherapeutics should
be utilized. Three chemotherapeutics were identified: gefitinib, bevacizumab, and lomustine.
Gefitinib (Iressa®) is an epidermal growth factor receptor tyrosine kinase inhibitor that prevents
uncontrolled cell proliferation. This drug is approved for use on non-small cell lung cancers and
is studied for other types of cancer [80]. Bevacizumab (Avastin®) is an antibody that prevents
angiogenesis by blocking the vascular endothelial growth factor A. It is approved for treatment
of colorectal, non-small cell lung, kidney cancer, and GBM [81]. Lomustine (CeeNU ®) is an
alkylating nitrosourea compound, which prevents cell replication, triggering cell death. It is
approved for the treatment of brain cancer due to its ability to readily penetrate the blood brain
barrier, Hodgkin’s disease, lung cancer, melanomas, and various solid tumors [82-84].
Gefitinib has been delivered orally for metastatic brain tumors with positive results [85-87].
Bevacizumab is applied intravenously for glioblastoma multiforme and is shown to help slow the
re-growth of certain brain tumors such as GBM; however, its effect on survival is still unclear
[2]. Lomustine is an FDA approved, oral drug for the treatment of brain tumor in patients who
have already had surgery or radiation therapy [88].

19
To date, gefitinib has been encapsulated in PCL microcapsules for use in subcutaneous drug
delivery, achieving capsules approximately 200 to 240 µm in size and a seven day release in
vitro [89]. Gefitinib has also been encapsulated in PLGA nanoparticles for the treatment of lung
and skin carcinoma [90]. Bevacizumab has been encapsulated in PLGA nanoparticles,
liposomes, and poly(ethylene glycol)-b-poly(D,L-lactic acid) microspheres for the treatment of
age-related macular degeneration [91-93]. However, neither gefitinib nor bevacizumab have
been encapsulated in polymeric microspheres for intracranial tumor therapy.
Lomustine has already been encapsulated in liposomes for the intravenous treatment of gliomas,
in chitosan nanoparticles for the treatment of human lung cancer, in PLA microspheres for
leukemia treatment, and in PLA microspheres acting as an embolic agent, causing obstruction in
arteries leading to the tumor and allowing for lomustine release [82, 83, 94, 95]. However,
reports of lomustine encapsulated in PCL microspheres or a long term release of lomustine
greater than three days were not found in the literature.
2.1.4 Degradable PNIPAM
PNIPAM, a biostable polymer, has been synthesized by numerous polymerizations techniques
ranging from atom transfer radial polymerization (ATRP) to surface-initiated,
photoiniferter-mediated photopolymerization to reversible addition fragmentation transfer
(RAFT) [76, 96, 97]. However, for the synthesis of a biodegradable PNIPAM, there are only
limited reports [98, 99]. In one study, a degradable PNIPAM hydrogel was synthesized using UV
polymerization of the monomer NIPAM with a benzo-2-methylene-1,3-dioxepen in the presence
20
of poly(ethylene glycol-co-glycolic acid) diacrylate. This created a hydrogel with degradable
ester bonds in both the backbone of the PNIPAM and crosslinking sites [98, 99].
Previously, our lab has reported the synthesis of a degradable, linear PNIPAM via ATRP [99].
ATRP was utilized to create a polymer with a controlled, tunable molecular weight of the parent
polymer and its degradation products. To create a degradable PNIPAM, a bi-functional,
degradable initiator containing PCL was incorporated in the polymer. The use of the bi-
functional initiator allowed the polymer chains to grow on both sides of the initiator at the same
rate. Therefore, when the polymer cleaves at the PCL linker, the polymer molecular weight
should be roughly halved. This was shown for a 2.29 x 10⁴ g/mol PNIPAM that had degradation
products of 1.38 x 10⁴ g/mol [99]. This linear PNIPAM also demonstrated an LCST of 30.8 °C,
ideal for our application of a room temperature microspheres suspension to an adherent layer at
physiological temperature and will be used in the work presented here.
2.2 Hypothesis
It is hypothesized that:
(1) Polymeric microspheres with a smooth morphology and a tunable particle size
distribution can be achieved using the emulsion techniques
(2) Gefitinib, bevacizumab (or a model of bevacizumab), and lomustine can be encapsulated
in PLGA, PLA, and PCL, microspheres, respectively
a. An encapsulation efficiency greater than 60% and a drug loading greater than
0.1% can be achieved for all three polymeric microspheres
21
(3) Degradable PNIPAM can by synthesized using ATRP that demonstrates a
thermoresponsive phase transition
2.3 Materials and Methods
2.3.1 Materials
2.3.1.1 Materials for Microsphere Formulation
Dichloromethane (DCM; EMD, HPLC grade), tetrahydrofuran (THF; EMD), hydrochloric acid
(HCl; EMD, 12.1 M), sodium hydroxide (NaOH; Mallinckrodt Chemicals), poly(lactic acid)
(PLA; gift to Ratner Lab, Mw unknown and Evonik Industries, Mw 58,000), poly(ε-
caprolactone) (PCL; Aldrich, Mn 70,000-90,000), poly(lactic-co-glycolic acid) 50:50 (PLGA;
Evonik Industries, Mw 60,000), poly(vinyl alcohol) (PVA; Sigma Aldrich, 98% hydrolyzed,
Mw 13,000-23,000), rhodamine B (RB; Sigma), fluorescein (Fluka), gefitinib (GB; Fisher, free
base >99%), immunoglobulin G from sheep serum (IgG; Sigma, ≥95%, lyophilized powder), and
lomustine (LMT; Enzo Life Sciences) were used as received.
2.3.1.2 Materials for PNIPAM Synthesis
Acetonitrile (EMD), chloroform (Sigma), diethyl ether (Sigma), dimethylformamide (DMF;
Sigma, anhydrous), dichloromethane (DCM; EMD, HPLC grade), formaldehyde solution
(Fisher), tetrahydrofuran (THF; EMD, anhydrous), acetic acid (Fisher, glacial), hydrochloric acid
(HCl; EMD, 12.1 M), sodium hydroxide (NaOH, EMD), N-isopropyl acrylamide (NIPAM;
Sigma), poly(caprolactone diol) (PCL diol; Sigma, Mn ~530), triethylamine (TEA; Sigma,
99.5%), copper chloride (CuCl; Sigma, ≥99%), sodium bicarbonate (NaHCO3; Fisher),
magnesium sulfate (MgSO4; J.T. Baker, anhydrous), 2-chloropropionyl chloride (Sigma), tris(2-
22
aminoethyl) amine (TREN, Sigma, 96%), sodium borohydride (Sigma), and aluminum oxide
(Fluka) were used as received.
2.3.2 Microsphere Formulation
PLGA, PLA, and PCL microspheres were produced by either a double or single emulsion,
solvent evaporation technique. Unless otherwise stated, the following steps were used to produce
microspheres by the double emulsion method. A total of 1.75 g of PLGA, PLA, or PCL was
dissolved in 35 mL of DCM (organic phase, O) and 0.5 g of PVA was dissolved in 50 mL of
deionized water (external water phase, W2). After dissolution, the organic phase was iced for 30
minutes to prevent solvent evaporation during emulsification. Then, 1500 µL of deionized water,
with or without the drug (inner water phase, W1), was added to the organic phase and
homogenized at 6000 rpm for two minutes using an Arrow 6000 electric stirrer and a five blade,
circular impeller. Seven mL of this oil in water solution was added to the PVA solution and
homogenized for one minute at a given speed (Table 2.1 and Table 2.2) creating a W1/O/W2
emulsion. This W1/O/W2 evaporated overnight before being stirred for 2 hours for further DCM
evaporation. The solution was then centrifuged (3000 g, 4 °C) for 15 minutes with three wash
cycles of deionized water before being filtered through two filters (Whatman Filter No. 4) to
remove spheres less than 10 µm in diameter. The remaining spheres were dried under vacuum
and stored in vials out of direct light. A schematic representation of this process is shown in
Figure 2.2.
To produce microspheres using the single emulsion technique, the double emulsion methodology
was used, with a few adaptations. The polymer was dissolved in 33.5 mL of DCM and the 1500
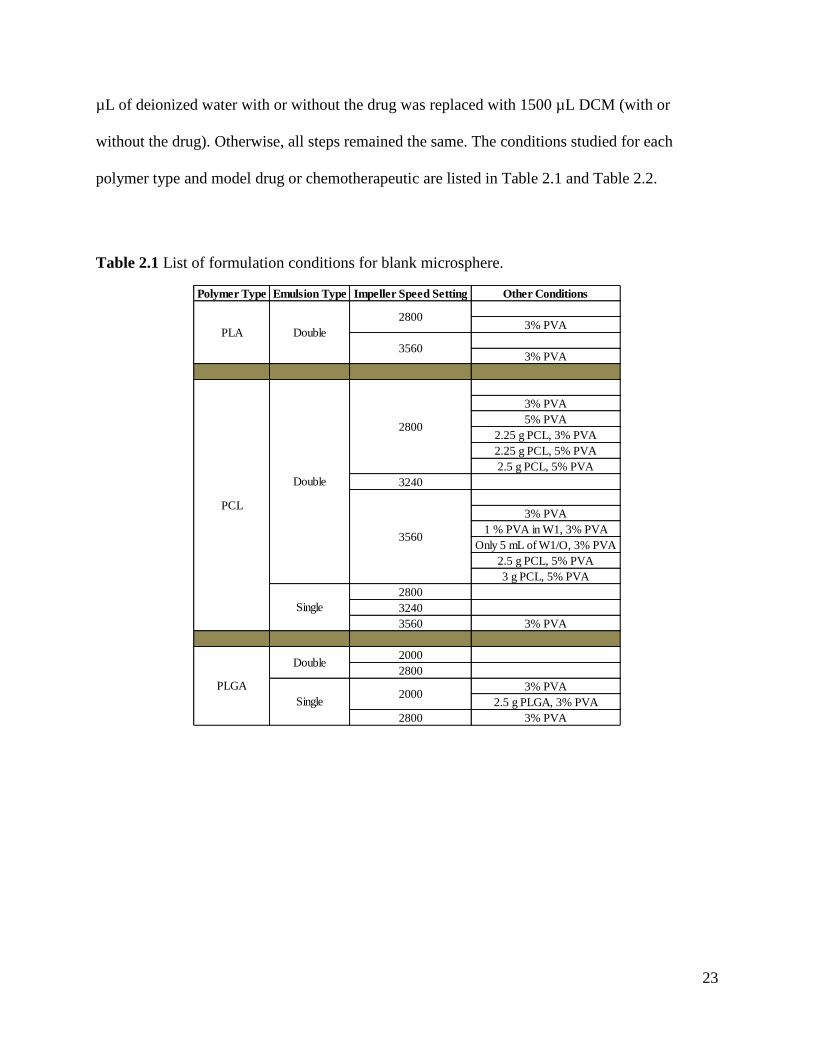
23
µL of deionized water with or without the drug was replaced with 1500 µL DCM (with or
without the drug). Otherwise, all steps remained the same. The conditions studied for each
polymer type and model drug or chemotherapeutic are listed in Table 2.1 and Table 2.2.
Table 2.1 List of formulation conditions for blank microsphere.
Polymer Type Emulsion Type Impeller Speed Setting Other Conditions
3% PVA
3% PVA
3% PVA
5% PVA
2.25 g PCL, 3% PVA
2.25 g PCL, 5% PVA
2.5 g PCL, 5% PVA
3240
3% PVA
1 % PVA in W1, 3% PVA
Only 5 mL of W1/O, 3% PVA
2.5 g PCL, 5% PVA
3 g PCL, 5% PVA
2800
3240
3560 3% PVA
2000
2800
3% PVA
2.5 g PLGA, 3% PVA
2800 3% PVA
Single2000
PCL
PLA
PLGA
Double
Double
Single
2800
3560
2800
3560
Double
24
Table 2.2 List of formulation conditions for drug encapsulated microspheres.
Polymer Drug Emulsion Type
Impeller Speed
Setting (rpm)
Initial Drug Loading
(mg) Other Conditions
1.5
1.5 3% PVA, 1 mg RB in W2
2800 1.5 3% PVA, 5 mg RB in W2
Fluorescein Double 2800 1.5
Double 2000 1.5
1.5 3% PVA
3 3% PVA
4.5 3% PVA
15 2.5 g PLGA, 3% PVA
2800 1.5 3% PVA
5600 15 2.5 g PLGA, 3% PVA
1.5 3% PVA
3 3% PVA
3560 1.5 3% PVA
Fluorescein Double 2800 1.5
1260 7.5 30 mL W2, 10 mg IgG in W2, 5% PVA
3 3% PVA
15 3% PVA
3 30 mL W2, 5% PVA
12 30 mL W2, 5% PVA
3 30 mL W2, 5 mg IgG in W2, 5% PVA
7.5 30 mL W2, 5 mg IgG in W2, 5% PVA
7.5 30 mL W2, 10 mg IgG in W2, 5% PVA
3 2 g PLA, 3% PVA
15 2 g PLA, 3% PVA
1.5
3
6
1.5 2.25 g PCL, 3% PVA
6 2.25 g PCL, 5% PVA
6 5% PVA, 10 mg RB in W2
3240 1.5
1.5
6
3240 1.5
Fluorescein Double 2800 1.5
1.5 3% PVA
3 3% PVA
6 3% PVA
9 3% PVA
15 3% PVA
15 5 mg LMT in W2, 3% PVA
3 30 mL W2, 5% PVA
15 30 mL W2, 5% PVA
3 30 mL W2, 5 mg LMT in W2, 5% PVA
15 30 mL W2, 5 mg LMT in W2, 5% PVA
3 2.5 g PCL, 5% PVA
15 2.5 g PCL, 5% PVA
3560 3 3% PVA
Lomustine Single2800
Rhodamine B
GefitinibSingle
2000
PLGA
PLA
IgG Double2800
PCL
2800
2800
2000
2800
Rhodamine B
Rhodamine B Double
Double
Single
Double

25
2.3.3 Microsphere Characterization
2.3.3.1 Microscopy Characterization
Microsphere shape, size, and fluorescence were determined using a Nikon E800 Upright
Microscope with fluorescence capabilities. Samples were prepared by placing 5 µL of an
aqueous solution of suspended microspheres on a glass slide and drying under vacuum prior to
analysis. Both bright field and fluorescence images were taken. The cubes included UV/DAPI
(Ex: 360/40, Em: 460/50, DM: 400LP), FITC (Ex: 480/40, Em: 535/50, DM: 505LP), and
TRITC (Ex: 540/20, Em: 620/60, DM: 565LP). Microsphere morphology and size were
determined using a FEI Sirion XL30 scanning electron microscope. Samples were prepared by
placing 10 µL of an aqueous solution of microspheres on a silicon chip and drying under
vacuum. The chips were then placed on double sided tape and sputter coated with gold-
palladium for 30 to 50 seconds prior to imaging.
2.3.3.2 Particle Sizing
Particle size was determined using a Partica LA-950 Laser Diffraction Particle Size Distribution
Analyzer. The surfactant Triton 10X was added to an aqueous solution of microspheres. Then the
resulting dispersion was placed in the sample chamber for determination of the equivalent
spherical diameter. Three measurements were taken per sample to confirm particle size
distribution.
2.3.3.3 Encapsulation Efficiency and Drug Loading
Microsphere encapsulation efficiency (EE) and drug loading (DL) were determined using a
Shimadzu UV-1601 ultraviolet-visible (UV-vis) spectrophotometer. Initially, a full spectrum of
the drug (or model drug) was taken to determine the wavelength with the highest absorbance

26
(Table 2.3). These wavelengths were used to create a standard curve of drug concentration versus
absorbance by measuring the absorbance of known concentrations of the drug dissolved in a
solvent. These curves are shown in Appendix 1.
The amount of drug in the microsphere samples were calculated by dissolving a known amount
of dried, drug encapsulated microspheres in the solvent and measuring the absorbance. The same
steps were repeated for “blank” spheres (sphere with no drug but same formulation conditions) to
produce a baseline absorbance. This baseline absorbance was subtracted from the drug
absorbance reading. From this corrected absorbance value, the amount of drug in the
microsphere samples could be calculated from the standard curves.
The theoretical amount of drug initially added for microsphere formation was determined with a
similar method. A known amount of the solution resulting from the first homogenization, the
W1/O for a double emulsion and the O for a single emulsion, was allowed to evaporate to
remove DCM before adding a known amount of the solvent. The absorbance of this solution was
measured and the “blank” solution absorbance from a drug-free emulsion subtracted out. The
initial, theoretical drug amount was then calculated from the standard curves. All measurements
were performed in triplicate with error to one standard deviation and statistical significance
analyzed with an unpaired t test. The following equations were used to determine encapsulation
efficiency and drug loading.
27
Equation 2.1 Encapsulation efficiency
𝐸𝐸(%) =𝑤𝑒𝑖𝑔ℎ𝑡 𝑜𝑓 𝑑𝑟𝑢𝑔 𝑒𝑛𝑐𝑎𝑝𝑠𝑢𝑙𝑎𝑡𝑒𝑑 (𝑚𝑔)
𝑤𝑒𝑖𝑔ℎ𝑡 𝑜𝑓 𝑡ℎ𝑒𝑜𝑟𝑒𝑡𝑖𝑐𝑎𝑙 𝑑𝑟𝑢𝑔 𝑒𝑛𝑐𝑎𝑝𝑢𝑠𝑙𝑎𝑡𝑒𝑑 (𝑚𝑔)∗ 100
Equation 2.2 Drug loading
𝐷𝐿(%) =𝑤𝑒𝑖𝑔ℎ𝑡 𝑜𝑓 𝑑𝑟𝑢𝑔 𝑒𝑛𝑐𝑎𝑝𝑠𝑢𝑙𝑎𝑡𝑒𝑑 (𝑚𝑔)
𝑡𝑜𝑡𝑎𝑙 𝑤𝑒𝑖𝑔ℎ𝑡 𝑜𝑓 𝑚𝑖𝑐𝑟𝑜𝑠𝑝ℎ𝑒𝑟𝑒 𝑠𝑎𝑚𝑝𝑙𝑒 (𝑚𝑔)∗ 100
Table 2.3 Wavelengths used for absorbance readings.
Molecule Wavelength (nm) Solvent
Rhodamine B 536 THF-1 M HCL 90-10 (v/v)
Gefitinib 333 THF-1 M HCL 90-10 (v/v)
Immunoglobulin G 283 1 M NaOH
Lomustine 396 DCM
2.3.4 Polymer Spin Coating and Contact Angle Measurements
PLGA, PLA, and PCL were dissolved in DCM at 2.5% w/v. Using an EC101 Series Photo Resist
Spinner, approximately 70 µL of the polymer solution was spin-dropped at 4000 rpm for 20
seconds on glass substrates (Gold Seal Microscope Cover Glasses, 15 mm diameter, #2
thickness).
Water contact angles were acquired using a FTA200 goniometer. Advancing contact angles were
measured and analyzed using FTA32 Analysis Software. Four measurements were completed for
each polymer sample.
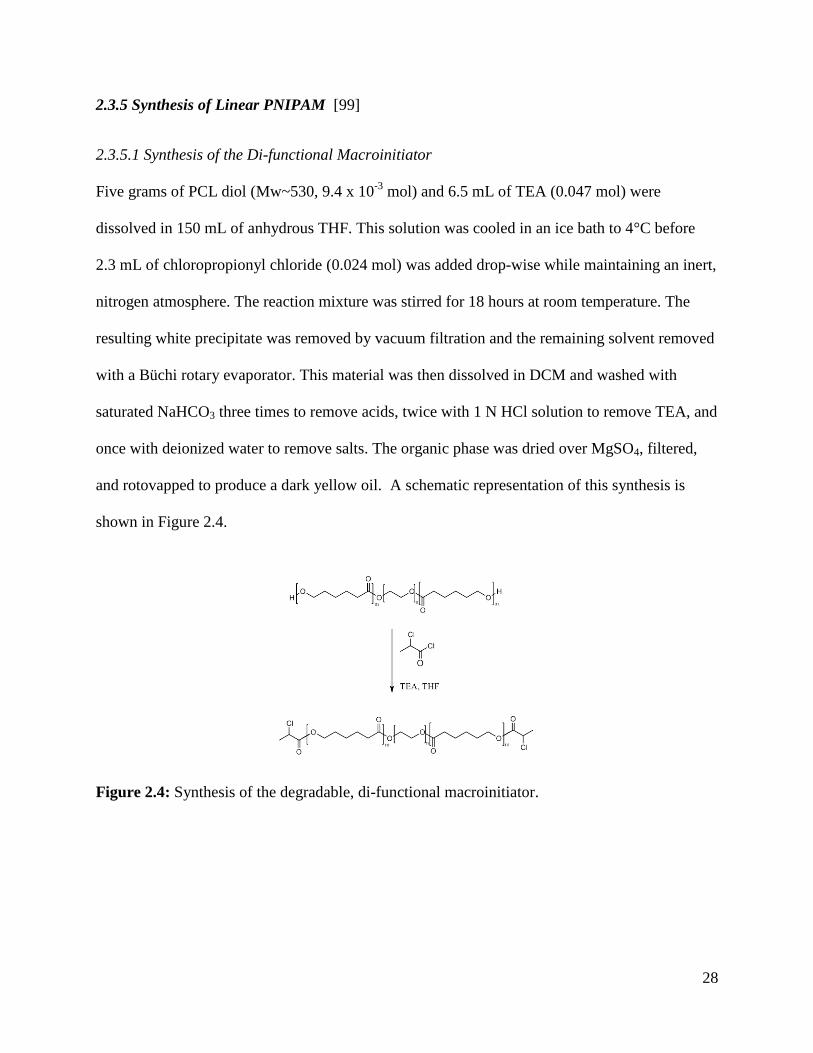
28
2.3.5 Synthesis of Linear PNIPAM [99]
2.3.5.1 Synthesis of the Di-functional Macroinitiator
Five grams of PCL diol (Mw~530, 9.4 x 10⁻³
mol) and 6.5 mL of TEA (0.047 mol) were
dissolved in 150 mL of anhydrous THF. This solution was cooled in an ice bath to 4°C before
2.3 mL of chloropropionyl chloride (0.024 mol) was added drop-wise while maintaining an inert,
nitrogen atmosphere. The reaction mixture was stirred for 18 hours at room temperature. The
resulting white precipitate was removed by vacuum filtration and the remaining solvent removed
with a Büchi rotary evaporator. This material was then dissolved in DCM and washed with
saturated NaHCO3 three times to remove acids, twice with 1 N HCl solution to remove TEA, and
once with deionized water to remove salts. The organic phase was dried over MgSO4, filtered,
and rotovapped to produce a dark yellow oil. A schematic representation of this synthesis is
shown in Figure 2.4.
Figure 2.4: Synthesis of the degradable, di-functional macroinitiator.
29
a)
b)
TREN
Me6TREN
2.3.5.2 Synthesis of the Ligand Tris[2-(dimethylamino)ethyl]amine (ME6TREN)
Three mL of TREN (19.9 x 10⁻³
mol) and 135 mL acetic acid were combined together to produce
a white solid. Then, 6000 mL of acetonitrile was added to dissolve the solid. After dissolution,
40 mL of aqueous formaldehyde (37% w/v, 660 x 10-3
mol) was added and stirred at room
temperature for one hour. Then, the reaction mixture was placed in an ice bath before 10 g of
sodium borohydride (13.4 x 10⁻³
mol) was slowly and carefully added. This mixture was then
allowed to stir for 48 hours at room temperature. The solvent was removed with a rotary
evaporator to obtain a yellow solid. The solid was dissolved in 3 M NaOH with a final pH of 11.
This product was extracted three times with DCM, dried over MgSO4, filtered, and rotovapped to
obtain a yellow, viscous, oil-like liquid. This oil was vacuumed for 12 hours and centrifuged at
4000 g, 4°C, for 10 minutes to remove any possible solids and then stored at 4°C. A schematic
representation of the synthesis is shown in Figure 2.5.
Figure 2.5: Synthesis of the ligand ME6TREN.
2.3.5.3 Synthesis of Linear PNIPAM (20k)
One gram of NIPAM (0.009 mol) and 36 mg of the macroinitiator CL-PCL-Cl (5 x 10⁻⁵
mol)
were dissolved in 1 mL DMF and purged with nitrogen for one hour while, in parallel, 0.115 g of
30
Me6TREN (0.0005 mol) was also purged. These solutions were transferred to a glove box before
50 mg of CuCl (0.0005 mol) was added to the DMF solution and dissolved by stirring. Then, the
Me6TREN was added and stirred at room temperature overnight, forming a viscous solution. The
solution was then diluted with THF (1:1 THF:DMF v/v). The resulting THF solution was passed
through an alumina column until a clear solution was obtained. The resulting solution was
rotovapped to remove the solvent, producing a white-yellow solid. This solid was dissolved in a
minimal amount of chloroform before being precipitated in a cold diethyl ether three times, with
a centrifugation of 4000 g, 4°C, for 5 minutes between each precipitation. The resulting powder
was dried under vacuum, dissolved in water, and lyophilized before storage. A schematic
representation of this synthesis is shown below in Figure 2.6.
Figure 2.6: Synthesis of linear PNIPAM.
2.3.6 Analysis of Macroinitiator, Ligand, and PNIPAM
The di-functional macroinitiator, ligand, and PNIPAM were characterized using a Bruker AV-
300 nuclear magnetic resonance (NMR) spectrometer. 1H NMR spectra were obtained in
solution of chloroform-d with chemical shifts expressed in parts per million downfield from the
tetramethylsilane internal standard.
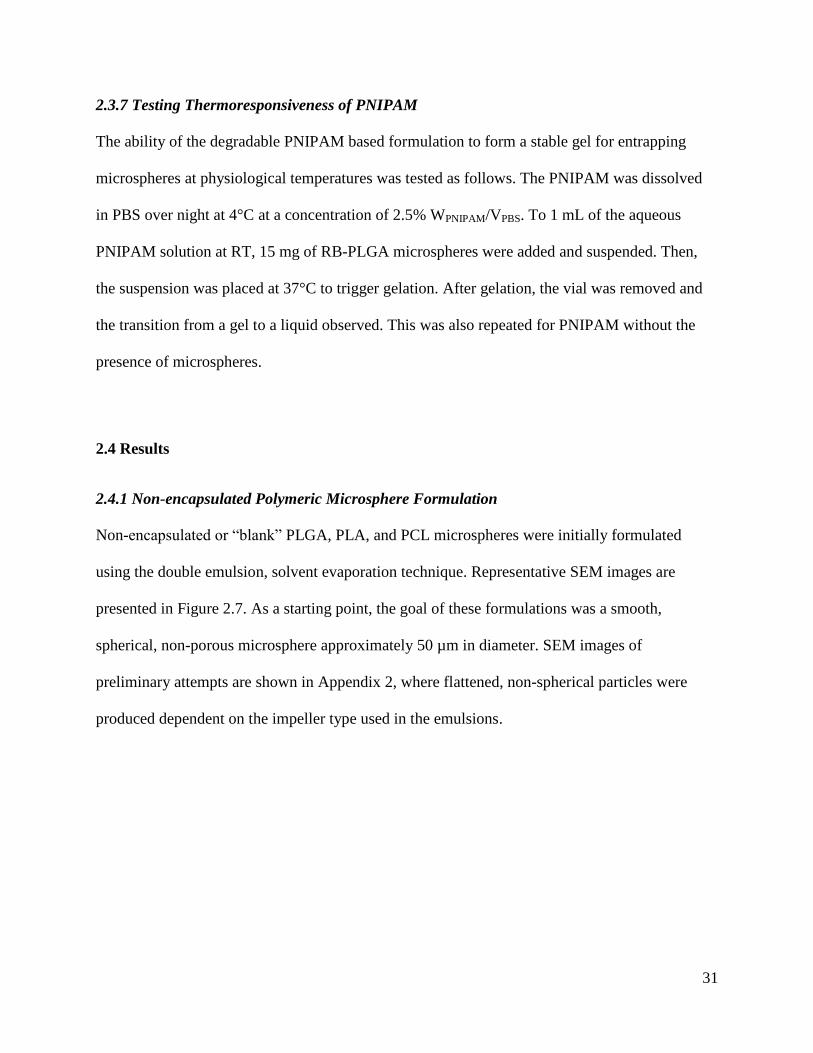
31
2.3.7 Testing Thermoresponsiveness of PNIPAM
The ability of the degradable PNIPAM based formulation to form a stable gel for entrapping
microspheres at physiological temperatures was tested as follows. The PNIPAM was dissolved
in PBS over night at 4°C at a concentration of 2.5% WPNIPAM/VPBS. To 1 mL of the aqueous
PNIPAM solution at RT, 15 mg of RB-PLGA microspheres were added and suspended. Then,
the suspension was placed at 37°C to trigger gelation. After gelation, the vial was removed and
the transition from a gel to a liquid observed. This was also repeated for PNIPAM without the
presence of microspheres.
2.4 Results
2.4.1 Non-encapsulated Polymeric Microsphere Formulation
Non-encapsulated or “blank” PLGA, PLA, and PCL microspheres were initially formulated
using the double emulsion, solvent evaporation technique. Representative SEM images are
presented in Figure 2.7. As a starting point, the goal of these formulations was a smooth,
spherical, non-porous microsphere approximately 50 µm in diameter. SEM images of
preliminary attempts are shown in Appendix 2, where flattened, non-spherical particles were
produced dependent on the impeller type used in the emulsions.
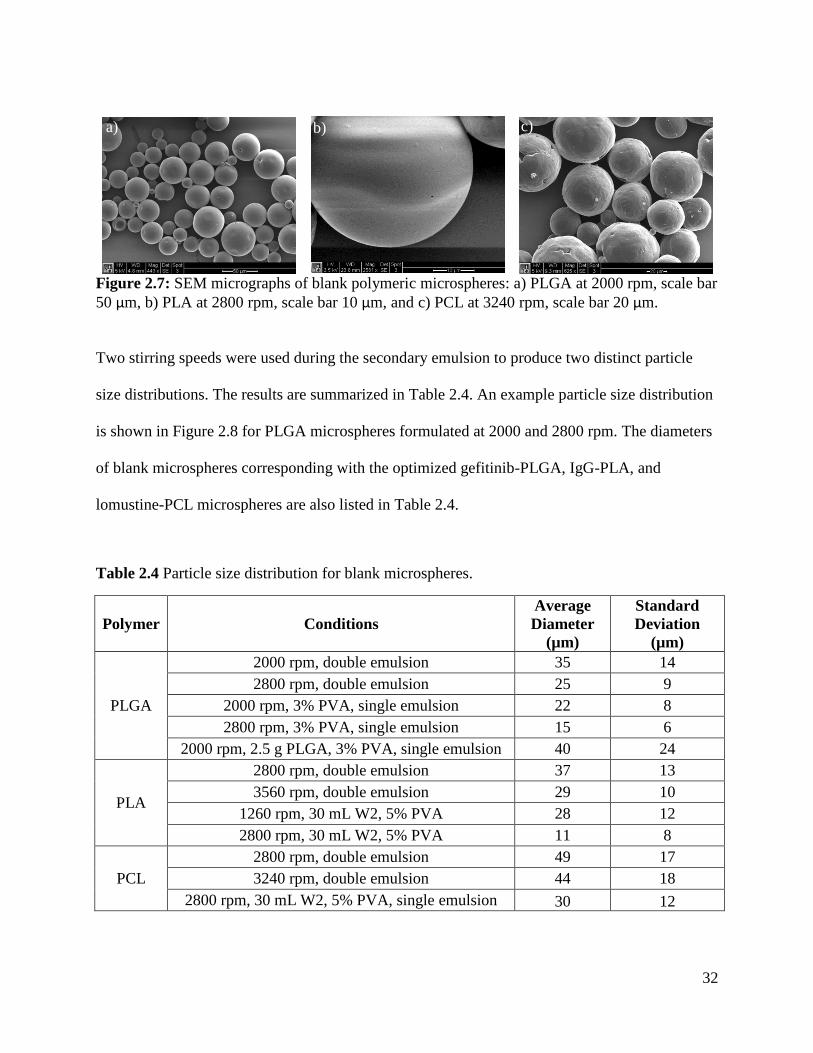
32
Figure 2.7: SEM micrographs of blank polymeric microspheres: a) PLGA at 2000 rpm, scale bar
50 µm, b) PLA at 2800 rpm, scale bar 10 µm, and c) PCL at 3240 rpm, scale bar 20 µm.
Two stirring speeds were used during the secondary emulsion to produce two distinct particle
size distributions. The results are summarized in Table 2.4. An example particle size distribution
is shown in Figure 2.8 for PLGA microspheres formulated at 2000 and 2800 rpm. The diameters
of blank microspheres corresponding with the optimized gefitinib-PLGA, IgG-PLA, and
lomustine-PCL microspheres are also listed in Table 2.4.
Table 2.4 Particle size distribution for blank microspheres.
Polymer Conditions
Average
Diameter
(µm)
Standard
Deviation
(µm)
PLGA
2000 rpm, double emulsion 35 14
2800 rpm, double emulsion 25 9
2000 rpm, 3% PVA, single emulsion 22 8
2800 rpm, 3% PVA, single emulsion 15 6
2000 rpm, 2.5 g PLGA, 3% PVA, single emulsion 40 24
PLA
2800 rpm, double emulsion 37 13
3560 rpm, double emulsion 29 10
1260 rpm, 30 mL W2, 5% PVA 28 12
2800 rpm, 30 mL W2, 5% PVA 11 8
PCL
2800 rpm, double emulsion 49 17
3240 rpm, double emulsion 44 18
2800 rpm, 30 mL W2, 5% PVA, single emulsion 30 12
a) b) c)
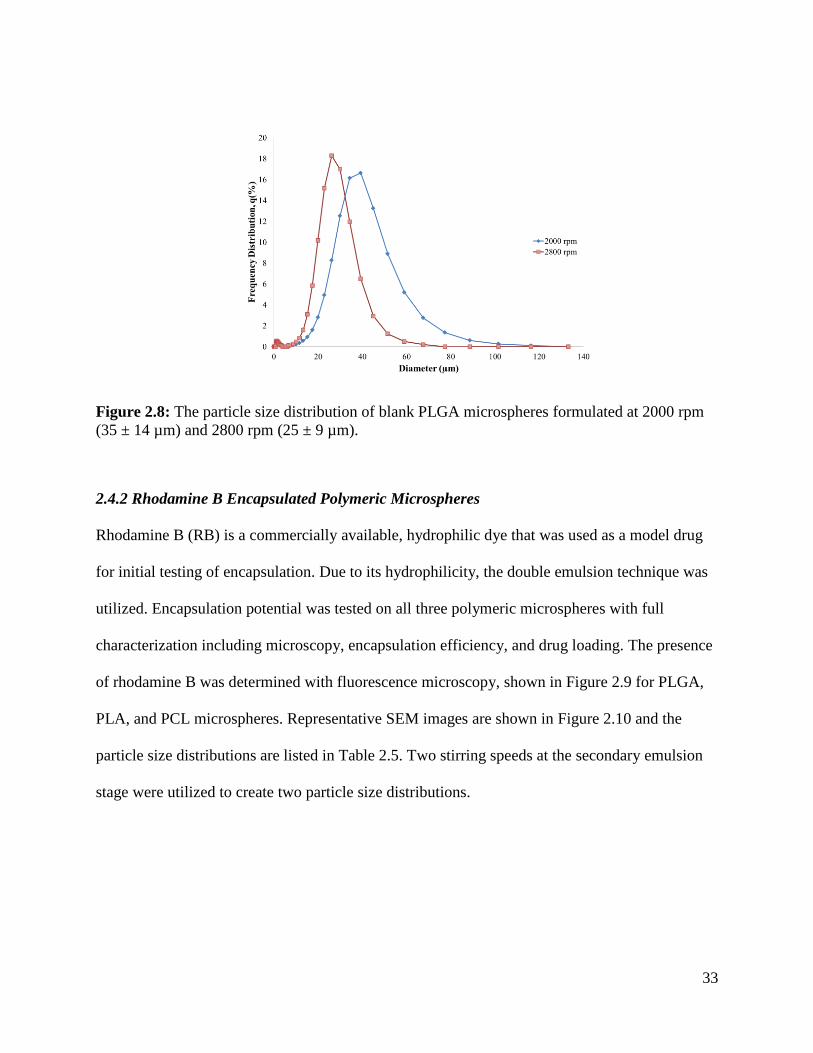
33
Figure 2.8: The particle size distribution of blank PLGA microspheres formulated at 2000 rpm
(35 ± 14 µm) and 2800 rpm (25 ± 9 µm).
2.4.2 Rhodamine B Encapsulated Polymeric Microspheres
Rhodamine B (RB) is a commercially available, hydrophilic dye that was used as a model drug
for initial testing of encapsulation. Due to its hydrophilicity, the double emulsion technique was
utilized. Encapsulation potential was tested on all three polymeric microspheres with full
characterization including microscopy, encapsulation efficiency, and drug loading. The presence
of rhodamine B was determined with fluorescence microscopy, shown in Figure 2.9 for PLGA,
PLA, and PCL microspheres. Representative SEM images are shown in Figure 2.10 and the
particle size distributions are listed in Table 2.5. Two stirring speeds at the secondary emulsion
stage were utilized to create two particle size distributions.
34
Figure 2.9: Fluorescence micrographs of rhodamine B encapsulated microspheres: a) PLGA
microspheres at 2000 rpm, b) PLA microspheres at 2800 rpm, and c) PCL microspheres at 3240
rpm at an initial rhodamine B loading of 1.5 mg.
Figure 2.10: SEM micrographs of rhodamine B encapsulated polymeric microspheres: a) PLGA
at 2000 rpm, scale bar 5 µm, b) PLA at 2800 rpm, scale bar 50 µm, and c) PCL at 3240 rpm,
scale bar 50 µm.
Table 2.5 Particle size distribution for rhodamine B encapsulated microspheres.
Polymer Conditions Average Diameter
(µm)
Standard Deviation
(µm)
PLGA 2000 rpm, 1.5 mg RB 42 15
2800 rpm, 1.5 mg RB 23 8
PLA 2800 rpm, 1.5 mg RB 37 11
3560 rpm, 1.5 mg RB 27 10
PCL 2800 rpm, 1.5 mg RB 52 20
3240 rpm, 1.5 mg RB 51 20
a) b) c)
a) b) c)
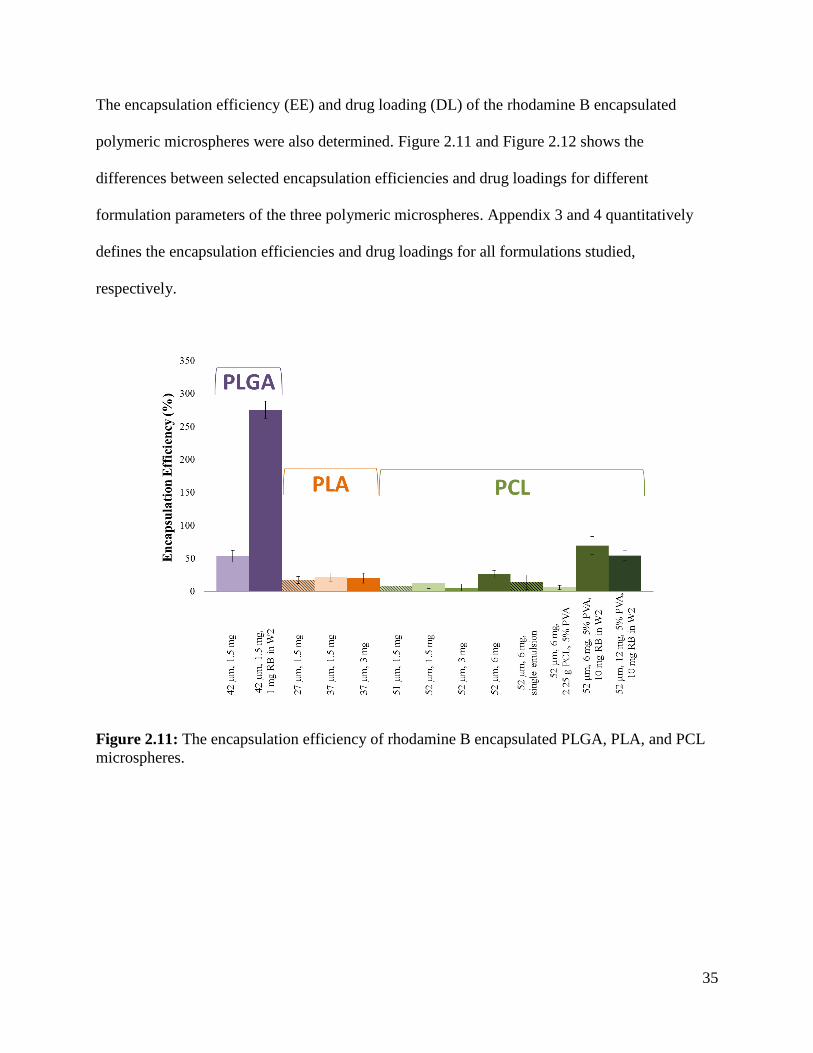
35
The encapsulation efficiency (EE) and drug loading (DL) of the rhodamine B encapsulated
polymeric microspheres were also determined. Figure 2.11 and Figure 2.12 shows the
differences between selected encapsulation efficiencies and drug loadings for different
formulation parameters of the three polymeric microspheres. Appendix 3 and 4 quantitatively
defines the encapsulation efficiencies and drug loadings for all formulations studied,
respectively.
Figure 2.11: The encapsulation efficiency of rhodamine B encapsulated PLGA, PLA, and PCL
microspheres.
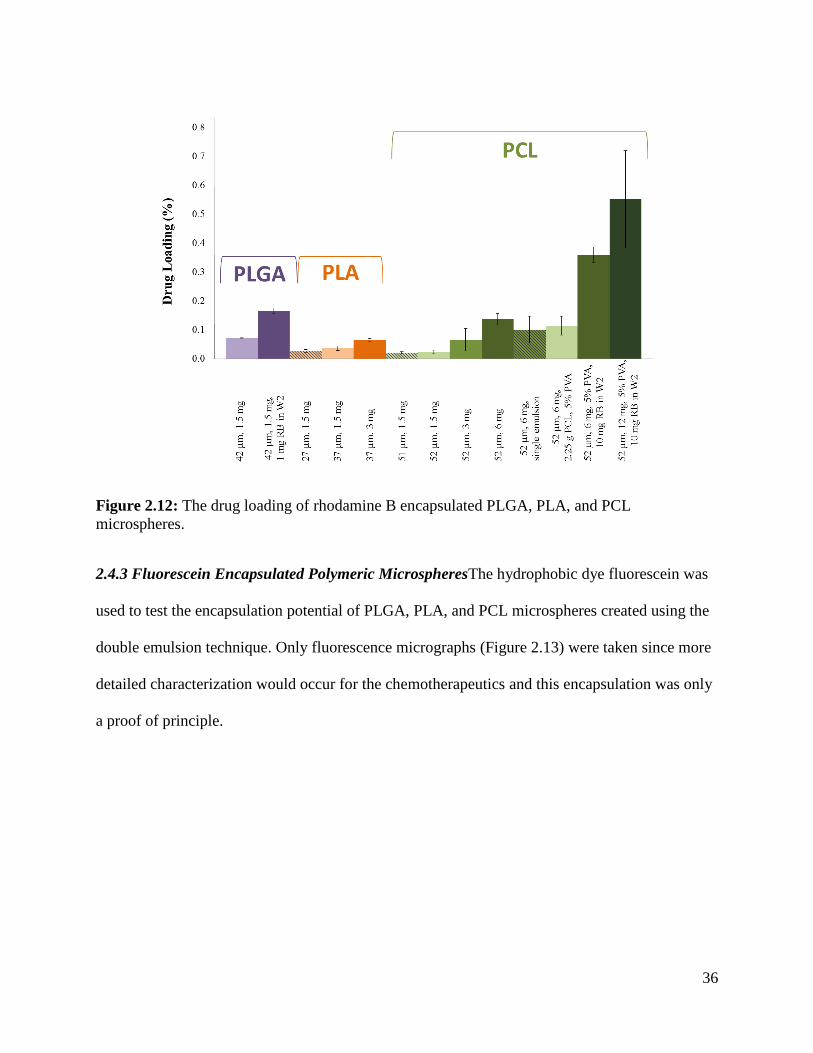
36
Figure 2.12: The drug loading of rhodamine B encapsulated PLGA, PLA, and PCL
microspheres.
2.4.3 Fluorescein Encapsulated Polymeric MicrospheresThe hydrophobic dye fluorescein was
used to test the encapsulation potential of PLGA, PLA, and PCL microspheres created using the
double emulsion technique. Only fluorescence micrographs (Figure 2.13) were taken since more
detailed characterization would occur for the chemotherapeutics and this encapsulation was only
a proof of principle.
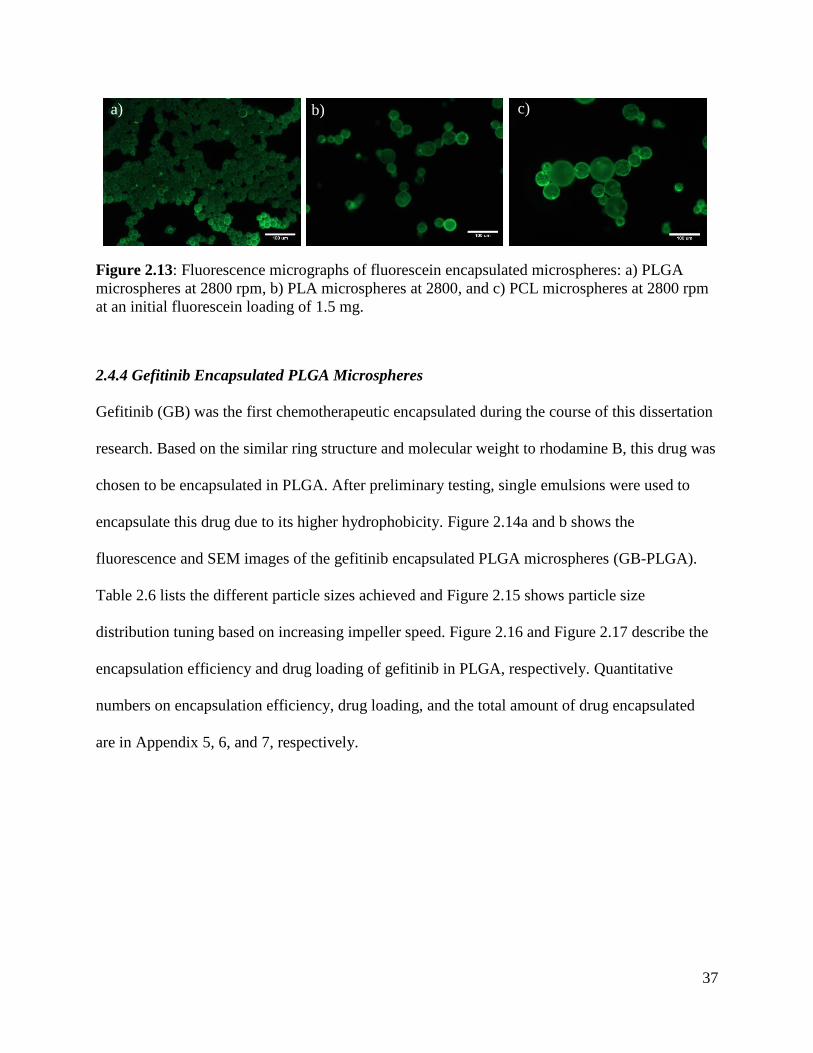
37
Figure 2.13: Fluorescence micrographs of fluorescein encapsulated microspheres: a) PLGA
microspheres at 2800 rpm, b) PLA microspheres at 2800, and c) PCL microspheres at 2800 rpm
at an initial fluorescein loading of 1.5 mg.
2.4.4 Gefitinib Encapsulated PLGA Microspheres
Gefitinib (GB) was the first chemotherapeutic encapsulated during the course of this dissertation
research. Based on the similar ring structure and molecular weight to rhodamine B, this drug was
chosen to be encapsulated in PLGA. After preliminary testing, single emulsions were used to
encapsulate this drug due to its higher hydrophobicity. Figure 2.14a and b shows the
fluorescence and SEM images of the gefitinib encapsulated PLGA microspheres (GB-PLGA).
Table 2.6 lists the different particle sizes achieved and Figure 2.15 shows particle size
distribution tuning based on increasing impeller speed. Figure 2.16 and Figure 2.17 describe the
encapsulation efficiency and drug loading of gefitinib in PLGA, respectively. Quantitative
numbers on encapsulation efficiency, drug loading, and the total amount of drug encapsulated
are in Appendix 5, 6, and 7, respectively.
a) b) c)
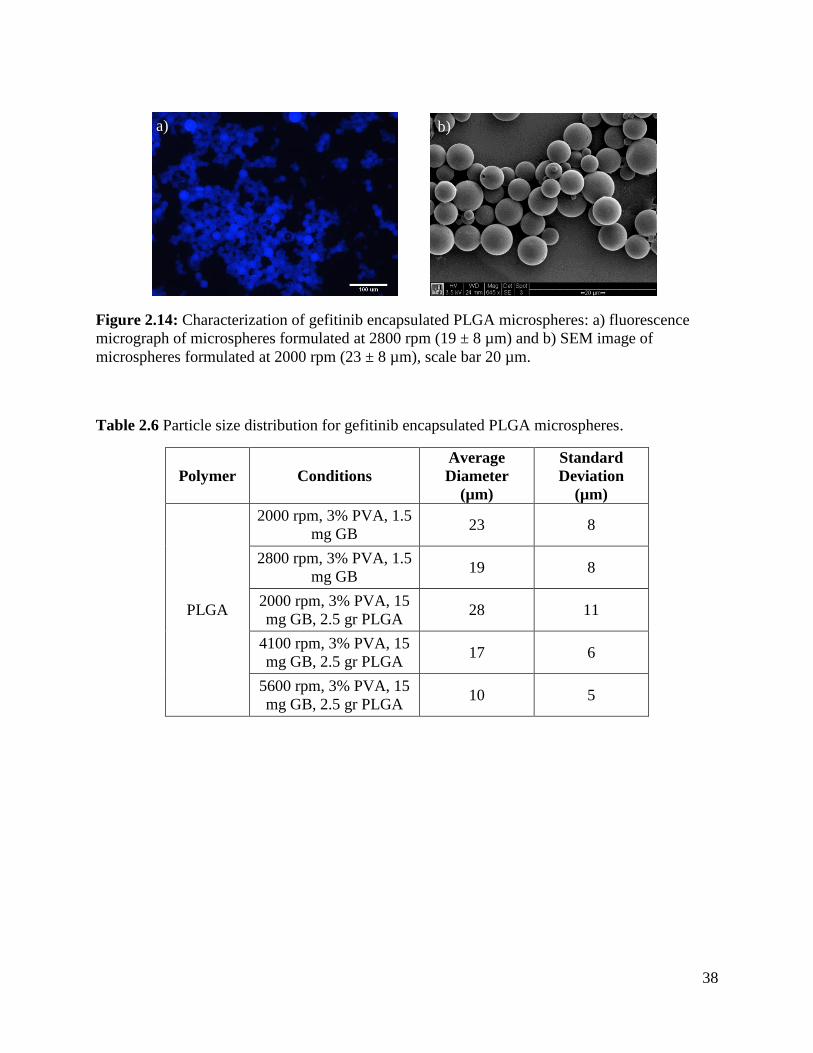
38
Figure 2.14: Characterization of gefitinib encapsulated PLGA microspheres: a) fluorescence
micrograph of microspheres formulated at 2800 rpm (19 ± 8 µm) and b) SEM image of
microspheres formulated at 2000 rpm (23 ± 8 µm), scale bar 20 µm.
Table 2.6 Particle size distribution for gefitinib encapsulated PLGA microspheres.
Polymer Conditions
Average
Diameter
(µm)
Standard
Deviation
(µm)
PLGA
2000 rpm, 3% PVA, 1.5
mg GB 23 8
2800 rpm, 3% PVA, 1.5
mg GB 19 8
2000 rpm, 3% PVA, 15
mg GB, 2.5 gr PLGA 28 11
4100 rpm, 3% PVA, 15
mg GB, 2.5 gr PLGA 17 6
5600 rpm, 3% PVA, 15
mg GB, 2.5 gr PLGA 10 5
a) b)
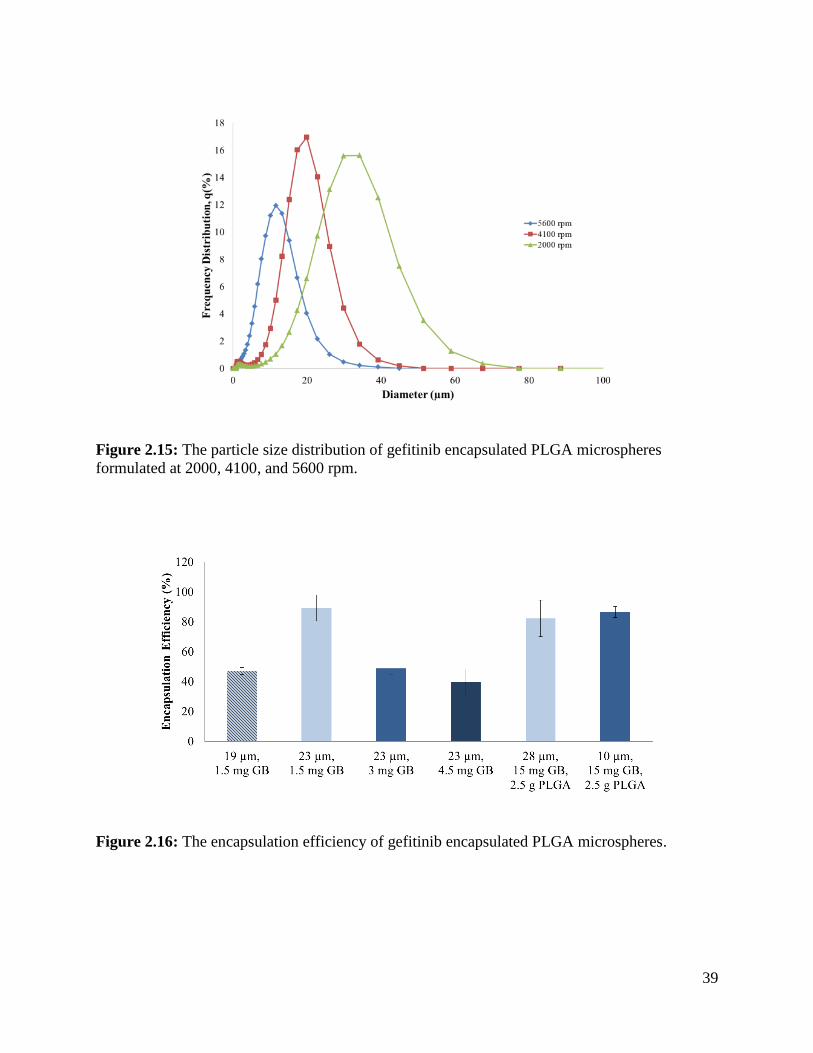
39
Figure 2.15: The particle size distribution of gefitinib encapsulated PLGA microspheres
formulated at 2000, 4100, and 5600 rpm.
Figure 2.16: The encapsulation efficiency of gefitinib encapsulated PLGA microspheres.
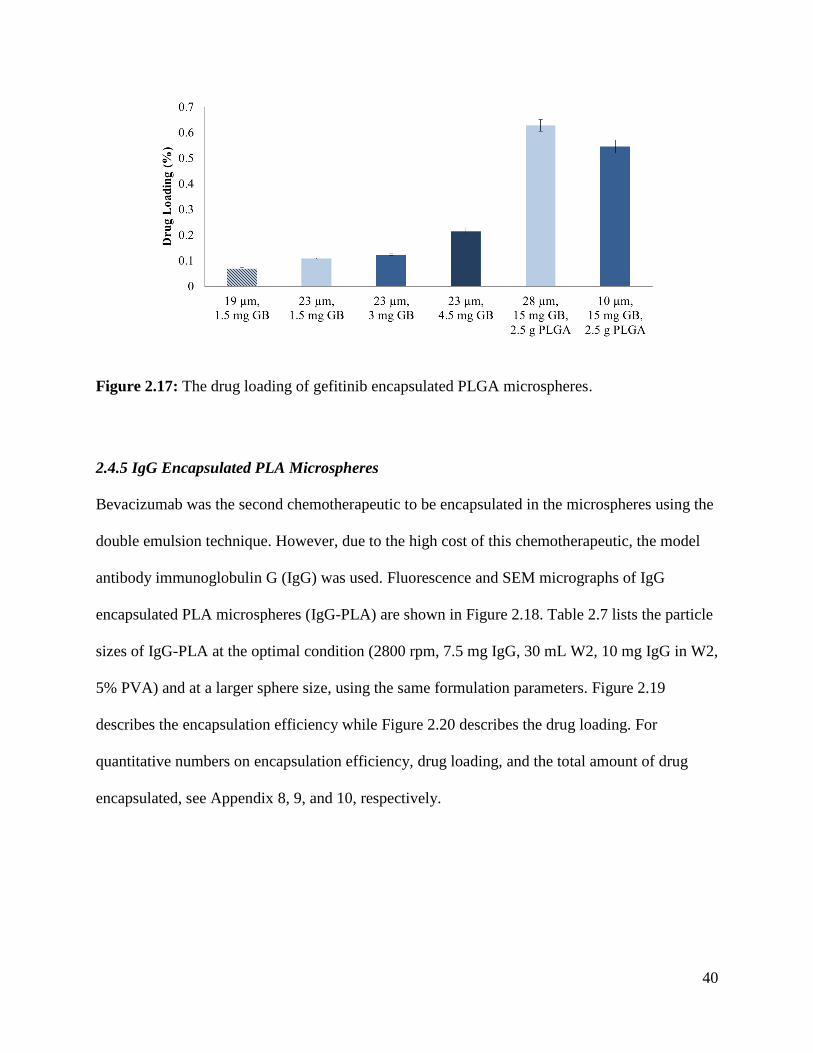
40
Figure 2.17: The drug loading of gefitinib encapsulated PLGA microspheres.
2.4.5 IgG Encapsulated PLA Microspheres
Bevacizumab was the second chemotherapeutic to be encapsulated in the microspheres using the
double emulsion technique. However, due to the high cost of this chemotherapeutic, the model
antibody immunoglobulin G (IgG) was used. Fluorescence and SEM micrographs of IgG
encapsulated PLA microspheres (IgG-PLA) are shown in Figure 2.18. Table 2.7 lists the particle
sizes of IgG-PLA at the optimal condition (2800 rpm, 7.5 mg IgG, 30 mL W2, 10 mg IgG in W2,
5% PVA) and at a larger sphere size, using the same formulation parameters. Figure 2.19
describes the encapsulation efficiency while Figure 2.20 describes the drug loading. For
quantitative numbers on encapsulation efficiency, drug loading, and the total amount of drug
encapsulated, see Appendix 8, 9, and 10, respectively.
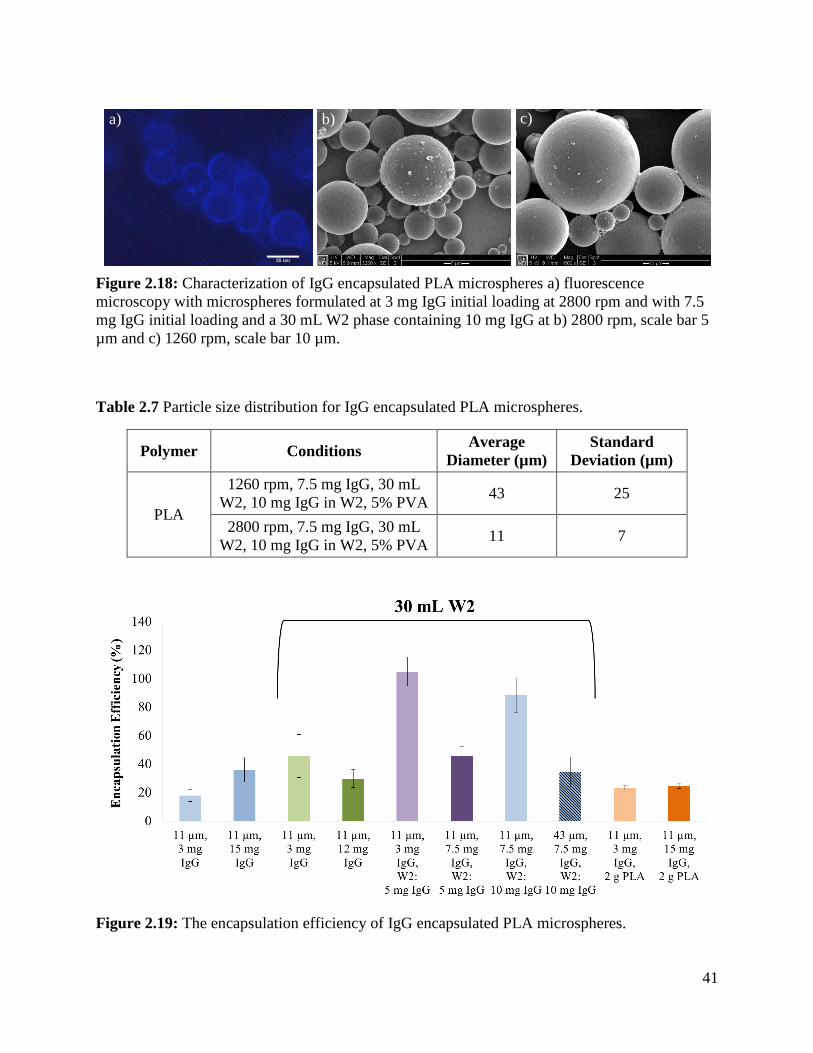
41
Figure 2.18: Characterization of IgG encapsulated PLA microspheres a) fluorescence
microscopy with microspheres formulated at 3 mg IgG initial loading at 2800 rpm and with 7.5
mg IgG initial loading and a 30 mL W2 phase containing 10 mg IgG at b) 2800 rpm, scale bar 5
µm and c) 1260 rpm, scale bar 10 µm.
Table 2.7 Particle size distribution for IgG encapsulated PLA microspheres.
Polymer Conditions Average
Diameter (µm)
Standard
Deviation (µm)
PLA
1260 rpm, 7.5 mg IgG, 30 mL
W2, 10 mg IgG in W2, 5% PVA 43 25
2800 rpm, 7.5 mg IgG, 30 mL
W2, 10 mg IgG in W2, 5% PVA 11 7
Figure 2.19: The encapsulation efficiency of IgG encapsulated PLA microspheres.
a) b) c)
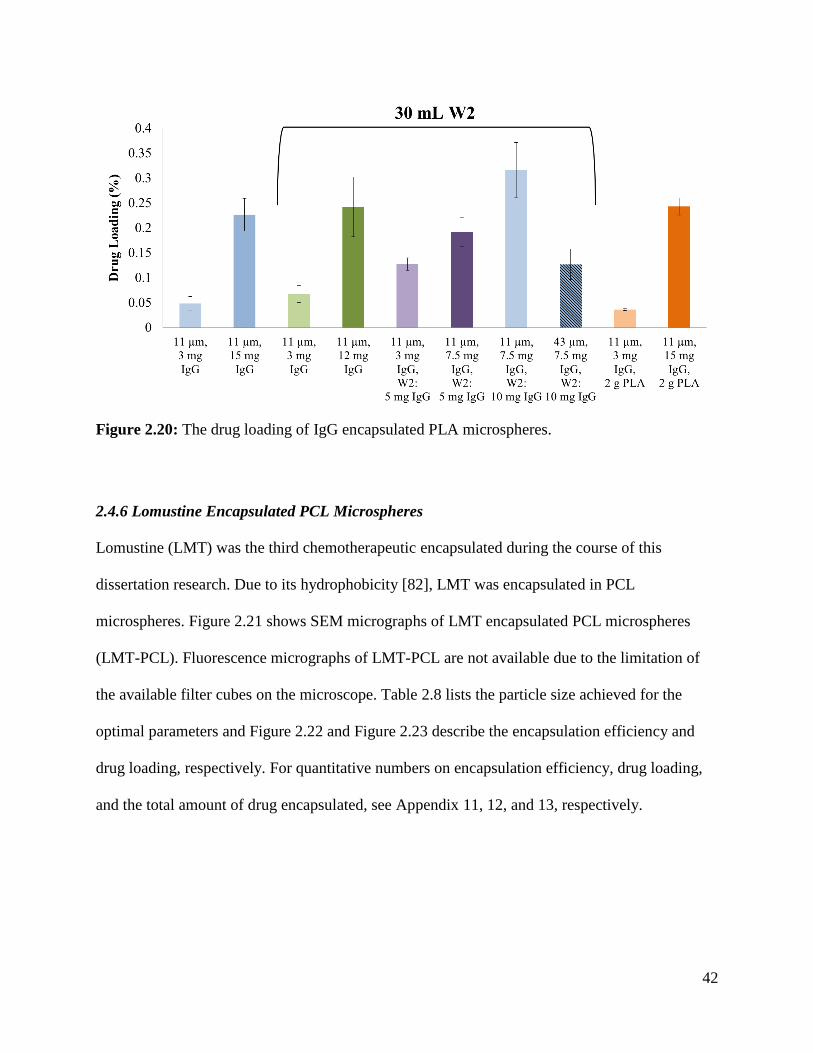
42
Figure 2.20: The drug loading of IgG encapsulated PLA microspheres.
2.4.6 Lomustine Encapsulated PCL Microspheres
Lomustine (LMT) was the third chemotherapeutic encapsulated during the course of this
dissertation research. Due to its hydrophobicity [82], LMT was encapsulated in PCL
microspheres. Figure 2.21 shows SEM micrographs of LMT encapsulated PCL microspheres
(LMT-PCL). Fluorescence micrographs of LMT-PCL are not available due to the limitation of
the available filter cubes on the microscope. Table 2.8 lists the particle size achieved for the
optimal parameters and Figure 2.22 and Figure 2.23 describe the encapsulation efficiency and
drug loading, respectively. For quantitative numbers on encapsulation efficiency, drug loading,
and the total amount of drug encapsulated, see Appendix 11, 12, and 13, respectively.
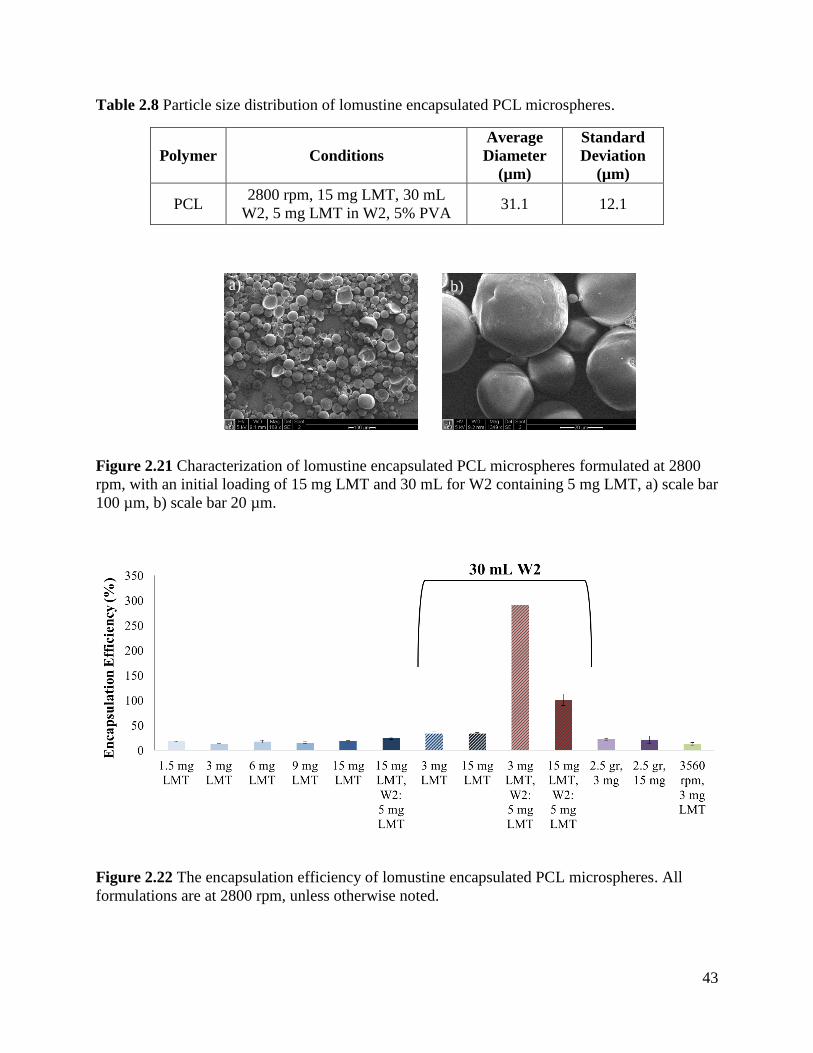
43
Table 2.8 Particle size distribution of lomustine encapsulated PCL microspheres.
Polymer Conditions
Average
Diameter
(µm)
Standard
Deviation
(µm)
PCL 2800 rpm, 15 mg LMT, 30 mL
W2, 5 mg LMT in W2, 5% PVA 31.1 12.1
Figure 2.21 Characterization of lomustine encapsulated PCL microspheres formulated at 2800
rpm, with an initial loading of 15 mg LMT and 30 mL for W2 containing 5 mg LMT, a) scale bar
100 µm, b) scale bar 20 µm.
Figure 2.22 The encapsulation efficiency of lomustine encapsulated PCL microspheres. All
formulations are at 2800 rpm, unless otherwise noted.
b) a)
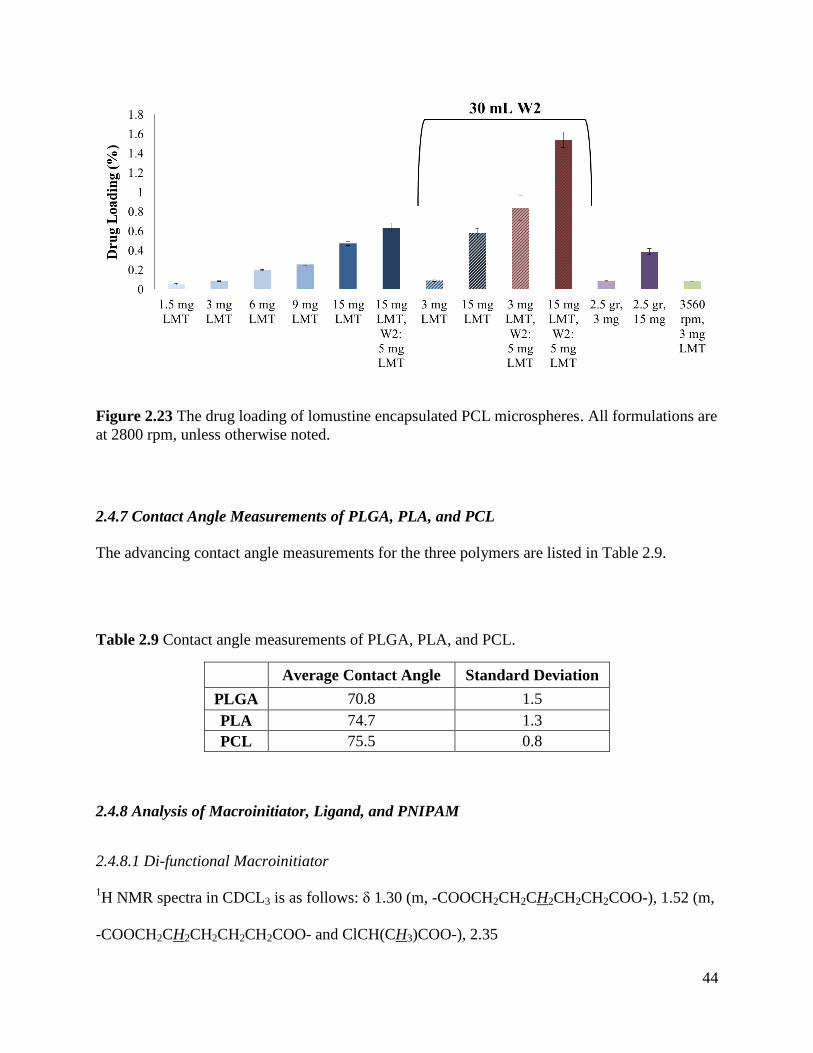
44
Figure 2.23 The drug loading of lomustine encapsulated PCL microspheres. All formulations are
at 2800 rpm, unless otherwise noted.
2.4.7 Contact Angle Measurements of PLGA, PLA, and PCL
The advancing contact angle measurements for the three polymers are listed in Table 2.9.
Table 2.9 Contact angle measurements of PLGA, PLA, and PCL.
Average Contact Angle Standard Deviation
PLGA 70.8 1.5
PLA 74.7 1.3
PCL 75.5 0.8
2.4.8 Analysis of Macroinitiator, Ligand, and PNIPAM
2.4.8.1 Di-functional Macroinitiator
1H NMR spectra in CDCL3 is as follows: δ 1.30 (m, -COOCH2CH2CH2CH2CH2COO-), 1.52 (m,
-COOCH2CH2CH2CH2CH2COO- and ClCH(CH3)COO-), 2.35
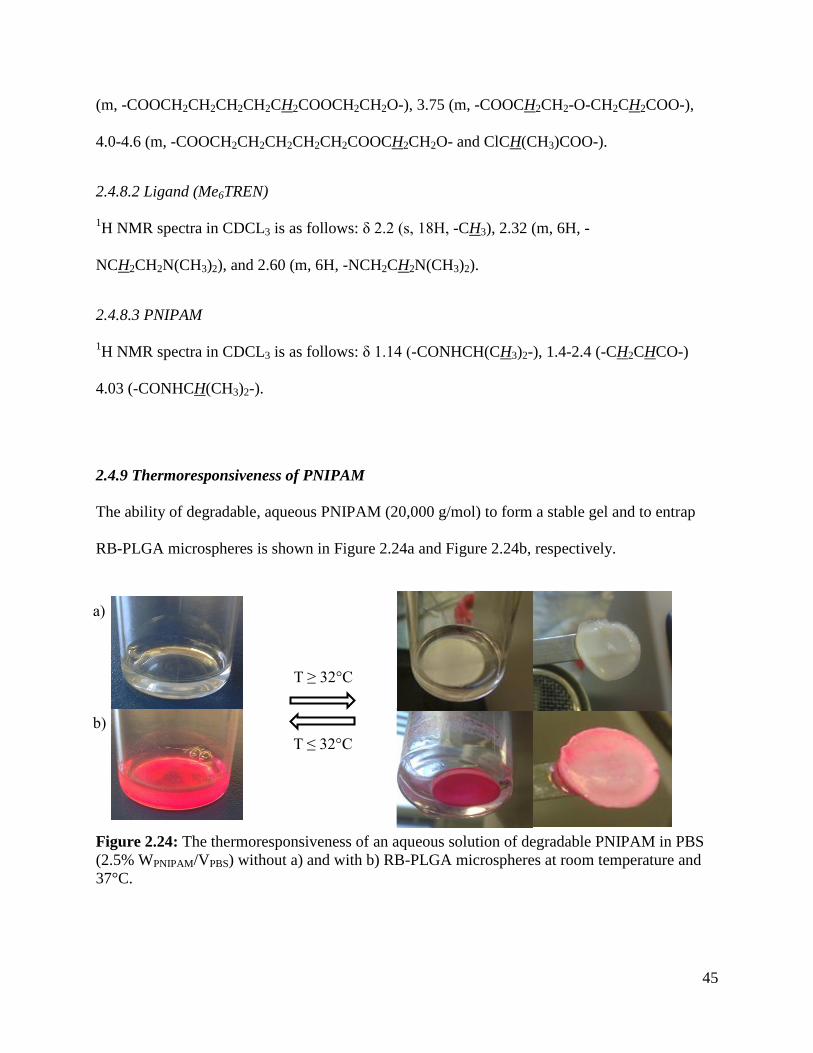
45
(m, -COOCH2CH2CH2CH2CH2COOCH2CH2O-), 3.75 (m, -COOCH2CH2-O-CH2CH2COO-),
4.0-4.6 (m, -COOCH2CH2CH2CH2CH2COOCH2CH2O- and ClCH(CH3)COO-).
2.4.8.2 Ligand (Me6TREN)
1H NMR spectra in CDCL3 is as follows: δ 2.2 (s, 18H, -CH3), 2.32 (m, 6H, -
NCH2CH2N(CH3)2), and 2.60 (m, 6H, -NCH2CH2N(CH3)2).
2.4.8.3 PNIPAM
1H NMR spectra in CDCL3 is as follows: δ 1.14 (-CONHCH(CH3)2-), 1.4-2.4 (-CH2CHCO-)
4.03 (-CONHCH(CH3)2-).
2.4.9 Thermoresponsiveness of PNIPAM
The ability of degradable, aqueous PNIPAM (20,000 g/mol) to form a stable gel and to entrap
RB-PLGA microspheres is shown in Figure 2.24a and Figure 2.24b, respectively.
Figure 2.24: The thermoresponsiveness of an aqueous solution of degradable PNIPAM in PBS
(2.5% WPNIPAM/VPBS) without a) and with b) RB-PLGA microspheres at room temperature and
37°C.
T ≤ 32°C
T ≥ 32°C
a)
b)
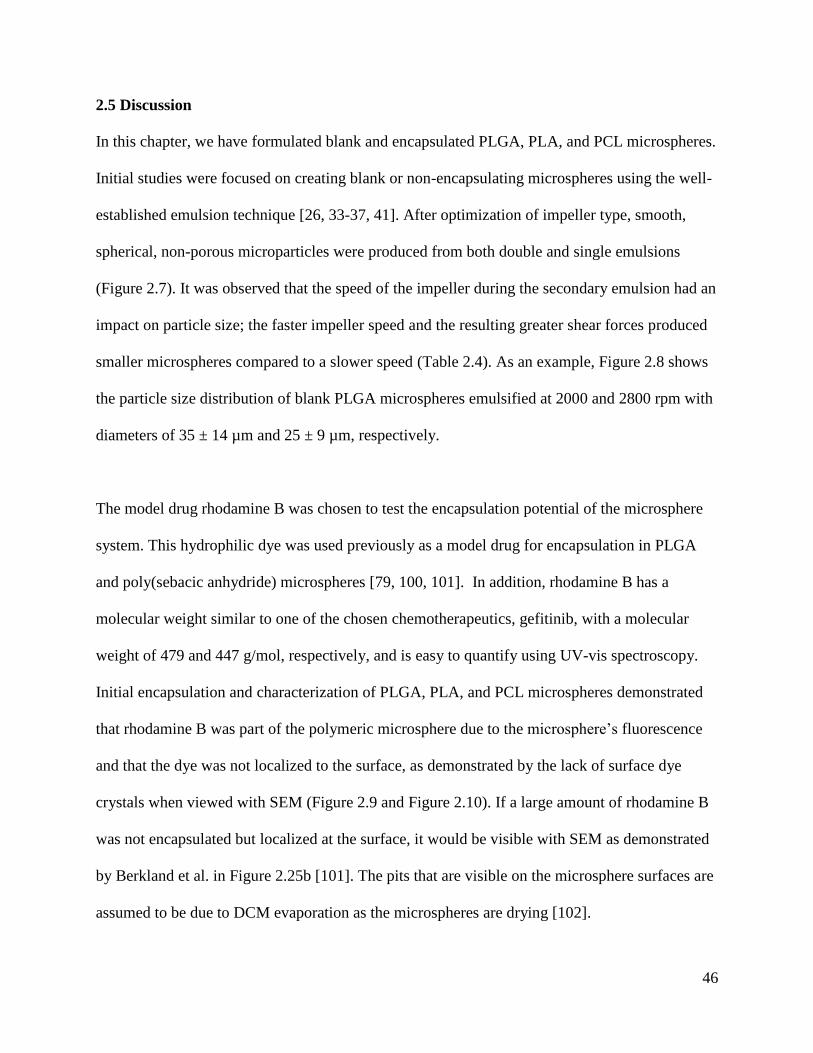
46
2.5 Discussion
In this chapter, we have formulated blank and encapsulated PLGA, PLA, and PCL microspheres.
Initial studies were focused on creating blank or non-encapsulating microspheres using the well-
established emulsion technique [26, 33-37, 41]. After optimization of impeller type, smooth,
spherical, non-porous microparticles were produced from both double and single emulsions
(Figure 2.7). It was observed that the speed of the impeller during the secondary emulsion had an
impact on particle size; the faster impeller speed and the resulting greater shear forces produced
smaller microspheres compared to a slower speed (Table 2.4). As an example, Figure 2.8 shows
the particle size distribution of blank PLGA microspheres emulsified at 2000 and 2800 rpm with
diameters of 35 ± 14 µm and 25 ± 9 µm, respectively.
The model drug rhodamine B was chosen to test the encapsulation potential of the microsphere
system. This hydrophilic dye was used previously as a model drug for encapsulation in PLGA
and poly(sebacic anhydride) microspheres [79, 100, 101]. In addition, rhodamine B has a
molecular weight similar to one of the chosen chemotherapeutics, gefitinib, with a molecular
weight of 479 and 447 g/mol, respectively, and is easy to quantify using UV-vis spectroscopy.
Initial encapsulation and characterization of PLGA, PLA, and PCL microspheres demonstrated
that rhodamine B was part of the polymeric microsphere due to the microsphere’s fluorescence
and that the dye was not localized to the surface, as demonstrated by the lack of surface dye
crystals when viewed with SEM (Figure 2.9 and Figure 2.10). If a large amount of rhodamine B
was not encapsulated but localized at the surface, it would be visible with SEM as demonstrated
by Berkland et al. in Figure 2.25b [101]. The pits that are visible on the microsphere surfaces are
assumed to be due to DCM evaporation as the microspheres are drying [102].
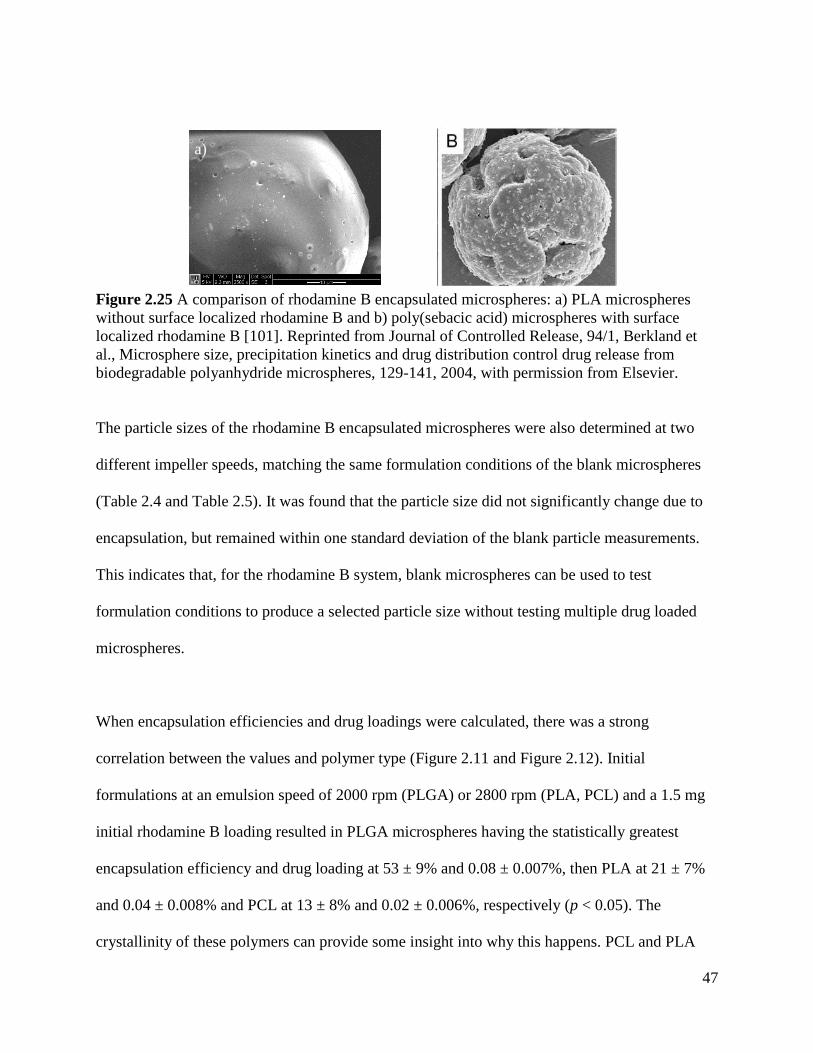
47
Figure 2.25 A comparison of rhodamine B encapsulated microspheres: a) PLA microspheres
without surface localized rhodamine B and b) poly(sebacic acid) microspheres with surface
localized rhodamine B [101]. Reprinted from Journal of Controlled Release, 94/1, Berkland et
al., Microsphere size, precipitation kinetics and drug distribution control drug release from
biodegradable polyanhydride microspheres, 129-141, 2004, with permission from Elsevier.
The particle sizes of the rhodamine B encapsulated microspheres were also determined at two
different impeller speeds, matching the same formulation conditions of the blank microspheres
(Table 2.4 and Table 2.5). It was found that the particle size did not significantly change due to
encapsulation, but remained within one standard deviation of the blank particle measurements.
This indicates that, for the rhodamine B system, blank microspheres can be used to test
formulation conditions to produce a selected particle size without testing multiple drug loaded
microspheres.
When encapsulation efficiencies and drug loadings were calculated, there was a strong
correlation between the values and polymer type (Figure 2.11 and Figure 2.12). Initial
formulations at an emulsion speed of 2000 rpm (PLGA) or 2800 rpm (PLA, PCL) and a 1.5 mg
initial rhodamine B loading resulted in PLGA microspheres having the statistically greatest
encapsulation efficiency and drug loading at 53 ± 9% and 0.08 ± 0.007%, then PLA at 21 ± 7%
and 0.04 ± 0.008% and PCL at 13 ± 8% and 0.02 ± 0.006%, respectively (p < 0.05). The
crystallinity of these polymers can provide some insight into why this happens. PCL and PLA
a)
48
are semi-crystalline polymers with an approximate 40% crystallinity for PCL and 37%
crystallinity for PLA [103, 104]. The crystalline phase of these polymers is relatively
impermeable to water, so the drug entrapment of the water soluble rhodamine B will most likely
occur in the amorphous region of the polymer, as demonstrated by Huatan et al., Kim et al., and
Youan et al., where an increase in the amorphous region of the polymer and decrease in polymer
crystallinity increased the encapsulation efficiency [105-107]. Therefore, PLGA 50:50,
characterized as an amorphous or non-crystalline polymer [108], would have the greatest
encapsulation efficiency, as we showed, and PLA and PCL would be lower. The contact angle
measurements of these polymers provide further insight to the encapsulation efficiency of the
microspheres, with PLGA having the smallest angle at 70.8 ± 1.5°, indicating its greater
hydrophilicity when compared to PLA at 74.7 ± 1.3°and PCL at 75.5 ± 0.8°. Therefore,
rhodamine B, a hydrophilic dye, would be more readily retained within a PLGA microsphere.
When encapsulated in PLA or PCL, rhodamine B would preferentially diffuse to the external
aqueous phase (W2) and wash out of the microspheres during formulation.
Even so, there are ways to overcome a low encapsulation efficiency and drug loading. For
example, Chen et al. increased the PLGA polymer concentration during emulsification from 6 to
18% w/v to increase carboplatin drug loading [31]. The polymer solution became more viscous,
reducing the amount of drug that leached out during the sphere hardening phase. This modestly
increased the drug loading from 9.6 ± 0.15 to 10.5 ± 0.2%. Another option was demonstrated by
Zhang et al. for temozolomide encapsulated PLGA microspheres using the single emulsion
method [28]. To overcome a low encapsulation efficiency, the external aqueous phase was
49
saturated with the drug in addition to having the drug in the internal, oil phase. This more than
doubled the efficiency from 30% to as high as 85%.
Increasing the initial drug loading can also have an impact on drug loading and encapsulation
efficiency. As demonstrated by Gil-Alegre et al., increasing the drug/polymer ratio from 0.2 to
0.4 doubled the drug loading, maintaining the same encapsulation efficiency [30]. However, for
an increase to a 0.8 ratio, the drug loading did not change; instead, a decrease in encapsulation
efficiency resulted. This indicates that there is a solubility limit that must be considered when
encapsulating drugs using the emulsion techniques.
Following these examples, PCL, having the lowest encapsulation efficiency, was subjected to
changes in initial drug loading, polymer amount, and rhodamine B in both the internal (W1) and
external (W2) aqueous phases. The best and highest encapsulation efficiencies and drug loadings
were achieved when rhodamine B was present in both the internal and external water phases,
lowering the concentration gradient and significantly increasing the encapsulation efficiency to
70 ± 14% from 13 ± 8% and drug loading to 0.35 ± 0.024% from 0.02 ± 0.003% (p < 0.05).
Increasing the initial drug loading from 1.5 mg to 6 mg increased the encapsulation efficiency to
26 ± 6% and drug loading to 0.14 ± 0.02% while changes from double to single emulsion and
increasing the polymer concentration did not impact the encapsulation efficiency and drug
loading.
Following these results, PLGA was optimized by placing rhodamine B in the external, aqueous
phase (W2). In an initial test, 5 mg of rhodamine B were used in W2 (10%, w/v), increasing
50
encapsulation efficiency to 439% ± 16. This greater than 100% efficiency is from part of the
rhodamine B in W2 being encapsulated in the microsphere during emulsification, approximately
27 ± 1%. To reduce the amount of drug, 1 mg of rhodamine B in W2 was used (2% w/v) with a
resulting efficiency of 274% ± 13 and a drug loading of 0.23 ± 0.010%. Approximately 47% of
the rhodamine B in the external phase was encapsulated. PLA was not optimized because of
limited polymer amounts. However, it is assumed that similar optimization would be possible.
Fluorescein, a hydrophobic dye, was also used as a model drug to test the encapsulation
capability of the microsphere system. It was encapsulated in all three polymer types and present
when viewed with fluorescence microscopy (Figure 2.13). A full characterization of
encapsulation efficiency and drug loading was not conducted since gefitinib, a hydrophobic
chemotherapeutic, would be used instead.
The first chemotherapeutic to be encapsulated was gefitinib, utilizing the single emulsion
technique due to its poor water solubility, less than 1 mg/mL [109]. PLGA was chosen to
encapsulate gefitinib since rhodamine B, with a similar molecular weight and ring structure, best
encapsulated in this polymer. Initial characterization showed that the gefitinib encapsulated
microspheres were UV fluorescent, indicating gefitinib was located somewhere on or in the
microspheres (Figure 2.14a). As a control, blank PLGA microspheres were also examined and
were not UV fluorescent. When imaged with SEM, the gefitinib encapsulated microspheres were
smooth and nonporous (Figure 2.14b). Surfaced localized drug crystals were not present,
indicating gefitinib was encapsulated inside the microspheres. The gefitinib encapsulated PLGA
microspheres demonstrated a tunable particle size distribution based on impeller speed, as shown
51
in Table 2.6 and Figure 2.15, with sizes ranging from 28 ± 11 µm in diameter at a low impeller
speed to 10 ± 5 µm in diameter at a high speed.
In initial experiments, encapsulation efficiency was high at 90 ± 2% for a 1.5 mg initial gefitinib
loading and 2000 rpm impeller speed (Figure 2.16). However, as shown in Figure 2.17, the drug
loading was low at this condition (0.11 ± 0.002%). Further increases in initial gefitinib loading
from 1.5 mg to 3 and 4.5 mg actually caused a decrease in encapsulation efficiency, indicating a
limit to the drug/polymer ratio, as previously discussed. Therefore, the polymer concentration
was increased by changing the PLGA amount from 1.75 g to 2.5 g and the initial gefitinib
loading increased to 15 mg. The resulting increase in polymer viscosity and initial gefitinib
loading significantly increased the drug loading to 0.63 ± 0.023% and the amount of drug present
from 0.2 ± 0.02 mg to 1.9 ± 0.21 mg (p < 0.05). Encapsulation efficiency remained high at 82 ±
9%. This formulation was considered optimal since reported in vivo studies have a drug dosage
from 15 µg to 1 mg for intracranial tumor bearing mice and rats [30, 36, 43-45]. The increase in
PLGA and initial gefitinib loading had a minimal effect on particle size, causing an increase
from 23 ± 8 µm to 28 ± 11 µm. This could be attributed to the more viscous oil phase present
with the higher concentration of PLGA. Of note is that the same, optimal formulation parameters
but at a faster impeller speed (5600 versus 2000 rpm) resulted in smaller microspheres, 10 ± 5
µm, while maintaining a comparable encapsulation efficiency at 87 ± 12% and drug loading at
0.55 ± 0.026%. This indicates that a robust set of optimized formulation parameters was
achieved for the gefitinib-PLGA microspheres, allowing for particle size (and subsequent drug
release) tuning without the need for repetitive optimization.
52
The second chemotherapeutic to be encapsulated was the antibody, bevacizumab. However, due
to the high cost of this chemotherapeutic, the commercially available antibody, immunoglobulin
G (IgG), was used instead. PLA was chosen to encapsulate IgG due to its slightly higher
hydrophilicity, as determined by contact angle (Table 2.9). The double emulsion technique was
selected for encapsulation because it was used to successfully encapsulate other non-small
molecules such as hemopexin and C-terminal fragment of platelet factor 4 (PF-4/CTF) for
glioma treatment and to formulate bevacizumab encapsulated PLGA and poly(ethyleneglycol)-b-
poly(D,L-lactic acid) microspheres for the treatment of age-related macular degeneration [43, 44,
91].
Following similar basic formulations conditions of gefitinib-PLGA, IgG was encapsulated at
2800 rpm with an initial IgG loading of 3 mg IgG. Preliminary characterization showed that the
IgG encapsulated PLA microspheres were UV-fluorescent (Figure 2.18a), indicating that IgG
was present on or in the microspheres. However, the encapsulation efficiency was low at 18 ±
4% (Figure 2.19). While increasing the initial IgG loading to 15 mg IgG increased efficiency to
36 ± 9%, this was still considered too low. Therefore, the PLA amount was increased to 2 grams,
resulting in an efficiency of 23 ± 2% for a 3 mg IgG initial loading. The low encapsulation
efficiency could be due to the hydrophilicity of IgG; IgG would preferentially diffuse to the
external aqueous phase with a low IgG concentration from the high IgG concentration in the
internal aqueous phase. Therefore, the next step was to reduce the amount of the external
aqueous phase from 50 mL to 30 mL. This reduction would hopefully reduce the driving force of
IgG to the external phase. The IgG that did diffuse out would result in a higher concentration of
IgG because of the lower volume. While this modestly improved the efficiency to 46 ± 15%, it

53
was not at our goal of 60%. Therefore, following the previous work with rhodamine B and PCL,
5 mg IgG (17% w/v) was loaded into the reduced, external phase. This increased encapsulation
efficiency to 105 ± 10% with an initial IgG loading of 3 mg; however, the drug loading was still
considered low at 0.13 ± 0.013% (Figure 2.20). The initial IgG loading was then increased to 7.5
mg IgG and the external phase concentration increased to 33% (w/v), resulting with an optimized
encapsulation efficiency of 88 ± 12% and a drug loading at 0.32 ± 0.055%, significantly higher
than the first attempt (p < 0.05). These same conditions were used to produce larger
microspheres 43 ± 25 µm in diameter. However, the encapsulation efficiency was low at 34 ±
11% for this larger size. This lowered encapsulation efficiency could be due to the precipitation
kinetics of polymer microspheres. As described by Berkland et al., there are two competing
factors affecting encapsulation efficiency during the time that the microspheres “harden” from a
DCM enriched polymer phase to a “hard” polymer phase with no DCM [101]. First, larger
microspheres have a decreased amount of drug that successfully diffuses out of the sphere
because of the large, physical size of the polymer the drug must diffuse through. On the other
hand, larger spheres take longer for the DCM to evaporate and “harden”, allowing more time for
the drug to diffuse before being entrapped by the hard polymer. Specifically, Berkland et al.
describes a minimum in encapsulation efficiency for 50 µm microspheres, where the rate of
entrapment and sphere hardening is slower than the drug diffusion, as compared to microspheres
approximately 10 µm in diameters [101]. Our larger microspheres set at 43 ± 25 µm and smaller
microsphere set at 11 ± 7 µm with the resulting low and high encapsulation efficiencies, would
support this hypothesis.
54
These two particles size sets of IgG-PLA were also imaged with SEM, showing that spherical
particles were produced (Figure 2.18b and c). However, the microspheres were not as smooth as
the gefitinib-PLGA microspheres. The smaller diameter microspheres had outward protruding
bumps on the surface while the larger diameter microspheres had material present at the surface.
Following the hypothesis of the precipitation kinetics described above, the bumps on the smaller
sized microspheres could be pockets of IgG that were diffusing towards the external aqueous
phase that were entrapped as the sphere hardened. These bumps are not present on the larger
microsphere set due to the longer time of sphere hardening, allowing the IgG to fully diffuse and
result in a lower encapsulation efficiency. Instead, the material that is seen via SEM could be
residual IgG from the external aqueous phase that was not fully washed off during microsphere
formulation. While the spheres are not perfectly smooth when compared to the blanks, these
microspheres are still spherical and considered an acceptable product.
The third chemotherapeutic to be encapsulated was lomustine, a hydrophobic, small molecule
drug already approved for the treatment of gliomas [82-84]. Lomustine (LMT) was chosen to be
encapsulated in PCL, the most hydrophobic of the three polymers (Table 2.9). Early formulations
were similar to GB-PLGA and IgG-PLA formulations, with an initial LMT loading of 1.5 mg
LMT at 2800 rpm. As can be seen in Figure 2.22, the encapsulation efficiency was low at 18 ±
0.7% and remained low despite increasing the initial LMT loading to 3, 6, 9, and 15 mg LMT.
Increasing the oil viscosity by increasing the PCL amount from 1.75 g to 2.5 g did not have a
significant impact on encapsulation efficiency, causing an increase to 22 ± 2% (p < 0.05).
Following a similar protocol to RB-PCL and IgG-PLA, 5 mg of LMT was loaded in the external
aqueous phase (10% w/v). However, this only modestly increased the encapsulation efficiency to
55
24 ± 2%. Therefore, the external aqueous phase volume was reduced to 30 mL. Without any
LMT present in the external aqueous phase, LMT encapsulation efficiency remained low at 34 ±
3%. However, with LMT in the external phase at 10% w/v, the encapsulation efficiency
significantly increased to 291 ± 36% for an initial LMT loading of 3 mg (p < 0.05). Similar to
RB and IgG, this means that PCL was encapsulating part of the LMT in the external aqueous
phase (~ 25%). The next step was to increase the initial LMT loading to 15 mg, which would
hopefully increase the overall drug loading in the microspheres. As seen in Figure 2.22 and
Figure 2.23, this reduced the encapsulation efficiency to 102 ± 12% and increased drug loading
to 1.54 ± 0.08%. The amount of drug initially loaded into the microsphere was fully encapsulated
by reducing the concentration gradient between the internal and external aqueous phase. Other
formulations that were tried without success to increase encapsulation include immediately
stirring the microspheres after emulsification to increase the rate of sphere hardening and
decrease the diffusion time, rinsing the microspheres once to remove excess drug, and
formulating the microspheres in the dark, due to light sensitivity of LMT.
The particle size of the optimized formulation parameters (2800 rpm, 15 mg initial LMT loading,
30 mL W2 with LMT 10% w/v) was 31 ± 12 µm in diameter. This is comparable to blank PCL
microspheres formulated at similar conditions, with a particle size of 30 ± 12 µm in diameter.
The microspheres produced were, for the most part, smooth and spherical, as shown by the SEM
images in Figure 2.21a and b. The presence of “flattened” microspheres seen in Figure 2.21a
may indicate that some PCL microspheres being hollow, demonstrating the same sunken shape
of hollow spheres reported in the literature [110-112]. In nanoparticle mini-emulsions, these
hollow spheres arise from phase separation inside the particles between the hydrophobic material
56
and polymer [110, 113]. Since these “hollow” spheres are minimally present, these microspheres
are still considered an acceptable product.
The synthesis of the di-functional macroinitiator, ligand, and PNIPAM were characterized by
NMR, comparing detected peaks to reported values [99]. In the case of PNIPAM, the 1H-NMR
spectra showed the disappearance of the peaks related to the vinyl protons (at 5.5 ppm and 6.2
ppm) of the NIPAM monomer and showed the characteristic PNIPAM peaks at 1.14, 1.4-2.4,
and 4.03 ppm.
The thermoresponsiveness of aqueous PNIPAM was demonstrated when a 2.5% WPNIPAM/VPBS
solution was exposed to room temperature (25°C) and physiological temperature (37°C). As
shown in Figure 2.24a, at room temperature below the LCST of PNIPAM, the solution was a
liquid. However, after exposure above the LCST at 37°C, the solution solidified, forming an
opaque gel. Figure 2.24b shows that the presence of rhodamine B encapsulated PLGA
microspheres did not hinder this phase transition. Instead it shows that the PNIPAM was capable
of entrapping the microspheres, demonstrating PNIPAM’s capability as a carrier for drug
encapsulated microspheres. It is important to note that the gelation phenomenon is reversible.
Once allowed to cool back to room temperature, the PNIPAM reverted back to liquid form,
releasing the microspheres.
2.6 Conclusions
The first part of this work was focused on formulating blank and drug encapsulated polymeric
microspheres. Smooth, spherical, non-porous microparticles were produced from both double
57
and single emulsions with the size dependent on the impeller speed during emulsification. The
model drugs rhodamine B and fluorescein were successfully encapsulated in PLGA, PLA, and
PCL microspheres. For rhodamine B encapsulation, PLGA microspheres had the highest
encapsulation efficiency and drug loading, then PLA, and then PCL. However, by altering the
formulation parameters, high encapsulation efficiencies and drug loadings were achieved.
Gefitinib encapsulated PLGA microspheres, IgG encapsulated PLA microspheres, and lomustine
encapsulated PCL microspheres were also successfully produced using the emulsion techniques.
All three drug and microsphere combinations were optimized with a high encapsulation
efficiency, greater than 80%, and drug loading, greater than 0.3%. These optimized particles
were spherical and mostly smooth, with particle size dependent on impeller speed during
emulsification.
The second part of this work was focused on synthesizing a linear, degradable PNIPAM.
PNIPAM with a 20,000 g/mol molecular weight was successfully synthesized and an aqueous
solution of PNIPAM demonstrated a reversible, temperature dependent phase transition that was
capable of entrapping microspheres.
58
3 Evaluation of the In Vitro Drug Release
3.1 Background
3.1.1 Motivation
Chapter 2 demonstrated that polymeric microspheres were capable of encapsulating both model
drugs and chemotherapeutics. While the microspheres were characterized for particle size,
surface morphology, and drug encapsulation, the release rate in vitro has not yet been elucidated.
The release rates determined in vitro are the first steps to understanding the drug release rate in
vivo and for deciding the amount of microspheres necessary for a therapeutic dosage. In this
chapter, the methods used to determine the release rates of rhodamine B, gefitinib, IgG, and
lomustine will be described and the results discussed. Linear, degradable PNIPAM will also be
tested for an aerosolized application on tissue at physiological temperature.
3.1.2 In Vitro Release of Drugs from Polymeric Microspheres
The release of chemotherapeutics from polymeric microspheres is dependent on several factors
including particle size, drug type, polymer type and molecular weight, fabrication technique,
drug loading content, stabilizer concentration, the use of additives to control porosity, etc. [24,
27, 41, 51, 52, 55, 56]. For example, a typical release of 5-FU from PLGA microspheres has a
biphasic profile: an initial burst phase in the first day or two followed by a sustained release for
18 days, as shown in Figure 3.1 [36, 72]. However, as demonstrated by Fournier et al., this
release can be extended by changing several formulation factors [41]. First, the polymer type was
changed from PLGA to the slower degrading poly(methylidene malonate 2.1.2) (PMM 2.1.2).
Then, a higher polymer concentration and molecular weight was used, resulting with a more
viscous organic phase that prevented the diffusion of the drug crystals to the surface of the
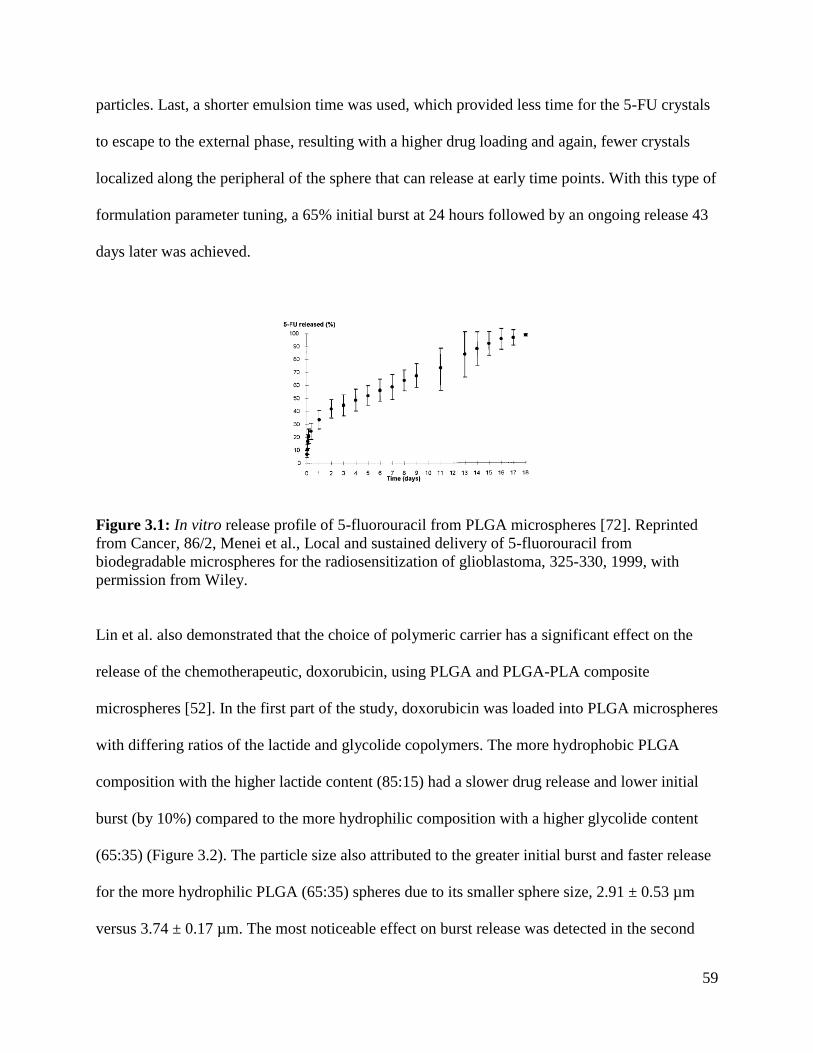
59
particles. Last, a shorter emulsion time was used, which provided less time for the 5-FU crystals
to escape to the external phase, resulting with a higher drug loading and again, fewer crystals
localized along the peripheral of the sphere that can release at early time points. With this type of
formulation parameter tuning, a 65% initial burst at 24 hours followed by an ongoing release 43
days later was achieved.
Figure 3.1: In vitro release profile of 5-fluorouracil from PLGA microspheres [72]. Reprinted
from Cancer, 86/2, Menei et al., Local and sustained delivery of 5-fluorouracil from
biodegradable microspheres for the radiosensitization of glioblastoma, 325-330, 1999, with
permission from Wiley.
Lin et al. also demonstrated that the choice of polymeric carrier has a significant effect on the
release of the chemotherapeutic, doxorubicin, using PLGA and PLGA-PLA composite
microspheres [52]. In the first part of the study, doxorubicin was loaded into PLGA microspheres
with differing ratios of the lactide and glycolide copolymers. The more hydrophobic PLGA
composition with the higher lactide content (85:15) had a slower drug release and lower initial
burst (by 10%) compared to the more hydrophilic composition with a higher glycolide content
(65:35) (Figure 3.2). The particle size also attributed to the greater initial burst and faster release
for the more hydrophilic PLGA (65:35) spheres due to its smaller sphere size, 2.91 ± 0.53 µm
versus 3.74 ± 0.17 µm. The most noticeable effect on burst release was detected in the second
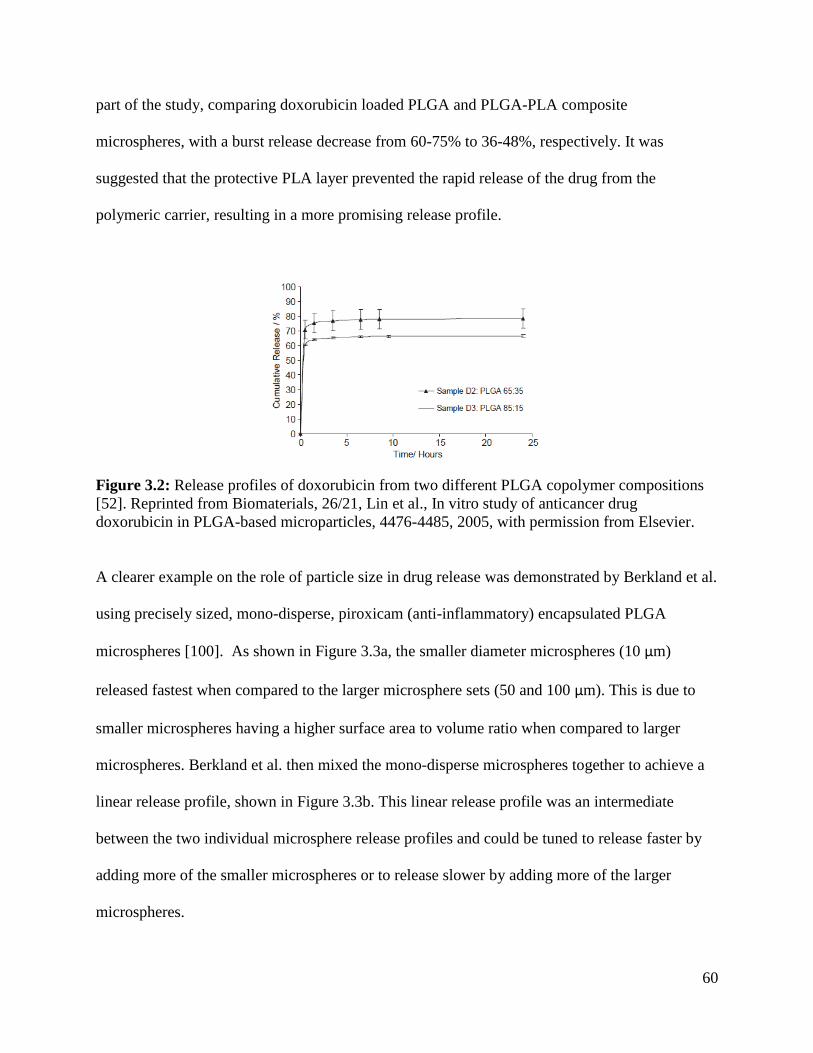
60
part of the study, comparing doxorubicin loaded PLGA and PLGA-PLA composite
microspheres, with a burst release decrease from 60-75% to 36-48%, respectively. It was
suggested that the protective PLA layer prevented the rapid release of the drug from the
polymeric carrier, resulting in a more promising release profile.
Figure 3.2: Release profiles of doxorubicin from two different PLGA copolymer compositions
[52]. Reprinted from Biomaterials, 26/21, Lin et al., In vitro study of anticancer drug
doxorubicin in PLGA-based microparticles, 4476-4485, 2005, with permission from Elsevier.
A clearer example on the role of particle size in drug release was demonstrated by Berkland et al.
using precisely sized, mono-disperse, piroxicam (anti-inflammatory) encapsulated PLGA
microspheres [100]. As shown in Figure 3.3a, the smaller diameter microspheres (10 µm)
released fastest when compared to the larger microsphere sets (50 and 100 µm). This is due to
smaller microspheres having a higher surface area to volume ratio when compared to larger
microspheres. Berkland et al. then mixed the mono-disperse microspheres together to achieve a
linear release profile, shown in Figure 3.3b. This linear release profile was an intermediate
between the two individual microsphere release profiles and could be tuned to release faster by
adding more of the smaller microspheres or to release slower by adding more of the larger
microspheres.
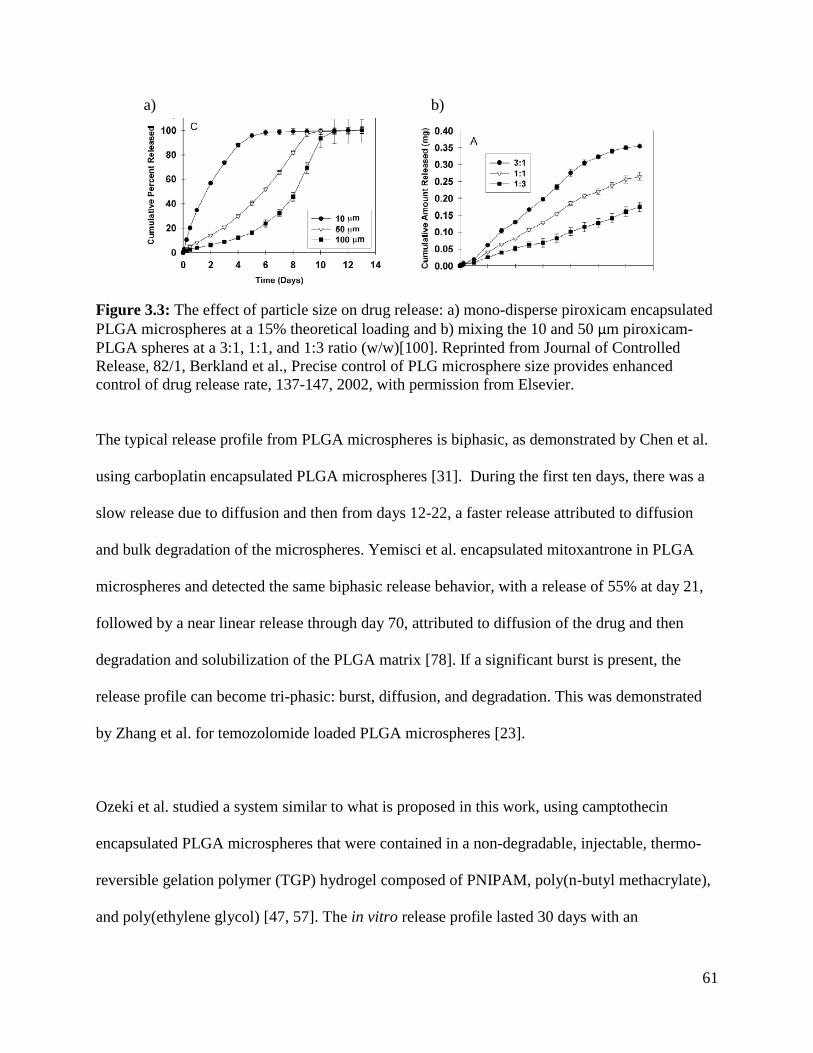
61
a) b)
Figure 3.3: The effect of particle size on drug release: a) mono-disperse piroxicam encapsulated
PLGA microspheres at a 15% theoretical loading and b) mixing the 10 and 50 µm piroxicam-
PLGA spheres at a 3:1, 1:1, and 1:3 ratio (w/w)[100]. Reprinted from Journal of Controlled
Release, 82/1, Berkland et al., Precise control of PLG microsphere size provides enhanced
control of drug release rate, 137-147, 2002, with permission from Elsevier.
The typical release profile from PLGA microspheres is biphasic, as demonstrated by Chen et al.
using carboplatin encapsulated PLGA microspheres [31]. During the first ten days, there was a
slow release due to diffusion and then from days 12-22, a faster release attributed to diffusion
and bulk degradation of the microspheres. Yemisci et al. encapsulated mitoxantrone in PLGA
microspheres and detected the same biphasic release behavior, with a release of 55% at day 21,
followed by a near linear release through day 70, attributed to diffusion of the drug and then
degradation and solubilization of the PLGA matrix [78]. If a significant burst is present, the
release profile can become tri-phasic: burst, diffusion, and degradation. This was demonstrated
by Zhang et al. for temozolomide loaded PLGA microspheres [23].
Ozeki et al. studied a system similar to what is proposed in this work, using camptothecin
encapsulated PLGA microspheres that were contained in a non-degradable, injectable, thermo-
reversible gelation polymer (TGP) hydrogel composed of PNIPAM, poly(n-butyl methacrylate),
and poly(ethylene glycol) [47, 57]. The in vitro release profile lasted 30 days with an
62
approximate 80% release. Dispersing the microspheres in the TGP resulted in a slightly slower
but similar release, indicating the release from PLGA was the rate limiting step instead of an
effect of the TGP.
3.1.3 Aerosolized PNIPAM
Thermoresponsive PNIPAM has been used in many different applications ranging from
scaffolding for tissue engineering [99], cell release from surfaces using low temperature lift-off
[114], as a thermo-sensitive glue for retinal implants [115], microgels for biosensing [116],and
vehicles for drug delivery including hydrogels, liposomes, and nanoparticles [117-119]. To the
best of our knowledge, PNIPAM has not been applied in an aerosolized form as a vehicle for
drug delivery. The closest example to our application is a non-degradable, thermo-reversible
gelation hydrogel containing PNIPAM in addition to poly(n-butyl methacrylate) and
poly(ethylene glycol) applied as an injectable formulation for a localized camptothecin,
doxorubicin, or vincristine encapsulated PLGA microsphere delivery[47, 48, 57, 61]. Therefore,
this will be the first time that PNIPAM applied as an aerosol to tissue at 37°C will be tested and
reported.
3.2 Hypothesis
It is hypothesized that:
(1) Rhodamine B will be released from PLGA microspheres in vitro following a diffusion,
degradation regime of approximately one month
63
(2) Gefitinib will be released from PLGA microspheres in vitro following the same diffusion,
degradation regime with a delay in release due to its hydrophobicity. Release is
hypothesized to take approximately two months
(3) Immunoglobulin G will release in vitro for approximately six months, following a diffusion
and degradation regime
(4) Lomustine will have an accelerated release from PCL microspheres over 5 days by using 5M
NaOH
(5) When combined and released together, gefitinib will release first from PLGA microspheres
then IgG from PLA microspheres
(6) PNIPAM will not significantly hinder the in vitro release of any of the model drugs or
chemotherapeutics
(7) Aqueous PNIPAM can be applied as an aerosol to tissue at physiological temperature and
will entrap drug encapsulated microspheres in a conformal layer on the tissue
3.3 Materials and Methods
3.3.1 Materials
3.3.1.1 Materials for In Vitro Drug Release
Microspheres and PNIPAM used in this section were formulated or synthesized in Chapter 2.
Phosphate buffered saline (PBS; Sigma), sodium carbonate (Fisher Scientific, anhydrous),
sodium bicarbonate (Fisher Scientific), citric acid monohydrate (Sigma), sodium phosphate
dibasic (Sigma, anhydrous), MES sodium salt (Sigma,) hydrochloric acid (HCl; EMD, 12.1 M),
sodium hydroxide (NaOH; Mallinckrodt Chemicals), dimethyl sulfoxide (DMSO; EMD),
64
rhodamine B (Sigma), gefitinib (Fisher, free base >99%), immunoglobulin G from sheep serum
(IgG; Sigma, ≥95%, lyophilized powder), and lomustine (LMT; Enzo Life Sciences) were used
as received.
3.3.2 Buffer Preparation
Buffers at pH 4, 6, 7.4, and 10 were prepared as described in Table 3.1 [120]. Small amounts of
hydrochloric acid and sodium hydroxide were added to the buffer solutions to adjust pH level
within ±0.1 of the target pH.
Table 3.1 Preparation of buffer solutions
pH Component 1 mL
component 1 Component 2
mL
component 2
4 citric acid monohydrate, 0.1 M 61.45 sodium phosphate
dibasic, 0.2 M 38.55
6 MES sodium salt, 0.01 M 100 N/A -
7.4 PBS packet, 0.01 M 100 N/A -
10 sodium carbonate, 0.1 M 60 sodium bicarbonate,
0.1 M 40
3.3.3 In Vitro Drug Release
3.3.3.1 Release from Microspheres
The in vitro drug release of rhodamine B encapsulated PLGA microspheres in PBS was
determined using a concentration of 30 mg dry microspheres per 5 mL PBS. The different
microspheres and formulation conditions are listed in Table 3.2. The dry microspheres were
added to PBS, sonicated for 5 minutes, and placed on a shaker at 300 rpm, 37 °C. At specified
time points (Appendix 14), the sample was removed and centrifuged at 3000 g and 4°C for 5
65
minutes. The supernatant was removed for measurement while the pellet was re-suspended to the
original concentration and placed back on the shaker. The supernatant was measured using a
Shimadzu UV-1601 ultraviolet-visible spectrophotometer with the wavelength dependent on the
drug being studied (Table 3.2). A “blank” drug release was also conducted as described above,
with the blank absorbance values subtracted out of the drug values. The amount of drug was then
calculated using a standard curve (Appendix 1).
The release of gefitinib from PLGA microspheres followed the same protocol with a few
modifications. Before centrifugation of the sample, 1 M HCl was added to obtain a PBS-1 M
HCL 90-10 (v/v) solution. This was to prevent the ring opening of gefitinib and to increase
gefitinib solubility [121]. After centrifugation, the supernatant was allowed to equilibrate for two
days before measurement and passed through a 0.2 µm cellulose acetate syringe filter before
measurement. Note that the release of gefitinib from PLGA microspheres was subjected to a 2.4
correction factor. We hypothesize that this is due to non-soluble polymer fragments adsorbing
gefitinib that is then caught in the syringe filter. A correction factor was not necessary for the
PNIPAM release discussed next. We hypothesize this is due to the PNIPAM retaining the
polymer fragments, preventing the adsorption and subsequent drug loss. We will test this
hypothesis at a later time.
The release of IgG from PLA microspheres followed the same protocol listed for RB-PLGA
microspheres with the addition of using a 0.2 µm cellulose acetate syringe filter before
measurement. For the accelerated release, PBS was replaced with a buffered solution at pH 4, 6,
or 10.
66
For the combined release of gefitinib from PLGA and IgG from PLA, the same protocol was
followed with a few modifications. Both GB-PLGA and IgG-PLA were present at a
concentration of 30 mg/5 mL solution. PBS was replaced with pH 10 buffered solution and
before centrifugation, 1 M HCl was added to obtain a pH 10-1 M HCL 80-20 (v/v) solution. This
was to enhance the solubility of gefitinib. A 0.2 µm cellulose acetate syringe filter was used
before each measurement. Additional controls included the individual release of GB-PLGA and
IgG-PLA under the same conditions. The total contribution of the gefitinib release at the IgG
UV-vis peak (283 nm) was subtracted from the 283 nm peak measurement of the combined
release. The contribution of the IgG release at the gefitinib UV-vis peak (333 nm) was also
subtracted from the 333 nm peak of the combined release. This was an attempt to remove any
peak contribution that was from the drug not being studied, i.e., gefitinib contributing to a higher
estimate of IgG and vice versa.
The release of lomustine from PCL followed the same basic protocol of RB-PLGA. For release
in PBS, DMSO was added to the supernatant after centrifugation for lomustine solubility, ending
with a final ratio of PBS-DMSO 55-45 (v/v). For accelerated release, PBS was replaced with 5
M NaOH-DMSO 65-35 (v/v). A 0.2 µm polytetrafluoroethylene syringe filter was used before
each measurement.
Table 3.2 details the conditions of release along with the microsphere formulation parameters.
All measurements were performed in triplicate with error propagated through the cumulative
release and statistical significance analyzed with an unpaired t test.
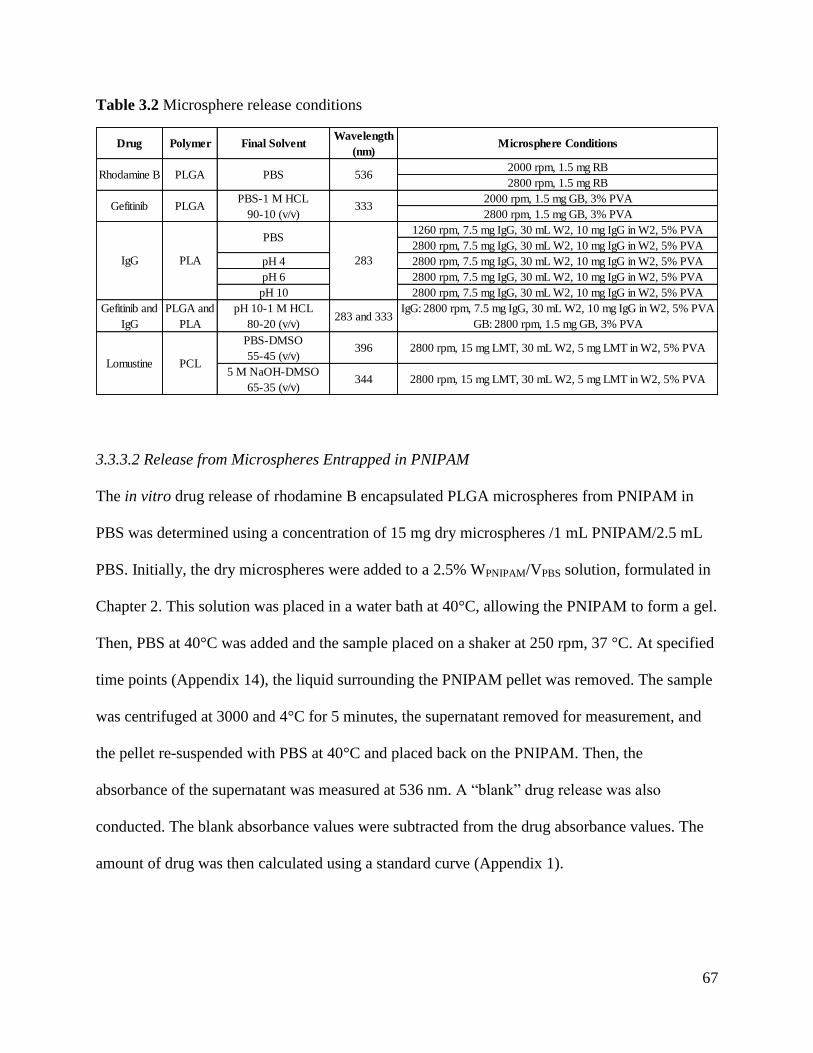
67
Table 3.2 Microsphere release conditions
3.3.3.2 Release from Microspheres Entrapped in PNIPAM
The in vitro drug release of rhodamine B encapsulated PLGA microspheres from PNIPAM in
PBS was determined using a concentration of 15 mg dry microspheres /1 mL PNIPAM/2.5 mL
PBS. Initially, the dry microspheres were added to a 2.5% WPNIPAM/VPBS solution, formulated in
Chapter 2. This solution was placed in a water bath at 40°C, allowing the PNIPAM to form a gel.
Then, PBS at 40°C was added and the sample placed on a shaker at 250 rpm, 37 °C. At specified
time points (Appendix 14), the liquid surrounding the PNIPAM pellet was removed. The sample
was centrifuged at 3000 and 4°C for 5 minutes, the supernatant removed for measurement, and
the pellet re-suspended with PBS at 40°C and placed back on the PNIPAM. Then, the
absorbance of the supernatant was measured at 536 nm. A “blank” drug release was also
conducted. The blank absorbance values were subtracted from the drug absorbance values. The
amount of drug was then calculated using a standard curve (Appendix 1).
Drug Polymer Final SolventWavelength
(nm)Microsphere Conditions
2000 rpm, 1.5 mg RB
2800 rpm, 1.5 mg RB
2000 rpm, 1.5 mg GB, 3% PVA
2800 rpm, 1.5 mg GB, 3% PVA
1260 rpm, 7.5 mg IgG, 30 mL W2, 10 mg IgG in W2, 5% PVA
2800 rpm, 7.5 mg IgG, 30 mL W2, 10 mg IgG in W2, 5% PVA
pH 4 2800 rpm, 7.5 mg IgG, 30 mL W2, 10 mg IgG in W2, 5% PVA
pH 6 2800 rpm, 7.5 mg IgG, 30 mL W2, 10 mg IgG in W2, 5% PVA
pH 10 2800 rpm, 7.5 mg IgG, 30 mL W2, 10 mg IgG in W2, 5% PVA
Gefitinib and
IgG
PLGA and
PLA
pH 10-1 M HCL
80-20 (v/v)283 and 333
IgG: 2800 rpm, 7.5 mg IgG, 30 mL W2, 10 mg IgG in W2, 5% PVA
GB: 2800 rpm, 1.5 mg GB, 3% PVA
PBS-DMSO
55-45 (v/v)396 2800 rpm, 15 mg LMT, 30 mL W2, 5 mg LMT in W2, 5% PVA
5 M NaOH-DMSO
65-35 (v/v)344 2800 rpm, 15 mg LMT, 30 mL W2, 5 mg LMT in W2, 5% PVA
PBS 536
PBS-1 M HCL
90-10 (v/v)333
PBS
283
Rhodamine B
Gefitinib
IgG
Lomustine
PLGA
PLA
PLGA
PCL
68
For the release of gefitinib from PLGA microspheres entrapped in PNIPAM, the same steps were
followed with a few modifications. Before centrifugation, 1 M HCl was added to the sample to
obtain a 90:10 v/v PBS:1 M HCl solution. This was to prevent the ring opening of gefitinib and
to increase gefitinib solubility. After the supernatant was removed, it was allowed to equilibrate
for two days, passed through a 0.2 µm cellulose acetate syringe filter, and measured at 333 nm.
Table 3.3 details the conditions of release along with the microsphere formulation parameters.
All measurements were performed in triplicate with error propagated through the cumulative
release and statistical significance analyzed with an unpaired t test.
Table 3.3 Release conditions of microspheres entrapped in PNIPAM
Drug Polymer Solvent Wavelength
(nm)
Microsphere
Conditions
Rhodamine
B PLGA PBS 536
2000 rpm, 1.5 mg RB
2800 rpm, 1.5 mg RB
Gefitinib PLGA PBS-1 M HCL 90-10
(v/v) 333
2800 rpm, 1.5 mg GB,
3% PVA
3.3.4 Ex Vivo Spray Application of Rhodamine B-PLGA Microspheres in PNIPAM
The spray application of PNIPAM and rhodamine B encapsulated PLGA microspheres was
performed ex vivo on rats provided by the Animal Use Training Program at the University of
Washington. First, dry rhodamine B encapsulated PLGA microspheres (1.5 mg initial loading, 44
± 11 µm) were added to aqueous PNIPAM (2.5% WPNIPAM/VPBS) in a travel perfume bottle
(Bartell Drugs) at a concentration of 30 mg microspheres/5 mL PNIPAM. Then, four “pumps” of
the RB-PLGA-PNIPAM formulation was applied as an aerosol to the exposed rat brain
(maintained at 37°C) and imaged. Images were taken with a SMZ15000 stereoscope with epi-
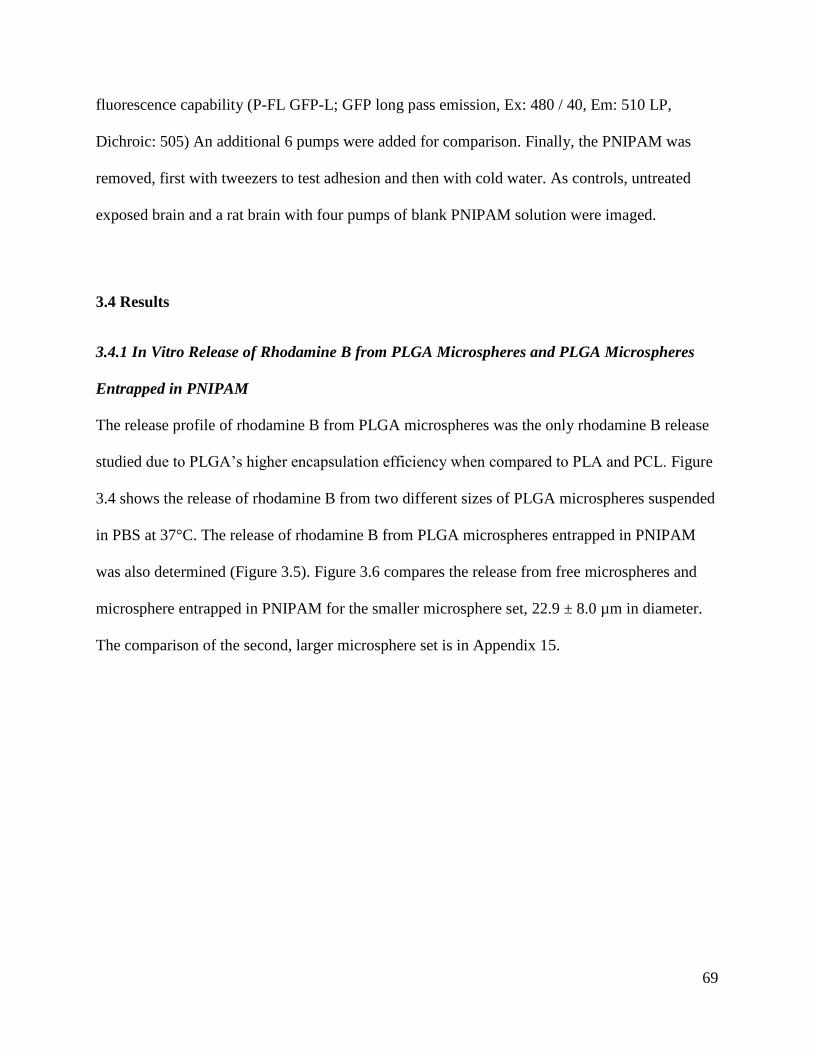
69
fluorescence capability (P-FL GFP-L; GFP long pass emission, Ex: 480 / 40, Em: 510 LP,
Dichroic: 505) An additional 6 pumps were added for comparison. Finally, the PNIPAM was
removed, first with tweezers to test adhesion and then with cold water. As controls, untreated
exposed brain and a rat brain with four pumps of blank PNIPAM solution were imaged.
3.4 Results
3.4.1 In Vitro Release of Rhodamine B from PLGA Microspheres and PLGA Microspheres
Entrapped in PNIPAM
The release profile of rhodamine B from PLGA microspheres was the only rhodamine B release
studied due to PLGA’s higher encapsulation efficiency when compared to PLA and PCL. Figure
3.4 shows the release of rhodamine B from two different sizes of PLGA microspheres suspended
in PBS at 37°C. The release of rhodamine B from PLGA microspheres entrapped in PNIPAM
was also determined (Figure 3.5). Figure 3.6 compares the release from free microspheres and
microsphere entrapped in PNIPAM for the smaller microsphere set, 22.9 ± 8.0 µm in diameter.
The comparison of the second, larger microsphere set is in Appendix 15.
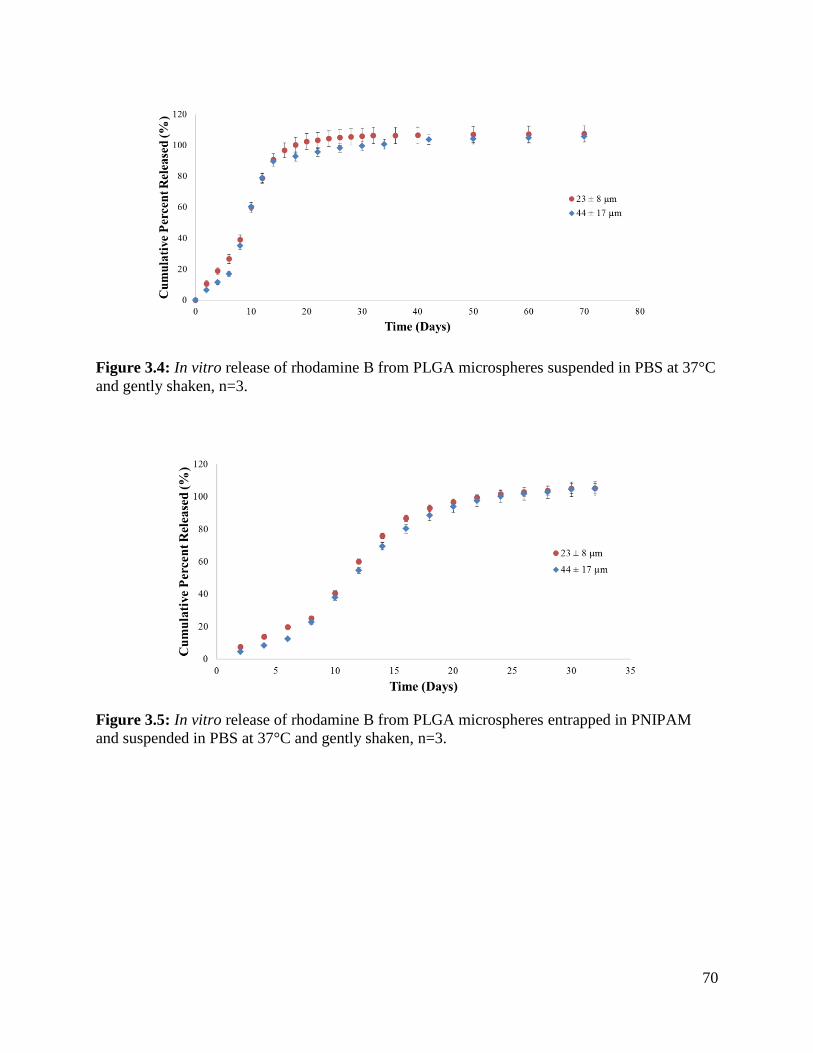
70
Figure 3.4: In vitro release of rhodamine B from PLGA microspheres suspended in PBS at 37°C
and gently shaken, n=3.
Figure 3.5: In vitro release of rhodamine B from PLGA microspheres entrapped in PNIPAM
and suspended in PBS at 37°C and gently shaken, n=3.
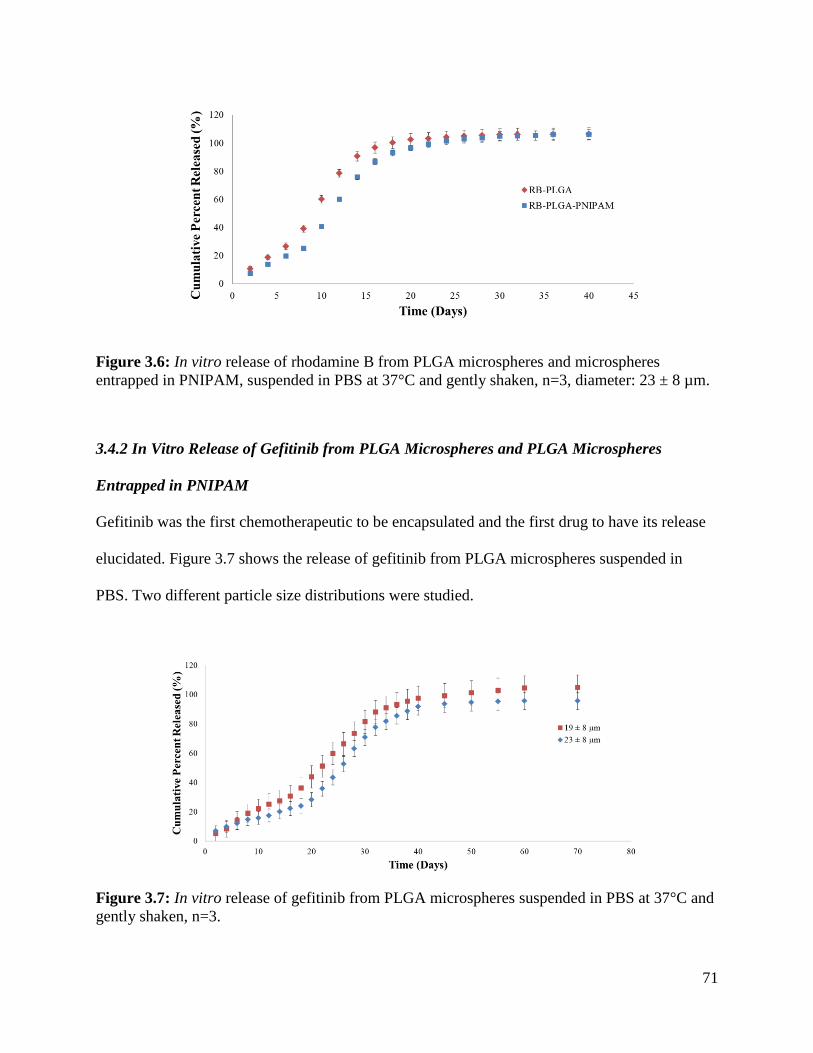
71
Figure 3.6: In vitro release of rhodamine B from PLGA microspheres and microspheres
entrapped in PNIPAM, suspended in PBS at 37°C and gently shaken, n=3, diameter: 23 ± 8 µm.
3.4.2 In Vitro Release of Gefitinib from PLGA Microspheres and PLGA Microspheres
Entrapped in PNIPAM
Gefitinib was the first chemotherapeutic to be encapsulated and the first drug to have its release
elucidated. Figure 3.7 shows the release of gefitinib from PLGA microspheres suspended in
PBS. Two different particle size distributions were studied.
Figure 3.7: In vitro release of gefitinib from PLGA microspheres suspended in PBS at 37°C and
gently shaken, n=3.
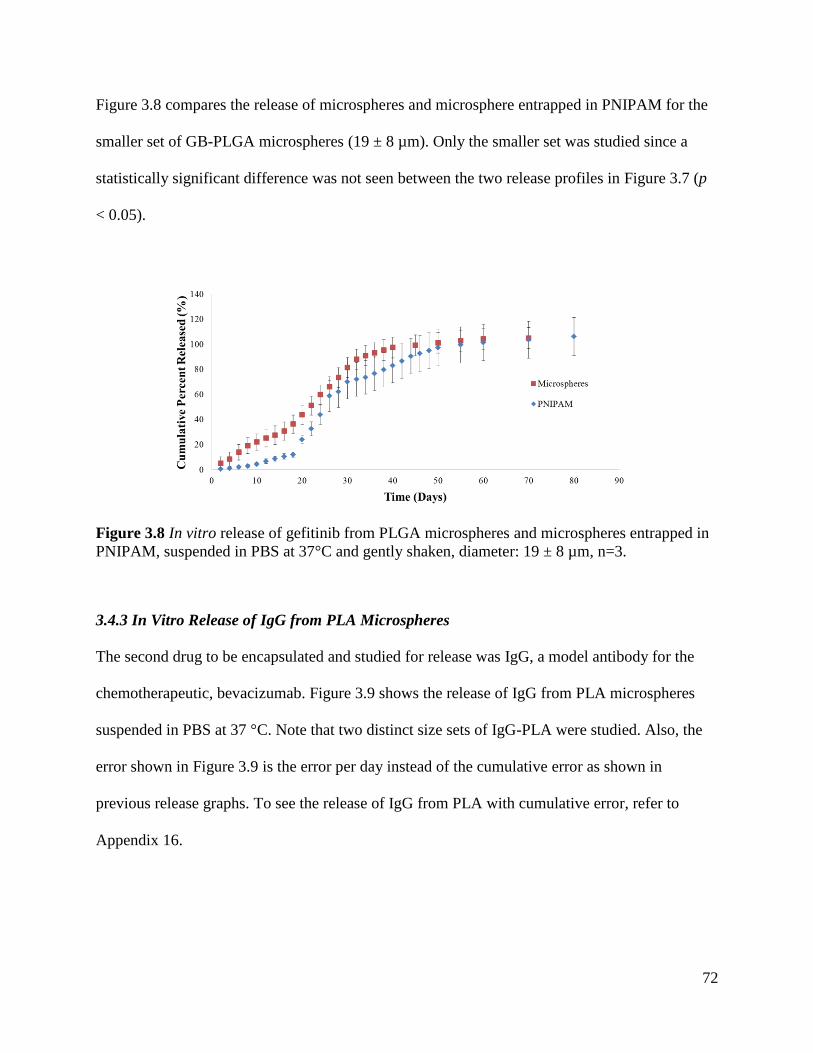
72
Figure 3.8 compares the release of microspheres and microsphere entrapped in PNIPAM for the
smaller set of GB-PLGA microspheres (19 ± 8 µm). Only the smaller set was studied since a
statistically significant difference was not seen between the two release profiles in Figure 3.7 (p
< 0.05).
Figure 3.8 In vitro release of gefitinib from PLGA microspheres and microspheres entrapped in
PNIPAM, suspended in PBS at 37°C and gently shaken, diameter: 19 ± 8 µm, n=3.
3.4.3 In Vitro Release of IgG from PLA Microspheres
The second drug to be encapsulated and studied for release was IgG, a model antibody for the
chemotherapeutic, bevacizumab. Figure 3.9 shows the release of IgG from PLA microspheres
suspended in PBS at 37 °C. Note that two distinct size sets of IgG-PLA were studied. Also, the
error shown in Figure 3.9 is the error per day instead of the cumulative error as shown in
previous release graphs. To see the release of IgG from PLA with cumulative error, refer to
Appendix 16.
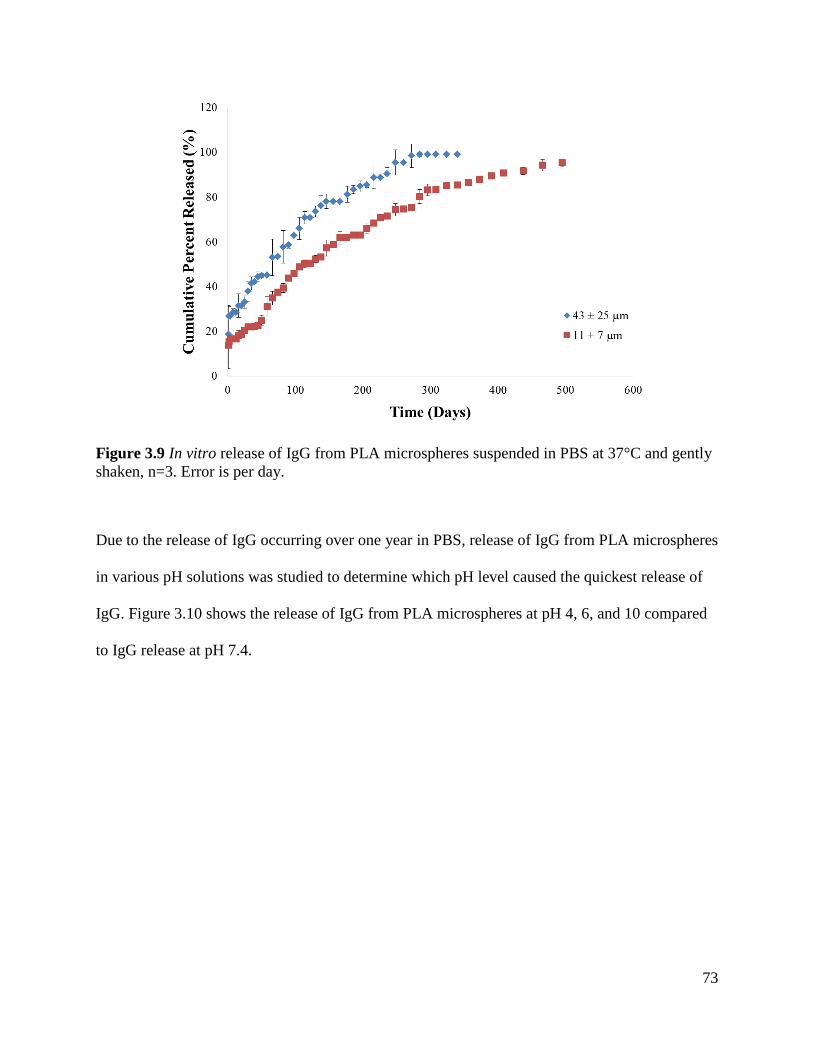
73
Figure 3.9 In vitro release of IgG from PLA microspheres suspended in PBS at 37°C and gently
shaken, n=3. Error is per day.
Due to the release of IgG occurring over one year in PBS, release of IgG from PLA microspheres
in various pH solutions was studied to determine which pH level caused the quickest release of
IgG. Figure 3.10 shows the release of IgG from PLA microspheres at pH 4, 6, and 10 compared
to IgG release at pH 7.4.
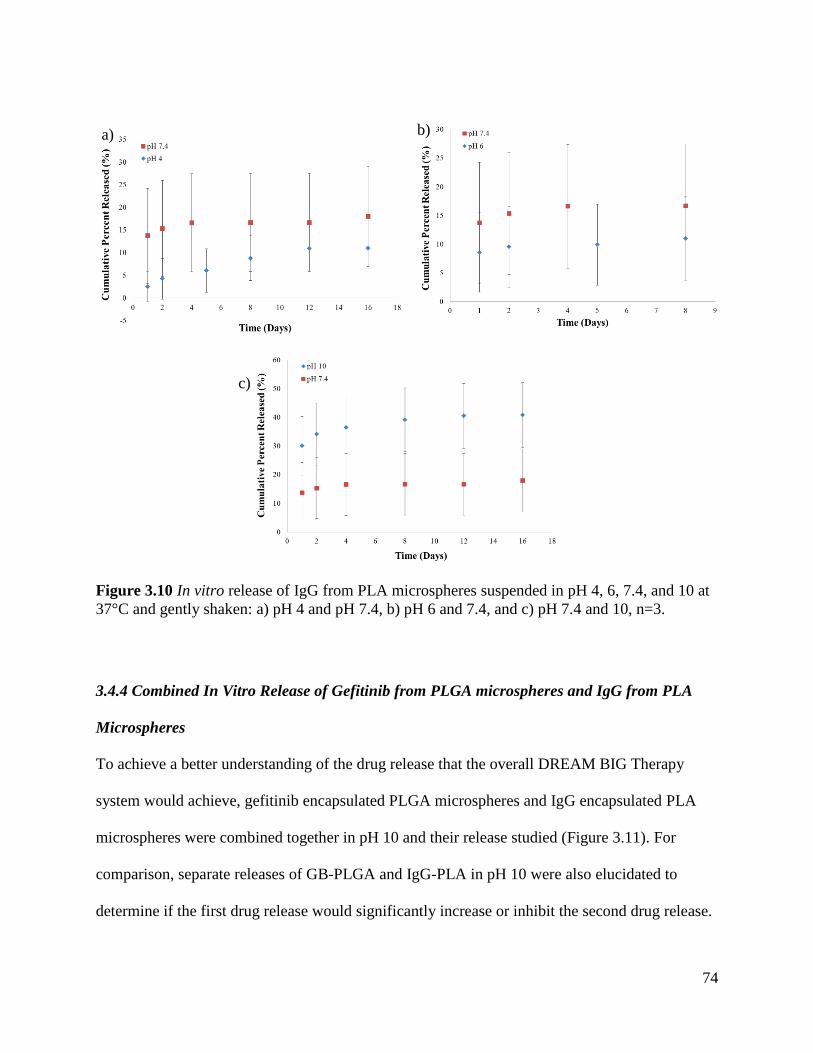
74
c)
Figure 3.10 In vitro release of IgG from PLA microspheres suspended in pH 4, 6, 7.4, and 10 at
37°C and gently shaken: a) pH 4 and pH 7.4, b) pH 6 and 7.4, and c) pH 7.4 and 10, n=3.
3.4.4 Combined In Vitro Release of Gefitinib from PLGA microspheres and IgG from PLA
Microspheres
To achieve a better understanding of the drug release that the overall DREAM BIG Therapy
system would achieve, gefitinib encapsulated PLGA microspheres and IgG encapsulated PLA
microspheres were combined together in pH 10 and their release studied (Figure 3.11). For
comparison, separate releases of GB-PLGA and IgG-PLA in pH 10 were also elucidated to
determine if the first drug release would significantly increase or inhibit the second drug release.
a) b)
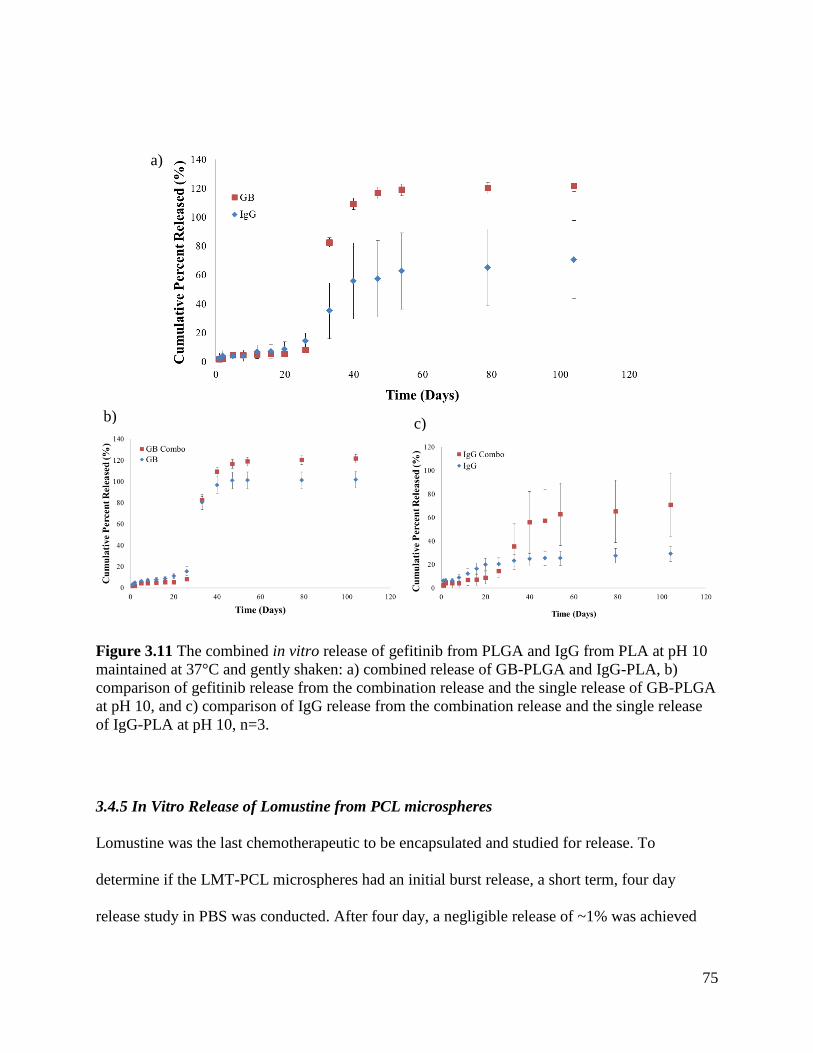
75
a)
Figure 3.11 The combined in vitro release of gefitinib from PLGA and IgG from PLA at pH 10
maintained at 37°C and gently shaken: a) combined release of GB-PLGA and IgG-PLA, b)
comparison of gefitinib release from the combination release and the single release of GB-PLGA
at pH 10, and c) comparison of IgG release from the combination release and the single release
of IgG-PLA at pH 10, n=3.
3.4.5 In Vitro Release of Lomustine from PCL microspheres
Lomustine was the last chemotherapeutic to be encapsulated and studied for release. To
determine if the LMT-PCL microspheres had an initial burst release, a short term, four day
release study in PBS was conducted. After four day, a negligible release of ~1% was achieved
b) c)
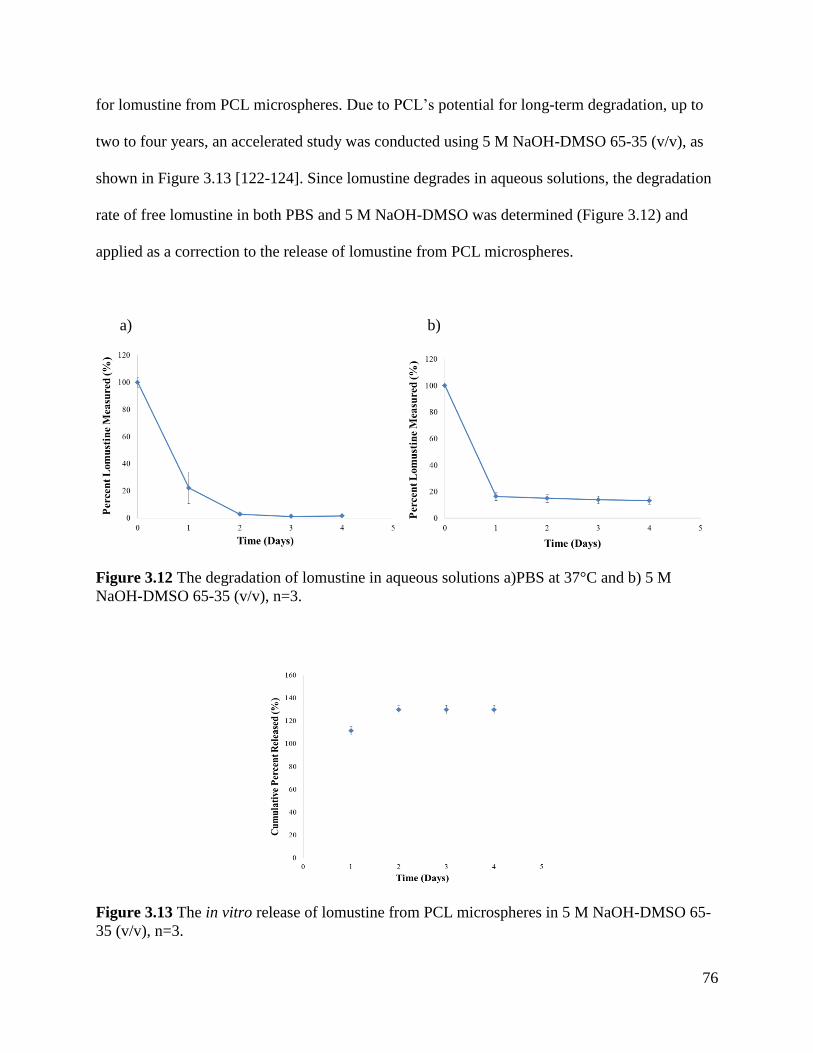
76
for lomustine from PCL microspheres. Due to PCL’s potential for long-term degradation, up to
two to four years, an accelerated study was conducted using 5 M NaOH-DMSO 65-35 (v/v), as
shown in Figure 3.13 [122-124]. Since lomustine degrades in aqueous solutions, the degradation
rate of free lomustine in both PBS and 5 M NaOH-DMSO was determined (Figure 3.12) and
applied as a correction to the release of lomustine from PCL microspheres.
a) b)
Figure 3.12 The degradation of lomustine in aqueous solutions a)PBS at 37°C and b) 5 M
NaOH-DMSO 65-35 (v/v), n=3.
Figure 3.13 The in vitro release of lomustine from PCL microspheres in 5 M NaOH-DMSO 65-
35 (v/v), n=3.
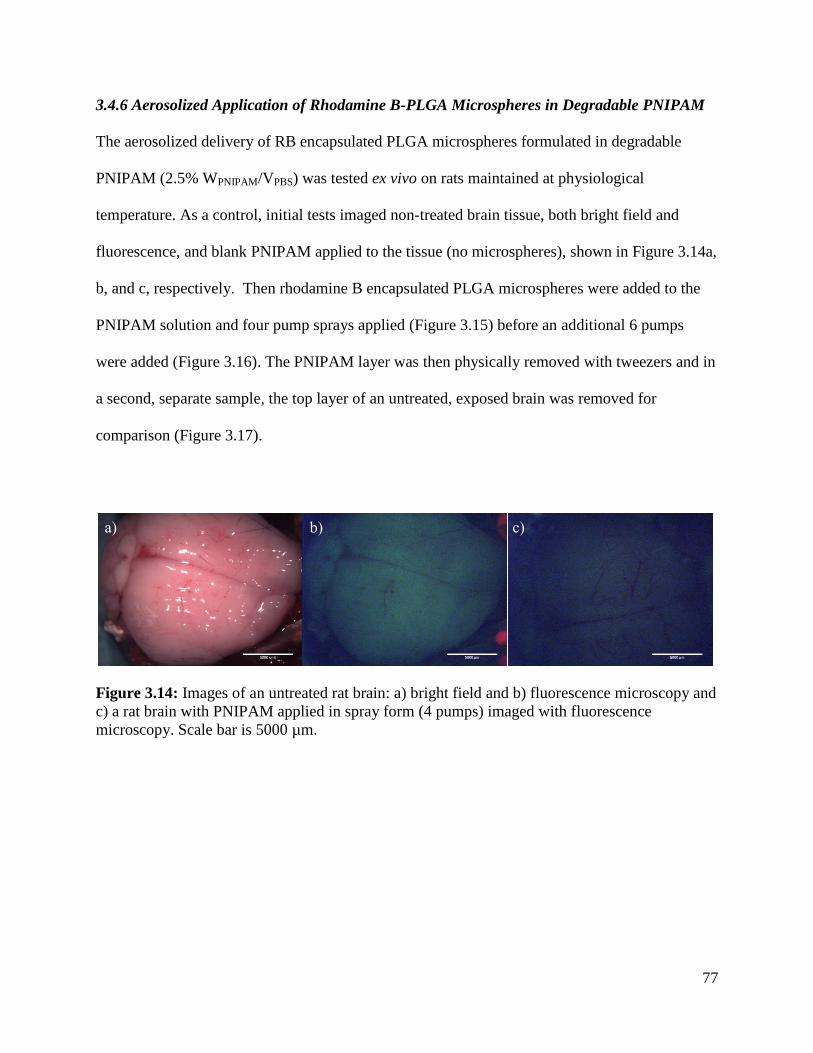
77
3.4.6 Aerosolized Application of Rhodamine B-PLGA Microspheres in Degradable PNIPAM
The aerosolized delivery of RB encapsulated PLGA microspheres formulated in degradable
PNIPAM (2.5% WPNIPAM/VPBS) was tested ex vivo on rats maintained at physiological
temperature. As a control, initial tests imaged non-treated brain tissue, both bright field and
fluorescence, and blank PNIPAM applied to the tissue (no microspheres), shown in Figure 3.14a,
b, and c, respectively. Then rhodamine B encapsulated PLGA microspheres were added to the
PNIPAM solution and four pump sprays applied (Figure 3.15) before an additional 6 pumps
were added (Figure 3.16). The PNIPAM layer was then physically removed with tweezers and in
a second, separate sample, the top layer of an untreated, exposed brain was removed for
comparison (Figure 3.17).
Figure 3.14: Images of an untreated rat brain: a) bright field and b) fluorescence microscopy and
c) a rat brain with PNIPAM applied in spray form (4 pumps) imaged with fluorescence
microscopy. Scale bar is 5000 µm.
a) b) c)
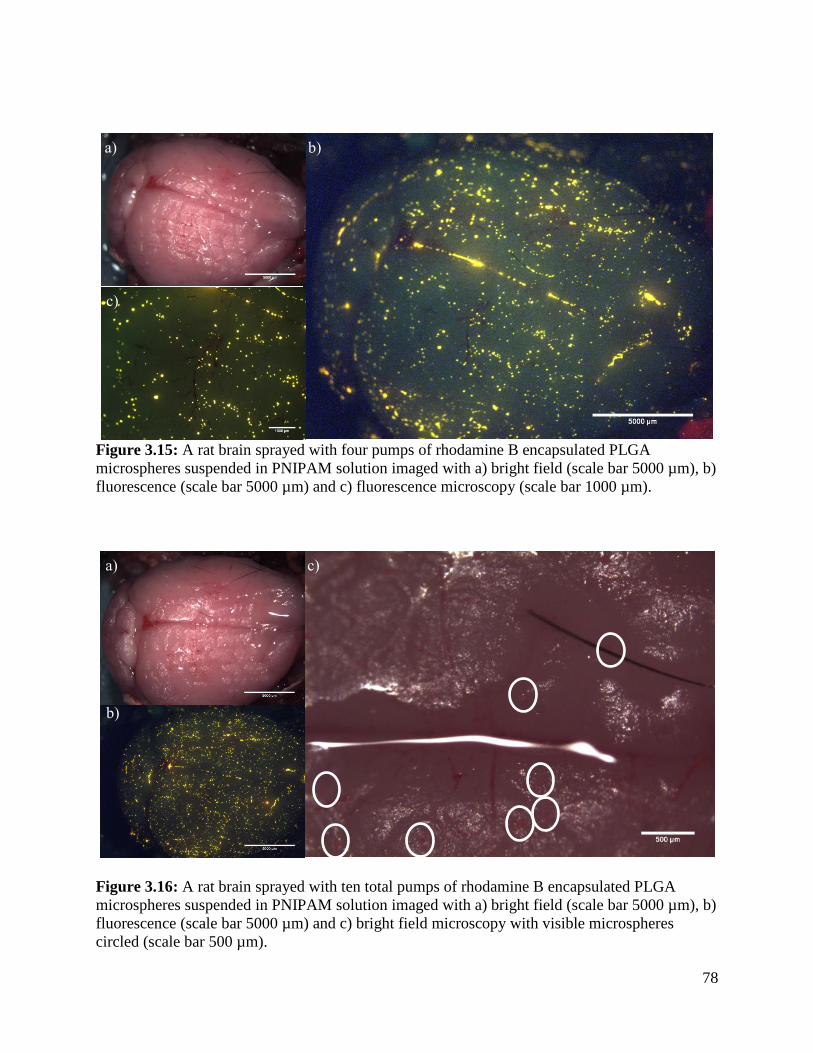
78
Figure 3.15: A rat brain sprayed with four pumps of rhodamine B encapsulated PLGA
microspheres suspended in PNIPAM solution imaged with a) bright field (scale bar 5000 µm), b)
fluorescence (scale bar 5000 µm) and c) fluorescence microscopy (scale bar 1000 µm).
Figure 3.16: A rat brain sprayed with ten total pumps of rhodamine B encapsulated PLGA
microspheres suspended in PNIPAM solution imaged with a) bright field (scale bar 5000 µm), b)
fluorescence (scale bar 5000 µm) and c) bright field microscopy with visible microspheres
circled (scale bar 500 µm).
a) b)
c)
a) c)
b)
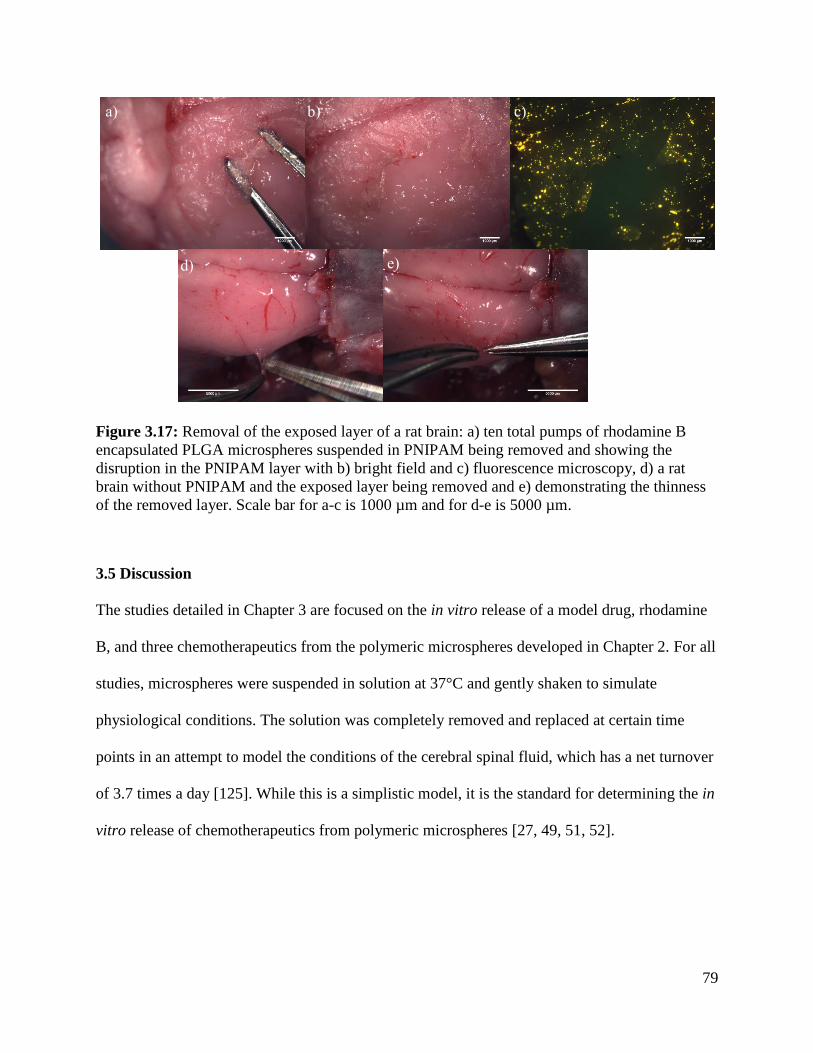
79
Figure 3.17: Removal of the exposed layer of a rat brain: a) ten total pumps of rhodamine B
encapsulated PLGA microspheres suspended in PNIPAM being removed and showing the
disruption in the PNIPAM layer with b) bright field and c) fluorescence microscopy, d) a rat
brain without PNIPAM and the exposed layer being removed and e) demonstrating the thinness
of the removed layer. Scale bar for a-c is 1000 µm and for d-e is 5000 µm.
3.5 Discussion
The studies detailed in Chapter 3 are focused on the in vitro release of a model drug, rhodamine
B, and three chemotherapeutics from the polymeric microspheres developed in Chapter 2. For all
studies, microspheres were suspended in solution at 37°C and gently shaken to simulate
physiological conditions. The solution was completely removed and replaced at certain time
points in an attempt to model the conditions of the cerebral spinal fluid, which has a net turnover
of 3.7 times a day [125]. While this is a simplistic model, it is the standard for determining the in
vitro release of chemotherapeutics from polymeric microspheres [27, 49, 51, 52].
a) b) c)
d) e)
80
Rhodamine B was the first molecule studied for release from PLGA microspheres. Only PLGA
microspheres were studied due to its high rhodamine B encapsulation efficiency when compared
to PLA and PCL (Figure 2.11). In addition, the polymer in use, PLGA 50/50, should have the
shortest release time of approximately one to two months [126]. As can be seen in Figure 3.4, a
20 day release was achieved. This release can be broken down into two distinct regimes, passive
diffusion and polymer degradation. From day 0 through day 6, there is an initial, moderate
continuous release due to the microspheres becoming hydrated and the dye passively diffusing
into PBS. After day 6, there is a significant increase in the release curve slope from the polymer
bulk degrading via hydrolysis and the dye being released before the release curve plateaus off
after day 18. This type of diffusion-degradation release profile has also been described by Zhang
et al. and Yemisci et al. [23, 78].
During the six day diffusion phase, the smaller microspheres released significantly faster due to
their larger surface area to volume ratio (p < 0.05). This demonstrates a method for tuning the
release profile based on particle size. An initial burst release was not present, characteristic of
several other types of polymeric microsphere systems [41, 42, 46, 52-54]. This initial burst is a
concern; if too much drug is released at once, a toxic overdose could result. We hypothesize that
the three wash steps conducted during microsphere formulation removes any of the surface
localized dye (as shown with SEM in Figure 2.10) that would contribute to a burst release.
When the microspheres were entrapped in PNIPAM and then suspended in PBS, a similar
biphasic profile was demonstrated (Figure 3.5). From day zero to day 8, a moderate release
attributed to diffusion occurred before the release increased as the polymer bulk degraded from
81
day 8 to day 22. Again, the smaller microspheres released faster from day zero to day 6 of the
diffusion phase due to their smaller diameters (p < 0.05). When the release through PNIPAM is
compared to the release from free microspheres (Figure 3.6, Appendix 15), the PNIPAM is
shown to delay rhodamine B release by approximately two days. This delay is statistically
significant from day 4 to day 18 (p < 0.05). While this means that PNIPAM does present a
barrier to the release of the dye from the microspheres, the main control for release tunability
will be from the microsphere design.
Gefitinib was the first chemotherapeutic whose release rate was studied. As can be seen in Figure
3.7, the overall release time was roughly doubled for gefitinib when compared to rhodamine B.
Yet, the biphasic release profile is still apparent. For the first 18 days, there was a slow, moderate
release attributed to passive diffusion without an initial burst release. After day 18 through day
40, there was a sharp increase in the release of gefitinib as the PLGA bulk degraded before the
release plateaued off through day 70. Since the particle size distributions of the two GB-PLGA
sets were similar, a significant difference between the releases was not seen (p < 0.05).
There are several possible reasons why the gefitinib release was doubled when compared to the
rhodamine B release. First, the PLGA microspheres that encapsulated gefitinib were made by the
single emulsion methodology while the rhodamine B encapsulated PLGA microspheres were
formulated using the double emulsion. The single emulsion microspheres could be denser and
less porous internally due to the absence of an inner water phase that would create pockets in the
oil of a double emulsion. This denser polymer microsphere would then slow the water
penetration that would release the drug. To gain insight into the internal structure of the
82
microspheres, confocal microscopy or sectioning the microspheres and light microscopy could
be used. Secondly and perhaps more importantly, gefitinib is more hydrophobic than rhodamine
B, from < 1 mg/mL solubility for gefitinib in water to 50 mg/mL for rhodamine B [109, 127].
Therefore, based on solubility alone, rhodamine B should release sooner in PBS than gefitinib,
all other factors remaining the same.
When gefitinib encapsulated PLGA microspheres were entrapped in PNIPAM (GB-PLGA-
PNIPAM), a delayed release of approximately 6-8 days was demonstrated through day 24
(Figure 3.8). This longer delay in release of gefitinib when compared to rhodamine B’s
approximate two days is most likely from the hydrophobicity of gefitinib. The delay was
statistically significant from day 10-24, the second half of the diffusion phase and the first few
days of the degradation phase (p < 0.05). We hypothesize this comes from the gefitinib
remaining in the microsphere and PNIPAM as long as possible before the microsphere
significantly degraded and gefitinib was released into the aqueous solution. After day 24 of the
degradation phase, there is no longer a statistical difference in the release from the free
microspheres and microspheres entrapped in PNIPAM, supporting the idea that PNIPAM does
not provide a significant barrier to drug release by itself.
PNIPAM was also tested as a carrier for free gefitinib. At time zero, right after PNIPAM
gelation, a full release of gefitinib was detected. This indicates that gefitinib was not entrapped in
PNIPAM but rather exuded out with the PBS as PNIPAM phase transitioned. This means that
microspheres will be necessary to achieve a sustained release of gefitinib.
83
The second molecule that was studied for release was the model antibody, IgG. Two distinct
particle sizes were studied: 11 ± 7 µm (Set A) and 43 ± 25 µm (Set B) in diameter. Both
microsphere sizes were formulated at 7.5 mg initial IgG loading with an external aqueous phase
concentration of 33% IgG (w/v). However, for Set A, the encapsulation efficiency and drug
loading was high at 88 ± 12% and 0.32 ± 0.05%, respectively. Set B, on the other hand, had a
low encapsulation efficiency of 34 ± 11% and drug loading of 0.13 ± 0.03%. As discussed in
Chapter 2, this was attributed to the different particle sizes and the competing factors of the drug
diffusion out of the sphere versus the rate of drug entrapment from sphere hardening. As shown
in Figure 3.9, the release of IgG from PLA microspheres was dependent on the microsphere
formulation. Set A had an initial burst release of 13 ± 11% followed by a near linear release over
495 days or over 16 months. Set A is still releasing to this date. Set B also had an initial burst
release of 19 ± 13%. Then, a near linear release was achieved over the full release of 284 days or
over nine months.
It is hypothesized that the burst releases are due to IgG located on or near the surface of the PLA
microspheres. For Set A, the SEM micrograph in Figure 2.18b shows bumps on the surface while
Figure 2.18c for Set B has material present at the surface. Following the hypothesis of the
precipitation kinetics described in Chapter 2, the bumps in Set A could be attributed to pockets
of IgG that were diffusing towards the external aqueous phase and entrapped as the sphere
hardened. These bumps are not present on the larger microspheres in Set B because of the longer
time for sphere hardening, allowing the IgG to fully diffuse. Instead, the material that is seen via
SEM could be residual IgG from the external aqueous phase that was not fully washed off during
microsphere formulation. Taking this under consideration, Set B, with more IgG readily
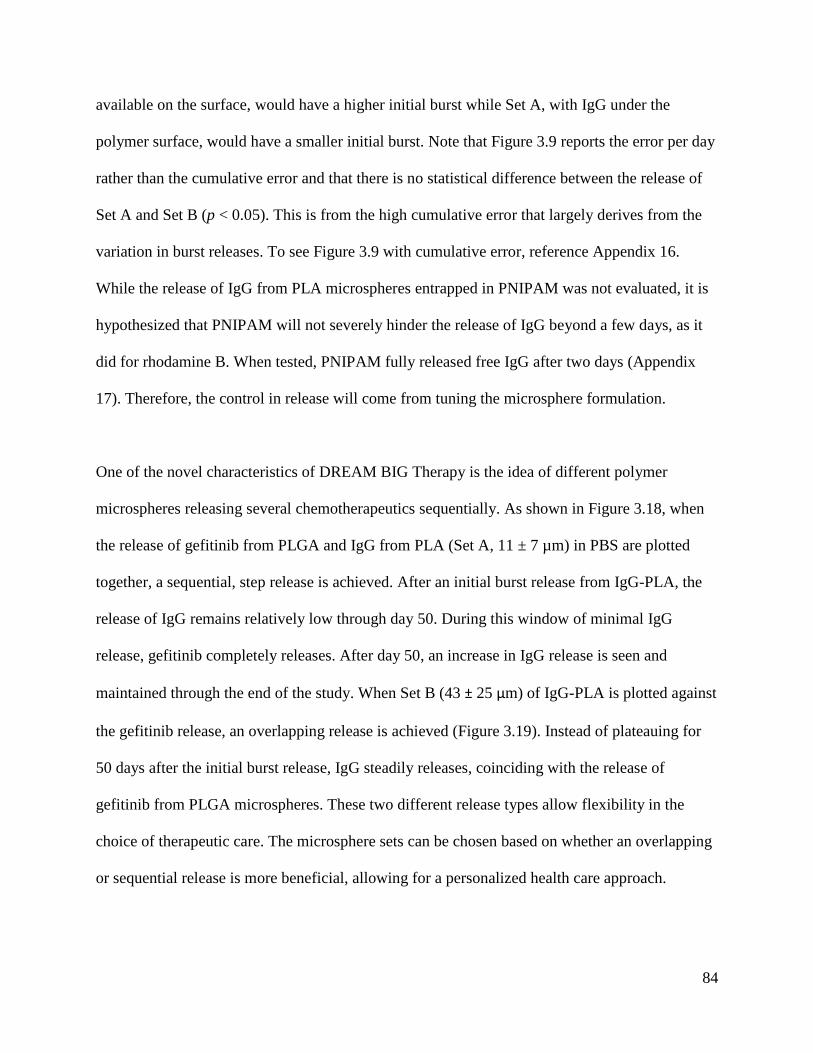
84
available on the surface, would have a higher initial burst while Set A, with IgG under the
polymer surface, would have a smaller initial burst. Note that Figure 3.9 reports the error per day
rather than the cumulative error and that there is no statistical difference between the release of
Set A and Set B (p < 0.05). This is from the high cumulative error that largely derives from the
variation in burst releases. To see Figure 3.9 with cumulative error, reference Appendix 16.
While the release of IgG from PLA microspheres entrapped in PNIPAM was not evaluated, it is
hypothesized that PNIPAM will not severely hinder the release of IgG beyond a few days, as it
did for rhodamine B. When tested, PNIPAM fully released free IgG after two days (Appendix
17). Therefore, the control in release will come from tuning the microsphere formulation.
One of the novel characteristics of DREAM BIG Therapy is the idea of different polymer
microspheres releasing several chemotherapeutics sequentially. As shown in Figure 3.18, when
the release of gefitinib from PLGA and IgG from PLA (Set A, 11 ± 7 µm) in PBS are plotted
together, a sequential, step release is achieved. After an initial burst release from IgG-PLA, the
release of IgG remains relatively low through day 50. During this window of minimal IgG
release, gefitinib completely releases. After day 50, an increase in IgG release is seen and
maintained through the end of the study. When Set B (43 ± 25 µm) of IgG-PLA is plotted against
the gefitinib release, an overlapping release is achieved (Figure 3.19). Instead of plateauing for
50 days after the initial burst release, IgG steadily releases, coinciding with the release of
gefitinib from PLGA microspheres. These two different release types allow flexibility in the
choice of therapeutic care. The microsphere sets can be chosen based on whether an overlapping
or sequential release is more beneficial, allowing for a personalized health care approach.
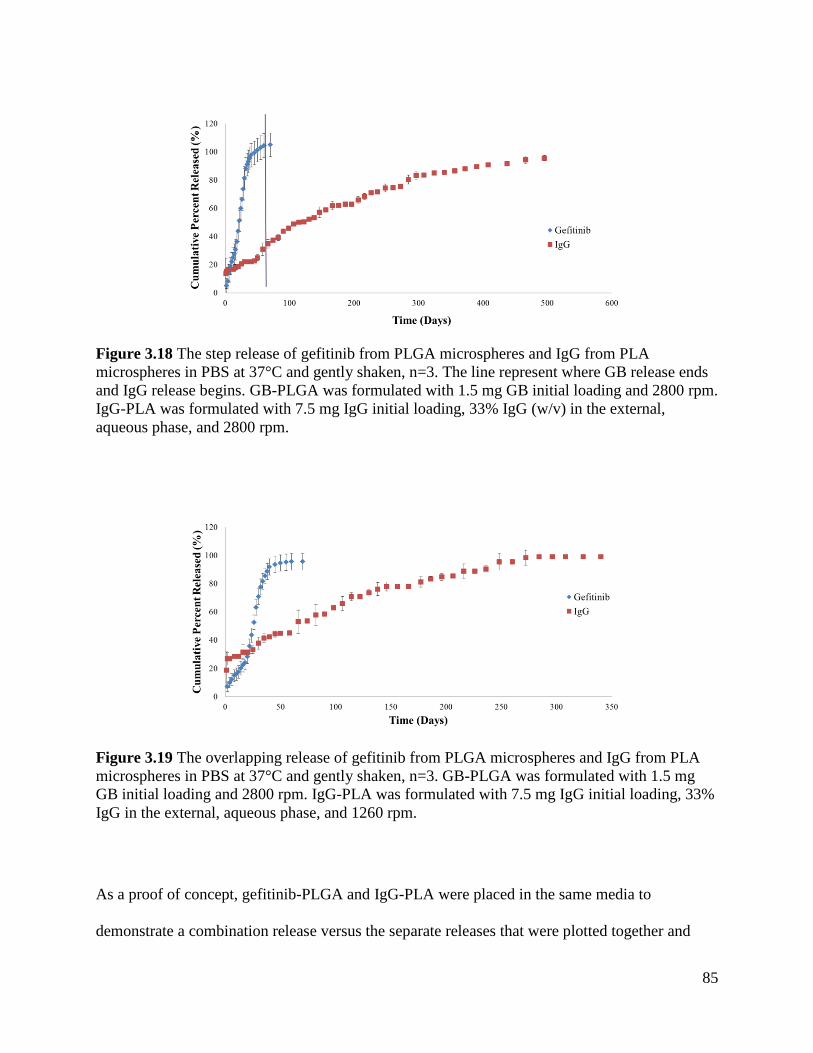
85
Figure 3.18 The step release of gefitinib from PLGA microspheres and IgG from PLA
microspheres in PBS at 37°C and gently shaken, n=3. The line represent where GB release ends
and IgG release begins. GB-PLGA was formulated with 1.5 mg GB initial loading and 2800 rpm.
IgG-PLA was formulated with 7.5 mg IgG initial loading, 33% IgG (w/v) in the external,
aqueous phase, and 2800 rpm.
Figure 3.19 The overlapping release of gefitinib from PLGA microspheres and IgG from PLA
microspheres in PBS at 37°C and gently shaken, n=3. GB-PLGA was formulated with 1.5 mg
GB initial loading and 2800 rpm. IgG-PLA was formulated with 7.5 mg IgG initial loading, 33%
IgG in the external, aqueous phase, and 1260 rpm.
As a proof of concept, gefitinib-PLGA and IgG-PLA were placed in the same media to
demonstrate a combination release versus the separate releases that were plotted together and
86
previously described. However, since the release of IgG-PLA was over one year in PBS, an
accelerated media was used to shorten the time span of the study. Figure 3.10 shows several
different buffers at both acidic and basic pHs that were tested, with the most basic buffer at pH
10 increasing the release rate of IgG from PLA the most. This supports what has been reported in
the literature, that pH extremes such as pH 10 and 2 increase the degradation rate of PLA [128-
130]. Using these results, GB-PLGA and IgG-PLA were combined in pH 10 buffer solution and
their release determined.
As can be seen in Figure 3.11a, gefitinib is fully released in forty days with the bulk of the
release occurring between day 26 and day 40. While GB’s release in pH 10 is similar to its
release in PBS, there are two things to note during this time period. First, GB released to
approximately 120%. Secondly, IgG is shown to also be releasing in this time, which is not
similar to the release of IgG in PBS. It is hypothesized that the method of detection, UV-vis
spectroscopy, is the cause of these two trends. When the combined release is measured, it is
possible that the spectrum of gefitinib could interfere and contribute to the IgG spectrum and
vice versa. In an attempt to properly baseline the measurements, the release of GB and IgG were
measured separately at pH 10 and the contribution of GB to the measurement peak of IgG was
removed and vice versa. However, as Figure 3.11a shows, this did not fully correct the baseline.
Figure 3.11c shows the release of IgG in pH 10 from the combined release compared to the
singular release of IgG in pH 10. It is noted that the combined release has a higher value when
compared to the single release, possibly an effect of GB’s spectrum. This is further supported
when IgG’s release slows down after day 40, coinciding with GB no longer releasing. While GB
appears to significantly affect the quantification of IgG release, the reverse is not true. As Figure
87
3.11b shows, the combined and single release of GB from PLGA are approximately the same,
with no significant difference between the releases (p < 0.05). A better study design would be to
repeat this experiment and use a method of detection that could separate the molecules, such as
high performance liquid chromatography (HPLC), and then quantify with a UV-vis or mass
spectrometer [131].
Interestingly, in this experiment at pH 10, a burst release was not noted for IgG either in
combination with GB or singularly. This is contradictory to the preliminary study of IgG release
from PLA at pH 10 shown in Figure 3.10. It is hypothesized that this reduction in release is due
to the addition of 1 M HCl before the pH 10 solution is removed for measurement. The 1 M HCl
was added to increase the solubility of GB, but it appears to have an adverse effect on IgG
release. After addition of the 1 M HCl, the pH was approximately 1.1. This is lower than the 3.86
pKa of lactic acid and the isoelectric point for sheep IgG (5-7.2) [132, 133]. In addition, it was
reported that fragments of IgG are unstable at a pH less than 5.1 [134]. All of these factors could
play a role in why IgG was not measured. Future experiments should use HPLC to avoid this
issue.
The last chemotherapeutic-microsphere combination to be studied in vitro was lomustine
encapsulated in PCL microspheres. Unlike GB-PLGA and IgG-PLA, the release of lomustine
from PCL in PBS was not studied long term. This is due to PCL’s slow degradation rate,
estimated at two to four years depending on the starting molecular weight [122-124]. Therefore,
a method capable of accelerating the release of lomustine from PCL was investigated. These
options included enzymatic, thermal, and base-promoted hydrolytic degradation [123, 124].
88
Hydrolytic degradation using 5 M NaOH was chosen due to the simplicity of implementation. In
addition, the high temperatures of thermal degradation could deform the polymeric microspheres
and enzymes would degrade antibodies such as IgG if a comparison study was conducted,
removing these methods from consideration.
Figure 3.13 shows that after two days, a full release of lomustine from PCL microspheres was
achieved in 5 M NaOH-DMSO 65-35 (v/v). This is a rough model of release because lomustine
degrades in aqueous solutions and has a half-life of 71 minutes in 50 mM PBS [135]. To correct
for this degradation, the rate of free lomustine degradation in 5 M NaOH-DMSO was also
determined and applied to the release (Figure 3.12b). It is expected that this will produce an
overestimate of lomustine degradation when applied to release from microspheres because the
entirety of the lomustine is subject to degradation when it is “free” in solution. However, the
PCL microspheres could provide a limited protection before becoming completely degraded.
This is demonstrated in Figure 3.13, where the release of lomustine from PCL microspheres
finished at 130%.
As a control, the release of lomustine from PCL microspheres in PBS was determined over four
days. This release followed a similar protocol, with the degradation of free lomustine in PBS
determined and used as a correction for lomustine release from the PCL microspheres (Figure
3.12). A negligible release was achieved, approximately 1% over four days.
The aerosolized delivery of PNIPAM to tissue at physiological temperature ex vivo was also
tested in this chapter. Initial images were taken of an untreated brain and blank PNIPAM sprayed
89
on the brain to show their limited background contribution (Figure 3.14). The aqueous solution
of degradable PNIPAM suspending rhodamine B encapsulated PLGA microspheres was then
successfully aerosolized and applied to tissue at physiological temperature. As can be seen in
Figure 3.15 and Figure 3.16, the PNIPAM entrapped the microspheres on the surface of the brain
and provided a relatively homogenous distribution of the microspheres on the surface. This
system conformed to the convoluted surface morphology of the brain, demonstrated by the
microspheres that line the junction or fissure between the two cerebral hemispheres. The
entrapped rhodamine B encapsulated microspheres were detected without fluorescence when
magnified (Figure 3.16c). Additionally, the application of PNIPAM changed the appearance of
the exposed brain, from a shiny, mucosal dura in Figure 3.14a to a matte surface appearance
shown in Figure 3.16a. Interestingly, the PNIPAM formed a stiff, adherent layer on the surface
of the brain, that when removed with tweezers, also removed the top layer of the exposed brain
including blood vessels (Figure 3.17). Comparatively, the removal of the top layer of the
untreated, exposed brain was difficult and shredded easily. The PNIPAM layer was easily
removed when bathed in water slightly below room temperature. This easy removal was
expected based on the results of PNIPAM used as an adhesive glue for retinal implants; the
PNIPAM adhesion was reversible by lowering the temperature [115].
3.6 Conclusions
The first part of this work focused on determining the release profile of rhodamine B, gefitinib,
IgG, and lomustine from microspheres in vitro. We determined that the overall release from
PLGA microspheres can be tuned from 20 days to 40 days by using either a hydrophilic
(rhodamine B) or hydrophobic (gefitinib) compound, respectively. In addition, the release from
90
PLGA is characterized by a biphasic profile: passive diffusion and then polymer degradation.
Particle size was found to effect release rate with smaller microspheres releasing faster due to
their larger surface area to volume ratio. When microspheres were entrapped in PNIPAM, it was
discovered that the release was only delayed by two to eight days depending on drug properties.
Thus, while PNIPAM will delay release to some extent, the microspheres are the main controls
for tuning the release profile.
The release of IgG from PLA microspheres exhibited an initial burst release followed by a near
linear release until full release was achieved. The burst release and length of release was
dependent on microsphere formulation, with the distribution and amount of IgG playing a pivotal
role. For larger, lower loaded IgG-PLA microspheres, release can extend as long as 284 days.
However, for smaller, higher loaded IgG-PLA microspheres, release can be extended longer than
495 days.
When the release of gefitinib from PLGA and IgG from PLA were plotted together, either a
sequential step release or overlapping release could be achieved. This demonstrates the potential
of flexibility in the choice of therapeutic care. Therapeutic microsphere sets can be chosen based
on whether an overlapping or sequential release is more beneficial, allowing for a personalized
health care approach.
A proof of concept was attempted, where gefitinib-PLGA and IgG-PLA were released together
in pH 10 buffered solution. While initial results are promising, a limitation in the detection
91
method was determined and further experimentation will need to use a more precise method,
such as HPLC.
The third chemotherapeutic, lomustine, was shown capable of release from PCL in accelerated
media, with a full release in two days. In contrast, lomustine release in PBS was negligible over
the same time period.
Finally, we found that aqueous, degradable PNIPAM was capable of suspending polymeric
microspheres that can be applied in aerosol form to the surface of a brain at physiological
temperature. This delivery system displayed the liquid-gel transition due to temperature, forming
an adherent layer with entrapped microspheres and conforming to the complex surface
morphology of the brain.
92
4 In Vivo Evaluation of Gefitinib Encapsulated PLGA
Microspheres Entrapped in PNIPAM
4.1 Background
4.1.1 Motivation
Chapters 2 and 3 focused on formulating and characterizing drug encapsulated polymeric
microspheres for glioma therapy. While the microspheres were characterized in vitro, their
efficacy in vivo has not been tested. This chapter will focus on a subcutaneous tumor model that
was used to test the gefitinib encapsulated PLGA microspheres in vivo. In addition, a selected
review of the literature covering in vivo results for drug encapsulated microspheres for glioma
therapy will be given.
4.1.2 Drug Encapsulated Polymeric Microspheres for Intracranial Tumor Therapy: In Vivo
Results
Paclitaxel, 5-FU, carboplatin, BCNU, camptothecin, and vincristine are some examples of
chemotherapeutics that have been encapsulated in polymer microspheres for intracranial tumor
therapy and tested in vivo [25, 26, 32-35, 38, 55, 57, 61, 72, 136]. Studies include both the
simplistic subcutaneous tumor model to intracranial tumor models in mice and rats that have
progressed to Phase II clinical trials.
An example of a subcutaneous glioma study was reported by Naraharisetti et al. using paclitaxel
encapsulated PLGA microspheres [55]. These drug loaded microspheres, formulated either by
spray drying or electrohydrodynamic atomization (EHDA), were implanted along the tumor sites
of BALB/c nude mice bearing C6 glioma cells subcutaneously. The two different formulation
93
techniques produced microspheres with unique release kinetics. Microspheres produced by spray
drying had a sustained, first-order release over 60 days while the EHDA technique had a pseudo-
zero order release for 28 days after an initial burst for the first two days. The spray dried
microspheres arrested tumor growth for more than 45 days when applied 6 days after tumor cell
inoculation. However, when applied at day 9, the tumor did not respond to treatment due to the
large tumor size; the tumor was too large for the drug dosage. The EHDA generated
microparticles were applied 14 days after tumor cell inoculation (larger tumor volume) and
arrested tumor growth for 10 days after the first injection. However, tumor growth rate increased
even after a repeated injection two weeks later of the paclitaxel loaded PLGA microparticles.
Overall, during 21 days of treatment, tumor growth was inhibited by 59% and 65% for the spray
dried and EHDA microparticles, respectively, in comparison to the blank placebo. However,
over longer time points, the spray-dried, slower releasing microspheres were the most effective.
In a similar subcutaneous tumor study, Ranganath et al. demonstrated the efficacy of paclitaxel
encapsulated PLGA microspheres in alginate beads. After 21 days of treatment, tumor volumes
were reduced by 85% and 78% for paclitaxel-PLGA when compared to a blank control and the
free drug form of paclitaxel, respectively [24]. As opposed to Naraharisetti et al., Ranganath et
al. implanted the drug loaded beads into the tumor itself instead of peripherally at the tumor site.
The small molecule imatinib mesylate was encapsulated by Benny et al. in PLGA microspheres
and tested in vivo, both subcutaneously and intracranially [45]. Swiss nude and C57/BL mice
were subcutaneously inoculated with human U87-MG and GL261 glioblastoma cells,
respectively. Tumor volume was suppressed by 79% after 30 days and 88% after 22 days for the
GL261 and U87-MG cell line, respectively. The U87-MG cell line was then tested intracranially
94
in Swiss nude mice. The imatinib mesylate encapsulated PLGA microspheres significantly
reduced tumor growth by 79% when compared to blank microspheres 14 days after intratumoral
injection.
Camptothecin was also tested intracranially using PLGA microspheres [47, 57, 61]. Ozeki et al.
injected camptothecin encapsulated PLGA microspheres suspended in a TGP directly on the
brain of Sprague-Dawley rats against C6 glioma cells [47]. At physiological temperature, the
TGP underwent a phase transition from a liquid to a gel, holding the microspheres at the tumor
site. Localized treatment with camptothecin-PLGA in the TGP increased survival significantly,
with one third of the rats surviving more than 60 days compared to a 16 day mean survival for
animals with no treatment. The same dosage of free camptothecin dispersed in TGP had a
median survival of only 21 days. A follow up study was conducted with the drug delivery system
injected after tumor resection [61]. Tumor resection without additional treatments had a median
survival of 18.5 days while resection plus camptothecin-PLGA in the TGP had a 24 and 26 day
median survival for a 10 and 30 µg camptothecin dose, respectively. The camptothecin-PLGA in
the TGP was also applied without tumor resection, resulting in the same median survival.
However, only groups with both tumor resection and the drug delivery system demonstrated
long-term survivors.
The radiosensitizer 5-fluorouracil has been extensively used for in vivo studies, progressing to
the point of a Phase II clinical trial [26, 32-36, 72, 136]. In one study, 5-FU encapsulated PMM
2.1.2 microspheres were tested by Fournier et al. against the F98 tumor cell line inoculated
intracranially in Fisher rats [35]. The 5-FU microspheres increased the median survival to 34.1 ±
95
5.6 days compared to the no treatment control at 22.7 ± 3.3 days and a 5-FU solution applied
stereotactically at 26.5 ± 2.4 days.
The most common system for 5-FU encapsulated microspheres applied to gliomas consists of
stereotactically injected, 5-FU loaded PLGA microspheres as shown in Figure 4.1 [26, 32-34, 36,
72, 136]. Lemaire et al. demonstrated that the stereotactic administration of the 5-FU loaded
PLGA microspheres slowed tumor development by a factor of three when compared to a bolus
5-FU solution injected intratumorally for Sprague-Dawley rats bearing C6 glioma cells
intracranially [26]. Overall, both protocols increased survival time by ~50% over the controls.
However, overall survival was not significantly different between the two therapies, with a 30 ±
1 day and 32 ± 2 days survival for the bolus and microsphere injection, respectively. An
interesting result of this experiment is that tumor proliferation was significantly reduced in the
vicinity of the stereotactic injection site before regrowth. This led to a multi-site injection
protocol, further elucidated in a study using the same system with [3H]5-FU to monitor diffusion
in Sprague-Dawley rats [36]. In the tumor bearing rats, the drug encapsulated microspheres were
found to diffuse ~ 1.5 mm distance from the injection site and to release 5-FU at a maximum of 3
mm. Multiple injections covering the whole area of the tumor would be needed for the best
chance of tumor eradication.
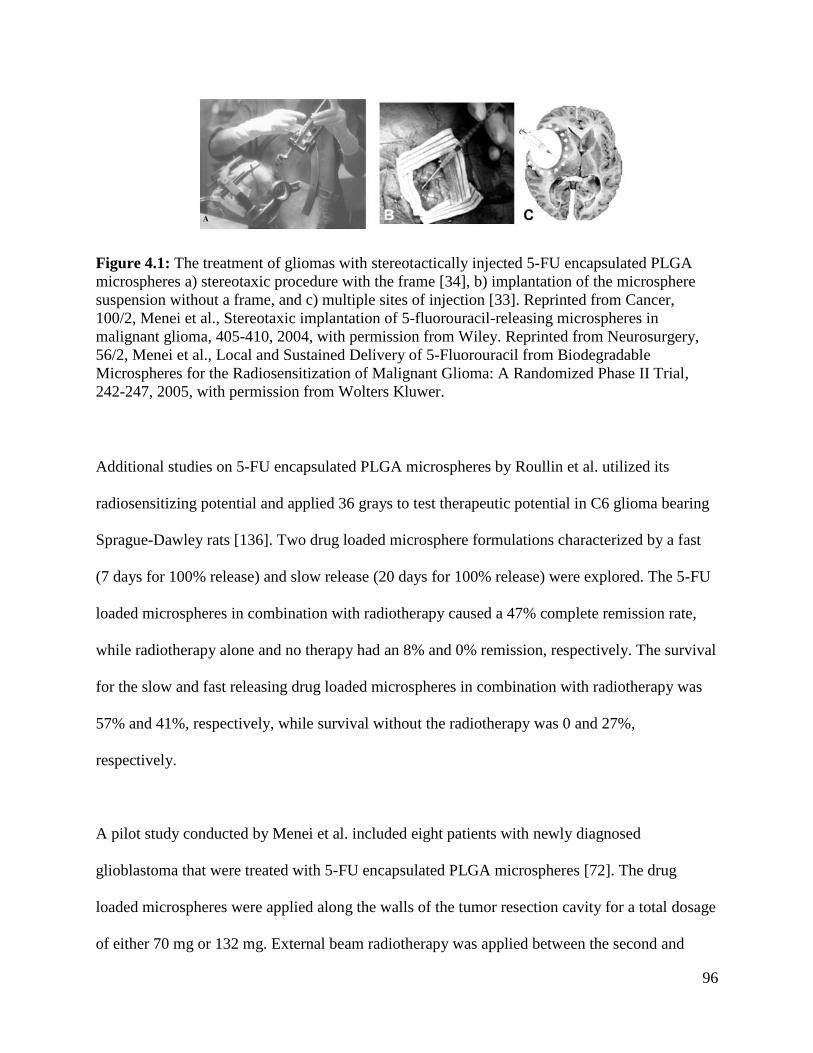
96
Figure 4.1: The treatment of gliomas with stereotactically injected 5-FU encapsulated PLGA
microspheres a) stereotaxic procedure with the frame [34], b) implantation of the microsphere
suspension without a frame, and c) multiple sites of injection [33]. Reprinted from Cancer,
100/2, Menei et al., Stereotaxic implantation of 5-fluorouracil-releasing microspheres in
malignant glioma, 405-410, 2004, with permission from Wiley. Reprinted from Neurosurgery,
56/2, Menei et al., Local and Sustained Delivery of 5-Fluorouracil from Biodegradable
Microspheres for the Radiosensitization of Malignant Glioma: A Randomized Phase II Trial,
242-247, 2005, with permission from Wolters Kluwer.
Additional studies on 5-FU encapsulated PLGA microspheres by Roullin et al. utilized its
radiosensitizing potential and applied 36 grays to test therapeutic potential in C6 glioma bearing
Sprague-Dawley rats [136]. Two drug loaded microsphere formulations characterized by a fast
(7 days for 100% release) and slow release (20 days for 100% release) were explored. The 5-FU
loaded microspheres in combination with radiotherapy caused a 47% complete remission rate,
while radiotherapy alone and no therapy had an 8% and 0% remission, respectively. The survival
for the slow and fast releasing drug loaded microspheres in combination with radiotherapy was
57% and 41%, respectively, while survival without the radiotherapy was 0 and 27%,
respectively.
A pilot study conducted by Menei et al. included eight patients with newly diagnosed
glioblastoma that were treated with 5-FU encapsulated PLGA microspheres [72]. The drug
loaded microspheres were applied along the walls of the tumor resection cavity for a total dosage
of either 70 mg or 132 mg. External beam radiotherapy was applied between the second and
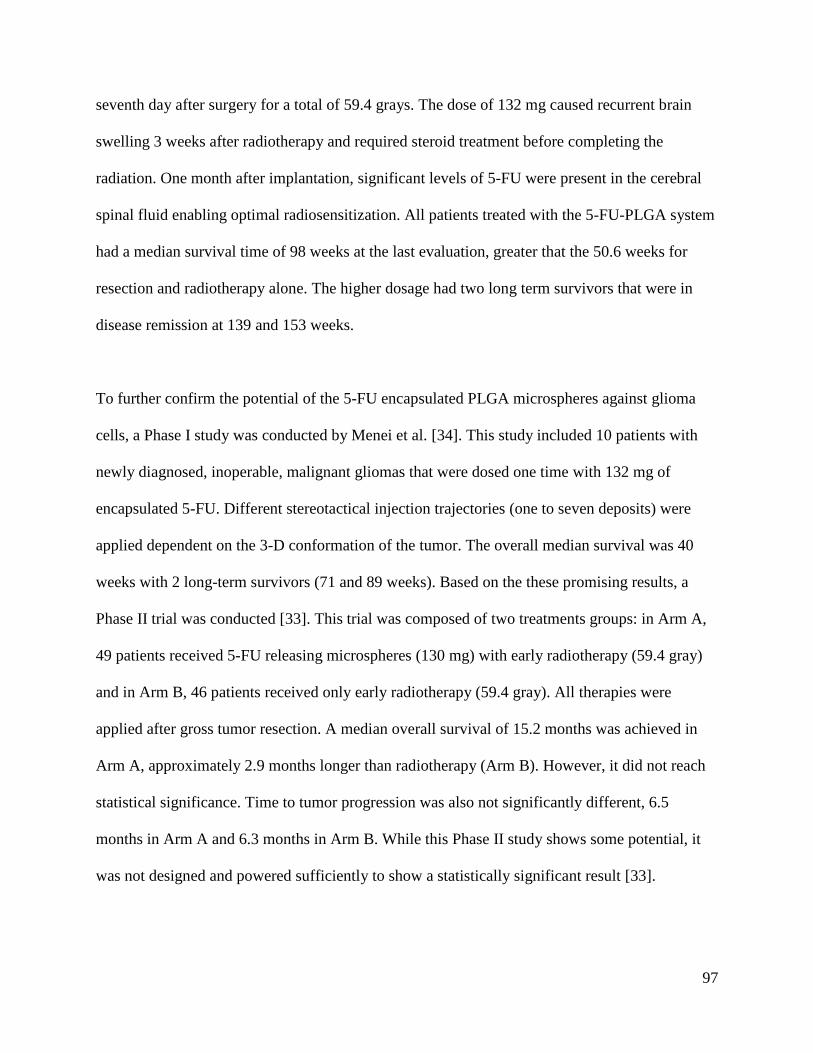
97
seventh day after surgery for a total of 59.4 grays. The dose of 132 mg caused recurrent brain
swelling 3 weeks after radiotherapy and required steroid treatment before completing the
radiation. One month after implantation, significant levels of 5-FU were present in the cerebral
spinal fluid enabling optimal radiosensitization. All patients treated with the 5-FU-PLGA system
had a median survival time of 98 weeks at the last evaluation, greater that the 50.6 weeks for
resection and radiotherapy alone. The higher dosage had two long term survivors that were in
disease remission at 139 and 153 weeks.
To further confirm the potential of the 5-FU encapsulated PLGA microspheres against glioma
cells, a Phase I study was conducted by Menei et al. [34]. This study included 10 patients with
newly diagnosed, inoperable, malignant gliomas that were dosed one time with 132 mg of
encapsulated 5-FU. Different stereotactical injection trajectories (one to seven deposits) were
applied dependent on the 3-D conformation of the tumor. The overall median survival was 40
weeks with 2 long-term survivors (71 and 89 weeks). Based on the these promising results, a
Phase II trial was conducted [33]. This trial was composed of two treatments groups: in Arm A,
49 patients received 5-FU releasing microspheres (130 mg) with early radiotherapy (59.4 gray)
and in Arm B, 46 patients received only early radiotherapy (59.4 gray). All therapies were
applied after gross tumor resection. A median overall survival of 15.2 months was achieved in
Arm A, approximately 2.9 months longer than radiotherapy (Arm B). However, it did not reach
statistical significance. Time to tumor progression was also not significantly different, 6.5
months in Arm A and 6.3 months in Arm B. While this Phase II study shows some potential, it
was not designed and powered sufficiently to show a statistically significant result [33].
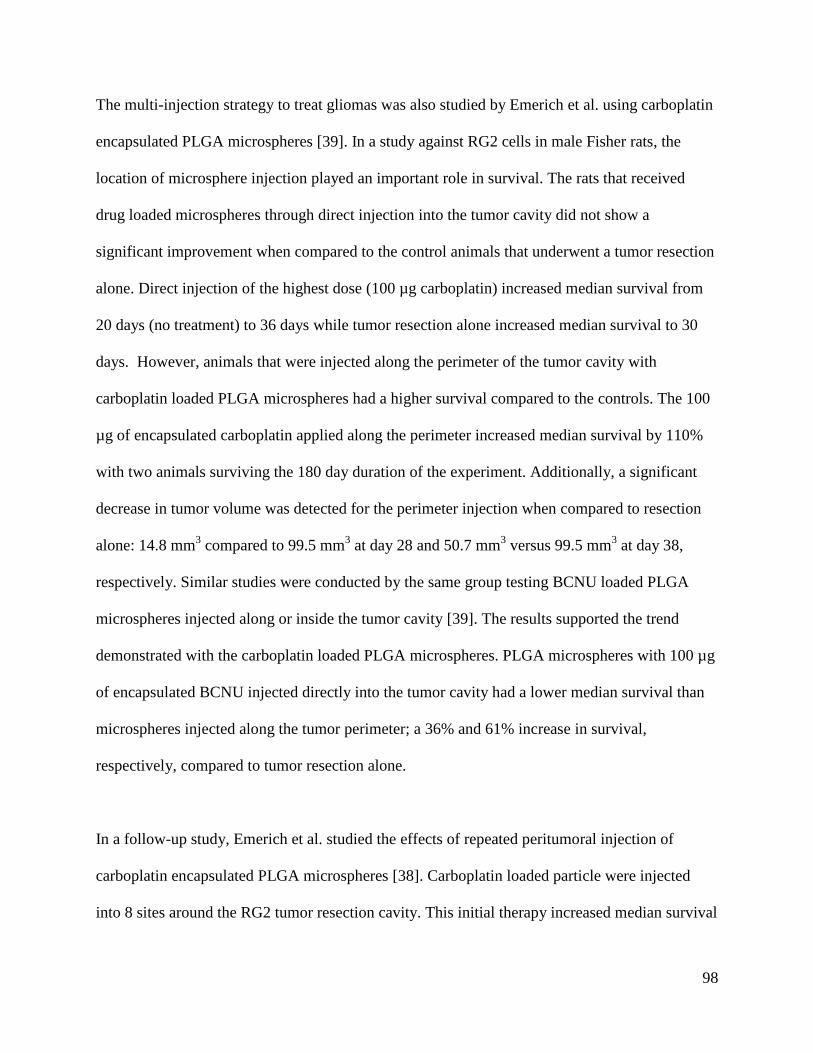
98
The multi-injection strategy to treat gliomas was also studied by Emerich et al. using carboplatin
encapsulated PLGA microspheres [39]. In a study against RG2 cells in male Fisher rats, the
location of microsphere injection played an important role in survival. The rats that received
drug loaded microspheres through direct injection into the tumor cavity did not show a
significant improvement when compared to the control animals that underwent a tumor resection
alone. Direct injection of the highest dose (100 µg carboplatin) increased median survival from
20 days (no treatment) to 36 days while tumor resection alone increased median survival to 30
days. However, animals that were injected along the perimeter of the tumor cavity with
carboplatin loaded PLGA microspheres had a higher survival compared to the controls. The 100
µg of encapsulated carboplatin applied along the perimeter increased median survival by 110%
with two animals surviving the 180 day duration of the experiment. Additionally, a significant
decrease in tumor volume was detected for the perimeter injection when compared to resection
alone: 14.8 mm3 compared to 99.5 mm
3 at day 28 and 50.7 mm
3 versus 99.5 mm
3 at day 38,
respectively. Similar studies were conducted by the same group testing BCNU loaded PLGA
microspheres injected along or inside the tumor cavity [39]. The results supported the trend
demonstrated with the carboplatin loaded PLGA microspheres. PLGA microspheres with 100 µg
of encapsulated BCNU injected directly into the tumor cavity had a lower median survival than
microspheres injected along the tumor perimeter; a 36% and 61% increase in survival,
respectively, compared to tumor resection alone.
In a follow-up study, Emerich et al. studied the effects of repeated peritumoral injection of
carboplatin encapsulated PLGA microspheres [38]. Carboplatin loaded particle were injected
into 8 sites around the RG2 tumor resection cavity. This initial therapy increased median survival
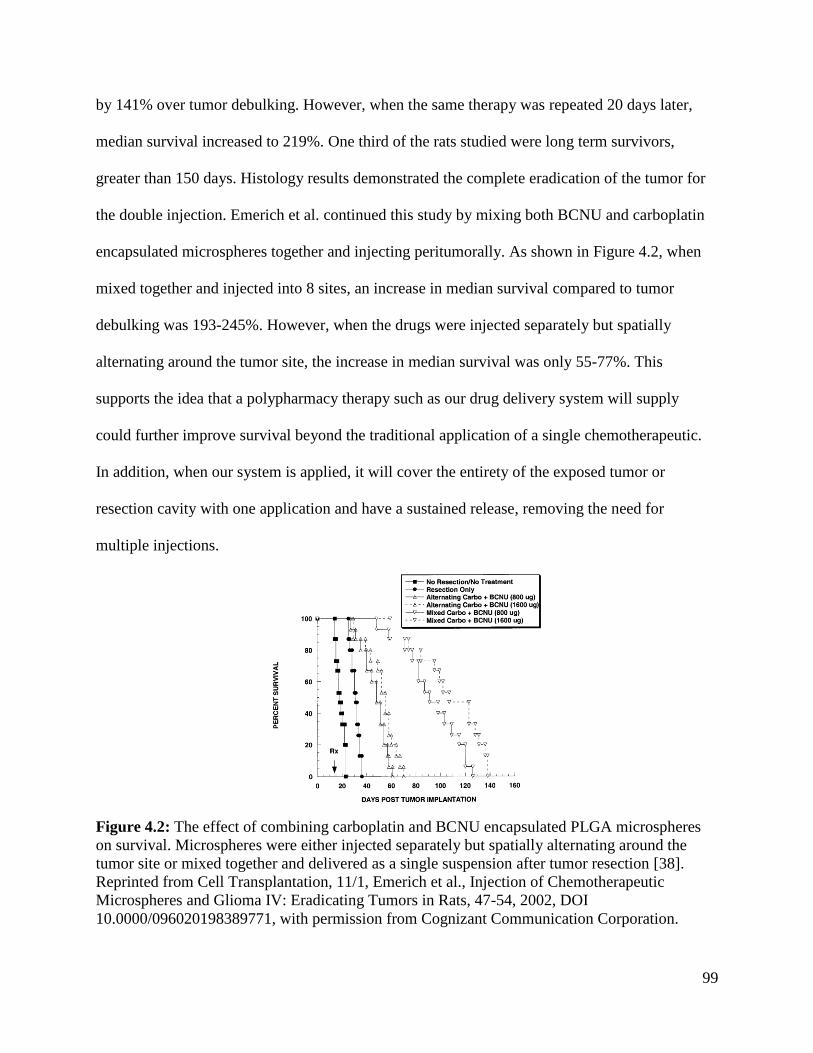
99
by 141% over tumor debulking. However, when the same therapy was repeated 20 days later,
median survival increased to 219%. One third of the rats studied were long term survivors,
greater than 150 days. Histology results demonstrated the complete eradication of the tumor for
the double injection. Emerich et al. continued this study by mixing both BCNU and carboplatin
encapsulated microspheres together and injecting peritumorally. As shown in Figure 4.2, when
mixed together and injected into 8 sites, an increase in median survival compared to tumor
debulking was 193-245%. However, when the drugs were injected separately but spatially
alternating around the tumor site, the increase in median survival was only 55-77%. This
supports the idea that a polypharmacy therapy such as our drug delivery system will supply
could further improve survival beyond the traditional application of a single chemotherapeutic.
In addition, when our system is applied, it will cover the entirety of the exposed tumor or
resection cavity with one application and have a sustained release, removing the need for
multiple injections.
Figure 4.2: The effect of combining carboplatin and BCNU encapsulated PLGA microspheres
on survival. Microspheres were either injected separately but spatially alternating around the
tumor site or mixed together and delivered as a single suspension after tumor resection [38].
Reprinted from Cell Transplantation, 11/1, Emerich et al., Injection of Chemotherapeutic
Microspheres and Glioma IV: Eradicating Tumors in Rats, 47-54, 2002, DOI
10.0000/096020198389771, with permission from Cognizant Communication Corporation.
100
4.2 Hypothesis
It is hypothesized that:
(1) Free gefitinib applied to C6 glioma cells in vitro will have a dosage dependent effect on cell
viability
(2) In a subcutaneous tumor model, gefitinib encapsulated PLGA microspheres entrapped in
PNIPAM will reduce tumor volume when compared to blank PLGA microspheres entrapped
in PNIPAM
4.3 Materials and Methods
4.3.1 Materials
4.3.1.1 Materials for Cell Culture and Gefitinib Testing
Dulbecco’s Modified Eagle Medium (DMEM; Invitrogen), fetal bovine Serum (FBS; Optima),
L-glutamine (Sigma), antibiotic/antimycotic (A/A; Gibco), dimethyl sulfoxide (DMSO; Sigma),
Vybrant MTT cell proliferation assay kit (Invitrogen), and gefitinib (GB; Fisher, free base
>99%) were used as received.
4.3.1.2 Materials for C6 Subcutaneous Injection and Treatment
Microspheres and PNIPAM used in this section were formulated or synthesized in Chapter 2
under sterile conditions. The formulations parameters are listed below in Table 4.1. Limulus
amebocyte lysate pyrogent plus kit (Lonza), sterile saline (Hospira), and optimal cutting
temperature (OCT, Tissue-Tek) were used as received.
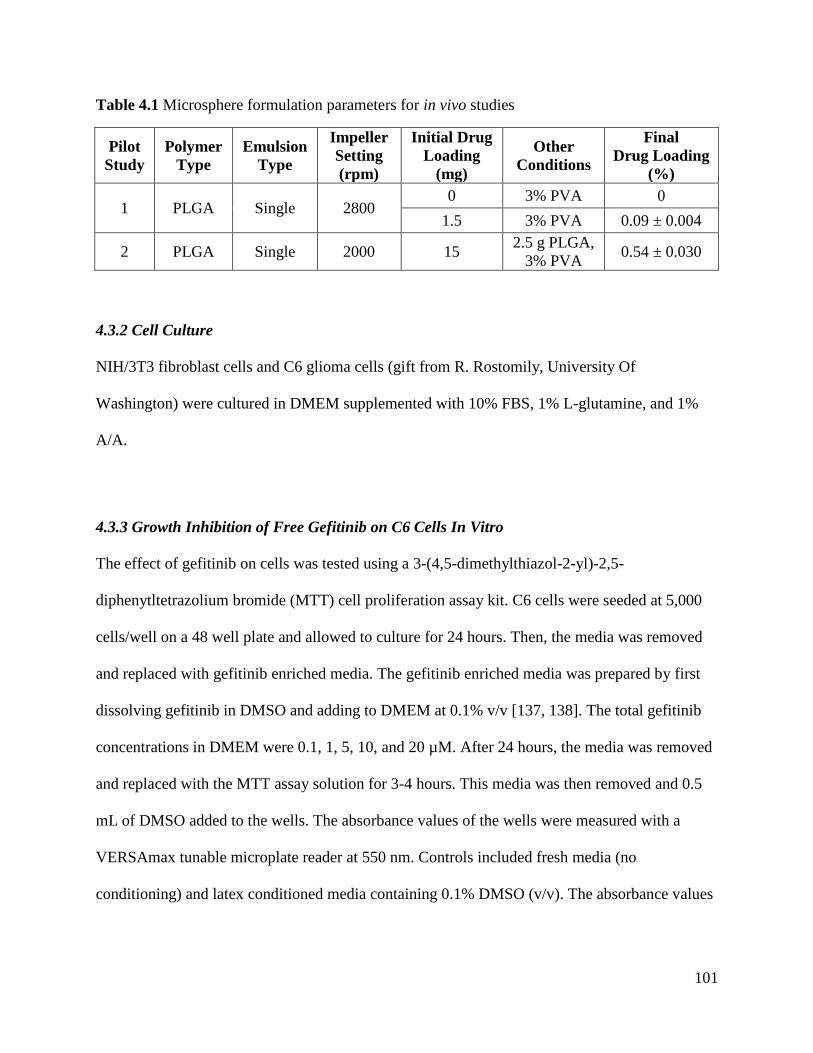
101
Table 4.1 Microsphere formulation parameters for in vivo studies
Pilot
Study
Polymer
Type
Emulsion
Type
Impeller
Setting
(rpm)
Initial Drug
Loading
(mg)
Other
Conditions
Final
Drug Loading
(%)
1 PLGA Single 2800 0 3% PVA 0
1.5 3% PVA 0.09 ± 0.004
2 PLGA Single 2000 15 2.5 g PLGA,
3% PVA 0.54 ± 0.030
4.3.2 Cell Culture
NIH/3T3 fibroblast cells and C6 glioma cells (gift from R. Rostomily, University Of
Washington) were cultured in DMEM supplemented with 10% FBS, 1% L-glutamine, and 1%
A/A.
4.3.3 Growth Inhibition of Free Gefitinib on C6 Cells In Vitro
The effect of gefitinib on cells was tested using a 3-(4,5-dimethylthiazol-2-yl)-2,5-
diphenytltetrazolium bromide (MTT) cell proliferation assay kit. C6 cells were seeded at 5,000
cells/well on a 48 well plate and allowed to culture for 24 hours. Then, the media was removed
and replaced with gefitinib enriched media. The gefitinib enriched media was prepared by first
dissolving gefitinib in DMSO and adding to DMEM at 0.1% v/v [137, 138]. The total gefitinib
concentrations in DMEM were 0.1, 1, 5, 10, and 20 µM. After 24 hours, the media was removed
and replaced with the MTT assay solution for 3-4 hours. This media was then removed and 0.5
mL of DMSO added to the wells. The absorbance values of the wells were measured with a
VERSAmax tunable microplate reader at 550 nm. Controls included fresh media (no
conditioning) and latex conditioned media containing 0.1% DMSO (v/v). The absorbance values
102
were normalized to the fresh media as 100% cell viability. All measurements were performed in
triplicate with error bars to one standard deviation and analyzed with an unpaired t test.
4.3.4 Gefitinib-PLGA-PNIPAM against a Subcutaneous Glioma Tumor
Animal experiments were approved by the University of Washington Animal Care and Use
Committee (IACUC) and followed federal guidelines for laboratory animal use. Blank
microspheres were evaluated for cytotoxicity using the elution method and following United
States Pharmacopeia and International Organization of Standardization (ISO) guidelines. At least
three samples per batch of microspheres were placed in DMEM for 24 hours at either 0.2 g per
mL media or 6 cm2 surface area per mL media. NIH/3T3 cells were exposed to this conditioned
media for 48 hours and examined via light microscopy at 12, 24, and 48 hours for any cytotoxic
response. GB-PLGA microspheres were not tested as GB would be toxic to cells. Both
microspheres and PNIPAM were evaluated for endotoxicity using a standard limulus amebocyte
lysate gel clot protocol. Three samples per microsphere set and PNIPAM batch were extracted at
a concentration of 0.2 g per mL endotoxin free water or 6 cm2 surface area per mL endotoxin
free water. To pass testing, all samples had to have less than 0.06 EU/mL (EU is endotoxin unit)
from the sample extracts.
4.3.4.1 Pilot 1
Six athymic, male, nude mice (6-7 weeks old, Charles River) were subcutaneously injected in the
right dorsal flank with 5 X 10⁵ C6 cells in a 100 µL volume of DMEM and 1% L-glutamine. The
injected cells were allowed to grow and form tumors over 8 days. The animals were randomly
divided into two groups of three mice each. The first group received a single, 0.5 mL
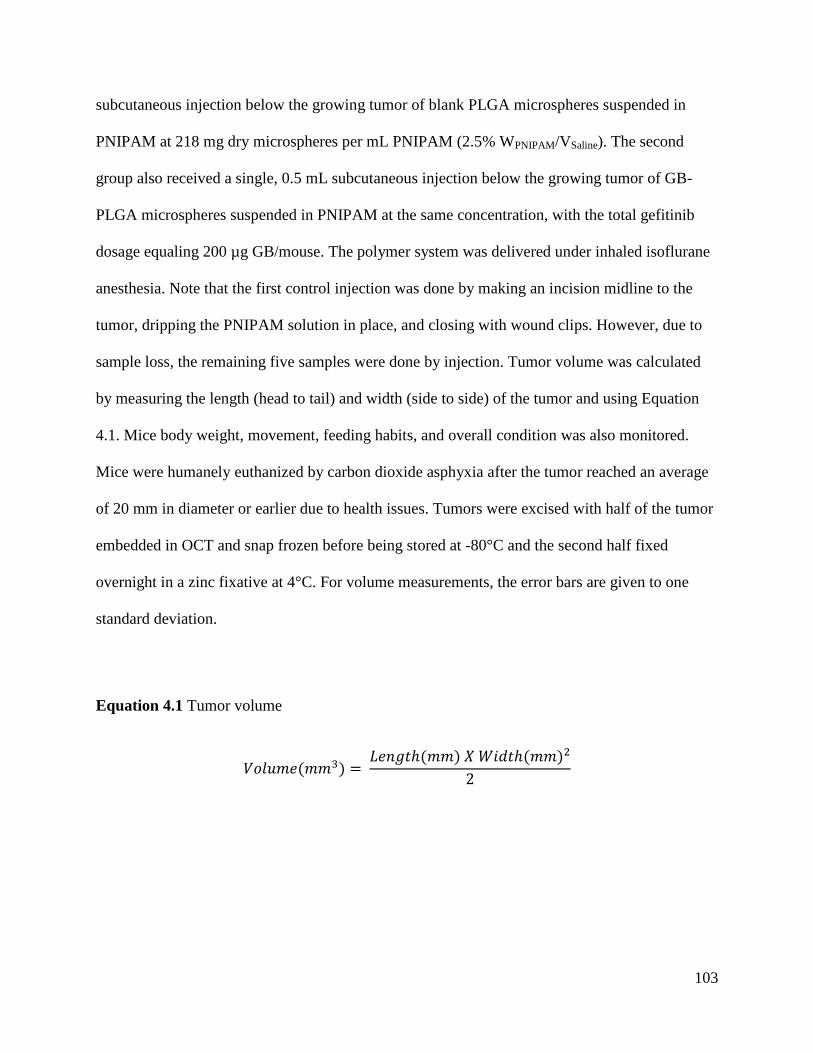
103
subcutaneous injection below the growing tumor of blank PLGA microspheres suspended in
PNIPAM at 218 mg dry microspheres per mL PNIPAM (2.5% WPNIPAM/VSaline). The second
group also received a single, 0.5 mL subcutaneous injection below the growing tumor of GB-
PLGA microspheres suspended in PNIPAM at the same concentration, with the total gefitinib
dosage equaling 200 µg GB/mouse. The polymer system was delivered under inhaled isoflurane
anesthesia. Note that the first control injection was done by making an incision midline to the
tumor, dripping the PNIPAM solution in place, and closing with wound clips. However, due to
sample loss, the remaining five samples were done by injection. Tumor volume was calculated
by measuring the length (head to tail) and width (side to side) of the tumor and using Equation
4.1. Mice body weight, movement, feeding habits, and overall condition was also monitored.
Mice were humanely euthanized by carbon dioxide asphyxia after the tumor reached an average
of 20 mm in diameter or earlier due to health issues. Tumors were excised with half of the tumor
embedded in OCT and snap frozen before being stored at -80°C and the second half fixed
overnight in a zinc fixative at 4°C. For volume measurements, the error bars are given to one
standard deviation.
Equation 4.1 Tumor volume
𝑉𝑜𝑙𝑢𝑚𝑒(𝑚𝑚3) = 𝐿𝑒𝑛𝑔𝑡ℎ(𝑚𝑚) 𝑋 𝑊𝑖𝑑𝑡ℎ(𝑚𝑚)2
2
104
4.3.4.2 Pilot 2
Three athymic, male, nude mice (6-7 weeks old, Charles River) were subcutaneously injected in
the right dorsal flank with 5 X 10⁵ C6 cells in a 100 µL volume of DMEM and 1% L-glutamine.
The injected cells were allowed to grow and form tumors over 7 days. All mice received a single,
0.5 mL, subcutaneous injection at day 7 below the growing tumor of GB-PLGA microspheres
suspended in PNIPAM at 83 mg dry microspheres per mL PNIPAM (2.5% WPNIPAM/VSaline). The
total gefitinib dosage equaled 450 µg GB/mouse. Note that all material was kept at 4°C prior to
injection and the drug delivery system was applied under inhaled isoflurane anesthesia. After
injection, the site was rinsed with cold saline to remove any PNIPAM or microspheres from the
wound. Tumor volume was calculated by measuring the length (head to tail) and width (side to
side) of the tumor and using Equation 4.1. Mice body weight, movement, feeding habits, and
overall condition was also monitored. Mice were humanely euthanized by carbon dioxide
asphyxia after the tumor reached an average of 20 mm in diameter or earlier due to health issues.
Tumors were excised with half of tumor embedded in OCT and snap frozen before being stored
at -80°C and the second half fixed overnight in zinc fixative at 4°C. Error bars are given to on
one standard deviation for volume measurements
Note that on day 19 post-treatment, the two remaining mice were given one dose of
buprenorphine SR (1 mg/mL) at 1.2 mg/kg subcutaneously. This was due to the skin
progressively breaking down with ulceration, secondary to the tumor.
105
4.3.5 Histology Analysis: Hematoxylin and Eosin Stain and Trichrome Stain
Fixed explants were dehydrated with a graded ethanol series and cleared with xylene prior to
paraffin embedding. The embedded explants were sectioned with a Leica microtome in 5 µm
sections and placed on a glass slide. Prior to staining, slides were baked at 50 °C for 30 minutes
before deparaffinization in xylene, rehydration through a graded ethanol series, and washing in
distilled water. For Hematoxylin and eosin staining (H&E), slides were soaked in Harris
hematoxylin solution for 8-10 minutes, rinsed in tap water, dipped three times in acid alcohol,
rinsed again in tap water, placed in Scotts Blue to reduce intensity staining, rinsed in tap water,
dipped three times in Eosin, and then dehydrated through a graded series of ethanol and xylene
before being cover slipped using Permount (Electron Microscopy Sciences). All media used was
obtained through Sigma.
For trichrome staining, slides were placed in Bouin’s fixative at 55 °C for 45 minutes, rinsed in
water, placed in Weigert’s iron hematoxylin for 10 minutes, washed in water, placed in Biebrich
scarlet-acid fuchsin for 5 minutes, rinsed in water, placed in phosphomolybdic-phosphotungstic
acid solution for 10 minutes, placed in Aniline blue for 3 minutes, rinsed in water, and placed in
fresh 1% acetic acid for 1 minute. Finally, slides were dehydrated through a graded series of
ethanol and xylene before being cover slipped using Permount (Electron Microscopy Sciences).
All media used was obtained through Sigma.
Slides were imaged using a Nikon E800 Upright Microscope equipped with Metamorph software
(version 6.0, Molecular Devices).
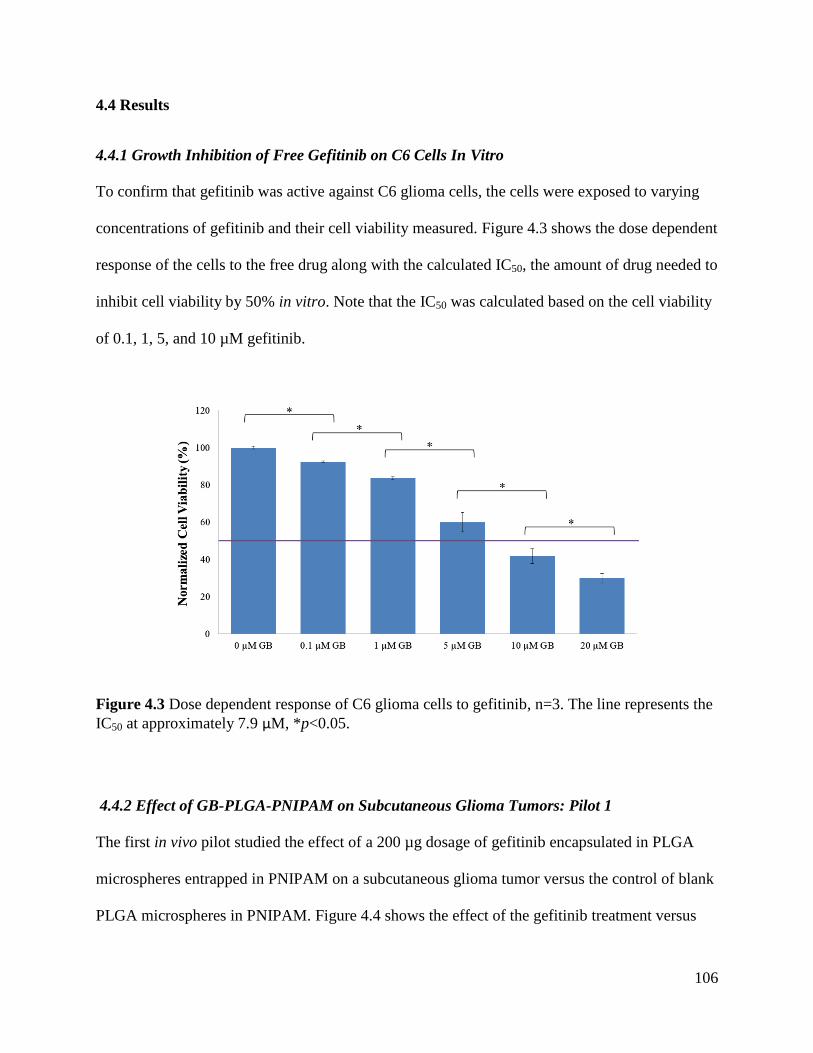
106
4.4 Results
4.4.1 Growth Inhibition of Free Gefitinib on C6 Cells In Vitro
To confirm that gefitinib was active against C6 glioma cells, the cells were exposed to varying
concentrations of gefitinib and their cell viability measured. Figure 4.3 shows the dose dependent
response of the cells to the free drug along with the calculated IC50, the amount of drug needed to
inhibit cell viability by 50% in vitro. Note that the IC50 was calculated based on the cell viability
of 0.1, 1, 5, and 10 µM gefitinib.
Figure 4.3 Dose dependent response of C6 glioma cells to gefitinib, n=3. The line represents the
IC50 at approximately 7.9 µM, *p<0.05.
4.4.2 Effect of GB-PLGA-PNIPAM on Subcutaneous Glioma Tumors: Pilot 1
The first in vivo pilot studied the effect of a 200 µg dosage of gefitinib encapsulated in PLGA
microspheres entrapped in PNIPAM on a subcutaneous glioma tumor versus the control of blank
PLGA microspheres in PNIPAM. Figure 4.4 shows the effect of the gefitinib treatment versus
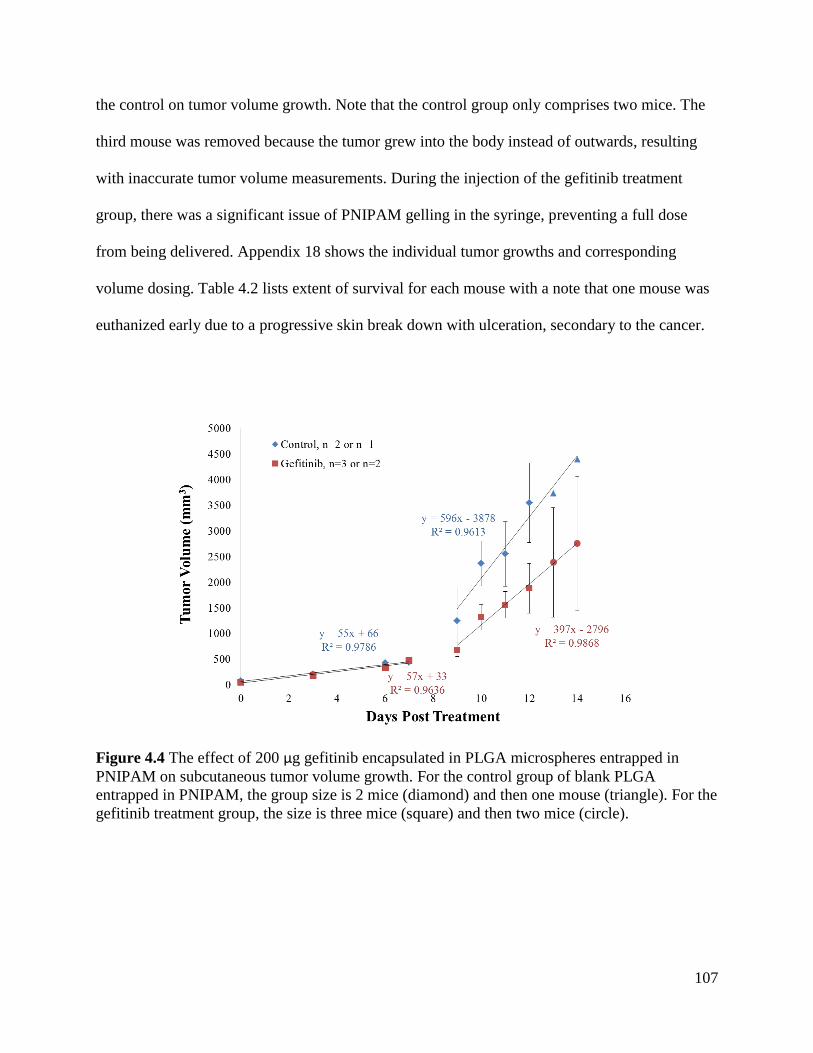
107
the control on tumor volume growth. Note that the control group only comprises two mice. The
third mouse was removed because the tumor grew into the body instead of outwards, resulting
with inaccurate tumor volume measurements. During the injection of the gefitinib treatment
group, there was a significant issue of PNIPAM gelling in the syringe, preventing a full dose
from being delivered. Appendix 18 shows the individual tumor growths and corresponding
volume dosing. Table 4.2 lists extent of survival for each mouse with a note that one mouse was
euthanized early due to a progressive skin break down with ulceration, secondary to the cancer.
Figure 4.4 The effect of 200 µg gefitinib encapsulated in PLGA microspheres entrapped in
PNIPAM on subcutaneous tumor volume growth. For the control group of blank PLGA
entrapped in PNIPAM, the group size is 2 mice (diamond) and then one mouse (triangle). For the
gefitinib treatment group, the size is three mice (square) and then two mice (circle).
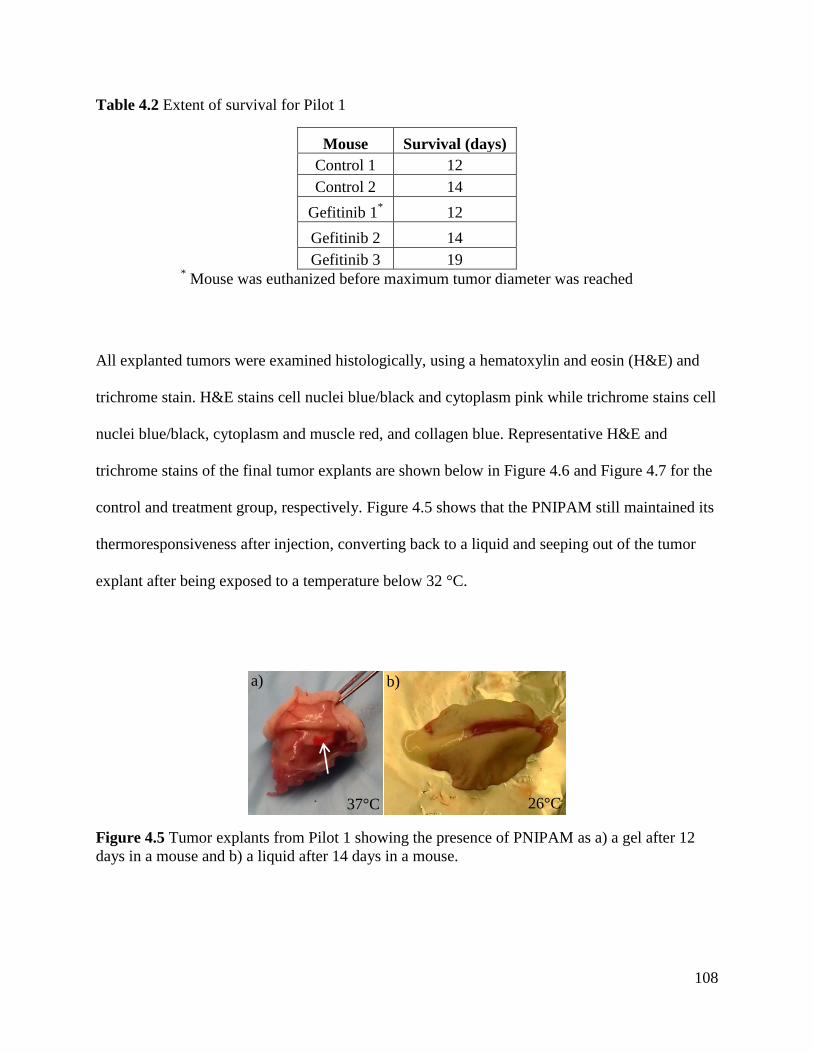
108
Table 4.2 Extent of survival for Pilot 1
Mouse Survival (days)
Control 1 12
Control 2 14
Gefitinib 1* 12
Gefitinib 2 14
Gefitinib 3 19 * Mouse was euthanized before maximum tumor diameter was reached
All explanted tumors were examined histologically, using a hematoxylin and eosin (H&E) and
trichrome stain. H&E stains cell nuclei blue/black and cytoplasm pink while trichrome stains cell
nuclei blue/black, cytoplasm and muscle red, and collagen blue. Representative H&E and
trichrome stains of the final tumor explants are shown below in Figure 4.6 and Figure 4.7 for the
control and treatment group, respectively. Figure 4.5 shows that the PNIPAM still maintained its
thermoresponsiveness after injection, converting back to a liquid and seeping out of the tumor
explant after being exposed to a temperature below 32 °C.
Figure 4.5 Tumor explants from Pilot 1 showing the presence of PNIPAM as a) a gel after 12
days in a mouse and b) a liquid after 14 days in a mouse.
a) b)
37°C 26°C
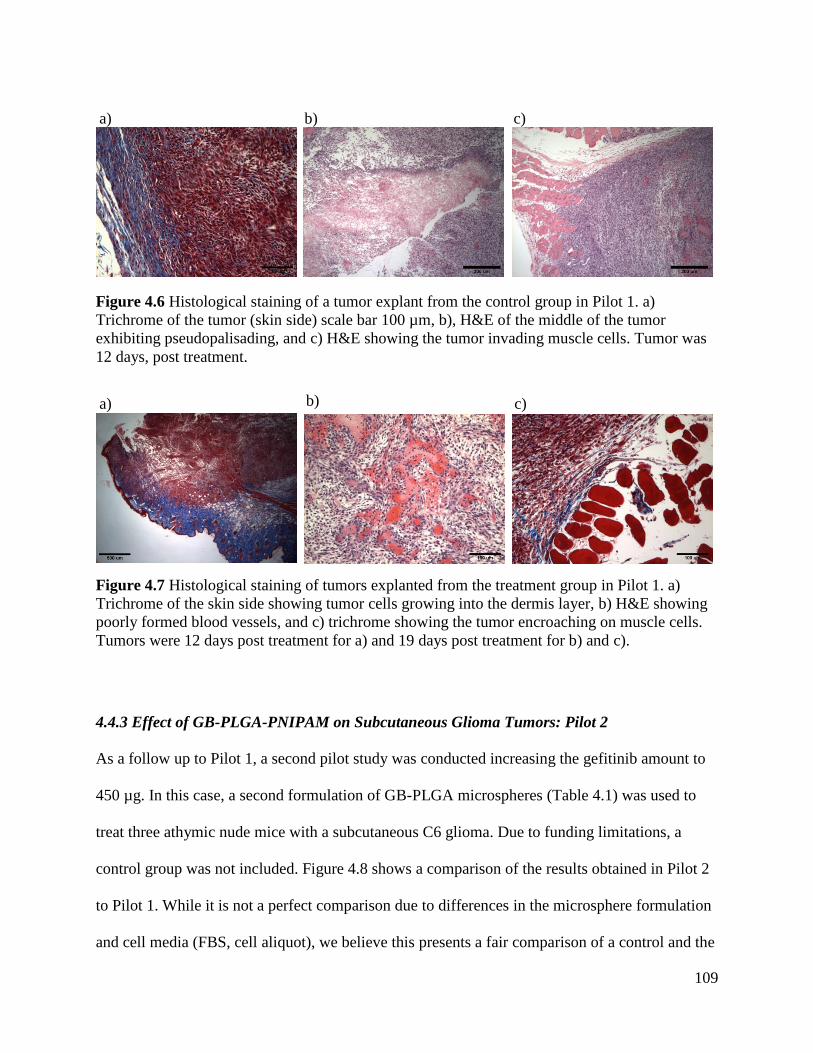
109
Figure 4.6 Histological staining of a tumor explant from the control group in Pilot 1. a)
Trichrome of the tumor (skin side) scale bar 100 µm, b), H&E of the middle of the tumor
exhibiting pseudopalisading, and c) H&E showing the tumor invading muscle cells. Tumor was
12 days, post treatment.
Figure 4.7 Histological staining of tumors explanted from the treatment group in Pilot 1. a)
Trichrome of the skin side showing tumor cells growing into the dermis layer, b) H&E showing
poorly formed blood vessels, and c) trichrome showing the tumor encroaching on muscle cells.
Tumors were 12 days post treatment for a) and 19 days post treatment for b) and c).
4.4.3 Effect of GB-PLGA-PNIPAM on Subcutaneous Glioma Tumors: Pilot 2
As a follow up to Pilot 1, a second pilot study was conducted increasing the gefitinib amount to
450 µg. In this case, a second formulation of GB-PLGA microspheres (Table 4.1) was used to
treat three athymic nude mice with a subcutaneous C6 glioma. Due to funding limitations, a
control group was not included. Figure 4.8 shows a comparison of the results obtained in Pilot 2
to Pilot 1. While it is not a perfect comparison due to differences in the microsphere formulation
and cell media (FBS, cell aliquot), we believe this presents a fair comparison of a control and the
a) b) c)
b) c) a)
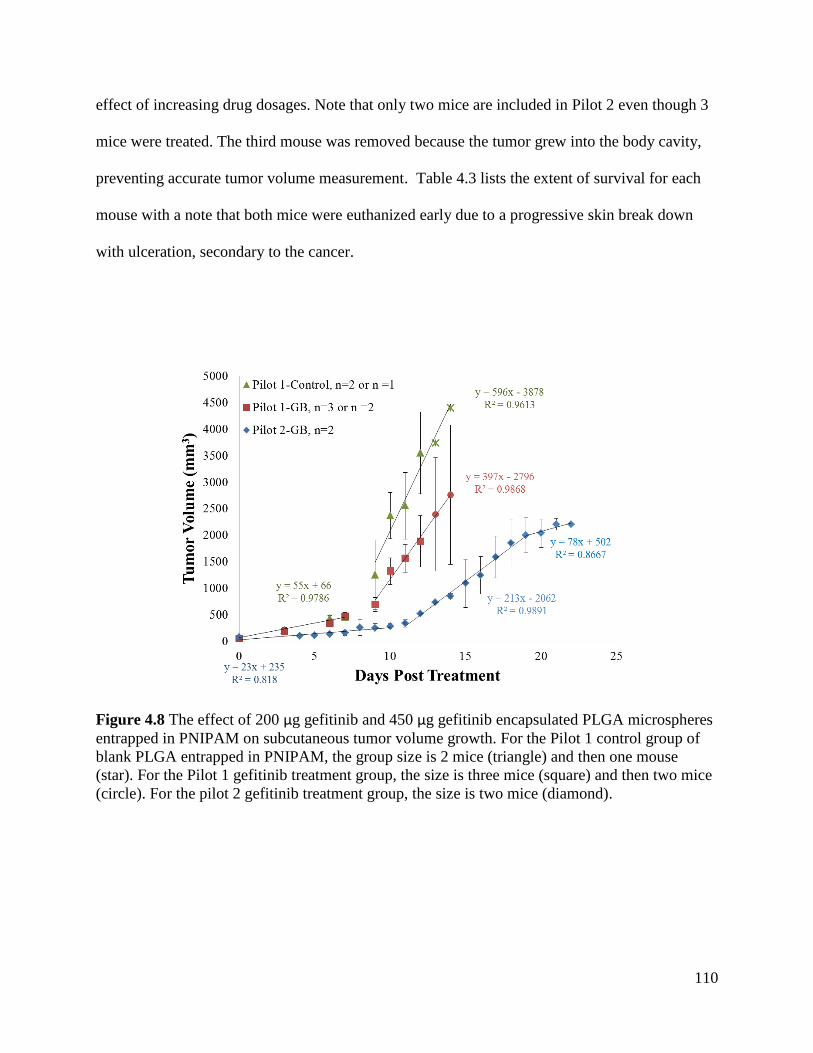
110
effect of increasing drug dosages. Note that only two mice are included in Pilot 2 even though 3
mice were treated. The third mouse was removed because the tumor grew into the body cavity,
preventing accurate tumor volume measurement. Table 4.3 lists the extent of survival for each
mouse with a note that both mice were euthanized early due to a progressive skin break down
with ulceration, secondary to the cancer.
Figure 4.8 The effect of 200 µg gefitinib and 450 µg gefitinib encapsulated PLGA microspheres
entrapped in PNIPAM on subcutaneous tumor volume growth. For the Pilot 1 control group of
blank PLGA entrapped in PNIPAM, the group size is 2 mice (triangle) and then one mouse
(star). For the Pilot 1 gefitinib treatment group, the size is three mice (square) and then two mice
(circle). For the pilot 2 gefitinib treatment group, the size is two mice (diamond).
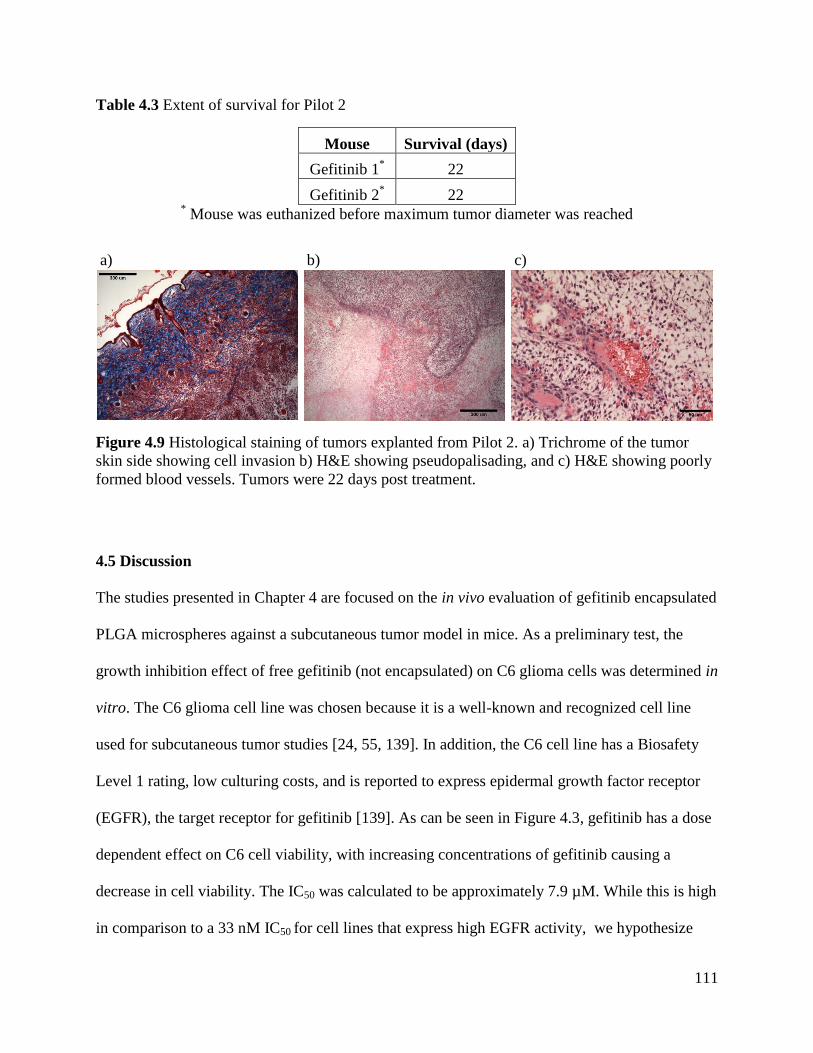
111
Table 4.3 Extent of survival for Pilot 2
Mouse Survival (days)
Gefitinib 1* 22
Gefitinib 2* 22
* Mouse was euthanized before maximum tumor diameter was reached
Figure 4.9 Histological staining of tumors explanted from Pilot 2. a) Trichrome of the tumor
skin side showing cell invasion b) H&E showing pseudopalisading, and c) H&E showing poorly
formed blood vessels. Tumors were 22 days post treatment.
4.5 Discussion
The studies presented in Chapter 4 are focused on the in vivo evaluation of gefitinib encapsulated
PLGA microspheres against a subcutaneous tumor model in mice. As a preliminary test, the
growth inhibition effect of free gefitinib (not encapsulated) on C6 glioma cells was determined in
vitro. The C6 glioma cell line was chosen because it is a well-known and recognized cell line
used for subcutaneous tumor studies [24, 55, 139]. In addition, the C6 cell line has a Biosafety
Level 1 rating, low culturing costs, and is reported to express epidermal growth factor receptor
(EGFR), the target receptor for gefitinib [139]. As can be seen in Figure 4.3, gefitinib has a dose
dependent effect on C6 cell viability, with increasing concentrations of gefitinib causing a
decrease in cell viability. The IC50 was calculated to be approximately 7.9 µM. While this is high
in comparison to a 33 nM IC50 for cell lines that express high EGFR activity, we hypothesize
a) b) c)
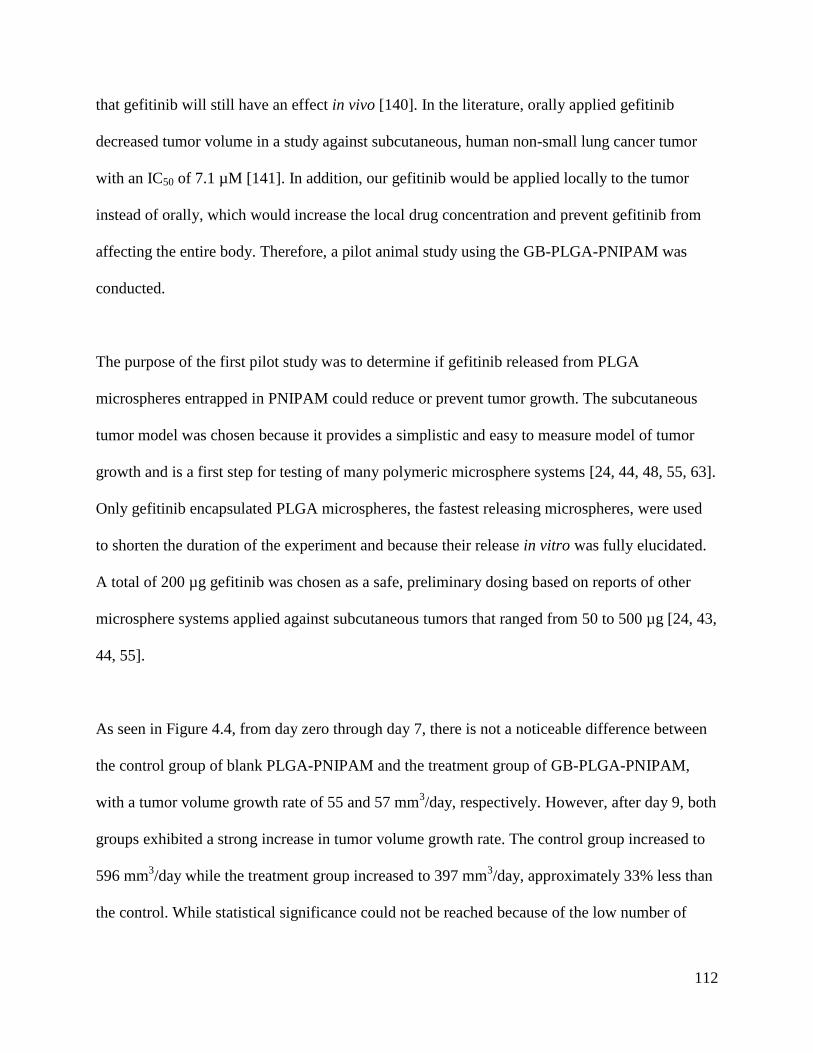
112
that gefitinib will still have an effect in vivo [140]. In the literature, orally applied gefitinib
decreased tumor volume in a study against subcutaneous, human non-small lung cancer tumor
with an IC50 of 7.1 µM [141]. In addition, our gefitinib would be applied locally to the tumor
instead of orally, which would increase the local drug concentration and prevent gefitinib from
affecting the entire body. Therefore, a pilot animal study using the GB-PLGA-PNIPAM was
conducted.
The purpose of the first pilot study was to determine if gefitinib released from PLGA
microspheres entrapped in PNIPAM could reduce or prevent tumor growth. The subcutaneous
tumor model was chosen because it provides a simplistic and easy to measure model of tumor
growth and is a first step for testing of many polymeric microsphere systems [24, 44, 48, 55, 63].
Only gefitinib encapsulated PLGA microspheres, the fastest releasing microspheres, were used
to shorten the duration of the experiment and because their release in vitro was fully elucidated.
A total of 200 µg gefitinib was chosen as a safe, preliminary dosing based on reports of other
microsphere systems applied against subcutaneous tumors that ranged from 50 to 500 µg [24, 43,
44, 55].
As seen in Figure 4.4, from day zero through day 7, there is not a noticeable difference between
the control group of blank PLGA-PNIPAM and the treatment group of GB-PLGA-PNIPAM,
with a tumor volume growth rate of 55 and 57 mm3/day, respectively. However, after day 9, both
groups exhibited a strong increase in tumor volume growth rate. The control group increased to
596 mm3/day while the treatment group increased to 397 mm
3/day, approximately 33% less than
the control. While statistical significance could not be reached because of the low number of
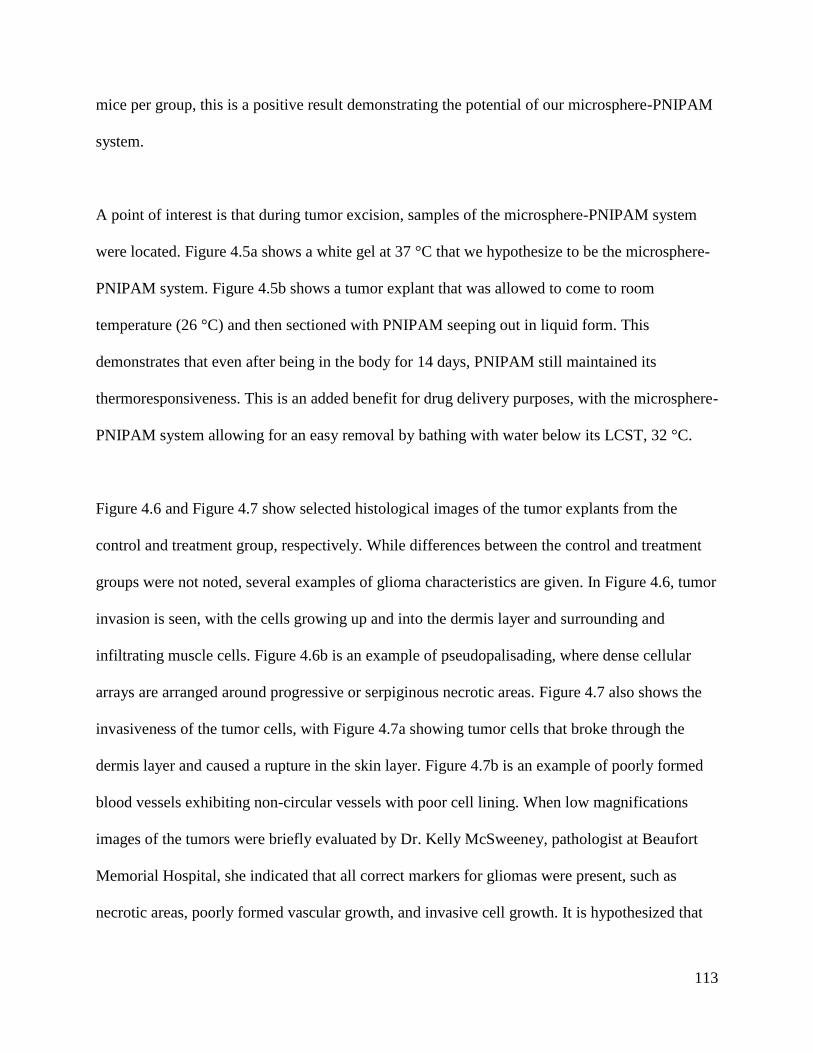
113
mice per group, this is a positive result demonstrating the potential of our microsphere-PNIPAM
system.
A point of interest is that during tumor excision, samples of the microsphere-PNIPAM system
were located. Figure 4.5a shows a white gel at 37 °C that we hypothesize to be the microsphere-
PNIPAM system. Figure 4.5b shows a tumor explant that was allowed to come to room
temperature (26 °C) and then sectioned with PNIPAM seeping out in liquid form. This
demonstrates that even after being in the body for 14 days, PNIPAM still maintained its
thermoresponsiveness. This is an added benefit for drug delivery purposes, with the microsphere-
PNIPAM system allowing for an easy removal by bathing with water below its LCST, 32 °C.
Figure 4.6 and Figure 4.7 show selected histological images of the tumor explants from the
control and treatment group, respectively. While differences between the control and treatment
groups were not noted, several examples of glioma characteristics are given. In Figure 4.6, tumor
invasion is seen, with the cells growing up and into the dermis layer and surrounding and
infiltrating muscle cells. Figure 4.6b is an example of pseudopalisading, where dense cellular
arrays are arranged around progressive or serpiginous necrotic areas. Figure 4.7 also shows the
invasiveness of the tumor cells, with Figure 4.7a showing tumor cells that broke through the
dermis layer and caused a rupture in the skin layer. Figure 4.7b is an example of poorly formed
blood vessels exhibiting non-circular vessels with poor cell lining. When low magnifications
images of the tumors were briefly evaluated by Dr. Kelly McSweeney, pathologist at Beaufort
Memorial Hospital, she indicated that all correct markers for gliomas were present, such as
necrotic areas, poorly formed vascular growth, and invasive cell growth. It is hypothesized that
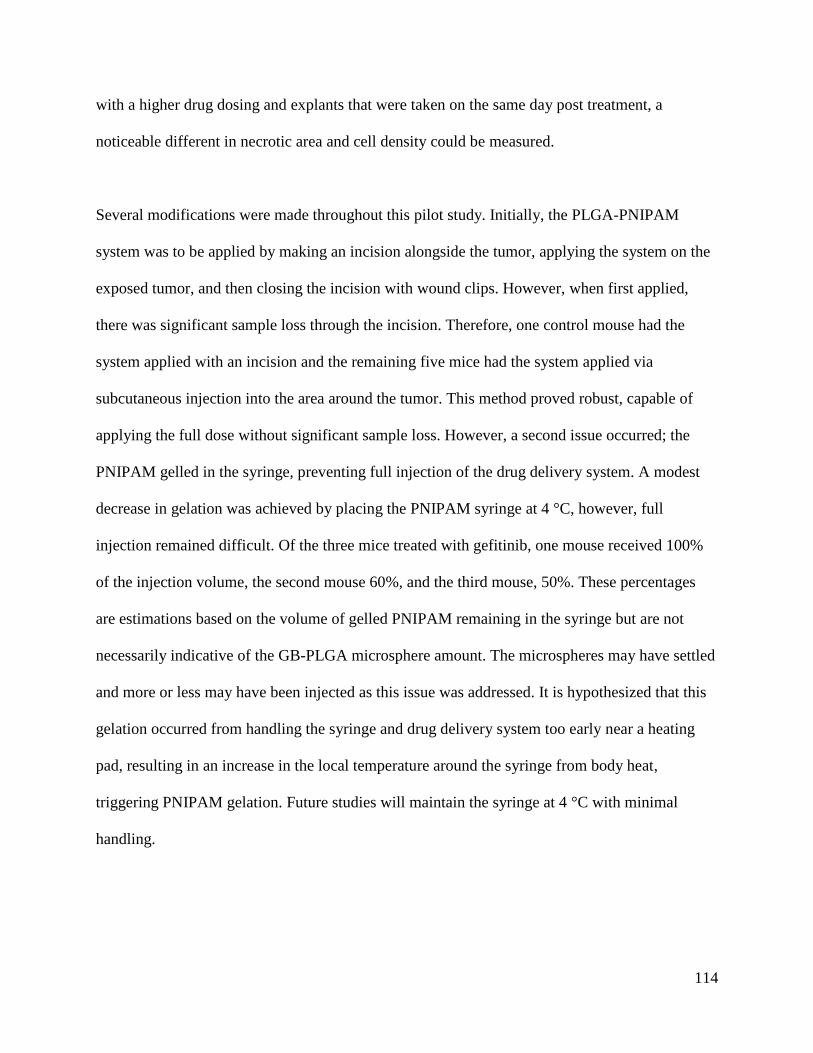
114
with a higher drug dosing and explants that were taken on the same day post treatment, a
noticeable different in necrotic area and cell density could be measured.
Several modifications were made throughout this pilot study. Initially, the PLGA-PNIPAM
system was to be applied by making an incision alongside the tumor, applying the system on the
exposed tumor, and then closing the incision with wound clips. However, when first applied,
there was significant sample loss through the incision. Therefore, one control mouse had the
system applied with an incision and the remaining five mice had the system applied via
subcutaneous injection into the area around the tumor. This method proved robust, capable of
applying the full dose without significant sample loss. However, a second issue occurred; the
PNIPAM gelled in the syringe, preventing full injection of the drug delivery system. A modest
decrease in gelation was achieved by placing the PNIPAM syringe at 4 °C, however, full
injection remained difficult. Of the three mice treated with gefitinib, one mouse received 100%
of the injection volume, the second mouse 60%, and the third mouse, 50%. These percentages
are estimations based on the volume of gelled PNIPAM remaining in the syringe but are not
necessarily indicative of the GB-PLGA microsphere amount. The microspheres may have settled
and more or less may have been injected as this issue was addressed. It is hypothesized that this
gelation occurred from handling the syringe and drug delivery system too early near a heating
pad, resulting in an increase in the local temperature around the syringe from body heat,
triggering PNIPAM gelation. Future studies will maintain the syringe at 4 °C with minimal
handling.
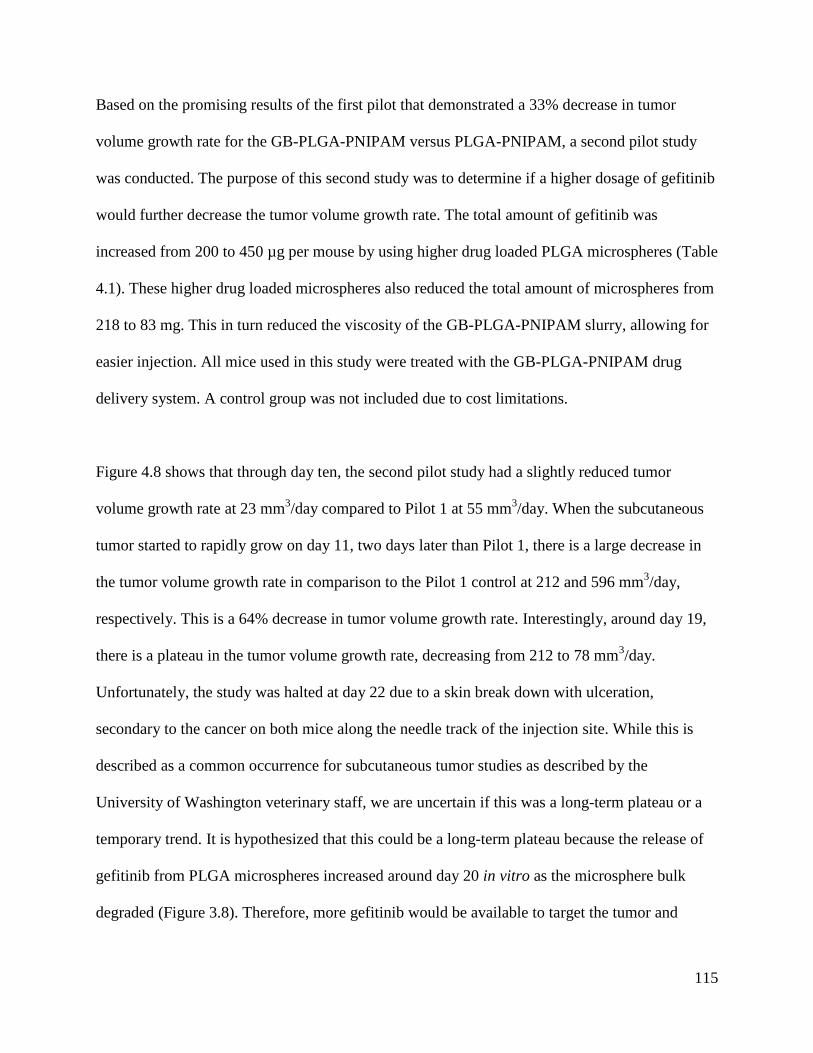
115
Based on the promising results of the first pilot that demonstrated a 33% decrease in tumor
volume growth rate for the GB-PLGA-PNIPAM versus PLGA-PNIPAM, a second pilot study
was conducted. The purpose of this second study was to determine if a higher dosage of gefitinib
would further decrease the tumor volume growth rate. The total amount of gefitinib was
increased from 200 to 450 µg per mouse by using higher drug loaded PLGA microspheres (Table
4.1). These higher drug loaded microspheres also reduced the total amount of microspheres from
218 to 83 mg. This in turn reduced the viscosity of the GB-PLGA-PNIPAM slurry, allowing for
easier injection. All mice used in this study were treated with the GB-PLGA-PNIPAM drug
delivery system. A control group was not included due to cost limitations.
Figure 4.8 shows that through day ten, the second pilot study had a slightly reduced tumor
volume growth rate at 23 mm3/day compared to Pilot 1 at 55 mm
3/day. When the subcutaneous
tumor started to rapidly grow on day 11, two days later than Pilot 1, there is a large decrease in
the tumor volume growth rate in comparison to the Pilot 1 control at 212 and 596 mm3/day,
respectively. This is a 64% decrease in tumor volume growth rate. Interestingly, around day 19,
there is a plateau in the tumor volume growth rate, decreasing from 212 to 78 mm3/day.
Unfortunately, the study was halted at day 22 due to a skin break down with ulceration,
secondary to the cancer on both mice along the needle track of the injection site. While this is
described as a common occurrence for subcutaneous tumor studies as described by the
University of Washington veterinary staff, we are uncertain if this was a long-term plateau or a
temporary trend. It is hypothesized that this could be a long-term plateau because the release of
gefitinib from PLGA microspheres increased around day 20 in vitro as the microsphere bulk
degraded (Figure 3.8). Therefore, more gefitinib would be available to target the tumor and
116
reduce tumor growth. Future studies should attempt to prevent skin ulceration by either using a
smaller needle for injection or injecting farther away from the tumor site. It was also confirmed
in Pilot 2 that placing the syringe and GB-PLGA-PNIPAM at 4 °C with minimal handling prior
to injection prevented PNIPAM from gelling in the syringe. All mice successfully received a full
injection of the drug delivery system.
Sample histology images from Pilot 2 are shown in Figure 4.9. Correct markers for gliomas are
present, including invasive cell growth into the skin layer, necrotic areas with pseudopalisading,
and poorly formed blood vessels [142].
It should be taken under consideration that the comparisons drawn between Pilot 1 and 2 are
“soft” comparisons, with trends taken from the data. Hard comparisons are not possible because
the Pilot 1 control used PLGA microspheres formulated under different conditions than Pilot 2
(Table 4.1). In addition, the number of animals per group was low and there were different cell
aliquots and cell media lots used between Pilot 1 and 2.
When the results of Pilot 2 are compared to a study using paclitaxel-PLGA microspheres
entrapped in an alginate matrix against subcutaneous C6 tumors, similar results were achieved in
tumor volume suppression [24]. After 21 days of treatment and dependent on the microsphere
formulation, the tumor volumes were reduced by 52 to 85% for the paclitaxel-PLGA-alginate
system in comparison to the blank microspheres control. Similarly, our Pilot 2 study reduced
tumor volume by 64% compared to the Pilot 1 blank microsphere control on day 7 and 80% on
day 14. A comparison at day 21 is not available as the control mice did not survive to that point.
117
However, it is encouraging to see that the gefitinib-PLGA-PNIPAM is achieving similar results
to those reported in the literature and an expanded study with larger animal numbers and control
groups would be necessary to achieve statistically significant results.
4.6 Conclusion
The first part of this work was focused on determining the growth inhibition effect of free
gefitinib on C6 glioma cells in vitro. It was found that gefitinib has a dose dependent effect on
C6 glioma cells, with higher concentrations of gefitinib decreasing cell viability. Next, the effect
of gefitinib encapsulated PLGA microspheres in PNIPAM was evaluated in a subcutaneous
tumor model. In the initial pilot study, the tumor volume growth rate was reduced by 33% for
GB-PLGA-PNIPAM when compared to the PLGA-PNIPAM control. When evaluated
histologically, the subcutaneous tumors demonstrated the markers characteristic of gliomas
including necrotic areas, poorly formed vasculature, and invasive cell growth. A second pilot
study was then conducted, more than doubling the amount of gefitinib that was delivered. When
compared to the first pilot control, the GB-PLGA-PNIPAM system was found to decrease tumor
volume growth rate by 64%. Additionally, the last four days of the study demonstrated a plateau
in the tumor volume growth that could be indicative of the tumor entering a long-term, slow
growth period due to more gefitinib being released from PLGA microspheres that are bulk
degrading. When evaluated histologically, the tumors from Pilot 2 exhibited the same glioma
markers as Pilot 1.
118
Further studies with more animals and controls would be needed to fully elucidate the
therapeutic benefits of the GB-PLGA-PNIPAM system. However, based on these two pilot
studies, this microsphere-PNIPAM system shows great potential for decreasing tumor growth.
119
5 Conclusions and Future Directions
The treatment of malignant gliomas is a field under constant study and advancements, with
researchers aiming to increase patient life expectancy beyond the current 12-15 month prognosis.
While there are several different directions being pursued such as targeted therapies, better
imaging and resection techniques, and implantable devices, this dissertation has purposed the use
of a topical, slow release, degradable, multi-drug delivery system applied post tumor resection
entitled drug encapsulated aerosolized microspheres as a biodegradable, intelligent glioma
therapy (DREAM BIG Therapy). The work presented here is focused on the production of drug
encapsulated polymeric microspheres and a degradable, thermoresponsive PNIPAM carrier, the
drug release of the drug-microspheres-carrier in vitro, and the effect of a chemotherapeutic-
microsphere-carrier on tumor volume growth in vivo. Overall, the results demonstrated the
potential of the DREAM BIG Therapy as a glioma treatment.
Initially, blank and drug encapsulated PLGA, PLA, and PCL microspheres were successfully
produced using emulsion techniques. By optimizing formulation parameters such as polymer,
stabilizer, and drug concentration, encapsulation efficiencies greater than 80% and drug loadings
greater than 0.3% were achieved for gefitinib encapsulated PLGA microspheres, IgG
encapsulated PLA microspheres, and lomustine encapsulated PCL microspheres. A degradable,
linear PNIPAM was also successfully synthesized using ATRP. The molecular weight of 20,000
g/mol demonstrated a temperature dependent, reversible phase transition that was capable of
entrapping polymeric microspheres.
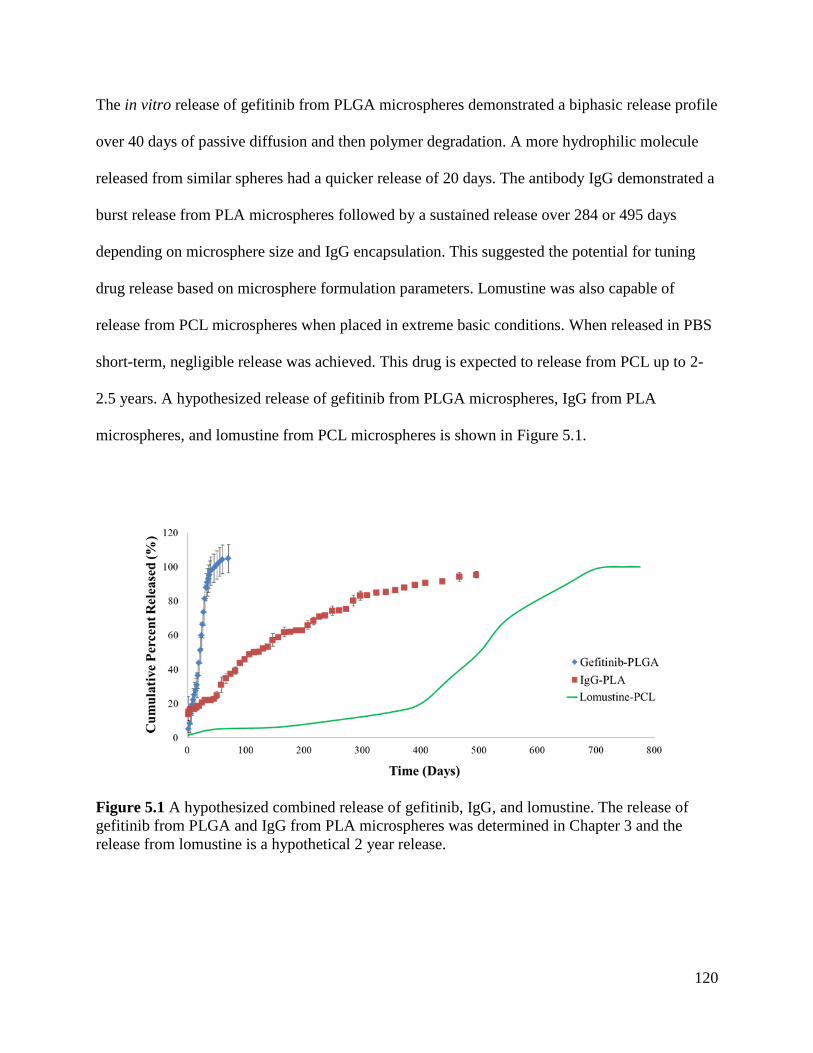
120
The in vitro release of gefitinib from PLGA microspheres demonstrated a biphasic release profile
over 40 days of passive diffusion and then polymer degradation. A more hydrophilic molecule
released from similar spheres had a quicker release of 20 days. The antibody IgG demonstrated a
burst release from PLA microspheres followed by a sustained release over 284 or 495 days
depending on microsphere size and IgG encapsulation. This suggested the potential for tuning
drug release based on microsphere formulation parameters. Lomustine was also capable of
release from PCL microspheres when placed in extreme basic conditions. When released in PBS
short-term, negligible release was achieved. This drug is expected to release from PCL up to 2-
2.5 years. A hypothesized release of gefitinib from PLGA microspheres, IgG from PLA
microspheres, and lomustine from PCL microspheres is shown in Figure 5.1.
Figure 5.1 A hypothesized combined release of gefitinib, IgG, and lomustine. The release of
gefitinib from PLGA and IgG from PLA microspheres was determined in Chapter 3 and the
release from lomustine is a hypothetical 2 year release.
121
The drug-microsphere-PNIPAM system was successfully aerosolized when tested ex vivo. The
aqueous PNIPAM solution suspended the microspheres and was applied via a spray bottle to
tissue at physiological temperature. Microspheres had a uniform distribution that penetrated the
convoluted topography of the tissue.
When tested in vivo, the gefitinib-PLGA-PNIPAM system reduced the tumor volume growth rate
of a subcutaneous glioma when compared to a blank PLGA-PNIPAM control. The trend
demonstrated a 33 and 64% decrease in tumor volume growth rate for a dosage of 200 and 450
µg gefitinib, respectively. While these numbers did not reach statistical significance, the pilot
studied confirmed the potential of the DREAM BIG Therapy.
Future work would concentrate on encapsulating the chemotherapeutic bevacizumab in PLA
microspheres to replace IgG. It is hypothesized that the optimal formulation parameters for IgG
will also apply to bevacizumab. The in vitro release of bevacizumab-PLA and lomustine-PCL at
physiological conditions would also be elucidated and microspheres parameters adjusted as
needed to achieve a sequential, step release of the chemotherapeutics.
Based on the promising results demonstrated by the two pilot studies, a fully powered animal
study is also suggested. A total of 64 athymic nude mice would be used, with 8 mice per group.
The groups would include 1) no treatment, 2) blank PLGA microspheres, 3) blank PLGA
microspheres and PNIPAM, 4) PNIPAM, 5) gefitinib in PNIPAM, 6) orally applied “free”
gefitinib, 7) gefitinib encapsulated PLGA microspheres and PNIPAM, and 8) gefitinib
encapsulated PLGA microspheres and PNIPAM containing gefitinib. While six mice per group
122
would achieve statistically significant results and allow for mice to be dropped from the study, a
30% better precision and narrowed confidence intervals would be achieved with eight mice per
group. Tumor growth rate would be measured and the extent of necrosis in each tumor calculated
histologically to determine the effect of each treatment.
Another potential study that could be conducted is a pilot study to determine the extent of drug
diffusion released from the polymeric microspheres-PNIPAM system in a rat brain. One of the
draw backs of the Gliadel® wafers is the poor penetration of BCNU (carmustine) in the brain.
When implanted intracranially, there is a steep concentration gradient between the tissue
surrounding the implant and the rest of the brain [5, 143]. For a rat model, a high concentration
(~ 1 mM) was found as far away as 5 mm from the implant in the first day [144]. However, this
rapidly declined to 1 mm for days 3-14 due to the rapid elimination of the drug, limiting the
diffusion of BCNU in the brain. The DREAM BIG Therapy would need to match if not exceed
this penetration depth to replace these wafers clinically. A basic outline of this study is as
follows: 15 Wistar male rats will have a craniotomy performed with a resection of the occipital
or right frontal lobe. Three rats will be in the control group with only a resection performed. The
remaining 12 rats will be split evenly into two groups of six, with group 1 having rhodamine B
encapsulated PLGA microspheres in PNIPAM applied in the resection cavity at one
concentration and group 2 having a higher concentration applied. Rhodamine B will be used to
determine the extent of diffusion because it is easily detected fluorescently and was already used
as a model drug for detection of polymeric microspheres injected intracranially [44]. At day 10,
20, and 30, two rats from each treated group will be sacrificed along with a rat from the control
group. The brains will be removed and sectioned to determine the extent of rhodamine B
123
diffusion. By taking a progression of samples over 30 days, the rate of diffusion into the
surrounding tissue can be determined. Rhodamine B should initially be concentrated at the site of
injection. Over time, we expect rhodamine B to be present 0.5 to 2-3 mm away from the
injection site [36, 39, 78, 144]. If both the subcutaneous tumor study and the intracranial study
yield positive results, then an intracranial tumor model would be the next logical step.
The potential of the DREAM BIG Therapy is that it provides an alternative solution to the
treatment of gliomas by using multiple microspheres types with different degradation rates and
chemotherapeutics in a thermoresponsive formulation. Multi-staged, sequential drug release
could combat tumor regrowth and tumor drug resistance long-term with a single, localized
application by the surgeon to the patient. In addition, various polymer-drug combinations could
be chosen and applied with the PNIPAM to specifically tailor a treatment based on the cancer’s
characteristics, allowing for a personalized therapeutic approach. This system is not limited to
gliomas, but could also be applied to other cancer types, such as breast and liver cancer. Other
applications could include an intramuscular, long term contraceptive or pain reliever.
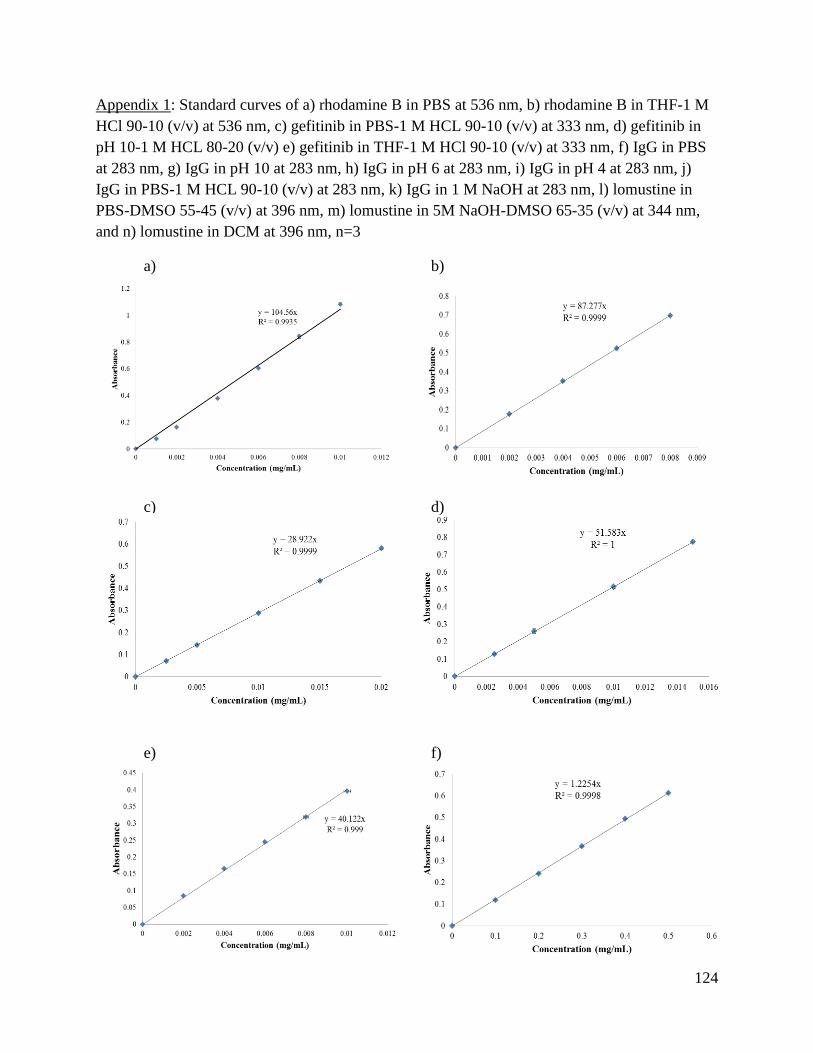
124
Appendix 1: Standard curves of a) rhodamine B in PBS at 536 nm, b) rhodamine B in THF-1 M
HCl 90-10 (v/v) at 536 nm, c) gefitinib in PBS-1 M HCL 90-10 (v/v) at 333 nm, d) gefitinib in
pH 10-1 M HCL 80-20 (v/v) e) gefitinib in THF-1 M HCl 90-10 (v/v) at 333 nm, f) IgG in PBS
at 283 nm, g) IgG in pH 10 at 283 nm, h) IgG in pH 6 at 283 nm, i) IgG in pH 4 at 283 nm, j)
IgG in PBS-1 M HCL 90-10 (v/v) at 283 nm, k) IgG in 1 M NaOH at 283 nm, l) lomustine in
PBS-DMSO 55-45 (v/v) at 396 nm, m) lomustine in 5M NaOH-DMSO 65-35 (v/v) at 344 nm,
and n) lomustine in DCM at 396 nm, n=3
a) b)
c) d)
e) f)
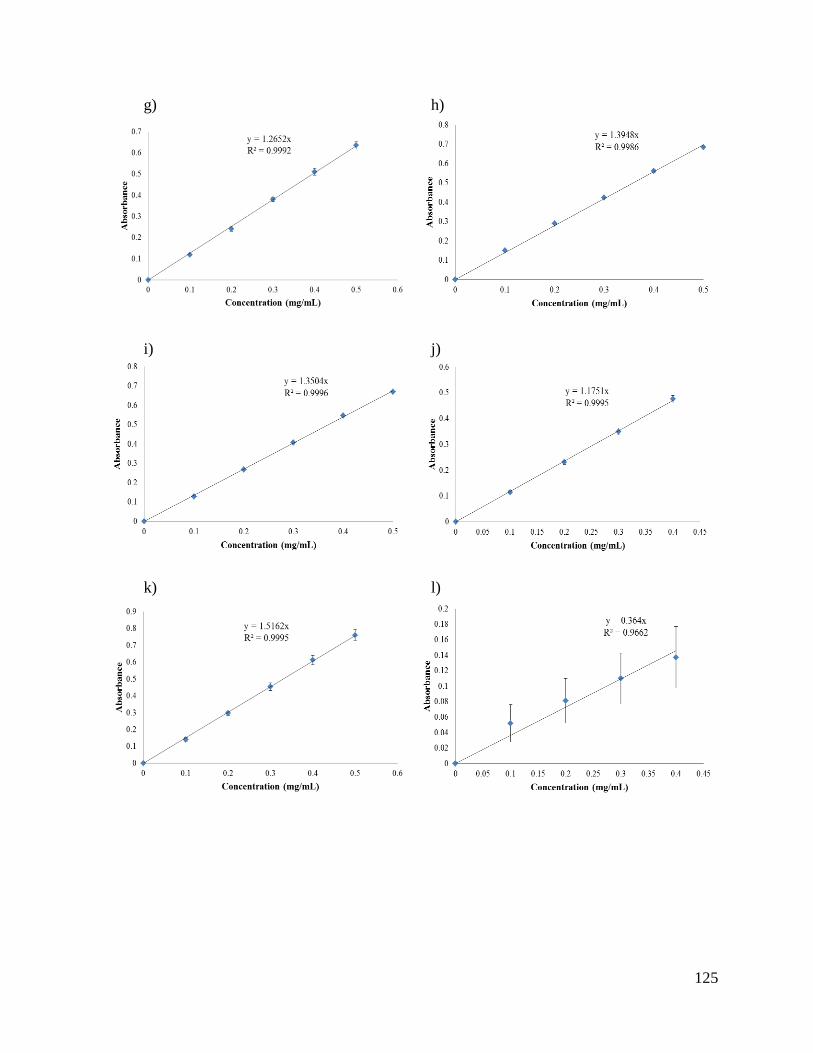
125
g) h)
i) j)
k) l)
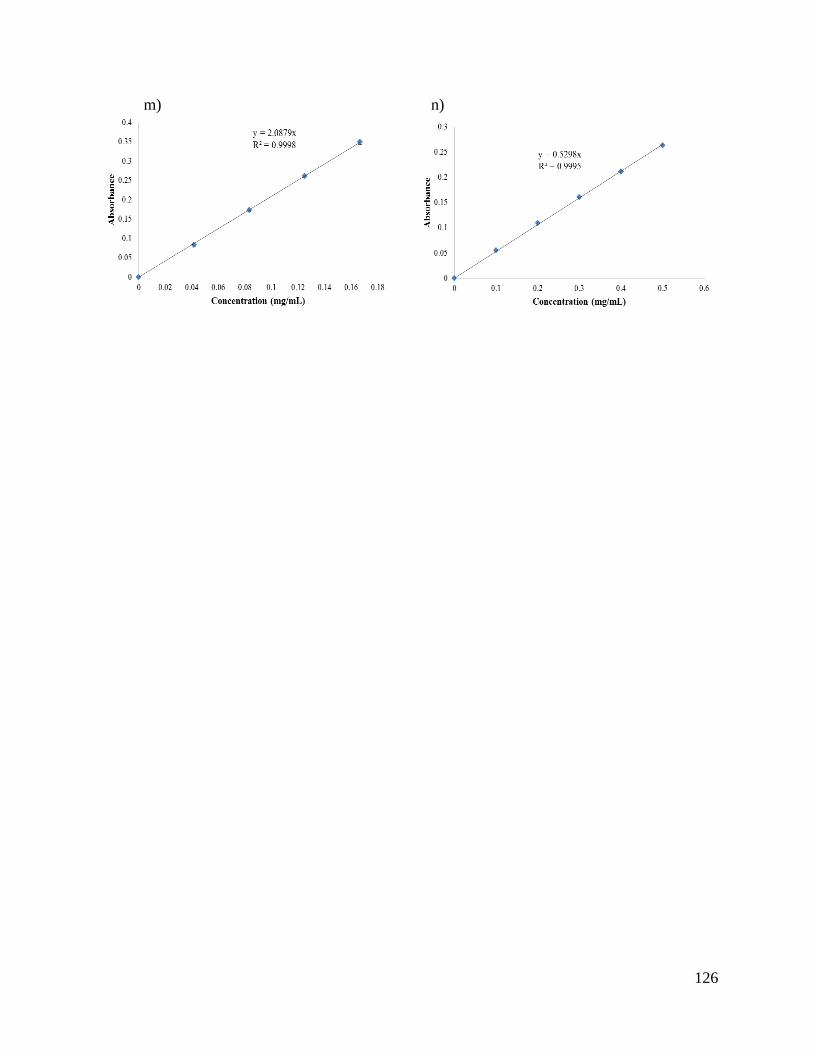
126
m) n)
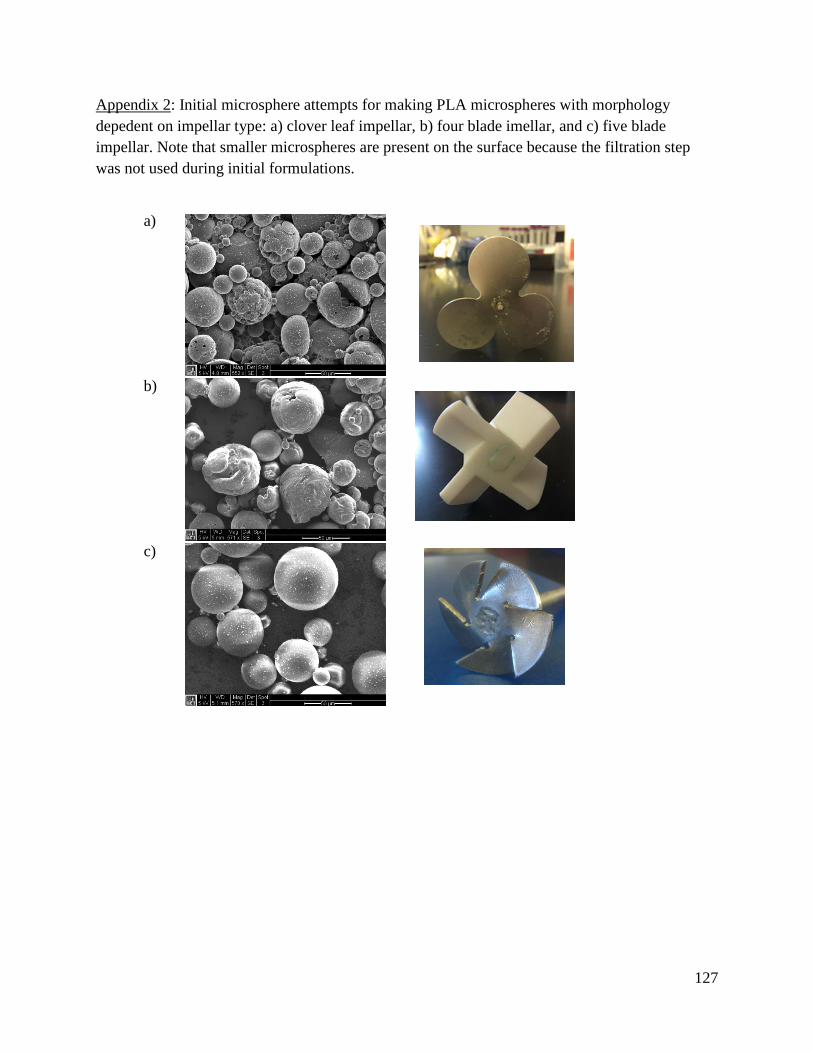
127
Appendix 2: Initial microsphere attempts for making PLA microspheres with morphology
depedent on impellar type: a) clover leaf impellar, b) four blade imellar, and c) five blade
impellar. Note that smaller microspheres are present on the surface because the filtration step
was not used during initial formulations.
a)
b)
c)
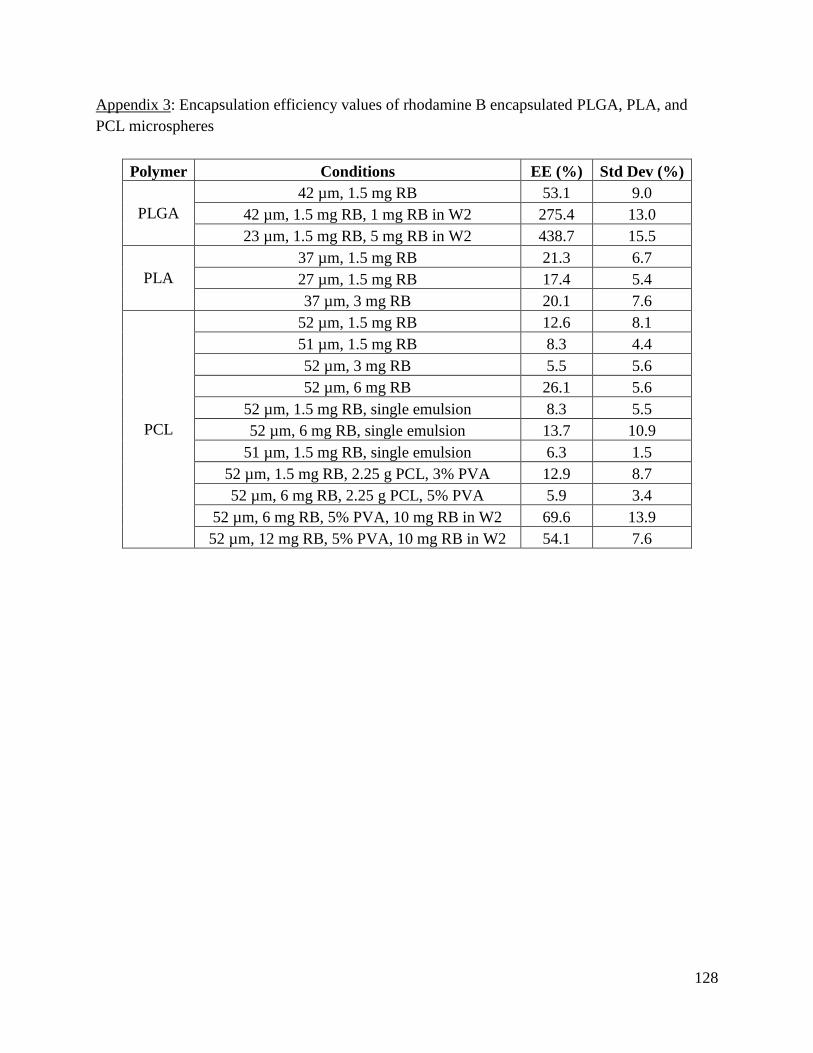
128
Appendix 3: Encapsulation efficiency values of rhodamine B encapsulated PLGA, PLA, and
PCL microspheres
Polymer Conditions EE (%) Std Dev (%)
PLGA
42 µm, 1.5 mg RB 53.1 9.0
42 µm, 1.5 mg RB, 1 mg RB in W2 275.4 13.0
23 µm, 1.5 mg RB, 5 mg RB in W2 438.7 15.5
PLA
37 µm, 1.5 mg RB 21.3 6.7
27 µm, 1.5 mg RB 17.4 5.4
37 µm, 3 mg RB 20.1 7.6
PCL
52 µm, 1.5 mg RB 12.6 8.1
51 µm, 1.5 mg RB 8.3 4.4
52 µm, 3 mg RB 5.5 5.6
52 µm, 6 mg RB 26.1 5.6
52 µm, 1.5 mg RB, single emulsion 8.3 5.5
52 µm, 6 mg RB, single emulsion 13.7 10.9
51 µm, 1.5 mg RB, single emulsion 6.3 1.5
52 µm, 1.5 mg RB, 2.25 g PCL, 3% PVA 12.9 8.7
52 µm, 6 mg RB, 2.25 g PCL, 5% PVA 5.9 3.4
52 µm, 6 mg RB, 5% PVA, 10 mg RB in W2 69.6 13.9
52 µm, 12 mg RB, 5% PVA, 10 mg RB in W2 54.1 7.6
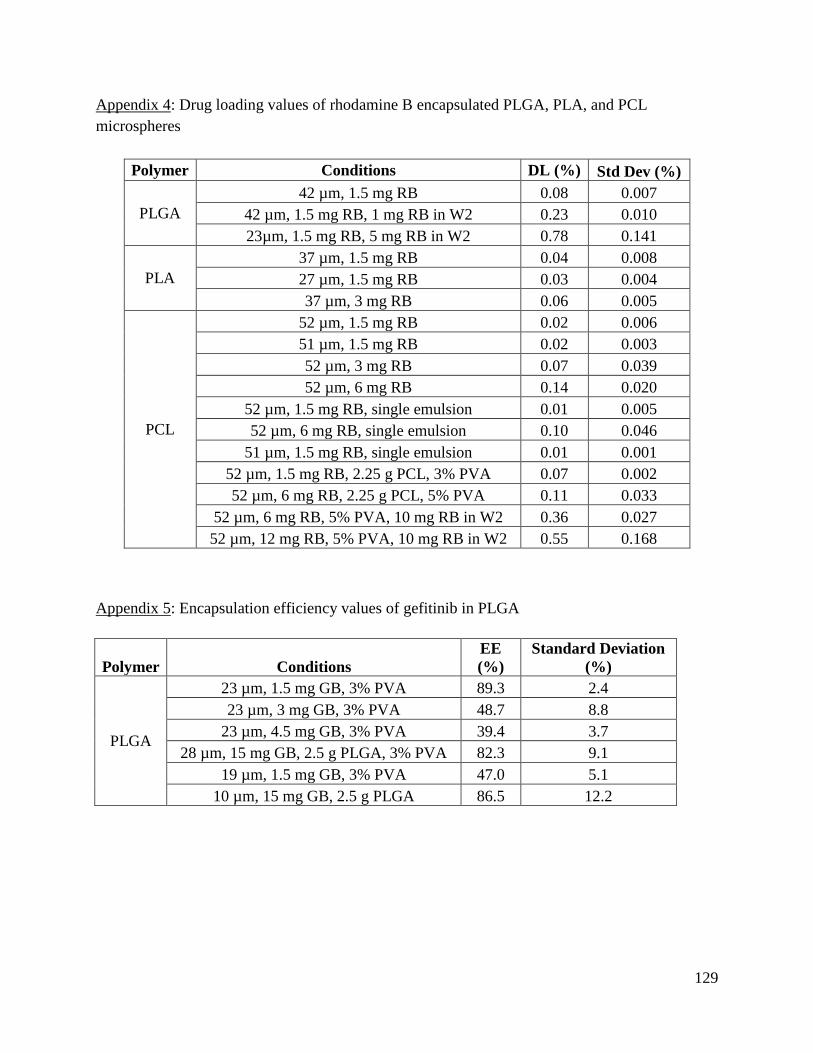
129
Appendix 4: Drug loading values of rhodamine B encapsulated PLGA, PLA, and PCL
microspheres
Polymer Conditions DL (%) Std Dev (%)
PLGA
42 µm, 1.5 mg RB 0.08 0.007
42 µm, 1.5 mg RB, 1 mg RB in W2 0.23 0.010
23µm, 1.5 mg RB, 5 mg RB in W2 0.78 0.141
PLA
37 µm, 1.5 mg RB 0.04 0.008
27 µm, 1.5 mg RB 0.03 0.004
37 µm, 3 mg RB 0.06 0.005
PCL
52 µm, 1.5 mg RB 0.02 0.006
51 µm, 1.5 mg RB 0.02 0.003
52 µm, 3 mg RB 0.07 0.039
52 µm, 6 mg RB 0.14 0.020
52 µm, 1.5 mg RB, single emulsion 0.01 0.005
52 µm, 6 mg RB, single emulsion 0.10 0.046
51 µm, 1.5 mg RB, single emulsion 0.01 0.001
52 µm, 1.5 mg RB, 2.25 g PCL, 3% PVA 0.07 0.002
52 µm, 6 mg RB, 2.25 g PCL, 5% PVA 0.11 0.033
52 µm, 6 mg RB, 5% PVA, 10 mg RB in W2 0.36 0.027
52 µm, 12 mg RB, 5% PVA, 10 mg RB in W2 0.55 0.168
Appendix 5: Encapsulation efficiency values of gefitinib in PLGA
Polymer Conditions
EE
(%)
Standard Deviation
(%)
PLGA
23 µm, 1.5 mg GB, 3% PVA 89.3 2.4
23 µm, 3 mg GB, 3% PVA 48.7 8.8
23 µm, 4.5 mg GB, 3% PVA 39.4 3.7
28 µm, 15 mg GB, 2.5 g PLGA, 3% PVA 82.3 9.1
19 µm, 1.5 mg GB, 3% PVA 47.0 5.1
10 µm, 15 mg GB, 2.5 g PLGA 86.5 12.2
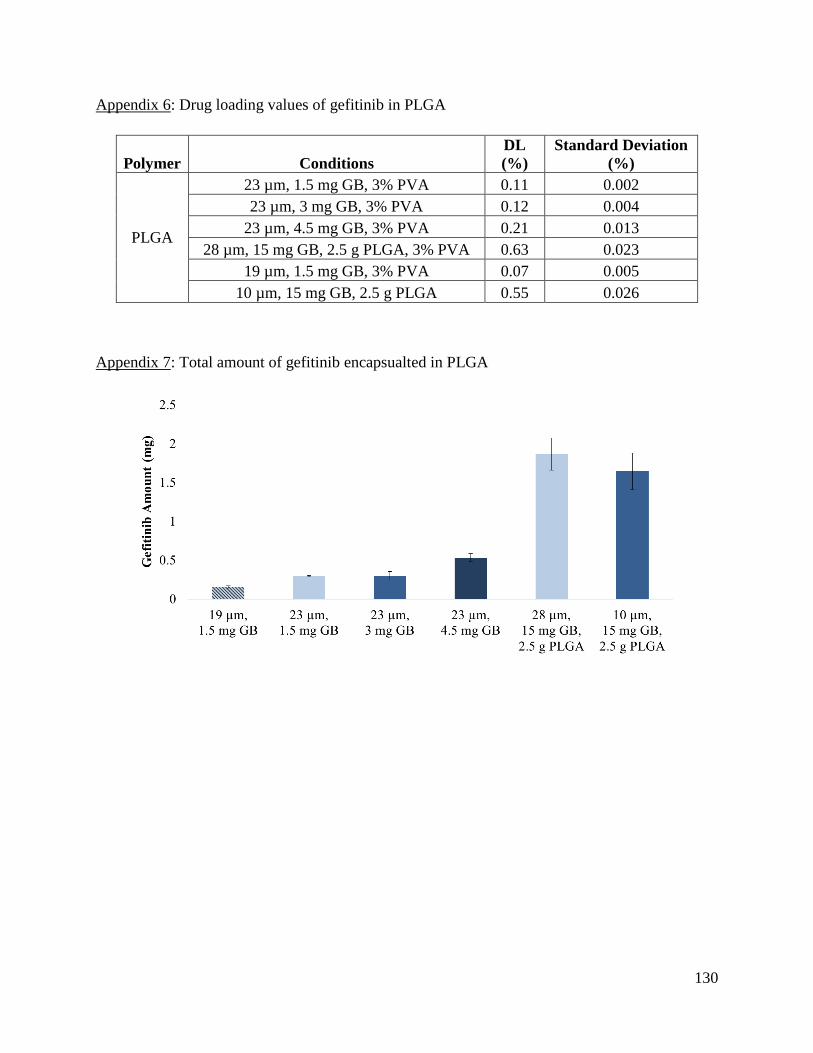
130
Appendix 6: Drug loading values of gefitinib in PLGA
Polymer Conditions
DL
(%)
Standard Deviation
(%)
PLGA
23 µm, 1.5 mg GB, 3% PVA 0.11 0.002
23 µm, 3 mg GB, 3% PVA 0.12 0.004
23 µm, 4.5 mg GB, 3% PVA 0.21 0.013
28 µm, 15 mg GB, 2.5 g PLGA, 3% PVA 0.63 0.023
19 µm, 1.5 mg GB, 3% PVA 0.07 0.005
10 µm, 15 mg GB, 2.5 g PLGA 0.55 0.026
Appendix 7: Total amount of gefitinib encapsualted in PLGA

131
Appendix 8: Encapsulation efficiency values of IgG in PLA
Polymer Conditions
EE
(%)
Std Dev
(%)
PLA
11 µm, 3 mg IgG, 3% PVA 17.8 4.1
11µm, 15 mg IgG, 3% PVA 35.8 8.5
11 µm, 3 mg IgG, 30 mL W2, 5% PVA 45.7 15.1
11 µm, 12 mg IgG, 30 mL W2, 5% PVA 29.8 6.3
11 µm, 3 mg IgG, 30 mL W2, 5% PVA, 5 mg IgG in W2 105.0 10.0
11 µm, 7.5 mg IgG, 30 mL W2, 5% PVA, 5 mg IgG in W2 45.9 6.4
11 µm, 7.5 mg IgG, 30 mL W2, 5% PVA, 10 mg IgG in W2 88.4 12.1
43 µm, 7.5 mg IgG, 30 mL W2, 5% PVA, 10 mg IgG in W2 34.4 10.5
11 µm, 3 mg IgG, 2 g PLA, 3% PVA 23.3 1.5
11 µm, 3 mg IgG, 2 g PLA, 3% PVA 24.6 1.9
Appendix 9: Drug loading values of IgG in PLA
Polymer Conditions
DL
(%)
Std Dev
(%)
PLA
11 µm, 3 mg IgG, 3% PVA 0.05 0.01
11 µm, 15 mg IgG, 3% PVA 0.23 0.03
11 µm, 3 mg IgG, 30 mL W2, 5% PVA 0.07 0.02
11 µm, 12 mg IgG, 30 mL W2, 5% PVA 0.24 0.06
11 µm, 3 mg IgG, 30 mL W2, 5% PVA, 5 mg IgG in W2 0.13 0.01
11 µm, 7.5 mg IgG, 30 mL W2, 5% PVA, 5 mg IgG in W2 0.19 0.03
11 µm, 7.5 mg IgG, 30 mL W2, 5% PVA, 10 mg IgG in W2 0.32 0.05
43 µm, 7.5 mg IgG, 30 mL W2, 5% PVA, 10 mg IgG in W2 0.13 0.03
11 µm, 3 mg IgG, 2 g PLA, 3% PVA 0.04 0.00
11 µm, 3 mg IgG, 2 g PLA, 3% PVA 0.24 0.02
132
Appendix 10: Total amount of IgG encapsualted in PLA
Appendix 11: Encapsulation efficiency values of LMT encapsulated in PCL
Polymer Conditions
EE
(%)
Std Dev
(%)
PCL
31 µm, 1.5 mg LMT, 3% PVA 18.1 0.7
31 µm, 3 mg LMT, 3% PVA 12.6 0.4
31 µm, 6 mg LMT, 3% PVA 17.6 2.8
31 µm, 9 mg LMT, 3% PVA 15.6 1.2
31 µm, 15 mg LMT, 3% PVA 18.0 1.8
31 µm, 15 mg LMT, 5 mg in W2, 3% PVA 24.2 2.4
31 µm, 3 mg LMT, 30 mL W2, 5% PVA 34.0 3.3
31 µm, 15 mg LMT, 30 mL W2, 5% PVA 34.1 1.1
31 µm, 3 mg LMT, 30 mL W2, 5% PVA, 5 mg LMT in W2 291.2 36.3
31 µm, 15 mg LMT, 30 mL W2, 5% PVA, 5 mg LMT in W2 101.6 11.5
31 µm, 3 mg LMT, 2.5 g PCL, 5% PVA 22.0 2.1
31 µm, 15 mg LMT, 2.5 g PCL, 5% PVA 21.1 7.2
3560 rpm, 3 mg LMT, 3% PVA 13.2 2.8
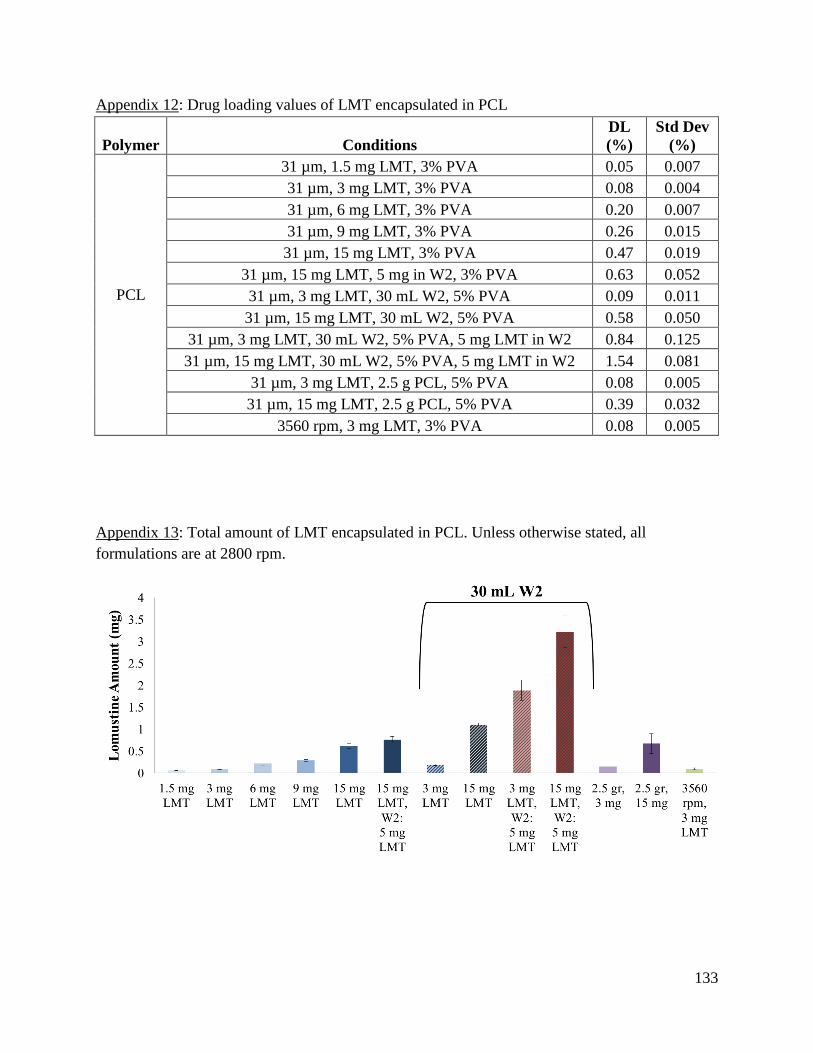
133
Appendix 12: Drug loading values of LMT encapsulated in PCL
Polymer Conditions
DL
(%)
Std Dev
(%)
PCL
31 µm, 1.5 mg LMT, 3% PVA 0.05 0.007
31 µm, 3 mg LMT, 3% PVA 0.08 0.004
31 µm, 6 mg LMT, 3% PVA 0.20 0.007
31 µm, 9 mg LMT, 3% PVA 0.26 0.015
31 µm, 15 mg LMT, 3% PVA 0.47 0.019
31 µm, 15 mg LMT, 5 mg in W2, 3% PVA 0.63 0.052
31 µm, 3 mg LMT, 30 mL W2, 5% PVA 0.09 0.011
31 µm, 15 mg LMT, 30 mL W2, 5% PVA 0.58 0.050
31 µm, 3 mg LMT, 30 mL W2, 5% PVA, 5 mg LMT in W2 0.84 0.125
31 µm, 15 mg LMT, 30 mL W2, 5% PVA, 5 mg LMT in W2 1.54 0.081
31 µm, 3 mg LMT, 2.5 g PCL, 5% PVA 0.08 0.005
31 µm, 15 mg LMT, 2.5 g PCL, 5% PVA 0.39 0.032
3560 rpm, 3 mg LMT, 3% PVA 0.08 0.005
Appendix 13: Total amount of LMT encapsulated in PCL. Unless otherwise stated, all
formulations are at 2800 rpm.
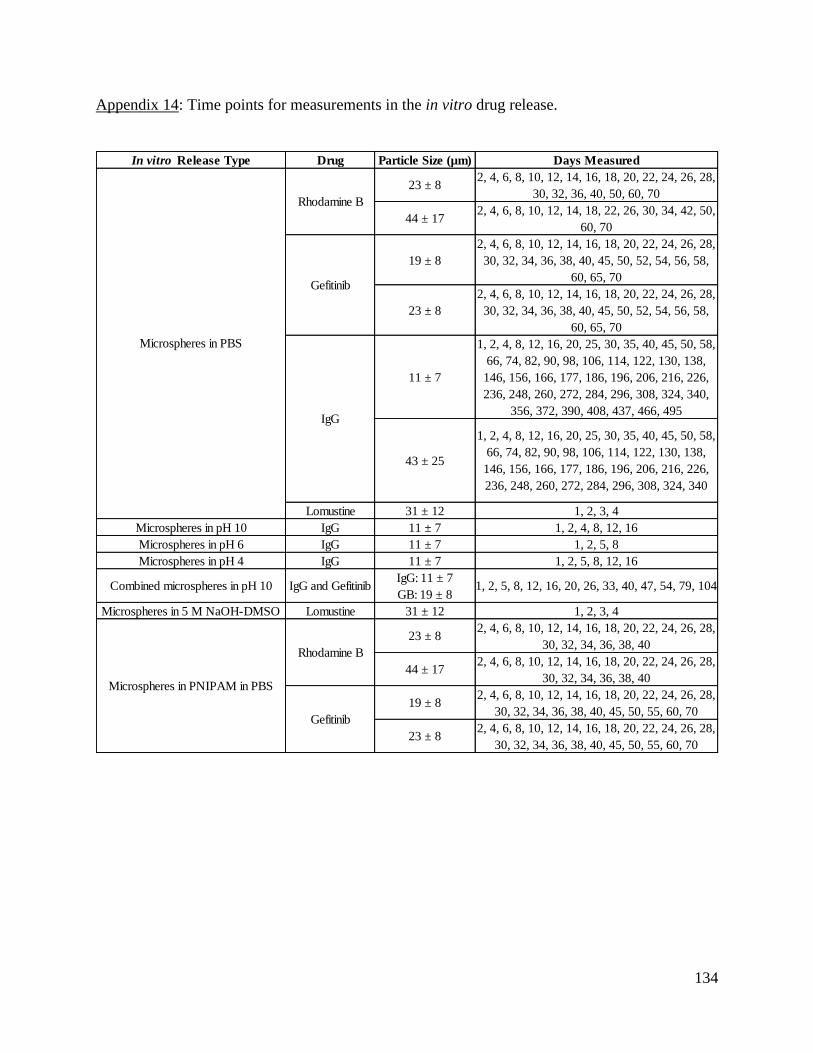
134
Appendix 14: Time points for measurements in the in vitro drug release.
In vitro Release Type Drug Particle Size (µm) Days Measured
23 ± 82, 4, 6, 8, 10, 12, 14, 16, 18, 20, 22, 24, 26, 28,
30, 32, 36, 40, 50, 60, 70
44 ± 172, 4, 6, 8, 10, 12, 14, 18, 22, 26, 30, 34, 42, 50,
60, 70
19 ± 8
2, 4, 6, 8, 10, 12, 14, 16, 18, 20, 22, 24, 26, 28,
30, 32, 34, 36, 38, 40, 45, 50, 52, 54, 56, 58,
60, 65, 70
23 ± 8
2, 4, 6, 8, 10, 12, 14, 16, 18, 20, 22, 24, 26, 28,
30, 32, 34, 36, 38, 40, 45, 50, 52, 54, 56, 58,
60, 65, 70
11 ± 7
1, 2, 4, 8, 12, 16, 20, 25, 30, 35, 40, 45, 50, 58,
66, 74, 82, 90, 98, 106, 114, 122, 130, 138,
146, 156, 166, 177, 186, 196, 206, 216, 226,
236, 248, 260, 272, 284, 296, 308, 324, 340,
356, 372, 390, 408, 437, 466, 495
43 ± 25
1, 2, 4, 8, 12, 16, 20, 25, 30, 35, 40, 45, 50, 58,
66, 74, 82, 90, 98, 106, 114, 122, 130, 138,
146, 156, 166, 177, 186, 196, 206, 216, 226,
236, 248, 260, 272, 284, 296, 308, 324, 340
Lomustine 31 ± 12 1, 2, 3, 4
Microspheres in pH 10 IgG 11 ± 7 1, 2, 4, 8, 12, 16
Microspheres in pH 6 IgG 11 ± 7 1, 2, 5, 8
Microspheres in pH 4 IgG 11 ± 7 1, 2, 5, 8, 12, 16
Combined microspheres in pH 10 IgG and GefitinibIgG: 11 ± 7
GB: 19 ± 81, 2, 5, 8, 12, 16, 20, 26, 33, 40, 47, 54, 79, 104
Microspheres in 5 M NaOH-DMSO Lomustine 31 ± 12 1, 2, 3, 4
23 ± 82, 4, 6, 8, 10, 12, 14, 16, 18, 20, 22, 24, 26, 28,
30, 32, 34, 36, 38, 40
44 ± 172, 4, 6, 8, 10, 12, 14, 16, 18, 20, 22, 24, 26, 28,
30, 32, 34, 36, 38, 40
19 ± 82, 4, 6, 8, 10, 12, 14, 16, 18, 20, 22, 24, 26, 28,
30, 32, 34, 36, 38, 40, 45, 50, 55, 60, 70
23 ± 82, 4, 6, 8, 10, 12, 14, 16, 18, 20, 22, 24, 26, 28,
30, 32, 34, 36, 38, 40, 45, 50, 55, 60, 70
Rhodamine B
Gefitinib
Rhodamine B
Gefitinib
Microspheres in PNIPAM in PBS
IgG
Microspheres in PBS
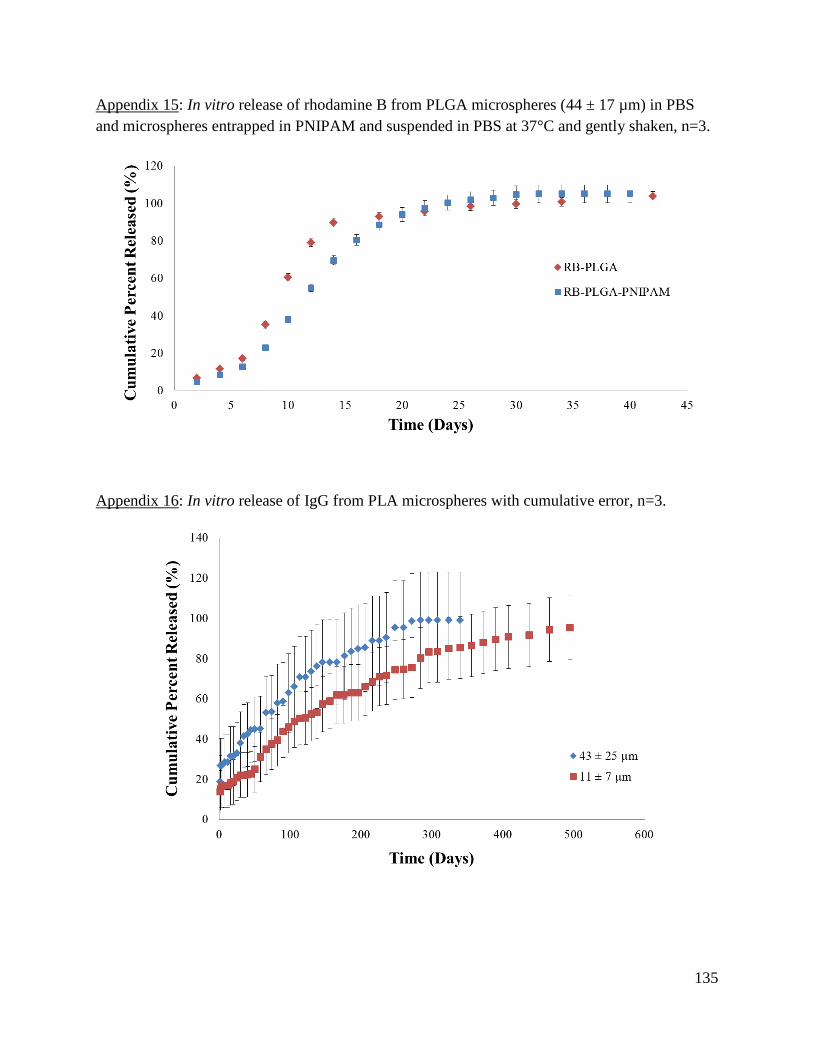
135
Appendix 15: In vitro release of rhodamine B from PLGA microspheres (44 ± 17 µm) in PBS
and microspheres entrapped in PNIPAM and suspended in PBS at 37°C and gently shaken, n=3.
Appendix 16: In vitro release of IgG from PLA microspheres with cumulative error, n=3.
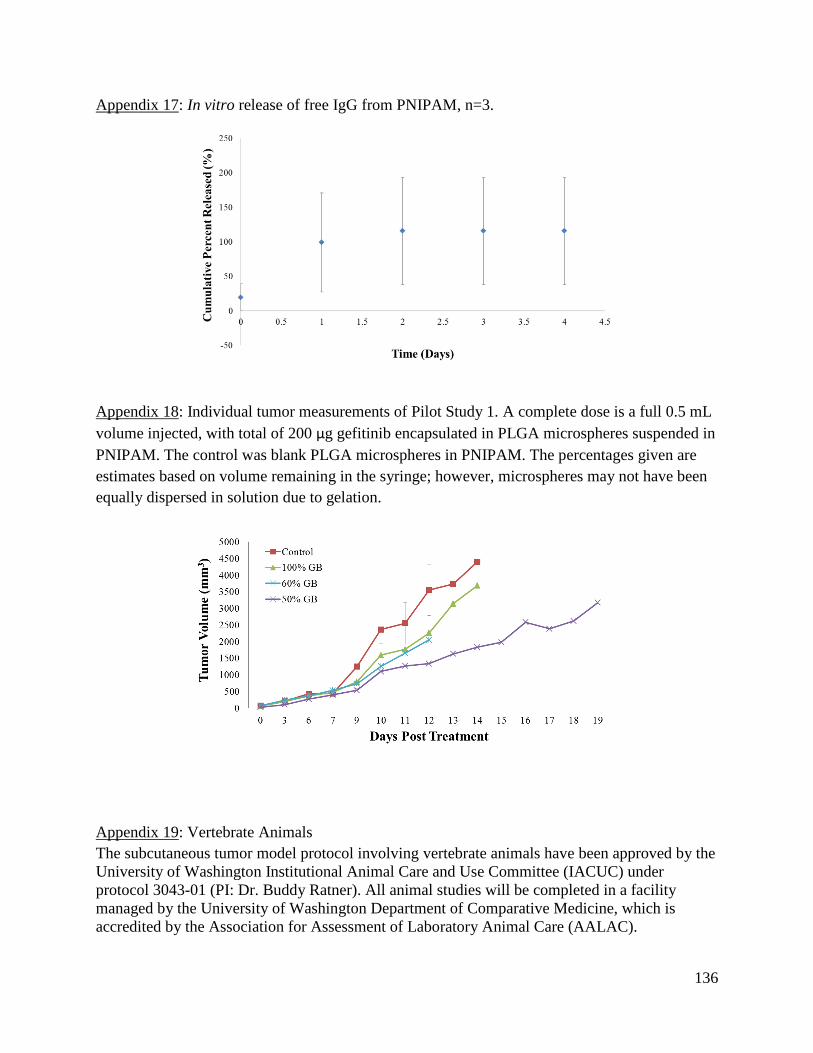
136
Appendix 17: In vitro release of free IgG from PNIPAM, n=3.
Appendix 18: Individual tumor measurements of Pilot Study 1. A complete dose is a full 0.5 mL
volume injected, with total of 200 µg gefitinib encapsulated in PLGA microspheres suspended in
PNIPAM. The control was blank PLGA microspheres in PNIPAM. The percentages given are
estimates based on volume remaining in the syringe; however, microspheres may not have been
equally dispersed in solution due to gelation.
Appendix 19: Vertebrate Animals
The subcutaneous tumor model protocol involving vertebrate animals have been approved by the
University of Washington Institutional Animal Care and Use Committee (IACUC) under
protocol 3043-01 (PI: Dr. Buddy Ratner). All animal studies will be completed in a facility
managed by the University of Washington Department of Comparative Medicine, which is
accredited by the Association for Assessment of Laboratory Animal Care (AALAC).
137
6 References
[1] Howlader N, N. A., Krapcho M, Neyman N, Aminou R, Altekruse SF, Kosary CL, Ruhl
J, Tatalovich Z, Cho H, Mariotto A, Eisner MP, Lewis DR, Chen HS, Feuer EJ, Cronin KA
(eds), April 2012 "SEER Cancer Statistics Review, 1975-2009 (Vintage 2009 Populations),"
http://seer.cancer.gov/csr/1975_2009_pops09/ </csr/1975_2009_pops09/>
[2] 2015, "Cancer Facts & Figures 2015," American Cancer Society, ed.Atlanta, GA.
[3] Holland, E. C., 2000, "Glioblastoma multiforme: The terminator," Proceedings of the
National Academy of Sciences of the United States of America, 97(12), pp. 6242-6244.
[4] Van Meir, E. G., Hadjipanayis, C. G., Norden, A. D., Shu, H. K., Wen, P. Y., and Olson,
J. J., 2010, "Exciting New Advances in Neuro-Oncology The Avenue to a Cure for Malignant
Glioma," Ca-a Cancer Journal for Clinicians, 60(3), pp. 166-193.
[5] Buonerba, C., Di Lorenzo, G., Marinelli, A., Federico, P., Palmieri, G., Imbimbo, M.,
Conti, P., Peluso, G., De Placido, S., and Sampson, J. H., 2011, "A comprehensive outlook on
intracerebral therapy of malignant gliomas," Crit Rev Oncol Hematol, 80(1), pp. 54-68.
[6] National Cancer Institute, 2009, "What You Need To Know About Brain Tumors."
[7] Hochberg, F. H., and Pruitt, A., 1980, "Assumptions in the radiotherapy of glioblastoma,"
Neurology, 30(9), pp. 907-911.
[8] Athanassiou, H., Synodinou, M., Maragoudakis, E., Paraskevaidis, M., Verigos, C.,
Misailidou, D., Antonadou, D., Saris, G., Beroukas, K., and Karageorgis, P., 2005, "Randomized
phase II study of temozolomide and radiotherapy compared with radiotherapy alone in newly
diagnosed glioblastoma multiforme," J Clin Oncol, 23(10), pp. 2372-2377.
[9] Dang, W. B., Daviau, T., Ying, P., Zhao, Y., Nowotnik, D., Clow, C. S., Tyler, B., and
Brem, H., 1996, "Effects of GLIADEL(R) wafer initial molecular weight on the erosion of wafer
and release of BCNU," Journal of Controlled Release, 42(1), pp. 83-92.
[10] Westphal, M., Hilt, D. C., Bortey, E., Delavault, P., Olivares, R., Warnke, P. C., Whittle,
I. R., Jaaskelainen, J., and Ram, Z., 2003, "A phase 3 trial of local chemotherapy with
biodegradable carmustine (BCNU) wafers (Gliadel wafers) in patients with primary malignant
glioma," Neuro Oncol, 5(2), pp. 79-88.
[11] Attenello, F. J., Mukherjee, D., Datoo, G., McGirt, M. J., Bohan, E., Weingart, J. D.,
Olivi, A., Quinones-Hinojosa, A., and Brem, H., 2008, "Use of Gliadel (BCNU) wafer in the
surgical treatment of malignant glioma: A 10-year institutional experience," Annals of Surgical
Oncology, 15(10), pp. 2887-2893.
[12] Alam, M. I., Beg, S., Samad, A., Baboota, S., Kohli, K., Ali, J., Ahuja, A., and Akbar,
M., 2010, "Strategy for effective brain drug delivery," European Journal of Pharmaceutical
Sciences, 40(5), pp. 385-403.
[13] Groothuis, D. R., 2000, "The blood-brain and blood-tumor barriers:
A review of strategies for increasing drug
delivery," Neuro Oncol, 2(1), pp. 45-59.
[14] Orive, G., Ali, O. A., Anitua, E., Pedraz, J. L., and Emerich, D. F., 2010, "Biomaterial-
based technologies for brain anti-cancer therapeutics and imaging," Biochimica Et Biophysica
Acta-Reviews on Cancer, 1806(1), pp. 96-107.
[15] Bredel, M., and Zentner, J., 2002, "Brain-tumour drug resistance: the bare essentials,"
Lancet Oncology, 3(7), pp. 397-406.
138
[16] Wolinsky, J. B., Colson, Y. L., and Grinstaff, M. W., 2012, "Local drug delivery
strategies for cancer treatment: Gels, nanoparticles, polymeric films, rods, and wafers," Journal
of Controlled Release, 159(1), pp. 14-26.
[17] American Cancer Society, 2013, "Brain and Spinal Cord Tumors in Children."
[18] Clarke, J., Butowski, N., and Chang, S., 2010, "Recent Advances in Therapy for
Glioblastoma," Archives of Neurology, 67(3), pp. 279-283.
[19] Sawyer, A. J., Piepmeier, J. M., and Saltzman, W. M., 2006, "New methods for direct
delivery of chemotherapy for treating brain tumors," Yale J Biol Med, 79(3-4), pp. 141-152.
[20] Guerin, C., Olivi, A., Weingart, J. D., Lawson, H. C., and Brem, H., 2004, "Recent
advances in brain tumor therapy: local intracerebral drug delivery by polymers," Investigational
New Drugs, 22(1), pp. 27-37.
[21] Allhenn, D., Boushehri, M. A. S., and Lamprecht, A., 2012, "Drug delivery strategies for
the treatment of malignant gliomas," International Journal of Pharmaceutics, 436(1-2), pp. 299-
310.
[22] Bidros, D. S., and Vogelbaum, M. A., 2009, "Novel Drug Delivery Strategies in Neuro-
Oncology," Neurotherapeutics, 6(3), pp. 539-546.
[23] Zhang, D. Y., Tian, A., Xue, X. X., Wang, M., Qiu, B., and Wu, A. H., 2012, "The Effect
of Temozolomide/Poly(lactide-co-glycolide) (PLGA)/Nano-Hydroxyapatite Microspheres on
Glioma U87 Cells Behavior," International Journal of Molecular Sciences, 13(1), pp. 1109-1125.
[24] Ranganath, S. H., Kee, I., Krantz, W. B., Chow, P. K. H., and Wang, C. H., 2009,
"Hydrogel Matrix Entrapping PLGA-Paclitaxel Microspheres: Drug Delivery with Near Zero-
Order Release and Implantability Advantages for Malignant Brain Tumour Chemotherapy,"
Pharmaceutical Research, 26(9), pp. 2101-2114.
[25] Pradilla, G., Wang, P. P., Gabikian, P., Li, K., Magee, C. A., Walter, K. A., and Brem,
H., 2006, "Local intracerebral administration of paclitaxel with the Paclimer (R) delivery system:
toxicity study in a canine model," Journal of Neuro-Oncology, 76(2), pp. 131-138.
[26] Lemaire, L., Roullin, V. G., Franconi, F., Venier-Julienne, M. C., Menei, P., Jallet, P., Le
Jeune, J. J., and Benoit, J. P., 2001, "Therapeutic efficacy of 5-fluorouracil-loaded microspheres
on rat glioma: a magnetic resonance imaging study," Nmr in Biomedicine, 14(6), pp. 360-366.
[27] Elkharraz, K., Faisant, N., Guse, C., Siepmann, F., Arica-Yegin, B., Oger, J. M., Gust, R.,
Goepferich, A., Benoit, J. P., and Siepmann, J., 2006, "Paclitaxel-loaded microparticles and
implants for the treatment of brain cancer: Preparation and physicochemical characterization,"
International Journal of Pharmaceutics, 314(2), pp. 127-136.
[28] Zhang, H., and Gao, S., 2007, "Temozolomide/PLGA microparticles and antitumor
activity against Glioma C6 cancer cells in vitro," International Journal of Pharmaceutics, 329(1-
2), pp. 122-128.
[29] Zhang, Y. H., Yue, Z. J., Zhang, H., Tang, G. S., Wang, Y., and Liu, J. M., 2010,
"Temozolomide/PLGA microparticles plus vatalanib inhibits tumor growth and angiogenesis in
an orthotopic glioma model," European Journal of Pharmaceutics and Biopharmaceutics, 76(3),
pp. 371-375.
[30] Gil-Alegre, M. E., Gonzalez-Alvarez, I., Gutierrez-Pauls, L., and Torres-Suarez, A. I.,
2008, "Three weeks release BCNU loaded hydrophilic-PLGA microspheres for interstitial
chemotherapy: Development and activity against human glioblastoma cells," Journal of
Microencapsulation, 25(8), pp. 561-568.
139
[31] Chen, W., and Lu, D. R., 1999, "Carboplatin-loaded PLGA microspheres for
intracerebral injection: formulation and characterization," Journal of Microencapsulation, 16(5),
pp. 551-563.
[32] Menei, P., BoisdronCelle, M., Croue, A., Guy, G., and Benoit, J. P., 1996, "Effect of
stereotactic implantation of biodegradable 5-fluorouracil-loaded microspheres in healthy and C6
glioma-bearing rats," Neurosurgery, 39(1), pp. 117-123.
[33] Menei, P., Capelle, L., Guyotat, J., Fuentes, S., Assaker, R., Bataille, B., Francois, P.,
Dorwling-Carter, D., Paquis, P., Bauchet, L., Parker, F., Sabatier, J., Faisant, N., and Benoit, J.
P., 2005, "Local and sustained delivery of 5-fluorouracil from biodegradable microspheres for
the radiosensitization of malignant glioma: A randomized phase II trial," Neurosurgery, 56(2),
pp. 242-247.
[34] Menei, P., Jadaud, E., Faisant, N., Boisdron-Celle, M., Michalak, S., Fournier, D.,
Delhaye, M., and Benoit, J. P., 2004, "Stereotaxic implantation of 5-fluorouracil-releasing
microspheres in malignant glioma - A phase I study," Cancer, 100(2), pp. 405-410.
[35] Fournier, E., Passirani, C., Montero-Menei, C., Colin, N., Breton, P., Sagodira, S., Menei,
P., and Benoit, J. P., 2003, "Therapeutic effectiveness of novel 5-fluorouracil-loaded
poly(methylidene malonate 2.1.2)-based microspheres on F98 glioma-bearing rats," Cancer,
97(11), pp. 2822-2829.
[36] Roullin, V. G., Deverre, J. R., Lemaire, L., Hindre, F., Venier-Julienne, M. C., Vienet,
R., and Benoit, J. P., 2002, "Anti-cancer drug diffusion within living rat brain tissue: an
experimental study using [H-3](6)-5-fluorouracil-loaded PLGA microspheres," European Journal
of Pharmaceutics and Biopharmaceutics, 53(3), pp. 293-299.
[37] Reza, M. S., and Whateley, T. L., 1998, "Iodo-2 '-deoxyuridine (IUdR) and (125)IUdR
loaded biodegradable microspheres for controlled delivery to the brain," Journal of
Microencapsulation, 15(6), pp. 789-801.
[38] Emerich, D. F., Winn, S. R., and Bartus, R. T., 2001, "Injection of chemotherapeutic
microspheres and glioma IV: Eradicating tumors in rats," Cell Transplantation, 11(1), pp. 47-54.
[39] Emerich, D. F., Winn, S. R., Hu, Y. H., Marsh, J., Snodgrass, P., LaFreniere, D., Wiens,
T., Hasler, B. P., and Bartus, R. T., 2000, "Injectable chemotherapeutic microspheres and glioma
I: Enhanced survival following implantation into the cavity wall of debulked tumors,"
Pharmaceutical Research, 17(7), pp. 767-775.
[40] Emerich, D. F., Winn, S. R., Snodgrass, P., LaFreniere, D., Agostino, M., Wiens, T.,
Xiong, H., and Bartus, R. T., 2000, "Injectable chemotherapeutic microspheres and glioma II:
Enhanced survival following implantation into deep inoperable tumors," Pharmaceutical
Research, 17(7), pp. 776-781.
[41] Fournier, E., Passirani, C., Colin, N., Breton, P., Sagodira, S., and Benoit, J. P., 2004,
"Development of novel 5-FU-loaded poly(methylidene malonate 2.1.2)-based microspheres for
the treatment of brain cancers," European Journal of Pharmaceutics and Biopharmaceutics,
57(2), pp. 189-197.
[42] Boisdroncelle, M., Menei, P., and Benoit, J. P., 1995, "Preparation and Characterization
of 5-Fluorouracil-Loaded Microparticles as Biodegradable Anticancer Drug Carriers," Journal of
Pharmacy and Pharmacology, 47(2), pp. 108-114.
[43] Benny, O., Duvshani-Eshet, M., Cargioli, T., Bello, L., Bikfalvi, A., Carroll, R. S., and
Machluf, M., 2005, "Continuous delivery of endogenous inhibitors from poly (lactic-co-glycolic
acid) polymeric microspheres inhibits glioma tumor growth," Clinical Cancer Research, 11(2),
pp. 768-776.

140
[44] Benny, O., Kim, S. K., Gvili, K., Radzishevsky, I. S., Mor, A., Verduzco, L., Menon, L.
G., Black, P. M., Machluf, M., and Carroll, R. S., 2008, "In vivo fate and therapeutic efficacy of
PF-4/CTF microspheres in an orthotopic human glioblastoma model," Faseb Journal, 22(2), pp.
488-499.
[45] Benny, O., Menon, L. G., Arid, G., Goren, E., Kim, S. K., Stewman, C., Black, P. M.,
Carroll, R. S., and Machluf, M., 2009, "Local Delivery of Poly Lactic-co-glycolic Acid
Microspheres Containing Imatinib Mesylate Inhibits Intracranial Xenograft Glioma Growth,"
Clinical Cancer Research, 15(4), pp. 1222-1231.
[46] Chandy, T., Das, G. S., and Rao, G. H. R., 2000, "5-fluorouracil-loaded chitosan coated
polylactic acid microspheres as biodegradable drug carriers for cerebral tumours," Journal of
Microencapsulation, 17(5), pp. 625-638.
[47] Ozeki, T., Hashizawa, K., Kaneko, D., Imai, Y., and Okada, H., 2010, "Treatment of rat
brain tumors using sustained-release of camptothecin from poly(lactic-co-glycolic acid)
microspheres in a thermoreversible hydrogel," Chem Pharm Bull (Tokyo), 58(9), pp. 1142-1147.
[48] Arai, T., Benny, O., Joki, T., Menon, L. G., Machluf, M., Abe, T., Carroll, R. S., and
Black, P. M., 2010, "Novel local drug delivery system using thermoreversible gel in combination
with polymeric microspheres or liposomes," Anticancer Res, 30(4), pp. 1057-1064.
[49] Hussain, M., Beale, G., Hughes, M., and Akhtar, S., 2002, "Co-delivery of an antisense
oligonucleotide and 5-fluorouracil using sustained release poly (lactide-co-glycolide)
microsphere formulations for potential combination therapy in cancer," Int J Pharm, 234(1-2),
pp. 129-138.
[50] Emerich, D. F., Winn, S. R., and Bartus, R. T., 2001, "Injection of chemotherapeutic
microspheres and glioma III: Parameters to optimize efficacy," Cell Transplantation, 11(1), pp.
35-45.
[51] Song, T. T., Yuan, X. B., Sun, A. P., Wang, H., Kang, C. S., Ren, Y., He, B., Sheng, J.,
and Pu, P. Y., 2009, "Preparation of Injectable Paclitaxel Sustained Release Microspheres by
Spray Drying for Inhibition of Glioma In Vitro," Journal of Applied Polymer Science, 115(3),
pp. 1534-1539.
[52] Lin, R., Shi Ng, L., and Wang, C. H., 2005, "In vitro study of anticancer drug
doxorubicin in PLGA-based microparticles," Biomaterials, 26(21), pp. 4476-4485.
[53] Xie, J. W., Marijnissen, J. C. M., and Wang, C. H., 2006, "Microparticles developed by
electrohyd ro dynamic atomization for the local delivery of anticancer drug to treat C6 glioma in
vitro," Biomaterials, 27(17), pp. 3321-3332.
[54] Xie, J. W., Tan, R. S., and Wang, C. H., 2008, "Biodegradable microparticles and fiber
fabrics for sustained delivery of cisplatin to treat C6 glioma in vitro," Journal of Biomedical
Materials Research Part A, 85A(4), pp. 897-908.
[55] Naraharisetti, P. K., Ong, B. Y. S., Xie, J. W., Lee, T. K. Y., Wang, C. H., and Sahinidis,
N. V., 2007, "In vivo performance of implantable biodegradable preparations delivering
Paclitaxel and Etanidazole for the treatment of glioma," Biomaterials, 28(5), pp. 886-894.
[56] Li, K. W., Dang, W. B., Tyler, B. M., Troiano, G., Tihan, T., Brem, H., and Walter, K.
A., 2003, "Polilactofate microspheres for paclitaxel delivery to central nervous system
malignancies," Clinical Cancer Research, 9(9), pp. 3441-3447.
[57] Ozeki, T., Kaneko, D., Hashizawa, K., Imai, Y., Tagami, T., and Okada, H., 2012,
"Improvement of survival in C6 rat glioma model by a sustained drug release from localized
PLGA microspheres in a thermoreversible hydrogel," International Journal of Pharmaceutics,
427(2), pp. 299-304.
141
[58] Rhines, L. D., Sampath, P., DiMeco, F., Lawson, H. C., Tyler, B. M., Hanes, J., Olivi, A.,
and Brem, H., 2003, "Local immunotherapy with interleukin-2 delivered from biodegradable
polymer microspheres combined with interstitial chemotherapy: a novel treatment for
experimental malignant glioma," Neurosurgery, 52(4), pp. 872-879; discussion 879-880.
[59] Beer, S. J., Hilfinger, J. M., and Davidson, B. L., 1997, "Extended release of adenovirus
from polymer microspheres: potential use in gene therapy for brain tumors," Adv Drug Deliv
Rev, 27(1), pp. 59-66.
[60] Beer, S. J., Matthews, C. B., Stein, C. S., Ross, B. D., Hilfinger, J. M., and Davidson, B.
L., 1998, "Poly(lactic-glycolic) acid copolymer encapsulation of recombinant adenovirus reduces
immunogenicity in vivo," Gene Therapy, 5(6), pp. 740-746.
[61] Ozeki, T., Kaneko, D., Hashizawa, K., Imai, Y., Tagami, T., and Okada, H., 2012,
"Combination Therapy of Surgical Tumor Resection with Implantation of a Hydrogel Containing
Camptothecin-Loaded Poly(lactic-co-glycolic acid) Microspheres in a C6 Rat Glioma Model,"
Biological & Pharmaceutical Bulletin, 35(4), pp. 545-550.
[62] Zhang, Y. H., Zhang, H., Liu, J. M., and Yue, Z. J., 2011, "Temozolomide/PLGA
microparticles: a new protocol for treatment of glioma in rats," Medical Oncology, 28(3), pp.
901-906.
[63] Dong, J., Zhou, G. H., Tang, D. F., Chen, Y. M., Cui, B. Q., Dai, X. L., Zhang, J. S., Lan,
Q., and Huang, Q., 2012, "Local delivery of slow-releasing temozolomide microspheres inhibits
intracranial xenograft glioma growth," Journal of Cancer Research and Clinical Oncology,
138(12), pp. 2079-2084.
[64] Hanes, J., Sills, A., Zhao, Z., Suh, K. W., Tyler, B., DiMeco, F., Brat, D. J., Choti, M. A.,
Leong, K. W., Pardoll, D. M., and Brem, H., 2001, "Controlled local delivery of interleukin-2 by
biodegradable polymers protects animals from experimental brain tumors and liver tumors,"
Pharm Res, 18(7), pp. 899-906.
[65] Hsu, W., Lesniak, M. S., Tyler, B., and Brem, H., 2005, "Local delivery of interleukin-2
and adriamycin is synergistic in the treatment of experimental malignant glioma," Journal of
Neuro-Oncology, 74(2), pp. 135-140.
[66] Freiberg, S., and Zhu, X., 2004, "Polymer microspheres for controlled drug release,"
International Journal of Pharmaceutics, 282(1-2), pp. 1-18.
[67] Edlund, U., and Albertsson, A. C., 2002, "Degradable polymer microspheres for
controlled drug delivery," Degradable Aliphatic Polyesters, 157, pp. 67-112.
[68] Park, J. H., Ye, M. L., and Park, K., 2005, "Biodegradable polymers for
microencapsulation of drugs," Molecules, 10(1), pp. 146-161.
[69] Vilos, C., and Velasquez, L. A., 2012, "Therapeutic Strategies Based on Polymeric
Microparticles," Journal of Biomedicine and Biotechnology.
[70] Hu, L., Zhang, H., and Song, W., "An overview of preparation and evaluation sustained-
release injectable microspheres," J Microencapsul.
[71] Makadia, H. K., and Siegel, S. J., "Poly Lactic-co-Glycolic Acid (PLGA) as
Biodegradable Controlled Drug Delivery Carrier," Polymers (Basel), 3(3), pp. 1377-1397.
[72] Menei, P., Venier, M. C., Gamelin, E., Saint-Andre, J. P., Hayek, G., Jadaud, E.,
Fournier, D., Mercier, P., Guy, G., and Benoit, J. P., 1999, "Local and sustained delivery of 5-
fluorouracil from biodegradable microspheres for the radiosensitization of glioblastoma - A pilot
study," Cancer, 86(2), pp. 325-330.
142
[73] Menei, P., Daniel, V., Montero-Menei, C., Brouillard, M., Pouplard-Barthelaix, A., and
Benoit, J. P., 1993, "Biodegradation and brain tissue reaction to poly(D,L-lactide-co-glycolide)
microspheres," Biomaterials, 14(6), pp. 470-478.
[74] Veziers, J., Lesourd, M., Jollivet, C., Montero-Menei, C., Benoit, J. P., and Menei, P.,
2001, "Analysis of brain biocompatibility of drug-releasing biodegradable microspheres by
scanning and transmission electron microscopy," Journal of Neurosurgery, 95(3), pp. 489-494.
[75] Ratner, B. D., 2004, Biomaterials science : an introduction to materials in medicine,
Elsevier Academic Press, Amsterdam ; Boston.
[76] Rahane, S. B., Floyd, J. A., Metters, A. T., and Kilbey, S. M., 2008, "Swelling behavior
of multiresponsive poly(methacrylic acid)-block-poly (N-isopropylacrylamide) brushes
synthesized using surface-initiated photoiniferter-mediated photopolymerization," Advanced
Functional Materials, 18(8), pp. 1232-1240.
[77] Tran, V. T., Benoit, J. P., and Venier-Julienne, M. C., 2011, "Why and how to prepare
biodegradable, monodispersed, polymeric microparticles in the field of pharmacy?,"
International Journal of Pharmaceutics, 407(1-2), pp. 1-11.
[78] Yemisci, M., Bozdag, S., Cetin, M., Soylemezoglu, F., Capan, Y., Dalkara, T., and Vural,
I., 2006, "Treatment of malignant gliomas with mitoxantrone-loaded poly (lactide-co-glycolide)
microspheres," Neurosurgery, 59(6), pp. 1296-1302; discussion 1302-1293.
[79] Berkland, C., Kim, K., and Pack, D. W., 2003, "PLG microsphere size controls drug
release rate through several competing factors," Pharmaceutical Research, 20(7), pp. 1055-1062.
[80] Araki, T., Yashima, H., Shimizu, K., Aomori, T., Hashita, T., Kaira, K., Nakamura, T.,
and Yamamoto, K., "Review of the treatment of non-small cell lung cancer with gefitinib," Clin
Med Insights Oncol, 6, pp. 407-421.
[81] 2013, "Full Prescribing Information: Avastin," Genentech, Inc.
[82] Zhuang, L., Gao, J., Zeng, Y., Yu, F., Zhang, B., Li, M., Derendorf, H., and Liu, C.,
"HPLC method validation for the quantification of lomustine to study pharmacokinetics of
thermosensitive liposome-encapsulated lomustine containing iohexol for CT imaging in C6
glioma rats," Eur J Drug Metab Pharmacokinet, 36(2), pp. 61-69.
[83] Mehrotra, A., Nagarwal, R. C., and Pandit, J. K., "Lomustine loaded chitosan
nanoparticles: characterization and in-vitro cytotoxicity on human lung cancer cell line L132,"
Chem Pharm Bull (Tokyo), 59(3), pp. 315-320.
[84] Loftsson, T., and Fridriksdottir, H., 1990, "Degradation of Lomustine (Ccnu) in
Aqueous-Solutions," International Journal of Pharmaceutics, 62(2-3), pp. 243-247.
[85] Muller, F., Riesenberg, H., Hirnle, P., Gehl, H. B., Duwel, P., and Gorner, M.,
"[Complete remission of multiple brain metastases of non-small cell lung cancer induced by
gefitinib monotherapy]," Strahlenther Onkol, 187(12), pp. 826-830.
[86] Yuan, Y., Tan, C., Li, M., Shen, H., Fang, X., Hu, Y., and Ma, S., 2012, "Activity of
pemetrexed and high-dose gefitinib in an EGFR-mutated lung adenocarcinoma with brain and
leptomeningeal metastasis after response to gefitinib," World J Surg Oncol, 10, p. 235.
[87] Ceresoli, G. L., Cappuzzo, F., Gregorc, V., Bartolini, S., Crino, L., and Villa, E., 2004,
"Gefitinib in patients with brain metastases from non-small-cell lung cancer: a prospective trial,"
Ann Oncol, 15(7), pp. 1042-1047.
[88] National Cancer Institute, 2012, "Lomustine,"
http://www.cancer.gov/cancertopics/druginfo/lomustine.
143
[89] Roy, P. G., P.; Nayek, A.; Samanta, A., 2012, "Preparation of Gefitinib Loaded
Polycaprolactone Microcapsule for Controlled Release Drug Delivery System," International
Journal of Pharmacology and Pharmaceutical Technology, 1(2), pp. 57-61.
[90] Kaur, J., and Tikoo, K., 2013, "p300/CBP dependent hyperacetylation of histone
potentiates anticancer activity of gefitinib nanoparticles," Biochimica Et Biophysica Acta-
Molecular Cell Research, 1833(5), pp. 1028-1040.
[91] Li, F. H., B.; Liu, Y.; Leonard, B.; Griffith, M, 2012, "Controlled Release of
Bevacizumab Through Nanospheres for Extended Treatment of Age-Related Macular
Degeneration," The Open Ophthalmology Journal, 6, pp. 64-58.
[92] Pan, C. K., Durairaj, C., Kompella, U. B., Agwu, O., Oliver, S. C. N., Quiroz-Mercado,
H., Mandava, N., and Olson, J. L., 2011, "Comparison of Long-Acting Bevacizumab
Formulations in the Treatment of Choroidal Neovascularization in a Rat Model," Journal of
Ocular Pharmacology and Therapeutics, 27(3), pp. 219-224.
[93] Abrishami, M., Ganavati, S. Z., Soroush, D., Rouhbakhsh, M., Jaafari, M. R., and
Malaekeh-Nikouei, B., 2009, "Preparation, Characterization, and in Vivo Evaluation of
Nanoliposomes-Encapsulated Bevacizumab (Avastin) for Intravitreal Administration," Retina-
the Journal of Retinal and Vitreous Diseases, 29(5), pp. 699-703.
[94] Benita, S., Benoit, J. P., Puisieux, F., and Thies, C., 1984, "Characterization of Drug-
Loaded Poly(D,L-Lactide) Microspheres," Journal of Pharmaceutical Sciences, 73(12), pp. 1721-
1724.
[95] Davis, S. S., 1984, Microspheres and drug therapy : pharmaceutical, immunological, and
medical aspects, Elsevier ;
Sole distributors for the USA and Canada, Elsevier Science Pub. Co., Amsterdam ; New York
New York, NY, USA.
[96] Trzebicka, B., Robak, B., Trzcinska, R., Szweda, D., Suder, P., Silberring, J., and
Dworak, A., 2013, "Thermosensitive PNIPAM-peptide conjugate - Synthesis and aggregation,"
European Polymer Journal, 49(2), pp. 499-509.
[97] Plamper, F. A., Steinschulte, A. A., Hofmann, C. H., Drude, N., Mergel, O., Herbert, C.,
Erberich, M., Schulte, B., Winter, R., and Richtering, W., 2012, "Toward Copolymers with Ideal
Thermosensitivity: Solution Properties of Linear, Well-Defined Polymers of N-Isopropyl
Acrylamide and N,N-Diethyl Acrylamide," Macromolecules, 45(19), pp. 8021-8026.
[98] Siegwart, D. J., Bencherif, S. A., Srinivasan, A., Hollinger, J. O., and Matyjaszewski, K.,
2008, "Synthesis, characterization, and in vitro cell culture viability of degradable poly(N-
isopropylacrylamide-co-5,6-benzo-2-methylene-1,3-dioxepane)-based polymers and crosslinked
gels," Journal of Biomedical Materials Research Part A, 87A(2), pp. 345-358.
[99] Galperin, A., Long, T. J., Garty, S., and Ratner, B. D., 2013, "Synthesis and fabrication
of a degradable poly(N-isopropyl acrylamide) scaffold for tissue engineering applications,"
Journal of Biomedical Materials Research Part A, 101A(3), pp. 775-786.
[100] Berkland, C., King, M., Cox, A., Kim, K., and Pack, D. W., 2002, "Precise control of
PLG microsphere size provides enhanced control of drug release rate," Journal of Controlled
Release, 82(1), pp. 137-147.
[101] Berkland, C., Kipper, M. J., Narasimhan, B., Kim, K. K., and Pack, D. W., 2004,
"Microsphere size, precipitation kinetics and drug distribution control drug release from
biodegradable polyanhydride microspheres," Journal of Controlled Release, 94(1), pp. 129-141.
144
[102] Wu, J., Kong, T., Yeung, K. W., Shum, H. C., Cheung, K. M., Wang, L., and To, M. K.,
"Fabrication and characterization of monodisperse PLGA-alginate core-shell microspheres with
monodisperse size and homogeneous shells for controlled drug release," Acta Biomater.
[103] Mark, J. E., 1996, Physical properties of polymers handbook, AIP Press, Woodbury, N.Y.
[104] Middleton, J. C., and Tipton, A. J., 2000, "Synthetic biodegradable polymers as
orthopedic devices," Biomaterials, 21(23), pp. 2335-2346.
[105] Huatan, H., Collett, J. H., and Attwood, D., 1995, "The microencapsulation of protein
using a novel ternary blend based on poly(epsilon-caprolactone)," J Microencapsul, 12(5), pp.
557-567.
[106] Kim, B. K., Hwang, S. J., Park, J. B., and Park, H. J., 2005, "Characteristics of
felodipine-located poly(epsilon-caprolactone) microspheres," J Microencapsul, 22(2), pp. 193-
203.
[107] Youan, B. B., Benoit, M. A., Baras, B., and Gillard, J., 1999, "Protein-loaded
poly(epsilon-caprolactone) microparticles. I. Optimization of the preparation by (water-in-oil)-in
water emulsion solvent evaporation," J Microencapsul, 16(5), pp. 587-599.
[108] Auras, R. A., Lim, L. T., Selke, S. E. M., and Tsuji, H., Poly(lactic acid): Synthesis,
Structures, Properties, Processing, and Applications, Wiley.
[109] 2007, "Gefitinib," I. Santa Cruz Biotechnology, ed.Santa Cruz.
[110] Romio, A. P., Sayer, C., Araujo, P. H. H., Al-Haydari, M., Wu, L. B., and da Rocha, S.
R. P., 2009, "Nanocapsules by Miniemulsion Polymerization with Biodegradable Surfactant and
Hydrophobe," Macromolecular Chemistry and Physics, 210(9), pp. 747-751.
[111] Hu, H. R., Wang, H. T., and Du, Q. G., 2012, "Preparation of pH-sensitive polyacrylic
acid hollow microspheres and their release properties," Soft Matter, 8(25), pp. 6816-6822.
[112] Leimann, F. V., Cardozo, L., Sayer, C., and Araujo, P. H. H., 2013, " Poly(3-
hydroxybutyrate-co-3- hydroxyvalerate) nanoparticles prepared by a miniemulsion/solvent
evaporation technique. Effect of phbv molar mass and concentration," Brazilian Journal of
Chemical Engineering, 30(2), pp. 369-377.
[113] Luo, Y. W., and Zhou, X. D., 2004, "Nanoencapsulation of a hydrophobic compound by
a miniemulsion polymerization process," Journal of Polymer Science Part a-Polymer Chemistry,
42(9), pp. 2145-2154.
[114] Canavan, H. E., Cheng, X. H., Graham, D. J., Ratner, B. D., and Castner, D. G., 2006, "A
plasma-deposited surface for cell sheet engineering: Advantages over mechanical dissociation of
cells," Plasma Processes and Polymers, 3(6-7), pp. 516-523.
[115] Tunc, M., Cheng, X. H., Ratner, B. D., Meng, E., and Humayun, M., 2007, "Reversible
thermosensitive glue for retinal implants," Retina-the Journal of Retinal and Vitreous Diseases,
27(7), pp. 938-942.
[116] Guan, Y., and Zhang, Y. J., 2011, "PNIPAM microgels for biomedical applications: from
dispersed particles to 3D assemblies," Soft Matter, 7(14), pp. 6375-6384.
[117] Ayano, E., Karaki, M., Ishihara, T., Kanazawa, H., and Okano, T., "Poly (N-
isopropylacrylamide)-PLA and PLA blend nanoparticles for temperature-controllable drug
release and intracellular uptake," Colloids Surf B Biointerfaces, 99, pp. 67-73.
[118] Soppimath, K. S., Aminabhavi, T. M., Dave, A. M., Kumbar, S. G., and Rudzinski, W.
E., 2002, "Stimulus-responsive "smart" hydrogels as novel drug delivery systems," Drug
Development and Industrial Pharmacy, 28(8), pp. 957-974.
[119] Bikram, M., and West, J. L., 2008, "Thermo-responsive systems for controlled drug
delivery," Expert Opinion on Drug Delivery, 5(10), pp. 1077-1091.
145
[120] "Buffer Reference Center," http://www.sigmaaldrich.com/life-science/core-
bioreagents/biological-buffers/learning-center/buffer-reference-center.html.
[121] Reddy, C. N., Prasad, P., Sreedhar, N.Y., 2011, "Voltammetric Behavior of Gefitinib and
its Adsorptive Stripping Voltammetric Determination in Pharmaceutical Formulations and Urine
Samples," International Journal of Pharmacy and Pharmaceutical Sciences, 3(3), pp. 141-145.
[122] Woodruff, M. A., and Hutmacher, D. W., 2010, "The return of a forgotten polymer-
Polycaprolactone in the 21st century," Progress in Polymer Science, 35(10), pp. 1217-1256.
[123] Lam, C. X. F., Savalani, M. M., Teoh, S. H., and Hutmacher, D. W., 2008, "Dynamics of
in vitro polymer degradation of polycaprolactone-based scaffolds: accelerated versus simulated
physiological conditions," Biomedical Materials, 3(3).
[124] Htay, A. S., Teoh, S. H., and Hutmacher, D. W., 2004, "Development of perforated
microthin poly(epsilon-caprolactone) films as matrices for membrane tissue engineering,"
Journal of Biomaterials Science-Polymer Edition, 15(5), pp. 683-700.
[125] Kumar, N., 2011, Handbook of Neurological Examination, Prentice-Hall of India, New
Delhility.
[126] Domb, A. J., and Jain, J. P., Biodegradable Polymers in Clinical Use and Clinical
Development, Wiley, Hoboken, NJ.
[127] Plata Bedmar, A., and Araguás Araguás, L., 2002, Detection and prevention of leaks
from dams, A.A. Balkema, Lisse ; Exton, PA.
[128] Alexis, F., 2005, "Factors affecting the degradation and drug-release mechanism of
poly(lactic acid) and poly[(lactic acid)-co-(glycolic acid)]," Polymer International, 54(1), pp. 36-
46.
[129] Belbella, A., Vauthier, C., Fessi, H., Devissaguet, J. P., and Puisieux, F., 1996, "In vitro
degradation of nanospheres from poly(D,L-lactides) of different molecular weights and
polydispersities," International Journal of Pharmaceutics, 129(1-2), pp. 95-102.
[130] de Jong, S. J., Arias, E. R., Rijkers, D. T. S., van Nostrum, C. F., Kettenes-van den
Bosch, J. J., and Hennink, W. E., 2001, "New insights into the hydrolytic degradation of
poly(lactic acid): participation of the alcohol terminus," Polymer, 42(7), pp. 2795-2802.
[131] Sirard, T., 2012, "Fundamentals of HPLC," Waters Corporation.
[132] Na, D. H., Murty, S. B., Lee, K. C., Thanoo, B. C., and DeLuca, P. P., 2003, "Preparation
and stability of poly(ethylene glycol) (PEG)ylated octreotide for application to microsphere
delivery," AAPS PharmSciTech, 4(4), p. E72.
[133] Clauss, M. A., and Jain, R. K., 1990, "Interstitial Transport of Rabbit and Sheep
Antibodies in Normal and Neoplas Tic Tissues," Cancer Research, 50(12), pp. 3487-3492.
[134] Calmettes, P., Cser, L., and Rajnavolgyi, E., 1991, "Temperature and Ph-Dependence of
Immunoglobulin-G Conformation," Archives of Biochemistry and Biophysics, 291(2), pp. 277-
283.
[135] Seidegard, J., Gronquist, L., Tuvesson, H., and Gunnarsson, P. O., 2009, "Increased
degradation rate of nitrososureas in media containing carbonate," In Vitro Cellular &
Developmental Biology-Animal, 45(1-2), pp. 32-34.
[136] Roullin, V. G., Mege, M., Lemaire, L., Cueyssac, J. P., Venier-Julienne, M. C., Menei,
P., Gamelin, E., and Benoit, J. P., 2004, "Influence of 5-fluorouracil-loaded microsphere
formulation on efficient rat glioma radiosensitization," Pharmaceutical Research, 21(9), pp.
1558-1563.
[137] La Monica, S., Galetti, M., Alfieri, R. R., Cavazzoni, A., Ardizzoni, A., Tiseo, M.,
Capelletti, M., Goldoni, M., Tagliaferri, S., Mutti, A., Fumarola, C., Bonelli, M., Generali, D.,
146
and Petronini, P. G., 2009, "Everolimus restores gefitinib sensitivity in resistant non-small cell
lung cancer cell lines," Biochem Pharmacol, 78(5), pp. 460-468.
[138] Mukohara, T., Engelman, J. A., Hanna, N. H., Yeap, B. Y., Kobayashi, S., Lindeman, N.,
Halmos, B., Pearlberg, J., Tsuchihashi, Z., Cantley, L. C., Tenen, D. G., Johnson, B. E., and
Janne, P. A., 2005, "Differential effects of gefitinib and cetuximab on non-small-cell lung
cancers bearing epidermal growth factor receptor mutations," J Natl Cancer Inst, 97(16), pp.
1185-1194.
[139] Grobben, B., De Deyn, P. P., and Slegers, H., 2002, "Rat C6 glioma as experimental
model system for the study of glioblastoma growth and invasion," Cell and Tissue Research,
310(3), pp. 257-270.
[140] Wakeling, A. E., Guy, S. P., Woodburn, J. R., Ashton, S. E., Curry, B. J., Barker, A. J.,
and Gibson, K. H., 2002, "ZD1839 (Iressa): An orally active inhibitor of epidermal growth factor
signaling with potential for cancer therapy," Cancer Research, 62(20), pp. 5749-5754.
[141] Koizumi, F., Shimoyama, T., Taguchi, F., Saijo, N., and Nishio, K., 2005, "Establishment
of a human non-small cell lung cancer cell line resistant to gefitinib," International Journal of
Cancer, 116(1), pp. 36-44.
[142] Watanabe, M., Yamada, Y., Kato, H., Imai, H., Nakano, H., Araki, T., and Shiraishi, T.,
2002, "Malignant phyllodes tumor of the prostate: Retrospective review of specimens obtained
by sequential transurethral resection," Pathology International, 52(12), pp. 777-783.
[143] Fleming, A. B., and Saltzman, W. M., 2002, "Pharmacokinetics of the carmustine
implant," Clinical Pharmacokinetics, 41(6), pp. 403-419.
[144] Fung, L. K., Shin, M., Tyler, B., Brem, H., and Saltzman, W. M., 1996,
"Chemotherapeutic drugs released from polymers: Distribution of 1,3-bis(2-chloroethyl)-1-
nitrosourea in the rat brain," Pharmaceutical Research, 13(5), pp. 671-682.