Embed Size (px)
Citation preview

Spatial and Temporal Variation in Fish Assemblage of the Lower Pecos River, Texas
by
Christopher A. Cheek, B.S.
A Thesis
In
Wildlife, Aquatic, and Wildlands Science and Management
Submitted to the Graduate Faculty
of Texas Tech University in
Partial Fulfillment of
the Requirements for
the Degree of
Master of Sciences
Approved
Dr. David Rogowski
Chair of Committee
Dr. Christopher M. Taylor
Dr. Gene R. Wilde
Dr. Peggy Gordon Miller
Dean of the Graduate School
August, 2012

Copyright 2012, Christopher A. Cheek

Texas Tech University, Christopher Cheek, August 2012 Texas Tech University, Christopher Cheek, August 2012
ii
Acknowledgements
Many people contributed to the success of this project. First, I would like to thank
my committee for the countless hours of work that they have contributed to this project. I
would especially like to thank my thesis advisor, Dr. Christopher Taylor for making this
project possible. I am eternally grateful for Dr. Taylor’s advice and guidance through this
process. I am also thankful to Dr. David Rogowski for his time and effort. Dr. Gene
Wilde provided me with valuable editing and commentary that was very helpful. I would
also like to thank my undergraduate advisor, Dr. Tim Patton, for his contribution as a
collaborator and mentor. This project was made possible through funding from Texas
Parks and Wildlife. I would also like to thank Mark McKinstry and the Bureau of
Reclamation for providing funding to sample the lower Canyons sites. I would like to
thank Gordon Linam and Leroy Kleinsasser for their assistance and providing data to
make this project possible. Thank you to Jason Wrinkle and Corbin Neil from The Nature
Conservancy for allowing access to Independence Creek Preserve. I am also thankful to
the International Boundary Waters Commission for allowing access to their property.
Thank you to Kyle Davis and Mayme and Odell Brotherton for graciously allowing me to
sample on their property. I would also like to thank Seiji Miyazono, Cameron Gallegos,
Logan Cross, Marshall Bailey, Jennifer Zavaleta, and Matt VanLandeghem who
volunteered their time to assist with field collections. Last, but certainly not least I would
like to thank Jennifer Zavaleta and my family for much needed moral support.

Texas Tech University, Christopher Cheek, August 2012 Texas Tech University, Christopher Cheek, August 2012
iii
Table of Contents
Acknowledgements ................................................................................................. ii
Abstract ...................................................................................................................v
List of Tables ......................................................................................................... vi
List of Figures ....................................................................................................... vii
I. Introduction ..........................................................................................................1
Study Area .........................................................................................................2
Previous Study ...................................................................................................6
II. Materials and Methods ........................................................................................9
Fish Collection ................................................................................................9
Physical Parameters ......................................................................................10
Analysis.........................................................................................................11
Species Richness Comparisons ...............................................................11
Temporal Fish Assemblage Comparisons ..............................................12
Fish assemblages and Environmental Correlations ................................13
III. Results ..............................................................................................................14
Species Richness Comparisons .....................................................................14
Fish Assemblage Comparisons .....................................................................22
Salinity ..........................................................................................................25
Habitat ...........................................................................................................26
Fish assemblage and Environmental Correlations ........................................27
IV. Discussion ........................................................................................................31
Temporal Variation in Fish Assemblages .....................................................31

Texas Tech University, Christopher Cheek, August 2012 Texas Tech University, Christopher Cheek, August 2012
iv
Spatial Variation Fish Assemblages .............................................................36
Literature Cited ......................................................................................................40

Texas Tech University, Christopher Cheek, August 2012 Texas Tech University, Christopher Cheek, August 2012
v
Abstract
Most river systems have been heavily impacted by human alterations that have
long-term ecological consequences. The lower Pecos River in the Trans-Pecos region of
Texas has undergone anthropogenic changes that include decreased flow, elevated
salinity, species loss, and species invasion. Comparative studies are important to
determine the long-term effects of these changes on fish assemblages. I compared
historical and contemporary fish assemblages from the Pecos River at local (site-specific)
and regional (Trans-Pecos region) scales across 24 years. Fish assemblage data were
collected during two time periods, October 1987 and 2011, by seining at 15 sites
spanning 430 km of the river in Texas. Additionally, I examined contemporary
environmental conditions to determine species-environment relationships. I found that
fish assemblages were significantly different between time periods, likely due to
increased salinization caused by irrigation and oil field pollution. Decreased species
richness, species replacement, and increases in tolerant species were documented in the
upstream sites. Freshwater springs lower the salinity in the downstream reach which
allows for higher species diversity. Better management of regional aquifers, changes to
irrigation practices, mitigation of petroleum waste water, and proper flow regulation are
necessary for protecting biodiversity in the lower Pecos River.

Texas Tech University, Christopher Cheek, August 2012 Texas Tech University, Christopher Cheek, August 2012
vi
List of Tables
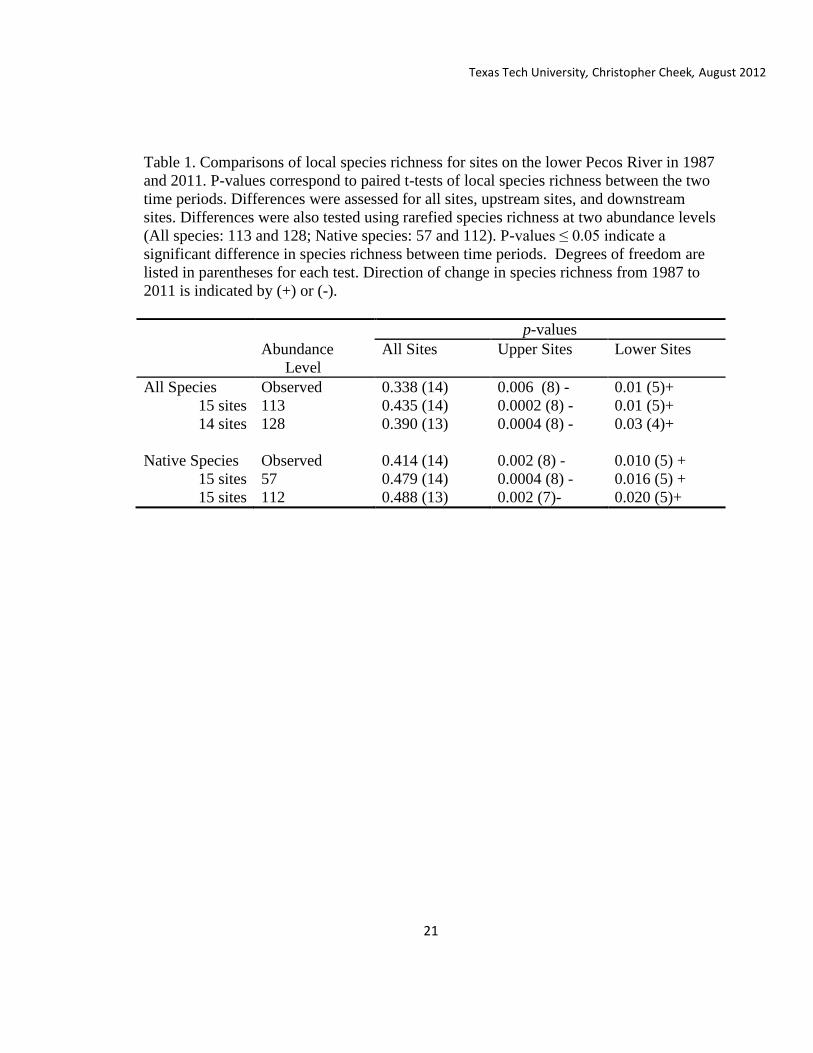
1. Comparisons of local species richness for 15 (14 sites for abundance level
of 128) sites on the lower Pecos River in 1987 and 2011. P-values
correspond to paired t-tests of local species richness between the two time
periods. Differences were assessed for all sites, upstream sites, and
downstream sites. Differences were also tested using rarefied species
richness at two abundance levels (All species: 113 and 128; Native
species: 57 and 112). P-values ≤ 0.05 indicate a significant difference in
species richness between time periods. Degrees of freedom are listed in
parentheses for each test. Direction of change in species richness from
1987 to 2011 is indicated by (+) or (-). ..........................................................21
2. Pearson correlations for fish species with NMS axes for fish assemblages
in the lower Pecos River (Figures 4 & 5).Fish were collected in October
1987 and Summer and October 2011. Comparisons were made between
October 1987 and Oct 2011, and between summer and October 2011.
Strong correlations (r≥0.50) are indicated by bold ........................................23
3. Pearson correlations of measured environmental variables with NMS axes
1 and 2 for fish assemblages of the lower Pecos River in summer and
October 2011.Pearson correlations (r≥0.60, bold) indicate strong
assemblage-environment relationships ..........................................................30

Texas Tech University, Christopher Cheek, August 2012 Texas Tech University, Christopher Cheek, August 2012
vii
List of Figures
1. Figure 1. Map of study area. Sites are represented by numbered squares.
Site numbers correspond to site names in Figure 4 .............................................8
2. The 95% confidence intervals for regional rarefaction curves based on15
sites on the lower Pecos River in 1987 (solid line) and 2011 (dashed line).
Curves were constructed with 25 species and 8310 individuals in 1987 and
25 species and 15699 individuals in 2011. ..........................................................15
3. Rarefaction curves and 95% confidence intervals of native regional
species richness across 15 sites on the lower Pecos River. Sites were
sampled in 1987 (solid line) and 2011 (dashed line). Curves were
constructed with 7441 individuals and 21 native species in 1987 and
11132 individuals and 21 native species in 2011.................................................17
4. Rarefaction curves and 95% confidence intervals of combined species
richness from 9 upstream sites on the lower Pecos River. Sites were
sampled in 1987 (solid line) and 2011 (dashed line). Curves were
constructed with 5150 individuals and 14 native species in 1987 and 7467
individuals and 10 native species in 2011............................................................18
5. Rarefied species richness at an abundance level of 113 individuals for 15
sites on the lower Pecos River. Sample site names and site numbers are
listed on the X-axis. Samples were collected in October of 1987 (black
bars) and 2011 (grey bars). Sites are ordered longitudinally from upstream
to downstream. .....................................................................................................20
6. Nonmetric Multidimensional Scaling analysis of 1987 (open symbols) and
2011 (closed symbols) fish samples from the lower Pecos River. NMS
axes 1, 2 and 3 account for 18.9%, 10.2% and 60.3% of the variation,
respectively. Upstream sites show greatest differences between time
periods. Circles indicate upstream sites and triangles represent
downstream sites. Site numbers correspond to site names in Figure 3. ...............24
7. Specific conductance for 15 sites on the Pecos River. Measurements were
collected in October of 1987 (black bars) and 2011 (grey bars). .........................26
8. Nonmetric Multidimensional Scaling analysis of 2011 fish samples from
the 15 sites on the lower Pecos River. Summer samples are represented by
open symbols and fall samples are designated by closed symbols.
Upstream sites are represented by squares and downstream sites are
represented by triangles. Site numbers correspond to sites names in Figure
3............................................................................................................................28
Texas Tech University, Christopher Cheek, August 2012 Texas Tech University, Christopher Cheek, August 2012
1
Chapter I
Introduction
Rivers and streams, particularly in arid regions, have been severely altered by
humans. Rivers primarily have been affected by impoundments, water quality
degradation, water diversion, and extensive introduction of invasive species (Miller and
Chernoff 1979; Williams1985; Hubbs 1990; Propst and Stefferud 1994; Rinne 1995).
These alterations have caused decreases in aquatic biodiversity around the world (Dirzo
and Raven 2003). Texas also has experienced a major loss of native species. Within
Texas, 44% of native fishes are considered to be extinct, extirpated, or imperiled (Hubbs
2008).
The Pecos River has been impacted by several anthropogenic alterations such as
fragmentation, altered flow regime, pollution, and channelization; this has led to
increasing salinization. Salinity along with habitat availability greatly influences
community structure of fishes in the lower Pecos River. Therefore, changes to salinity
and habitat quality could have a profound impact on fish community structure.
In order to document the magnitude and extent of anthropogenic impacts, it is
necessary to examine ecosystems over long temporal scales. Comparisons of historical
and contemporary assemblages provide a way to detect assemblage shifts and individual
species declines. Temporal comparisons also allow for examination of environmental
factors that contribute to the loss of biodiversity. Understanding the processes and
mechanisms of assemblage change can aid in the development of management practices
that best preserve biodiversity.

Texas Tech University, Christopher Cheek, August 2012 Texas Tech University, Christopher Cheek, August 2012
2
In this study I examined changes in biota and environmental conditions over a 24-
year period in the lower Pecos River. The specific objectives for this study were to
compare historical and contemporary fish assemblages from the Pecos River at local
(site-specific) and regional (Trans-Pecos region) scales and to examine contemporary
associations between environmental factors and fish assemblages.
Study Area
The Pecos River begins in the Sangre de Cristo Mountains in north-central New
Mexico and flows south-southeast to Texas. The river concludes at the confluence with
the Rio Grande just upstream of Amistad Reservoir. The lower Pecos River begins near
Carlsbad, New Mexico and flows 770 kilometers to the Rio Grande River (Hoagstrom
2001). This study focuses on the Texas portion of the river from Red Bluff Reservoir to
the Rio Grande confluence (Figure 1).
Along its course, the lower Pecos River flows through two major geomorphic
divisions. The river flows through the Permian Basin beginning near Artesia, NM and
enters the Edwards Plateau near Iraan, TX. In the Permian Basin, the river is wide and
low gradient, and becomes incised in limestone canyons after it enters the Edwards
Plateau. Upstream flow and irrigation returns provide the greatest contribution to flow in
the Permian Basin because there is little perennial surface water in the region (Hoagstrom
2009). In the Edwards Plateau freshwater springs greatly increase discharge especially
during drought conditions. Live Oak Creek, Independence Creek, and Howard Creek are
spring-fed tributaries in this region. Salinity is greatest in the reach between Red Bluff
Reservoir and Iraan, TX (Linam and Kliensasser 1996; Hoagstrom 2001; Hoagstrom

Texas Tech University, Christopher Cheek, August 2012 Texas Tech University, Christopher Cheek, August 2012
3
2009). Past studies indicate that salinity increases from the headwaters to Iraan and then
decreases downstream (Linam and Kleinsasser 1996; Davis 1987; Hoagstrom 2009).
Decreases in salinity associated with freshwater springs occur in a fairly short distance
between Sheffield and Independence Creek.
Natural sources of salinity and anthropogenic land use in the region contribute to
high contemporary salinity levels. Historical accounts indicate that the water had a
“salty” taste but settlers used it as a source for drinking (Lingle and Linford 1961).
Natural sources of salinity often are associated with the brine aquifer near Malaga, NM
(Havens and Wilkins 1979). Hoagstrom et al. (2009) concluded that salinity levels have
increased since major water development began.
Irrigation has directly contributed to salinization through the concentration of salts
in return channels and field runoff (Pillsbury 1981; Williams 1987). Crop production in
this arid region heavily relies on irrigation since rainfall only amounts to 30-40 cm
annually (Davis 1987). Agricultural areas in the Pecos River area are associated with
alluvial valleys in the Fort Sumner, Roswell, Carlsbad, and Toyah Basins (Ashworth
1990). Overdraft of water from local aquifers is also associated with decreases in river
flow and increases in salinity. Groundwater levels in the region have fallen as much as
150m since water resource development began around the turn of the century (Brune
2002). Freshwater springs throughout the Permian Basin now have decreased flows or no
longer contribute freshwater to the river. In some cases, springs that once supplied fresh
water now discharge saline water from depleted aquifers (Hoagstrom 2009). Increased

Texas Tech University, Christopher Cheek, August 2012 Texas Tech University, Christopher Cheek, August 2012
4
evaporation associated with reservoirs also contributes to water loss and increased
salinity (Hoagstrom 2009).
Oil and gas production in the Pecos drainage may also be linked to increased
salinity levels. Saline water is a major byproduct of petroleum production in this area.
Waste water is disposed of by two methods, injection into saline aquifers or pumping into
evaporation or storage ponds. This water has been documented to contain varying
amounts of sodium, calcium, magnesium chloride, sulfate, and several trace metals
(Baker and Brendecke 1983). Several studies have observed contamination of
groundwater and surface water has as a result of local petroleum production (Chipman
1959; Pettyjohn 1971; Baker and Brendecke 1983; Shipley 1991). Waste water can reach
aquifers and surface flows through seepage from holding ponds, subsurface flows, and
accidental releases (Baker and Brendecke 1983). Reduced water quality resulting from
waste water pollution has been documented to reduce species richness and diversity in
bivalve and fish communities (Pettyjohn 1971; Fuller 1974; Shipley 1991). Major oil and
gas production is active in every county that borders the Pecos River in Texas, and likely
contributes to salinization (Campbell 1959; Gregory and Hatler 2008).
Not surprisingly, salinity and water quality have influenced the species
distribution in the Pecos River (Hoagstrom 2001). The stretch of river between Red Bluff
Dam and Iraan, the most saline area, is dominated by seven euryhaline fish species
(Hoagstrom 2009). The earliest fish assessments in this section do not predate the
development of water resources in the region, but loss of noneuyhaline species has been
documented in this highly saline reach (Hoagstrom 2001).

Texas Tech University, Christopher Cheek, August 2012 Texas Tech University, Christopher Cheek, August 2012
5
Species composition has also been impacted by the introduction of non-native,
invasive species. Vectors of introduction include intentional stocking of game fish as well
as bait bucket releases (Hoagstrom 2003). Native fish populations have suffered as a
result of non-native introductions due to hybridization and competition. For example, the
introduction of Cyprinodon variegatus has led to genetic introgression with the native
Cyprinodon pecosensis (Echelle and Connor 1989). A hybrid swarm is now prevalent in
the main stem of the river, with pure populations only persisting in wetlands and a single
tributary. Hybognathus amarus is another species that has been negatively impacted by
invasion and flow regime shifts. Hybognathus amurus has been replaced by the
Hybognathus placitus in New Mexico (Hoagstrom et al. 2010). Hybognathus placitus is
not native to the Pecos River but is more naturally tolerant of reduced base flows than H.
amurus (Hoagstrom et al. 2010). Other introduced species, including Fundulus grandis,
Cyprinus carpio, Cyprinella venusta, and Lepomis auritus also occur in the Pecos River
and have unknown effects on local fish assemblages (Smith and Miller 1986).
The widespread establishment of non-native salt cedar has altered the banks of the
Pecos River (Davis 1980; Hubbs 1990). Salt cedar is an aggressive riparian invader that
can develop dense monotypic stands along rivers and streams. Salt cedar can deplete
water levels, alter native bank vegetation, increase soil salinity, and change channel
morphology (Shafroth et al. 2005). Removal of salt cedar occurred in the Pecos River
drainage in Texas from 1999-2003 with the goal of decreasing salinity and increasing
flow although success was minimal (Hart et al. 2005).

Texas Tech University, Christopher Cheek, August 2012 Texas Tech University, Christopher Cheek, August 2012
6
Another stressor that impacts fish assemblages in the lower Pecos is golden algae,
Prymnesium parvum. This introduced algal species can produce toxins that are fatal to
freshwater fish. For example, In November 1986 a toxic algae bloom resulted in a 99%
kill of fish in the Pecos River between Iraan and Amistad Reservoir (Rhodes and Hubbs
1992). The bloom originated near Iraan and the toxic “wedge” reached Amistad reservoir.
These toxins caused major fish kills in 1985, 1986, and 1988 (Rhodes and Hubbs 1992).
Earlier fish kills in the 1960 were likely due to golden algae but were not confirmed.
More recently toxic algae blooms have occurred in the Pecos River in 1993, 1995, and
2005-2007 (Southard et al. 2010).
Previous Study
Linam and Kliensasser (1996) published a report by Texas Parks and Wildlife
Department examining the relationship between water quality and fish communities in
the Pecos River. Fish and water quality were sampled at 16 sites in October of 1987.
They reported that the distribution and abundance of fish species appeared to be strongly
related to salinity. Salt tolerant species such as pupfish, rainwater killifish (Lucania
parva), red shiner (Cyprinella lutrensis), inland silverside (Menidia beryllina) and
western mosquitofish (Gambusia affinis) were found to comprise the greatest portion of
the fish community in areas with high conductivity. Dominance of these euryhaline
species decreased with in areas with lower conductance.
Linam and Kliensasser (1996) also noted significant declines of roundnose
minnow (Dionda episcopa) and gray redhorse (Moxostoma congestum) from historical
studies. Declines in spring flow and surface water depletion are suggested reasons for

Texas Tech University, Christopher Cheek, August 2012 Texas Tech University, Christopher Cheek, August 2012
7
declines. Increased dominance of red shiners was noted from previous collections. Linam
and Kliensasser’s report (1996) was chosen as for comparison purposes because of the
large area sampled as well as the environmental data available.

Texas Tech University, Christopher Cheek, August 2012 Texas Tech University, Christopher Cheek, August 2012
8
Figure 1. Map of study area. Sites are represented by numbered squares. Site numbers
correspond to site names in Figure 4.

Texas Tech University, Christopher Cheek, August 2012 Texas Tech University, Christopher Cheek, August 2012
9
Chapter II
Materials and Methods
I followed methods outlined by Linam and Kleinsasser (1996) in order to assess
change in fish assemblages across a 24-year time span. For comparison I collected fish
and environmental data at corresponding locations in May-July and October, 2011. I
sampled 15 main-stem sites and 2 tributary sites at Independence Creek and Salt Creek.
One site was not sampled in 2011 due to access issues. I consulted with Gordon Linam so
that localities and sampling techniques were matched as closely as possible. Salt Creek
was sampled only in October 2011 and the Harkell Canyon site was not sampled in 2011.
October samples were used for comparison and sample dates were matched as closely as
possible to minimize natural, seasonal differences.
Fish Collection
Fish were collected using a 1.8 m by 6.1 m, 4.8 mm braided cotton mesh seine.
Seining was performed in a downstream pattern with pulls ranging from 1-5m. All habitat
types were sampled at each site. For example, all riffles, runs, and pools present within a
sample reach were seined. Sampling effort depended on habitat complexity and ranged
between 45 and 50 minutes per site. All fish less than 25 cm in length were preserved in
a 10% formalin solution, except at sites on Independence Creek Preserve. At
Independence Creek rare and threatened species were enumerated and returned to the
water. All preserved fish were identified in the laboratory. Fish greater than 25 cm were
identified in the field and returned to the water. All specimens were cataloged and
deposited at the University of Texas Museum.

Texas Tech University, Christopher Cheek, August 2012 Texas Tech University, Christopher Cheek, August 2012
10
Physical Parameters
Water temperature, pH, dissolved oxygen, specific conductance, total dissolved
solids, and salinity were measured in the field using a multi-probe Hanna water quality
meter. Turbidity and chlorophyll-a were measured using a fluorometer (Turner Designs,
AuqaFluor®). Turbidity and chlorophyll-a were averaged from three samples at each site
to account for sample variability. Water quality data was collected below the surface of
the water usually in areas with some flow near the center of the sample reach.
A minimum of six transects were designated at each sample site prior to sampling
for fish. The number of transects reflected the site length and habitat complexity. For
example, a seventh transect would be added if a unique habitat did not fall within the first
six transects. Transects spanned the width of the river and were evenly spaced throughout
the area sampled. Dominate substrate type was recorded at three points along each
transect. Depth also was measured at each substrate sample point. Percentage of each
substrate type was calculated from at least18 point classifications sampled on the
transects. Substrate measurements were classified using a modified Wentworth scale
(Cummins 1962). Substrate was classified as boulder, cobble, gravel, sand, or mud.
Measurements for each substrate class are provided in Cummins (1962). Stream width,
average depth, and maximum velocity were measured at each site. Maximum velocity
(m/s) was measured by floating a neutrally buoyant object over two meters.
The presence of algae, aquatic macrophytes, woody debris, and over stream
herbaceous vegetation was visually ranked by percent coverage. Percent coverage
estimates of each habitat variable were assessed in the area between each transect (20-

Texas Tech University, Christopher Cheek, August 2012 Texas Tech University, Christopher Cheek, August 2012
11
30m), always looking upstream. The area between each transect was also classified as
riffle, run, or pool. This allowed for percentage calculation of riffle, run, and pool habitat
present at a site. Rank values were averaged to allow for ranking of the site as a whole.
Habitat variables were visually classified on a scale of zero to three (Taylor et al. 2003),
with zero indicating absence and 3 indicating ubiquity. Salt cedar bank coverage also was
ranked on this scale at each transect. The same observer ranked the coverage of each
variable at all sites to minimize observer variability.
Analysis
Species Richness Comparisons
Rarefaction was used to compare local and regional species richness between time
periods (Taylor et al. 2008). Rarefaction allows for comparisons of species richness
between samples with differing levels of abundance (Sanders 1968; Taylor et al. 2008)
and was implemented using EcoSim700 software (Gotelli and Entsminger 2001).
Random subsamples drawn from the observed data were used to create species richness
distributions at each abundance level using a Monte Carlo procedure (Gotelli and Graves
1996). All estimates of species richness were sampled with 5000 iterations.
To compare regional diversity between 1987 and 2011, I constructed rarefaction
curves and visually compared the 95% confidence intervals of those curves. For this
analysis, species abundance was combined for 15 sites (excluding Harkell Canyon and
Salt Creek) in 1987 and 2011. Linam and Kleinsasser (1996) in October 1987, collected
25 species and 8310 individuals. In October 2011, 25 species and 15699 individuals were
collected. Regional species richness was compared for the two time periods by visually

Texas Tech University, Christopher Cheek, August 2012 Texas Tech University, Christopher Cheek, August 2012
12
assessing overlap of the confidence intervals. If the curves diverged then a significant
difference in species richness was present between time periods.
To compare mean species richness between the two time periods, I rarefied
species richness values to the lowest abundance collected at a single site in each time
period. Species richness values were rarefied to abundance levels of 113 and 128 for
comparison using all species, and 57 and 112 for native species. Designation of native
species followed Smith and Miller (1986) and Hoagstrom (2001). I then used a two-tailed
paired t-test to examine differences in species richness between time periods and within
upstream and downstream sites between time periods. Upstream sites were defined as the
nine sites from Orla to Sheffield. Downstream sites were defined as the six sites from
above Independence Creek to Shumla (Fig. 1). Paired t-tests were implemented using
SYSTAT 13. Statistical significance was defined at an alpha level of 0.05.
Temporal Fish Assemblage Comparisons
To compare assemblages between samples collected in 1987 to 2011, I used
Nonmetric Multidimensional Scaling (NMS) (Taylor et al. 2008; Gauch 1982). NMS is
used to summarize complex community data and is well suited to for non-normal data or
data measured on discontinuous or questionable scales (Guach 1982, McCune and Grace
2002). NMS analysis was conducted using PC-ORD 5 software. Ordinations of sites were
based on site-specific species abundance data and the Sorensen distance metric. Square-
root transformations were used to decrease the influence of highly abundant species.
Pearson correlations of fish species with NMS axes were calculated to determine which
species were driving the ordination.

Texas Tech University, Christopher Cheek, August 2012 Texas Tech University, Christopher Cheek, August 2012
13
A Multiresponse Permutation Procedure (MRPP) was used to test the hypothesis
of no difference in fish assemblages between October 1987 and October 2011. This
procedure is similar to a multivariate analysis of variance (MANOVA), but MRPP does
not make distributional assumptions (McCune and Grace 2002). This makes MRPP well
suited to handle the skewed distributions often associated with community data (Grace
and McCune, 2002). Species abundance values were square-root transformed and the
Sorenson distance metric was used. A-values in MRPP analysis indicate the effect size of
the difference in fish assemblages between groups. An effect size of A=0 means that the
heterogeneity between groups is equal. In ecological communities A<0.1 is common, but
if A<0.01 ecological significance should be questioned (Grace and McCune 2002).
MRPP was also used to determine differences in fish assemblages between upstream and
downstream sites within each time period and between summer and October samples in
2011.
Fish assemblages and Environmental Correlations
Nonmetric multidimensional scaling was also used to ordinate contemporary
samples to identify environmental correlates of fish assemblages. Pearson correlations
were calculated between the measured environmental variables and the NMS axes. Some
variables were discarded due to equipment failure and natural diel variation. For the final
analysis 22 variables were assessed for environmental-assemblage relationships (Table
3). Continuous variables were log10 transformed and included width, depth, specific
conductance, turbidity, chlorophyll a, and max velocity. Substrate and riffle/pool
Texas Tech University, Christopher Cheek, August 2012 Texas Tech University, Christopher Cheek, August 2012
14
(percentages) values were arcsine square root transformed. Rank variables were not
transformed for this analysis.
Chapter III
Results
Species Richness Comparisons
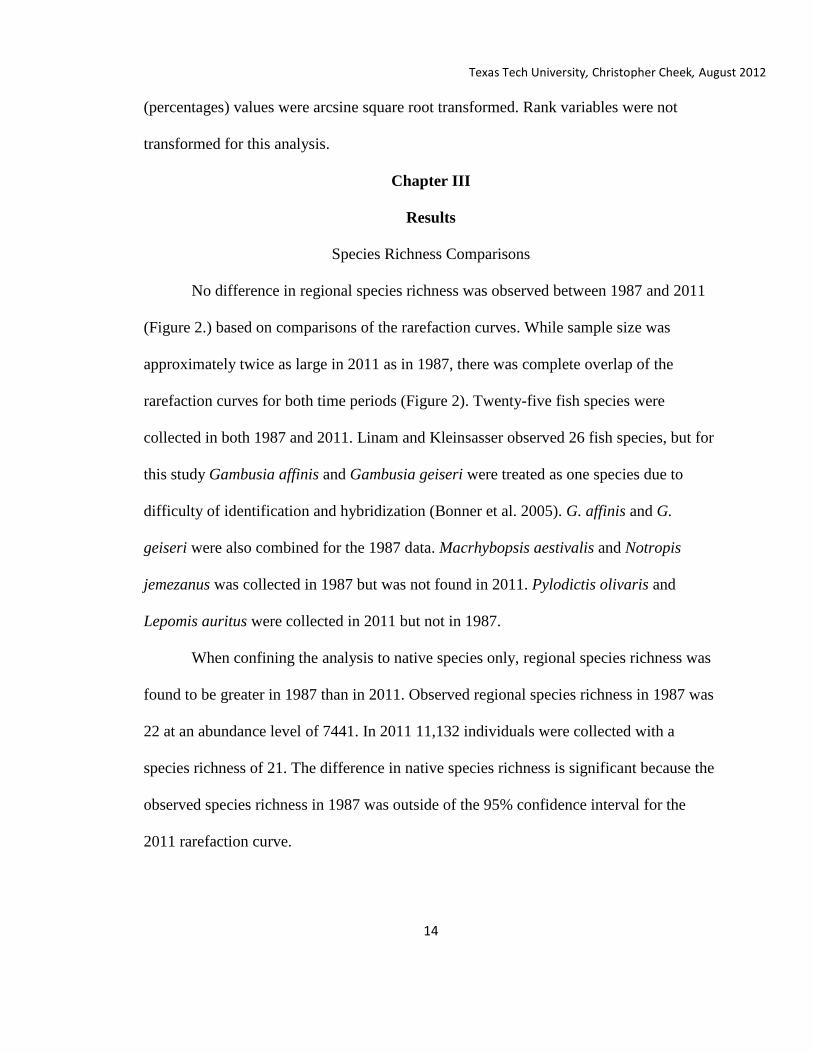
No difference in regional species richness was observed between 1987 and 2011
(Figure 2.) based on comparisons of the rarefaction curves. While sample size was
approximately twice as large in 2011 as in 1987, there was complete overlap of the
rarefaction curves for both time periods (Figure 2). Twenty-five fish species were
collected in both 1987 and 2011. Linam and Kleinsasser observed 26 fish species, but for
this study Gambusia affinis and Gambusia geiseri were treated as one species due to
difficulty of identification and hybridization (Bonner et al. 2005). G. affinis and G.
geiseri were also combined for the 1987 data. Macrhybopsis aestivalis and Notropis
jemezanus was collected in 1987 but was not found in 2011. Pylodictis olivaris and
Lepomis auritus were collected in 2011 but not in 1987.
When confining the analysis to native species only, regional species richness was
found to be greater in 1987 than in 2011. Observed regional species richness in 1987 was
22 at an abundance level of 7441. In 2011 11,132 individuals were collected with a
species richness of 21. The difference in native species richness is significant because the
observed species richness in 1987 was outside of the 95% confidence interval for the
2011 rarefaction curve.

Texas Tech University, Christopher Cheek, August 2012 Texas Tech University, Christopher Cheek, August 2012
15
Figure 2. The 95% confidence intervals for regional rarefaction curves based on15 sites
on the lower Pecos River in 1987 (solid line) and 2011 (dashed line). Curves were
constructed with 25 species and 8310 individuals in 1987 and 25 species and 15699
individuals in 2011.

Texas Tech University, Christopher Cheek, August 2012 Texas Tech University, Christopher Cheek, August 2012
16
The observed difference was only one, but the samples sizes were considerably
higher in 2011 (Figure 3). In 1987, a total of 8310 individuals were collected, and 15,699
were collected in 2011. Macrhybopsis aestivalis and N. jemezanus, both native species,
were found in 1987 but not in 2011. M. aestivalis was listed as a species of special
concern by Hubbs et al. 2008. Neither species is listed as threatened or endangered by
Texas Parks and Wildlife, US Fish and Wildlife Service, or the IUCN Red List. Hubbs et
al. (1991) listed N. jemezanus as threatened in Texas, and was supported by the findings
of Edwards et al. (2002). P. olivaris was the only native species that was found in 2011
that was not observed in 1987.
Rarefaction curves were constructed to determine differences in observed species
richness for the nine upstream sites in 1987 and 2011 (Figure 4). Curves were constructed
with 5150 individuals and 14 native species in 1987 and 7467 individuals and 10 native
species in 2011. The observed species richness in 1987 did not overlap with the
confidence interval for 2011 indicating that species richness was significantly different
between time periods. Cyprinella proserpina, Notropis braytoni, Pimephales vigilax, and
Fundulus zebrinis were collected in the upstream sites in 1987, but were not collected in
2011. To compare mean local species richness, I eliminated Harkell Canyon (Site 15,
sampled only in 1987) and used the15 sites sampled during October in both time periods.
Observed and rarefied mean local species richness was compared between time periods
using a paired t-test. Species richness values were rarefied to an abundance level of 113
(Figure 5, 15 sites) and 128 (14 sites) corresponding to the lowest two abundance levels

Texas Tech University, Christopher Cheek, August 2012 Texas Tech University, Christopher Cheek, August 2012
17
of fish collected at a single site. Orla (Site 1) was excluded from the analysis at an
abundance level of 128 because less than 128 fish were captured at that site in 2011.
Figure 3. Rarefaction curves and 95% confidence intervals of native regional species
richness across 15 sites on the lower Pecos River. Sites were sampled in 1987 (solid
line) and 2011 (dashed line). Curves were constructed with 7441 individuals and 22
native species in 1987 and 11132 individuals and 21 native species in 2011.

Texas Tech University, Christopher Cheek, August 2012 Texas Tech University, Christopher Cheek, August 2012
18
Figure 4. Rarefaction curves and 95% confidence intervals of combined species richness
from 9 upstream sites on the lower Pecos River. Sites were sampled in 1987 (solid
line) and 2011 (dashed line). Curves were constructed with 5150 individuals and 14
native species in 1987 and 7467 individuals and 10 native species in 2011.

Texas Tech University, Christopher Cheek, August 2012 Texas Tech University, Christopher Cheek, August 2012
19
No difference was found between observed mean local species richness in 1987
and 2011 samples (T14= -0.467, p=0.338; Table 1). There was also no difference for
rarefied mean local species richness between time periods for either abundance level
(113: T14=-0.166, p=0.435; 128: T13=0.285, p=0.390). Significant differences in fish
assemblage between upstream and downstream sites within each time period (1987: T=-
4.11, A= 0.077, p=0.001; 2011: T=-6.82, A=0.18, p=0.0002). Thus, I proceeded with
comparisons of species richness in 1987 and 2011 within the upstream and downstream
reach.
Within the upstream sites, observed mean local species richness was greater in
1987 than in 2011 (T8=3.19, p=0.006). Local mean rarefied species richness was also
greater in 1987 than in 2011 (113: T8=5.51, p=0.0002, 128: T7=5.31, p=0.0004). Species
richness within the lower sites was significantly different between time periods for both
observed and rarefied values (Obs: T5=-2.95 p=0.01; 113: T5=-3.06, p=0.01; 128: T4=-
2.36, p=0.04), but species richness was greater in 2011 than in 1987. Greater species
richness in 2011 for the downstream sites indicates that different processes may be
limiting species presence in the upstream and downstream reach.

Texas Tech University, Christopher Cheek, August 2012 Texas Tech University, Christopher Cheek, August 2012
20
Figure 5. Rarefied species richness at an abundance level of 113 individuals for 15 sites
on the Pecos River. Sample site names and site numbers are listed on the X-axis. Samples
were collected in October of 1987 (black bars) and 2011 (grey bars). Sites are ordered
longitudinally from upstream to downstream.
Texas Tech University, Christopher Cheek, August 2012 Texas Tech University, Christopher Cheek, August 2012
21
Table 1. Comparisons of local species richness for sites on the lower Pecos River in 1987
and 2011. P-values correspond to paired t-tests of local species richness between the two
time periods. Differences were assessed for all sites, upstream sites, and downstream
sites. Differences were also tested using rarefied species richness at two abundance levels
(All species: 113 and 128; Native species: 57 and 112). P-values ≤ 0.05 indicate a
significant difference in species richness between time periods. Degrees of freedom are
listed in parentheses for each test. Direction of change in species richness from 1987 to
2011 is indicated by (+) or (-).
p-values
Abundance
Level
All Sites Upper Sites Lower Sites
All Species Observed 0.338 (14) 0.006 (8) - 0.01 (5)+
15 sites 113 0.435 (14) 0.0002 (8) - 0.01 (5)+
14 sites 128 0.390 (13) 0.0004 (8) - 0.03 (4)+
Native Species Observed 0.414 (14) 0.002 (8) - 0.010 (5) +
15 sites 57 0.479 (14) 0.0004 (8) - 0.016 (5) +
15 sites 112 0.488 (13) 0.002 (7)- 0.020 (5)+

Texas Tech University, Christopher Cheek, August 2012 Texas Tech University, Christopher Cheek, August 2012
22
Fish Assemblage Comparisons
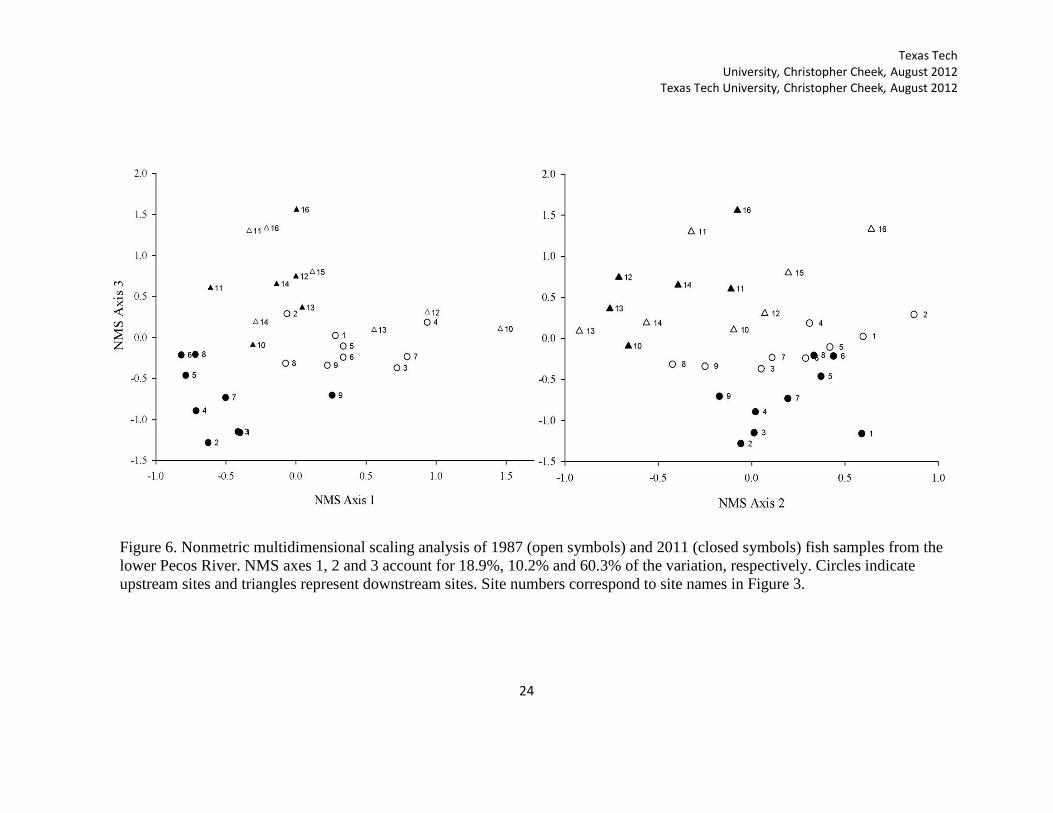
Nonmetric multidimensional scaling was used to examine differences in fish
assemblage between October 1987 and 2011 (Figure 6). The first (18.9 %) and third
(60.3%) NMS Axes accounted for 79.2% of the variance between distances in ordination
space and original space. Axis 2 accounted for 10.2% of the variance. Because a three
dimensional solution was suggested, I also plotted the second and third NMS axes
(Figure 6). The final stress for a three dimensional solution was 9.633. Clarke (1993)
stated that stress scores between 5 and 10 indicate a good ordination with no real risk of
drawing false inferences. The final stability criterion was 0.00001.
Fish assemblages in 1987 and 2011 were found to be significantly different (T=-
6.83, A=0.07, p=0.000064). Differences in the location of upstream sites (Orla to
Sheffield) in the NMS figure revealed grouping between time periods. This was primarily
due to increases in species that were negatively correlated with Axes 1 and 3. NMS axis 1
was negatively correlated (r>0.5) with Lucania parva and Cyprinodon spp. (Table 2).
Axis 3 was negatively correlated with Menidia beryllina, F. grandis, and Cyprinodon
spp. These species are known to be tolerant of elevated salinity when compared with
other freshwater species (Griffith 1974; Pillard et al. 1999). Increases in salinity tolerant
species could indicate that change in salinity of the upstream sites is driving the shifts in
fish assemblage. Axis 2 was negatively correlated with species that are intolerant of the
high salinity and were found in the downstream sites. This includes Cyprinella lutrensis,
C. proserpina, Astyanax mexicanus, N. braytoni, P. vigilax, Lepomis megalotis, and
Cichlasoma cyanoguttatum (Table 2). When Axis 2 and 3 are compared (Figure 6), it is

Texas Tech University, Christopher Cheek, August 2012 Texas Tech University, Christopher Cheek, August 2012
23
obvious that the downstream sites were associated with the abundance of these intolerant
species.
Table 2. Pearson correlations for fish species with NMS axes for fish assemblages in the
lower Pecos River (Figures 4 & 5). Comparisons were made between years (October
1987 and Oct 2011), and between seasons (summer and October 2011). Strong
correlations (r≥0.50) are indicated by bold.
Between years Between seasons
Species Axis: 1 2 3 Axis: 1 2
D. cepedianum 0.114 -0.107 -0.103 0.014 -0.377
A. mexicanus 0.018 -0.520 0.479 -0.506 -0.349
C. lutrensis 0.374 -0.653 0.006 -0.321 -0.673
C. proserpina -0.098 -0.649 0.375 -0.579 -0.528
C. venusta -0.052 -0.186 0.679 -0.722 -0.405
C. carpio 0.355 0.240 -0.134 0.291 0.18
D. episcopa -0.210 -0.366 0.358 -0.479 -0.226
M. aestivalis 0.181 -0.382 0.023
N. amabilis -0.125 -0.471 0.614 -0.818 -0.362
N. braytoni 0.106 -0.543 0.297 -0.406 -0.518
N. jemezanus -0.093 -0.233 0.049
P. vigilax -0.087 -0.591 0.127 -0.306 -0.602
P. promelas -0.050 -0.146
M. congestum 0.152 -0.261 -0.008 -0.282 -0.36
P. olivaris 0.000 -0.295 0.194 -0.329 -0.557
I. punctatus -0.206 -0.138 0.373 -0.316 -0.041
Cyprinodon sp -0.563 -0.031 -0.555 0.206 0.467
F. grandis -0.510 0.230 -0.593 0.716 0.530
F. zebrinis 0.030 0.006 -0.014 -0.23 0.010
L. parva -0.576 0.109 -0.281 0.191 0.326
Gambusia sp -0.319 0.058 0.364 -0.484 -0.361
M. beryllina -0.358 -0.183 -0.645 0.293 -0.339
L. macrochirus -0.070 -0.192 0.599 -0.632 -0.328
L. megalotis 0.065 -0.552 0.323 -0.695 -0.502
L. auritus -0.041 -0.368 0.406 -0.605 -0.541
M. salmoides -0.052 -0.389 0.293 -0.582 -0.498
E. grahami -0.122 -0.405 0.613 -0.805 -0.534
C. cyanoguttatum -0.003 -0.563 0.105 -0.377 -0.646
O. aureus -0.233 -0.063
Texas Tech University, Christopher Cheek, August 2012
Texas Tech University, Christopher Cheek, August 2012
24
Figure 6. Nonmetric multidimensional scaling analysis of 1987 (open symbols) and 2011 (closed symbols) fish samples from the
lower Pecos River. NMS axes 1, 2 and 3 account for 18.9%, 10.2% and 60.3% of the variation, respectively. Circles indicate
upstream sites and triangles represent downstream sites. Site numbers correspond to site names in Figure 3.

Texas Tech University, Christopher Cheek, August 2012 Texas Tech University, Christopher Cheek, August 2012
25
Axis 2 also shows that assemblages in the upstream reach have become more
homogenous between time periods. Upstream sites in 1987 were widely distributed
across axis 2, whereas in 2011 sites were more tightly grouped. The proliferation of
tolerant species has lead to homogenization of fish assemblages in the region
The downstream sites were not differentiated between time periods. Fish
assemblage at some sites substantially changed between time periods, but as a group,
sites did not exhibit an overall pattern of change. Axis 3 was positively correlated with C.
venusta, Notropis amabilis, and Etheostoma grahami. These species are intolerant of the
high salinity levels that influence fish communities in the upstream sites.
Salinity
Specific conductance was higher in the upstream sites in 2011 than in 1987
(Figure 7). The downstream sites show a different pattern with conductance being greater
in 1987 than in 2011. In both time periods conductance increased in a downstream
pattern from Red Bluff Reservoir to Iraan, TX. The greatest specific conductance (27,600
umhos/cm) was measured at Iraan (site 7) in October of 2011. High salinity
(conductivity) likely contributed to the high abundance of salinity tolerant species and
absence of intolerant species at upstream sites. Conductance was lower in the
downstream sites than the upstream sites in both time periods but differences between
reaches were greater in 2011.

Texas Tech University, Christopher Cheek, August 2012 Texas Tech University, Christopher Cheek, August 2012
26
Figure 7. Specific conductance for 15 sites on the Pecos River. Measurements were
collected in October of 1987 (black bars) and 2011 (grey bars).
Habitat
Habitat data was not collected by Linam and Kliensasser in 1987 so no temporal
habitat comparisons could be made in this study. However, contemporary habitat
measurements showed differences between the upstream and downstream reaches. One
major difference between sites in the upstream and downstream reach was substrate
composition. Substrate in the upstream sites was mostly composed of mud (Average:

Texas Tech University, Christopher Cheek, August 2012 Texas Tech University, Christopher Cheek, August 2012
27
64.4%) and gravel (16.1%). Sand (6.1%), cobble (8.9%), boulder (4.5%), and bedrock
(0.0%) we rare or absent in the upstream reach. Substrate diversity was greater in the
downstream reach with higher percentages of larger substrate such as cobble (27.7%),
boulder (19.8%), and bedrock (21.6%). Gravel (21.0%) was also abundant at many of the
downstream sites, whereas sand (1.9%) and mud (8.0%) were rare.
Sites in the upstream reach consisted of mostly run (57.5%) and pool (34.2%)
habitats with few riffles (8.3%) Downstream sites had more pools (43.8%) and riffles
(31.9%) and less runs (24.3%) than the upstream sites. This reflects the amount of
channelization that has occurred in the upstream sites. Downstream sites (depth: 0.51 m;
width: 36.0 m) had a greater depth and width than did the upstream sites (depth: 0.39 m;
width: 12.5 m. Salt cedar and woody debris were more abundant in the upstream reach
than in the downstream. Differences in habitat and water quality likely account for
differences in fish assemblage between upstream and downstream reach.
Fish assemblage and Environmental Correlations
NMS was used to ordinate the species abundance data from October and summer
of 2011. Combining data from two sample periods inherently adds some variation due to
seasonal differences in fish community. No difference in fish assemblage was found
between the October and summer collection events (A=0.011, p= 0.171).
The combined NMS with species abundance data from October and summer of
2011 accounted for a total of 85.8% of the variation between distances in ordination
space and original space.. NMS Axes 1 and 2 accounted for 70.2% and 15.6% of the
variation, respectively (Figure 8). The number of iterations used for the final solution was

Texas Tech University, Christopher Cheek, August 2012 Texas Tech University, Christopher Cheek, August 2012
28
70 and the stability criterion was 0.00001. A two dimensional solution had the least
amount of stress with a final stress of 11.366. Stress values between 10 and 20 are
common for ecological data. Values at the lower end of this spectrum represent a good
and useable picture for drawing inferences (Clarke 1993).
Figure 8. Nonmetric multidimensional scaling analysis of 2011 fish samples from the 15
sites on the lower Pecos River. NMS axis 1 represents 72.0% of the variation and axis 2
accounts for 13.9% of the variation. Summer samples are represented by open symbols
and fall samples are designated by closed symbols. Upstream sites are represented by
squares and downstream sites are represented by triangles. Site numbers correspond to
sites names in Figure 3.

Texas Tech University, Christopher Cheek, August 2012 Texas Tech University, Christopher Cheek, August 2012
29
The ordination had a distinct split between sites located in the upstream and
downstream reach (Figure 8). Both axes were positively correlated with F. grandis (Table
2). Notropis amabilis and Etheostoma grahami were strongly negatively correlated with
axis 1. C. proserpina, C. venusta, A. mexicanus, L. macrochirus, L. megalotis, and L.
auritus were also positively correlated with axis 1. Axis 1 represents differences in fish
communities between the upstream and downstream sites. Downstream sites were
characterized by species that were intolerant of high salinity, whereas the upstream sites
were dominated by tolerant species. Axis 2 was also negatively correlated with minnow
species, Lepomis species, E. grahami, and C. cyanoguttatum.
Both NMS axes 1 and 2 were positively correlated with specific conductance
(Table 3). Conductivity was highest in the upstream sites and greatly contributed to
assemblage structure in this reach. The downstream sites had much lower conductivity
due to large amounts of freshwater input from springs. Axis 1 was also negatively
correlated with larger substrate types such as cobble, boulder, and bedrock, and positively
correlated with fine muddy substrates. This substrate gradient represents the shifts in
substrate composition between the upstream and downstream reach. Axis 1 is also
positively correlated with salt cedar and abundance of woody debris.

Texas Tech University, Christopher Cheek, August 2012 Texas Tech University, Christopher Cheek, August 2012
30
Table 3. Pearson correlations of measured environmental variables with NMS axes 1 and
2 for fish assemblages of the lower Pecos River in summer and October 2011. Pearson
correlations (r≥0.60, Bold) indicate strong assemblage-environment relationships.
r
Environmental
Variable Axis 1 Axis 2
Width -0.519 -0.686
Depth -0.0110 -0.445
Conductivity 0.732 0.617
pH 0.216 0.295
Chlorophyll-a 0.660 0.232
Turbidity 0.490 -0.00700
Maximum velocity 0.353 0.358
% Mud 0.746 0.506
% Sand 0.277 0.0200
% Gravel -0.0700 -0.133
% Cobble -0.534 -0.228
% Boulder -0.630 -0.526
% Bedrock -0.702 -0.445
% Riffle -0.538 -0.364
% Run 0.432 0.488
% Pool -0.167 -0.365
Algae -0.296 -0.128
Woody debris 0.614 0.103
Undercut -0.158 -0.387
Terrestrial vegetation 0.140 -0.095
Salt cedar 0.659 0.470
Macrophytes 0.408 0.369
Texas Tech University, Christopher Cheek, August 2012
31
Chapter IV
Discussion
Temporal Variation in Fish Assemblages
Fish assemblages in the lower Pecos River have changed markedly over a 24 year
time-span. Species replacement and distributional changes between time periods for
several species may be associated with increased salinity. For example, in 1987 F.
grandis was collected in low abundance (≤26 specimens) at five sites, four of which were
the most downstream. In 2011, this species was found to be highly abundant (up to 562
specimens) and sometimes dominant at upstream sites. F. grandis is tolerant to high
salinity levels that naturally exist in coastal waters of the Gulf of Mexico (Griffith 1974).
Natural tolerance to saline environments has allowed this non-native species to
proliferate in the upstream sites. Several other species also experienced changes in
abundance between the two time periods including Cyprinidon hybrids, M. beryllina, and
L. parva. Their ability to tolerate the high salinity levels and lack of competition from
stenohaline species has likely contributed to increased abundance of these species.
The inability of some species to tolerate high levels of salinity likely caused shifts
in spatial distribution. For example, the distribution of C. lutrensis largely decreased
between time periods. In 1987, C. lutrensis was the most abundant fish species and was
collected at every site except the most downstream location (Shumla). In 2011, C.
lutrensis was only collected at sites downstream of Sheffield. C. lutrensis is relatively
tolerant of salinity but the critical threshold of salinity tolerance was exceeded at five of
the nine upstream sites in 2011 (Mathews and Hill 1977). For this species, salinity may
have been a leading cause in distribution and abundance declines. Other species that

Texas Tech University, Christopher Cheek, August 2012
32
experienced decreases in distribution included, the stenohaline, A. mexicanus and C.
proserpina. Both were found in the upstream sites in 1987, but were only found in the
downstream sites in 2011.
Increased salinity may have also affected the distribution and abundance of the
euryhaline F. zebrinus, which was once abundant in the upstream reach of the Pecos
River, but has experienced recent and sugnificant declines (Hubbs 1957; Rhodes and
Hubbs 1992; Linam and Kleinsasser 1996). In 1987, F. zebrinus was collected at seven
sites in 1987, but it was only found in Independence Creek in 2011. Salinity levels are not
likely to limit the distribution of F. zebrinus in this system because their tolerance
exceeds the maximum salinity measured in the field (Ostrand and Wilde 2001). It is
plausible that the establishment of F. grandis, and subsequent interspecific competition
has led to a reduction in F. zebrinus abundance, rather than abiotic regulation. F. grandis
matures at a much greater size than F. zebrinis which may allow for competitive
advantages (Sublette et al. 1990). Previous studies also have suggested that F. zebrinus is
most successful in communities with few fish species (Echelle et al. 1972). Fish
communities in the upstream sites were comprised of only a few euryhaline species, but
those species were highly successful. Through competition, the high abundance of
tolerant species may play a role in declines of F. zebrinus.
Fundulus zebrinus is considered native to the Pecos River, and introduced into
Rio Grande tributaries in the Big Bend Region (Hubbs 1957; Kreiser et al. 2010). These
contrasting designations are surprising, because the regions are inherently linked by the
Rio Grande. If F. zebrinus is truly native to the Pecos River, natural dispersal could
Texas Tech University, Christopher Cheek, August 2012
33
account for the presence in Rio Grande tributaries. The introduced/native status of F.
zebrinus should be investigated further in this region.
Increased salinity levels between time periods may be perpetuated by oil and gas
production in the Pecos River Drainage. The results of this study resemble other studies
that examined the effects of waste water pollution from petroleum production. For
example, Shipley (1991) showed decreases in species richness from 20 to 4 species below
a waste water discharge in Texas. Chipman (1959) documented the persistence of tolerant
fish during fish kills in a freshwater pond polluted by oil waste. Other pollutants from oil
field waste such as trace metals and sulfate may also influence community structure, but
were not measured in this study. Sources of contemporary salinity should be investigated
to determine if oil and gas production is contributing to the increasing salinity.
Several studies have examined the effects of salinity on stream ecosystems. In
Great Plains streams, studies have indicated that salinity can play a large role in
structuring fish assemblages (Taylor et al. 1993; Higgins and Wilde 2005). Higgins and
Wilde (2005) also noted that salinity tolerance of some species may be associated with
species persistence in tributaries to the Red River, TX. In this case, species that had high
salinity tolerances were more likely to persist over time than intolerant species. Salinity
tolerant species are often adapted to high levels of disturbance, which allows for greater
survival (Higgins and Wilde 2005). The dominance of tolerant species in the upstream
reach may be explained by their natural adaptation to high levels of disturbance.
Decreases in biodiversity of flowing waters due to salinization have been well
documented. Much like the Pecos River, streams in Western Australia have been
negatively impacted by salinization due to agricultural irrigation and natural salinity

Texas Tech University, Christopher Cheek, August 2012
34
sources (Williams 2001). Decreases in diversity and increasing dominance of salt
tolerant species have been observed in Australia for several taxa including fishes,
macroinvertebrates, and aquatic plants (Bunn and Davies 1990; Williams 2001; James et
al. 2003).
Along with salinization, anthropogenic land use in the upstream reach may be
impacting fish assemblages. Many of the upstream sites have been affected by
channelization and increases in fine sediments. Association between channelization and
degradation of stream habitat has been well documented. Channelization causes
decreased riffle/pool habitat, riparian vegetation, and stream sinuosity (Emerson 1971;
Shields et al. 1998) as well as, channel erosion and decreased habitat heterogeneity
(Sullivan et al. 2004). Decreases in fish diversity and community quality have been
attributed to this type of habitat alteration (Etnier 1972; Gorman and Karr 1978). Along
with increases in salinity, this shallow monotypic habitat may be contributing to
decreases in fish diversity in the upstream reach (Hoagstrom 2009).
Interpretation of assemblage shifts between time periods was complicated by fish
kills that occurred in 1986. In this study I documented increases in species richness
between time periods in the downstream sites. This pattern is opposite of what I found in
the upstream reach. Species richness in 1987 was likely reduced by a massive fish kill
that occurred in the previous year (Rhodes and Hubbs 1992). Golden algae blooms
occurred near Iraan, TX and extended downstream to Amistad Reservoir, affecting three
upstream sites and all downstream sites, except Independence Creek. Recolonization of
fishes after the fish kill was likely still occurring during the October 1987 collections.
This may have resulted in the absence of some species in the 1987 collections. Upstream

Texas Tech University, Christopher Cheek, August 2012
35
sites were likely colonized more rapidly by salinity tolerant species that were still
abundant upstream of the algae bloom. Some salinity tolerant species were not
significantly affected by the golden algae toxic blooms including Cyprinodon hybrids and
G. affinis (Rhodes and Hubbs 1992). This allowed for rapid recolonization of upstream
reach. Fishes in the downstream reach were confined by high salinity upstream and
Amistad Reservoir downstream. Therefore, the mainstem of the river was likely
recolonized by populations in spring fed tributaries. Tributaries such as Independence
Creek, likely acted as refugia for colonizing populations in the downstream reach
(Rhodes and Hubbs 1992).
Recent observations in the downstream reach suggest that many fish species have
recolonized since the 1987 collections, although at least two species never recovered.
Notropis jemezanus and M. aestivalis were common before the fish kill, but abundances
were significantly reduced in subsequent samples (Hubbs 1990). In October 1987, N.
jemezanus was represented by only one specimen and M. aestivalis was represented by
16 specimens at a single site. Both species were absent from recent collections indicating
that they may have never recovered from the fish kill or that other factors affected their
contemporary abundance.
Overall, our results show that the downstream sites have a relatively intact fish
fauna when compared to recent historical accounts. The presence of fish species that are
more sensitive to anthropogenic disturbance in the downstream sites may indicate that
these areas are isolated from the salinization and hydraulic alteration that affects the
upstream reach. The presence of spring flow is likely associated with the persistence of
species that are intolerant of anthropogenic impacts in the lower reach.

Texas Tech University, Christopher Cheek, August 2012
36
Spatial Variation of Fish Assemblages
Changes in species assemblages along a longitudinal gradient have widely been
attributed to two processes, biotic zonation and continual addition of species. Biotic
zonation refers distinct community composition that results from discontinuities in the
geomorphic or abiotic conditions along a longitudinal gradient (Schlosser 1982; Rahel
and Hubert 1991; Oberdorff et al.1993; Belliard et al.1997). Species addition is most
often observed where environmental gradients exhibit smooth transitions (Sheldon 1968;
Rahel and Hubert 1991). In this case, accumulation of species is often attributed to
increases in habitat size, habitat diversity, and environmental stability in a downstream
pattern (Winemiller 1983; Angermeier and Schlosser 1989; Winemiller and Leslie 1992;
Matthews and Styron 1981; Grossman et al. 1982).
The results of this study show a pattern of zonation with two major zones of fish
assemblages, upstream and downstream. These zones are primarily determined by two
factors, salinity and habitat heterogeneity. Disparity in these factors between reaches is
associated with the level of anthropogenic disturbance as well as natural geologic
formations.
Water quality differences appear to contribute to the division of distinct fish
assemblages in the upstream and downstream reach. In the upstream reach fish
assemblages are controlled primarily by high salinity. The downstream reach has lower
salinity levels due to freshwater spring inflows. Several studies have indicated that
competitive advantages of fish can shift based on abiotic factors such as salinity or

Texas Tech University, Christopher Cheek, August 2012
37
temperature (Baltz et al. 1982; Dunson and Travis 1991). Species intolerant of the high
salinity levels likely out compete tolerant species in the lower salinity waters, leading to
assemblage differences. Springs also increase the total discharge and supply constant
flow downstream which increases habitat size and stability. Tributaries fed by spring
flow are also important for reproduction of some species, such as Dionda episcopa
(Hubbs 1957). Therefore, spring flows that separate the upstream and downstream reach
alter fish assemblages along a longitudinal gradient.
Differences in fish assemblage between the upstream and downstream reach is
likely related to differences in habitat, particularly substrate heterogeneity. Changes in
substrate composition downstream are attributable to natural characteristics of the
Permian Basin and Edwards Plateau. Land use practices also may affect each region,
individually. In the Permian Basin (upstream sites), mud was the dominant substrate type,
with little large substrate present in the river. The upstream reach mostly consisted of run
habitat with few riffles and pools. Habitat heterogeneity in this reach is influenced by the
lack of historical flow regimes that would naturally transport fine sediments. Monotypic
habitat features along with salinity may have led to decreased fish diversity and increased
dominance of tolerant species. Alternatively, the Edwards plateau reach (downstream
reach) is dominated by large substrate such as cobble, boulder, and bedrock. Riffles are
also more prominent with increased gradient and substrate size in the downstream reach.
The presence of species adapted to riffle habitat, such as E. grahami, may partially
explain increases in diversity. Substrate heterogeneity may also be important for species
that require multiple substrate types for reproduction or recruitment. The downstream
reach has been less impacted by human alteration, and likely retains habitat heterogeneity

Texas Tech University, Christopher Cheek, August 2012
38
similar to historical standards. In the Pecos River this may partly explains the increase in
diversity between upstream and downstream reach.
Historical records indicate that this zonation pattern was likely present but not as
pronounced as was found in this study. In an analysis of historical and recent fish
collections, Hoagstrom (2001) found that there were once 27 species of fish that had
distributions that spanned the entire lower Pecos River. In recent collections only 9
species were found in every segment. Increases in salinity and anthropogenic disturbance
likely lead to altered distributions of fishes in the lower Pecos River and enhanced the
effects of natural zonation.
This study illustrates the importance of the downstream reach of the Pecos River
for preserving the system’s biodiversity. Because the upstream reach has unsuitable water
quality for many species, the protection of this region is vital. To prevent the degradation
of water quality and habitat it is important to preserve the many springs that reduce
salinity and provide downstream flow. This includes the protection of aquifers and
spring-fed tributaries that feed the downstream reach. The Nature Conservancy has taken
the initiative to protect Independence Creek, but other sources of freshwater and the
surrounding watershed should also be protected.
Upstream sources of anthropogenic alteration must also be managed to preserve
diversity in the downstream reach. Regulation and mitigation of saline waste water
disposal could prevent further pollution. Preventing the salinization of surface and ground
water is both economically and ecological beneficial. Aquatic communities will benefit
from the reduced salinity, but crop producers and municipalities would also benefit by
preventing further salinization of aquifers used for drinking and irrigation water. Better

Texas Tech University, Christopher Cheek, August 2012
39
management of regional aquifers, changes to irrigation practices, mitigation of petroleum
waste water, and proper flow regulation could reduce salinity levels and restore habitat in
this region.

Texas Tech University, Christopher Cheek, August 2012
40
Literature Cited
Angermeier, P.L. & Schlosser, I. J. 1989. Species area relationships for stream fishes.
Ecology 70: 1450-1462.
Ashworth, J.D. 1990. Evaluation of water resources in parts of Loving, Pecos, Reeves,
Ward, and Winkler Counties, Texas. Austin, Texas: Texas Water Development
Board Report, 317.
Baker, F.G. & Brendecke, C. M. 1983. Seepage from oilfield brine disposal ponds in
Utah. Ground Water 21: 317-324.
Baltz, D.M., Moyle, P.B. & Knight, N. J. 1982. Competitive interactions between benthic
stream fishes: riffle sculpin Cottus gulosus, and speckled dace Rhinichthys
osculus. Canadian Journal of Fish and Aquatic Sciences39: 1502-1511.
Belliard, J., Boët, P. & Tales, E. 1997. Regional and longitudinal patterns of fish
community structure in the Seine River Basin, France. Environmental Biology of
Fishes 50: 133-147.
Bogan, A.E. 1993. Freshwater bivalve extinctions (Mollusca: Unionoida): a search for
causes. American Zoologist33(6): 599-609.
Bonner, T.H., Thomas, C., Casey, Williams, S., & Karges, J.P. 2005. Temporal
assessment of a West Texas stream fish assemblage. Southwestern Naturalist 50:
74-78.
Brune, G. 2002. Springs of Texas, 2nd ed. College Station, Texas: Texas A&M
University Press.
Bunn, S.E., & Davies, P.M. 1990. Why is the stream fauna of southwestern Australia so
impoverished? Hydrobiologia 194:169–176.
Campbell, L. 1959. Basic survey and inventory of species present in the Pecos River of
Texas. Dingell-Johnson Project F-5-R-5, Job 13. Austin, Texas: Texas Game and
Fish Commission.
Chipman, R.K. 1959. Studies of tolerance of certain freshwater fishes to brine water from
oil wells. Ecology 40: 299-302.
Clarke, K.R. 1993. Non-parametric multivariate analysis of changes in community
structure. Australian Journal of Ecology 18: 117-143.
Cummins, K. 1962. An evaluation of some techniques for collection and analysis of
benthicsamples with a special emphasis on lotic waters. American Midland
Naturalist 67:477-504.
Texas Tech University, Christopher Cheek, August 2012
41
Davis, J.R. 1980. Species composition and diversity of benthic macroinvertebrates in the
Upper Rio Grande, Texas. Southwestern Naturalist 25:137-150.
Davis, J. 1987. Faunal characteristics of a saline stream in the Northern Chihuahuan
Desert. Contributed papers of the second symposium on resources of the
Chihuahuan Desert, United States and Mexico. Alpine, Texas: Chihuahuan Desert
Research Institute, pp. 18-24.
Dirzo, R. & Raven, P. H. 2003. Global state of biodiversity and loss. Annual Review of
Environmental Resources 28:137–67.
Dunson, W.A. & Travis, J. 1991. The role of abiotic factors in community organization.
American Naturalist 138: 1067-1091.
Echelle, A. & Connor, P. 1989. Rapid geographically extensive genetic introgression
aftersecondary contact between two pupfish species (Cyprinodon,
Cyprinidontidae). Evolution 43:717-727.
Echelle, A.A., Echelle, A.F., & Hill, L.G. 1972. Interspecific interactions and limiting
factors of abundance and distribution in the Red River pupfish, Cyprinodon
rubrofluviatilis. American Midland Naturalist 88:109-130.
Edwards, R.J. Garrett, G.P. & Marsh-Matthews, E. 2002. Conservation and status of the
fish communities inhabiting the Rio Conchos basin and middle Rio Grande,
Mexico and U.S.A. Reviews in Fish Biology and Fisheries 12: 119–132.
Emerson, J.W. 1971. Channelization: a case study. Science 173: 325-326.
Etnier, D.A. 1972.The effect of annual rechanneling on a stream fish population.
Transactions of the American Fisheries Society 101: 372-375.
Fuller, S.L. 1974. Clams and mussels. In: C. W. Hart, Jr. & S. L. Fuller, eds., Pollution
ecology of freshwater invertebrates. New York, Academic Press, pp. 215-273.
Gauch, H.G. 1982. Multivariate analysis in community ecology. Cambridge, England:
Cambridge University Press.
Gregory, L. & Hatler, W. 2008. A watershed protection plan for the Pecos River in
Texas. Texas Water Resources Institute: College Station, Texas. Available from:
http://pecosbasin.tamu.edu/media/5734/pecosriverwpp.pdf
Griffith, R.W. 1974. Environment and salinity tolerance in the genus Fundulus. Copeia
2:319-331.

Texas Tech University, Christopher Cheek, August 2012
42
Grossman, G.D., Moyle, P. B. & Whittaker, J. O.1982. Stochasticity in structural and
functional characteristics of an Indiana stream fish assemblage: a test of
community theory. American Naturalist 120: 423-454.
Gorman, O.T. & Karr, J.R. 1978. Habitat structure and stream fish communities. Ecology
59:507–515.
Gotelli, N.J. & Graves, G.R. 1996. Null models in ecology. Washington, DC:
Smithsonian Institution Press.
Gotelli, N.J. & Entsminger, G.L. 2001.EcoSim: Null models software for ecology.
Version 7 Acquired Intelligence Inc. and Kesey-Bear
http://garyentsminger.com/ecosim/index.htm.
Hart, C.R., White, L.D., Mcdonald, A., & Sheng, Z. 2005. Saltcedar control and water
salvage on the Pecos river, Texas, 1999–2003. Journal of Environmental
Management 75: 399-409
Havens, J.S. & Wilkins, D.W. 1979. Experimental salinity alleviation at Malaga Bend of
the Pecos River, Eddy County, New Mexico. U.S. Geological Survey water-
resources investigations 80-4. Washington, DC: U.S. Government Printing Office.
Higgins, C.L. & Wilde, G. R. 2005.The role of salinity in structuring fish assemblages in
a prairie stream system. Hydrobiologia 549:197–203.
Hoagstrom, C.W. 2001. Historical and recent fish fauna of the lower Pecos. In:
Contributed papers from a special session within the thirty-third annual
symposium of the desert fishes council held at Sul Ross State University in
Alpine, TX. In: Occasional Papers Museum of Texas Tech University. 21 pp.
Hoagstrom, C.W. 2009. Causes and impacts of salinization in the lower Pecos
River.Great Plains Research 19: 27-44.
Hoagstrom, C.W., Nikolas, D. Z., Davenport, S. R., Propst, D. L. & Brooks, J. E. 2010.
Rapid species replacements between fishes of the North American plains: a case
history from the Pecos River. Aquatic Invasions 5: 141-153.
Hubbs, C. 1957. Distributional patterns of Texas fresh-water fishes. Southwestern
Naturalist 2: 89-104.
Hubbs, C. 1990. Declining fishes of the Chihuahuan Desert. Third Symposium on
Resourcesofthe Chihuahuan Desert Region, U.S. and Mexico. Chihuahuan Desert
Research Institute, Alpine, Texas, pp. 89-96.
Texas Tech University, Christopher Cheek, August 2012
43
Hubbs, C., Edwards, R.J., & Garrett, G.P. 1991. An annotated checklist of the freshwater
fishes of Texas, with keys to identification of species. Texas Journal of Science
43:1-56.
Hubbs, C., Edwards, R.J. & Garrett, G.P. 2008.An annotated checklist of the freshwater
fishes of Texas, with keys to identification of species. Texas Academy of Science.
Available from: http://www.texasacademyofscience.org/
James, K.R. Cant, B. & Ryan, T. 2003. Responses of freshwater biota to rising salinity
levels and implications for saline water management: a review. Australian Journal
of Botany 51: 703-713.
Kreiser, B.R., Mitton, J.B., & Woodling, J.D. 2001. Phylogeography of the plains
killifish, Fundulus zebrinus. Evolution 55: 339-350.
Linam, G.W. & Kleinsasser, L. J. 1996. Relationship between fishes and water quality in
the Pecos River, Texas. River Studies Report No. 9, Resource Protection
Division, Texas Parks and Wildlife, Austin, Texas.
Lingle, R.T. & Linford, D. 1961. The Pecos River commission of New Mexico and
Texas: a report of a decade of progress, 1950-1960. Santa Fe, NM: Rydal Press.
Matthews, W.J. & Hill, L. G. 1977.Tolerance of the red shiner, Notropis lutrensis
(Cyprinidae) to environmental parameters. Southwestern Naturalist 22: 89-98.
Matthews, W.J. & Styron, Jr., J. T. 1981.Tolerance of headwater vs. mainstream fishes
for abrupt physicochemical changes. American Midland Naturalist 105: 149-158.
McCune, B. & Grace, J.B. 2002. Analysis of ecological communities. Gleneden Beach,
Oregon: MjM Software Design.
Miller, R.R. & Chernoff, B. 1979.Status of populations of the endangered Chihuahua
chub, Gila nigrescens, in New Mexico and Mexico. Proceedings of the Desert
Fishes Council 11: 74-84.
Oberdorff, T., Guilbert, E. & Luchetta, J.C. 1993. Patterns of fish species richness in the
Seine River basin, France.Hydrobiologia 259: 157-167.
Ostrand, K.G. & Wilde, G.R. 2001. Temperature, dissolved oxygen, and salinity
tolerance of five prairie stream fishes and their role in explaining fish assemblage
pattern. Transactions of the American Fisheries Society 130: 742-749.
Pettyjohn, W.A. 1971. Water pollution by oil-field brines and related industrial wastes in
Ohio. Ohio Journal of Science 71: 257-269.
Texas Tech University, Christopher Cheek, August 2012
44
Pillard, D.A., Dufresne, D.L., Tietge, J.E., Evans, J.M. 1999. Response of mysid shrimp
(Mysidopsis bahia), sheepshead minnow (Cyprinodon variegatus), and inland
silverside minnow (Menidia beryllina) to changes in artificial seawater salinity.
Environmental toxicology and chemistry 18:430-435.
Pillsbury, A.F. 1981. The salinity of rivers. Scientific American 245: 54-65.
Propst, D.L. & Stefferud, J.A. 1994.Distribution and status of the Chihuahua chub
(Teleostei: Cyprinidae: Gila nigrescens), with notes on its ecology and associated
species. Southwestern Naturalist 39: 224–234.
Rahel, F.J. & Hubert, W.A. 1991. Fish assemblages and habitat gradients in a Rocky
Mountain-Great Plains stream: biotic zonation and additive patterns of
community change. Transactions of the American Fisheries Society 120: 319-332.
Rhodes, K. & Hubbs, C. 1992. Recovery of Pecos River fishes from a red tide fish kill.
The Southwestern Naturalist 37:178-187.
Rinne, J.N. 1995. The effects of introduced fishes on native fishes: Arizona, southwestern
United States, In: Philipp, D.P, ed. Protection of Aquatic Diversity. Proceedings
of the World Fisheries Conference, Theme 3. New Delhi: Oxford and IBH
Publishing Co. Pvt. Ltd., pp. 149-159.
Sanders, H.L. 1968. Marine benthic diversity: a comparative study. American Naturalist
102: 243-282.
Schlosser, I.J. 1982. Fish community structure and function along two habitat gradients in
a headwater stream. Ecological Monographs 52: 395-414.
Shafroth, P.B., Cleverly, J.R., Dudley, T.L., Taylor, J.P., Van Riper, C., Weeks, E.P. &
Stuart, J.N. 2005. Control of Tamarix in the Western United States: implications
for water salvage, wildlife use, and riparian restoration. Environmental
Management 35:231–246.
Sheldon, A.L. 1968. Species diversity and longitudinal succession in stream fishes.
Ecology 49: 193-198.
Shields, F.D., Knight, S.S., & Cooper, C.M. 1998.Rehabilitation of aquatic habitats in
warmwater streams damaged by channel incision in Mississippi. Hydrobiologia
382: 63-86.
Shipley, F. 1991. Oil field-produced brines in a coastal stream: water quality and fish
community recovery following long term impacts. Texas Journal of Science
43:51-64.

Texas Tech University, Christopher Cheek, August 2012
45
Smith, M.L. & Miller, R.R. 1986. The evolution of the Rio Grande Basin as inferred from
its fish fauna. In: The zoogeography of North American freshwater fishes. In:
Hocutt, C.H. & Wiley, E.O., ed. The zoogeography of North American freshwater
fishes. New York: John Wiley and Sons, pp. 457-485.
Southard, G.M., Fries, L.T. & Barkoh, A. 2010. Prymnesium parvum: the Texas
experience. Journal of American Water Resources Association 46: 14–23.
Sublette, J.E., Hatch, M.D., & Sublette, M. 1990. The Fishes of New
Mexico.Albuquerque, NM: University of New Mexico Press.
Sullivan, B.E., Rigsby, L.S., Berndt, A., Jones-Wuellner, M., Simon, T.P., Lauer, T.E. &
Pyron, M. 2011. Habitat influence on fish community assemblage in an
agricultural landscape in four east central Indiana streams. Journal of Freshwater
Ecology 19:141-148.
Taylor, C.M., Winston, M.R., Mathews, W.J. 1993.Fish species-environment and
abundance relationships in a Great Plains river system. Ecography 16: 16-23.
Taylor, C.M., Millican, D.S., Roberts, M.E. & Slack, W.T. 2008. Long-term change to
fish assemblages and the flow regime in a southeastern U.S. river system after
extensive aquatic ecosystem fragmentation. Ecography 31: 787-797.
Winemiller, K.O. 1983.An introduction to the freshwater fish communities of Corcovado
National Park, Costa Rica. Brenesia 21: 47-66.
Winemiller, K.O. & Leslie, M.A. 1992.Fish assemblages across complex, tropical
freshwater/marine ecotone. Environmental Biology of Fishes 34: 29-50.
Williams, J.E., Bowman, D.B., Brooks, J.E., Echelle, A.A. Edwards, R.J., Hendrickson,
D.A. and Landye, J.J. 1985. Endangered aquatic ecosystems in North American
deserts with a list of vanishing fishes of the region. Journal of Arizona-Nevada
Academy of Science 20: 1-61.
Williams, W.D. 1987. Salinization of rivers and streams: an important environmental
hazard. Ambio 16:180-185.
Williams, W.D. 2001. Salinization: unplumbed salt in a parched landscape. Water
Science and Technology 43: 85–91.