Embed Size (px)
Citation preview
.&!> I RI[ 8783
1
PLEASE DO NOT REMOVE FRG1 LIBRARY
Bureau of Mines Report of Investigations/1983
Copper-Manganese-Base Silverless Brazing Systems
By V. R. Miller and W. L. Falke
lJNITED STATES DEPARTMENT OF THE INTERIOR

Report of Investigations 8783
Copper-Manganese- Base Silverless Brazing Systems
By V. R. Miller and W. l. Falke
UNITED STATES DEPARTMENT OF THE INTERIOR
James G. Watt, Secretary
BUREAU OF MINES Robert C. Horton, Director

This publication has been as follows:
Miller, V. R. (Vernon , 194 1· COPP""mangane se-basc s il verless bra zin IS sy stems.
(Report of investigutions / Unired States Departmenr 01 tEl<' In!erior, Bureau of Mines; 8783)
Bibliography: p. 13.
SIIpr. of Docs. no.: I 28.23;8783.
1. alloys. 2. Manganese-copper alloys. L Falke, W. L. (Wilbert L.). Till". II!. Series: Ih'porr 01 inll";,,igations (United Smtes. Burc'a" of Mines) : 8783.
TN 2J 6228 [671.5'6] 83-600112

CONTENTS
Abstrac-t ........•................•••.•.......•..•......•.•....•.•.............. lnt roduction. II II II • II •• II • II. II II II II II II ••• II • II ..... II ..... II •••• II •• II • II II II •• II • • II • II II • II II II II •• II II • II II
Background ••••••••••••••••••.•.•••••.•••.•••. Experimental materials and procedure •••••••••••••••••••••••••••••••
Materials • .... II • II. II II II II •••• II • II •• II II •• II ••••• II ••••••••• II • II • II •• II II II •••• II • II •• II •• II
Procedure II •• II II ••• II • II •••• II •• II II II II • II II •• II • II • II II II • II II •• II II II II •••••• II II II II • II II •••• II II • II II
Results and discussion. II. II II II ••• II II •••• II II ••• II II II ••• II •• II •• II •• II. II. II II II. II •• II II II. II II •••• II
Wetting tests ••••••••••••••••• Joint strength tests ••••••••••
Conclusions •••••••••••. References •....•••.•••. Appendix A.--Silver filler metal joint strengths ••• Appendix B.--Experimental alloy joint strengths ••••
ILLUSTRATIONS
1 2 2 3 3 4 5 5 8
12 13 14 15
1. Cross sections of filler alloys on various substrates.................... 7 2. 3. 4. 5. 6. 7. 8.
9.
10.
1. 2. 3.
4.
Shear strength of copper joints brazed with silver filler alloys......... 9 Shear strength of brass joints brazed with silver filler alloys.......... 9 Shear strength of steel joints brazed with silver filler alloys.......... 9 Shear strength of copper joints brazed with experimental Cu-Mn-Zn alloys. 9 Shear strength of brass joints brazed with experimental Cu-Mn-Zn alloys.. 10 Shear strength of steel joints brazed with experimental Cu-Mn-Zn alloys.. 10 Shear strength of copper joints brazed with experimental Cu-Mn-Zn-Ni,
Cu-Mn-Zn-Pb, and Cu-Mn-Sn alloys. II II II •• II •• II • II II • II II •• II II ••• • II ••• II II II •• II 10 Shear strength of brass joints brazed with experimental Cu-Mn-Zn-Ni,
Cu-Mn-Zn-Pb, and Cu-Mn-Sn alloys ••••••••••••••••••••••••••••••••••••• 10 Shear strength of steel joints brazed with experimental Cu-Mn-Zn-Ni,
Cu-Mn-Zn-Pb, and Cu-Mn-Sn alloys ••••••••••••••••••••••••••••••••••• 11
TABLES
Silver filler alloy compositions and temperatures •••••••••••••••••.•••••• Experimental filler alloy compositions and temperatures •••••••••••••••••• Silver filler alloy spread areas formed in 30 sec at different tempera-
3 4
tures above the liquidus ••••••••••••••••••••••••••••••••••••••••••••••• 5 Silver filler alloy spread areas for different periods at 60° C above the
liquidus.. .. .. .. .. . ....... ... . . . . ..... ... ... . . . ... . ..... . . . . . ... . . . . .. . . . . . .. . . . . .... .. . . . 5 5. Experimental filler alloy spread areas formed in 30 sec at 60° C above
6.
A-I. B-I. B-2.
the liquidus ............................................................. .:;...,. Experimental filler alloy spread areas at 60° C above the liquidus for
30 sec using a laboratory-prepared flux •••••••••••••••••••••••••••••••• Strength of joints brazed with silver alloys ••••••••••••••••••••••••••••• Strength of joints brazed with experimental Cu-Mn-Zn alloys •••••••••••••• Strength of joints brazed with experimental Cu-Mn-Zn-base and Cu-Mn-Sn
6
6 14 15
alloys........................................................................... 16

UNIT OF MEASURE ABBREVIATIONS USED IN THIS REPORT
" C degree Celsius min minute
g gram ~1n microinch
in inch percent
in2 square inch sec second
in/min inch per minute weight-percent
ksi thousand pounds per square inch

COPPER.MANGANESE.BASE SILVERLESS BRAZING SYSTEMS
By V. R. Miller 1 and W. L. Falke 2
ABSTRACT
The Bureau of Mines conducted research on substitute brazing filler alloys with properties similar to those of silver filler alloys in an effort to conserve silver and reduce hazards from cadmium emissions. Experimental work was conducted first on the commercial silver brazing alloys BAg-I, BAg-la, BAg-2, and BAg-3 to establish criteria for evaluating the substitute alloys. Properties investigated included the wettability of copper, brass, and steel substrates, and the strength of joints made with the filler alloys. A series of experimental alloys containing 50 to 60 pct Cu, 20 to 28 pct Mn, and 17 to 30 pct Zn was prepared and evaluated, together with Cu-Mn-Zn alloys with 5 pct Pb or 2 pct Ni. Wetting properties and joint strengths were not as good as those for silver filler alloys, and the high application temperatures reduced the copper and brass base metal strengths. However, experimental alloys cont.aining 70 pct Cu, 15 to 20 pct Mn, and 10 to 16 pct Sn had wetting and strength properties approaching those of the silver filler alloys. The application temperatures for these alloys were higher than those for silver fillers, but not as high as those for the CuMn-Zn alloys. With the Cu-Mn-Sn alloy fillers, copper alloy joint members are less deteriorated by recrystallization than when applying Cu-Mn-Zn alloys. The Cu-Mn-Sn system has potential for further development as a substitute brazing alloy system, particularly if the melting temperature can be reduced by the addition of other elements without decreasing the ductility and wetting.
'Supervisory research physicist, Rolla Research Center, Bureau of Mines, Rolla, Mo. 2Supervisory research chemist, Rolla Research Center, Bureau of Mines, Rolla, Mo.

2
INTRODUCTION
Inherent in the goals of Bureau of Mines Research in the minerals and materials area is a continuing endeavor to minimize the requirements for critical and scarce mineral commodities through substitution and conservation. Owing to the limited reserves and widening use of silver, its conservation is vital. This is especially true for silver brazing alloys because their use is largely dissipative. One means to conserve and efficiently utilize silver is to develop brazing filler alloys to substitute for silver brazing alloys, which consumed 8.5 million troy ounces in 1980.
The research described in this report was undertaken in an effort to obtain silverless filler alloys exhibiting
properties similar to those of silver filler alloys as a means to conserve silver by substitution and to reduce hazards from cadmium emissions. As an initial step in developing silverless brazing alloys, some selected properties of silver brazing alloys were determined to establish criteria for evaluating possible substitutes. These properties were the wettability of copper, brass, and steel substrates by the filler alloys and the strength of joints made with the filler metals. Experimental filler alloys were prepared from ternary Cu-Mn-Zn and Cu-Mn-Sn systems, with or without additions of other metals, to evaluate the potential of these alloys as substitutes for silver filler alloys.
BACKGROUND
Brazing, like forge welding, is one of the oldest metal joining processes. A brazing process for the fabrication of gold jewelry was in use around 600 B.C. by the Etruscans of northwest Italy (14).3 With the advent of the Iron Age and ferrous technology, copper-zinc filler metals, called spelter, were developed for joining iron and steel. Theophilus, writing in the 10th century A.D., makes reference to a metal joining process used by the Chinese, which probably used copper-zinc alloys (14).
Paralleling the development of lowmelting-point gold filler metals was the discovery of silver-base filler alloys exhibiting low melting points. These were developed by silversmiths for use in their craft (2). The process seems to have been forgotten, as far as written records show, until 1865 when Cu-Zn-Ag alloys were used to braze joints in the transatlantic telegraph cable. In 1890, Cu-Zn-Ag alloys were used for brazing turbine blades in steam engines (14). The use of silver filler alloys expanded
3Underlined numbers in parentheses refer to items in the list of references preceding the appendixes.
during the next 35 years, and in 1929 the American Society for Testing and Materials established specifictions for silver brazing all.o-¥-s (l)~ The 1i terature up till that date consisted largely of formulas which specified a certain portion of silver and brass to be used to make more malleable and lower melting alloys. Little definitive information regarding the physical properties of the silver filler alloys was given. The work on establishing standards for the silverbearing fillers was to recommend a suitable number of compositions to meet the different trade requirements (ll).
In the early 1930's, cadmium was added to the Cu-Zn-Ag filler alloys to produce lower melting and more ductile alloys (12). The alloy patented is now categorized under American Welding Society (AWS) classification BAg-la. During the 1940's widespread industrial acceptance of the Ag-Cu-Zn-Cd alloys occurred as their employment became necessary in many military manufacturing processes (10). In the ensuing years, many complex forgings and stampings were redesigned to allow fabrication by brazing of parts produced by mass production lechniques (13) •
Beginning in the ]950's and continuing into recent years, brazing research turned toward the basics of metallurgical principles involved in metallic bonding (5-8). During this time, alloy development continued but in a different direction. The advent of jet aircraft, missiles, and the space age made it obvious that the early silver brazing alloys were no longer adequate to meet many of the special requirements of these advanced designs (lQ). Subsequently, research was directed toward ductile alloys for elevated--temperature service and included nickel-base alloys as well as precious metal alloys of gold or palladium or both (9).
In the 1970's, the introduction of a threshold limit value for cadmium in European countries resulted in the decision to switch to cadmium-free filler alloys
3
rather than install fume-extraction equipment. However, there were no direct replacement alloys equal in physical properties and intrinsic costs. The AgCu-Zn ternary alloys were ava~lable but required a 55-pct Ag content if solidus temperatures as low as 630 0 C were to be achieved (15). The research on cadmiumfree filler-alloys was spurred on by the rising cost of silver. In the United States, the rising silver cost was somewhat offset in the brazing industry by the use of filler alloys of somewhat l'educed silver content. The decreased "ilver content did, however, result in higher brazing temperatures, longer brazing periods, and increased difficulty in flux removal, all of which increase production costs. Consequently, there is a practical limit to the reduction of silver in Ag-Cu-Zn-Cd filler alloys.
EXPERIMENTAL MATERIALS AND PROCEDURE
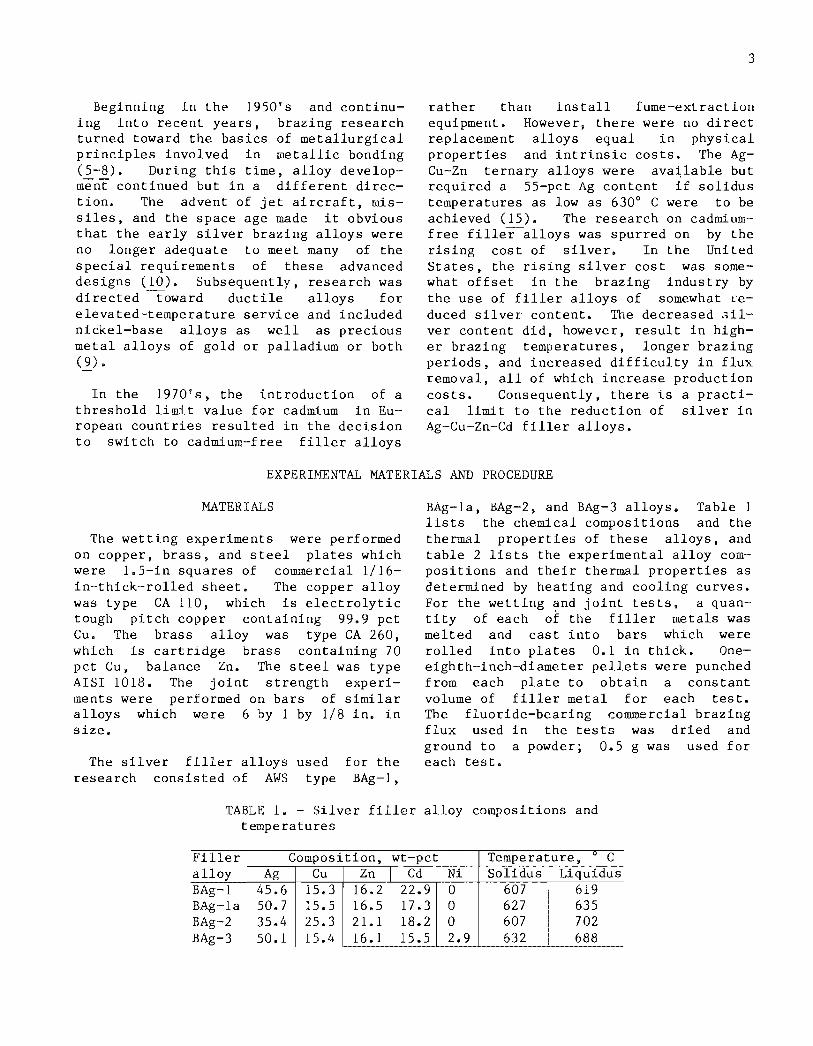
MATERIALS
The wetting experiments were performed on copper, brass, and steel plates which were 1.5-in squares of commercial 1/16-in-thick-rolled sheet. The copper alloy was type CA 110, which is electrolytic tough pitch copper containing 99.9 pct Cu. The brass alloy was type CA 260, which is cartridge brass containing 70 pct Cu, balance Zn. The steel was type AISI 1018. The joint strength experiments were performed on bars of similar alloys which were 6 by 1 by 1/8 in. in size.
The silver filler alloys used research consisted of AWS type
for the BAg-I,
BAg-la, BAg-2, and BAg-3 alloys. Table 1 lists the chemical compositions and the thermal propertieG of these alloys, and table 2 lists the experimental alloy compositions and their thermal properties as determined by heating and cooling curves. For the wetting and joint tests, a quantity of each of the filler metals was melted and cast into bars which were rolled into plates 0.1 in thick. Oneeighth-inch-diameter pellets were punched from each plate to obtain a constant volume of filler metal for each test. The fluoride-bearing commercial brazing flux used in the tests was dried and ground to a powder; 0.5 g was used for each test.
TABLE 1. - Silver filler alloy compositions and temperatures
Filler Composition, wt-pct Temperature, 0 C alloy Ag Cu Zn Cd Ni Solidus Liquidus BAg-l 45.6 15.3 16.2 22.9 0 607 619 BAg-la 50.7 15.5 16.5 17.3 0 627 635 BAg-2 35.4 25.3 21.1 18.2 0 607 702 BAg-3 50.1 15.4 16.1 15.5 2.9 632 688

4
TABLE 2. - Experimental filler alloy compositions and temperatures
Filler Composition, wt-pct Temperature, o C
alloy Cu Mn Zn Sn 1 ••••• 59.3 20.0 20.7 0 2 ••••• 55.2 20.3 24.5 0 3 ••••• 50.2 20.0 29.8 0 4 ••••• 52.7 28.1 19.2 0 5 ••••• 50.0 24.0 23.9 0 6 ••••• 52.2 25.5
I 17.3 0
7 ••••• 69.8 14.4 0 15.8 8 ••••• 70.4 19.7 0 9.9
PROCEDURE
Prior to wetting and joint strength tests, the copper and brass plates and bars were degreased in a common solvent, pickled in a 5-pct-sulfuric-acid solution, and etched for 1 min in a 30-pctnitric acid solution. Steel specimens were similarly degreased and pickled, but etching was conducted in a 10-pct-Nital solution for 5 min. The etching procedures were experimentally determined so that a surface roughness of 30 to 40 ~in was obtained.
For wetting tests, the square plates were placed inside an induction coil and supported on three ceramic supports (1/8-in diameter) for heating. The bottom side of the plate was sprayed with a flat black, heat-resistant paint prior to insertion. This coating was used to obtain a constant emittance for the infrared sensor used to measure the temperature of the plates. The temperature sensor was focused on the bottom of the plate directly beneath the test sample of filler alloy. The temperature-measuring system was calibrated by noting the deviations in melting points of standards heated on various plates. Measured temperatures were within 2 0 C of the melting temperatures of the standards.
Wetting experiments were performed by placing the commercial flux on a plate and heating it to the desired temperature. The filler alloy was then placed on the plate and allowed to spread for a specified time after melting. Fumes from fluxes and metals were removed by an exhaust duct located above the specimens.
Ni Pb Solidus Liquidus 0 0 816 836 0 0 812 830 0 0 805 825 0 0 839 847 2.1 0 826 840 0 5.0 802 812 0 0 725 760 0 0 800 810
The power to the induction coil was then turned off and the drop allowed to solidify before the plate was removed from the coil.
The solidified spread areas were measured to obtain quantitative data on the effect on wetting properties of the various parameters and alloy compositions. The area of spread was used as an indicator of the wettability of the filler metals. The spread areas were measured by photographing the plates along with a graduated scale. The negatives were placed in a modified microfilm reader, and the spread-area image was projected onto a flat white surface at a magnification of 36 times. A planimeter was then used to measure the area. Five plates were prepared and measured for each variable tested, and an average value for the spread area was calculated.
Lap-joint specimens for measuring shear strengths were prepared in accordance with AWS C3.2-63, Standard Method for Evaluating the Strength of Brazed Joints, with one exception. The exception was that the bars were riveted at the various overlaps rather than tungsten-inert-gas welded. Welding was tried, but for the copper bars the excessive heat caused severe oxidation in the joint and sound joints were difficult to obtain. For comparative purposes, all joints were " assembled in the same manner.
Joint specimens were brazed by induction heating. The specimens were fluxed and heated to the desired temperature, and the filler alloy was applied to one side of the joint. To avoid excessive

fillets, the amount of fillet alloy applied was slightly in excess of what was needed to fill the joint. The power to the induction coil was turned off a specified time after the filler alloy had melted and entered the joint. The CuMn-Sn alloys were water-quenched when the temperature had dropped to 550° C. After cooling, the specimens were machined to produce the reduced gauge section, with the rivets being removed in the process.
5
Fillets and butrs were removed by hand filing; and the overlap, width, and thickness of the gauge section were measured with a micrometer. Some of the very small overlap joints were broken in the machining process and were not remade for subsequent mechanical testing. The mechanical testing was conducted on an Instron Universal testing machine4 using grips for flat bars and at a cross-head speed of 1 in/min.
RESULTS AND DISCUSSION
WETTING TESTS
The parameters of time and temperature were varied for the wetting experiments with silver filler alloys to establish criteria for evaluating the experimental alloys. Table 3 lists the results for tests at different table 4 lists those periods.
temperatures, and for different time
The results presented in table 3 indicate that maximum spread occurs at about 60° C superheat in all but two cases. They also indicate that, for the majority of the alloys, the maximum spread occurs on brass, followed by copper, and then steel. The only exception at 60° C is the BAg-2 alloy which contains the most copper and zinc, both of which wet steel well.
The effect of time on area of spread, as seen in the results of table 4, is not quite as well defined as that of temperature. About 50 pct of the maximum spreads occurred in 30 sec and 50 pct in 60 sec. The only filler alloy that had maximum spread at 60 sec for all three substrates was BAg-la. Except for this alloy, the trend ot increased spread with time appeared to be controlled more by the substrate material than by the filler alloy. Maximum spread with increased time was noted to occur for three of the four alloys on brass, two of the four alloys on copper, and only one of the four alloys on steel.
4Reference to specific not imply endorsement by Mines.
products does the Bureau of
TABLE 3. - Silver filler alloy spread areas (in2 ) formed in 30 sec at different temperatures above the liquidus
Brass Copper Steel BAg-l :
30° C ••••••••• 0.485 0.329 0.111 60° C ••••••••• .679 .339 .206
120° C ••••••••• .481 .312 .175 BAg-la:
30° c ......... .363 .249 .108 60° C ••••••••• .634 .292 .190
120° c ......... .336 .312 .183 BAg-2 :
30° c ......... .411 .358 .273 60° C ••••••••• .665 .492 .607
120° C ••••••••• .222 .450 .309 BAg-3:
30° c ......... .284 .234 .144 60° c ......... .445 .288 .275
120° c ......... .291 .431 .201
TABLE 4. - Silver filler alloy spread areas (in 2 ) for different periods at 60° C above the liquidus
Brass Copper Steel BAg-l :
15 se c ......... 0.446 0.264 0.141 30 sec ••••••••• .679 .339 .206 60 sec ......... .656 .392 .204
BAg-la: 15 sec ••••••••• .453 .241 .143 30 sec ......... .634 .292 .190 60 sec ......... .730 .331 .206
BAG-2 : 15 sec ......... .439 .381 .400 30 sec ......... .665 .492 .607 60 sec ••••••••• .668 .440 .461
BAg-3 : 15 sec ••••••••• .325 .204 .158 30 sec ......... .445 .288 .275 60 sec ••••••••• .526 .273 .258

6
For evaluating the experimental alloys, a spread time of 30 sec and a temperature of 60° C above the liquidus were selected. Using these conditions, the smallest silver alloy spread areas obtained on the substrates were selected as the basis for the evaluation. This resulted in areaof-spread crit.eria of >0.190 inZ for steel, ~0.288 inZ for copper, and ~0.445 inZ for brass. The results of the wetting tests are listed in table 5.
TABLE 5. - Experimental filler alloy spread areas (inZ) formed in 30 sec at 60° C above the liquidus
Filler alloyl Substrate Steel Copper Brass
1 ••••••••••••• .- •• 0.138 0.054 0.-090 2 •••••••••••••••• .135 .057 .080 3 •••••••••••••••• .133 .059 .057 4 •••••••••••••••• .097 • 058 .070 5 •••••••••••••••• .078 .058 .055 6 •••••••••••••••• .168 .145 .160 7 •••••••••••••••• .447 .265 • 179 8 ••••••••..•••••• .356 .216 .147 L Composltl0ns given in table 2.
It is readily seen in table 5 that the wettability of the experimental alloys is much less than that of the silver filler alloys. None of the alloys approach the criteria for brass and copper, and only the Cu-Mn-Sn alloys (7 and 8) meet the criteria for steel. The trend for the experimental alloys was for maximum spread to occur on steel, which is the opposite of that observed for silver alloys.
The causes of wetting and spreading are still controversial, but Bailey and Watkins (3) found that metal solubility or interfacial compound formation was a necessary condition for good wetting and subsequent bond strength. Wassink (17) has stated that the occurrence of intermetallics at the interface means that dissimilar atoms attract each other more than similar ones. As a result, wetting and bond strength are improved by the addition of an element that is mutually soluble or forms compounds with the base metal.
For the case of the Cu-Mn-Zn alloys, the solubilities may be too high on copper and brass substrates. Figure lA is a cross section of a silver filler alloy on brass; figures IS, Ie, and ID show a Cu-Mn-Zn alloy on copper, brass, and steel, respectively. In figures IS and Ie, migration of the boundary or interface down into the substrate is evident. The molten filler alloy appears to have dissolved and alloyed with the substrate rather than spread upon it. This is not the case in figure 1D (steel substrate), where the boundary layer remains uniform and substrate penetration is not evident.
Additional work was conducted on the Cu-Mn-Zn alloys despite their poor wettability. This was done pecause wettingspreading is a dynamic occurrence with several factors active simultaneously • These include surface tensions of the liquid and solid phases as well as the interfacial tensions •
Blanc (4) has pointed out that fluxes are- as ~ta-fltin br-azing practice as the filler alloys themselves. The results of wetting tests on the experimental filler metals using a flux formulated in the laboratory are listed in table 6. This flux consisted of 50 pct K3Al3F6' 30 pct KBF 4 , 10 pct BaCI z, 5 pct LiCIz , and 5 pct KCl.
TABLE 6. - Experimental filler alloy spread areas (inZ) at 60° C above the liquidus for 30 sec using a laboratory-prepared flux
Filler alloyl Substrate Steel Copper Brass
1 •••••••••••••••• 0.450 0.167 0.076 2 •••••••••••••••• .457 .197 .109 3 •••••••••••••••• .500 .226 .120 4 •••••••••••••••• .215 .202 .151 5 •••••••••••••••• .191 .135 .160 6 •••••••••••••••• .184 .111 .069 7 •••••••••••••••• .528
I
.363 .276 8 •••••••••••••••• .419 .373 .294 lCompositions glven in table 2.

A
FIGURE 1. - Cross sections of filler alloys on various substrates (X 10). Panel A is silver
alloyonbrass,H is Cu-Mn-Zn oncopper, Cis Cu-Mn-Zn on brass,and D is Cu-Mn-Zn on steel.
All alloys exhibited increased wetting and spreading when using the laboratory flux, except alloy 6, which displayed decreased spreading on copper and brass. The increase was such that all alloys except 6 met or exceeded the criterion for
steel. On copper, the Cu-Mn-Sn alloys (7 and 8) exceeded the criterion but the CuMn-Zn-base alloys did not meet it. No alloy met the criterion for with the increased wetting.
brass, even However, the
increased wetting was encouraging, and
7

8
qualitative tests with experimental fluxes were started using active fluxes with additives such as SnCl 2 and NiCl 2 , These additives increased the spreading on brass by apparently plating a thin layer of tin or nickel on which the filler alloys could spread more readily than on brass alone. This is similar to the technique developed by Schwaneke, Falke, and Crosser (16) in which an electroplated nickel coating was applied to copper-base alloys to promote spontaneous wetting and spreading of zinc-base solders. On the basis of this qualitative work, the technique appears feasible for increasing the wetting of the experimental alloys on brass and copper.
JOINT STRENGTH TESTS
The values of the joint shear strength for the silver and experimental filler alloys joining copper, brass, and steel joint members are plotted in figures 2 to 10 as a function of both joint overlap and the ratio of joint overlap to member thickness. This is the method suggested by the American Welding Society. The shear strength and overlap values are tabulated in appendix A for the silver alloys and appendix B for the experimental alloys. For comparison purposes, it is necessary to have a range of overlap distances because of the high values of "apparent joint strength" at very short overlap distances compared to those at long overlaps. The most sensitive portion of the curve is the low-overlap portion, where the apparent joint strength is the highest. In this same region of the curve, the most variation in test results will occur because the joints are very sensitive to all factors that affect the brazing operation. A design engineer, on the other hand, is looking for the load-carrying capacity of the joint and thus is most interested in portions of the curve representing less than
maximum shear stress. Consequently, a good way to compare the experimental and silver filler alloys is to look at the overlap-to-member thickness for which the failure undergoes transition from rupture in the joint or filler aJ.loy (open circles in the figures) to rupture in the joint member (filled circles in the figures).
The strengths of copper joints brazed with silver alloys are plotted in figure 2. For the BAg-l and BAg-2 alloys, fractures in the joint members start occurring at an overlap-to-thickness ratio of about 1, whereas for alloys BAg-1a and BAg-3 the ratio is close to 1.6. For brass joints formed with the silver brazes (fig. 3), the ratios are about 1 for BAg-1 and BAg-la and then jump to about 3 for BAg-2 and BAg-3. For steel joints made with the silver filler alloys (fig. 4), the ratio for all alloys approaches 5. It is also evident in figures 2 through 4 that the most variation occurs in the small overlaps, which have the maximum joint strength. The maxImum strengt-hs appear to be related to the joint member strength, with the highest maximum strength values occurring for steel, followed by brass and then copper. For design purposes, an overlapto-thickness ratio of about 2 for copper, 3 for brass, and 5 for steel would be required to retain joint integrity.
For the joining of copper with experimental alloys 1 through 4 (fig. 5), the overlap-to-thickness ratio producing failure in the joint member is also about 2. For brass, the ratio is 1 to 2, as shown in figure 6. For the steel specimens, figure 7, the ratio i~ 5 for alloys 2 and 3 and greater than 5 for 1 and 4. Thus, the overlap-to-thickness ratios used for silver filler alloy design would also work for these alloys.

JOINT OVERLAP TO MEMBER TH!CKNESS RATIO
JOINT OVERLAP, in
FIGURE 2. - Shear of copper joints brazed with silver filler alloys CiS 0 function of joint overlap
and the ratio of joint to member th ickness. Open circles designate specimens that fractured in the
filler alloy; filled circles designate fractures outside the joint in bose members.
~~ <f> lIJ a: Iui
[]:'
<1 w :r
"" I:: z => w ~ ;r
JOINT OVERLAP TO MEMBER THICKNESS RATIO
o 0,8 1.6 2.4 ",2 4,0 4.8 1\,6 0 0,8 1.6 ZA 3,2 4.0 4,B 5,6 60r--.--.-~~-.--.--'--,
Q
w 20 ~
o
10
0,1 0.2 0.3 0,\1 0,6 0.7
JOINT OVER;"AP, in
FIGURE 4. - Shear strength of steel 10lnts brazed
withsilverfilieroiloysas (1 function of [oint overlap and the ratio of joint overlap to member th Open circles des specimens that fractured in the fi Iler 01 . fi lied c irdes des ignate out. side the in bose members.
9
JOiNT OVERLAP TO MEMBER THICKNESS RATIO
• •
Q
" Q
0.1 0,2 0.3 0.4 o.e 0.6 0.7
JOINT OVERLAP, in
FIGURE 3. - Shear strength of brass ioints brazed withsilverfillerolloys as 0 function of ioint overlop and the ratio of ioint overlap to member thickness.
circles designate specimens thot fractured in the fj Iler alloYi fi led cirdes des ignate fractures outside the joint in base members.
JOiNT OVERLAP TO MEMBER THICKNESS RATIO
0,8 1.6 2.4 ~.2 4,0 4,8 5,6 0 O.S 1.6 2,4 a Z 4.0 4,8 5,6
Alia? 2
•
JOI'llT OVERLAP, ,~
FIGURE 5. - Shear strength of copper joints brazed with experimental Cu-Mn-Zn oi loys os a function of :oint overiap and the ratio of oint to member thickness. Open circles designate specimens that fractured in the filler 01 filled circles des fractures outside the joint in base members.

10
JOINT OVERLAP TO MEMBER THICKNESS RATIO
o 50
0.8 1.6 2.4 3.2 4.0 4.6 5 .6 0
40
30
vi 20 V) w a: 10
tn
i 58L if) 40 1
I-Z ~ 30 00
. .
w •• ~ 20 <r
t;; 10 <l
Alloy I
Alloy .,
0 .8 1.6 2.4
o
o 0
00 o
o
3.2 4.0 4 .8 ~.6
Alloy 2 '-"l Alloy oJ
o 0.1 0 .2 0 .3 0 .4 0.5 0 .6 0 .10 0 .1 0 .2 0 .3 0.4 0 .5 0 .6 01
JOINT OVERLAP, in
FIGURE 6. - Shear strength of brass joints brazed wi th experimental Cu-Mn-Zn alloys as a function of
joint overlap and the ratio of joint overlap to member thickness. Open circles designate specimens that fractured in the filler alloy, filled circles des·,gnate
fractures outside the loint in base members.
JOINT OVERLAP TO MEMBER THICKNESS RATIO
o 50
De l 6 2 4 3 2 40 4 8 5.6 0 0 8 • 6 2 4 3 2 4 0 4 e 0 6
40
~- 20 °0 c? • w <r 10 l-V)
Alloy!j
a: qL-____________________ ~
~ 00r---------------------~
I V) 40
A/loy 7
'= 3 30
Wo O. 'it 20 a: l.oJ 10 ~ • •
000
o
o
Alloy 6
Alloy J
o D.' 0 .2 0 .3 D.. o.~ 0.6 0 .70 0 .1 0.2 0 .3 0.4 0 .5 0 .6 0 .7
JOINT OVERLAP, in
FIGURE 8. - Shear strength of copper joints brazed
wi th experimen ta I Cu-Mn-Zn-Ni, Cu-Mn-Zn-Pb, and
Cu-Mn-Sn alloy s a s a function of joint overlap and the
rat io of joint overlap to member th ick nes s . Open cir
cles designate specimens Ihat fractured in the filler
alloy; filled circles designate fracture s outside the joint in base members.
JOINT OVERLAP TO MEMBER THICKNESS RATIO
0 .6 1.6 2.4 3. 2 4 .0 4 .8 5.6 0r-...:0::;8::....-....: • .;::6:........:2:;.4~.::3.;::2=---4.:..r0::....-....:4.;::8~5 6
o 50 Alloy I
40
30
~f 20 o
~ 10 l-V)
<r O'----------------------~ ~ 60,----------------------, I If) 50 I-
~ 40
w '" 30 <l <r l.oJ 20
~ .0
Alloy J
o 0
o
o o
Alloy 2
o o 0
o
o
o
Alloy 4
00 0
o 0 0
o o
o 0 . 1 0 .2 0.3 0.4 0 .5 0 .6 0.10 D.' 0 .2 0 .3 0.4 0 .5 0 .6 0 .1
JOINT OVERLAP, In
FIGUR E 7 •. Shear stren!jth of steel joints brazed with experimental Cu-Mn-Zn alloys as a function of
loint over lap and the ratio of loint overlap to member
thickness. Open circles designate specimens that
fractured in the filler alloy; filled circles designate
fractures outside the joint in base members.
JOINT OVERLAP TO MEMBER THICKNESS RATIO
;0°r-_0~.~8 __ 'r·6 __ 2~.~4~3r·2 __ 4~.0 ___ 4r·e~
40 Alloy!j
o
0°
30 ° I .. ~. 20
~ 10 , •
<r O~--------------------~
<l 50,----------------------, w
iii 40 I- ~.
~ 30
l.oJ
~ 20 <r lJ.J 'o L ~
Alloy 7
o 00
o 00
o o
3 .2 4 .0 4 .8 5.6
Alloy {;
Alloy 8
OL--:OL.I---:OJ....2=--0=".3=--0=" .• -=-0='.70--:!0.76-0='.·70 0.1 0.2 0 .3 0.4 0.0 0.6 0 .7
JOINT OVERLAP, in
FIGURE 9. - Shear strength of brass joints brazed with experimental Cu-Mn-Zn-Ni, Cu-Mn-Zn-Pb, and
Cu·Mn-Sn alloy s a s a function of joint overlap and the
ratio of loint overlap to member thickness. Open cir
cles designate specimens that fractured in the filler
alloy; filled circles designate fractures outside the joint in base member s .

JOINT OVERLAP TO MEMBER THICKNESS RATIO
0 08 16 24 32 40 48 56 0 0.8 1.6 2.4 3.2 4.0 4.8 0.6 80
50 Alloy:; Alloy 6
40 .-VI
6' 30
0 0
• 20 0 <f) <f) w 10 cr f- 0 <f)
cr 0 <I 60 w :r: Alloy T Alloy 8 <f) 50 I::: z 40 :::J
w l? 30 <I cr w 20 > <I
10 0
o 0.1 0.2 0.3 0.4 0.5 0.6 0.7 0 0.1 0.2 0.3 0.4 0.5 0.6 0.7
JOINT OVERLAP. in
FIGURE 10 •.. Shear strength of steel joints brazed
with experimental' Cu-Mn-Zn-Ni, Cu-Mn-Zn-pb, and
Cu-Mn-Sn alloys as a function of joint overlap and the
ratio of joint overlap to member thicknes·s. Open cir
cles designate specimens that fractured in the filler alloy.
As shown in figure 8, the overlapto-thickness ratios for experimental alloys 5 to 8, when used to join copper, are in the range of 1 to 2. For the same alloys and brass (fig. 9), the ratios are about 1.5 to 2 for the Cu-Mn-Zn-base alloys 5 and 6. However, for the Cu-Mn-Sn alloys, 7 and 8, the ratios are about 0.5 to 1, which is less than that for brass brazed with silver alloys. As indicated in figure 10, the highest ratio of 5 did not result in fractures in the steel joint members, indicating a larger ratio was needed. These alloys would work satisfactorily for joining copper and brass joints designed for fabrication with silver filler alloys. For the steel joints, a ratio of 5 still resulted in fracture in the filler alloy rather than the steel. However, the strengths were as high as those for brass (fig. 9) at the higher ratio, and substantially higher for alloy 8. The absence of failure in the steel substrate is a result of the substantially higher strength of the steel relative to brass.
On the basis of this type of comparison, the experimental alloys would be
11
similar to silver filler alloys as far as joint design was concerned; i.e., they would ensure failure in the copper and brass joint members and not in the joint. However, an additional factor should be considered when comparing the different alloys. That factor is the higher temperature needed to braze the materials with the experimental alloys. If one disregards the high joint strengths at small overlaps and looks at the values where failure occurs in the joint members in figures 2 and 5, the effect of the higher temperature can be seen. The values for failure in the copper member are 20 to 25 ksi for the silver filler alloys (fig. 2), and only 10 to 15 ksi for experimental alloys 1 to 4 (fig. 5).
Comparing the values in figures 3 and 6 for the brass joint members shows a similar trend. The values are about 30 ksi for BAg-l and BAg-la, and about 15 ksi for BAg-2 and BAg-3. For alloys 1 to 4, the values are about 20 to 25 ksi, which shows a reduction but not as large as for the copper members. For steel, the values are about 15 ksi for both the silver alloys and experimental alloys 1 to 4.
In figure 8, the values for copper range from about 15 to 20 ksi for alloys 5 to 8--values which are higher than for the first group of experimental alloys but still below those for the silver filler alloys. In figure 9 for the same alloys joining brass, the values range from 15 to 35 ksi. The two Cu-Mn-Sn alloys, 7 and 8, have the highest values of about 30 to 35 ksi, which are comparable to the values for the silver brazing alloys. These two alloys also have the lowest liquidus temperatures of the experimental alloys.
For steel, the comparison cannot be made because failure occurred in the joints for all the overlap-to-thickness ratios evaluated. The reduction in strength of the copper and brass joint members is due to the annealing effects of the higher temperatures than those required with the silver brazes; heavier
12
structural members would be comparable design strengths.
required for
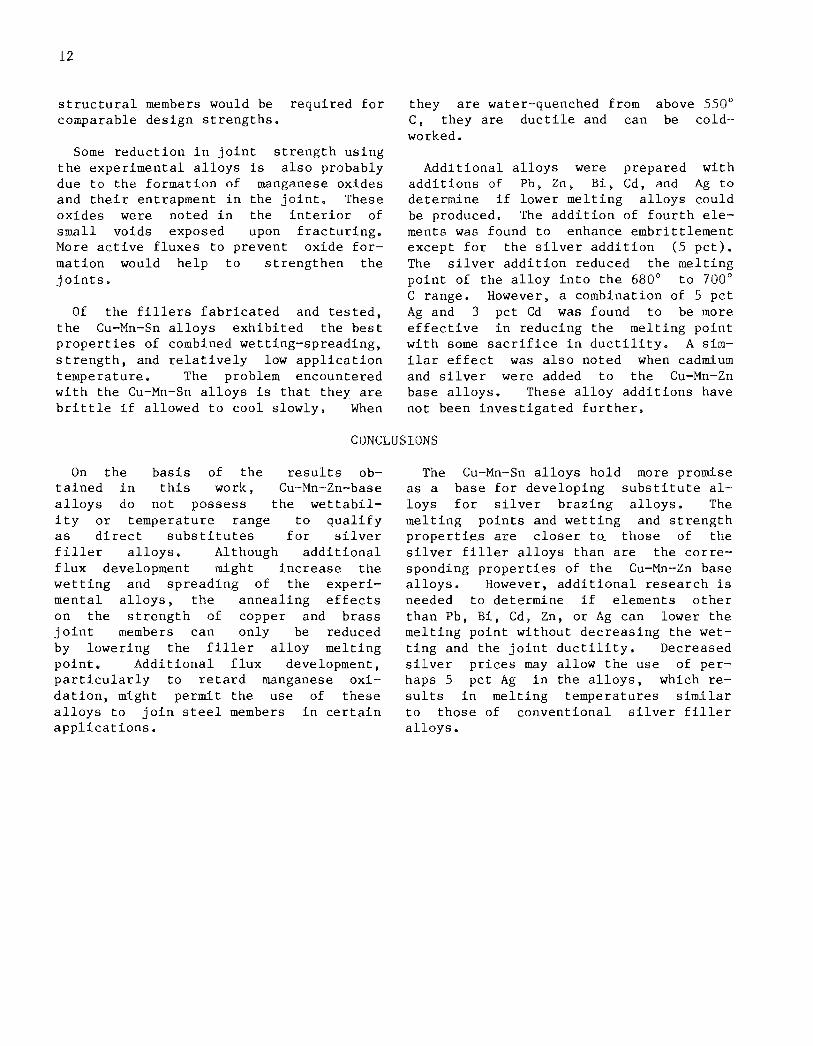
Some reduction in joint strength using the experimental alloys is also probably due to the formation of manganese oxides and their entrapment in the joint. These oxides were noted in the interior of small voids exposed upon fracturing. More active fluxes to prevent oxide formation would help to strengthen the joints.
Of the fillers fabricated and tested, the Cu-Mn-Sn alloys exhibited the best properties of combined wetting-spreading. strength, and relatively low application temperature. The problem encountered with the Cu-Mn-Sn alloys is that they are brittle if allowed to cool slowly. When
they are water-quenched from C, they are ductile and can worked.
above 550 0
be cold-
Additional alloys were prepared with additions of Pb. Zn. Bi. Cd, and Ag to determine if lower melting alloys could be produced. The addition of fourth elements was found to enhance embrittlement except for the silver addition (5 pct). The silver addition reduced the melting point of the alloy into the 680 0 to 700 0
C range. However, a combination of 5 pct Ag and 3 pct Cd was found to be more effective in reducing the melting point with some sacrifice in ductility. A similar effect was also noted when cadmium and silver were added to the Cu-Mn-Zn base alloys. These alloy additions have not been investigated further.
CONCLUSIONS
On the basis of the results obtained in this work, Cu-Mn-Zn-base alloys do not possess the wettability or temperature range to qualify as direct substitutes for silver filler alloys. Although additional flux development might increase the wetting and spreading of the experimental alloys, the annealing effects on the strength of copper and brass joint members can only be reduced by lowering the filler alloy melting point. Additional flux development, particularly to retard manganese oxidation, might permit the use of these alloys to join steel members in certain applications.
The Cu-Mn-Sn alloys hold more promise as a base for developing substitute alloys for silver brazing alloys. The melting points and wetting and strength propextie_s are closer: t_o_ those of the silver filler alloys than are the corresponding properties of the Cu-Mn-Zn base alloys. However, additional research is needed to determine if elements other than Pb, Bi, Cd, Zn, or Ag can lower the melting point without decreasing the wetting and the joint ductility. Decreased silver prices may allow the use of perhaps 5 pct Ag in the alloys, which results in melting temperatures similar to those of conventional silver filler alloys.
13
REFERENCES
1. American Society for Testing and Materials. Book of Standards, Supplement. American Society for Testing and Materials, Philadelphia. PaM , 1929, p. 113.
2. American Welding Society. Welding Handbook. American Welding Society. New York. sec. 3, pt. B, 1971, p. 60.4.
3. Bailey, G. L. J., and H. C. Watkins. The Flow of Liquid Metals on Solid Metal Surfaces and Its Relation to Soldering, Brazing, and Hot-Dip Coating. J. Inst. Metals. v. 80, No.2, 1951-52. PPM 57-76.
4. Blanc, G. M. A. , J. Colbus, and C. G. Keel. Notes on the Assessment of Filler Metals and Fluxes. Welding J. , v. 40, No. 5, May 1961, PPM 210s-2238.
5. Bredz, N., and H. Schwartzbart. Metallurgy of Bonding in Brazed Joints. Part I - Base Metal-Filler Metal Interaction, Excluding Compound Formation. Welding J., Nov. 1958. p~. 4938-498s.
6. Metallurgy Brazed Joints. Part II the Filler Metal Into Welding J., v. 38, No. PPM 305s-314s.
of Bonding in - Migration of the Base Metal. 8 • Aug. 1959,
7. Metallurgy of Bonding in Brazed Joints. Part III - The Role of Intermetallic Compounds in Brazed Joints. Welding J., v. 39, No.2, Feb. 1960, PPM 49s-58s.
8. Burton, M. S. Metallurgical Principles of Metal Bonding. Welding J., v. 33, No. 11, Nov. 1954, PPM 1051-1057.
9. Gyorgak. C. A. Several Braze Filler Metals for Joining an Oxide-Dispersion-Strengthened-Nickel-Chromium-Aluinurn Alloy. NASA Tech. Note 0-8064, Sept. 1975, 19 PPM
10. Herrschaft, D. C. The Evolution of Ductile High-Temperature Brazing Alloys. Metall. Progress, Sept. 1961, PPM 97-100.
11. Leach, R. H. Silver Proc. 33d Ann. Meeting ASTM, pt. II, Tech. Papers. June 1930. 508.
Solders. v. 30,
PPM 493-
12. (assigned to Handy and Harmon, • I New York). Silver Alloy. U.S. Pat. 1,899,701, .July 12, 1932.
13. Libsch. J., and P. Capalongo. H-F Induction Brazing and Soldering, Canadian Metalworking, Aug. 1961. pp. 49-51.
14. Roberts, P. M. Some Copper-Base Brazing Alloys and Their Uses. Pres. at CDA-ASM Conf. on Copper, Cleveland, Ohio, Oct. 16-19, 1972. Copper Development Assoc. Pub. 032/2. 1972. 13 PPM
15. Recent Developments in Cd-Free Silver Brazing Alloys. Welding J •• v. 57, No. 10, Oct. 1978, PPM 23-30.
16. Schwaneke, A. E., W. L. Falke, and O. K. Crosser. Development of a New High-Temperature Solder System. Welding J., v. 51, No.7, July 1972, pp.361s-368s.
17. Wassink, R. J. K. Wetting of Solid-Metal Surfaces by Molten Metals. J. Inst. Metals, v. 95, 1967, PPM 38-43.

14
APPENDIX A.--SILVER FILLER METAL JOINT STRENGTHS
TABLE A-l. - Strength of joints brazed with silver alloys
Copper joints Brass joints Steel joints Shear Shear Shear
Overlap, in stress, Overlap, in stress, Overlap, in stress, ksi ksi ksi
BAg-I .•.•..... 0.053 35.1 0.049 40.0 0.048 48.5 .062 32.3 .055 19.4 .061 63.3 .098 28.5 .090 38.1 .087 45.1 .124 25.9 .118 30.5 .120 44.6 .185 18.4 .177 22.6 .190 31.8 .249 15.3 .239 21.2 .252 25.0 .366 10.7 .369 15.4 .371 18.9 .506 7.9 .481 12.1 .482 17.4 .618 6.3 .613 9.1 .619 14.3
BAg-la •••••••• .046 28.5 .053 52.7 .044 54.5 .061 26.7 .059 50.0 .080 41.7 .092 30.7 .092 41.8 .101 44.1 .105 25.7 .108 34.3 .125 35.6 .188 16.2 .177 22.5 .185 33.5 .239 16.0 .243 22.7 .249 29.7 .375 10.5 .374 15.1 .365 28.5 .503 7.6 .506 11.5 .490 16.6 .617 6.6 .619 9.2 .612 15.7
BAg-2 .••...... .049 32.5 .056 30.3 .047 41.5 .059 29.0 .065 35.6 .062 45.9 .103 20.6 .092 33.2 .087 44.3 .132 18.1 .127 27.6 .123 36.3 .202 14.3 .178 19.7 .186 29.6 .243 13.8 .243 17.1 .234 26.2 .369 10.0 .368 13.6 .362 22.1 .497 7.7 .491 11. 3 .491 18.0 .618 5.9 .618 8.6 .612 14.8
BAg- 3 •••....•• .046 31.5 .053 41.6 .048 41.0 .062 24.2 .065 34.2 .063 40.0 .093 25.5 .093 32.7 .090 47.6 .111 24.8 .121 27.8 .125 42.5 .186 17.4 .174 21.7 .187 33.9 .234 13.9 .224 17.5 .240 24.7 .364 10.1 .364 14.3 .375 21.2 .496 7.6 .481 10.9 .492 18.1 .618 6.1 .622 8.7 .617 14.3

15
APPENDIX B.--EXPERlMENTAL ALLOY JOINT STRENGTHS
TABLE B-1. - Strength of joints brazed with experimental Cu-Mn-Zn alloys
Copper joints Brass joints Steel joints Shear Shear Shear
Overlap, in stress, Overlap, in stress, Overlap, in stress, ksi ksi ksi
Alloy 1 ••••••• 1).058 16.1 0.062 34.5 ( 1 ) ( 1 )
.061 26.5 .064 32.7 0.072 29.7
.087 22.9 .095 28.4 .097 3.8
.116 IS.? .117 22.5 .119 55.2
.179 11. 1 .177 20.3 .172 31.6
.246 11.8 .241 19.8 .242 23.3
.379 9.0 .364 13.1 .366 18.7
.501 6.8 .506 9.8 .498 13.9
.630 5.9 .612 7.9 .619 13.3
Alloy 2 ••• , ••• .051 1l.5 .048 39.9 .047 43.6 .067 13.8 .Oll 27.4 .051 41.1 .100 16.8 .094 22.5 .095 40.0 .133 18.0 .134 26.8 .125 35.5 .180 14.9 .179 22.9 .191 26.7 .245 11.1 .234 13.1 .250 22.2 .380 8.9 .366 12.7 .377 16.9 .490 7.6 .510 9.1 .503 12.6 .631 6.0 .623 7.7 .619 14.1
Alloy 3 ••••••• .1)54 21.0 .058 24.3 ( 1 ) ( 1 )
.074 23.8 .Oll 30.6 .067 30.0
.098 15.7 .096 29.0 .094 40.6
.181 13.3 .149 24.3 .123 31.0
.196 14.9 .182 23.8 .192 25.9
.253 12.4 .255 17.9 .250 19.3
.3 II 9.5 .377 12.4 .368 16.1
.503 7.5 .505 9.4 .491 13.9
.627 6.0 .627 7.4 .619 13.9
Alloy 4 •••.•.• .055 17.9 .064 29.4 .050 30.0 .059 20.7 .078 18.4 .075 21.0 .109 16.0 .101 29.1 .092 29.1 .130 15.3 .139 26.1 .138 30.1 .190 15.0 .181 21.5 .192 20.9 .247 12.2 .256 17.5 .240 21.6 .381 9.3 .358 13.5 .368 1 15.1 .513 6.9 .488 10.1 .495 14.7 .632 6.0 .620 8.1 .618 10.3
1 . SpeClmen broke and could not be tested, no comparable overlap made •

16
TABLE B-2. - Strength of joints brazed with experimental Cu-Mn-Zn-base and Cu-Mn-Sn alloys
Copper joints Brass joints Steel joints Shear Shear
in I Shear
Overlap, in stress, Overlap, in stress, Overlap, stress, ksi ksi ksi
Alloy 5 ....••• 0.053 19.2 0.060 32.9 (1) ( 1 )
.076 18.9 .080 38.5 ( 1 ) ( 1 )
.117 16.0 .108 34.5 0.095 4.0
.129 17. 1 .141 24.3 .135 12.7
.194 14.5 .196 21.1 .195 21.2
.243 12.4 .249 20.2 .249 7.1
.380 9.7 .385 12.5 .369 15.7
.502 7.5 .481 10.4 .498 10.6
.628 5.9 .637 7.3 .625 10.9
Alloy 6 •..•••• .050 17.2 .052 26.7 .045 32.6 .077 14.4 .058 29.6 .058 33.1 .093 19.6 .089 26.7 .100 24.0 .127 19.3 .138 24.1 .133 26.8 .180 15.7 .179 18.7 .191 20.9 .252 12.0 .247 15.3 .240 18.7 .382 9.7 .349 12.8 .364 13.7 .488 7.7 .490 9.8 .490 12.2 .611 6.3 .624 8.0 .630 11.6
Alloy 7 ••••••• .051 20.8 .055 35.1 ( 1 ) ( 1 )
( 1 ) ( 1 ) .057 33.8 .059 59.3 .093 22.0 .091 36.3 .086 47.2 .114 20.7 .132 27.3 .123 41.1 .179 17.0 .181 21.3 .191 30.0 .249 13.4 .241 17.1 .243 23.1 .376 10.0 .351 13.2 .368 13.9 .493 7.7 .498 9.7 .498 11. 3 .617 6.3 .619 8.0 .624 10.5
Alloy 8 •••..•• ( 1 ) ( 1 ) .050 34.7 ( 1 ) ( 1 )
.066 22.0 .056 32.2 ( 1 ) (1)
.101 16.5 .092 30.3 .088 45.6
.111 14.3 .129 28.3 .124 47.6
.202 11.4 .184 22.9 .190 37.2
.248 11.5 .242 17.2 .245 25.1
.372 9.0 .360 13.3 .372 23.8
.511 7.1 .491 10.0 .494 18.4
.619 5.9 .625 7.6 I .628 i
14.4 I
1 Specimen broke and could not be tested, no comparable overlap made.
-Q U.S. GOVERNMENT PRINTING OFFICE: 1983·605·015/40 INT .-BU.OF MIN I 5,P G H.,PA . 26940