Embed Size (px)
Citation preview

1298 Technical Gazette 25, 5(2018), 1298-1305
ISSN 1330-3651 (Print), ISSN 1848-6339 (Online) https://doi.org/10.17559/TV-20161219120040 Original scientific paper
Coordination of a Retail Supply Chain Distribution Flow
Tea VIZINGER, Janez ŽEROVNIK
Abstract: Retail supply chains are very sensitive by their nature and need to adapt to several situations with the aim to increase their reliability, flexibility and convenience. There are many factors affecting the effectiveness of a distribution flow, from perishability, capacities of storage areas, lead times, untimely deliveries and others. Because the latter heavily depend on the planned and realized distribution and not on the demand side perspective, we partially neglect them in the initial study. We focus only on the demand satisfaction, without considering any pricing policies, perishability factors, etc. Beside stochastic demand modelling we introduce the multi-objective optimization approach to cope with the minimization of transport and warehouse costs, minimization of over stock effects and the maximization of customers’ service level. Methodology used produces a set of solutions and its quality estimations in order to find the desired distribution plan that is near optimal. The paper further explains the integration of management decisions with respect to the obtained results of the modelling approach. The applicability of the model will be explained using a numerical example. Keywords: distribution flow; flow coordination; retail supply chain; stochastic demand 1 INTRODUCTION
Supply chain is an integrated system of facility locations, links between facilities, and logistics activities to cope with efficient planning, implementing and controlling of supply chain flows, stock levels, routing decisions, other services and related information in order to satisfy the demand side. In the last two decades, a lot of effort has been done on sustainability issues with the aim to prevent the environment from the GHG (Greenhouse Gas) emissions. Integration of traditional forward flows with a reverse logistics results in a closed loop supply chain [1], where transportation networks have an important role in the design of a sustainable and reliable supply chain. Some other decisions regarding i.e. vehicle routing should therefore be considered when planning the distribution flows, but here the focus is just on the forward product flow.
Efficiency of a product flow management strongly depends on the planned distribution and with that on the management decisions that are unfortunately often based on intuition and experience. Decisions reflecting location-allocation problems, vehicle routing problems and inventory management problems are usually analysed separately, which often results in sub-optimal solutions. The integration of the above mentioned decisions has recently become an increasingly important issue. Zhalechian and his colleagues [1] have shown that considering these decisions holistically enables firms to manage their logistic system processes efficiently, provides responsiveness at lower cost and avoids generating sub-optimal results.
Globalization of market economies, variable customer demands and rising manufacturing and transportation costs triggers the competitive business environment. Companies are nowadays forced to make operational and tactical decisions alongside strategic ones so that logistics system processes are efficiently managed. Let us consider for example a retailer network with several central depots (warehouses) and arbitrary number of grocery stores. Everyday routing decisions depend on the predefined inventory levels (at warehouses and stores) and are also affected by the strategic location-allocation decisions of a retailer. Coordination of a distribution flow should
therefore be seen through the whole distribution network, considering holding, manipulation, as well as transportation costs.
As indicated above, the level of the achieved coordination is also reflected in the inventory management decisions. Beside intuition and experience the latter are often affected by information distortion of actual inventory levels. Let us take for example a retailer that orders products once a week. The size of the order is naturally based on the knowledge of the recorded inventory, using for example a barcode technology. Hence, the retailers perform physical cycle counts just a few times per year; the recorded inventory and the physical inventory may differ by up to 35% [2]. Orders based on inaccurate inventory calculations may result in overstocked and/or understocked inventory levels, and correspondingly affect the holding, as well as transportation costs. Difficulties in decision-making may also occur because different groups of people with different managing philosophies [3] mostly supervise different stages in supply chains. Our focus here is restricted to a single stage in a supply chain, i.e. an internal retail supply chain, which represents an intermediate link between wholesalers and end consumers (Fig. 1). The aim is to define adequate location-allocation decisions (selection of distribution channels between warehouses and stores), appropriate inventory levels (at warehouses and stores), while everyday routing activities are adjusted considering the orders’ sizes as well as loadings on transportation modes.
Our work was motivated by a specific application regarding a distribution of fruits and vegetables. Distribution of fresh food products has some special features within a retail supply chain, especially because of the very short life cycle of a product. To avoid overstocks and correspondingly to minimize the amount of thrown away products, it is natural to distribute as low amounts as possible. If retailers distribute lower amounts of product, they might be vulnerable to the state of stock-out with possible sale realization. The latter state is also known as lost sale or unsatisfied demand, where customers’ request is not met.
The problem we deal with in this paper is to define a preferable distribution plan with the aim to minimize the distribution cost as well as overstocks’ effects, while the
Tea VIZINGER, Janez ŽEROVNIK: Coordination of a Retail Supply Chain Distribution Flow
Tehnički vjesnik 25, 5(2018), 1298-1305 1299
customer’s service level is maximized. We address a single-period location-inventory-routing problem and examine the possibility of a multi objective coordination of a retail supply chain. The rest of the paper is organized as follows. An overview of the existing procedures to cope with efficient planning of a distribution flow is provided in Section 2. Section 3 provides the problem formulation, mathematical model and solution procedures. Results and their applications are further described in Section 4, while conclusions are provided in Section 5. 2 LITERATURE REVIEW OF THE EXISTING MODELLING
APPROACHES
Retail supply chains are vulnerable to the changes from environment, such as demand uncertainty, cost, distance and operations variability. To minimize the deviations of the planned distribution, a supply chain needs to be efficiently managed. In organized and efficiently managed environment decision makers are able to provide robust decisions, flexible responses to changes, and consequently they are able to improve business performance level [4].
Most of the existing literature introduces cost as the common measure of a retail supply chain performance. Beside cost measure, the impact of the coordination may be assessed due to the delivery reliability, operational performance, customer service level, etc. For an insight into the variety of studies, we recommend reader to consult [5-9]. Hill and his colleagues [8] have found out that there is a lack of papers addressing the inventory-routing problem under lost customer demand. Lost customer demand represents the state of stock-out product with possible sale realization. From the practical point of view, the demand is transferred to a substitute product or to another store, therefore known also as the state of lost sale. Moreover, Liu and Papageorgiou [10] interpret customer service level with the percentage of a customer demand satisfied on time. Therefore, lower customer service level causes lost sales or lost customers, resulting in profit loss of the whole supply chain.
Various alternative models have been proposed for modelling supply chain flows, i.e. deterministic models, stochastic models, game-theory models and models based on simulation. Static models have been shown to be insufficient when dealing with the dynamics characteristics of the supply chain, because those models are not able to describe, analyse and find remedies that occur out of the demand fluctuations [3]. Nevertheless, in this first experiment we address a single-period problem, where our primarily aim is to define appropriate framework that will be able to integrate several management decisions and to be able to solve large problem instances in a real time.
To find the appropriate inventory-routing policy, literature mostly introduces the use of mixed integer optimization, multi objective optimization and stochastic programming [10, 11]. Some studies examine the inventory-routing problem as a newsboy problem (e.g. [12]) and investigate it due to the various analyses of periodic reviews (e.g. [13, 14]). The main disadvantage of the latter approaches is that they mainly concern the replenishment problems and with that neglect the transportation costs that results out of the distribution plan
realization. Moreover, for the common objective they introduce just the simple or weighted sum of the considered criteria, while we tend to obtain several preferable solutions with respect to the differentiation of the decision criteria. In the literature, we may also find several other approaches that tackle the multi objective problem: ε-constraint, lexicographic minmax method, Pareto principle and the goal-programming method (e.g. [1, 4, 10, 15]).
Most of the applied stochastic models are two stage programs, and are used to deal with the uncertainty of variables by assigning statistical distributions [15]. Many researchers used several continuous distributions (normal, gamma, uniform, etc.) to model the demand for product (e.g. [12, 14, 16, 17, 18]). In some other studies (e.g. [7, 8, 14, 16, 19]) demand follows the Poisson distribution. On the other hand, Zhalechian and his colleagues [1] have found out that it is difficult or even impossible to fit an exact probability distribution for some objective-natured parameters, especially when there is a lack of historical information. In our approach we tend to avoid the assumption that demand follows a certain distribution, hence in the practical applications demand may be served on any basis, naturally not known in advance.
Stochastic programming as a stand-alone solution method may become computationally intractable as the size of the problem increases. In recent years, the use of heuristics approaches that provide good feasible solutions and the use of meta-heuristics that are able to perform a robust stochastic search of near optimal solutions, have therefore become very popular. He et al. [20] found out that simulation optimization might be quite a powerful tool when seeking for near-optimal solutions of combinatorial optimization problem such as supply chain system optimization. Furthermore, Zhalechian and his colleagues [1] have used hybrid meta-heuristic algorithm and found that genetic algorithms are generally very good at diversifying the solution space but fail when intensifying the search in local regions.
Moreover, Grossman and Guillén-Gosálbez [11] provide an insight into the robust optimization and probabilistic programming. In many practical situations one may not be able to identify the underlying probability distributions or such a stochastic description may simply not exist [3]. In such a situation it is reasonable to fit a suitable possibilistic distribution for each parameter based on experts’ subjective knowledge derived from past experiences and feelings. Uncertainties are therefore unknown-but-bounded quantities, while constraints are satisfied for all realizations of the uncertain parameters. In robust programming, not every scenario therefore represents a feasible solution. When uncertainty is once realized, the solution obtained from the robust optimization ensures that a set of constraints is satisfied with a certain probability. Introducing a probabilistic level of constraint satisfaction corresponds to the probabilistic programming also known as chance-programming.
The purpose of this paper is to model the trade-offs and to identify situations in which decision maker can optimize both, the costs of distribution and risk costs (overstocks effects and lost sales). In the first attempt of finding a solution we have used and tested stochastic model for coordination of a retail supply chain product flow. Methodology used produces a set of solutions and quality

Tea VIZINGER, Janez ŽEROVNIK: Coordination of a Retail Supply Chain Distribution Flow
1300 Technical Gazette 25, 5(2018), 1298-1305
estimations in order to find the desired distribution plan that is near optimal. 3 THE PROBLEM
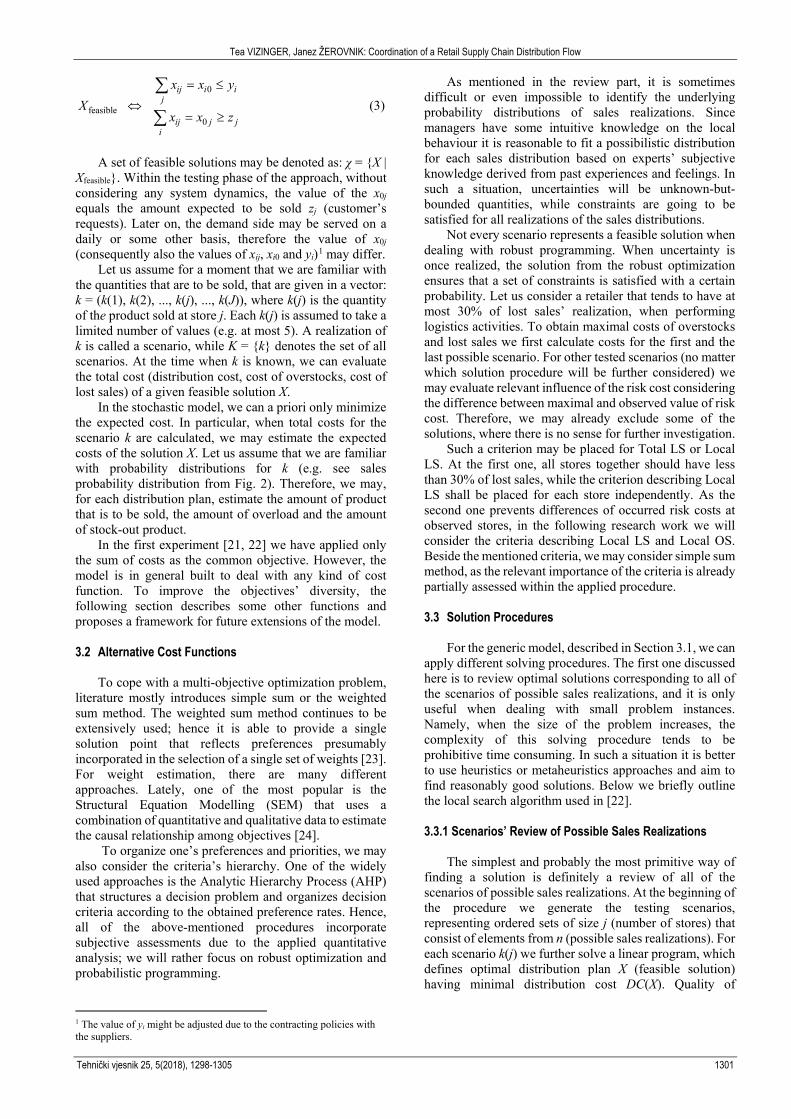
Fig. 1 represents a typical retail supply chain with a set of warehouses i ∈ (1, …, I) and a set of stores j ∈ (1, …, J), where wij represents distribution cost, and xij the quantity of distributed product. A retail distribution flow is represented as a multi objective discrete optimization problem and is modelled as a flow on a connected weighted graph with the aim to minimize its total weight.
Figure 1 Retail supply chain
In our model, we assume that the actual quantity of the
product that will be sold in the stores is not known in advance. For the stores requests zj we only have some estimates of the probability distribution of the expected amounts to be sold. One possibility is to assume that these quantities are random variables according to some probability distributions, for example normal distribution. Instead we here work with discrete distributions based on estimates given by the managers of the stores. The idea is that these managers have some intuitive knowledge on the local behaviour, and attempt to gather this information. In the future, our aim is also to allow both the system and the managers to learn from past cycles to tune the future decisions. Another point of view is that the distribution is unknown or partially unknown, and we aim to learn to improve the intuitive understanding of this distribution by the store managers.
Formally, we assume that for each store we are given the probability estimates of possible sales realizations. Let us consider a retail store with probability sales distribution described in Fig. 2. It is expected that this store is going to sell 1, 2, 3, 4 or 5 units of product on a daily basis. We, or better the store managers, are 40% sure that this store is going to sell 3 units of the product, while with 10% we may argue that the store is going to sell 1 or 5 units of product. Based on the given managers’ estimates we are able to obtain approximate sales distributions P=[p(j,n)], where p(j,n) represent probability estimate that store j will sell n units of product per day. Nevertheless, the case from Fig. 2 applies a relatively low and limited number of possible units n of product to be sold, the model is in general designed to deal with any probability sales distribution and therefore with arbitrary number of possible sales realizations.
Figure 2 Estimated probability distribution of the expected amounts to be sold
(for the case of chosen store)
With respect to the given sales distributions, we are able to evaluate chosen distribution plan. Hereafter we use two metrics for the risk assessments, representing the expected cost of overstocks and the expected cost of lost sales. Overstocks represent returned or wasted products because of their obsolete or perishable nature, while lost sales represent the state of stock-out with possible sale realizations.
3.1 Mathematical Model
Here we present the model for coordination of a retail supply chain distribution flow that was recently introduced in [21, 22]. Mathematical model includes the definition of an appropriate cost function and aims to find a distribution plan with minimal mutual costs. This is achieved by finding a trade-off between the minimization of distribution costs (transport and holding costs), minimization of the expected cost of overstocks as well as minimization of the expected cost of lost sales:
( )( )
( )( ) ( )( ) ( )( )( )X
X
min Exp Cost X
min Exp DC X ,Exp OS X ,Exp LS Xχ
χ
∈
∈
=
= (1)
In Eq. (1), χ is the space of feasible solutions,
Exp(DC) represents the expected distribution cost, Exp(LS) expected cost of lost sales and Exp(OS) expected cost of overstocks. The purchasing costs are related only to the costs of overstocks, expressed with some percentage of a wholesale price. We partially neglect the purchasing costs as we consider an internal distribution flow and coordinate just the internal activities. The external ones may be coordinated accordingly, when internal distribution plan is already determined. A solution X is presented with the following matrix:
00 01 00
10 11 10 0 ,
0 1
,
J
Ji ij j i I j J
I I IJ
x x x
x x xX x x x
x x x
=
∈ ∈
= =
(2)
where xij is the quantity of product transported between the warehouse i and store j, xi0 represents the amount of product available at warehouse i, and xj0 is the quantity of product available at store j. A solution from the matrix X is feasible, if it satisfies the customer’s requests zj, while complies with the supply limitations yi:
Tea VIZINGER, Janez ŽEROVNIK: Coordination of a Retail Supply Chain Distribution Flow
Tehnički vjesnik 25, 5(2018), 1298-1305 1301
0
feasible0
ij i ij
ij j ji
x x yX
x x z
= ≤
⇔= ≥
∑
∑ (3)
A set of feasible solutions may be denoted as: χ = {X |
Xfeasible}. Within the testing phase of the approach, without considering any system dynamics, the value of the x0j equals the amount expected to be sold zj (customer’s requests). Later on, the demand side may be served on a daily or some other basis, therefore the value of x0j (consequently also the values of xij, xi0 and yi)1 may differ.
Let us assume for a moment that we are familiar with the quantities that are to be sold, that are given in a vector: k = (k(1), k(2), ..., k(j), ..., k(J)), where k(j) is the quantity of the product sold at store j. Each k(j) is assumed to take a limited number of values (e.g. at most 5). A realization of k is called a scenario, while K = {k} denotes the set of all scenarios. At the time when k is known, we can evaluate the total cost (distribution cost, cost of overstocks, cost of lost sales) of a given feasible solution X.
In the stochastic model, we can a priori only minimize the expected cost. In particular, when total costs for the scenario k are calculated, we may estimate the expected costs of the solution X. Let us assume that we are familiar with probability distributions for k (e.g. see sales probability distribution from Fig. 2). Therefore, we may, for each distribution plan, estimate the amount of product that is to be sold, the amount of overload and the amount of stock-out product.
In the first experiment [21, 22] we have applied only the sum of costs as the common objective. However, the model is in general built to deal with any kind of cost function. To improve the objectives’ diversity, the following section describes some other functions and proposes a framework for future extensions of the model.
3.2 Alternative Cost Functions
To cope with a multi-objective optimization problem, literature mostly introduces simple sum or the weighted sum method. The weighted sum method continues to be extensively used; hence it is able to provide a single solution point that reflects preferences presumably incorporated in the selection of a single set of weights [23]. For weight estimation, there are many different approaches. Lately, one of the most popular is the Structural Equation Modelling (SEM) that uses a combination of quantitative and qualitative data to estimate the causal relationship among objectives [24].
To organize one’s preferences and priorities, we may also consider the criteria’s hierarchy. One of the widely used approaches is the Analytic Hierarchy Process (AHP) that structures a decision problem and organizes decision criteria according to the obtained preference rates. Hence, all of the above-mentioned procedures incorporate subjective assessments due to the applied quantitative analysis; we will rather focus on robust optimization and probabilistic programming.
1 The value of yi might be adjusted due to the contracting policies with the suppliers.
As mentioned in the review part, it is sometimes difficult or even impossible to identify the underlying probability distributions of sales realizations. Since managers have some intuitive knowledge on the local behaviour it is reasonable to fit a possibilistic distribution for each sales distribution based on experts’ subjective knowledge derived from past experiences and feelings. In such a situation, uncertainties will be unknown-but-bounded quantities, while constraints are going to be satisfied for all realizations of the sales distributions.
Not every scenario represents a feasible solution when dealing with robust programming. When uncertainty is once realized, the solution from the robust optimization ensures that a set of constraints is satisfied with a certain probability. Let us consider a retailer that tends to have at most 30% of lost sales’ realization, when performing logistics activities. To obtain maximal costs of overstocks and lost sales we first calculate costs for the first and the last possible scenario. For other tested scenarios (no matter which solution procedure will be further considered) we may evaluate relevant influence of the risk cost considering the difference between maximal and observed value of risk cost. Therefore, we may already exclude some of the solutions, where there is no sense for further investigation.
Such a criterion may be placed for Total LS or Local LS. At the first one, all stores together should have less than 30% of lost sales, while the criterion describing Local LS shall be placed for each store independently. As the second one prevents differences of occurred risk costs at observed stores, in the following research work we will consider the criteria describing Local LS and Local OS. Beside the mentioned criteria, we may consider simple sum method, as the relevant importance of the criteria is already partially assessed within the applied procedure.
3.3 Solution Procedures
For the generic model, described in Section 3.1, we can
apply different solving procedures. The first one discussed here is to review optimal solutions corresponding to all of the scenarios of possible sales realizations, and it is only useful when dealing with small problem instances. Namely, when the size of the problem increases, the complexity of this solving procedure tends to be prohibitive time consuming. In such a situation it is better to use heuristics or metaheuristics approaches and aim to find reasonably good solutions. Below we briefly outline the local search algorithm used in [22].
3.3.1 Scenarios’ Review of Possible Sales Realizations
The simplest and probably the most primitive way of finding a solution is definitely a review of all of the scenarios of possible sales realizations. At the beginning of the procedure we generate the testing scenarios, representing ordered sets of size j (number of stores) that consist of elements from n (possible sales realizations). For each scenario k(j) we further solve a linear program, which defines optimal distribution plan X (feasible solution) having minimal distribution cost DC(X). Quality of

Tea VIZINGER, Janez ŽEROVNIK: Coordination of a Retail Supply Chain Distribution Flow
1302 Technical Gazette 25, 5(2018), 1298-1305
solutions X is now evaluated due to the risk assessments. With respect to a given solution from the linear program, we obtain the expected cost of overstocks and the expected cost of lost sales. Therefore, we are able to seek for a minimum among the applied decision criteria.
The solution procedure was already presented on a smaller example in [21]. We further explain the applicability of the obtained results using a numerical example related to the fruit distribution. The data we use here are artificial, but we can say they are realistic as they are based on interviews with a practitioner from a real company. Distribution of perishable product (bananas) is observed between two central depots (warehouses) and four retail stores, located in the eastern and central part of Slovenia. Possible sales realizations for the first and the second store equal (0, 1, 2, 3, 4) batches of products on a daily basis, sales realizations for the third store equal (2, 4, 5, 6, 7) batches on a daily basis, while the fourth store may sell (1, 2, 3, 4, 5) batches on a daily basis.
For the example described above we first generate testing scenarios and obtain 625 feasible solutions (5 possible sales realizations and 4 stores, 5^4 = 625), some of them are listed in Tab. 1. If we analyze the obtained results throughout a distribution cost perspective, we may represent the quality of solutions X(k) as are shown in Fig. 3. Each solution X(k) corresponds to two points in the figure, (DC(X), OS(X)) and (DC(X), LS(X)). It is obvious
that greater distributed quantities result in higher distribution cost as well as in higher expected cost of overstocked products. To the opposite, the greater is the distributed quantity the lower is the expected cost of lost sales.
The relevance of the risk costs is changing and is often based on the subjective assessment. If managers prefer well-stocked grocery stores, with minimal possible lost sales, there is a quite big chance that stores are going to have larger cost for overstocks. This kind of distribution is quite appropriate for low value as well as frequent products, while many higher value products are better to be distributed due to the pull logistics strategy. In pull logistics concept the distribution is triggered by the demand side, therefore stores and warehouses operate with minimal stock levels. Definitely this results in the minimization of overstocks, but unfortunately also in the higher lost sales. As the example deals with the perishable low value product, we assume that retailer wishes to minimize both, overstocks and lost sales. Retailer may not afford that store runs out of products, as well as he may not afford to throw away many products. Therefore, we seek for a solution where all of the present costs are mutually minimized. In the example, the favourable solutions rely somewhere between the 25€ and 30€ for distribution cost on a daily basis, where expected costs of risks (both, OS and LS) on average represent roughly 10€ (Fig. 3).
Table 1 Quality of solutions X(k) that are obtained as having optimal distribution cost at scenario k # x0j= k(j) p(k) DC(X) Exp(OS(X)) Exp(LS(X)) 1 0 0 2 1 0.0 7.35 0 48.6 … … … … … … … … …
308 2 2 4 3 0.018 25.694 8.25 10.5 … … … … … … … …
625 4 4 7 5 0.0 46.588 44.5 0
Figure 3 Estimated costs of overstocks and lost sales
We consider only the feasible solutions coresponding
to some scenarios and choose the best solution among them. The best solution corresponds to the scenario 308, where distribution cost amounts to 25.7€ per day, the expected cost of overstocks equals 8.25€ per day while the expected cost of lost sales equals 10.5€ per day (Tab. 1). At this scenario, store j = 1 and j = 2 are going to order two packages of product per day, store j = 3 is going to order four packages, while store j = 4 is going to order three units of product per day. With such an ordering policy, the
expected sales are going to be exactly realized with the probability 1.8%.
The optimization problem that arises from the model is seemingly hard. Computational complexity increases with the number of stores as well as with the number of possible sales realizations. For small problem instances it is possible to examine all the possible scenarios of sales realizations. For larger instances, a complete review is not an appropriate option, hence we may and we should use a heuristic approach and aim to find nearly optimal solution. 3.3.2 Local Search
Many experimental studies including some of the present authors [25, 26] confirm the efficiency of local search that is perhaps the most natural heuristic. Local search heuristic is a procedure, performed in two steps. At first an initial solution from the set of feasible solutions is selected, and afterward the solution gets iteratively improved by small perturbations or local changes. Local changes are applied according to the definition of neighbourhood structure that defines which feasible solutions can be obtained from a given feasible solution.
Initial solution may be selected randomly or may be given based on the past experience. To cope with the computational hardness that results out of the generating feasible solutions, we first conduct the problem
Tea VIZINGER, Janez ŽEROVNIK: Coordination of a Retail Supply Chain Distribution Flow
Tehnički vjesnik 25, 5(2018), 1298-1305 1303
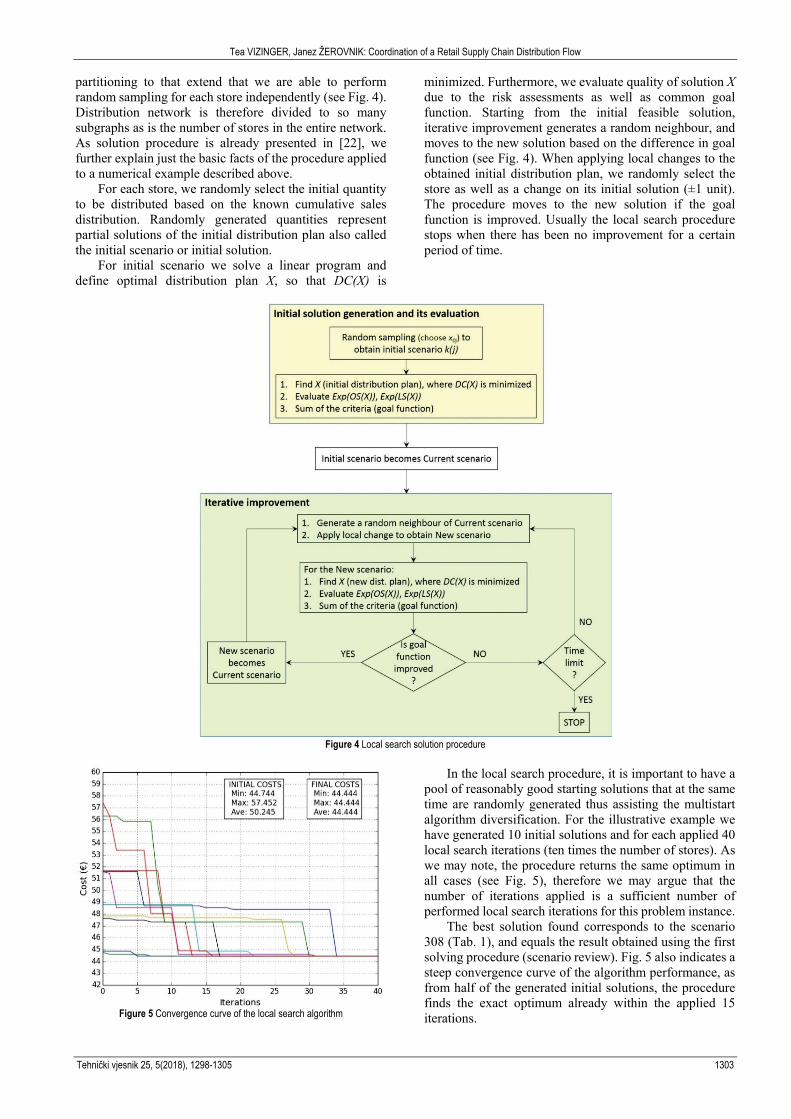
partitioning to that extend that we are able to perform random sampling for each store independently (see Fig. 4). Distribution network is therefore divided to so many subgraphs as is the number of stores in the entire network. As solution procedure is already presented in [22], we further explain just the basic facts of the procedure applied to a numerical example described above.
For each store, we randomly select the initial quantity to be distributed based on the known cumulative sales distribution. Randomly generated quantities represent partial solutions of the initial distribution plan also called the initial scenario or initial solution.
For initial scenario we solve a linear program and define optimal distribution plan X, so that DC(X) is
minimized. Furthermore, we evaluate quality of solution X due to the risk assessments as well as common goal function. Starting from the initial feasible solution, iterative improvement generates a random neighbour, and moves to the new solution based on the difference in goal function (see Fig. 4). When applying local changes to the obtained initial distribution plan, we randomly select the store as well as a change on its initial solution (±1 unit). The procedure moves to the new solution if the goal function is improved. Usually the local search procedure stops when there has been no improvement for a certain period of time.
Figure 4 Local search solution procedure
Figure 5 Convergence curve of the local search algorithm
In the local search procedure, it is important to have a pool of reasonably good starting solutions that at the same time are randomly generated thus assisting the multistart algorithm diversification. For the illustrative example we have generated 10 initial solutions and for each applied 40 local search iterations (ten times the number of stores). As we may note, the procedure returns the same optimum in all cases (see Fig. 5), therefore we may argue that the number of iterations applied is a sufficient number of performed local search iterations for this problem instance.
The best solution found corresponds to the scenario 308 (Tab. 1), and equals the result obtained using the first solving procedure (scenario review). Fig. 5 also indicates a steep convergence curve of the algorithm performance, as from half of the generated initial solutions, the procedure finds the exact optimum already within the applied 15 iterations.
Tea VIZINGER, Janez ŽEROVNIK: Coordination of a Retail Supply Chain Distribution Flow
1304 Technical Gazette 25, 5(2018), 1298-1305
4 DISCUSSION
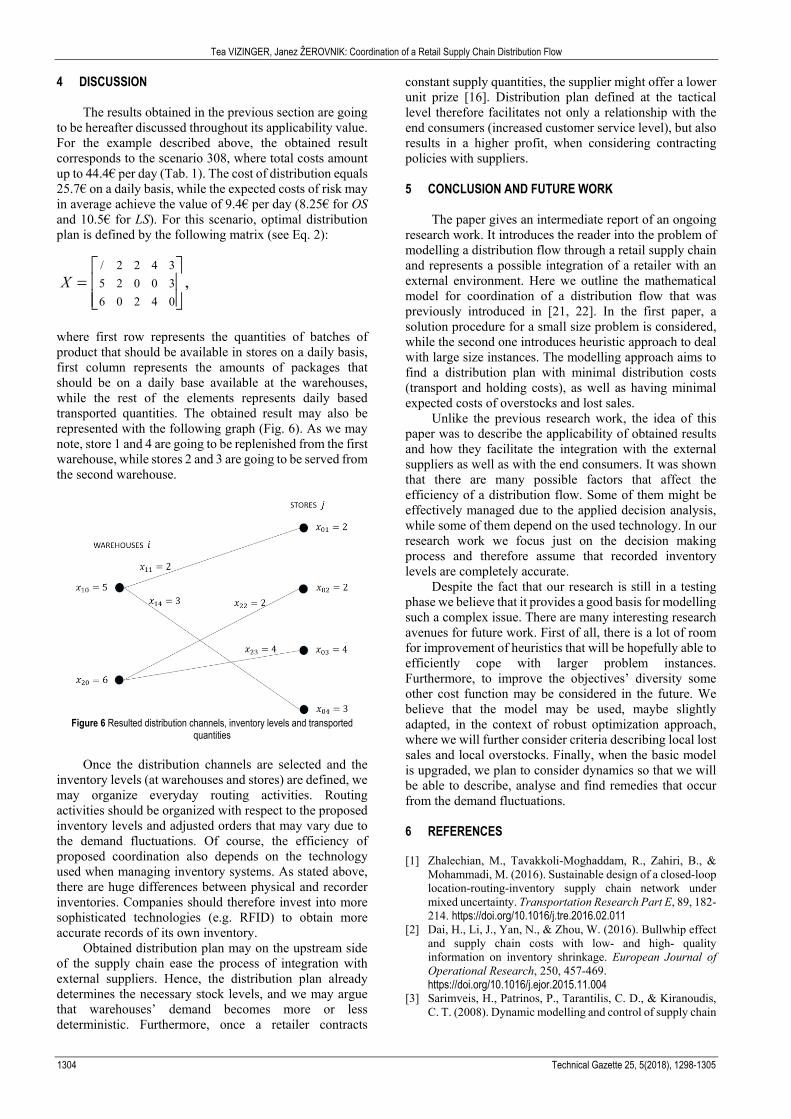
The results obtained in the previous section are going to be hereafter discussed throughout its applicability value. For the example described above, the obtained result corresponds to the scenario 308, where total costs amount up to 44.4€ per day (Tab. 1). The cost of distribution equals 25.7€ on a daily basis, while the expected costs of risk may in average achieve the value of 9.4€ per day (8.25€ for OS and 10.5€ for LS). For this scenario, optimal distribution plan is defined by the following matrix (see Eq. 2):
/ 2 2 4 35 2 0 0 36 0 2 4 0
,X
=
where first row represents the quantities of batches of product that should be available in stores on a daily basis, first column represents the amounts of packages that should be on a daily base available at the warehouses, while the rest of the elements represents daily based transported quantities. The obtained result may also be represented with the following graph (Fig. 6). As we may note, store 1 and 4 are going to be replenished from the first warehouse, while stores 2 and 3 are going to be served from the second warehouse.
Figure 6 Resulted distribution channels, inventory levels and transported
quantities
Once the distribution channels are selected and the inventory levels (at warehouses and stores) are defined, we may organize everyday routing activities. Routing activities should be organized with respect to the proposed inventory levels and adjusted orders that may vary due to the demand fluctuations. Of course, the efficiency of proposed coordination also depends on the technology used when managing inventory systems. As stated above, there are huge differences between physical and recorder inventories. Companies should therefore invest into more sophisticated technologies (e.g. RFID) to obtain more accurate records of its own inventory.
Obtained distribution plan may on the upstream side of the supply chain ease the process of integration with external suppliers. Hence, the distribution plan already determines the necessary stock levels, and we may argue that warehouses’ demand becomes more or less deterministic. Furthermore, once a retailer contracts
constant supply quantities, the supplier might offer a lower unit prize [16]. Distribution plan defined at the tactical level therefore facilitates not only a relationship with the end consumers (increased customer service level), but also results in a higher profit, when considering contracting policies with suppliers.
5 CONCLUSION AND FUTURE WORK
The paper gives an intermediate report of an ongoing
research work. It introduces the reader into the problem of modelling a distribution flow through a retail supply chain and represents a possible integration of a retailer with an external environment. Here we outline the mathematical model for coordination of a distribution flow that was previously introduced in [21, 22]. In the first paper, a solution procedure for a small size problem is considered, while the second one introduces heuristic approach to deal with large size instances. The modelling approach aims to find a distribution plan with minimal distribution costs (transport and holding costs), as well as having minimal expected costs of overstocks and lost sales.
Unlike the previous research work, the idea of this paper was to describe the applicability of obtained results and how they facilitate the integration with the external suppliers as well as with the end consumers. It was shown that there are many possible factors that affect the efficiency of a distribution flow. Some of them might be effectively managed due to the applied decision analysis, while some of them depend on the used technology. In our research work we focus just on the decision making process and therefore assume that recorded inventory levels are completely accurate.
Despite the fact that our research is still in a testing phase we believe that it provides a good basis for modelling such a complex issue. There are many interesting research avenues for future work. First of all, there is a lot of room for improvement of heuristics that will be hopefully able to efficiently cope with larger problem instances. Furthermore, to improve the objectives’ diversity some other cost function may be considered in the future. We believe that the model may be used, maybe slightly adapted, in the context of robust optimization approach, where we will further consider criteria describing local lost sales and local overstocks. Finally, when the basic model is upgraded, we plan to consider dynamics so that we will be able to describe, analyse and find remedies that occur from the demand fluctuations. 6 REFERENCES [1] Zhalechian, M., Tavakkoli-Moghaddam, R., Zahiri, B., &
Mohammadi, M. (2016). Sustainable design of a closed-loop location-routing-inventory supply chain network under mixed uncertainty. Transportation Research Part E, 89, 182-214. https://doi.org/10.1016/j.tre.2016.02.011
[2] Dai, H., Li, J., Yan, N., & Zhou, W. (2016). Bullwhip effect and supply chain costs with low- and high- quality information on inventory shrinkage. European Journal of Operational Research, 250, 457-469. https://doi.org/10.1016/j.ejor.2015.11.004
[3] Sarimveis, H., Patrinos, P., Tarantilis, C. D., & Kiranoudis, C. T. (2008). Dynamic modelling and control of supply chain

Tea VIZINGER, Janez ŽEROVNIK: Coordination of a Retail Supply Chain Distribution Flow
Tehnički vjesnik 25, 5(2018), 1298-1305 1305
systems: A review. Computers & Operations Research, 35, 3530-3561. https://doi.org/10.1016/j.cor.2007.01.017
[4] Laínez, J. M. & Puigjaner, L. (2012). Prospective and perspective review in integrated supply chain modelling for the chemical process industry. Current Opinion in Chemical Engineering, 1, 430-445. https://doi.org/10.1016/j.coche.2012.09.002
[5] Mak, K. L. (1986). Determining optimal production inventory control policies for an inventory system with partial backlogging. Computers and Operations Research, 27, 299-304.
[6] Chang, H. J. & Dye, C. Y. (1999). An EOQ model for deteriorating items with time varying demand and partial backlogging. International Journal of Operational Research Society, 50, 1176-1182. https://doi.org/10.1057/palgrave.jors.2600801
[7] Andersson, J. & Melchiors, P. (2001). A two-echelon inventory model with lost sales. International Journal of Production Economics, 69, 307-315. https://doi.org/10.1016/S0925-5273(00)00031-1
[8] Hill, R. M., Seifbarghy, M., & Smith, D. K. (2007). A two-echelon inventory model with lost sales. European Journal of Operational Research, 181, 753-766. https://doi.org/10.1016/j.ejor.2006.08.017
[9] Ghosh, S. K., Khanra, S., & Chaudhuri, K. S. (2011). Optimal price and lot size determination for a perishable product under conditions of finite production, partial backordering and lost sale. Applied Mathematics and Computation, 217, 6047-6053. https://doi.org/10.1016/j.amc.2010.12.050
[10] Liu, S. & Papageorgiou, L. G. (2013). Multiobjective optimisation of production, distribution and capacity planning of global supply chains in the process industry. Omega, 41, 369-382. https://doi.org/10.1016/j.omega.2012.03.007
[11] Grossman, I. E. & Guillén-Gosálbez, G. (2010). Scope for the application of mathematical programming techniques in the synthesis and planning of a sustainable processes. Computers and Chemical Engineering, 34, 1365-1376. https://doi.org/10.1016/j.compchemeng.2009.11.012
[12] Abdel-Malek, L. L. & Montanari, R. (2005). On the multi-product newsboy problem with two constraints. Computers and Operations Research, 32, 2095-2116. https://doi.org/10.1016/j.cor.2004.02.002
[13] Sarker, B. R. (2014). Consignment stocking policy models for supply chain systems: A critical review and comparative perspectives. International Journal of Production Economics, 155, 52-67. https://doi.org/10.1016/j.ijpe.2013.11.005
[14] Kouki, C., Babai, M. Z., Jemai, Z., & Minner, S. (2016). A coordinated multi-item inventory system for perishables with random lifetime. International Journal of Production Economics. https://doi.org/10.1016/j.ijpe.2016.01.013
[15] Franca, R. B., Jones, E. C., Richards, C. N., & Carlson, J. P. (2010). Multi-objective stochastic supply chain modelling to evaluate tradeoffs between profit and quality. International Journal of Production Economics, 127, 292-299. https://doi.org/10.1016/j.ijpe.2009.09.005
[16] Minner, S. (2003). Multiple-supplier inventory models in supply chain management: A review. International Journal of Production Economics, 81-82, 265-279. https://doi.org/10.1016/S0925-5273(02)00288-8
[17] Abdel-Malek, L. L. & Areeratchakul, N. (2007). A quadratic programming approach to the multi-product newsvendor problem with side constraints. European Journal of Operational Research, 176, 1607-1619. https://doi.org/10.1016/j.ejor.2005.11.002
[18] Klosterhalfen, S. T., Dittmar, D., & Minner, S. (2013). An integrated guaranteed- and stochastic-service approach to
inventory optimization in supply chains. European Journal of Operational Research, 231, 109-119. https://doi.org/10.1016/j.ejor.2013.05.032
[19] Axsäter, S. (2006). Inventory control, 2nd ed. Springer, New York.
[20] He, J., Huang, Y., & Cheng, D. (2015). Simulation-based heuristic method for container supply chain network. Advanced Engineering Informatics, 29(3), 339-354. https://doi.org/10.1016/j.aei.2014.08.001
[21] Vizinger, T. & Žerovnik, J. (2016). Towards better coordination of a retail supply chain distribution flow. PrePrints of 19th International Working Seminar on Production Economics, Grubbström, R. W. and Hinterhuber, H. H. (Eds.) / Innsbruck, 513-524.
[22] Vizinger, T. & Žerovnik, J. (2018). A stochastic model for better planning of product flow in retail supply chains. Accepted for publishing in the Journal of the Operational Research Society. https://doi.org/10.1080/01605682.2018.1501460
[23] Marler, R. T. & Arora, J. S. (2010). The weighted sum method for multi-objective optimization: new insight. Structural and Multidisciplinary Optimization, 41(6), 853-862. https://doi.org/10.1007/s00158-009-0460-7
[24] Jakhar, S. K. (2015). Performance evaluation and a flow allocation decision model for a sustainable supply chain of an apparel industry. Journal of Cleaner Production, 87, 391-413. https://doi.org/10.1016/j.jclepro.2014.09.089
[25] Kaljun, D. & Žerovnik, J. (2014). On local search based heuristics for optimization problems. Croatian operational research review, 5(2), 317-327. https://doi.org/10.17535/crorr.2014.0016
[26] Žerovnik, J. (2015). Heuristics for NP-hard optimization problems - simpler is better!? Logistics & Sustainable Transport, 6(1), 1-10. https://doi.org/10.1515/jlst-2015-0006
Contact information: Tea VIZINGER, MSc, Teaching Assistant Faculty of logistics, University of Maribor, Mariborska 7, 3000 Celje, Slovenia [email protected] Janez ŽEROVNIK, PhD, Full Professor Faculty of Mechanical Engineering, University of Ljubljana, Aškerčeva 6, 1000 Ljubljana, Slovenia [email protected]