Embed Size (px)
Citation preview

Cooperation, Competition and Patents: Understanding
Innovation in the Telecommunication Sector ∗
Tatiana Rosa†CEMFI
This draft: June 2, 2020
JOB MARKET PAPER
(latest version HERE)
Abstract
Many modern innovations depend on interconnectivity, which require technology stan-dards as a common language to successfully link up. This paper develops and estimates astructural model to understand how competition between firms affects their incentives tocooperate by supplying technologies to a common standardization process. I study theseincentives empirically by focusing on the standardization of the mobile telecommunicationstechnologies. In the model, firms face two decisions. They decide whether to join a groupto develop a component of the system and, in that case, how much effort to exert. Whenmaking these choices, firms consider 1) how their effort increases the common value, 2) howmuch of this common value they can privately appropriate through their patents, and 3)their capacity to profit from the technology in the downstream part of the market. In thissetting, patents have an ambiguous effect on the development of a common innovation. Onthe one hand, they alleviate the free-rider problem and induce firms to exert more effort.On the other hand, they bias firms’ participation towards groups with less competition overpatented technologies even where their effort may be less valuable. To study the net effect ofthese forces in equilibrium, I estimate the model using a novel dataset on 3G and 4G tech-nologies. I also show that the enforcement of royalty-free clauses reduces firm participationand effort, ultimately delaying the completion of the initial releases of 4G by almost 1 year.
JEL Codes: O3, L1, L2Keywords: Telecommunication standards, 4G, Innovation, Inter-firm collaboration, Patents,Complementarities, Competition
∗I am deeply grateful to my supervisor Gerard Llobet for his patient, guidance, constant encouragement and invaluableadvice; and to Manuel Arellano for his advice, enlightening comments and continuous support. I also thank Justus Baron,who kindly helped me understanding the development of technology standards and Dante Amengual, Dmitry Arkhangelsky,Guillermo Caruana, Despina Doneva, Susanna Esteban, Ariel Gomez, Pedro Mira, Jorge Padilla, Ariel Pakes, Claudia Roblesand Marc Rysman for all their help and suggestions. I would also like to thank seminar participants at CEMFI, at the SearleCenter Round table on Patents and Technology Standards and at the First Annual Empirical Workshop on Standardizationfor very useful comments and suggestions. I particularly thank industry practitioners attending these meetings who werevery generous in sharing their knowledge of the market. The paper uses data from the Searle Center from NorthwesternUniversity that has been provided under a data-access agreement for research purposes. Funding from the Fundacion RamonAreces and from Spain’s Ministerio de Economıa, Industria y Competitividad (Marıa de Maeztu Programme for Units ofExcellence in R&D, MDM-2016-0684) is gratefully acknowledge. All errors are my own.†[email protected]

1 Introduction
Many modern innovations depend on interconnectivity. The upcoming 5G network will set the
basis for many appliances to communicate with each other, and may, according to the European
Commission, represent 10% of the global GDP by 2025.1 Such an innovative feat requires a
diverse set of firms, with different technological specializations and distinct business models,
working closely together in order to develop the technology standards guaranteeing such inter-
connectivity. In the telecommunications sector, firms supply technologies and collaboratively
develop these standards. In doing so, participating firms can benefit from their involvement
through the sale of resulting products, taking the standards as inputs, or by licensing the patents
protecting such technologies. Nevertheless, only some patented technologies will make it into
the standard, creating competitive pressures for firms with similar specializations.
Despite the longstanding debate over whether patents foster or hurt innovation, as well as
the economic relevance of the mobile telecommunications market, which represented almost
5% of global GDP in 2018, empirical evidence on the effect of patents on this standardized
technology is limited. This paper develops and estimates a structural model to understand
how competition between firms over including patented technologies in a standard affects their
incentives to cooperate and supply technologies to a common standardization process. This
study contributes to our understanding of the mobile telecommunications sector, as well as to
the debate over patents and innovation in this special but important context.2
In this paper, I assess the impact of patent licensing on the number of firms working together,
the intensity of their contributions and, ultimately, on the time it takes a group of firms to
jointly develop a standard. For that, I propose a framework in which firms develop the full set of
standards together but are allowed to individually license the patents protecting the technologies
specified on each of them. In my model, firms can choose to work in many standardization groups
(extensive margin), each of which focuses on a single part/component of the technological system.
On the intensive margin, they also decide how much effort exert to increase the common value of
the component/part. In weighing this decision, they consider: (i) how their effort increases the
common value, (ii) how much they can privately appropriate from this common value through
patents, and (iii) their capacity to profit from the technology in the downstream part of the
1Commission (2016)2“One illustration of the enormous stakes in standards has been the ongoing disputes over smartphone patents.
Litigation across at least 10 countries enveloped these devices, with at least 50 lawsuits between Apple andSamsung and—until their May 2014 settlement agreement—20 cases between Apple and Google not counting theongoing lawsuits between Google and the Rockstar Consortium, of which Apple is a partner.” See Lerner andTirole (2015) for the complete quote and details.
2

market. In this context, patents have an ambiguous effect on the development of a common
standard. On the one hand, patents alleviate the free-rider problem, thereby inducing firms to
increase their efforts. On the other hand, patents incentivise firms to participate in groups with
less competition over patented technologies, but where their efforts may be less valuable. This
ambiguity generates a trade off for firms between: (i) participating in groups in which their
effort has a bigger impact on the common value but where they can appropriate from a smaller
part of the total; and (ii) participate in groups in which their contributions are less valuable but
they can appropriate from a bigger part. To study the net effect of these forces in equilibrium,
I estimate my model using a novel dataset on the standardization of 3G and 4G technologies. I
then use these estimates to evaluate the impact of enforcing royalty-free clauses in this market, a
policy in place in some internet standards like HTML. I find that preventing firms from licensing
their patents would have reduced firms participation and effort, slowing down the development
of the standards. My model implies such a policy would have delayed the completion of the
initial releases of 4G by 1 year.
As in other sectors with interconnected components, such as Internet or upcoming smart cars,
mobile telecommunication technologies are defined by technology standards. But who sets these
standards? Most firms in the Information and Communication Technology (ICT) sector choose
to develop their standards cooperatively, in bodies called Standard Development Organizations
(SDOs).In the mobile technology industry, the major SDO in charge of developing the industry
standards is the 3rd Generation Partnership Project (3GPP), a worldwide organization formed
by almost 1000 institutions. Modern innovations are often complex technological systems, re-
quiring a large number of well-defined standards to function. To standardized each component,
firms team up in small groups inside SDOs. In these groups, firms submit contributions and
collectively decide on what technologies to ultimately include in the standard. A technology is
considered essential if any implementation of a standard must use it. Patents protecting the IP
rights over such technologies are called Standard Essential Patents (SEP). Several SDOs require
SEPs to be licensed under a Fair Reasonable and Non-Discriminatory (FRAND) terms.3
This innovation model has proven to be very successful in the telecommunication sector
and may be key in the development of other innovations beyond the traditional ICT sector.4
3FRAND clauses are designed to prevent the exploitation of unearned market power, which firms may gain fromthe incorporation of their proprietary technologies into industry standards, and avoid potential underinvestmentof standards’ implementers due to this uncertainty on IP cost (the hold-up problem)
4Modern innovations often result from a combination of multiple inventions, and therefore require the jointwork of firms with different technological specializations. A good example of this are interconnected, or smart,cars. In order for cars to be able to communicate with each other, industries as diverse as cybersecurity providers,cloud vendors and automotive software providers, along with automotive manufactures, need to work closely
3

The innovation model adopted by firms in the telecommunication market is flexible enough to
accommodate the incentives faced by firms with different business models specializing in different
technologies. Moreover, the network effects of interconnectivity are large, as are the gains to
using a common technological language allowing it.5 To the best of my knowledge, this work is
the first to provide a structural framework for collaborative innovation which can be generalized
to analyse firm incentives in the standardization of other technologies.
Understanding the market structure of the mobile telecommunications market is critical to
understanding firm behaviour and incentives. In the upstream part of this vertical market, firms
collaborate to develop the mobile system’s technology, while also protecting their individual IP
rights with patents. The technology is then used as an input to produce intermediate and final
goods, such as semiconductors, mobile devices, and telecommunication services. This gives rise
to 4 different business models: (i) pure upstream firms, whose only revenues come from licensing
patents; (ii) intermediary firms, which license patents and produce intermediary goods such as
telecommunication equipment; (iii) downstream vendors, which may or may not be vertically
integrated and must obtain licenses for the patents necessary to produce their devices; and
(iv) telecom operators that buy telecommunication equipment to provide services downstream.
Moreover, firms in this market also have technological knowledge or a specialization, which I
measure using their patent portfolio and the technological classification of their patents. To
assess the technological similarity of firms, I rely on the cosine similarity of the corresponding
portfolios.6
In my framework, firms face a common incentive to develop the technology in the shortest
amount of time as they cannot produce or license their IP rights until the whole set of standards
is established. Using a novel dataset on the standardization of 3G and 4G, I first show empirical
evidence that firms can speed up technology development by providing effort together. To show
this, I estimate a time production function for standard development, where the development
time is the output and firms’ efforts are the main inputs, which I proxy with the number of
written contributions submitted by each firm to the group. I find that a 10% increase in a single
firm’s effort is associated with a nearly 2% reduction in the time it takes to develop a standard.
I also show that the effect of greater efforts on the speed of development is higher when the
together.See https://www.rfidjournal.com/articles/view?17632/2 for a complete description of the developmentof smart cars.
5According to the European Commission Guidelines (Commission (2016)), without the interoperability enabledby standards, 40% of the potential benefits of Internet of Things would be lost.
6Cosine similarity is a metric used to measure how similar two vectors are irrespective of their size. Mathe-matically, it measures the cosine of the angle between two vectors projected in a multi-dimensional space. Thismetric is widely use in machine learning environments, for example, to assess the similarity of two documents.
4

firms working together are specialized in similar technologies. I call this the cooperation effect:
if a firm’s similarity with the rest of the group is in the top 20% of the knowledge similarity
distribution, when that firm increases effort by 10%, the time to complete decreases by an extra
0.2%, on top of the 2% reduction discussed above. On the other hand, when a firm’s similarity
with the rest of the group is in the bottom 20% of the knowledge similarity distribution, the same
increase in effort only decreases development time by an extra 0.075%, which is not significantly
different from 0 at a 5% confidence level.
Secondly, allowing firms to license their patents individually generates a private incentive for
firms to contribute in teams in which they may obtain a higher number of patents, even if this
would slow down development. This can generate a misalignment between the common incentive
of developing standards in due time and a firm’s particular incentives to contribute more where
it can obtain more patents. In my framework, firms contributing to the same standardization
group compete for their technology to be included in the standard, and this competition is
tougher the closer the firms are in the technological space. I call this the Competition effect.
I find that for a given firm, working with other firms that are, on average, 1% more similar
in terms of knowledge, reduces the expected number of SEPs it holds by 1.3%. This evidence
supports the existence of a competition effect.
With this empirical evidence in mind, I develop a two-stage structural model for the incen-
tives firms face in the joint development of mobile telecommunication standards. The model
features: (i) firms with heterogeneous knowledge and different business models which choose
whether to participate in each standardization group, as well as a level of effort that will max-
imize profits from standardization; (ii) standards that need to be developed in order to meet
technology goals which have been (exogenously) decided. A novel feature of this approach is
that it does not require any proprietary data on royalty revenues, on profits from standard-
ization, or on prices of intermediary goods to estimate the model. The timing of events is as
follows. First, firms decide whether to participate in each standardization group, depending on
the profits they expect to receive and on the match between their technological expertise and
the one required to develop the standard. Second, firms decide how much effort to exert in the
standardization group, given the participation decisions of the other firms. The time it takes
to develop a standard-release depends on the effort exerted and the cross-effects between the
efforts of firms with different areas of expertise (knowledge).
As usual, I start by solving the second stage of the model. I construct a firm profit function
accounting for the revenues from (i) good production with standards as inputs; and (ii) the
5

licensing of SEPs, where both are negatively related to the time it takes to develop the set of
standards in a release.7 For the identification of profit function parameters, I assume revenues
from good production using the standard only vary with the business model of the firm, while
revenues from licensing SEPs vary with the number of SEPs held by a firm and the standard’s
release. Finally, I assume firms face a quadratic marginal cost of effort, which is heterogeneous
across firms, constant over all standardization projects and unobserved for the researcher up to a
parametric distribution with an unknown firm-specific mean and a common variance parameter.
In the first stage of the model, each firm simultaneously chooses in which group to partici-
pate. These decisions are not random, but the literature sheds little light on why firms choose
to participate in some standardization groups and not others. Guided by qualitative survey
information that I complemented with informal talks with industry practitioners, I assume that
firms make their participation decision based on (i) the potential overall profits firms expect to
get from participation in a standardization group; and (ii) the match between firm and standard
goals. Firms are specialized in certain technologies, and therefore are more willing to partici-
pate in groups developing standards related to these technologies. For example, if a group is
developing a standard for a new kind of antenna for 5G, then firms working in the fields re-
lated to antennas are more likely to participate in that group. I consider (ii) as a fixed cost
of participation. While (i) is endogenous to all firms decisions and characteristics, the second
one is exogenously determined by the technological needs of the standard and the technological
knowledge of the firm.
To estimate the parameters in my structural model, I rely on a 3-stage procedure in which
I first estimate the parameters in the time production function and the SEP equation, using
the same empirical strategy as in my empirical evidence section. Second, I use these estimates
and the equilibrium equations of the model to calculate the moments, which I then match to
key moments in the data. I rely on a minimum distance estimator to back out this last set of
structural parameters. Finally, I use all the previously estimated parameters to compute the
difference between the profits of the observed decision and the counterfactual one, imposing a
parametric distribution on the participation shocks, and estimate the participation parameters
by maximum likelihood.8
7The faster all standards in the release are finished, the faster firms can start profiting from either of the twochannels described above. Time can be implicitly interpreted as a discount factor. Moreover, according to 3GPPprogram, one of the goals in the standardization process is to develop standards in the smallest amount of timepossible, therefore it makes sense to assume that firms profit from lower development times.
8I rely on a Nash Equilibrium concept to compute the counterfactual choice set, and derivate logit conditionsfrom the inequalities resulted from a revealed preferences approach.
6

For a clearer interpretation of the parameters, I construct an index which captures the relative
importance of royalty revenues with respect to the overall expected revenues from standardiza-
tion. My results suggest that in the development of 4G, the licensing of IP rights represents
more than 20% of the profits firms expect to get from standardization. Before the first release
of 4G, the SEP licensing represented 5% of intermediary firms total profits and less than 10%
for vendors.9 As a robustness check of my results, I compare my estimation of the importance
of licensing for Qualcomm, the one firm in my sample that separately reports both type of prof-
its.10 In my model, from 4G technologies onward, the licensing of patents represents between
60-66% of total profits for Qualcomm. In their annual results, Qualcomm reported, between
2010-2016,11 licensing profits between 63 -73% of total profits.
In this context, the impact of enforcing a royalty-free licensing scheme is ambiguous.12 On
the one hand, it would shut down the competition effect, aligning firms’ private and common
incentives and encouraging similar firms to cooperate more to take full advantage of their com-
plementarities, developing the standards in less time. On the other hand, it would also shut
down one of the potential revenue streams, disincentivizing firms from participating and exerting
effort. This second channel is particularly important for firms that do not profit from selling
products. To quantify this trade-off, I compare the predictions of my economic model using the
estimated parameters against an economic model in which patents are licensed for free. In my
counterfactual scenario, I allow effort and participation decisions to vary with the new licensing
policies. I find that, despite an increase of the average similarity of almost 5% between firms
in the same standardization group, which boosts the cooperation effect, the overall impact is
an increase in the time it takes to develop the technology. This result can be explained by a
decrease of 7% and 18% in average participation and effort, respectively. Results are hetero-
geneous across releases. In the case of the first releases of 4G, which took 3 years to develop,
forcing firms to license their patents for free would have delayed completion by an additional
year.
Contributions to the literature. This paper contributes to various strands of the liter-
ature. First, it is related to the growing literature on technology standardization and patents.
Licensing of standard’s patents has being mostly analysed from a theoretical point of view.
Close to my research question, Shapiro (2000) discuss if our patent system is slowing down the
9This index is not relevant in case of pure upstream firms or telecommunication operators, since by assumptionof the model it would be 100% and 0% respectively.
10See https://investor.Qualcomm.com/financial-information/quarterly-results114G was commercially launched in 201012Under royalty-free clauses, firms must license their patents at no cost.
7

commercialization of new technologies by describing the patent thicket problem, a problem that
arises when those seeking to commercialize new technology must obtain licenses from multiple
patentees, and assess its importance when combined with a hold-up problem, that is, the danger
that new products will inadvertently infringe on patents issued after these products were de-
signed. To alleviate those problems they recommend the use of cross licensing agreements and
patent pools. In a similar line, Lerner and Tirole (2015) study the inefficiencies attached to the
lack of licensing price commitments and show how structured price commitments restore compe-
tition. Also related to my reserach question Layne-Farrar, Llobet and Padilla (2014) assess the
effects of different licensing rules on firms participation in standardization processes and R&D
investment. On the empirical side of this literature, Rysman and Simcoe (2008), show that the
inclusion of a patent in a standard increases the patent’s return, because it signals its value and
influences future adoption of the patented technology. Consistent with the view that inclusion
increases a patent’s value, Simcoe, Graham and Feldman (2009) show that patents disclosed in
SSOs have higher litigation rates, particularly if these patents are assigned to small firms. Both
studies focus on the Internet Standards. Related to the standards in the telecommunication
market, Bekkers et al. (2017) study differences in the rules used by different SSOs and how
this influence which patents are disclosed, the terms of licensing commitments, and ultimately
long-run citation and litigation rates for the underlying patents.
Investigating the effects of firm similarity on standard development, Baron and Pohlmann
(2013) explore the degree of complementarity and competition between firms participating in
the development of ICT standards and how that shapes firms incentives to collaborate. In the
same vein, Bar and Leiponen (2014) find a negative correlation between firms’ technological
distance and their probability of developing R&D together. Using the 3GPP as a case study,
Jones, Leiponen and Vasudeva (2018) find that firms contributing to the mobile standard tend
to cooperate more after a patent litigation event.
In contrast, this paper is the first one to: (i) provide an empirical framework to think about
incentives firms face in this type of collaborations; (ii) quantify the importance of licensing
revenues with respect to market revenues; (iii) provide a structural model that can be used to
evaluate counterfactual policies; and (iv) asses the impact of enforcing royalty-free clauses on the
time of developing standards for the mobile technologies. It also differs from earlier literature
on technology development and standardization in that: (i) it estimates a time production
function for standards, allowing for cross-effects between the efforts exerted by different firms;
(ii) accounts for the heterogeneity in firm knowledge similarity and firms’ business models; (iii)
8
uses contributions to 3GPP as inputs for the time production function; and (iv) constructs
a revenue function for the firms participating in the development of standards in the mobile
telecommunications market, allowing for competition over IP rights of the technologies included
in the standard.
This study is also related to the literature on team production models, that is also mainly
composed by theoretical contributions. This literature started with the seminal reference of
Holmstrom (1982) on moral hazard in teams. More recent theoretical contributions have added a
network component to the team production games, including Goyal and Joshi (2003), Ballester,
Calvo-Armengol and Zenou (2006) and Benlahlou (2019).13 The empirical literature on this
topic is growing but still narrow. An example is Hsieh et al. (2018) with their empirical model
on coauthorship’s network. Ballester, Calvo-Armengol and Zenou (2006) and Benlahlou (2019)
develop a theoretical framework that accounts for complementarities and substitution between
the players’ effort in a team production function.
This paper uses a similar production function, but I impose that at least a part of a team’s
output must be divided between its members. This introduces competition between team mem-
bers over the largest share of the common output. I also complement earlier studies by empiri-
cally estimating effort complementarities in the team-production function, while allowing them
to depend on the knowledge similarity of participating firms.
Finally, my analysis also relates to empirical literature on innovation economics. My ap-
proach is interesting when revenues and profits are unobserved. Traditionally, papers in this field
relied on patents , their citations (Trajtenberg (1990), Hall, Jaffe and Trajtenberg (2001)),their
renewal fees Pakes (1984), R&D expenditures, or case studies. More recent papers use admin-
istrative data (Aghion and Howitt (1999); Bell et al. (2018); Bell et al. (2019)) or proprietary
data provided by Non-Practicing Entities (Abrams et al. (2019)). Notwithstanding, the scarcity
and low quality of the data remains a central challenge in studying the economics of innovation.
In this paper, I use a novel data set on standardization, developed by the Searle Center for
Innovation at Northwestern University (Baron and Spulber (2018), Baron and Gupta (2018),
Baron and Pohlmann (2018)), to develop a structural framework for cooperation within innova-
tion alliances, allowing me to quantify the incentives firms face in jointly developing technology.
I can estimate parameters of an empirical revenue function, even while only observing a proxy
for the effort exerted by firms. This approach can be very useful for markets in which some
variables, such as revenues and prices, are not easily observed due to proprietary conditions or
13For literature on network formation see for example, Myerson (1994); Bala and Goyal (2000) and Jacksonand Wolinsky (1996).
9
the difficulty of its accountability.
The rest of the paper proceeds as follows. Section 2 describes the relevant institutional
details and data, including the most relevant facts about the mobile telecommunications market
and a simplified version of how standards are developed in 3GPP. Section 3 shows empirical
evidence on the competition and cooperation effect than I later include in my model. In section
4, I develop a structural model for firms effort decisions in standardization groups. Estimation
procedure and identification strategy is discussed in section 5 and results are presented in section
6. Finally, I conclude in section 7.
2 Institutional setting
2.1 The mobile telecommunications market
The market for mobile telecommunications is vertically integrated. In the upstream part of the
market, firms collaborate to develop the mobile system’s technology, while also protecting their
individual Intellectual Property (IP) rights. The technology is then used as an input to produce
intermediate and final goods, such as semiconductors, mobiles, and telecommunication services.
Most of the firms operating in this market produce goods that comply with the technology.
These firms can be divided in two groups: those producing final goods and the ones producing
intermediary goods. In my study, I consider firms producing intermediary goods as upstream
firms, since they don’t sell to final consumers. Final consumers in this market are individuals
that buy phones and telecommunication operators that buy infrastructure equipment to deploy
the mobile network.
Firms selling downstream are mainly phone vendors, such as Samsung, Apple, LG, Huawei
and ZTE. The ones producing intermediary goods are firms producing chips, like Qualcomm, and
infrastructure equipment, such as Ericsson and Nokia. One of main differences between these
two groups is how intensely they use the technology developed upstream for manufacturing their
own goods. Vendors need to comply with the whole technological system to produce phones,
and therefore must obtain licenses for all patents protecting the technology. Firms producing
intermediary goods need to produce goods compatible with the technology, but might not employ
all of the system’s patents in their product.
Telecommunication operators are another part of this market. In my analysis, these firms
are consumers since they buy infrastructure equipment to deploy their network. Though they
provide final consumers with mobile communications, this is not germane to my study. These
firms rarely develop technology upstream and therefore hold almost no IP rights.
10
Finally, there are pure upstream firms, which I define as a firms which do not produce any
goods, but earn most of their revenue by licensing intellectual property. Interdigital, Universi-
ties and research centers such as the Chinese Academy of Telecommunications Technology are
examples of such firms.
Firms’ business models and payments in this market
In this market, there are two channels through which firms can benefit: (i) producing down-
stream using the technology developed upstream, and (ii) licensing the IP rights. The extent to
which firms benefit from each depends on their business model.
Firms in the upstream part of the market, that is, pure upstream firms, and those producing
intermediary goods, license their IP rights to vendors. IP rights are usually protected by patents,
and licensing firms are paid royalty revenues. Firms typically license their entire patent portfolio,
and the amount they can charge is set in court. The number of ongoing disputes over the
licensing of these patents are indicative of the enormous stakes involved. According to Lerner
and Tirole (2015), as of May 2014, there were at least 50 lawsuits between Apple and Samsung,
and 20 between Apple and Google. Galetovic, Haber and Zaretzki (2018) estimates that royalty
revenues from SEP licensing in 2016 were around 14,000 million dollars, and represented 3% of
the cost of manufacturing a smartphone.
For vertically integrated firms, their downstream business model has implications for the
revenues derived from (ii), as they are usually engaged in cross-licensing agreements. These are
contracts in which each party is granted rights to a piece of technology, product, research, or
other intellectual property. Cross-licensing agreements allow parties to use the technology pro-
tected by the other parties’ patents without having to pay, in return for allowing the other parties
to use their own protected technology. They help prevent litigation over patents infringement
disputes.14
Finally, phone vendors only operating downstream, such as Apple, Xiomi, and HTC, pay
royalties to the firms holding the IP rights for the technology to produce their phones.
Throughout this paper, I focus mainly on the upstream part of the market, only accounting
for the downstream activity of firms when considering the incentives they have to innovate.
14If a firm undertakes activities that are covered by the claims of a patent without having a license for it, theyare said to infringe the patent.
11

2.2 Technology generations, releases and standards
Mobile telecommunication technology is defined by technological standards, rules defining how
related technologies are to be built.15 More specifically, a standard is a document that describes
a feature of a technology. In the telecommunications market, this could be a document describing
a characteristic of the antennas required to send a cellular signal. In order to describe the whole
system of mobile telecommunications, hundreds or even thousands of standards are required.
Mobile communication technologies evolve over time, and each round or version of standard-
ization is called a release. Each release is formed by all the standards necessary to implement a
given version of the mobile communication system.
Table 1: Releases and technology generations
Release Start Generation TechnologyYear
Rel-99 1996 3G WCDMARel-4 1998 3G UMTSRel-5 2000 3G IMS HSDPARel-6 2000 3G HSUPA WLANRel-7 2003 3G EDGE EVOLUTIONRel-8 2006 4G LTERel-9 2008 4G WIMAX LTE Dual CellRel-10 2009 4G LTE AdvancedRel-11 2010 4G LTE HetNetRel-12 2011 4G ProSeRel-13 2012 4G NB-IoTRel-14 2014 4G LTE Advances ProRel-15 2016 5G 5G system phase 1Rel-16 2017 5G 5G system phase 1
Each release belongs to a given generation of the technology. There have been 4 generations of
mobile standards, each describing a different technology generation, with 5th generation currently
under development. Within each generation, there is heterogeneity in the technology used. A
change in generations occurs only when there is a major change in the technology, while a
minor evolution of the technology gives place to a new release of the standards inside the same
generation of technology. Consider the development of 4G. The first release of 4G was Release-8,
describing Long Term Evolution (LTE) technology. Though 4G is still in use, devices can now
also connect with LTE advanced Pro, from Release 14.16
15Though there are standards for many productive activities, such as standards for plugs, TV standards (PALor NTSC), etc. (even driving on the right side of the street can be considered a standard), this paper only refers totechnological standards. These standards are very different from the ones describing mobile telecommunicationstechnologies, and therefore the development procedures described in this paper apply only to mobile technology.
16The release of a new version of the technology, such as LTE advanced, doesn’t fully replace the previous one.
12

2.3 Standard Development Organizations
Mobile standards, such those that define the use and implementation of Wi-Fi, Bluetooth and
the Internet Protocol, are developed in Standard Development Organizations (SDO). An SDO is
any organization active in the development of standards. In some cases, an SDO may endorse a
standard it developed. In other cases, standards developed by an SDO may be formally endorsed
by a Standard Setting Organization (SSO). Each SDO defines its own standard development
procedure, as well as the rules its members have to follow in order to participate. These rules
usually refer to the steps and majorities required to approve a standard, as well as how licensing
of the patents for standard implementation is handled. For a more comprehensive description
of the diversity of SDO rules, the reader might refer to Lerner and Tirole (2006) and Baron and
Spulber(2018).
3GPP and the mobile telecommunication standards
The third Generation Partnership Project (hereafter, 3GPP) is the main SDO in charge
of supplying mobile telecommunication standards to the industry. It is a private, worldwide
organization formed by almost 1000 organizations. This includes anything from phone manu-
facturers and telecommunication operators to national regulators.17 Participation in 3GPP is
open, up to a fee. It is important to note that being a member of 3GPP does not require any
obligation in terms of contributing to the development of the standards. In fact, the majority
of their members do not contribute to such development.
The documents delivered by 3GPP are not proper standards, according to its formal defini-
tion, but Technical Recommendations (TR) or Technical Specifications (TS). Once these docu-
ments are finished, they are passed to ETSI for its formal endorsement. TS and TR documents
may define new proper standards or modify existing ones. Since I am interested in the standard
development and not on it endorsement, I simplify my terminology and refer to 3GPP’s TS and
TR documents as standards.
3GPP was created in December 1998 by the signing of “The 3rd Generation Partnership
Project Agreement,” and since then, they have been in charge of developing standards for the
1st, 2nd, 3rd, 4th and upcoming 5th generation of mobile technology. As can be seen in Figure 1,
the work in 3GPP is organized in 3 Technical Specification Groups (TSG) representing the
main technical areas: (i) Radio Access Network (RAN), (ii) Core Network & Terminals; and
Usually several technologies coexists in time and their use depends on the deployment of each of them.17Formally 3GPP is formed by 7 national and regional SDOs. These local SDOs, called organizational partners,
are: ARIB (Japan), ATIS (USA), CCSA (China), ETSI (Europe), TSDSI (India), TTA (Korea) and TTC (Japan).A firm joins these SDOs by paying a fee, and any member of these organizations can participate in 3GPP.
13

Source: 3GPP’s webpage
(iii) Service and System Access (SA). Inside each TSG, there are Working Groups (WG), which
are also defined by their technological scope and organize meetings to develop standards. All of
them are coordinated by a unique Project Coordination Group (PCG).
One of the most important rules set out by SDOs relate to the licensing of the Intellectual
Property (IP) rights protecting the innovations included in a standard. 3GPP has two main
rules regarding IP rights:18 (i) members should declare the existence of patents protecting any
essential technology included in the standard; and (ii) holders of such patents must make licenses
available to all interested third parties under fair, reasonable and non-discriminatory (FRAND)
terms. The patents mentioned in (i) are called Standard Essential Patents (SEPs), and any
entity that wishes to implement the standard must obtain a license for those patents. The
use of these clauses allow SDOs to avoid hold up problems.19 By forcing participating firms
to license their SEP under FRAND terms, SDOs avoid any potential strategic use of SEPs to
prevent competitors from launching rival products. This also encourages the early adoption of a
standard by assuring implementers a “reasonable” cost of using it. FRAND is meant to balance
the tension between providing developers incentives to invest in technology development and
ensuring downstream competition.
18See https://www.3gpp.org/about-3gpp/3gpp-faqs for more details on the licensing policies of 3GPP.19See Lemley and Shapiro (1991) for more details on the hold up problem.
14

Figure 2: Example of the development of a Release with 2 standards
FirmA
Knowl.A
FirmB
Knowl.B
FirmC
Knowl.C
FirmD
Knowl.D
FirmE
Knowl.E
FirmF
Knowl.F
Tech. Goal 1Idea1
Crea
tes
Standard1
Tech. Goal 2Idea2
Modifies Creates
Standard2
Tech. Goal 3Idea3
ContributionsContributions
Release
READY TO IMPLEMENT
2.4 Development of standards in 3GPP
The process of developing standards is neither simple nor linear. I present here a simplified
version that will help the reader the main steps in the development of a standard in 3GPP.20
The first step is to define a technological goal that the system should meet. This initial idea
can be presented by any organization as long as it has the support of 4 3GPP members. These
initial goals are typically broad and must be broken into smaller ideas and problems that are
more concrete and actionable to ultimately attain the broad goal. Each “part” of this idea,
generically called work item21 in 3GPP might either give place to a new standard (if there is a
completely new feature that must be developed in order to accomplish this goal) or modify an
existing one. Each part of this initial idea is allocated to a working group,22 which is in charge
of transforming the idea in a standard.
As a simplifying example, consider a release of only 2 standards with 3 goals: (i) the new
mobile technology should allow phones to connect to the network, even in very dense cities;
(ii) energy efficiency should be enhanced; and (iii) security of the network should be improved.
Each idea is allocated to a different working group depending on the technological requirements.
Figure 2 illustrates this example.
20As explained in the previous paragraphs, to simplify terminology I refer to Technical Reports and TechnicalSpecifications as standards.
21Formally, there are many categories of work items: study items, features, building blocks and work tasks. SeeETSI TR 121 900 p.26 for more details on work items.
22See Figure 1 for a description of 3GPP structure.
15

Imagine now that the first goal requires a new type of antenna capable of emitting signals
in very dense cities. Since this is a new feature it requires a new standard to describe it. Then,
the chair of the working group sets up a meeting where all interested firms can show up.23
Once there, firms provide documents with their ideas for this new antenna. These documents
are called contributions. Before providing these technical solutions to the group, firms conduct
in-house R%D. Firms developing standards typically have a history of R&D activities that
determines their knowledge. I define firm knowledge as the capacities and know-how acquired
trough experience and R&D activities.
The process of developing a standard usually requires firms to meet more than once and its
approval is done in stages: first it is approved by firms actively contributing to the standard
and then by all firms in the corresponding working group. Approval is achieved by consensus.24
Contributions have different names depending on their type and the stage at which they are
submitted: technical reports, discussion documents, change request or proposal. In this paper I
assume all contributions equally valuable for the development of the standard.
Consider now idea number (ii). Suppose that to enhance the energy efficiency of the system,
two things must be achieved: modify some feature of the antenna previously developed and
develop a new way of transmitting signals. The first part of this idea requires to modify Standard
1, while the second one entails the creation of a new one. The procedure for modifying an existing
standard is the same as the one for creating one.
To finish my simple example, consider now the third idea. To improve the security of the
network, the transmission technology must be modified. This idea only involves modifying
standard 2.
Ideas continue arriving until the chair of the Project Coordinator Group judges that most
of the work has been done for this release. Then, the release is said to be “frozen” and it can
be used by implementers. Firms holding IP rights over technologies that are standard-essential
have to declare it at some point of the standardization process. A technology is considered
essential if there is no alternative way to implement the standard without using it. Patents
protecting IP rights of these technologies are called Standard Essential Patents (SEP).
23Working groups have been omitted from Figure 2 to simplify the figure.24Consensus in 3GPP is defined as the lack of sustained opposition and might not imply that 100% of members
agree with the decision.
16
3 Data
3.1 Data sources
My main data source is the Searle Center Data Base (hearafter, SCDB), a comprehensive
database on technology standards developed by the Searle Center of Northwestern University,
in collaboration with Qualcomm, Perinorm, and IPLytics.25 The database consists on 3 related
datasets, one of which contains detailed information on the standardization process of mobile
networks in 3GPP, which occurred between 1999 and 2010. During this period I observe 9
releases of 3G and 4G, firms’ written contributions to each standard in each release, the date
each contribution was submitted, and whether it was approved (or rejected). The database also
has information about the meeting in which each contribution was discussed. I combine the
information from this database with another dataset on essential patents, from the SCDB. This
allows me to see who owns the IP rights over the technologies included in each standard.
For the purpose of my analysis, I also add information on firms’ patent portfolio from United
State Patent and Trade Office (USPTO). From the Patentview platform, I collected data on firms
granted patents from 1970 to 2014, including their technological class, based on the International
Patent Classification (IPC).26
I complement my analysis with data on working items affecting each standard, which I
scraped from 3GPP webpage. As explained in 2.4 a working item is a document containing
the description of a new feature or a goal proposal that might be included into one or more
releases. I call working items “technology goals”, since they are the first steps in incorporating
new features to the system.
To merge these datasets together, I rely on firm names and algorithms to match string
variables. See appendix A for details and robustness checks (TBD).
3.2 Empirical measures and descriptive statistics
Most of the variables I need to conduct my study are not observed. I therefore construct various
empirical proxies using the data described in the previous section. More precisely, I construct or
define the following measures: (i) Standard heterogeneity; (ii) Effort and participation decisions;
(iii) Firm knowledge similarity; (iv) Group outcomes; and (v) Payments.
Standard heterogeneity Not all standards carry equal weight. Some of them describe broader
or more complex parts of the system. To account for this, I use information on the technology
25see Baron and Gupta(2018) and Baron and Pohlmann(2018) for a more detailed description of the data sets.26patentsview.org.
17

Source: Table produced using SCDB data
Release Number of standards Average number of firms Average tech. goalsin the sample per standard per standard
Rel - 99 54 4.5 4.6Rel - 4 70 4.9 5.1Rel - 5 100 4.7 7.1Rel - 6 194 5.4 6.3Rel - 7 275 5.9 6.4Rel - 8 407 7.1 5.5Rel - 9 389 7.1 5.5Rel - 10 361 6.9 7.1Rel - 11 285 6.6 10.4
goals for each release. To achieve each goal, new standards might be created and old ones
might be modified. Then my measure of a standard’s broadness is the number of technological
goal documents that mention that standard. For example, a standard that is mentioned in two
technological goal documents is broader than one that is mentioned in only one. On average, a
standard is related to 7.18 technology goals (see Table 3)
Effort and participation decision. Effort is not directly observable but written contributions
to a standard are. I use the number of contributions made by firms to a standard as a proxy
for firm effort. If the contribution is submitted by more than one firm, I give equal weight to all
participating firms. I consider any firm that submits at least one contribution as a participant
of the standard.
Firms’ knowledge similarity I rely on patented technologies to measure firm knowledge.
Using USPTO data on granted patents, I construct a patent portfolio for each firm in the
dataset by counting the number of valid patents in each technological class, as defined by the
International Patent Classification (IPC). IPC is a hierarchical system for the classification of
patents according to the different areas of technology which they pertain. Most of the firms
in the dataset specialize in Information and Communication Technologies (ICT) and have no
patents in classes unrelated to ICT. To avoid “false similaritie” driven by zeros in non-ICT
categories, I consider only the 15 most relevant classes for this market. To determine relevance,
I consider all technological classes of all patents declared to be essential to any standard. I
then select the 15 most frequent ones. These 15 classes cover a little over 85% of all essential
18

Table 3: Descriptive statistics
N Mean SD Min Max
Panel A: Standardization characteristics
Number of firms (participating) 1,899 6.09 4.48 2 25Number of contributions 1,899 65.40 159.69 2 2463Time to develop the standard (days) 1,899 691.57 649.13 0 4,030Broadness 1,899 7.18 10.06 1 173Knowledge similarity of participating firms 1,899 0.67 0.19 0.01 0.99Number SEP declared to the standard 946 9.49 19.78 1 175
Panel B: Firms characteristics
Number of standards participating (per release) 315 36.75 55.93 0 313Number of patents 315 4,476 8,722 0 46,609Number of SEP 315 18.13 53.30 0 650Size (sales) per year 115 24,385 24,925 0 116,466R&D expenditures per year 115 1,803 1,867 0 7,150
patents. With the 15 classes for each firm in each year, I use Cosine Similarity (CS) to measure
the similarity between any 2 firms. CS is commonly used in the machine learning literature as
a metric for the similarity between two documents, and is defined as follows:
CS(A,B) =~A~B
‖ ~A‖‖ ~B‖=
∑ni=1AiBi√∑n
i=1Ai√∑n
i=1Bi
Since there can only be a non-negative amount of patents in any class, CS will take values
between 0 (no similarity, vectors are orthogonal) and 1 (completely equivalent, vectors have the
exact same direction).
The advantage of CS over the euclidean distance is that it depends only on the direction, not
the length, of the vectors. Here, I consider the classes in which a firm has patents but not how
many. Since CS is a pairwise measure, to account for the similarity of a firm in a given group,
I average the CS between this firm and all the other firms in the group.
Group outcomes and payments According to the project agreement, one of the goals of 3GPP
is to “[use] minimum production time for Technical Specifications and Technical Reports from
conception to approval”.27 Given that neither value nor quality are observable at a standard
27See 3GPP Partnership Project Agreement https://www.3gpp.org/ftp/Inbox/2008 web files/3gppagre.pdf,page 1.
19
level, the time it takes to develop the standard is the closest observable proxy for the success of
the group. I define time of development as the number of days it takes to accomplish 90% of
the standardization work. Say one is the date the first contribution is submitted and the last
day is the date when 90% of all contributions have been submitted.
Time to Develop = Date when 90%work is accomplished−Date of the first contribution
Payments in this market comes from two sources: selling products or services complying with
the standard and from the licensing of SEP (royalty revenues), as explained in 2.1, and any of
these variables is observed. SEPs have to be licensed under FRAND terms and therefore there
is a cap on the amount a firm can expect to get from licensing it SEP. Even though FRAND
is not precisely defined and most of the royalties are set in court, this rule puts a cap on the
amount a firm can expect to get from licensing its SEP. Another way for firms to get a benefit
from their SEP is through cross-licensing.
Also no public information on cross-licensing agreements, therefore, even if I had access to
data on royalties revenues it will show that firms that don’t manufacture goods in the final
market are getting the largest benefits from standardization. This is because vendors rely a
lot on cross-licensing agreements while pure upstream firms or firms producing intermediary
goods choose to license their SEPs. I therefore use the number of SEPs as a proxy of the private
upstream revenues a firm gets from participating in a standardization process. Assigning patents
to standards is not straightforward. There are several criteria for this in the SCDB. I used the
broadest criterion, which assigns all patents declared to be essential to a standard. , even if the
information for the match was not perfect.
4 Empirical Evidence
In this section, I present empirical evidence documenting the economic trade-off that arises when
firms with similar knowledge work together. I first show the inverted U-shape relationship be-
tween the effort firms exert and their knowledge similarity. I then provide evidence of two effects
which generate the economic trade-off behind this non-linear relationship. On the one hand, I
show that when firms with similar knowledge work together, they speed up the development of
a standard because of the positive relationship between complementarities in firms’ effort and
their knowledge similarity. I call this the cooperation effect. On the other hand, when firms have
similar knowledge, the competition over intellectual property rights of the technologies included
in the standard becomes more intense. This is what I call competition effect.
20
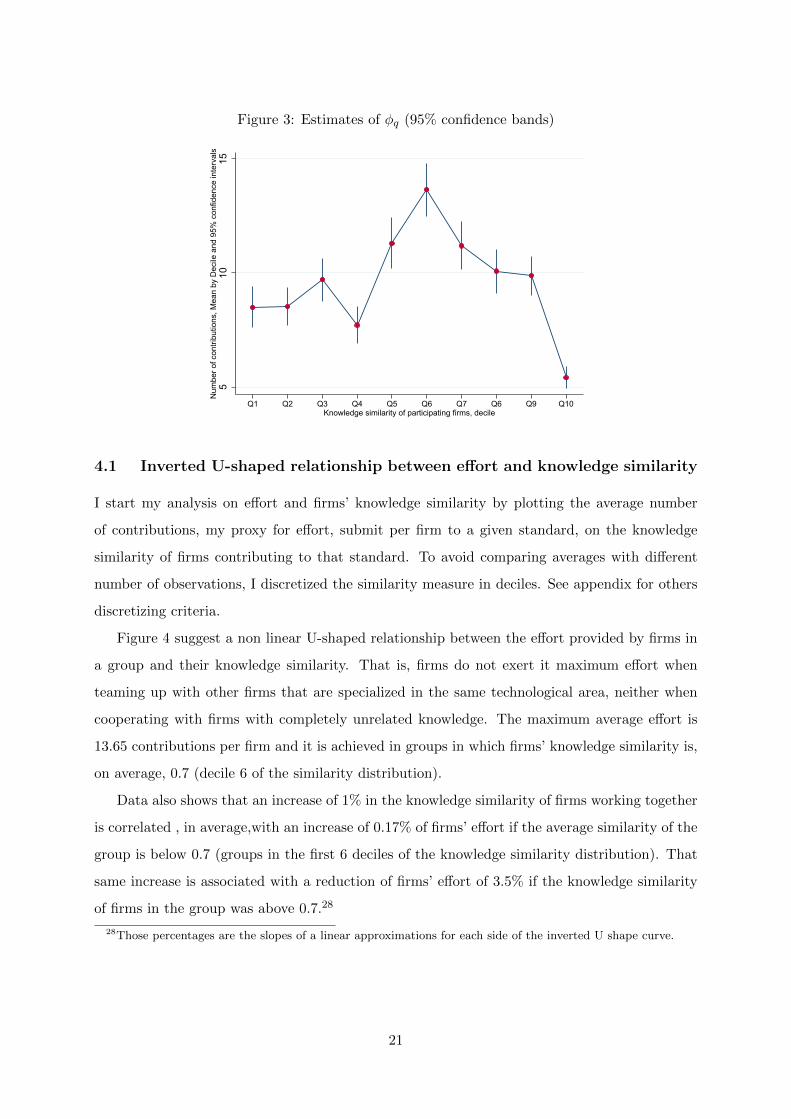
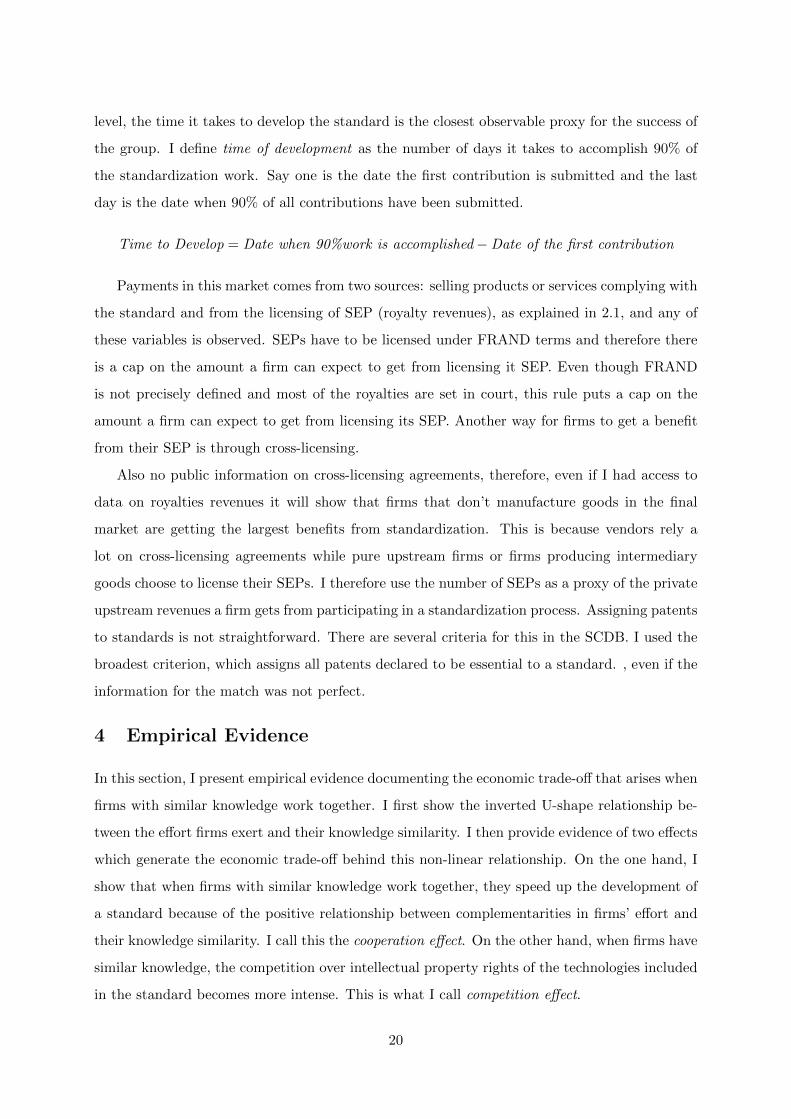
Figure 3: Estimates of φq (95% confidence bands)
510
15N
umbe
r of c
ontri
butio
ns, M
ean
by D
ecile
and
95%
con
fiden
ce in
terv
als
Q1 Q2 Q3 Q4 Q5 Q6 Q7 Q6 Q9 Q10Knowledge similarity of participating firms, decile
4.1 Inverted U-shaped relationship between effort and knowledge similarity
I start my analysis on effort and firms’ knowledge similarity by plotting the average number
of contributions, my proxy for effort, submit per firm to a given standard, on the knowledge
similarity of firms contributing to that standard. To avoid comparing averages with different
number of observations, I discretized the similarity measure in deciles. See appendix for others
discretizing criteria.
Figure 4 suggest a non linear U-shaped relationship between the effort provided by firms in
a group and their knowledge similarity. That is, firms do not exert it maximum effort when
teaming up with other firms that are specialized in the same technological area, neither when
cooperating with firms with completely unrelated knowledge. The maximum average effort is
13.65 contributions per firm and it is achieved in groups in which firms’ knowledge similarity is,
on average, 0.7 (decile 6 of the similarity distribution).
Data also shows that an increase of 1% in the knowledge similarity of firms working together
is correlated , in average,with an increase of 0.17% of firms’ effort if the average similarity of the
group is below 0.7 (groups in the first 6 deciles of the knowledge similarity distribution). That
same increase is associated with a reduction of firms’ effort of 3.5% if the knowledge similarity
of firms in the group was above 0.7.28
28Those percentages are the slopes of a linear approximations for each side of the inverted U shape curve.
21

4.2 Complementarities in effort and knowledge similarity
It may be intuitive to think that firms work together because there are complementarities be-
tween their efforts, but it is not obvious that those complementarities are related to firms’
knowledge similarity, whereas the sign of this relationship is ambiguous.
In order to find empirical evidence of effort complementarities and their link to firm similarity,
I estimate a translog production function. As the output, I use the number of days (in logs)
it takes the group to develop the standard and as inputs, the effort (in logs), measured by the
number of contributions provided by each firm participating. Groups are defined at a standard-
release level.
In a first attempt to capture effort complementarities, I estimate the following fixed-effects
model at a standard-release level:
ttds,r = −β1
i=N∑i=1
ci,s,rpi,s,r−β2
2
i=N∑i=1
c2i,s,rpi,s,r−
φ
2
i=N∑i=1
j=N∑j=1
ci,s,rpi,s,rcj,s,rpj,s,r−µSs −µRr −εs,r (1)
where the dependent variable is the time it takes the group to develop standard s in release r,
normalized by its broadness, in logs.29 The independent variables ci,s,r and c2i,s,r are the number
of contributions (logs) and the number of contributions squared (logs) that firm i submits to
develop standard s in release r, respectively. The variable pi,s,r is a dummy variable that takes
value 1 if firm i participates in the group developing standard s in release r. The interaction
of firm effort is represented by the parameter φ. A positive φ means that firms’ efforts are
complements, while a negative φ means that the effort put in by different firms are substitutes.
To solve some of the endogeneity concerns that may arise from comparing standards with
different characteristics, I control for unobserved heterogeneity in standards by absorbing a set
of fixed-effects at a standard level. I include release fixed-effects to account for characteristics
of the release that do not vary across standards and which affect the time it takes to develop a
standard within the release. For example, it may be that the time it takes to develop standards
in the first release of 4G (release-8) is higher that the time it takes to develop a standard in
a subsequent release. I include two extra controls, a dummy variable that takes value 1 if the
standard is developed for the first time in that release and the average number of patents held
by firms participating in each group.
Column 1 of Table 4 presents estimates for Equation 1. After adding controls, I find that: (i)
there is a non-linear and concave relationship between effort and time (adjusted by the standard
29I normalize time by dividing by the broadness of the standard, defined as the number of related technologicalgoals (see the Data section for more details on this measure).
22

Table 4: Time production function
(1) (2)Restricted model Non-linear Effects
Contributions 0.195∗∗∗ 0.181∗∗∗
(0.000) (0.000)Squared number of contributions -0.0107∗∗ -0.00860∗∗
(0.015) (0.032)Joint effort:
All similarity levels 0.0114∗∗
(0.011)Q1 similarity 0.00756∗
(0.079)Q2 similarity 0.0103∗∗
(0.015)Q3 similarity 0.0106∗∗
(0.020)Q4 similarity 0.0173∗∗∗
(0.000)Q5 similarity 0.0225∗∗∗
(0.000)
Firm patent portfolio Yes YesStandard first time (dummy) Yes YesStandard FE Yes YesRelease FE Yes Yes
N 1792 1792adj. R2 0.543 0.544
p-values in parentheses. Errors are robust to heteroskedasticity All values are in logs∗ p < 0.10, ∗∗ p < 0.05, ∗∗∗ p < 0.01
23

broadness); and (ii) effort provided by different firms are indeed complements. The estimation
of parameter β1 shows that an increase in contributions of 10% decreases30 the average time
to develop a standard by almost 2%, other things being equal. We can see that β2 is negative
with a magnitude of about 0.1%, suggesting decreasing returns (in terms of the time it takes to
complete a standard) in the provision of effort The positive and significant value of the estimated
parameter φ supports finding (ii).
Estimates of Equation 1 suggest that the efforts provided by different firms are complements,
but they do not say anything about the relationship between these complementarities and the
similarity of the firms providing the effort. I assume firm knowledge comes from past in-house
R&D activities. For example, if a firm has previously done research about antennas, it is likely
that its contributions will related to them. As explained in ??, I use the similarity between
firms’ portfolios as a measure of firm knowledge similarity.
My hypothesis about the cooperation effect implies that if firms have similar knowledge,
they will face lower coordination costs, such as common expert language, and therefore, their
joint effort will speed up the standardization process more than the effort provided by dissimilar
firms.
To explore this hypothesis I estimate a more flexible version of Equation 1:
ttds,r = −β1
i=N∑i=1
ci,s,rpi,s,r−β2
2
i=N∑i=1
c2i,s,rpi,s,r−
q=Q∑q=1
φq2
i=N∑i=1
j=N∑j=1
ci,s,rpi,s,rcj,s,rpj,s,rDqi,j−µ
Ss−µRr −εs,r
(2)
where Dqi,j is a set of dummy variables that take value 1 if the similarity between firm i and
j is at the qth percentile of the firm knowledge similarity distribution. The set of parameters φq
represent the complementarities between efforts of firms whose similarity falls in the percentile
q of the distribution. Table 4 and Figure 4 present estimates using quintiles. See Appendix for
robustness checks using other percentiles and variables in levels.
Figure 4 shows empirical evidence of a positive relationship between the value of φq and firm
knowledge similarity. According to column 2 of Table 4, an increase in efforts’ interaction term
of 10% reduces the time to develop the standard by 2.25% if the effort is provided by firms with
a knowledge similarity in the top 20% of the distribution. If this same effort is provided by
firms with a knowledge similarity in the bottom 20%, this decrease in time is reduced to 0.75%
and it is not statistically different from 0 at a 5% significance level. This evidence supports the
30Remember that Equation 1 is defined in terms of −β1 and −β2.
24

Figure 4: Estimates of φq (95% confidence bands)
0.0
1.0
2.0
3.0
4Ef
fort
com
plem
enta
rity
coef
ficie
nt (p
hi)
Q1 Q2 Q3 Q4 Q5Firms knowledge similarity, quintile
hypothesis of a cooperation effect, in which efforts are stronger complements the more similar
the knowledge of firms providing it.
4.3 SEP competition and knowledge similarity
Licensing SEPs is one of the channels through which firms can benefit from participating in
the development of standards. As documented by Simcoe(2012) and by Spulberg(2013) and
Spulberg(2016), firms in SDOs compete within standards to include their preferred technology.31
Firms have private interests in including certain technologies in a standard, since they often have
IP rigths over them. Rysman and Simcoe (2008) show that SEPs receive twice as many citations
as the average patent, implying that patents gain additional value when included in a standard.32
The value of a SEP is difficult to asses since firms usually license the entire patent portfolio
and since it is defined in court under FRAND conditions.33 Therefore, one could think that
competition in this market is not on prices, but on the number of patented technologies to
be included in the standard. This last statement is implicitly assuming all SEPs are equally
valuable. Though this may appear to be a strong assumption, it is based on the essentiality of a
SEP: if all SEPs are required to implement the innovation, they are then perfect complements.
Following a Shapley value approach, it is then reasonable to assume that they have the same
value.34
31Simcoe(2012) studies the development of Internet standards.32For their empirical study, Rysman and Simcoe (2013) use data on 4 SSOs: ANSI, IEEE, IETF and ITU.33Some of the most well-known cases are Microsoft Corp vs Motorolla Inc and Ericsson Inc vs D-Link Sys.34See Roth (1988) for a detailed description of the Shapley value.
25
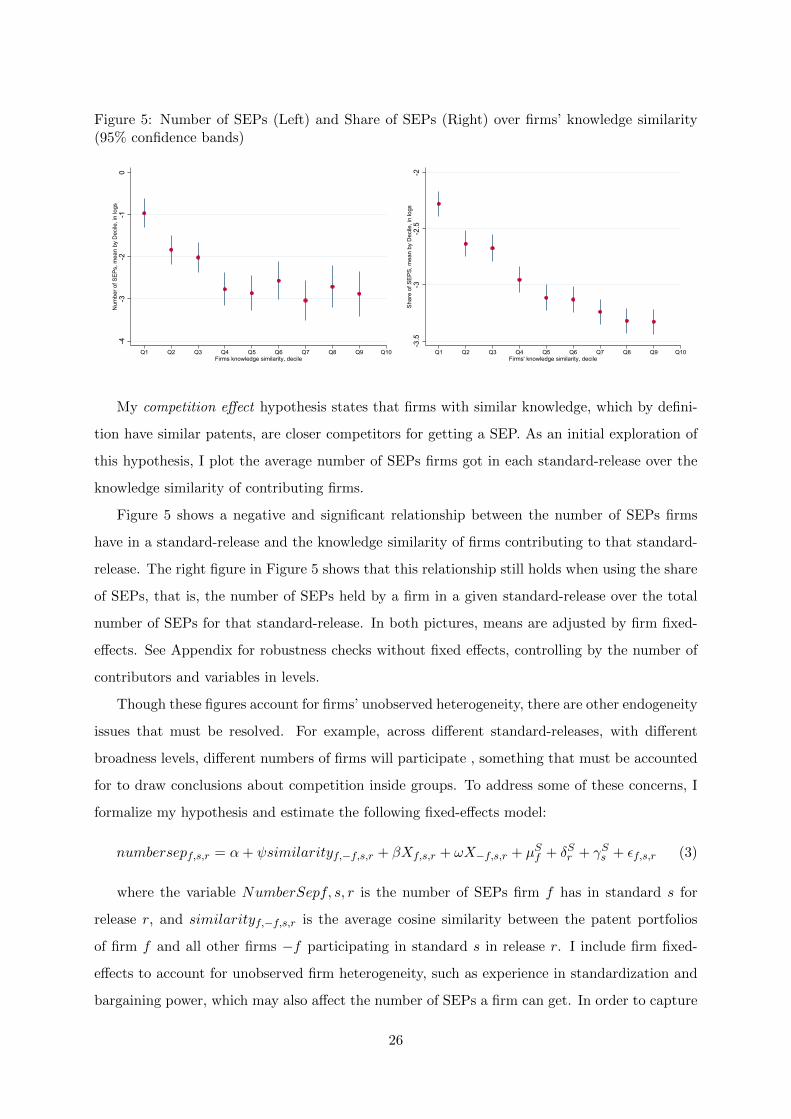
Figure 5: Number of SEPs (Left) and Share of SEPs (Right) over firms’ knowledge similarity(95% confidence bands)
-4-3
-2-1
0N
umbe
r of S
EPs,
mea
n by
Dec
ile, i
n lo
gs
Q1 Q2 Q3 Q4 Q5 Q6 Q7 Q8 Q9 Q10Firms knowledge similarity, decile
-3.5
-3-2
.5-2
Shar
e of
SEP
S, m
ean
by D
ecile
, in
logs
Q1 Q2 Q3 Q4 Q5 Q6 Q7 Q8 Q9 Q10Firms' knowledge similarity, decile
My competition effect hypothesis states that firms with similar knowledge, which by defini-
tion have similar patents, are closer competitors for getting a SEP. As an initial exploration of
this hypothesis, I plot the average number of SEPs firms got in each standard-release over the
knowledge similarity of contributing firms.
Figure 5 shows a negative and significant relationship between the number of SEPs firms
have in a standard-release and the knowledge similarity of firms contributing to that standard-
release. The right figure in Figure 5 shows that this relationship still holds when using the share
of SEPs, that is, the number of SEPs held by a firm in a given standard-release over the total
number of SEPs for that standard-release. In both pictures, means are adjusted by firm fixed-
effects. See Appendix for robustness checks without fixed effects, controlling by the number of
contributors and variables in levels.
Though these figures account for firms’ unobserved heterogeneity, there are other endogeneity
issues that must be resolved. For example, across different standard-releases, with different
broadness levels, different numbers of firms will participate , something that must be accounted
for to draw conclusions about competition inside groups. To address some of these concerns, I
formalize my hypothesis and estimate the following fixed-effects model:
numbersepf,s,r = α+ ψsimilarityf,−f,s,r + βXf,s,r + ωX−f,s,r + µSf + δSr + γSs + εf,s,r (3)
where the variable NumberSepf, s, r is the number of SEPs firm f has in standard s for
release r, and similarityf,−f,s,r is the average cosine similarity between the patent portfolios
of firm f and all other firms −f participating in standard s in release r. I include firm fixed-
effects to account for unobserved firm heterogeneity, such as experience in standardization and
bargaining power, which may also affect the number of SEPs a firm can get. In order to capture
26

the heterogeneity across releases that may affect the number of SEP, I also include release
fixed-effects. In the same spirit, I absorb a set of standard fixed-effects.
CovariatesXf,s,r control for the number of contributors in the standard-release, the broadness
of the standard-release, a dummy variable that takes value 1 if the standard is developed for
the first time in that release, and the portfolio size of the firm and its expenditure in R&D
activities. The value of these last two variables is computed in the year previous to joining
the standard, as joining the standardization process might impact firms’ patents portfolio and
their R&D activities. In some specifications, I also control for the average characteristics of
other firms in the group, X−f,s,r, to account for the portfolio size and R&D expenditures of the
competing firms.
Firms do not always get SEPs when participating in the development of a standard-release. In
fact, in the sample of standards for which I have information, 43% of the times firms participate
they do not get any SEPs. Given the significant number of zeros in my sample, I also estimate
a tobit model for Equation 3.
Table 5: SEPs and firm knowledge similarity
(1) (2) (3) (4)Baseline Controls Other firms Tobit
controls
Firms’ knowledge similarity -1.723∗∗∗ -0.875∗ -1.286∗∗ -2.470∗∗∗
(0.000) (0.093) (0.015) (0.000)
Firm characteristics (Portfolio, R&D) No Yes Yes YesCharact. other firms in the group No No Yes YesFirm FE Yes Yes Yes YesRelease FE Yes Yes Yes YesStandard FE Yes Yes Yes NoStandard- release characteristics No Yes Yes Yes(Numb of firms,Broadness, First time)
Average SEP per firm-standard-release 1.5 1.5 1.5 1.5Firms’ average knowledge similarity 0.64 0.64 0.64 0.64
N 2059 2059 2059 2059adj. R2 0.137 0.286 0.300
p-values in parentheses. Errors are robust to heteroskedasticity. All values are in logs∗ p < 0.10, ∗∗ p < 0.05, ∗∗∗ p < 0.01
Table 5 shows estimates of ψ in Equation 3. See Appendix for the complete table including
27
all estimates in Equation 3. An increase of 1% in the average knowledge similarity of firms
in the group decreases the number of SEPs obtained by firms in that group between 2.47%
and 0.875% depending on the specification. The negative and significant relationship between
a firm’s number of SEPs and a firm’s knowledge similarity in the group is robust to the several
set of controls detailed in the previous paragraph. This evidence supports the hypothesis of a
competition effect, according to which firms with similar knowledge are closer competitors when
it comes to obtaining SEPs.
4.4 Participation and standard-firm match
Participation is relatively low in the data, with the overall probability of joining standardization
group at 16.64%. These decisions is not random, but the literature sheds little light on why
firms choose to participation in some standardization groups and not others. In an attempt
to model participation in a more realistic manner, I relied on qualitative survey information,
complemented with informal talks with industry practitioners.
In 2003, ConsortiumInfo.org conducted a small survey on standardization and SSOs, which
asked major players in technology sector about the standardization process in different SSOs.
Specifically, they asked, “What are the three most important things that you look for in any
standard setting organization in deciding whether to join?”. Firms responded with reasons
such as topic and goals, how relevant a standard was to their technical expertise; IP rights
policies, cost effectiveness vis-a-vis alternative, the procedures and group composition, and other
members’ commitment of engineering resources.
I group these answers in two categories: (i) the potential overall profits firms expect to get
from participation in a standardization group; and (ii) the match between firm and standard
goals. Firms are specialized in certain technologies, and therefore are more willing to participate
in groups developing standards involving such technologies. For example, if a group is developing
a standard for a new kind of antenna for 5G, then firms working in the fields related to antennas
are more likely to participate in that group. I refer to this second point as the firm-standard
fithypothesis. While (i) is endogenous to all firms decisions and characteristics, the second
one is exogenously determined by the technological needs of the standard and the technological
knowledge of the firm.
The empirical challenge of modelling the firm-standard match is the unobservability of the
standard topic or goal. Nevertheless, I observe the broadness of a standard.35 Then, if the firm-
35Another approach could be to look at the technological classes of the patents declared to be essential to thestandard. However, this is observed ex-post, and then patents’ technology class are likely to match the classes of
28

standard technological fit hypothesis is true, I should observe that broader standards, which
require a higher number of distinct technologies, are subject to higher participation. This is
because if more technologies are required, it is more likely that one of will be relevant to a given
firm’s interest and expertise. On the flip side, if a firm works in several technological areas, it is
more likely to be interested in more standard. To capture this empirically, I use patent portfolio
size to measure firm technological capacity. If the firm-standard fit hypothesis is true, I should
observe that firms with bigger portfolios are more likely to participate in standardization groups.
As an initial exploration of this hypothesis, I estimate the following logit model for partici-
pation, at a firm-standard-release level:
pf,s,r = 1βpXpf,s,r + γpPortfoliof,r + γbBroadnesss,r + νpf,s,r > 0 (4)
where pf,s,r is a dummy variable that equals one if firm f participates in standard s in release
r, Xpf,s,r is a set of proxy variables for the revenues that f would obtain if it were to partic-
ipate, Portfoliof,r is the number of patents in firm f ’s portfolio the year prior to release r,
Broadnesss,r is the broadness of standard S in release r measured by the number initial goals
affecting the standard, and νpf,s,r captures the unobserved (to the researcher) determinants of
the firm’s participation decision, including the quality of the fit between the standard’s techno-
logical needs and the firm’s technological capacity. As extra controls, I also include a dummy
variable that takes on value 1 if standard s is developed for the first time in release r, as well as
release and standard fixed-effects.36
Xpf,s,r includes proxies for firms’ standardization revenues, including the amount of down-
stream sales of the firm and firm fixed-effects. The first accounts for the size of the firm,
controlling for the heterogeneity in downstream profits across firms and firm’s size. Firm fixed-
effects control for other unobserved firm characteristics, invariant across standard and release,
affecting their likelihood of participating.
Columns 1, 2 and 3 present estimates for Equation 4. I find a positive and significant γp
across all specifications, meaning that firms with bigger portfolios are more likely to participate
in a standardization group, everything else constant. I also find a positive and significant γb,
suggesting that firms are more likely to participate in broader standards.
As is usual in logit models, due to the normalization σ2ε = π2/3, parameters are identified
up to a scale factor. To quantify the effect of adding an extra patent or broadening a standard
patents held by participating firms.36Given the large number of standards (645) and the small number of observations per standard, estimations
of standard fixed-effects are biased due to the incidental parameters problem (Neyman and Scott (1948)). Nev-ertheless, since I am not interested in the estimates of those parameters, I do not adjust for them.
29

Table 6: Logit estimates for participation decisions
(1) (2) (3)Baseline Fixed Effects Controls
Portfolio size of the firm (log) 0.134 ∗∗∗ 0.146∗∗∗ 0.345 ∗∗∗
(0.000) (0.000) (0.000)
Broadness of the standard 0.038∗∗∗ 0.018∗∗∗ .022∗∗
(0.000) (0.000) (0.000)
Firm FE No Yes YesStandard FE No Yes YesRelease FE No Yes YesStandard and firm characteristics No No Yes(First time standard, Sales)
N 59,395 59,395 26,835Pseudo R2 0.0415 0.3712 0.3975
p-values in parentheses. Errors are robust to heteroskedasticity∗ p < 0.10, ∗∗ p < 0.05, ∗∗∗ p < 0.01
by 1 unit , I calculate the marginal effects of those variables on the participation probabilities.
Figure 6 shows the results of this estimation. The probability of a firm participating in a group
with a broadness of 30 or more units is almost 30%, double the overall probability of participation
of 16%. On the other hand, a firm with a portfolio of 8000 patents (e9) are twice as likely to
participate than firms with portfolios of 3 patents (e1).
These results provide evidence in favour of the firm-standard fit hypothesis. The match
between a standard and a firm matters for participation and the broadness of a standard, which
is partially captured by the size of a firm’s portfolio.
4.5 The need for a model
Results in the preceding sections suggest that the presence of IP rights generate vested interests
that could slow down the standardization process. On the one hand, competition over IP rights
generates incentives for firms to team up with firms specialized in different technologies, as
shown in subsection 4.3. On the other, I show in subsection 4.2 that firms which are closer
in the technological space develop standards faster due to the large complementarities between
them. Notwithstanding, IP rights are a monetary incentive for firms to participate and exert
effort. That is especially true for pure upstream firms, since IP licensing is their only revenue
30
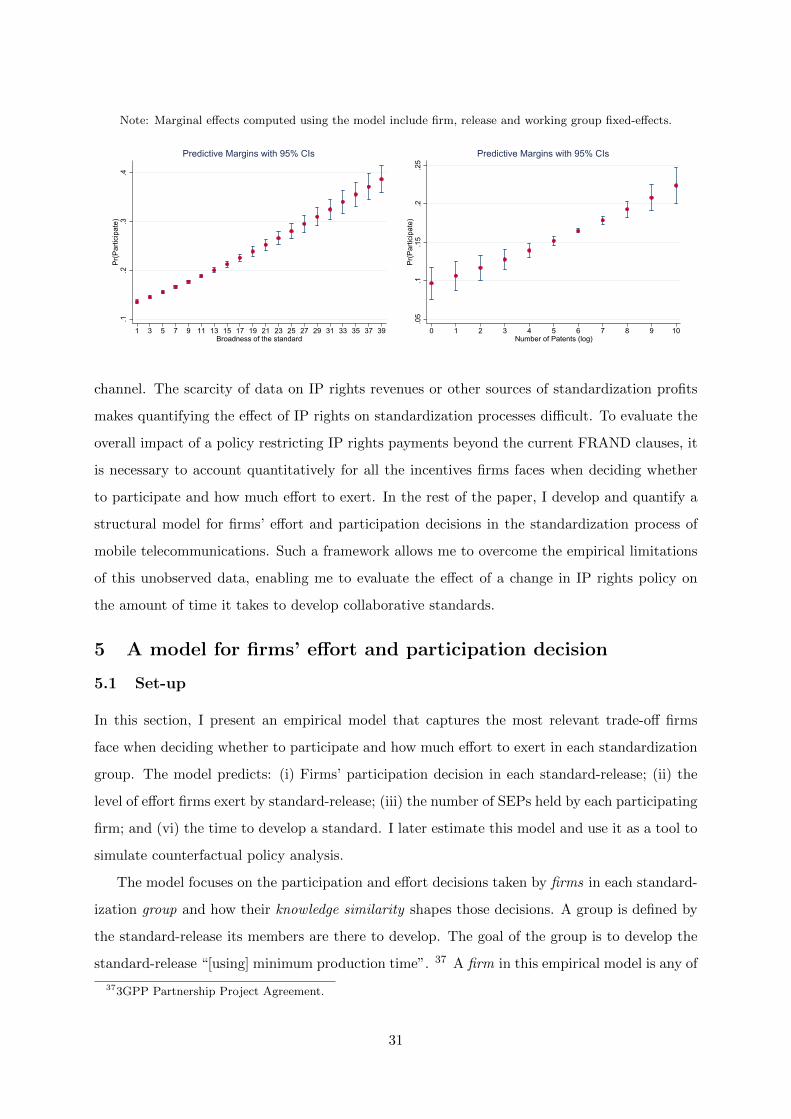
Note: Marginal effects computed using the model include firm, release and working group fixed-effects..1
.2.3
.4Pr
(Par
ticip
ate)
1 3 5 7 9 11 13 15 17 19 21 23 25 27 29 31 33 35 37 39Broadness of the standard
Predictive Margins with 95% CIs
.05
.1.1
5.2
.25
Pr(P
artic
ipat
e)
0 1 2 3 4 5 6 7 8 9 10Number of Patents (log)
Predictive Margins with 95% CIs
channel. The scarcity of data on IP rights revenues or other sources of standardization profits
makes quantifying the effect of IP rights on standardization processes difficult. To evaluate the
overall impact of a policy restricting IP rights payments beyond the current FRAND clauses, it
is necessary to account quantitatively for all the incentives firms faces when deciding whether
to participate and how much effort to exert. In the rest of the paper, I develop and quantify a
structural model for firms’ effort and participation decisions in the standardization process of
mobile telecommunications. Such a framework allows me to overcome the empirical limitations
of this unobserved data, enabling me to evaluate the effect of a change in IP rights policy on
the amount of time it takes to develop collaborative standards.
5 A model for firms’ effort and participation decision
5.1 Set-up
In this section, I present an empirical model that captures the most relevant trade-off firms
face when deciding whether to participate and how much effort to exert in each standardization
group. The model predicts: (i) Firms’ participation decision in each standard-release; (ii) the
level of effort firms exert by standard-release; (iii) the number of SEPs held by each participating
firm; and (vi) the time to develop a standard. I later estimate this model and use it as a tool to
simulate counterfactual policy analysis.
The model focuses on the participation and effort decisions taken by firms in each standard-
ization group and how their knowledge similarity shapes those decisions. A group is defined by
the standard-release its members are there to develop. The goal of the group is to develop the
standard-release “[using] minimum production time”. 37 A firm in this empirical model is any of
373GPP Partnership Project Agreement.
31

the 35 organizations actively contributing to 3GPP.38 The concept of knowledge similarity refers
to the technological specialization or know-how firms have prior to joining any standardization
group.
The timing of events is as follows. First, firms decide whether to participate in each stan-
dardization group, depending on the profits they expect to get and on the match between their
technological expertise and the one required to develop the standard. Second, firms decide how
much effort to exert in the standardization group, given the participation decisions of the other
firms. The time it takes to develop a standard-release depends on the effort exerted and the
cross-effects between the efforts of firms with different areas of expertise (knowledge). Third,
members of 3GPP decide on which technologies to include in the standard-release. Then,firms
owning IP rights over these technologies claim their SEPs.39 Finally, when all standards in
the release are finished, implementers manufacture phones or deploy the network to provide
telecommunication services. SEPs holders also license their patents at this stage.
5.2 Group Outcomes
I model the time it takes to develop a standard-release, TTDs,r, as a function T of the effort
exerted by each firm, the complementarities between these efforts, and standard and release
characteristics.
TTDs,r = T (Es,r, E2s,r, X
Ss , X
Rr ; θT )
where Es,r represents the effort exerted by all firms developing standard s in release r, E2s,r is
the sum of the squared efforts and XSs and XR
r are a set of variables representing standard and
release characteristics, respectively. Finally, θT represents the set of parameters in T .
To take this model to the data, I assume a linear specification for T and proxy for firm effort
for each standard-release using the number of contributions they submit to each group. Assume
that firms are labeled f = 1...N . Then, Equation 5 defines the time production function as:
TTDs,r = β1
f=N∑f=1
ef,s,rpf,s,r+1
2β2
f=N∑f=1
e2f,s,rpf,s,r+
φ
2
N∑f 6=j
N∑j 6=f
ef,s,rpf,s,rej,s,rpj,s,rsf,j+αTs +αTr +εTs,r
(5)
383GPP has hundreds of members, but I consider only those that submit at least 5 contributions during theperiod 1999-2012. See 3.1 for more details on this.
39SEPs are actually declared by their owners. Once the technological solutions are chosen firms holding patentsprotecting the IP rights of those selected technologies have to declare it to 3GPP.
32
where ef,s,r is the effort exerted by firm f toward the development of standard s for release
r, pf,s,r is a dummy variable that takes value 1 if firm f participates in the development of
s in release r, si,j is a measure for the knowledge similarity between firms i and j, αTs is a
standard-specific term that accounts for the unobserved heterogeneity in standard complexity
and αTr is a release-specific term. The term εTs,r is standard-release specific and accounts for
all residual variation in TTD. The parameter φ in Equation 5 is an average measure of firm
effort cross-effects. If φ > 0, then the efforts are on average strategic complements. If instead
φ < 0, then they are substitutes. Keeping in mind the empirical evidence on the interaction
between complementarities and firm knowledge similarity, I allow complementarities in effort to
vary with firm knowledge similarity si,j .
Moreover, I assume that:
E[εTs,r | ef,s,r,Jf,s,r] = 0 (6)
where E denotes the expectation of εTf,s,r conditional on firm effort, and Jf,s,r is the information
set of firm f when deciding how much effort to exert for standard s in release r
5.3 Revenue function
There are two channels through which firms can benefit: (i) producing downstream using the
technology developed upstream, and (ii) licensing the IP rights. The main differences between
these benefits are whether they accrue upstream or downstream and the rivalry each entails. To
profit from the implementation of the standard, a firm must operate downstream or produce
intermediary goods. Then, since many vertically integrated firms can produce downstream at
the same time, there is no rivalry on the implementation of the standard. On the other hand,
each SEP is a rival good because only one firm can own it.
To account for both channels in my model, I include: (i) a set of dummy variables representing
the business model of the firm; and (ii) a SEP equation that models firm competition over SEPs
in the standardization group. The first term represents the non-rivlarous part of the team’s
output value, which firms can appropriate by using standards as inputs to produce downstream.
The second term represents the part of the team’s output that can be privately appropriated by
firms through IP rights on the essential technologies.
The time it takes to develop the standard also (negatively) affects firms’ revenues. The faster
all standards in the release are finished, the faster firms can start profiting from either of the
two channels described above. Time can be implicitly though of as a discount factor in my
model. Recall that one of the goals in the standardization process is to develop standards in the
33

smallest amount of time possible, therefore it makes sense to assume that firms profit from lower
development times. As a simplifying assumption, I impose independence between the times it
takes to develop different standards. That is, there are no externalities between standards in a
release.
I then construct the following empirical function, R, to proxy for a firm’s revenue function:
Rf,s,r = R(TTDs,r, BMf , SEPf,s,r; θB)
where BMf is a set of dummy variables representing firm f ’s business model, and SEPf,s,r is a
function modelling the number of SEPs firm f has in standard s in release r. Ideally, I would
include the value of those SEPs, but because this variable is unavailabile, I consider only the
number of SEPs.40 Finally, θB represents the set of parameters in R.
To take this function to the data, I assume both components of the revenue function and
the time enter linearly. Then, the firm revenue function becomes:
Rf,s,r = (MT − TTDr)︸ ︷︷ ︸Time Penalty (-)
×(AMBMBMf︸ ︷︷ ︸Downstreamprofits ofusing s
+APr,BM ∗ SEPf,s,r︸ ︷︷ ︸Value of s that canbe privately appropri-ated by IP rights
) (7)
where :
TTDr =∑s∈r
TTDs,r
The term MT represents the maximum time to develop the set of standards, after which
they have no value. The parameter AMf accounts for the market revenues related to the imple-
mentation of the standard, while APr,BM is the average value for a firms with BM BM of a SEP
in release r.
5.4 SEP function
Most of the technologies included in 3GPP standards are protected by SEPs. Some of these
technologies were already developed, patented and ultimately included in the standard, while
others were developed specifically to meet the standard’s goals. Moreover, different firms may
have different technological solutions to meet the standard requirements. I assume that the
more similar the firms’ knowledge, the more they compete for their solution to be included in
40There are several problems when dealing with value of a SEP: (i) firms usually licence their entire portfolio ofpatents; (ii) royalties are usually set in court, are propietary data and vary depending who is the licensee (Abramset al (2019)); and (iii) even data on royalties collected by firms would not capture the whole value of a SEP dueto cross-licensing agreements between vertically integrated firms. See 2.1 for more details on this.
34

the standard. This idea is in line with the negative correlation I showed in section 4 between
the number of SEPs a firm has in a given standard and its knowledge similarity with the other
firms participating.
With this in mind, I define the following equation for the number of firms:
SEPf,s,r = S(similf,s,r;−f,s,r, XSf ; θS)
where similf, s, r;−f, s, r is the knowledge similarity between f and all other firms −f
participating in the development of standard s in release r, XSf are firm characteristics and θS
represents all parameters in S.
To take S to the data, I assume a linear specification. I also include a set of dummy
variables µf to account for unobserved firm heterogeneity, such as patenting experience and
bargaining power, and for release fixed-effects. I also add an error term εSf,s,r that accounts for
the measurement error in SEPf,s,r and an unexpected normal shock in the SEP function. Then
the SEP function is defined by:
SEPf,s,r = αS + ψsimilf,s,r;−f,s,r + µSf + µSr + εSf,s,r (8)
Moreover, I assume that:
E[εSf,s,r | sf,s,r;−f,s,r,Jf,s,r] = 0 (9)
where E denotes the expectation of εSf,s,r conditional on firm knowledge similarity prior to joining
the group, and Jf,s,r is the information set of firm f when deciding how much effort to exert in
standard s for release r
5.5 Marginal costs and Firms profits
In my model, firms have a quadratic marginal cost cf of exerting effort, whereas conditional on
participating, they face no fixed cost. Marginal costs are heterogeneous across firms but constant
across standards and releases. They are also common knowledge for all firms but unobserved to
the researcher. I assume that:
cf ∼ lognormal(µCf , σ2) (10)
with and unknown set of parameters µCf and σ2
Combining Equation 7, Equation 8 and Equation 10, I construct the following empirical firm
profit function:
35
Πf,s,r = (MT −TTDr)× (AMBMBMf +APr,BM ∗ (ψsf,s,r;−f,s,r +µSf +µSr + εSf,s,r))−cf2e2f,s,r (11)
Πf,s,r =∑s∈r
(MT − TTDs,r)× (AMBMBMf +APr,BM ∗ (ψsf,s,r;−f,s,r + µSf + µSr + εSf,s,r))−cf2e2f,s,r
Πf,s,r =
(− β1
∑s∈R
∑i∈S
ei,s,r −β2
2
∑s∈R
∑i∈S
e2i,s,r −
φ
2
∑s∈R
∑i∈S
∑j∈S
ei,s,rej,s,rsi,j − µSs + µRr − εTs,r)
× (AMBMBMf +APr,BM ∗ (ψsf,s,r;−f,s,r + µSf + µSr + εSf,s,r))
−cf2e2f,s,r
(12)
5.6 Optimal effort
Given their participation, firms choose how much effort ef,s,r to exert by maximizing expected
profits, assuming that other firms are also maximization their own profits. Combining Equa-
tion 12 with Equation 6 and Equation 9, I can write the following equation for the expected
profits:
E(Πf,s,r | If,s,r) = (− β1
∑s∈R
∑i∈S
ei,s,r −β2
2
∑s∈R
∑i∈S
e2i,s,r −
φ
2
∑s∈R
∑i∈S
∑j∈S
ei,s,rej,s,rsi,j − µSs + µRr )
× (AMBMBMf +APr,BM ∗ (ψsf,s,r;−f,s,r + µSf + µSr + εSf,s,r))
−cf2e2f,s,r
(13)
Then the best response function for firm f in standard s for release r is defined by:
∂E(Πf,s,r | If,s,r)∂ef,s,r
= (−β1−β2ef,s,r−φ
2
∑j 6=fj∈S
ej,s,rpj,s,rsf,j)∗(AMBMBMf+APr,BM∗SEPf,s,r)−cfef,s,r = 0
(14)
36

Rearranging, I can write the optimal effort e∗f,s,r of firm f as a function of the optimal efforts
of the the other firms in the group e∗j,s,r, the observable variables previously defined, and the set
of parameters of the model. That is:
e∗f,s,r = − β1
AMBMBMf +APr,BM ∗ (ψsf,s,r;−f,s,r + µSf + µSr + εSf,s,r)
cf + β2(AMBMBMf +APr,BM ∗ (ψsf,s,r;−f,s,r + µSf + µSr + εSf,s,r))
− φ
2
∑i∈Si 6=f
AMBMBMf +APr,BM ∗ (ψsf,s,r;−f,s,r + µSf + µSr + εSf,s,r)
cf + β2(AMBMBMf +APr,BM ∗ (ψsf,s,r;−f,s,r + µSf + µSr + εSf,s,r)e∗j,s,rpj,s,rsf,j
(15)
Then the matrix representation of the game becomes:
e1
e2...eNs
︸ ︷︷ ︸ENs×1
=
−β1C1
−β1C2...
−β1CN
︸ ︷︷ ︸
KNs×1
−
φ2C1φ2C2
...φ2CN
︸ ︷︷ ︸VNs×1
11,1 . . . 11,Ns
12,1 . . . 12,Ns
.... . .
...1Ns,Ns . . . 1Ns,Ns
︸ ︷︷ ︸
OnesNs×Ns
s1,1 . . . s1,Ns
s2,1 . . . s2,Ns
.... . .
...sNs,Ns . . . sNs,Ns
︸ ︷︷ ︸
SNs×Ns
×
e1
e2...eNs
︸ ︷︷ ︸ENs×1
(16)
where
Cf =AMBMBMf +APr,BM ∗ (ψsf,s,r;−f,s,r + µSf + µSr + εSf,s,r)
cf − β2(AMBMBMf +APr,BM ∗ (ψsf,s,r;−f,s,r + µSf + µSr + εSf,s,r)
Then I can write the game as:
E∗Ns×1 = KNs×1 + WNs×Ns SNs×Ns ∗E∗Ns×1 (17)
where
WNs×Ns = VNs×1 OnesNs×Ns
5.7 Second stage equilibrium
The Nash equilibrium of this stage of the model is the vector of efforts exerted by each firm,
for which every firm is maximizing its expected profits given that all other firms in the group
are doing so. Taken participation as given, in equilibrium each firm is exerting the effort that
maximises its profits given that all the other firms are also playing their best response. This
corresponds to the fixed point on firms’ efforts.
As can be seen in Equation 15 the reaction function of each firm are linear on others firms’
effort. This allow me to solve the model just by inverting the matrices in Equation 17. Then
the equilibrium of the model becomes:
37

E∗Ns×1 = (INs −WSNs×Ns)−1 ∗KNs×1 (18)
5.8 Participation decision
Revisiting the first stage of the model, each firm simultaneously chooses in which group to
participate. In line with the empirical evidence presented in subsection 4.4, I model a firm’s
participation decision based on: (i) expected revenues; and (ii) the fixed cost of participating.
Firms generate their expectations over standardization profits according to the model presented
in the previous section.
Firms face a fixed cost of participating in each standardization group. An important part of
this fixed cost is the technological knowledge a firm must have to participate in the development
of a given standard. Firms have to invest resources (engineers’ hours) in order to understand
the group goal and assess its potential for the firm. If the standardization group is working in a
field completely unrelated to a firm’s technological expertise, the fixed cost is higher. As I show
in subsection 4.4, the fit between the technological need of the standard under development and
the firm’s technological knowledge is an important determinant of firm participation. I therefore
incorporate this friction in my model as a fixed cost.
Moreover, I assume the following structure for the observable part of the firm’s fixed costs:
FCf,s,r = γFC0︸︷︷︸Constant
+ fitf,s,r︸ ︷︷ ︸Firm-Standard fit
+ γf︸︷︷︸Firm specific FC
(19)
where:
fitf,s,r = M(Broadnesss,r, Portfoliof,r; γfit)
where γFC0 represents a constant fixed cost common to all firms in the market, fitf,s,r refers
to the fit between the firm’s technological expertise and the standard’s requirements, and γf is a
firm-specific constant term accounting for the unobserved heterogeneity in firm standardization
capacity. An example of such unobserved heterogeneity is the number of potential groups in
which a firm might be able to participate. Keeping in mind the evidence presented in subsection
4.4, I model the fit between firm and standard as a function M of the standard’s broadness
Broadnesss,r and the firm’s technological capacity, proxied by the size of its patent portfolio
Portfoliof,r.
Participation condition (Revealed Preference assumption): If pf,s is the participa-
38

tion decision chosen by firm f in standardization group s, then
E(Πf,s(pf,s)− Ff,s(pf,s) + εpff,s | Jf ) ≥ E(Πf,s(1− pf,s)− Ff,s(1− pf,s) + ε
1−pff,s | Jf ) (20)
where (Πf,s(pf,s) and Ff,s(pf,s) are the second-stage profits and fixed costs of choosing pf,s, re-
spectively. εpff,s represents the unobserved part (to the researcher) of fixed costs firm f faces when
choosing pf,s. This unobserved term accounts for the part of the firm-standard technological
match that is not captured by the M function.
Without loss of generality, assume that firm f participates in standard s. Then, adding
Equation 11 I can write Equation 20 as:
(MT − TTD(e∗f , e∗pf=1−f )︸ ︷︷ ︸
TTD if part.
)× (AMBM +APr,BMSEPf )︸ ︷︷ ︸Revenues of part.
−cfe∗2f − Ff + εpartf,s
≥ (MT − TTD(0, e∗pf=0−f )︸ ︷︷ ︸
TTD if no part.
)× (AMBM )︸ ︷︷ ︸Revenuesof notpart.
+εnpartf,s(21)
where TTD(e∗f , e∗pf=1−f ) is the time it takes to develop the standard if firm f participates, exerting
optimal effort e∗f , and, given that firm f participates, the other firms −f exert their optimal
effort e∗pf=1−f . Note that a firm’s outside option of participating is not zero. The standard will
still be developed in a counterfactual time, TTD(0, e∗pf=0−f , given that firm f would exert no
effort and the other firms in the group would exert their optimal effort e∗pf=0−f accounting for
the non-participation of firm f .
I simplify notation in Equation 21 and write the participation condition as:
pf,s = 1 ⇐⇒ ∆(Πf,s)− FCf,s ≤ εpf=0f − εpf=1
f (22)
where ∆(Πf,s) represents the difference between the expected second stages profits if firm f par-
ticipates and if it does not. Recall that this is a full information game, therefore in equilibrium,
expectations equal observed values.
Equilibrium A Nash equilibrium in this stage of the model is a vector of firm participation
decisions for each standardization group. The revealed preference assumption is a necessary
condition for any possible Nash equilibria. It does not rule out multiple equilibria and it does
not assume anything about the selection mechanism used when there are multiple equilibria.
39

6 Estimation and Identification
The unknown model parameters θ are: (i) the set of parameters in the time production func-
tion parameters θT entering Equation 5; (ii) the set of parameters in the SEP function θS in
Equation 8; (iii) the market revenues set of parameters AMBM , the SEP’s price set of parameters
APr,BM ; (iv) the set of parameters of the firms marginal cost distribution µcf and σ entering
Equation 7 and Equation 17; and the set of F fixed costs parameters γ in ??
θ = θT , θT , AMBM , APr,BM , µcf , σ, γ
where:¯θT = β0, β1, β2, φ, µ
Tf
θS = ψ, µSf , µSr
γ = γR, γB, γP , γf
To estimate the parameters in my structural model, I rely on a 3-stage procedure. I first
estimate the parameters in the time production functionθT and the SEP equation θS , relying
on Equation 6 and Equation 9 for their identification. I then use those estimates and the
equilibrium equations of the model (Equation 18) to calculate the moments, which I then match
to key moments of the data. I rely on a minimum distance estimator to back out this last set of
structural parameters. Finally, I use all the previously estimated parameters to compute ∆Πf,s
and impose a parametric distribution to εp=1 and εp=0 and estimate γ by maximum likelihood.
Estimation and identification of the profit function parameters
Identification of β1, β2, φ, ψ , µSf relies on the parametric assumption on the distributions
of εTs,r and εSf,s,r and the classic moment conditions derived from the orthogonality assumption
in Equation 5 and Equation 8:
1. E[εTs,r | ef,s,r,Jf,s,r] = 0
2. E[εSf,s,r | sf,s,r;−f,s,r,Jf,s,r] = 0
The identification of the remaining parameter of the second stage of the model relies on
the set of moments m(θ). Although the model is highly non-linear in θ, so that (almost) all
parameters affect all outcomes, the identification of some parameters relies on some key moments
in the data. Keeping this in mind, I choose the following m(θ) moments:
40

1. The average effort per firm business model, across standards and releases: 1 moment per
business model.
2. The average effort per release, across firms and standards: 1 moment per release.
3. The average effort per firm, across standards and releases: 1 moment per firm.
The first set of moments in m(θ) exploits the variation in effort across firm’s business model
to identify AMBM . I assume that the revenues of producing goods using the standards as inputs
only vary with a firm’s business model, and that the business model of a firm only affects its
selling revenues. Then, the identification of AMBM relies on the idea that the difference between
the effort exerted by two firms with different business model, but otherwise have the same
characteristics and expect to have the same number of SEPs, must be driven by their expected
selling revenues.
Identification of APr,BM comes from the variation of effort across releases. Assuming that the
value of SEPs is the only component of the profit function that varies exclusively across releases,
then the variation across releases should reflect the changes in the value of SEPs.
Finally, I assume that a firm’s marginal cost does not vary across standards or releases.
Therefore, everything else equal, two firms exert different levels of effort because of the difference
in their marginal costs. Then the identification of µcf comes from the variation in average firm
effort across standards and releases.
Moreover, since the parameters in this model are identified up to a scale factor, I normalize
them with respect to the parameter σ of the cost function distribution. Particularly, I use
σ = 0.1.41
To get the point estimates of the parameters, I use a minimum-distance estimator which
chooses the parameter vector θ that minimizes the criterion function:
(m(θ)−md)′Ω(m(θ)−md)
where md are the corresponding data moments in the sample, and Ω is a symmetric, positive-
definite matrix; in practice, I use the identity matrix. Since the moments of this model cannot
be easily computed in closed form, I resort to simulation-assisted methods. More precisely, I
take 10 random draws from a lognormal(µcf , σ2) and for a particular value of θ, I solve the model
41Other values of σ can be used for the normalization. For instance, the standard choice σ = 1 increasesignificantly the time it takes the algorithm to minimize the distance between the data and the model moments.
41

for each of these simulations.42 I then average across simulations to obtain the moments of the
model for this particular value of θ. I compute standard errors following combining standard
delta method with bootstrap method in order to account for the uncertainty in both stages.
Participation model
The participation model of this paper can be linked to the class of discrete full information
choice models applied to oligopolistic markets. The standard approach to the estimation of
this type of entry models relies on assuming that firm profits are declining in rivals’ decisions
(Bresnahan and Reiss (1991b), Bresnahan and Reiss (1990)). This assumption does not hold
in my model, since firms can benefit from the presence of other firms in the group due to the
complementarities in their efforts. Another standard approach to solve this models is deriving
choice probabilities from a theoretical framework and finding the parameter values that maximize
the likelihood of entry choice in the data (Bresnahan and Reiss (1991a)). I rely on this last
approach. I rely on Nash equilibrium concept, and use the observed equilibrium to derive firms’
(unobserved) choice set. Starting from the observed equilibrium in each group, I consider the
vector of observed participation decisions when only 1 firm deviates at a time as a feasible
unobserved group configuration. Figure 7 shows a simple example using a three-firm group. In
the observed equilibrium, firm A and firm C participate, while firm B does not. I consider the
group in which only firm C or A participates as a potential unobserved group configuration, as
well as a configuration in which all three firms participate. The number of potential unobserved
group configurations following this approach is exactly the number of game players, which in
my game is 35. Recall that to compute each firm’s expected profits, in each group, I need to
compute all the remaining 34 firms optimal effort decisions. This means solving the model 35
times per standardization group
Figure 7: Observed and Unobserved Group configurations
Obs. goup configuration Unobserved group alternatives
Firm A = 1 Firm A = 0 Firm A = 1 Firm A = 1Firm B = 0 Firm B = 0 Firm B = 1 Firm B = 0Firm C = 1 Firm C = 1 Firm 1 = 1 Firm C = 0
Estimation of the participation model parameters
I assume unobserved participation terms εparts,r and εnparts,r in Equation 22 are identically and
42I also computed the moments using 100 simulations. Results were very similar but the computational timeincreased significantly. While estimating the parameters using 10 draws takes between 1 and 2 hours, using 100draws increased the computational time to more than 15 hours. Estimating standard errors by bootstrappingwould take an incredible time using 100 draws.
42

independently distributed across firms and standards with a type I extreme value distribution.
Then, the probability of firm f participating in standard s is:
Prob(ps,r = 1) =exp(∆πf,s − FCf,s)
1 + exp(∆Πf,s − FCf,s)(23)
where ∆(Πf,s) represents the difference between the expected second stage profits if firm
f participates and if it does not, defined in Equation 7, and FC is the fixed cost defined in
Equation 19. To compute ∆(Πf,s).
After constructing the counterfactual group configuration for each standardization group
and computing the corresponding ∆(π), I proceed to estimate the participation parameters
in Equation 22 by maximizing the likelihood function corresponding to the probabilities in
Equation 23.43
7 Estimation Results and fit of the model
Table 7 shows estimates for the direct effect of effort and the cooperation and competition effects.
All average point estimates of the coefficients of interest are significantly different from zero at
a 5% confidence level.
Table 7: Time production function and SEP estimates
Individual effect Effort’s squared Cooperation Competitionof effort (−β1) term (−β2) effect (−φ) effect(ψ)
Estimate 0.4068 ∗∗∗ -0.0027∗∗ 0.0068∗∗∗ -5.1673∗∗∗
SE 0.0510 0.0007 0.0027 0.6493
Standard charact. Yes Yes Yes YesRelease FE Yes Yes Yes YesStandard FE No No No NoFirms FE No No No Yes
N 1,880 1,880 1,880 2,824R2 0.5650 0.5650 0.5650 0.08
Errors are robust to heteroskedasticity.∗ p < 0.10, ∗∗ p < 0.05, ∗∗∗ p < 0.01
The positive sign of the cooperation effect suggest that efforts exerted by different firms and
their knowledge similarity are indeed complements. The same amount of effort provided by firms
43This is a just a simplify and first attempt to estimate this model and it does not properly deal with themultiple equilibrium problem. For a proper interpretation of the fixed cost parameters another method thataccount for potential multiple equilibrium should be applied.
43

that are 0.1 closer technologically reduces the expected time to finish the standard by 0.0075
days. I also find that each contribution reduces the expected standardization time non-linearly.
The significant and negative coefficient of β2 suggests that there are decreasing marginal returns
in the effort provision. That is, on average, the first contribution reduces standardization time
in 0.2243 days,44 while the second one only saves 0.2201 days. Standards require time to be
developed, and the effort provided by participating firms can reduce it up to a point. Given that
the time it takes to develop a standard reduces potential revenues from sales, the cooperation
effect here generates an incentive for firms to exert more effort when teaming up with other
firms specialized in similar technologies.
Column number 4 of Table 7 shows that firms working in the same group with technologically
similar firms expect to have a lower number of SEPs. The point estimate of the ψ parameter
suggest that an increase of 1% in the average similarity of the other firms in the group reduces
the expected number of SEPs by 0.41% for a firm. Contrary to the cooperation effect, the
competition effect generates incentives for firms to exert less effort when teaming up with other
firms that are specialized in similar technologies.
Table 8: Downstream revenues and SEP value estimates
Panel A: Estimates of the market revenues parameters
Pure Upstream Vendors Telecoms IntermediaryAM
up AMv AM
t AMI
Estimate 0 5.56 5.34 5.46SE - (0.026) (0.040) (0.023)
Panel B: Estimates of the SEP value parameters
Rel-3 Rel-4 Rel-5 Rel-6 Rel-7 Rel-8 Rel-9 Rel-10 Rel-11
Upst. 0.55 0.61 0.71 0.78 0.80 1.17 0.91 1.07 0.75(0.000) (0.001) (0.001) (0.003) (0.012) (0.014) (0.019) (0.018) (0.017)
Vend. 0.51 0.55 0.49 0.00 0.33 0.77 0.36 0.20 0.08(0.002) (0.001) (0.003) (0.005) (0.021) (0.028) (0.019) (0.034) (0.015)
Inter. 0.55 0.55 0.43 0.60 0.56 0.48 0.55 0.55 0.55(0.000) (0.003) (0.023) (0.019) (0.022) (0.007) (0.001) (0.000) (0.000)
Note: Bootstrapped SE in parenthesis. Bootstrap (with reposition) at a standardization group level, 1000 samples.
For the estimation of the remaining parameters of the profit function, I rely on a minimum
44The marginal effect of effort on time is 0.2285 - 0.0021 * Number of contributions.
44

Figure 8: IL index for vendors and intermediary firms
-.10
.1.2
.3IL
inde
x
Rel-4 Rel-5 Rel-6 Rel-7 Rel-8 Rel-9 Rel-10 Rel-11
Intermediary firms vendors
Note: Bands represent 95% confidence intervals. The variance of this Index comes from the variance of averagingthe number of SEPs per business model and release. release 4,5, 6 and 7 are part of the 3rd generation and release8 onwards belong to the 4th one.
distance estimator as explained in section 6. I use 100 simulation to compute each of the model’s
moments. Table 8 presents the structural parameter estimates.
Given the lack of scale in these estimates, I quantify the importance of licensing SEPs for
a firm’s expected profits by constructing an index which captures the relative importance of
royalty revenues with respect to the overall expected revenues from standardization. I define,
ILbm,r =APr,BM ×AvgSEPr,BM
APr,BM ×AvgSEPr,BM +AMBM
where ILbm,r is the importance of expected licensing revenues with respect to the total
expected revenues from standardization for firms with business model bm in release r. Figure 8
shows the IL index for vendors and intermediary firms, per release. As can be seen in Figure 8,
before 4G (from release-8 onwards), the licensing of SEPs had a higher weight in a vendor’s profit
function compared to that of a firm producing intermediary goods. This changes with 4G, when
the licensing of SEPs become more important in general, and particularly for firms producing
intermediary goods,for which represents a maximum of almost 30% of the total expected revenues
from standardization in release 10.
45

7.1 Fit of the model
Table 9 compares the empirical moments and the moments calculated from the model at the
estimated parameters. Overall, the model matches the moments of the data well: notably,
it perfectly captures the average effort per firm business model. Similarly, as can be seen in
Figure 9, the model perfectly captures the average firm effort for most of the firms in the
sample.
Figure 10 also plots the observed average effort per decile of firms’ similarity in the data
and the average effort computed from the model at the estimated parameters. Considering
that those moments are not targeted when estimating the parameters, the model predicts the
non-monotonic relationship between effort and firms’ knowledge similarity remarkably well.
Table 9: Model fit - targeted moments
Data Model
Upstream firms average effort 0.04512 0.04512Vendors average effort 0.90027 0.90026Operators average effort 0.16442 0.16442Intermediary firms average effort 0.21695 0.21695Average firms’ effort in release-4 0.02075 0.01980Average firms’ effort in release-5 0.02641 0.02696Average firms’ effort in release-6 0.07082 0.07090Average firms’ effort in release-7 0.11904 0.11931Average firms’ effort in release-8 0.31930 0.31969Average firms’ effort in release-9 0.32449 0.32489Average firms’ effort in release-10 0.27032 0.27072Average firms’ effort in release-11 0.16146 0.16162Average firms’ effort in release-R99 0.01417 0.01286
46

Figure 9: Difference between average effort per firm in the data and the model
-.0001 0 .0001 .0002 .0003Difference between data and model moments
ZTEVODAFONE
TELECOMST
SONYSHARP
SASKENSAMSUNG
RESEARCHRACAL
QUALCOMMPANASONIC
NTTNOKIA
NEUSTARNEC
MOTOROLAMITSUBISHI
MELCOLUCENT
LGKONINKLIJKE
INTERDIGITALINTEL
INFINEONHUAWEI
GEMALTOFRANCE
ERICSSONDEUTSCHE
CMCCCINGULAR
CATTANRITSUALCATEL
Figure 10: Untarget moments - Effort per firms’ similarity decile
1 2 3 4 5 6 7 8 9 10
Firm knowledge similarity in the group
0
2
4
6
8
10
12
14
16
18
20
Firm
s`' a
verg
ae e
ffort
DataPredicted by the model
0 0.1 0.2 0.3 0.4 0.5 0.6 0.7 0.8 0.9 1
Firm Knowledge similarity in the group
4
5
6
7
8
9
10
11
Obs
erve
d E
ffort
(so
lid li
ne)
5.5
6
6.5
7
7.5
8
8.5
9
9.5
10
10.5
Sim
ulat
ed E
ffort
(da
shed
line
)
Observed and Simulated effort given participation
8 Counterfactuals
For each counterfactual policy, I compare the predictions of my economic model using the
estimated parameters against an economic model in which patents are licensed under different
licensing policies but the current FRAND ones. In my counterfactual scenario I allow effort but
also participation decisions to vary with the new licensing policies.
For the participation model, enumerating each of the potentially many equilibria is compu-
tationally infeasible at present, so I follow Lee and Pakes (2009), who suggest a learning process
to reduce this burden.45 In short, the program assumes an ordering of decisions based partici-
45Solve the game implies calculate the potential profits for each firm in each potential group configuration. For
47

pation probabilities over all standardization groups. The first firm whether to participate or not
as a best response to all other firms’ participation decision in the baseline scenario. The second
firm similarly best responds, but substitutes participation decision of the first firm with its best
response. The third firm similarly best responds, but it substitutes the participation decision
of the first and second firm with their best responses. The program cycles through the firms,
continually updating the participations decisions, until a no firm wishes to deviate. The result
is a simultaneous move Nash equilibrium, conditional on a single draw of the sunk costs. I take
100 such draws and report the average outcomes across them.The weakness of this approach is
that each “run” results in a unique equilibrium, a small fraction of those possible. Results are
robust to completely reversing the order and rerunning the program.
I find that the overall effect of restricting patent licensing would be a delay in the development
of the standards. Besides the increment of similar firms working together as can be seen in
Figure 11 that fosters the cooperation effect, the restriction on patent licensing would have a
big and negative impact on participation (see page 49) and effort decisions. In average, under a
Royalty-free licensing policy there would be 7% less firms participating in each standardization
group, and they would contribute 18% less.
This results are heterogeneous across firms’ business models. While participation of telecomm
operators remain unchanged, pure upstream firms would barely participate in this counterfac-
tual scenario, representing less than 1% of overall participants. Intermediary firms would be
the second most affecting group, reducing their participation in 10%. Finally, vendors would
participate 4% less than in a scenario in which they could license their patents.
This result in an overall increase in standardization time. In the case of the initial releases
of 4G, implementing a Royalty-free policy would have delayed its completion by 1 year beyond
the 4 years it took to develop it.
9 Conclusions
The future of technology is in interconnected gadgets. In order to successfully deploy this in-
terconnectvity, firms in the ICT sector cooperatively develop technological standards in SDOs,
many of which include technologies that are protected by patents. The exclusivity provided
by these rights may become an impediment to the implementation of standardized technology.
Nevertheless, licensing revenues provide incentives for firms to actively contribute in the devel-
each group there are 235 potential configuration. Calculating expected profits for each firms implies solving themodel 235 × 35 in each group, which is currently computationally unfeasible.
48

Figure 11: Distribution of average similarity between firms in a standardization group
05
1015
Den
sity
0 .2 .4 .6 .8 1Average similarity of participating firms
Baseline Royalty Free
Figure 12: number of participating firms per standardization group
510
1520
0 10 20 30 40 50Average number of participating firms
Baseline Royalty free
opment of these standards. This debate over whether such patents cause more harm or good
is of special interest for policy-makers, who have so far chosen not to impose any regulation
on the licensing of the IP rights for standard-essential technologies. I provide new insights to
this debate by developing and estimating a structural model that captures the incentives firms
face in the joint development of mobile telecommunication standards. I find that enforcing a
Royalty-free policy would delay the development of standards. In the case of the first release
49

of 4G, it would have delayed its completion by 1 beyond the almost 4 years it took to develop
them.
References
Abrams, David S, Ufuk Akcigit, Gokhan Oz, and Jeremy G Pearce. 2019. “The Patent
Troll: Benign Middleman or Stick-Up Artist?” National Bureau of Economic Research.
Aghion, P Howitt, and Peter Howitt. 1999. “P.(1998): Endogenous growth theory.”
Bala, Venkatesh, and Sanjeev Goyal. 2000. “A noncooperative model of network forma-
tion.” Econometrica, 68(5): 1181–1229.
Ballester, Coralio, Antoni Calvo-Armengol, and Yves Zenou. 2006. “Who’s who in
networks. Wanted: The key player.” Econometrica, 74(5): 1403–1417.
Baron, Justus, and Daniel F Spulber. 2018. “Technology standards and standard setting
organizations: Introduction to the searle center database.” Journal of Economics & Manage-
ment Strategy, 27(3): 462–503.
Baron, Justus, and Kirti Gupta. 2018. “Unpacking 3GPP standards.” Journal of Economics
& Management Strategy, 27(3): 433–461.
Baron, Justus, and Tim Pohlmann. 2013. “Who Cooperates in Standards Consortia—Rivals
or Complementors?” Journal of Competition Law and Economics, 9(4): 905–929.
Baron, Justus, and Tim Pohlmann. 2018. “Mapping standards to patents using declarations
of standard-essential patents.” Journal of Economics & Management Strategy, 27(3): 504–534.
Bar, Talia, and Aija Leiponen. 2014. “Committee composition and networking in standard
setting: The case of wireless telecommunications.” Journal of Economics & Management
Strategy, 23(1): 1–23.
Bekkers, Rudi, Christian Catalini, Arianna Martinelli, Cesare Righi, and Timothy
Simcoe. 2017. “Disclosure rules and declared essential patents.” National Bureau of Economic
Research.
Bell, Alexander M, Raj Chetty, Xavier Jaravel, Neviana Petkova, and John
Van Reenen. 2019. “Do Tax Cuts Produce More Einsteins? The Impacts of Financial Incen-
50
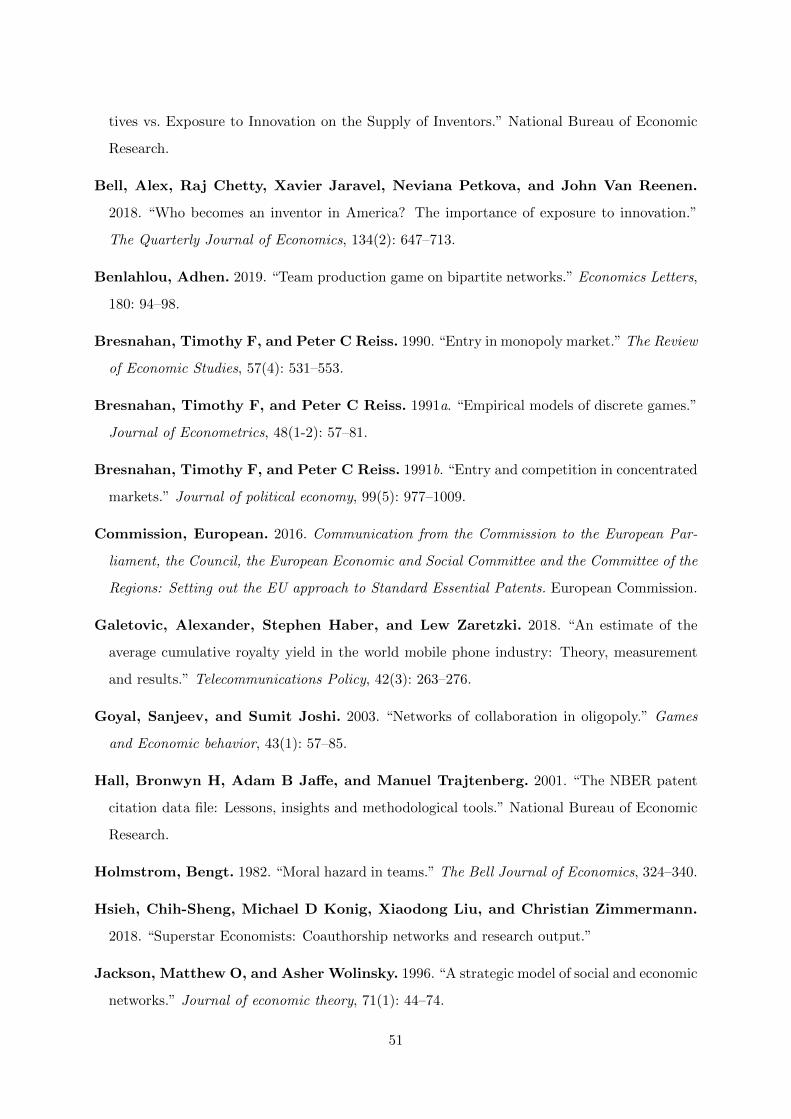
tives vs. Exposure to Innovation on the Supply of Inventors.” National Bureau of Economic
Research.
Bell, Alex, Raj Chetty, Xavier Jaravel, Neviana Petkova, and John Van Reenen.
2018. “Who becomes an inventor in America? The importance of exposure to innovation.”
The Quarterly Journal of Economics, 134(2): 647–713.
Benlahlou, Adhen. 2019. “Team production game on bipartite networks.” Economics Letters,
180: 94–98.
Bresnahan, Timothy F, and Peter C Reiss. 1990. “Entry in monopoly market.” The Review
of Economic Studies, 57(4): 531–553.
Bresnahan, Timothy F, and Peter C Reiss. 1991a. “Empirical models of discrete games.”
Journal of Econometrics, 48(1-2): 57–81.
Bresnahan, Timothy F, and Peter C Reiss. 1991b. “Entry and competition in concentrated
markets.” Journal of political economy, 99(5): 977–1009.
Commission, European. 2016. Communication from the Commission to the European Par-
liament, the Council, the European Economic and Social Committee and the Committee of the
Regions: Setting out the EU approach to Standard Essential Patents. European Commission.
Galetovic, Alexander, Stephen Haber, and Lew Zaretzki. 2018. “An estimate of the
average cumulative royalty yield in the world mobile phone industry: Theory, measurement
and results.” Telecommunications Policy, 42(3): 263–276.
Goyal, Sanjeev, and Sumit Joshi. 2003. “Networks of collaboration in oligopoly.” Games
and Economic behavior, 43(1): 57–85.
Hall, Bronwyn H, Adam B Jaffe, and Manuel Trajtenberg. 2001. “The NBER patent
citation data file: Lessons, insights and methodological tools.” National Bureau of Economic
Research.
Holmstrom, Bengt. 1982. “Moral hazard in teams.” The Bell Journal of Economics, 324–340.
Hsieh, Chih-Sheng, Michael D Konig, Xiaodong Liu, and Christian Zimmermann.
2018. “Superstar Economists: Coauthorship networks and research output.”
Jackson, Matthew O, and Asher Wolinsky. 1996. “A strategic model of social and economic
networks.” Journal of economic theory, 71(1): 44–74.
51
Jones, Stephen L, Aija Elina Leiponen, and Gurneeta Vasudeva. 2018. “Dear Enemy:
Litigation and Cooperation in a Mobile Phone Standard Development Organization.” Vol.
2018, 15558, Academy of Management Briarcliff Manor, NY 10510.
Layne-Farrar, Anne, Gerard Llobet, and Jorge Padilla. 2014. “Payments and partici-
pation: The incentives to join cooperative standard setting efforts.” Journal of Economics &
Management Strategy, 23(1): 24–49.
Lee, Robin S, and Ariel Pakes. 2009. “Multiple equilibria and selection by learning in an
applied setting.” Economics Letters, 104(1): 13–16.
Lerner, Josh, and Jean Tirole. 2015. “Standard-essential patents.” Journal of Political
Economy, 123(3): 547–586.
Myerson, Roger B. 1994. “Communication, correlated equilibria and incentive compatibility.”
Handbook of game theory with economic applications, 2: 827–847.
Pakes, Ariel. 1984. “Patents as options: Some estimates of the value of holding European
patent stocks.”
Rysman, Marc, and Timothy Simcoe. 2008. “Patents and the performance of voluntary
standard-setting organizations.” Management science, 54(11): 1920–1934.
Shapiro, Carl. 2000. “Navigating the patent thicket: Cross licenses, patent pools, and standard
setting.” Innovation policy and the economy, 1: 119–150.
Simcoe, Timothy S, Stuart JH Graham, and Maryann P Feldman. 2009. “Competing
on standards? Entrepreneurship, intellectual property, and platform technologies.” Journal
of Economics & Management Strategy, 18(3): 775–816.
Trajtenberg, Manuel. 1990. “A penny for your quotes: patent citations and the value of
innovations.” The Rand Journal of Economics, 172–187.
52

10 Appendix
Figure 13: Estimates of φq using similarity deciles (95% confidence bands)
-.02
0.0
2.0
4.0
6Ef
fort
com
plem
enta
rity
coef
ficie
nt (p
hi)
Q1 Q2 Q3 Q4 Q5 Q6 Q7 Q8 Q9 Q10Firms knowledge similarity, decile
Figure 14: Estimates of φq using all variables in levels (95% confidence bands)
0.0
2.0
4.0
6.0
8.1
Effo
rt co
mpl
emen
tarit
y co
effic
ient
(phi
)
Q1 Q2 Q3 Q4 Q5Firms knowledge similarity, quintile
0.0
2.0
4.0
6.0
8.1
Effo
rt co
mpl
emen
tarit
y co
effic
ient
(phi
)
Q1 Q2 Q3 Q4 Q5 Q6 Q7 Q8 Q9 Q10Firms knowledge similarity, decile
53

Figure 15: Number of SEPs (Left) and Share of SEPs (Right) over firms’ knowledge similarity,no controls (95% confidence bands)
-3-2
.5-2
-1.5
-1-.5
Num
ber o
f SEP
s, m
ean
by D
ecile
, in
logs
Q1 Q2 Q3 Q4 Q5 Q6 Q7 Q8 Q9 Q10Firms' knowledge similarity, decile
-4.4
-4.2
-4-3
.8Sh
are
of S
EPs,
mea
n by
Dec
ile, i
n lo
gs
Q1 Q2 Q3 Q4 Q5 Q6 Q7 Q8 Q9 Q10Firms' knowledge similarity, decile
Figure 16: Number of SEPs (Left) and Share of SEPs (Right) over firms’ knowledge similarity,controlling by firms fe and number of firms in the group (95% confidence bands)
-4-3
-2-1
0N
umbe
r of S
EPs,
mea
n by
Dec
ile, i
n lo
gs
Q1 Q2 Q3 Q4 Q5 Q6 Q7 Q8 Q9 Q10Firms' knowledge similarity, decile
-4-3
-2-1
0Sh
are
of S
EPs,
mea
n by
Dec
ile, i
n lo
gs
Q1 Q2 Q3 Q4 Q5 Q6 Q7 Q8 Q9 Q10Firms' knowledge similarity, decile
54

Table 10: SEP and firms knowledge similarity, all coefficients
(1) (2) (3) (4) (5)Baseline Controls Other firms controls Tobit Tobit
Firms’knowledge simlarity -1.723∗∗∗ -0.875∗ -1.286∗∗ -2.470∗∗∗ -3.204∗∗∗
(0.000) (0.093) (0.015) (0.000) (0.000)Number of firms 0.956∗∗∗ -0.0437 0.339 1.566∗∗∗ 2.027∗∗∗
(0.000) (0.860) (0.169) (0.000) (0.000)Portfolio size 0.131 0.172 0.448 0.495
(0.534) (0.418) (0.315) (0.282)Standard’s broadness 0.377∗∗∗ 0.321∗∗∗ -0.204∗ -0.248∗∗
(0.003) (0.009) (0.092) (0.042)R&D expenditures 0.0924 0.129∗∗ 0.0327 0.0672
(0.103) (0.023) (0.767) (0.543)First time dummy -0.124 -0.196 0.302 0.223
(0.577) (0.374) (0.283) (0.426)Other firms portfolio -0.513∗∗ -0.260
(0.028) (0.324)Other firms R&D 1.424∗∗∗ 1.735∗∗∗
(0.000) (0.000)
N 2059 2059 2059 2059 2059adj. R2 0.137 0.286 0.300
Firm FE Yes Yes Yes Yes YesRelease FE Yes Yes Yes Yes YesStandard FE Yes Yes Yes No No
p-values in parentheses∗ p < 0.10, ∗∗ p < 0.05, ∗∗∗ p < 0.01
55


![Coffee Cooperation and Competition[1]](https://img.pdfslide.us/doc/110x75/5406ec9adab5caa9628b46b3/coffee-cooperation-and-competition1.jpg)
