Embed Size (px)
Citation preview
FY2013 Q3 Financial ResultsMarch, 2014
COOKPAD Inc.
Highlights of FY2013 Q3
■ Consolidated Net Sales is 4,693million yen、Consolidated Ordinary Income is 2,307million yen.
■ Non-Consolidated Net Sales increased by 31.5% y/y.
■ Paid members increased at an accelerated pace, growing to over 1,200,000 members.
■ Smartphone contributed to Ad Business.
2
※Started consolidated balance sheet from FY2013 Q2. Started consolidated income statement from FY2013 Q3.
Summary of Business Conditions
3
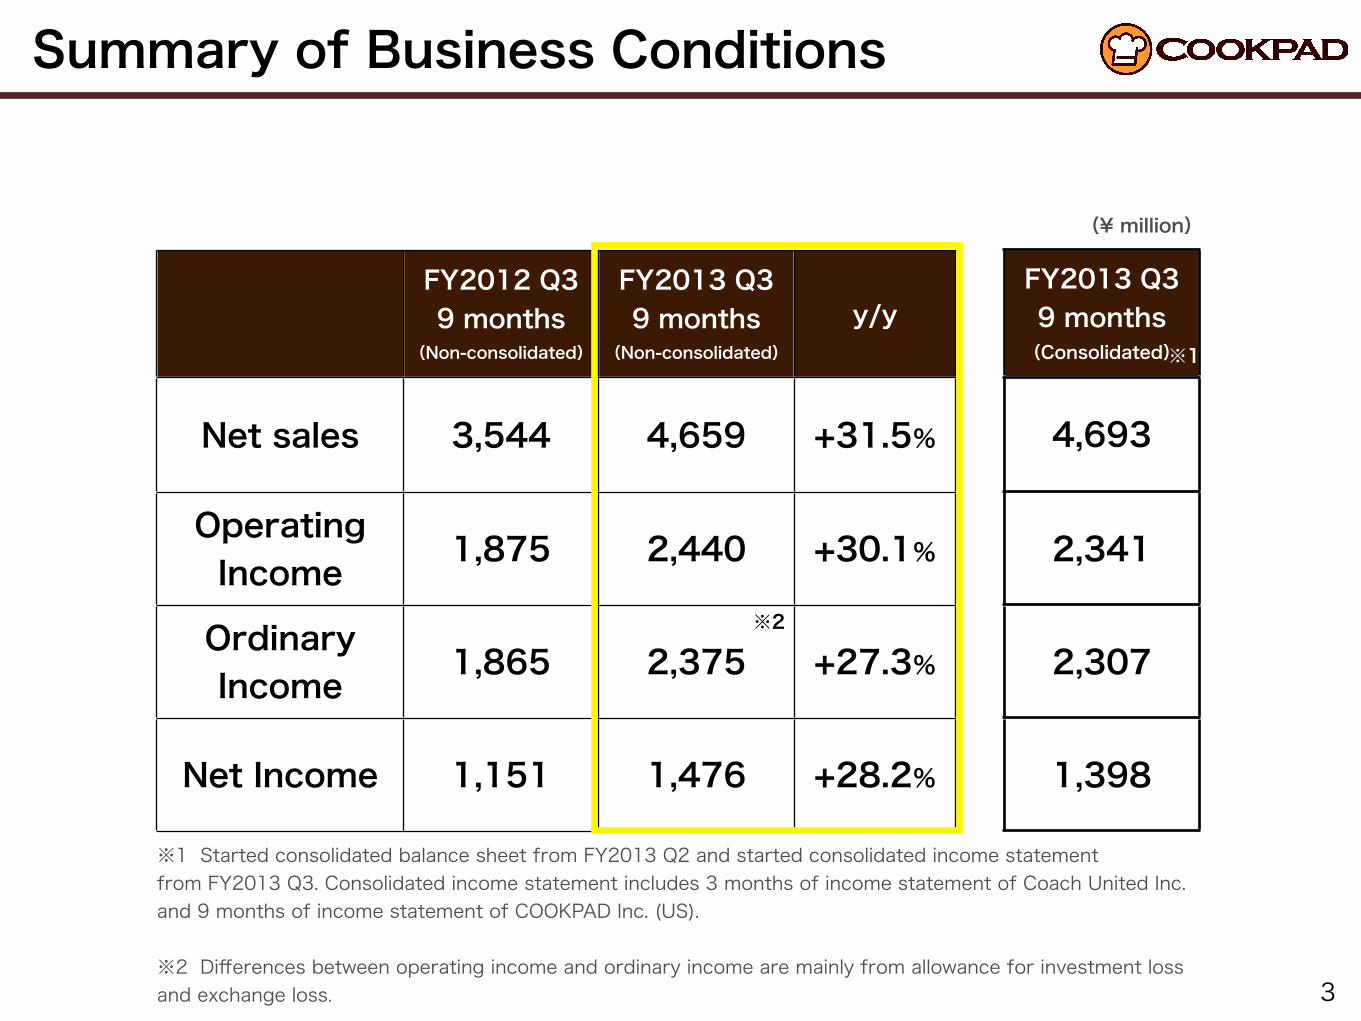
※1 Started consolidated balance sheet from FY2013 Q2 and started consolidated income statement from FY2013 Q3. Consolidated income statement includes 3 months of income statement of Coach United Inc. and 9 months of income statement of COOKPAD Inc. (US).
※2 Differences between operating income and ordinary income are mainly from allowance for investment loss and exchange loss.
FY2012 Q39 months
(Non-consolidated)
FY2013 Q39 months
(Non-consolidated)
y/y
Net sales 3,544 4,659 +31.5%
OperatingIncome 1,875 2,440 +30.1%
OrdinaryIncome 1,865 2,375 +27.3%
Net Income 1,151 1,476 +28.2%
(¥ million)
FY2013 Q39 months(Consolidated)
4,693
2,341
2,307
1,398
※2
※1
Net Sales comparison to past quarter result
0
1,000
2,000
3,000
4,000
5,000
6,000
FY2012 Q3 FY2013 Q3
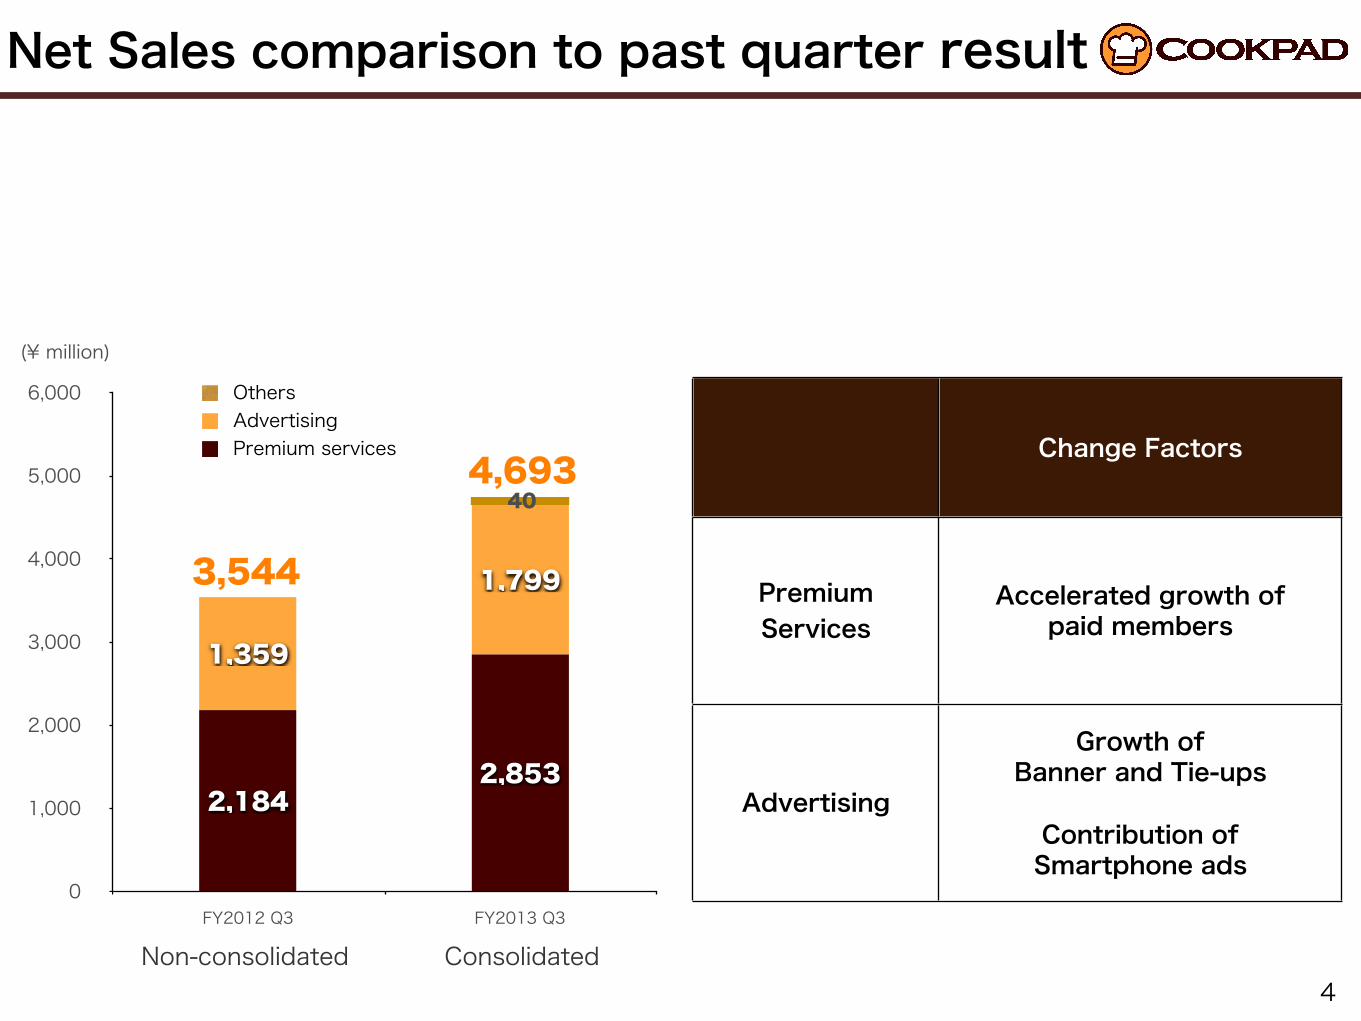
1,799
1,359
2,8532,184
Premium servicesAdvertisingOthers
(¥ million)
Change Factors
PremiumServices
Accelerated growth of paid members
Advertising
Growth of Banner and Tie-ups
Contribution of Smartphone ads
4
3,544
4,69340
Non-consolidated Consolidated
Net Sales trend by Business
5
0
200
400
600
800
1,000
1,200
1,400
1,600
1,800
Q1 Q2 Q3 Q4 Q1 Q2 Q3 Q4 Q1 Q2 Q3 Q4 Q1 Q2 Q3
564574660
620485
452420480
390413302354414
410373 1,019956877816775727681638582558542497451402358
Premium servicesAdvertisingOthers
732
865813 851 844
FY2011
972 9731,103
FY2012
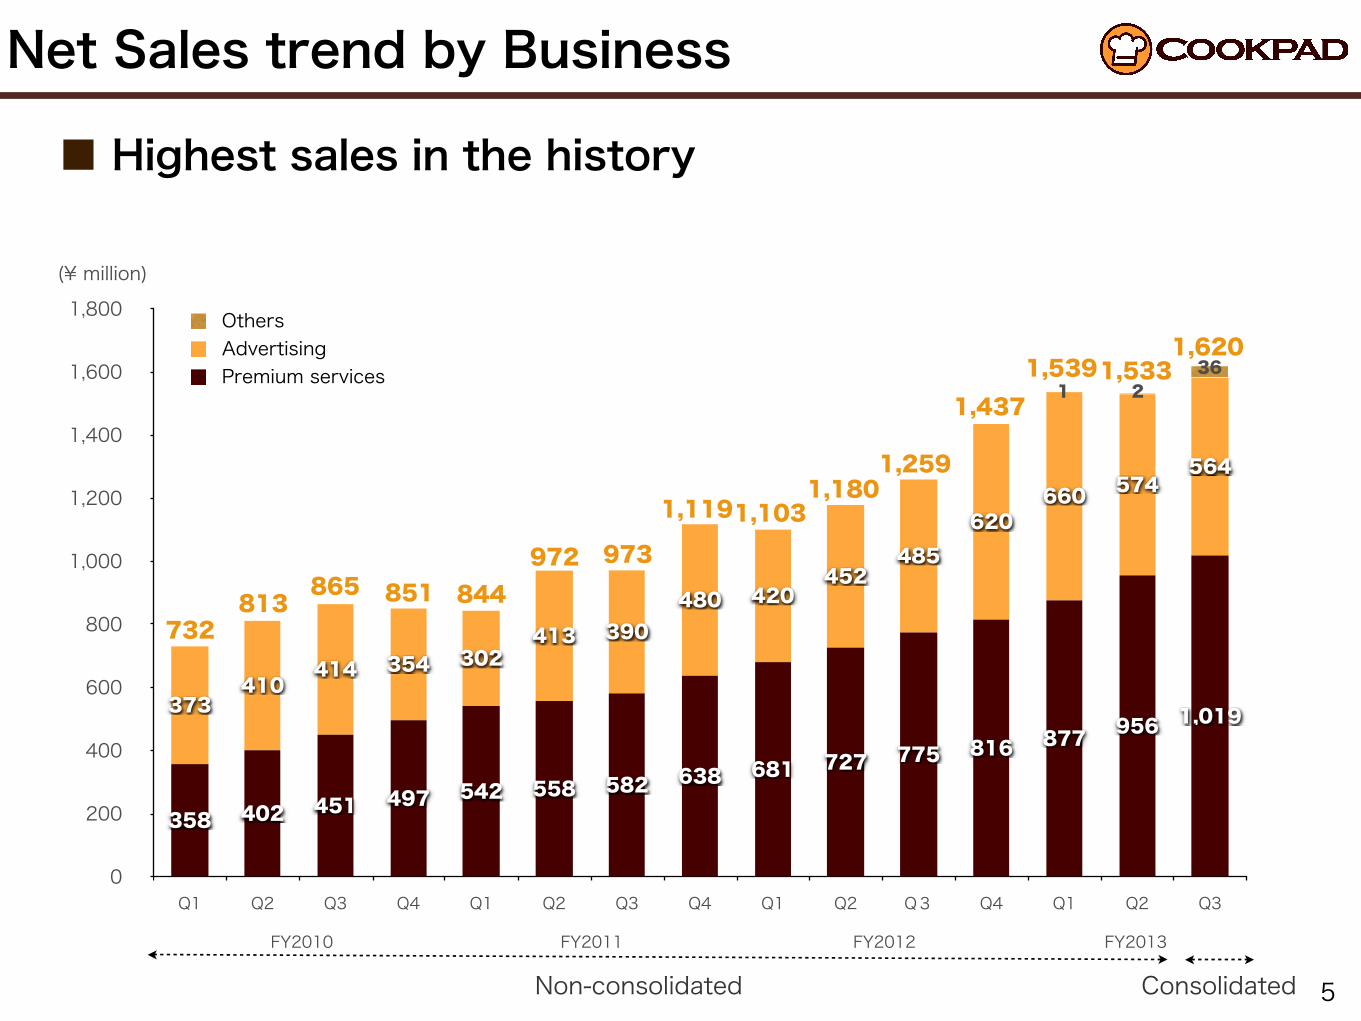
■ Highest sales in the history
1,119
1,259
1,4371,539
FY2010 FY2013
1,5332
361
ConsolidatedNon-consolidated
1,180
1,620
(¥ million)
0
500
1,000
1,500
2,000
2,500
FY2012 Q3 FY2013 Q3
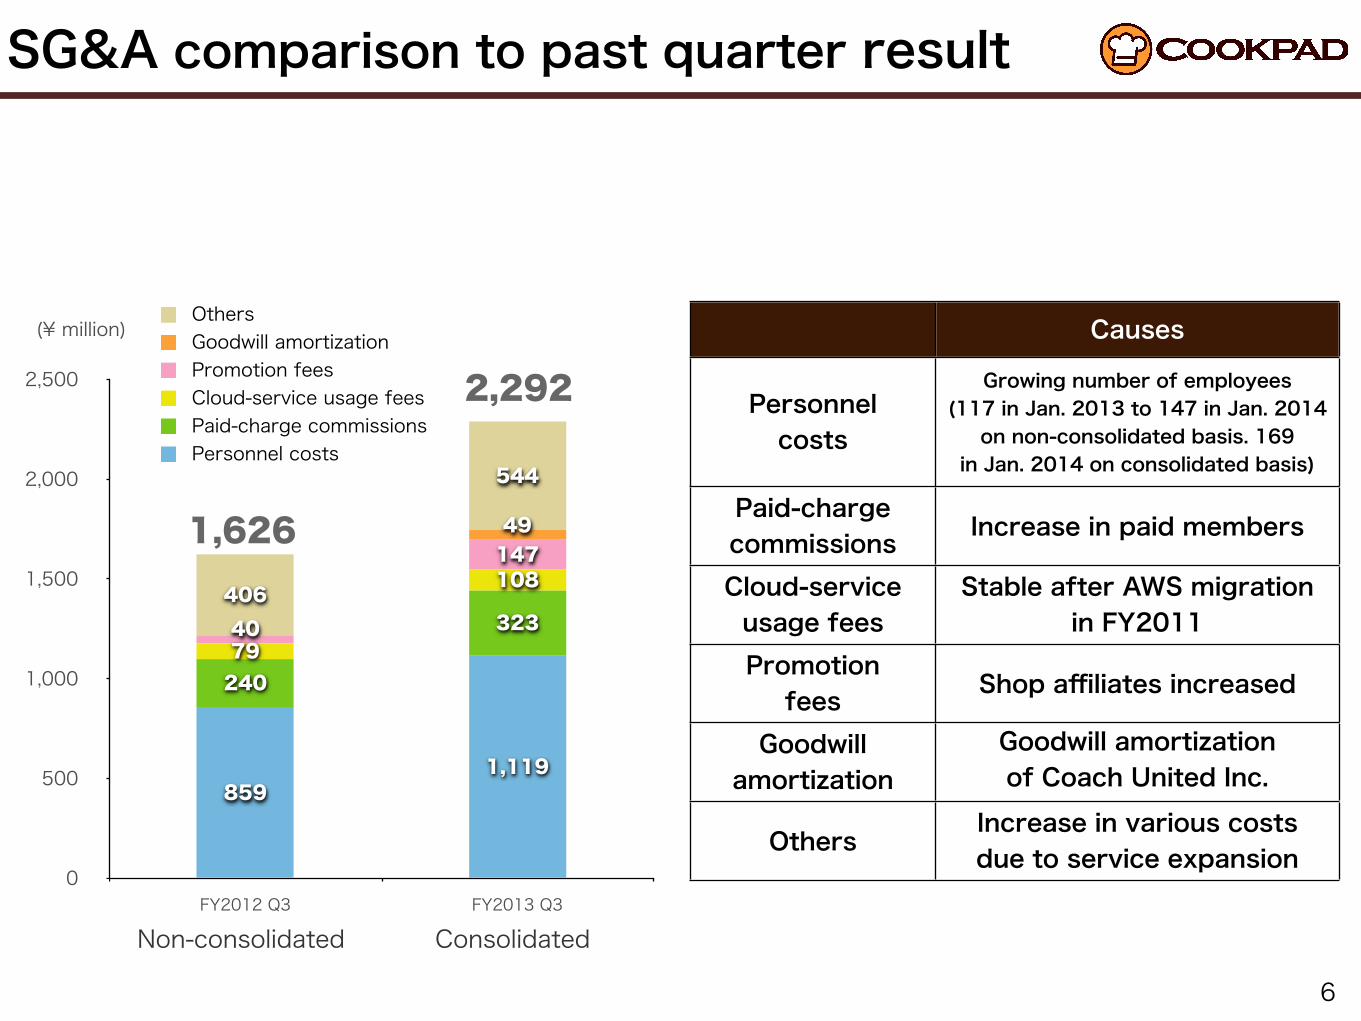
544
406
49147
40
108
79323
240
1,119859
SG&A comparison to past quarter result
6
Causes
Personnelcosts
Growing number of employees (117 in Jan. 2013 to 147 in Jan. 2014 on non-consolidated basis. 169
in Jan. 2014 on consolidated basis)
Paid-chargecommissions Increase in paid members
Cloud-serviceusage fees
Stable after AWS migrationin FY2011
Promotionfees Shop affiliates increased
Goodwill amortization
Goodwill amortizationof Coach United Inc.
Others Increase in various costs due to service expansion
2,292
1,626
Personnel costsPaid-charge commissionsCloud-service usage feesPromotion feesGoodwill amortizationOthers
Non-consolidated Consolidated
(¥ million)
SG&A trend
7
0
100
200
300
400
500
600
700
800
900
Q1 Q2 Q3 Q4 Q1 Q2 Q3 Q4 Q1 Q2 Q3 Q4 Q1 Q2 Q3
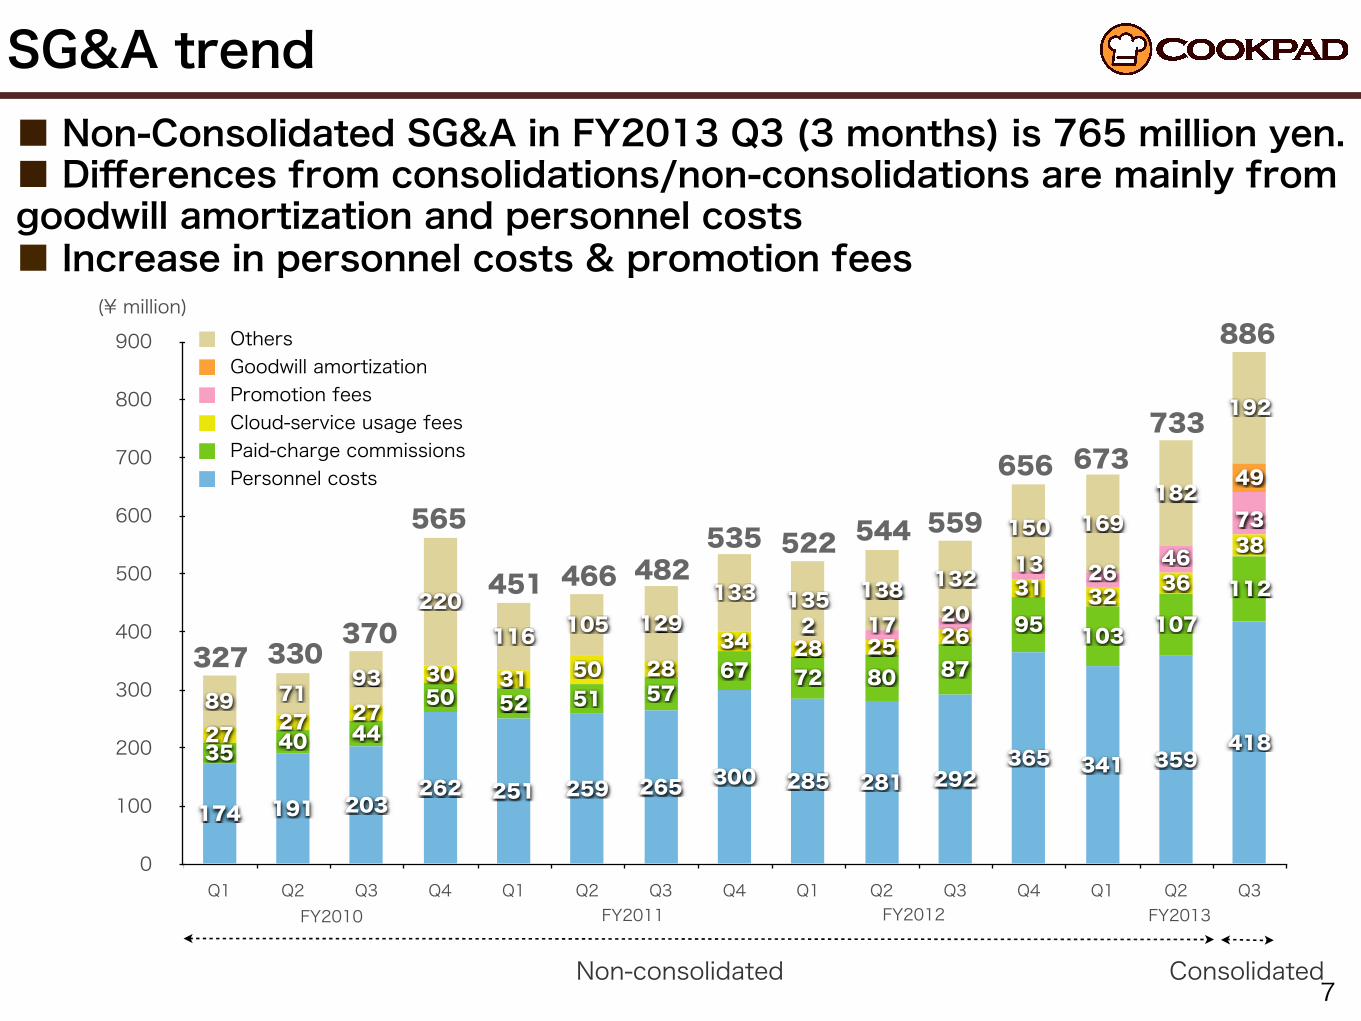
192
182169150
132138135133129105116
220
937189
49
73
462613
20172
38
363231
2625283428503130
272727
11210710395
8780726757515250
444035 418359341365
292281285300265259251262203191174
Personnel costsPaid-charge commissionsCloud-service usage feesPromotion feesGoodwill amortizationOthers
327 330370
565
451 466 482535 522
FY2010 FY2011 FY2012
■ Non-Consolidated SG&A in FY2013 Q3 (3 months) is 765 million yen.■ Differences from consolidations/non-consolidations are mainly fromgoodwill amortization and personnel costs■ Increase in personnel costs & promotion fees
544 559
656 673
FY2013
733
886
Non-consolidated Consolidated
(¥ million)
Operating Income trend
8
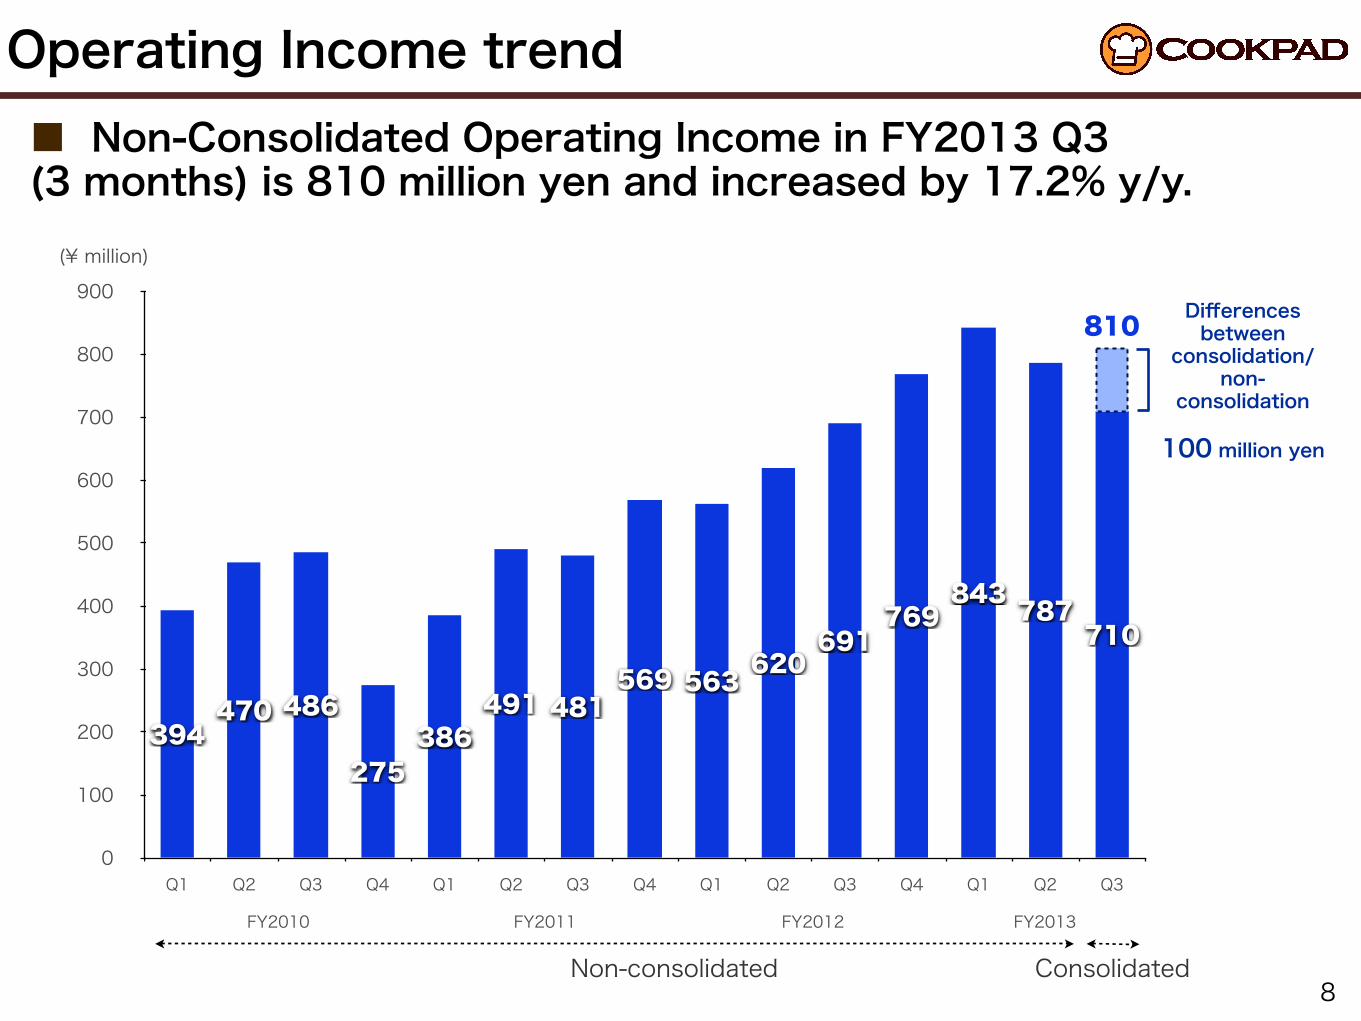
■ Non-Consolidated Operating Income in FY2013 Q3 (3 months) is 810 million yen and increased by 17.2% y/y.
Non-consolidated Consolidated
FY2010 FY2011 FY2012
0
100
200
300
400
500
600
700
800
900
Q1 Q2 Q3 Q4 Q1 Q2 Q3 Q4 Q1 Q2 Q3 Q4 Q1 Q2 Q3
710787843
769691
620563569481491
386275
486470394
FY2013
810 Differences between
consolidation/non-
consolidation
100 million yen
(¥ million)
Business Details - Users
9
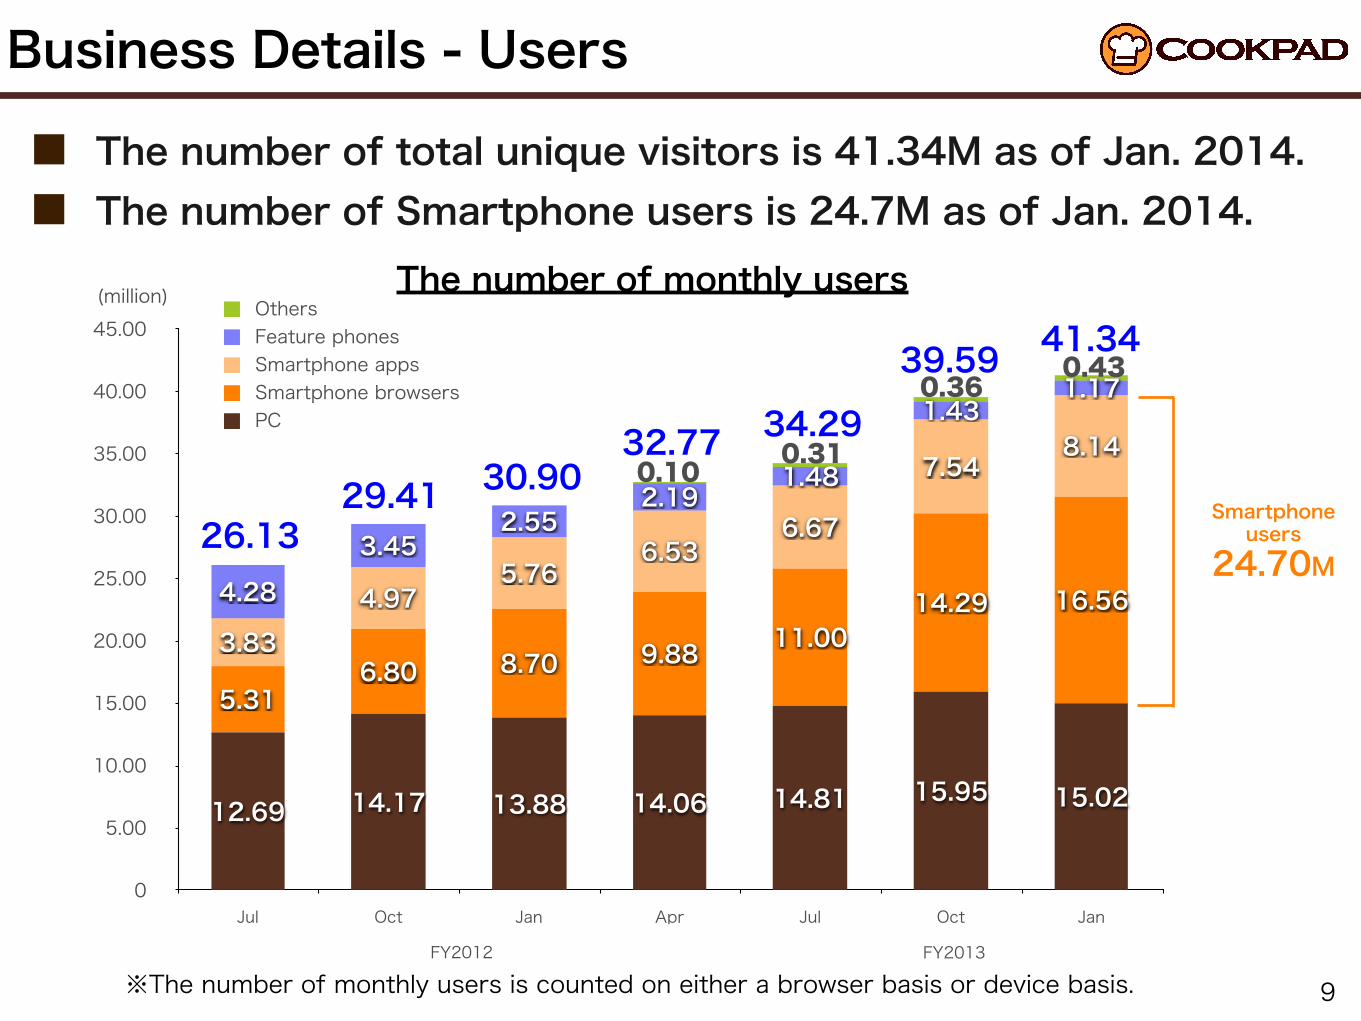
The number of monthly users
0
5.00
10.00
15.00
20.00
25.00
30.00
35.00
40.00
45.00
Jul Oct Jan Apr Jul Oct Jan
1.171.43
1.482.19
2.553.45
4.28
8.147.54
6.676.53
5.764.97
3.8316.5614.29
11.009.888.706.805.31
15.0215.9514.8114.0613.8814.1712.69
FY2012
(million)
※The number of monthly users is counted on either a browser basis or device basis.
PCSmartphone browsersSmartphone appsFeature phonesOthers
29.41 30.9032.77 34.29
■ The number of total unique visitors is 41.34M as of Jan. 2014.■ The number of Smartphone users is 24.7M as of Jan. 2014.
Smartphone users
24.70M
39.59
FY2013
41.34
26.13
0.430.36
0.10 0.31
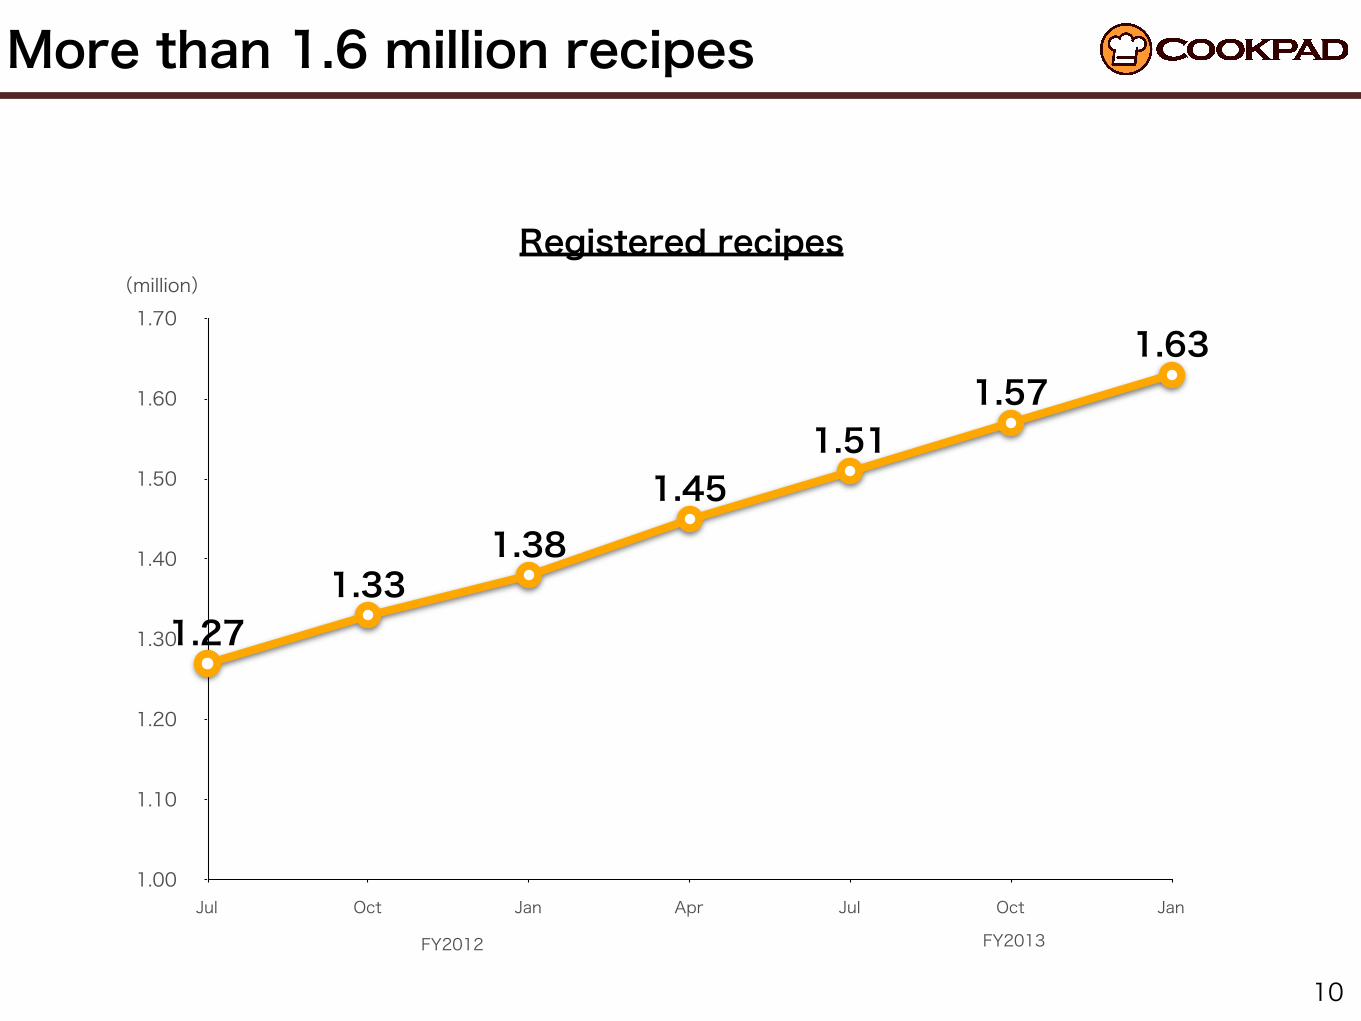
More than 1.6 million recipes
10
(million)
1.00
1.10
1.20
1.30
1.40
1.50
1.60
1.70
Jul Oct Jan Apr Jul Oct Jan
1.271.33
1.381.45
1.511.57
1.63
FY2012
Registered recipes
FY2013
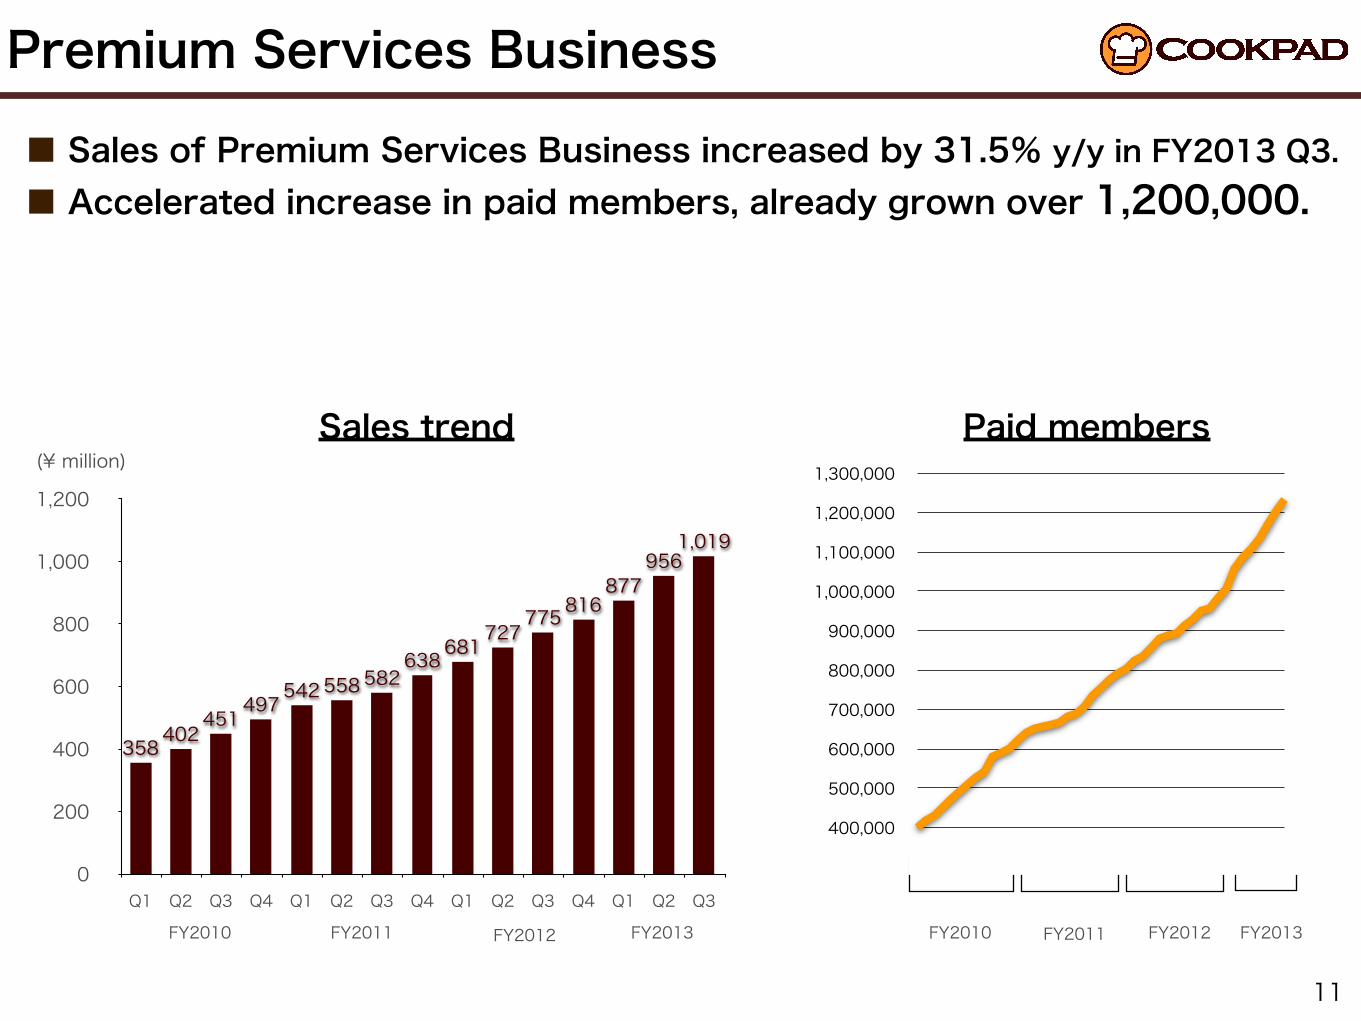
Premium Services Business
11
0
200
400
600
800
1,000
1,200
Q1 Q2 Q3 Q4 Q1 Q2 Q3 Q4 Q1 Q2 Q3 Q4 Q1 Q2 Q3
1,019956
877816775
727681638
582558542497451
402358
FY2011FY2010
Sales trend Paid members
400,000
500,000
600,000
700,000
800,000
900,000
1,000,000
1,100,000
1,200,000
1,300,000
FY2012 FY2010 FY2011 FY2012
■ Sales of Premium Services Business increased by 31.5% y/y in FY2013 Q3.■ Accelerated increase in paid members, already grown over 1,200,000.
FY2013 FY2013
(¥ million)
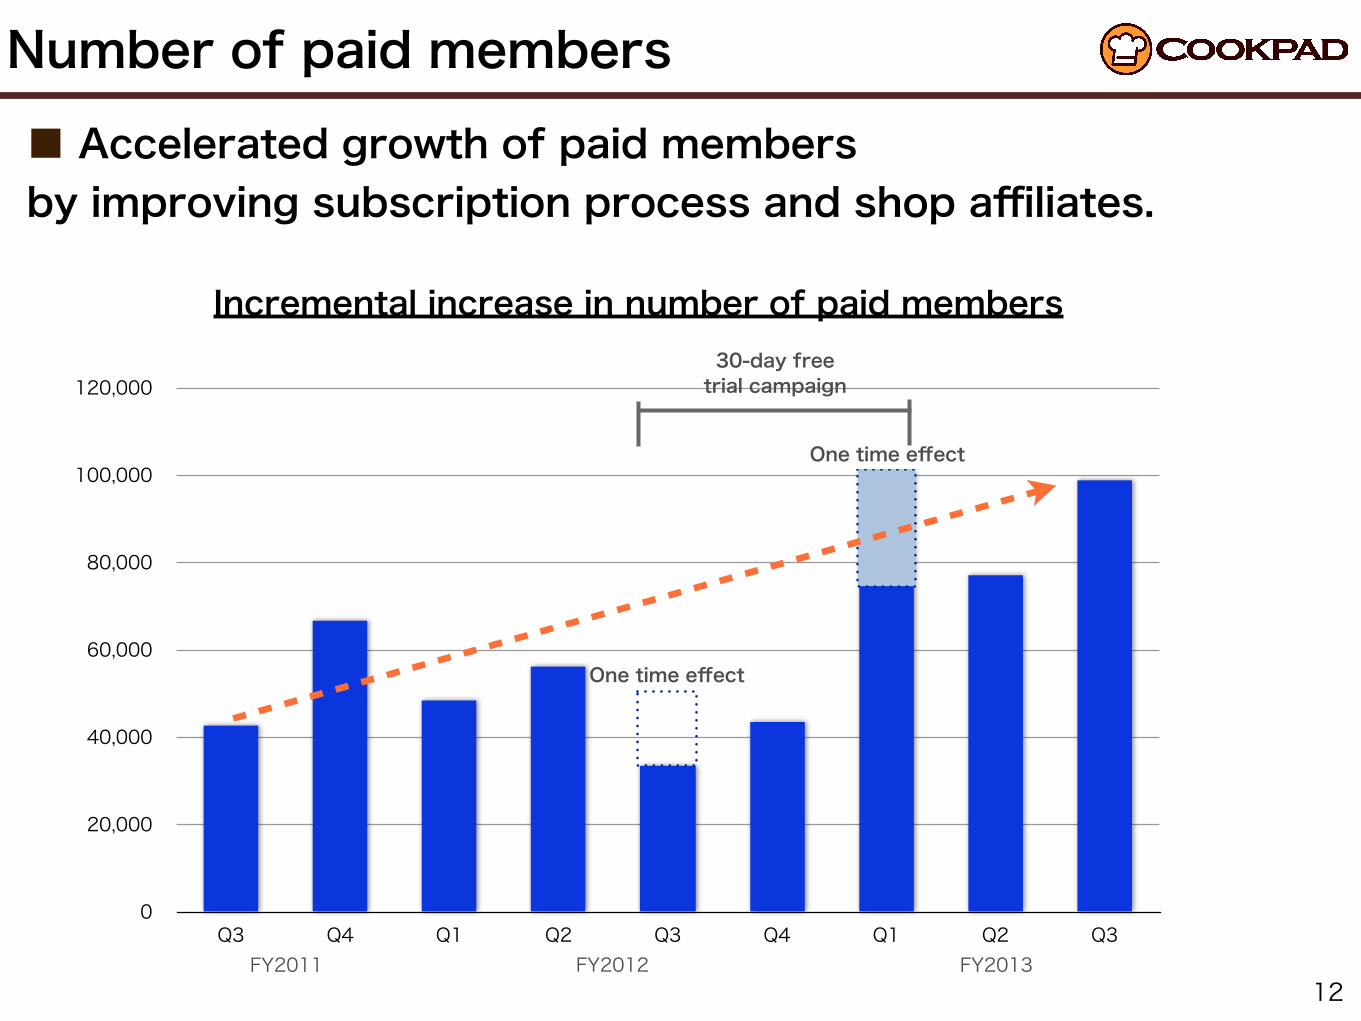
Number of paid members
12
■ Accelerated growth of paid members by improving subscription process and shop affiliates.
Incremental increase in number of paid members
0
20,000
40,000
60,000
80,000
100,000
120,000
Q3 Q4 Q1 Q2 Q3 Q4 Q1 Q2 Q3FY2011 FY2013FY2012
One time effect
One time effect
30-day freetrial campaign
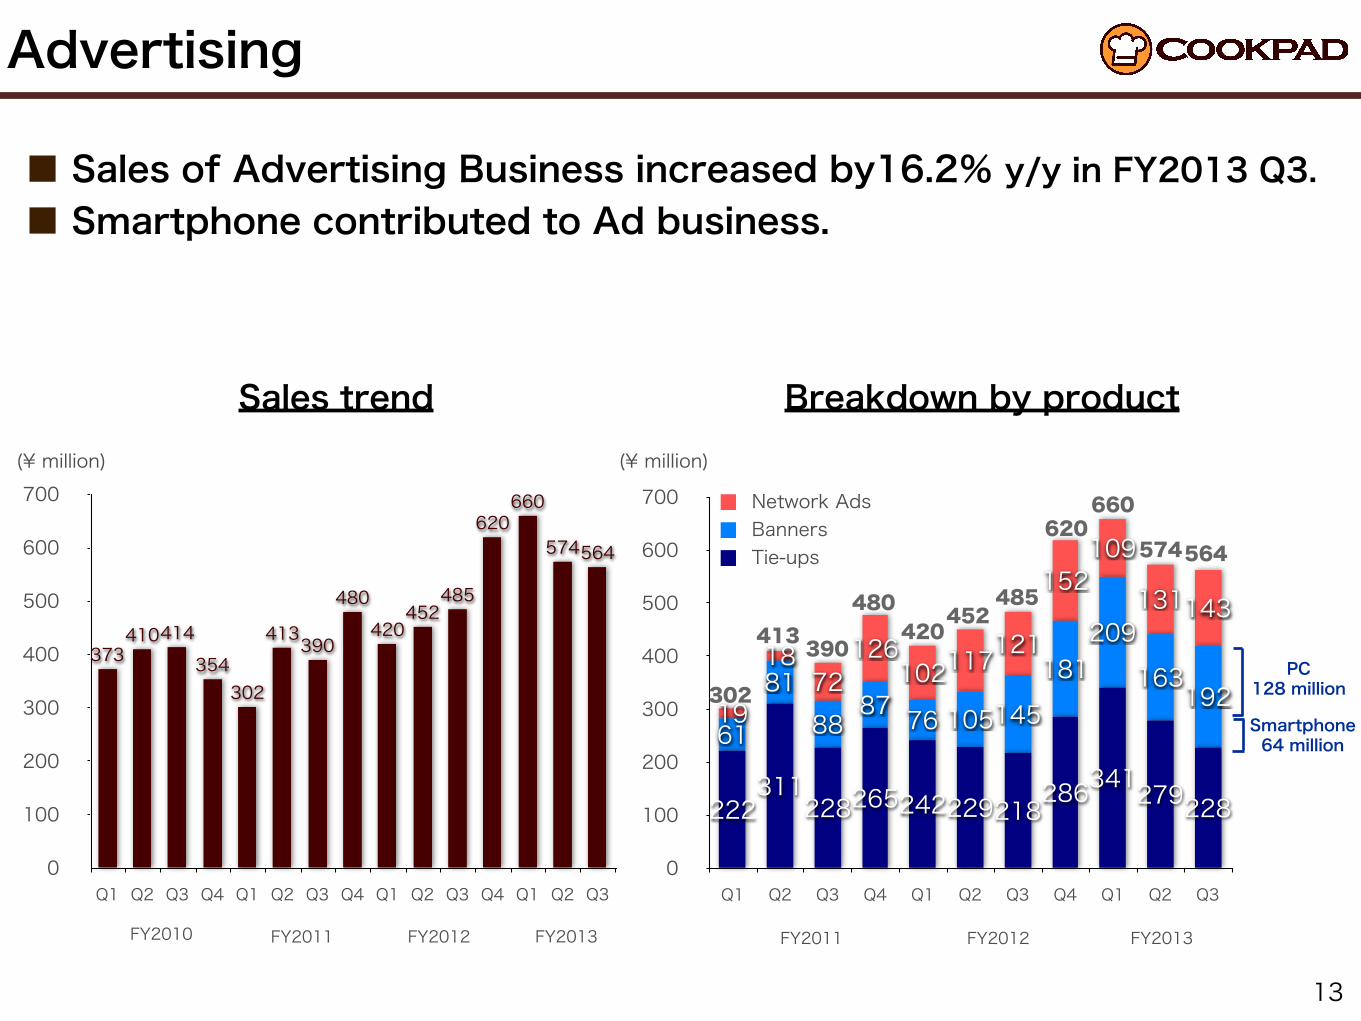
Advertising
13
Sales trend
■ Sales of Advertising Business increased by16.2% y/y in FY2013 Q3.■ Smartphone contributed to Ad business.
Breakdown by product
420480
390413
302
452485
620
0
100
200
300
400
500
600
700
Q1 Q2 Q3 Q4 Q1 Q2 Q3 Q4 Q1 Q2 Q3 Q4 Q1 Q2 Q3
564574
660620
485452
420480
390413
302354
414410373
FY2011FY2010 FY2012 FY2013
0
100
200
300
400
500
600
700
Q1 Q2 Q3 Q4 Q1 Q2 Q3 Q4 Q1 Q2 Q3
143131
109152
121117102126
7218
19 192163
209181
145105768788
81
61
228279341286218229242265228311
222
FY2011 FY2012
Tie-upsBannersNetwork Ads
FY2013
574564
660620
485420
452480
390413
302Smartphone64 million
PC128 million
(¥ million) (¥ million)
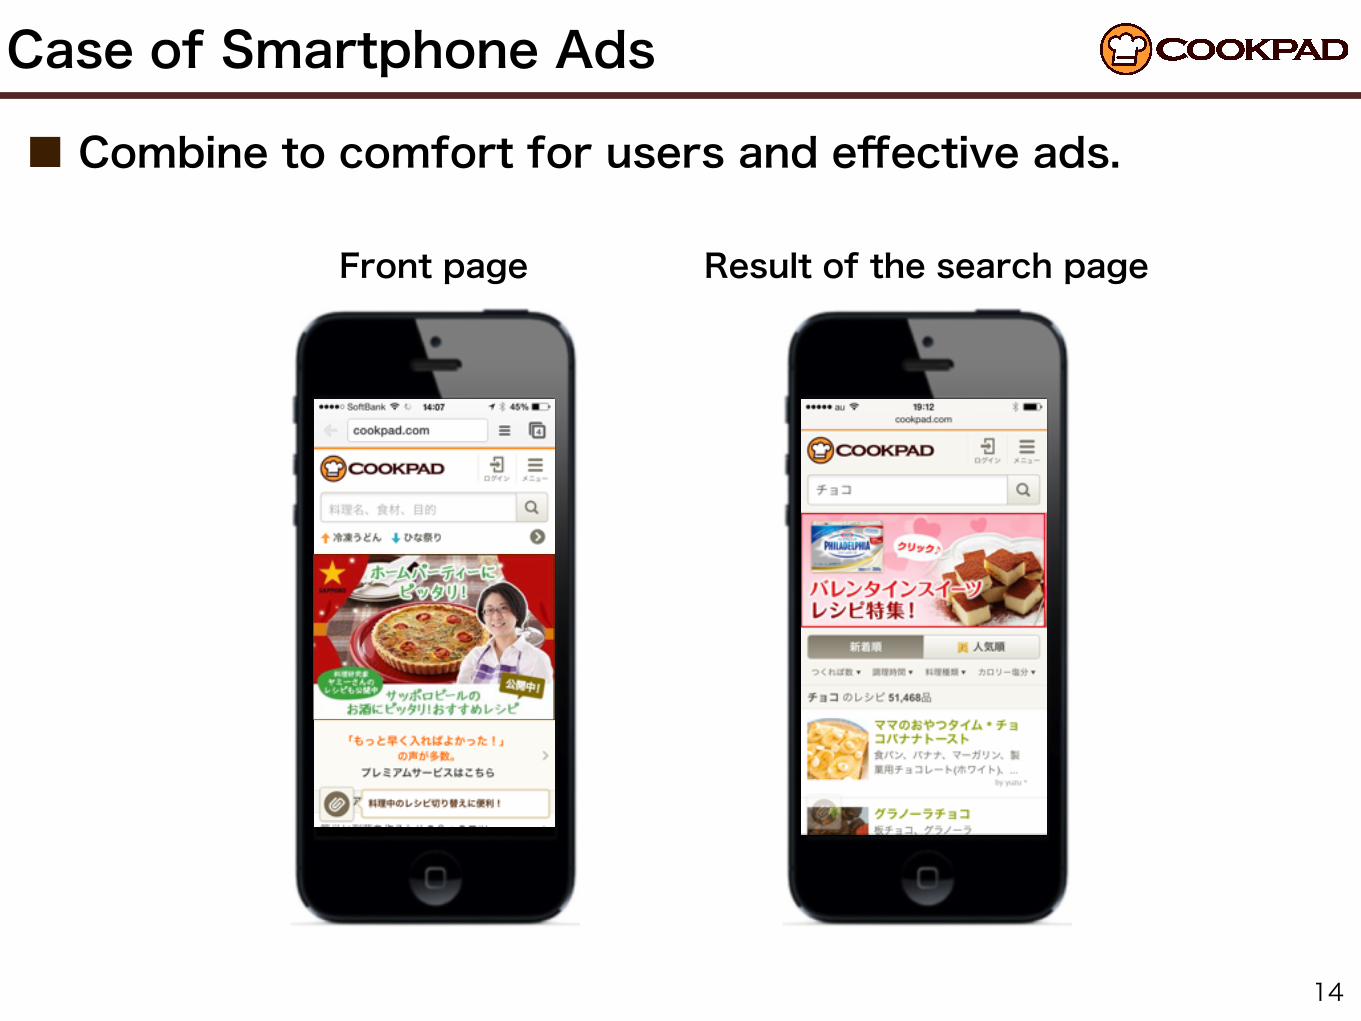
Case of Smartphone Ads
14
■ Combine to comfort for users and effective ads.
Result of the search pageFront page

Topics
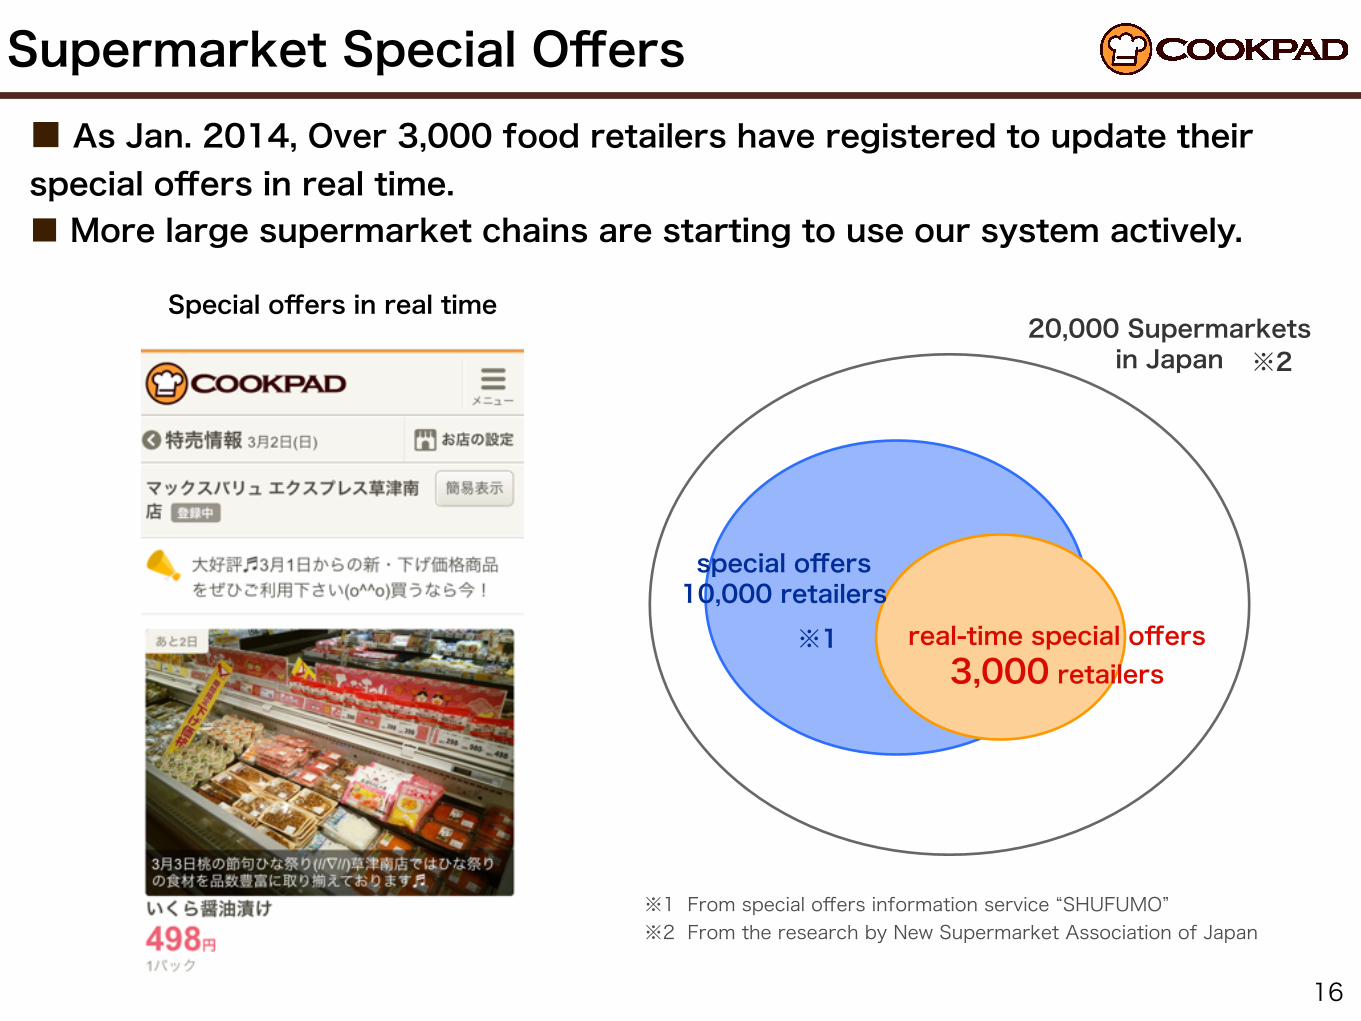
Supermarket Special Offers
16
■ As Jan. 2014, Over 3,000 food retailers have registered to update their special offers in real time.■ More large supermarket chains are starting to use our system actively.
Special offers in real time
※1 From special offers information service “SHUFUMO”※2 From the research by New Supermarket Association of Japan
special offers10,000 retailers
real-time special offers3,000 retailers
20,000 Supermarkets in Japan ※2
※1
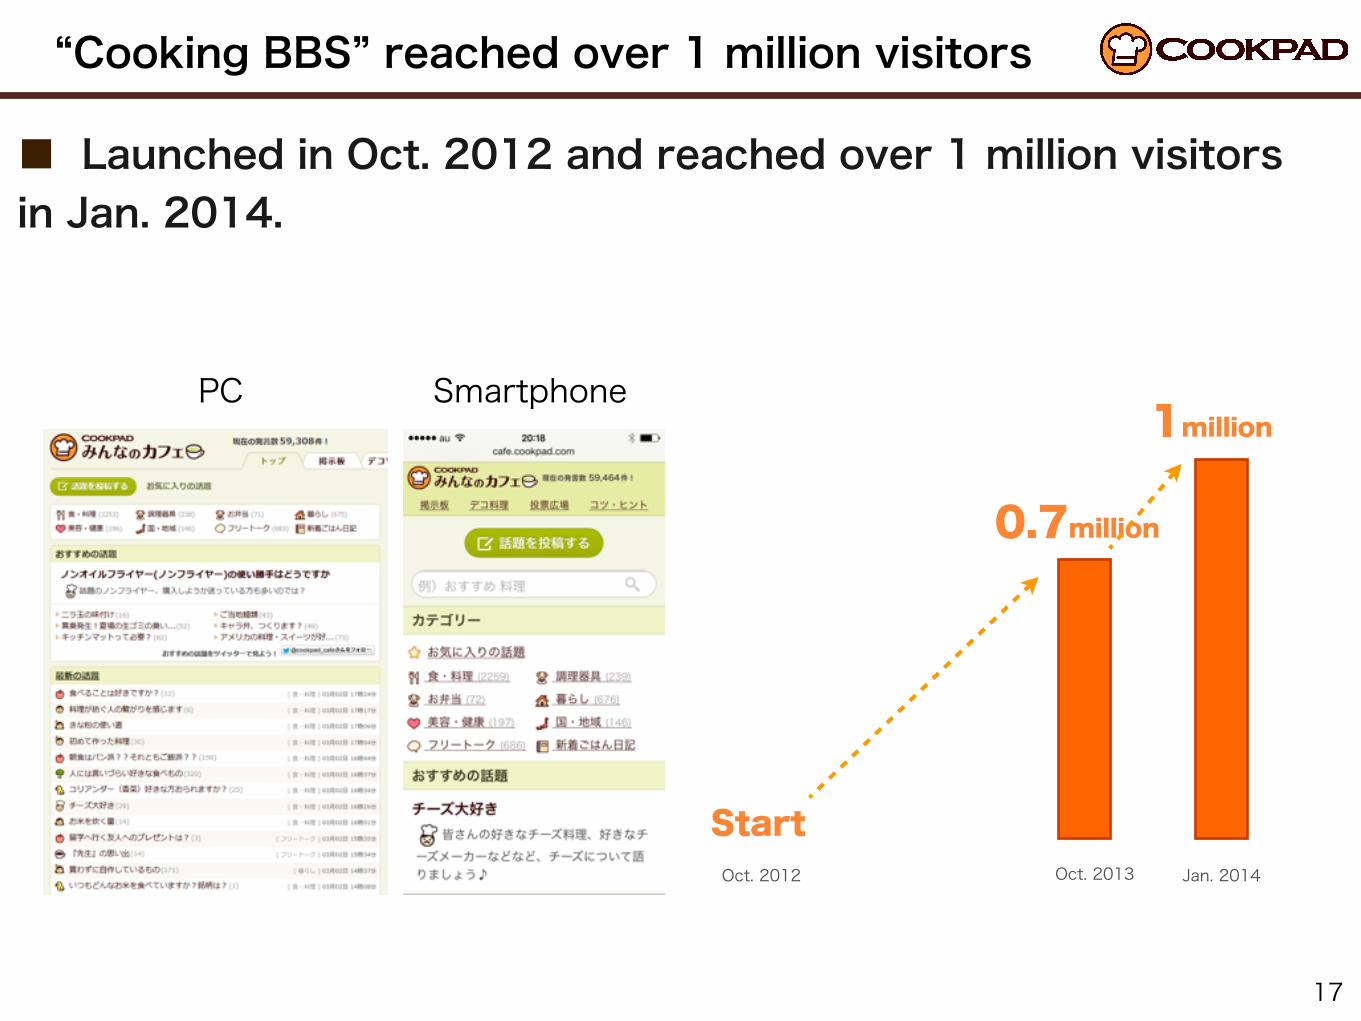
“Cooking BBS” reached over 1 million visitors
17
■ Launched in Oct. 2012 and reached over 1 million visitors in Jan. 2014.
1million
0.7million
Oct. 2013 Jan. 2014Oct. 2012
Start
PC Smartphone
COOKPAD Goes Global
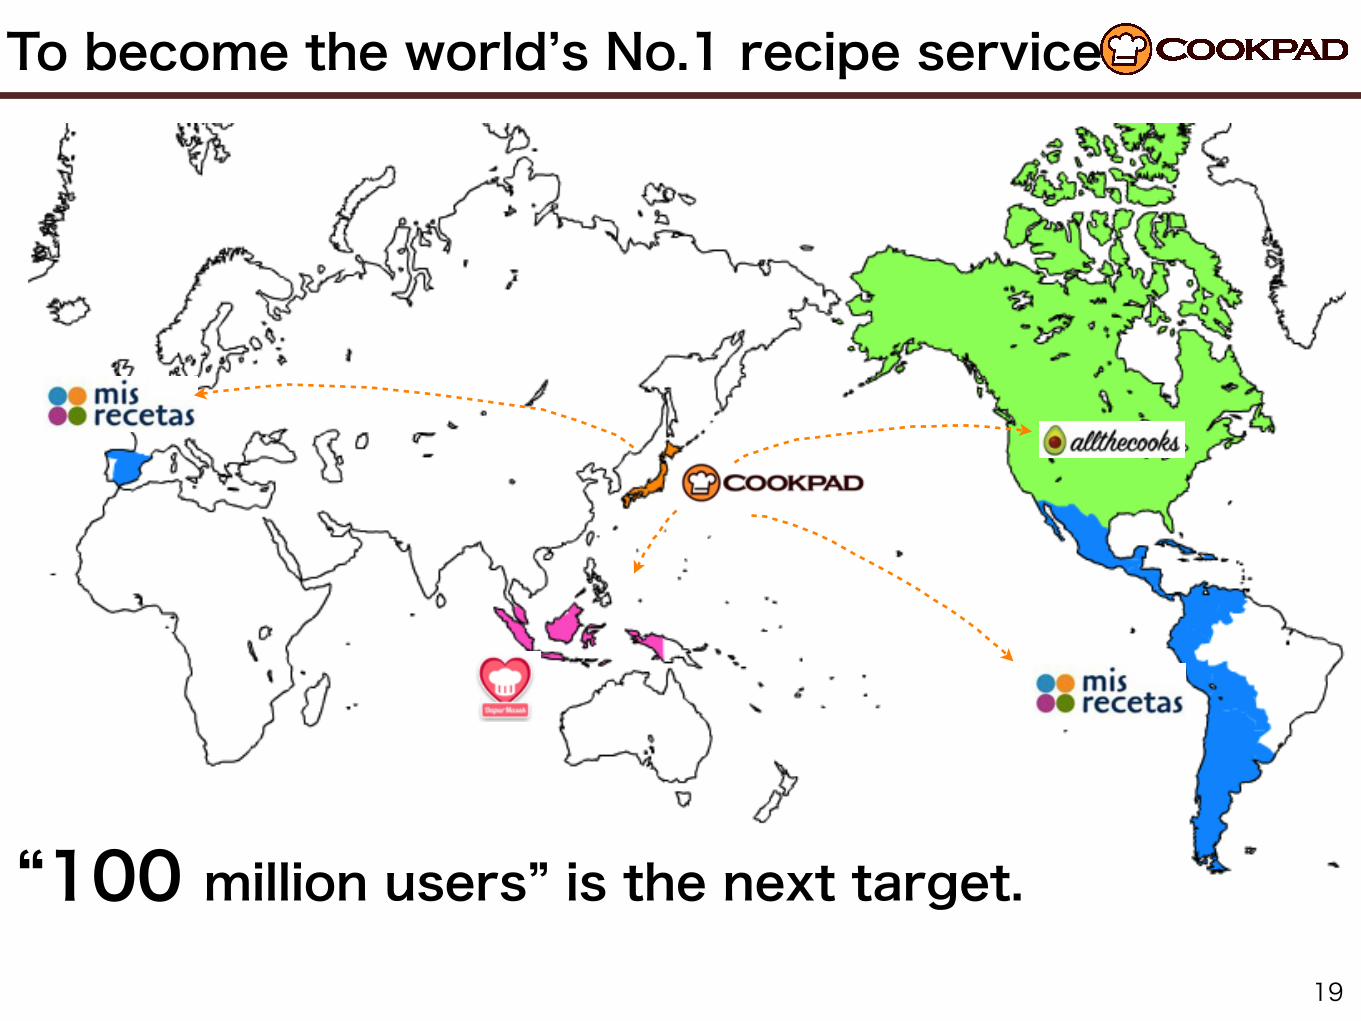
To become the world’s No.1 recipe service
“100 million users” is the next target.19
Major recipe services around the world
20
No.1 recipe services in U.S. and Europe
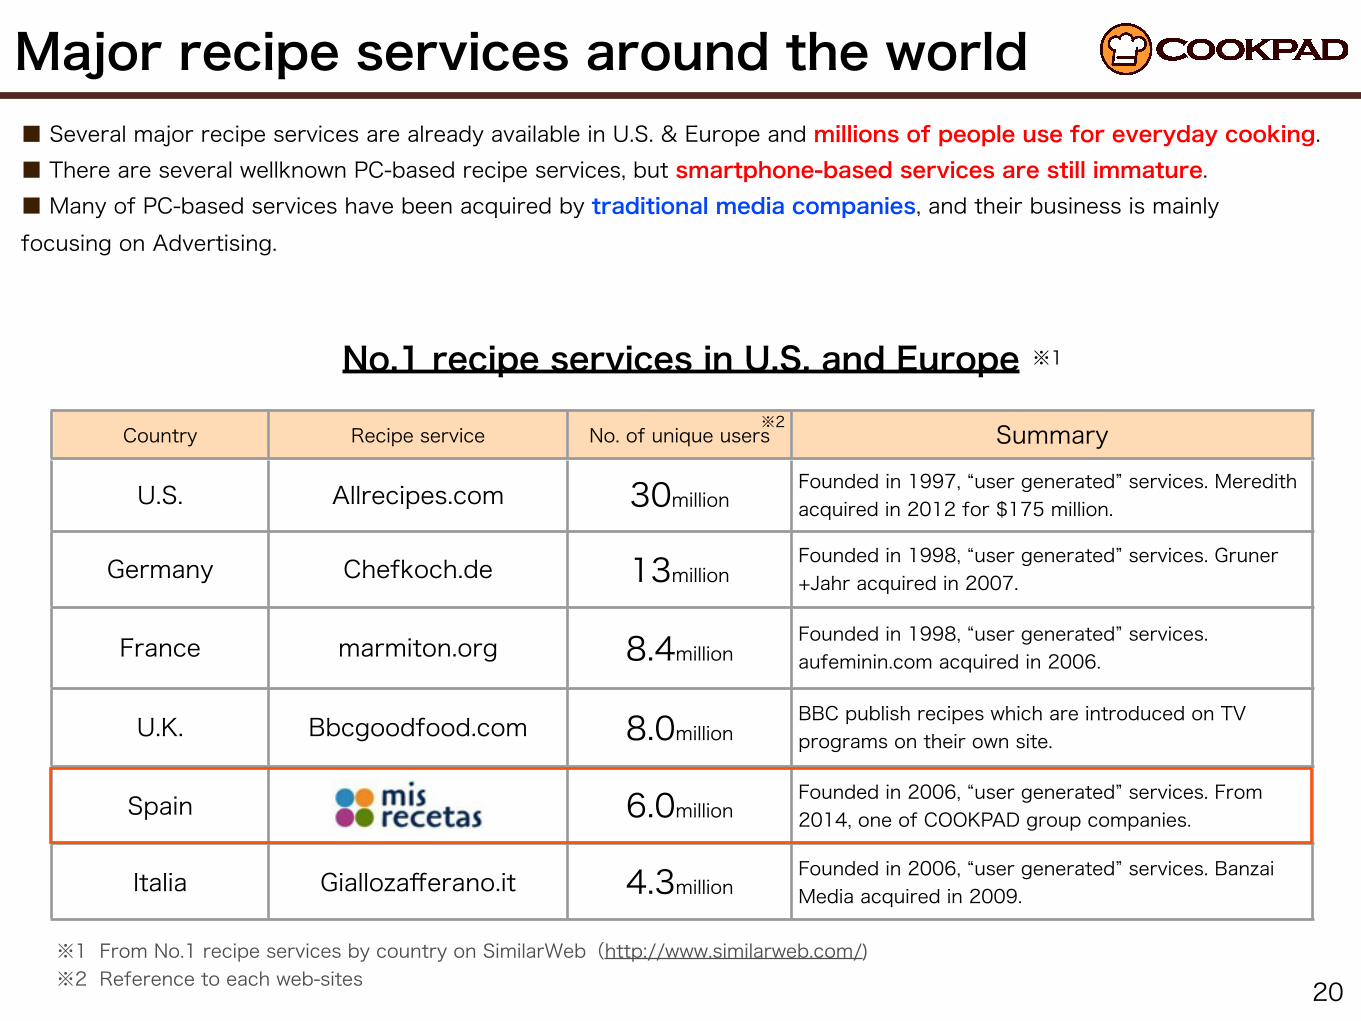
■ Several major recipe services are already available in U.S. & Europe and millions of people use for everyday cooking.■ There are several wellknown PC-based recipe services, but smartphone-based services are still immature.■ Many of PC-based services have been acquired by traditional media companies, and their business is mainly focusing on Advertising.
Country Recipe service No. of unique users Summary
U.S. Allrecipes.com 30millionFounded in 1997, “user generated” services. Meredith acquired in 2012 for $175 million.
Germany Chefkoch.de 13millionFounded in 1998, “user generated” services. Gruner+Jahr acquired in 2007.
France marmiton.org 8.4millionFounded in 1998, “user generated” services. aufeminin.com acquired in 2006.
U.K. Bbcgoodfood.com 8.0millionBBC publish recipes which are introduced on TV programs on their own site.
Spain 6.0millionFounded in 2006, “user generated” services. From 2014, one of COOKPAD group companies.
Italia Giallozafferano.it 4.3millionFounded in 2006, “user generated” services. Banzai Media acquired in 2009.
※1
※2
※1 From No.1 recipe services by country on SimilarWeb(http://www.similarweb.com/)※2 Reference to each web-sites
COOKPAD’s Core Value
21
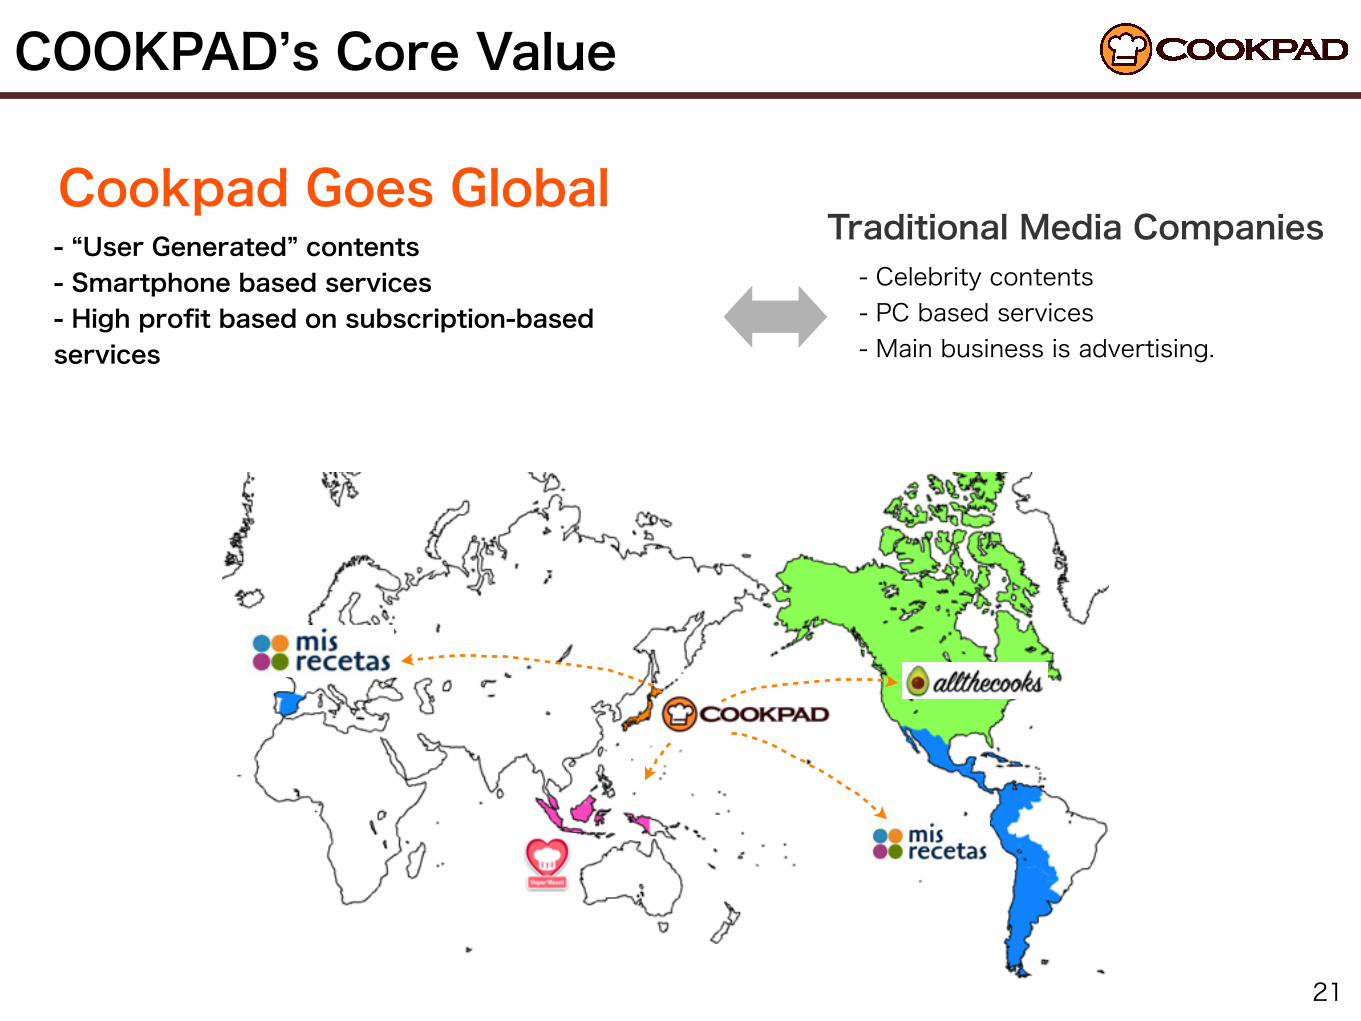
Cookpad Goes GlobalTraditional Media Companies- “User Generated” contents
- Smartphone based services- High profit based on subscription-based services
- Celebrity contents- PC based services- Main business is advertising.
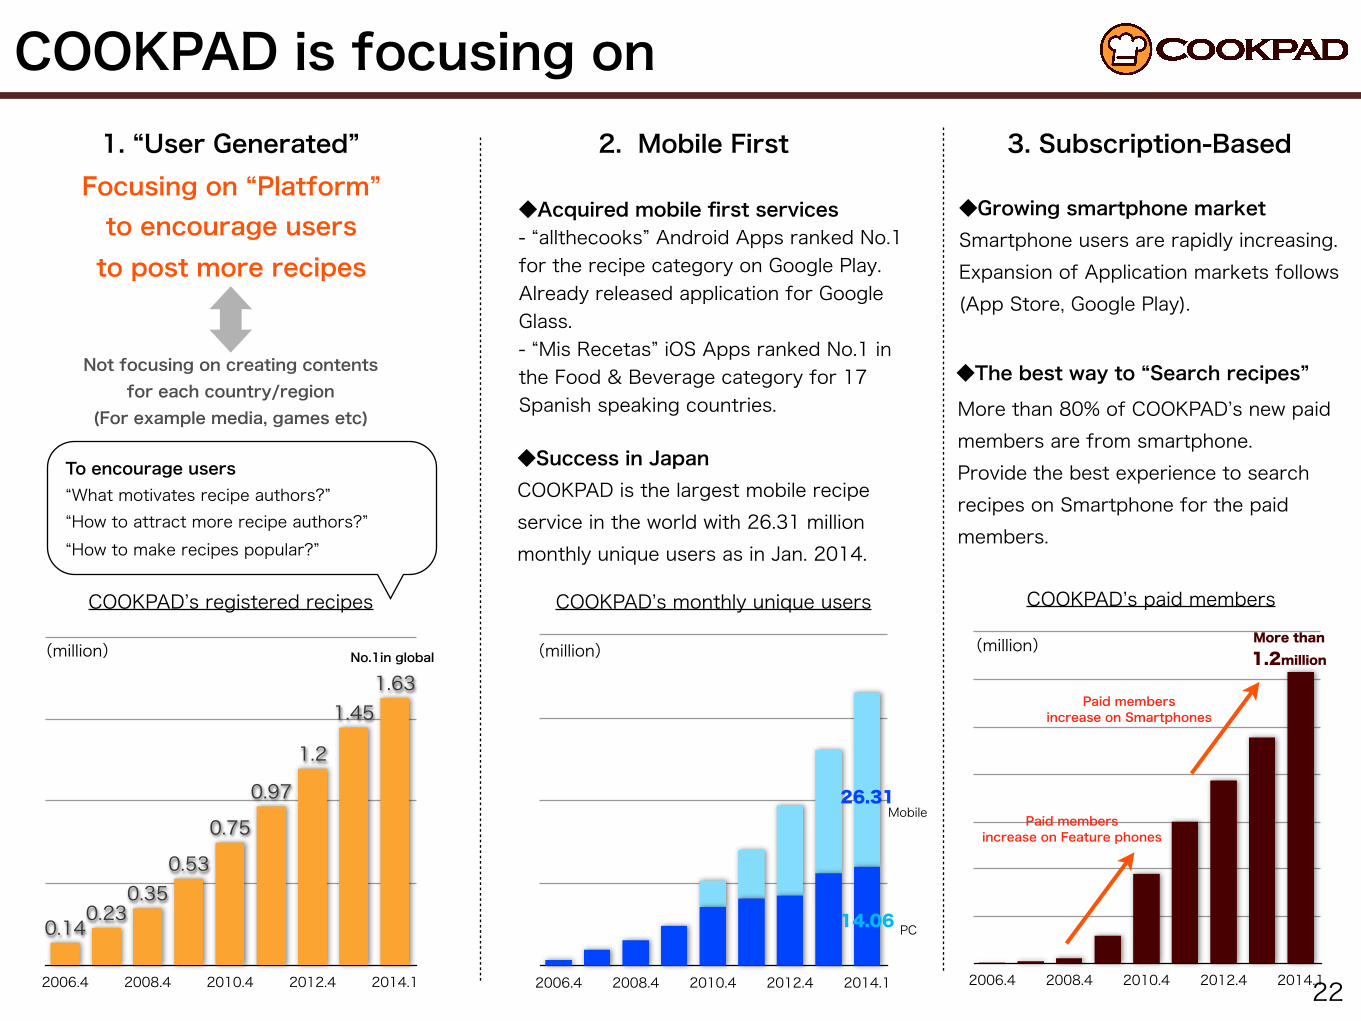
More than 80% of COOKPAD’s new paid members are from smartphone.Provide the best experience to search recipes on Smartphone for the paid members.
COOKPAD is focusing on
222006.4 2008.4 2010.4 2012.4 2014.1
1.631.45
1.2
0.97
0.75
0.530.35
0.230.14
COOKPAD’s registered recipes
(million)
To encourage users“What motivates recipe authors?”“How to attract more recipe authors?”“How to make recipes popular?”
1. “User Generated” 2. Mobile First 3. Subscription-Based
2006.4 2008.4 2010.4 2012.4 2014.1
26.31
14.06
(million)
COOKPAD’s monthly unique users
Mobile
PC
◆Acquired mobile first services- “allthecooks” Android Apps ranked No.1 for the recipe category on Google Play. Already released application for Google Glass.- “Mis Recetas” iOS Apps ranked No.1 in the Food & Beverage category for 17 Spanish speaking countries.
◆Success in JapanCOOKPAD is the largest mobile recipe service in the world with 26.31 million monthly unique users as in Jan. 2014.
Not focusing on creating contents for each country/region
(For example media, games etc)
Focusing on “Platform”to encourage users to post more recipes
No.1in global
2006.4 2008.4 2010.4 2012.4 2014.1
More than 1.2million
(million)
COOKPAD’s paid members
Paid membersincrease on Feature phones
◆Growing smartphone marketSmartphone users are rapidly increasing. Expansion of Application markets follows (App Store, Google Play).
◆The best way to “Search recipes”
Paid membersincrease on Smartphones
Same business model in global
23
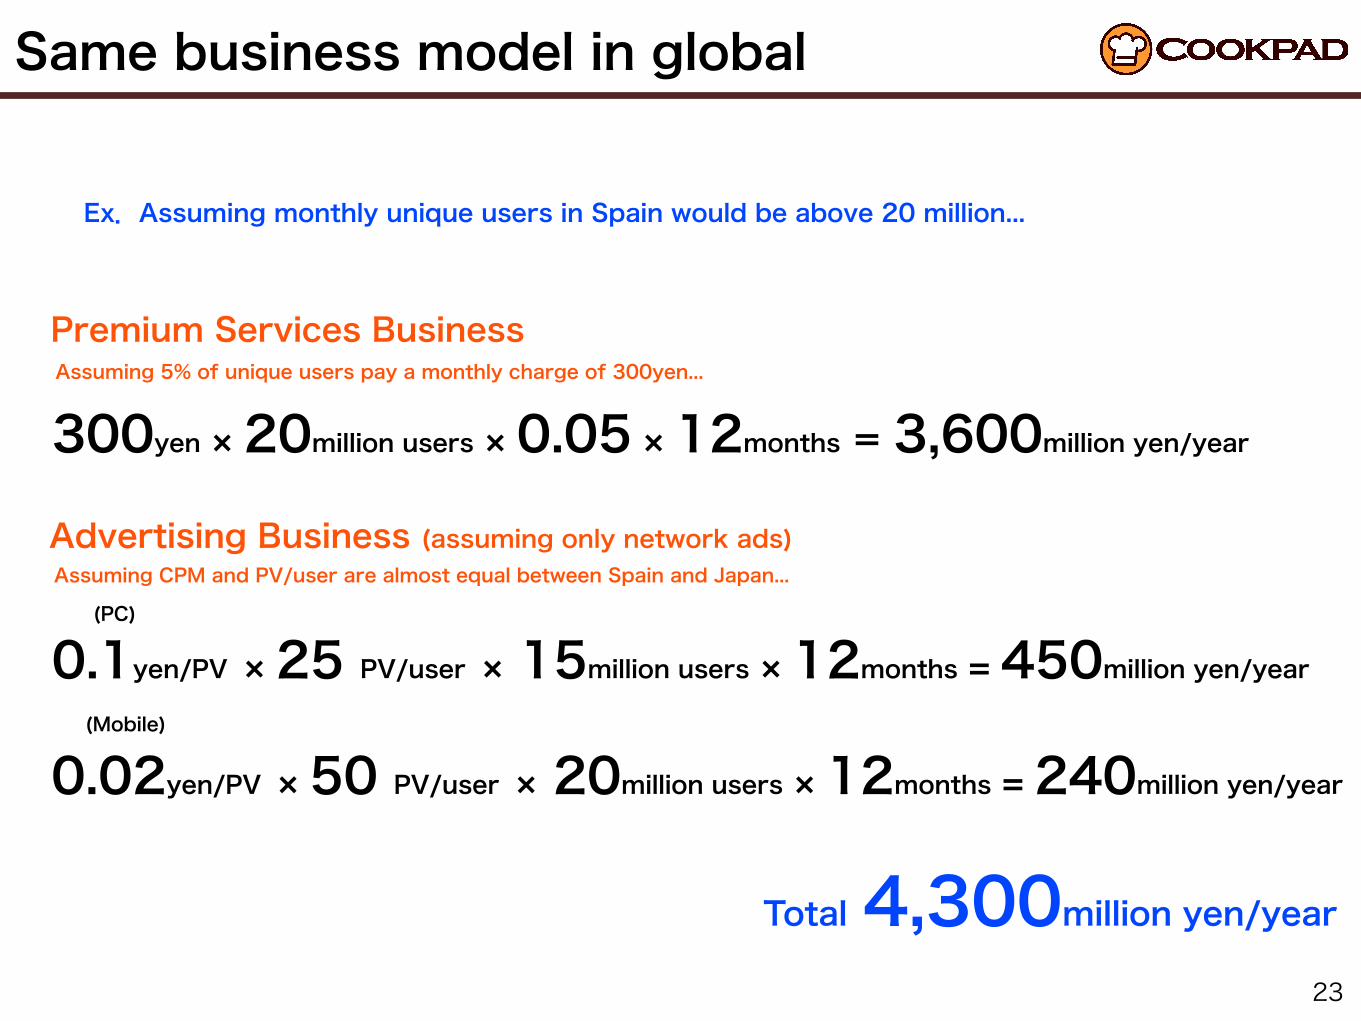
Ex.Assuming monthly unique users in Spain would be above 20 million...
300yen × 20million users × 0.05 × 12months = 3,600million yen/year
Premium Services BusinessAssuming 5% of unique users pay a monthly charge of 300yen...
Advertising Business (assuming only network ads)Assuming CPM and PV/user are almost equal between Spain and Japan...
0.1yen/PV × 25 PV/user × 15million users × 12months = 450million yen/year
0.02yen/PV × 50 PV/user × 20million users × 12months = 240million yen/year
(PC)
(Mobile)
Total 4,300million yen/year

Make everyday cooking fun
- This document includes some forecasts, which are based on currently available information. It may contain an element of uncertainty. Actual performance data and similar information may differ due to diverse factors.
- We appreciate your understanding. When producing this document, we were careful not to include errors or omissions, but the authenticity and integrity of the information are not guaranteed.