Embed Size (px)
Citation preview
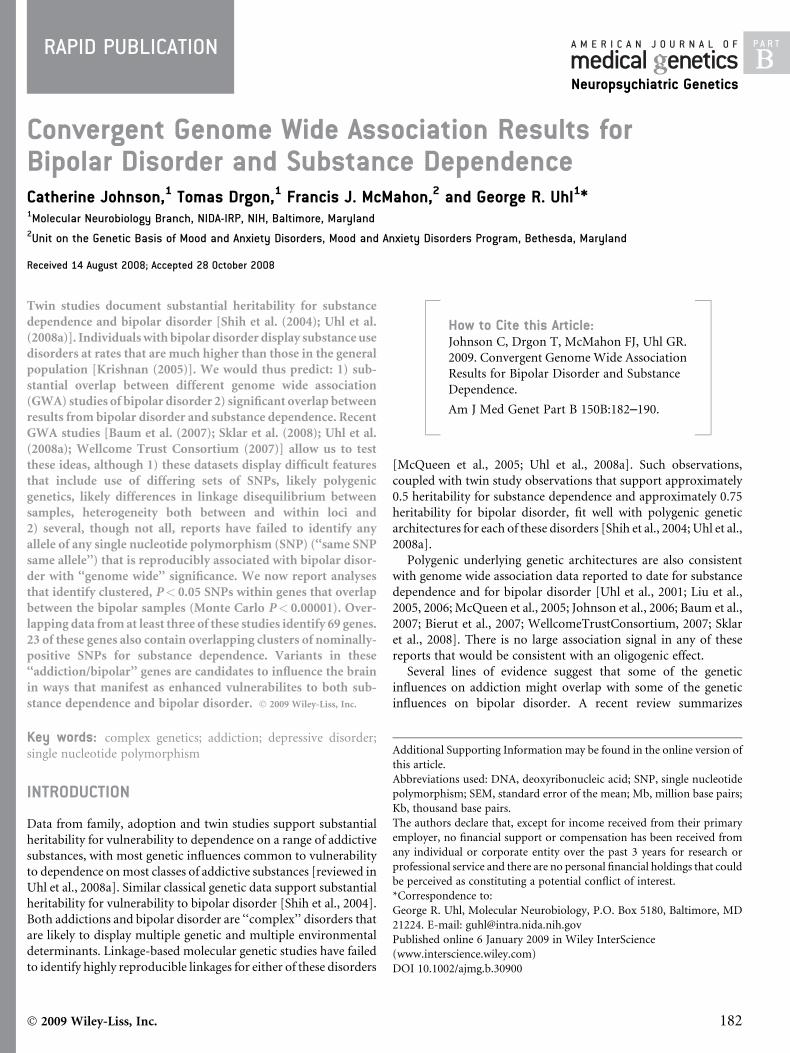
RAPID PUBLICATION
Convergent Genome Wide Association Results forBipolar Disorder and Substance DependenceCatherine Johnson,1 Tomas Drgon,1 Francis J. McMahon,2 and George R. Uhl1*1Molecular Neurobiology Branch, NIDA-IRP, NIH, Baltimore, Maryland2Unit on the Genetic Basis of Mood and Anxiety Disorders, Mood and Anxiety Disorders Program, Bethesda, Maryland
Received 14 August 2008; Accepted 28 October 2008
Twin studies document substantial heritability for substance
dependence and bipolar disorder [Shih et al. (2004); Uhl et al.
(2008a)]. Individuals with bipolar disorder display substance use
disorders at rates that are much higher than those in the general
population [Krishnan (2005)]. We would thus predict: 1) sub-
stantial overlap between different genome wide association
(GWA) studies of bipolar disorder 2) significant overlap between
results from bipolar disorder and substance dependence. Recent
GWA studies [Baum et al. (2007); Sklar et al. (2008); Uhl et al.
(2008a); Wellcome Trust Consortium (2007)] allow us to test
these ideas, although 1) these datasets display difficult features
that include use of differing sets of SNPs, likely polygenic
genetics, likely differences in linkage disequilibrium between
samples, heterogeneity both between and within loci and
2) several, though not all, reports have failed to identify any
allele of any single nucleotide polymorphism (SNP) (‘‘same SNP
same allele’’) that is reproducibly associated with bipolar disor-
der with ‘‘genome wide’’ significance. We now report analyses
that identify clustered, P< 0.05 SNPs within genes that overlap
between the bipolar samples (Monte Carlo P< 0.00001). Over-
lapping data from at least three of these studies identify 69 genes.
23 of these genes also contain overlapping clusters of nominally-
positive SNPs for substance dependence. Variants in these
‘‘addiction/bipolar’’ genes are candidates to influence the brain
in ways that manifest as enhanced vulnerabilites to both sub-
stance dependence and bipolar disorder. � 2009 Wiley-Liss, Inc.
Key words: complex genetics; addiction; depressive disorder;
single nucleotide polymorphism
INTRODUCTION
Data from family, adoption and twin studies support substantial
heritability for vulnerability to dependence on a range of addictive
substances, with most genetic influences common to vulnerability
to dependence on most classes of addictive substances [reviewed in
Uhl et al., 2008a]. Similar classical genetic data support substantial
heritability for vulnerability to bipolar disorder [Shih et al., 2004].
Both addictions and bipolar disorder are ‘‘complex’’ disorders that
are likely to display multiple genetic and multiple environmental
determinants. Linkage-based molecular genetic studies have failed
to identify highly reproducible linkages for either of these disorders
[McQueen et al., 2005; Uhl et al., 2008a]. Such observations,
coupled with twin study observations that support approximately
0.5 heritability for substance dependence and approximately 0.75
heritability for bipolar disorder, fit well with polygenic genetic
architectures for each of these disorders [Shih et al., 2004; Uhl et al.,
2008a].
Polygenic underlying genetic architectures are also consistent
with genome wide association data reported to date for substance
dependence and for bipolar disorder [Uhl et al., 2001; Liu et al.,
2005, 2006; McQueen et al., 2005; Johnson et al., 2006; Baum et al.,
2007; Bierut et al., 2007; WellcomeTrustConsortium, 2007; Sklar
et al., 2008]. There is no large association signal in any of these
reports that would be consistent with an oligogenic effect.
Several lines of evidence suggest that some of the genetic
influences on addiction might overlap with some of the genetic
influences on bipolar disorder. A recent review summarizes
Additional Supporting Information may be found in the online version of
this article.
Abbreviations used: DNA, deoxyribonucleic acid; SNP, single nucleotide
polymorphism; SEM, standard error of the mean; Mb, million base pairs;
Kb, thousand base pairs.
The authors declare that, except for income received from their primary
employer, no financial support or compensation has been received from
any individual or corporate entity over the past 3 years for research or
professional service and there are no personal financial holdings that could
be perceived as constituting a potential conflict of interest.
*Correspondence to:
George R. Uhl, Molecular Neurobiology, P.O. Box 5180, Baltimore, MD
21224. E-mail: [email protected]
Published online 6 January 2009 in Wiley InterScience
(www.interscience.wiley.com)
DOI 10.1002/ajmg.b.30900
How to Cite this Article:Johnson C, Drgon T, McMahon FJ, Uhl GR.
2009. Convergent Genome Wide Association
Results for Bipolar Disorder and Substance
Dependence.
Am J Med Genet Part B 150B:182–190.
� 2009 Wiley-Liss, Inc. 182
Neuropsychiatric Genetics

evidence that up to three quarters of individuals with bipolar
disorder manifest a substance use disorder, a rate that is much in
excess of the rate in the general population [Krishnan, 2005]. The
familial patterns of bipolar and substance use disorders provide
ample evidence for enhanced occurrence of addictive disorders in
members of families that were ascertained on the basis of a member
with bipolar disorder [Biederman et al., 2000; Preisig et al., 2001;
Shih et al., 2004].
In genome wide association studies for addictions, we have
developed and used analytic approaches that aim to identify
modest-sized association signals in genes that are identified repro-
ducibly in multiple samples, in ways that increase confidence in the
results. We have used these approaches to identify dozens of gene
loci that contain association signals from replicated genome
wide association studies of polysubstance abusers, methamphet-
amine abusers and alcohol abusers of European, African and Asian
genetic backgrounds [Uhl et al., 2001, 2008a,b; Liu et al., 2005, 2006;
Johnson et al., 2006].
Recent reports have used several different approaches to analyze
genome wide association data from studies of four bipolar versus
control samples. The individuals studied were of largely European
genetic background and were collected in the United States, the
United Kingdom, and Germany [McQueen et al., 2005; Baum et al.,
2007; WellcomeTrustConsortium, 2007; Sklar et al., 2008]. Most of
these analyses have sought, and failed to identify, the same alleles of
specific single nucleotide polymorphisms (SNP) (‘‘same SNP same
allele’’ analysis) that were strongly associated with bipolar disorder
in each of these multiple samples [Baum et al., 2008; Gershon et al.,
2008; Sklar et al., 2008], although a recent analysis has identified
some SNPs that display some of these properties [Ferreira et al.,
2008].
We now report analyses of data from each of these four bipolar
disorder genome wide association studies. We use preplanned
approaches that seek overlapping clusters of SNPs with nominally
significant associations in the same genes in each of several inde-
pendent samples. Such analyses may provide some robustness in
the face of genetic architectures and technical issues that may
prove to be difficult for ‘‘same SNP same allele’’ analyses, including
(1) polygenic genetic architectures that are likely to provide asso-
ciation signals of modest magnitude at individual SNPs, (2) sample-
to-sample differences in allele frequencies and patterns of linkage
disequilibrium that render different SNPs differentially informative
in different samples, (3) within-locus heterogeneity that could
result in association signals at multiple sites within the same gene,
(4) between-locus heterogeneity that could render association at
one gene locus more prominent in one sample than in other
samples, and (5) genome wide association datasets that use differing
sets of SNPs, such as those found on Affymetrix versus Illumina
platforms.
Using these preplanned analytic approaches, we report substan-
tial overall convergence between the genes identified in these four
bipolar datasets. We also note significant convergence between
these ‘‘bipolar’’ genes and those identified in comparisons of
substance-dependent versus control individuals. These data pro-
vide substantial support for shared molecular genetic bases for
portions of the genetic component of vulnerabilities to addiction
and to bipolar disorder. The ‘‘addiction and bipolar vulnerability’’
genes that we identify in these analyses support the concept that
brains of individuals at greater risk for these disorders differ from
brains of individuals at lower risk for these disorders. The analyses
appear to provide robust overall evidence for overlapping genetic
components, even when observations at single genes do not provide
effects of large magnitude.
MATERIALS AND METHODS
Samples and GenotypingWe use data from autosomal SNPs that were subjected to the quality
control procedures performed by the investigators in each of the
primary studies, to avoid adding inadvertent biases. We note the
numbers of SNPs whose data was available for analyses in each
dataset.
Bipolar disease versus control. WTCCC: 436,604 autosomal
SNP genome wide association for bipolar disorder came from a
study that compared controls with 1,868 United Kingdom indi-
viduals of European descent with bipolar disorders diagnosed using
Research Diagnostic Criteria [WellcomeTrustConsortium, 2007].
Subjects were recruited by teams based in Aberdeen, Birmingham,
Cardiff, London, and Newcastle. Lifetime diagnosis of a bipolar
mood disorder according to Research Diagnostic Criteria included
bipolar subtypes that co-aggregate in family studies: bipolar I
disorder (0.71), schizoaffective disorder bipolar type (0.15), bipolar
II disorder (0.09) and manic disorder (0.05). Uncharacterized
control samples came from two sources. One thousand four
hundred eighty individuals came from a 1958 birth cohort sample.
One thousand four hundred fifty eight individuals came from a
blood service sample, and represent a subset of a United Kingdom
national repository of anonymized DNA samples from 3,622 con-
senting blood donors.
SNP genotyping was performed using Affymetrix 500k arrays.
Genotypes were determined from hybridization intensities were
determined using a CHIAMO algorithm with a �0.9 a posteriori
probability threshold for making genotype calls. We used data for
each of the 436,604 of the 469,557 SNPs assessed by the WTCCC
that could be assigned confident autosomal chromosomal local-
izations based on data in NCBI genome assembly, build 36. A P-
value for each SNP was determined based onc2 tests for significance
of allele frequency differences in bipolar versus control subjects
[WellcomeTrustConsortium, 2007].
NIMH: 536,288 autosomal SNP genome wide association was
assessed in controls compared to 461 unrelated bipolar I probands.
These probands reported European ancestry and were selected from
families with at least one affected sibling pair who were part of the
NIMH Genetics Initiative (http://nimhgenetics.org) [Baum et al.,
2007]. Probands underwent a semi-structured diagnostic interview
and were assigned a ‘‘confident’’ diagnosis of DSM-IV bipolar I
disorder by each of two trained clinicians. 563 unrelated control
individuals of European-American ancestry who failed to display
evidence for DSM-IV criteria for major depression, history of
bipolar disorder or a history of psychosis were recruited by a
marketing firm.
German: 536,288 autosomal SNP genome-wide association was
assessed in controls compared with 772 bipolar I patients were
JOHNSON ET AL. 183

recruited from consecutive hospital admissions [Baum et al., 2007].
DSM-IV bipolar I diagnoses were made by a consensus best-
estimate procedure based on structured interviews, medical records
and family history. Eight hundred seventy six population-based
controls were randomly recruited by the same investigators with the
support of the Bonn (North Rhine-Westphalia, Germany) census
bureau. Individuals with personal histories of affective disorder or
schizophrenia were excluded.
For genotyping, NIMH samples were divided into seven bipolar
and nine control pools of 50–80 subjects/pool. German samples
were divided into 13 bipolar and 10 control pools of 42–60 subjects
per pool. SNP allelic distributions were assessed using duplicate
Illumina HumanHap550 arrays and a BeadStation (Illumina, Inc.,
La Jolla, CA) [Baum et al., 2007]. Normalized allele frequencies
were calculated from raw intensity data averaged across duplicate
pools to obtain a relative allele frequency estimate for each SNP in
each pool. SNPs with >2% variance between replicate pools were
excluded. t tests assessed the null hypothesis that the transformed
relative allele frequencies of cases and controls were equal, com-
paring pool-to-pool variation within phenotypes to phenotype-to-
phenotype differences. We used P values obtained from these t tests.
US and UK bipolar I samples: 364,218 autosomal SNP genome
wide association was assessed in controls compared to bipolar (I)
patients identified as part of the Systematic Treatment Enhance-
ment Program for Bipolar Disorder (STEP-BD; n¼ 955) or at
University College London, United Kingdom (UCL; n¼ 506)
[Sklar et al., 2008]. Control samples were obtained from the United
States National Institute of Mental Health (NIMH) Genetics Re-
pository (n¼ 1,498) and from the UK (n¼ 510, matched to the
UCL cases).
For STEP cases DSM-IV diagnoses came from information in the
Affective Disorders Evaluation and the Mini International Neuro-
psychiatric Interview administered by trained clinical specialists or
psychiatrists. UCL individuals received ICD10 diagnoses of bipolar
disorder from a psychiatrist and DSMIIIR and Research Diagnostic
Criteria diagnoses of bipolar disorder after interviews by research
psychiatrists. SNP genotyping was performed using Afymetrix 500k
arrays. A P value for each SNP was determined based on its c2 test
for significance of allele frequency differences in bipolar versus
control subjects.
Substance dependent versus control. 1 M autosomal SNP
genome wide association data came from European-American
samples selected as previously described [Liu et al., 2006]. For
convenience, we use here the term ‘‘abusers’’ to describe individuals
who displayed heavy lifetime use of illegal substances [Persico et al.,
1996; Uhl et al., 2001] and dependence on at least one illegal
substance based on DSMIIIR or DSMIV criteria, while we use the
term ‘‘controls’’ to describe individuals who displayed neither
abuse nor dependence on any addictive substance and report no
significant lifetime histories of use of any addictive substance. These
studies provide one of the richest datasets of well-characterized
individuals matched for ethnicity that is available for comparison,
though the 400 ‘‘abusers’’ and 280 ‘‘controls’’ provide a smaller
sample than those available for bipolar disorder. A ‘‘t’’ statistic for
the differences between abusers and controls was obtained from
assessments of DNAs analyzed in pools of 20 individuals using
Affymetrix 6.0 array methods that have been extensively validated
[Drgon et al., manuscript in preparation]. We focused on clustered,
reproducibly positive SNPs in chromosomal regions that contained
genes, using a preplanned set of criteria. Such SNPs (a) displayed t
values with P< 0.05 significance in abuser versus control compar-
isons, (b) cluster, so that at least four of these reproducibly positive
SNPs lie within 10 Kb of each other and (c) identify genes. As we
note below, since many of these SNPs are likely to be in linkage
disequilibrium with each other, this analysis provides evidence
against large amounts of genotyping error in these European-
American samples. Convergence of these results with data from
other independent samples that would be expected to reveal over-
lapping genetics (e.g., African-American abuser versus control
comparisons) [Drgon et al., manuscript in preparation] and bipolar
samples (see below) provides independent evidence for the success
of these criteria, though it does not document that these criteria
have been optimized. We do note that we preplanned use of 10 kb
clustering for data from 1 M SNP arrays and 25 kb clusters for
analyses of data from 300 to 500 k SNP arrays based on prior
analyses using these distances for data from SNP datasets of these
differing densities [Liu et al., 2006; Drgon et al., manuscript in
preparation].
In this work, correlations between pooled and individually
determined genotypes were 0.98, standard errors estimating the
variation among the four replicate studies of each DNA pool were
0.03 and standard errors estimating the variation among the pools
studied for each phenotype group were 0.03 [Liu et al., 2006].
Monte Carlo Simulations IData from each study provided a set of SNPs with known chromo-
somal locations and nominal P values for each SNP based on the
results of thec2 or t tests, as noted above. A first set of ‘‘Monte Carlo
I’’ simulations addressed, within each sample, the null hypothesis I
that the extent of clustering of nominally positive SNPs was no
greater than would have been anticipated by chance. We tested this
first null hypothesis using 100,000 Monte Carlo I simulation trials
[Uhl et al., 2001]. Each trial began with sampling from the database
that contained the data from the SNPs in the study of interest. For
each of the 100,000 simulation trials, a randomly selected set of
SNPs of the same size as the authentic set displayed nominally
significant P values in the primary analysis was chosen to test the
null hypothesis I: that the nominally significant SNPs from the
study cluster together no more frequently than would be expected
by chance. The number of trials for which the results from randomly
selected SNPs matched or exceeded the results actually observed
from the authentic SNPs that were actually identified by the results
of the study was tabulated. Empirical P values were calculated by
dividing the number of trials for which the observed results were
matched or exceeded by the total number of Monte Carlo simula-
tion trials performed. Failure to support the null hypothesis I in
relation to clustering of nominally positive SNPs could of course
come from: (a) case versus control allele (and haplotype) frequency
differences that related to clinical phenotype or (b) stochastic
differences between case versus control allele (and haplotype)
frequency differences that do not necessarily relate to the clinical
phenotype.
184 AMERICAN JOURNAL OF MEDICAL GENETICS PART B

Monte Carlo Simulations IIWhen comparing with the results from different studies, we test the
null hypothesis II: that the clustered positive results from the
genome wide association data from one study do not converge
with (e.g., overlap with the chromosomal positions of) clustered
nominally positive SNPs in other studies to extents greater than
expected by chance. Note that testing this null hypothesis does not
require that the same sets of SNPs were examined in each study.
Testing this null hypothesis does not require that we impute
genotypes at SNPs that were not assayed. We first seek chromo-
somal overlap between clusters of nominally positive SNPs, defined
as noted above, from different studies. To balance type I and type II
error, we focus on genes that are identified by overlapping, clustered
nominally positive SNPs in at least three of the four independent
bipolar versus control comparisons analyzed here. Genes identified
by all samples are also identified in boldface in Table I. Failure to
support the null hypothesis II is thus based on identification of
many more overlapping clusters of nominally positive SNPs in
multiple independent samples in authentic samples than anticipat-
ed by chance. In comparison to the results from tests of null
hypothesis I, failure to support null hypothesis II is much less
likely to arise from case versus control allele frequency differences
that relate to stochastic differences in allele and haplotype frequen-
cies. Failure to support null hypothesis II is much more likely to
come from case versus control allele (and haplotype) frequency
differences that relate to clinical phenotype.
We can use similar strategies to test the significance of overlaps
between clusters of nominally positive SNPs that identify genes for
bipolar disorder in different samples and overlap between genome
wide results from bipolar disorder and substance dependence. To
test the significance of these overlaps, we use a second set of Monte
Carlo simulations (‘‘II’’) with trials that each sample randomly
from the SNP datasets noted above. We compare sample to sample
overlap of clustered results from the randomly sampled SNPs to
those seen in the authentic datasets. 100,000 trials allow estimates of
significance using this empirical statistic, as noted above.
Monte Carlo Simulations IIIIn assessing the extent of support for individual genes identified in
this work, we test the null hypothesis III that the clustered positive
results from the entire set of genome wide association datasets do
not identify gene sequences of the same size found in each of the
genes listed in Table I more than anticipated by chance. This set of
simulation studies thus tests a more stringent null hypothesis than
the simulation studies that seek to assess the significance of overall
converge/overlap between the chromosomal positions of clustered
nominally positive SNPs. For these simulation studies, we use a list
of ‘‘gene centric’’ genomic segments that lie flanked by the begin-
ning of the first exon or end of the last exon of annotated genes or
within 10 kb 50 and 30 from these sites, respectively. For each of
10,000 Monte Carlo III trials, we assess randomly ascertained
‘‘within gene’’ segments of the same size as those noted for each
of the ‘‘authentic’’ genes identified in Table I. We obtain a Monte
Carlo P value by comparing the number of trials in which the
number of clustered nominally positive SNPs in the randomly
selected within-gene segment is as large as or larger than the number
actually obtained in the authentic gene, when we consider data from
each of the five genome wide datasets in Table I. To provide a
concrete example of overlap based on the bipolar samples, we
provide detailed data for an area of the CSMD1 gene that is
identified by clustered, nominally positive SNPs from three of the
four bipolar samples in the Supplement, Table S1.
RESULTS
Assessment of Chromosomal Clustering forResults From Bipolar Disorder Genome WideAssociation DatasetsWTCCC bipolar versus control: 28,192 of the 426,604 SNPs analyzed
in the WTCCC bipolar disorder collection displayed c2 values with
P< 0.05 [WellcomeTrustConsortium, 2007]. Twelve thousand five
hundred sixty of these SNPs fell into 1,775 clusters in which at least
four SNPs that each displayed P< 0.05 and were sampled on at least
two array types lay within 25 kb of each other. One way of
understanding the extent of this clustering comes from the follow-
ing statistic: two thirds of these clustered nominally positive
SNPs lay within 7,500 bp of another nominally positive SNP from
this sample. Monte Carlo I simulation trials that assessed the
probabilities that these results were due to chance found an average
of 2,358 SNPs that lay in 511 clusters and that none of 100,000
simulation trials identified as many clusters of SNPs that displayed
nominally positive differences between bipolar versus control
samples as we have identified from this work (thus P< 0.00001)
[WellcomeTrustConsortium, 2007].
NIMH bipolar versus control: 32,835 of the 536,288 SNPs
analyzed in the NIMH bipolar collection displayed t values with
P< 0.05. Nine thousand nine hundred seventy one of these SNPs
fell into 1,770 clusters in which at least 4 SNPs that each displayed
t values (in this sample) corresponding to P< 0.05 lay within 25 kb
of each other [Baum et al., 2007]. Half of these clustered nominally
positive SNPs lay within 7,500 bp of another nominally positive
SNP from this sample. Monte Carlo I simulation trials that assessed
the probabilities that these results were due to chance found an
average of 4,041 SNPs in 853 clusters and that none of 100,000
simulation trials identified as many clustered SNPs that displayed
nominally positive differences between bipolar versus control
samples as we have identified from this work (thus P< 0.00001).
German bipolar versus control: 27,057 of the 532,835 SNPs
analyzed in the German samples displayed t values that corre-
sponded to P< 0.05. Six thousand one hundred ten of these SNPs
fell into 1,137 clusters in which at least four SNPs that each
displayed t values corresponding to P< 0.05 (within this sample)
lay within 25 kb of each other [Baum et al., 2007]. Half of these
clustered nominally positive SNPs lay within 7,500 bp of another
nominally positive SNP from this sample. Monte Carlo I simulation
trials that assessed the probabilities that these results were due to
chance found an average of 2,297 SNPs in 500 clusters and that none
of 100,000 simulation trials identified as many clustered SNPs that
displayed nominally positive differences between bipolar versus
control samples as observed in this work (thus P< 0.00001).
JOHNSON ET AL. 185
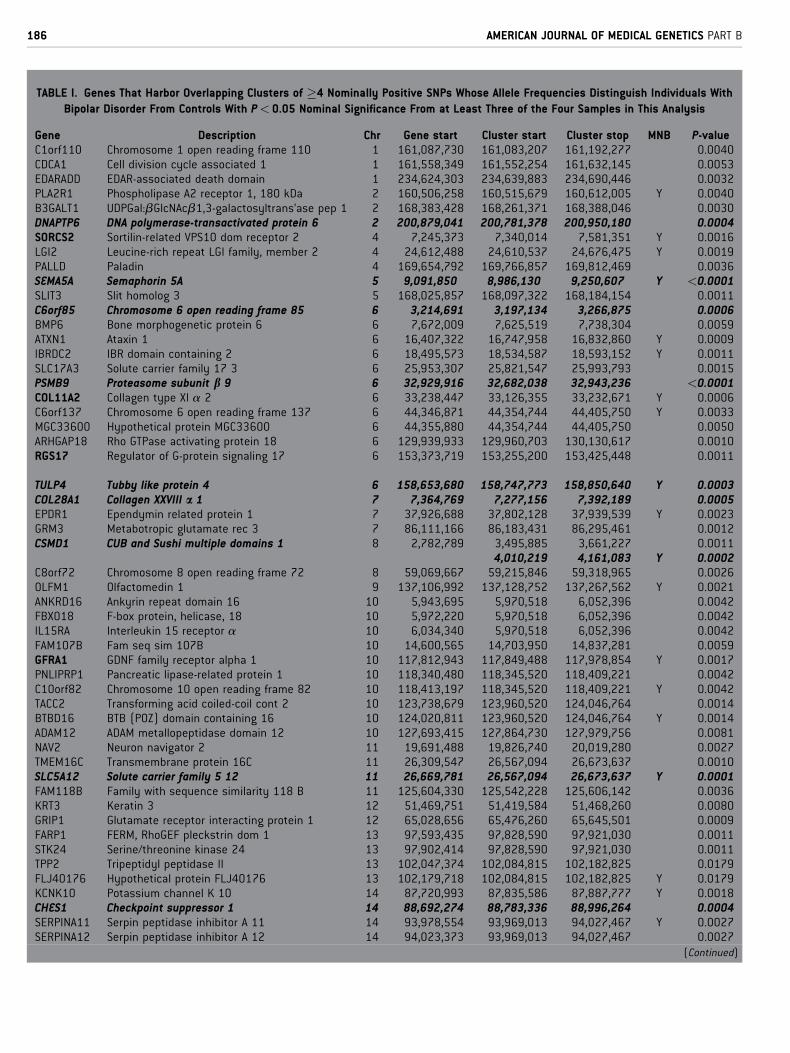
TABLE I. Genes That Harbor Overlapping Clusters of �4 Nominally Positive SNPs Whose Allele Frequencies Distinguish Individuals With
Bipolar Disorder From Controls With P < 0.05 Nominal Significance From at Least Three of the Four Samples in This Analysis
Gene Description Chr Gene start Cluster start Cluster stop MNB P-valueC1orf110 Chromosome 1 open reading frame 110 1 161,087,730 161,083,207 161,192,277 0.0040CDCA1 Cell division cycle associated 1 1 161,558,349 161,552,254 161,632,145 0.0053EDARADD EDAR-associated death domain 1 234,624,303 234,639,883 234,690,446 0.0032PLA2R1 Phospholipase A2 receptor 1, 180 kDa 2 160,506,258 160,515,679 160,612,005 Y 0.0040B3GALT1 UDPGal:bGlcNAcb1,3-galactosyltrans’ase pep 1 2 168,383,428 168,261,371 168,388,046 0.0030DNAPTP6 DNA polymerase-transactivated protein 6 2 200,879,041 200,781,378 200,950,180 0.0004SORCS2 Sortilin-related VPS10 dom receptor 2 4 7,245,373 7,340,014 7,581,351 Y 0.0016LGI2 Leucine-rich repeat LGI family, member 2 4 24,612,488 24,610,537 24,676,475 Y 0.0019PALLD Paladin 4 169,654,792 169,766,857 169,812,469 0.0036SEMA5A Semaphorin 5A 5 9,091,850 8,986,130 9,250,607 Y <0.0001SLIT3 Slit homolog 3 5 168,025,857 168,097,322 168,184,154 0.0011C6orf85 Chromosome 6 open reading frame 85 6 3,214,691 3,197,134 3,266,875 0.0006BMP6 Bone morphogenetic protein 6 6 7,672,009 7,625,519 7,738,304 0.0059ATXN1 Ataxin 1 6 16,407,322 16,747,958 16,832,860 Y 0.0009IBRDC2 IBR domain containing 2 6 18,495,573 18,534,587 18,593,152 Y 0.0011SLC17A3 Solute carrier family 17 3 6 25,953,307 25,821,547 25,993,793 0.0015PSMB9 Proteasome subunit b 9 6 32,929,916 32,682,038 32,943,236 <0.0001COL11A2 Collagen type XI a 2 6 33,238,447 33,126,355 33,232,671 Y 0.0006C6orf137 Chromosome 6 open reading frame 137 6 44,346,871 44,354,744 44,405,750 Y 0.0033MGC33600 Hypothetical protein MGC33600 6 44,355,880 44,354,744 44,405,750 0.0050ARHGAP18 Rho GTPase activating protein 18 6 129,939,933 129,960,703 130,130,617 0.0010RGS17 Regulator of G-protein signaling 17 6 153,373,719 153,255,200 153,425,448 0.0011
TULP4 Tubby like protein 4 6 158,653,680 158,747,773 158,850,640 Y 0.0003COL28A1 Collagen XXVIII a 1 7 7,364,769 7,277,156 7,392,189 0.0005EPDR1 Ependymin related protein 1 7 37,926,688 37,802,128 37,939,539 Y 0.0023GRM3 Metabotropic glutamate rec 3 7 86,111,166 86,183,431 86,295,461 0.0012CSMD1 CUB and Sushi multiple domains 1 8 2,782,789 3,495,885 3,661,227 0.0011
4,010,219 4,161,083 Y 0.0002C8orf72 Chromosome 8 open reading frame 72 8 59,069,667 59,215,846 59,318,965 0.0026OLFM1 Olfactomedin 1 9 137,106,992 137,128,752 137,267,562 Y 0.0021ANKRD16 Ankyrin repeat domain 16 10 5,943,695 5,970,518 6,052,396 0.0042FBXO18 F-box protein, helicase, 18 10 5,972,220 5,970,518 6,052,396 0.0042IL15RA Interleukin 15 receptor a 10 6,034,340 5,970,518 6,052,396 0.0042FAM107B Fam seq sim 107B 10 14,600,565 14,703,950 14,837,281 0.0059GFRA1 GDNF family receptor alpha 1 10 117,812,943 117,849,488 117,978,854 Y 0.0017PNLIPRP1 Pancreatic lipase-related protein 1 10 118,340,480 118,345,520 118,409,221 0.0042C10orf82 Chromosome 10 open reading frame 82 10 118,413,197 118,345,520 118,409,221 Y 0.0042TACC2 Transforming acid coiled-coil cont 2 10 123,738,679 123,960,520 124,046,764 0.0014BTBD16 BTB (POZ) domain containing 16 10 124,020,811 123,960,520 124,046,764 Y 0.0014ADAM12 ADAM metallopeptidase domain 12 10 127,693,415 127,864,730 127,979,756 0.0081NAV2 Neuron navigator 2 11 19,691,488 19,826,740 20,019,280 0.0027TMEM16C Transmembrane protein 16C 11 26,309,547 26,567,094 26,673,637 0.0010SLC5A12 Solute carrier family 5 12 11 26,669,781 26,567,094 26,673,637 Y 0.0001FAM118B Family with sequence similarity 118 B 11 125,604,330 125,542,228 125,606,142 0.0036KRT3 Keratin 3 12 51,469,751 51,419,584 51,468,260 0.0080GRIP1 Glutamate receptor interacting protein 1 12 65,028,656 65,476,260 65,645,501 0.0009FARP1 FERM, RhoGEF pleckstrin dom 1 13 97,593,435 97,828,590 97,921,030 0.0011STK24 Serine/threonine kinase 24 13 97,902,414 97,828,590 97,921,030 0.0011TPP2 Tripeptidyl peptidase II 13 102,047,374 102,084,815 102,182,825 0.0179FLJ40176 Hypothetical protein FLJ40176 13 102,179,718 102,084,815 102,182,825 Y 0.0179KCNK10 Potassium channel K 10 14 87,720,993 87,835,586 87,887,777 Y 0.0018CHES1 Checkpoint suppressor 1 14 88,692,274 88,783,336 88,996,264 0.0004SERPINA11 Serpin peptidase inhibitor A 11 14 93,978,554 93,969,013 94,027,467 Y 0.0027SERPINA12 Serpin peptidase inhibitor A 12 14 94,023,373 93,969,013 94,027,467 0.0027
(Continued)
186 AMERICAN JOURNAL OF MEDICAL GENETICS PART B
US and UK bipolar versus control: 20,266 of the 364,218 SNPs
analyzed in the Sklar et al. [2008] samples displayed c2 values that
corresponded to P< 0.05. Seven thousand five hundred sixty seven
of these SNPs fell into 1,165 clusters in which at least four SNPs
(within this sample) that represented each of the two array types and
lie within 25 kb of each other. Two thirds of these clustered
nominally positive SNPs lay within 7,500 bp of another nominally
positive SNP from this sample. Monte Carlo I simulation trials that
assessed the probabilities that these results were due to chance
found an average of 782 SNPs in 177 clusters and that none of
100,000 Monte Carlo I simulation trials identified as many clustered
SNPs that displayed nominally positive differences between bipolar
versus control samples as observed in this work (thus P< 0.00001).
Assessment of Chromosomal Clustering forResults From a Substance Dependence GenomeWide Association DatasetNIDA substance dependence samples [Drgon et al., manuscript in
preparation] were analyzed as previously described [Liu et al.,
2006], selecting ‘‘nominally positive SNPs’’ that displayed P values
<0.05 for comparisons between substance dependent versus con-
trol samples in European-American samples. We assessed the
extent to which nominally positive SNPs clustered together in
small chromosomal regions, such that at least four SNPs that
displayed P< 0.05 lay within 10 kb of each other. Seventy five
thousand three hundred twenty seven of the 870,000 tested auto-
somal SNPs displayed nominally significant abuser versus control
allele frequency differences (e.g., t values with P< 0.05) in these
samples. Fifteen thousand seven hundred seventy nine of these
75,327 reproducibly positive SNPs lie in 2,931 clusters. One thou-
sand three hundred four of these clusters identified 1,123 annotated
genes. None of 100,000 Monte Carlo I simulation trials observed
chromosomal clustering as marked as that observed for the true
reproducibly positive SNPs (P< 0.00001).
Assessment of Extent to Which ChromosomalClusters for Nominally Positive Results FromBipolar Disorder GWA Converge With Each Otherand Identify GenesThere was substantial convergence between the genes identified by
clustered, nominally positive SNPs for bipolar disorder. The
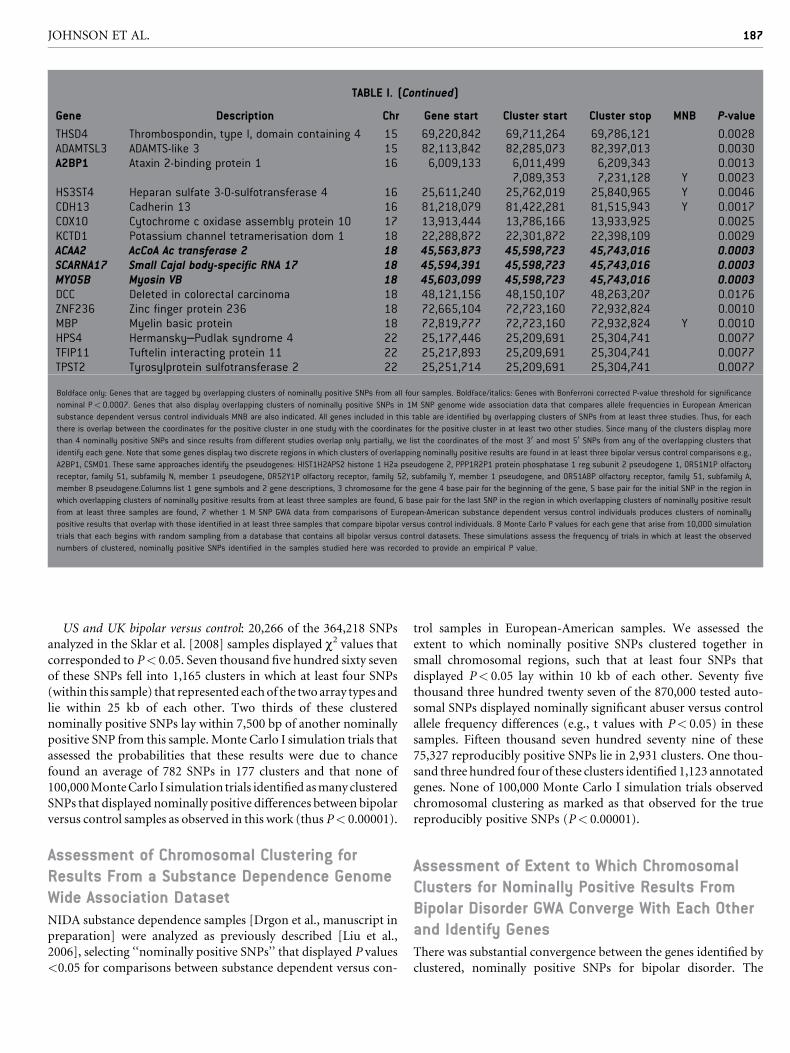
TABLE I. (Continued)
Gene Description Chr Gene start Cluster start Cluster stop MNB P-value
THSD4 Thrombospondin, type I, domain containing 4 15 69,220,842 69,711,264 69,786,121 0.0028ADAMTSL3 ADAMTS-like 3 15 82,113,842 82,285,073 82,397,013 0.0030A2BP1 Ataxin 2-binding protein 1 16 6,009,133 6,011,499 6,209,343 0.0013
7,089,353 7,231,128 Y 0.0023HS3ST4 Heparan sulfate 3-O-sulfotransferase 4 16 25,611,240 25,762,019 25,840,965 Y 0.0046CDH13 Cadherin 13 16 81,218,079 81,422,281 81,515,943 Y 0.0017COX10 Cytochrome c oxidase assembly protein 10 17 13,913,444 13,786,166 13,933,925 0.0025KCTD1 Potassium channel tetramerisation dom 1 18 22,288,872 22,301,872 22,398,109 0.0029ACAA2 AcCoA Ac transferase 2 18 45,563,873 45,598,723 45,743,016 0.0003SCARNA17 Small Cajal body-specific RNA 17 18 45,594,391 45,598,723 45,743,016 0.0003MYO5B Myosin VB 18 45,603,099 45,598,723 45,743,016 0.0003DCC Deleted in colorectal carcinoma 18 48,121,156 48,150,107 48,263,207 0.0176ZNF236 Zinc finger protein 236 18 72,665,104 72,723,160 72,932,824 0.0010MBP Myelin basic protein 18 72,819,777 72,723,160 72,932,824 Y 0.0010HPS4 Hermansky–Pudlak syndrome 4 22 25,177,446 25,209,691 25,304,741 0.0077TFIP11 Tuftelin interacting protein 11 22 25,217,893 25,209,691 25,304,741 0.0077TPST2 Tyrosylprotein sulfotransferase 2 22 25,251,714 25,209,691 25,304,741 0.0077
Boldface only: Genes that are tagged by overlapping clusters of nominally positive SNPs from all four samples. Boldface/italics: Genes with Bonferroni corrected P-value threshold for significance
nominal P< 0.0007. Genes that also display overlapping clusters of nominally positive SNPs in 1M SNP genome wide association data that compares allele frequencies in European American
substance dependent versus control individuals MNB are also indicated. All genes included in this table are identified by overlapping clusters of SNPs from at least three studies. Thus, for each
there is overlap between the coordinates for the positive cluster in one study with the coordinates for the positive cluster in at least two other studies. Since many of the clusters display more
than 4 nominally positive SNPs and since results from different studies overlap only partially, we list the coordinates of the most 30 and most 50 SNPs from any of the overlapping clusters that
identify each gene. Note that some genes display two discrete regions in which clusters of overlapping nominally positive results are found in at least three bipolar versus control comparisons e.g.,
A2BP1, CSMD1. These same approaches identify the pseudogenes: HIST1H2APS2 histone 1 H2a pseudogene 2, PPP1R2P1 protein phosphatase 1 reg subunit 2 pseudogene 1, OR51N1P olfactory
receptor, family 51, subfamily N, member 1 pseudogene, OR52Y1P olfactory receptor, family 52, subfamily Y, member 1 pseudogene, and OR51A8P olfactory receptor, family 51, subfamily A,
member 8 pseudogene.Columns list 1 gene symbols and 2 gene descriptions, 3 chromosome for the gene 4 base pair for the beginning of the gene, 5 base pair for the initial SNP in the region in
which overlapping clusters of nominally positive results from at least three samples are found, 6 base pair for the last SNP in the region in which overlapping clusters of nominally positive result
from at least three samples are found, 7 whether 1 M SNP GWA data from comparisons of European-American substance dependent versus control individuals produces clusters of nominally
positive results that overlap with those identified in at least three samples that compare bipolar versus control individuals. 8 Monte Carlo P values for each gene that arise from 10,000 simulation
trials that each begins with random sampling from a database that contains all bipolar versus control datasets. These simulations assess the frequency of trials in which at least the observed
numbers of clustered, nominally positive SNPs identified in the samples studied here was recorded to provide an empirical P value.
JOHNSON ET AL. 187

69 genes identified by overlapping clusters of>4 nominally positive
SNPs from at least three of four bipolar versus control comparisons
(Table I) were accompanied by identification of five annotated
pseudogenes (Table I legend). Five of the 69 genes were identified by
overlapping clusters of nominally positive SNPs from all four
samples (Table I, boldface). Two of the 69 genes were identified
by two sites that are separated from each other by >25 kb but that
each contain clusters of nominally positive SNPs from three of the
four bipolar versus control comparisons. None of 100,000 Monte
Carlo II simulation trials identified chance overlaps as significant as
those noted in actual data for the clustered positive SNPs for at least
three of the bipolar versus control comparisons (thus, P< 0.00001).
This degree of overall convergence between these samples, assessed
in the ways that we have approached it herein, is thus virtually never
identified by chance.
In addition to the data estimating the significance of the overall
overlaps between the results noted here, we can use Monte Carlo III
methods to estimate the relative significance of the clustered
nominally positive results within individual genes (Table I). We
obtain substantial levels of nominal significance for many of these
69 genes. However, these levels of significance become more modest
when corrected for the 69 repeated comparisons implicit in gene-
by-gene analyses. Following ‘‘conservative’’ Bonferroni correc-
tions, data from the overlapping clusters of repeatedly, nominally
positive SNPs that identify semaphorin 5A, C6orf85, the proteo-
some subunit b 9, collagen type XI a 2, tubby-like protein 4,
collagen XXVIII a 1, cub and sushi domains 1, solute carrier family
5, member 12, checkpoint suppressor 1 and the clustered genes
acetyl co A acetyl transferase 2/small Cajal body-specific RNA 17/
myosin VB retain corrected P values <0.05 (nominal P< 0.0007;
boldfaced italics in Table I).
Assessment of Extent to Which ChromosomalClusters for Results From Bipolar Disorder GWAConverge With Chromosomal Clusters for ResultsFrom Substance Dependence GWAThere was also remarkable convergence between the genes identi-
fied by overlapping clusters of nominally positive SNPs from at least
three studies of bipolar disorder and clusters of nominally positive
SNPs from genome wide association studies of substance depen-
dence in MNB samples of self-reported European ancestry (‘‘MNB’’
in Table I). Twenty three of the 69 ‘‘bipolar’’ genes were identified in
this way. None of the 100,000 Monte Carlo II simulation trials
identified chance overlaps as significant as those noted in actual
data for comparisons between the genes identified by clustered
positive SNPs for the NIDA substance dependence versus control
comparisons and any of the four bipolar disorder versus control
comparison groups (thus, P< 0.00001).
DISCUSSION
The analyses presented in the current report provide strong support
for the extent to which multiple samples identify (1) reproducible
associations for bipolar disorder and (2) significant overlap be-
tween these data and data for substance dependence. It is important
to note that this strong evidence for the sets of genes, taken as a
whole, is accompanied by more modest evidence in support of
many of the individual genes identified here. We discuss the ways in
which these molecular genetic data provide support for observa-
tions from classical genetic and comorbidity studies, as well as the
strengths and limitations of the approaches used here to define and
document convergence.
Availability of multiple datasets that compare bipolar versus
control individuals provides us with opportunities to seek conver-
gence that are not available in any single dataset. Following initial
submission of parts of the analyses presented herein (e.g., based on
three of the four bipolar versus control datasets), several (though
not all) reports appeared that failed to identify any allele of any
single nucleotide polymorphism (SNP) (‘‘same SNP same allele’’
analysis) that was strongly associated with bipolar disorder in each
of the available bipolar versus control comparisons [Baum et al.,
2008; Gershon et al., 2008; Sklar et al., 2008]. The analytic approach
used both here and in the previously submitted manuscript is based
on assumptions that polygenic underlying genetic architectures for
vulnerabilities to bipolar disorder are likely to result in association
signals of modest strength for allelic variants at any single SNP. In
developing this approach, we hypothesized that it was likely that
other features might well confound ‘‘same SNP/same allele’’ anal-
yses. Such confounding features might include subtle differences in
patterns of linkage disequilibrium among the different samples
studied, within-locus heterogeneity of the genetic effects, between-
locus heterogeneity of the genetic effects and use of differing sets of
SNPs in the different studies. By contrast, we have used analyses that
use preplanned criteria based on clusters of nominally positive
SNPs that lie within genes. These analyses use empirical statistics
(e.g., those that do not make assumptions about underlying
distributions) to assess statistical significance at several levels, that
include: (a) at the level of the convergence of overall datasets
(Monte Carlo II) and (b) at the level of individual genes (Monte
Carlo III). Within any single sample, these approaches could simply
identify stochastic variations in haplotype frequency or methodo-
logical noise related to clusters of SNPs that were not associated with
disease vulnerability. However, replication of these observations in
multiple independent samples makes stochastic variation a much
less likely explanation for the overall group of results obtained.
‘‘True-positive’’ association signals are thus likely to be found in
genes in which multiple nearby SNPs display nominally significant
association signals in multiple samples, as we observe here.
With the current approaches, we have thus identified what
appears to be strong evidence for significant convergence of the
results of the four bipolar versus control datasets that are currently
available in the literature. It is important to stress that this strong
evidence for overall convergence contrasts with the modest evi-
dence that identifies many of the individual genes in Table I. On
statistical grounds, it is thus likely that association signals in most of
these genes will be identified in future studies of bipolar disorder
genetics, but that many will not be replicated. In this sense, the
findings from the current analyses mirror the ‘‘lack of genome wide
significance’’ conclusions of several previously reported ‘‘same
SNP/same allele’’ analyses. However, interpretation of (a1) modest
confidence in identification of individual genes in the context of
188 AMERICAN JOURNAL OF MEDICAL GENETICS PART B

(a2) strong overall evidence for overlapping results differs dramati-
cally from prior, implicit or explicit interpretation of (b1) the failure
of ‘‘same SNP/same allele’’ analyses to identify results with genome-
wide significance in (b2) the absence of the context of strong overall
evidence for overall overlapping genetics.
We can come to many of the same conclusions about the overlap
between genome wide association results for bipolar disorder, taken
as a group, with genome wide association results for an ethnically
matched substance dependence versus control comparison. A
remarkably substantial subset of the genes identified in bipolar
versus control studies are also identified in substance dependence
versus control comparisons, providing overall results that are again
virtually never identified by chance (P< 0.00001, Monte Carlo
simulations). Variants in ‘‘addiction/bipolar’’ genes that we iden-
tify are candidates to influence the brain in ways that manifest as
enhanced vulnerabilities to both substance dependence and bipolar
disorder. However, it is again important to note that even this
cumulative evidence for identification of these genes is modest,
taken individually. On statistical grounds, it is thus likely that
association signals in most of these genes will be identified in future
studies of addiction and bipolar disorder genetics, but that some
will not be replicated.
There are a number of important limitations to the current
analyses. (1) The samples employed here are based on research
volunteers and volunteers for blood donation who might not be
representative of all individuals in the general population, especially
of individuals who are less likely to volunteer. Ethical consider-
ations, however, limit many molecular genetic studies to samples of
volunteering individuals. (2) Modest but significant sample to
sample differences in diagnostic criteria, including Research Diag-
nostic and Diagnostic and Statistical Manual criteria, might well
provide ‘‘noise’’ in the current datasets. It is somewhat reassuring
that previous observations support the likelihood that RDC and
DSM criteria for bipolar disease can produce highly convergent
diagnoses [Maier et al., 1986; Sugiura et al., 1998]. (3) None of these
samples provides very high power to identify polygenic effects.
Thus, requirements that at least three out of four such samples
provide nominally significant clustered nominally positive results
are likely to substantially increase the numbers of false-negative
results, while they enhance confidence in the positive results. (4) We
have failed to identify single SNPs that display nominally positive
results in several of the bipolar disorder datasets at rates that are
significantly greater than those expected by chance. We can form
observed/expected ratios between the individual SNPs that display
nominally significant differences between bipolar and control
individuals in pairwise comparisons by multiplying the number
of SNPs studied by (0.05)2 to reflect the requirement that the same
SNP must achieve nominal significance in each of two independent
samples. When we compare the observed number of SNPs that
achieve nominal significance in each two-sample comparison to
those that would be expected, we observe: WTCCC versus NIMH
(331/245), WTCCC versus German (242/297), WTCCC versus
Sklar et al. (1387/1309), NIMH versus German (1599/1657), NIMH
versus Sklar et al. (280/199) and German versus Sklar et al. (211/
241). Only 60 SNPs display nominally positive results in three of the
four samples, fewer than would have been expected by chance. Each
of these observations supports the idea that one or more of the
abovementioned ‘‘difficulties’’ for ‘‘same SNP/same allele’’ analyses
is likely to be present in the genetic architecture of bipolar disorder
and/or in the genome wide methods used in these studies. (5) There
were overlaps among ‘‘NIHM’’ controls used as part of the com-
parison group by McMahon and colleagues with those employed by
Sklar and colleagues. While this may have contributed to the fact
that the observed/expected ratio for comparisons between the
single SNPs identified for these two samples was somewhat higher
than the ratios noted for other two sample comparisons (see above),
we do not believe that this overlap degrades the overall comparisons
to a significant extent.
There is substantial comorbidity for vulnerabilities to substance
dependence and bipolar disorder. A recent review documents that
about three quarters of patients with bipolar disorder also display a
substance use diagnosis [Krishnan, 2005]. Since both substance
dependence and bipolar disorder display substantial heritabilities
in twin studies, it was likely a priori that there would be substantial
overlap between the genetic bases of bipolar disorder and addiction
vulnerability. However, no twin data of which we are aware
previously documented heritable influences on the addiction/bi-
polar comorbidity per se. Indeed, some of the family data that
documents coaggregation of bipolar disorder and substance abuse/
dependence phenotypes has been interpreted to support some
separate segregation of these two phenotypes within pedigrees
[Preisig et al., 2001]. The current molecular genetic analyses thus
provide some of the first direct evidence for genetic bases for
portions of the elevated frequency of substance dependence that
is noted in bipolar patients.
The genes that display convergent reproducibly positive obser-
vations in genome wide association studies of addiction vulnera-
bility and of bipolar disorder represent an interesting set that can be
viewed from a number of perspectives. Products of one group
of these genes that are likely to play substantial roles in the initial
and/or plasticity-related ‘‘wiring’’ of the brain include semaphorin
5A, slit homolog 3, CUB and Sushi multiple domains, neuron
navigator 2 and cadherin 13. From one perspective, the represen-
tation of such genes is not surprising, since we have previously
emphasized the relative abundance of these genes from genome-
wide data for substance dependence in multiple samples [Liu et al.,
2005, 2006; Uhl et al., 2008a]. We and others have also identified
substantial numbers of neuronal connectivity genes when compar-
ing individuals who are more versus less successful at quitting
smoking [Uhl et al., 2007, 2008c], individuals with greater versus
smaller volumes of frontal cerebral cortex [Uhl et al., submitted],
individuals with Alzheimer’s disease versus controls, and individ-
uals with better versus poorer performance on tests of cognitive
abilities [Uhl et al., submitted]. Identifying substantial numbers of
connectivity-associated molecules whose variants alter vulnerabili-
ty to bipolar disorder supports the idea that this disorder is a likely
member of a ‘‘connectivity constellation’’ of disorders in which
differences in neuronal connectivity may play substantial roles in
the genetic contributions to individual differences in vulnerability.
Both addiction and bipolar disorder are common illnesses
[Uhl and Grow, 2004]. Identifying SNP markers whose allelic
frequencies distinguish addicts of several different ethnicities from
matched controls thus supports at least some ‘‘common disease/
common allele’’ genetic architecture [Lander and Schork, 1994] for
JOHNSON ET AL. 189

the genetics of both bipolar disorder and addiction vulnerability.
Clearly, there are also likely contributions to both addiction vul-
nerability and to bipolar disorder from genomic and environmental
features that are specific to each disorder. Nevertheless, the findings
presented here thus promise to enhance understanding of features
that are common to human addictions and bipolar disorder in ways
that could facilitate efforts to personalize prevention and treatment
strategies for these debilitating diseases.
ACKNOWLEDGMENTS
This research was supported financially by the NIH Intramural
Research Programs of NIDA and NIMH, DHSS. We are very
grateful for access to bipolar and control data generated by the
Wellcome Trust Case-Control Consortium and by Dr. Pamela Sklar
and colleagues. A full list of the WTCC investigators who contrib-
uted to the generation of the WTCCC data is available from
www.wtccc.org.uk. Funding for this project was provided by the
Wellcome Trust under award 076113. For studies of substance
dependence, we are also grateful for dedicated help with clinical
characterization of subjects from Judith Hess, Dan Lipstein, Fely
Carillo and other Johns Hopkins-Bayview support staff.
REFERENCES
Baum AE, Akula N, Cabanero M, Cardona I, Corona W, Klemens B,Schulze TG, Cichon S, Rietschel M, Nothen MM, et al. 2007. A genome-wide association study implicates diacylglycerol kinase eta (DGKH) andseveral other genes in the etiology of bipolar disorder. Mol Psychiatry2:197–207.
Baum AE, Hamshere M, Green E, Cichon S, Rietschel M, Noethen MM,Craddock N, McMahon FJ. 2008. Meta-analysis of two genome-wideassociation studies of bipolar disorder reveals important points ofagreement. Mol Psychiatry 13(5):466–467.
Biederman J, Faraone SV, Wozniak J, Monuteaux MC. 2000. Parsing theassociation between bipolar, conduct, and substance use disorders: Afamilial risk analysis. Biol Psychiatry 48(11):1037–1044.
Bierut LJ, Madden PA, Breslau N, Johnson EO, Hatsukami D, PomerleauOF, Swan GE, Rutter J, Bertelsen S, Fox L, et al. 2007. Novel genesidentified in a high-density genome wide association study for nicotinedependence. Hum Mol Genet 16(1):24–35.
Ferreira MA, O’Donovan MC, Meng YA, Jones IR, Ruderfer DM, Jones L,Fan J, Kirov G, Perlis RH, Green EK, et al. 2008. Collaborative genome-wide association analysis supports a role for ANK3 and CACNA1C inbipolar disorder. Nat Genet. [Epub ahead of print].
Gershon ES, Liu C, Badner JA. 2008. Genome-wide association in bipolar.Mol Psychiatry 13(1):1–2.
Johnson C, Drgon T, Liu QR, Walther D, Edenberg H, Rice J, Foroud T,Uhl GR. 2006. Pooled association genome scanning for alcohol depen-dence using 104,268 SNPs: Validation and use to identify alcoholismvulnerability loci in unrelated individuals from the collaborative studyon the genetics of alcoholism. Am J Med Genet Part B 141B(8):844–853.
Krishnan KR. 2005. Psychiatric and medical comorbidities of bipolardisorder. Psychosom Med 67(1):1–8.
Lander ES, Schork NJ. 1994. Genetic dissection of complex traits. Science265(5181):2037–2048.
Liu QR, Drgon T, Walther D, Johnson C, Poleskaya O, Hess J, Uhl GR. 2005.Pooled association genome scanning: Validation and use to identifyaddiction vulnerability loci in two samples. Proc Natl Acad Sci USA102(33):11864–11869.
Liu QR, Drgon T, Johnson C, Walther D, Hess J, Uhl GR. 2006. Addictionmolecular genetics: 639,401 SNP whole genome association identifiesmany ‘‘cell adhesion’’ genes. Am J Med Genet Part B 141B(8):918–925.
Maier W, Philipp M, Buller R, Benkert O. 1986. Sources of disagreementbetween clinical (ICD-9) and operational (RDC, DSM-III) diagnosisof endogenous depression (melancholia). J Affect Disord 11(3):235–243.
McQueen MB, Devlin B, Faraone SV, Nimgaonkar VL, Sklar P, Smoller JW,Abou Jamra R, Albus M, Bacanu SA, Baron M, et al. 2005. Combinedanalysis from eleven linkage studies of bipolar disorder provides strongevidence of susceptibility loci on chromosomes 6q and 8q. Am J HumGenet 77(4):582–595.
Persico AM, Bird G, Gabbay FH, Uhl GR. 1996. D2 dopamine receptor geneTaqI A1 and B1 restriction fragment length polymorphisms: Enhancedfrequencies in psychostimulant-preferring polysubstance abusers. BiolPsychiatry 40(8):776–784.
Preisig M, Fenton BT, Stevens DE, Merikangas KR. 2001. Familial rela-tionship between mood disorders and alcoholism. Compr Psychiatry42(2):87–95.
Shih RA, Belmonte PL, Zandi PP. 2004. A review of the evidence fromfamily, twin and adoption studies for a genetic contribution to adultpsychiatric disorders. Int Rev Psychiatry 16(4):260–283.
Sklar P, Smoller JW, Fan J, Ferreira MA, Perlis RH, Chambert K, Nim-gaonkar VL, McQueen MB, Faraone SV, Kirby A, et al. 2008. Whole-genome association study of bipolar disorder. Mol Psychiatry13(6):558–569.
Sugiura T, Hasui C, Aoki Y, Sugawara M, Tanaka E, Sakamoto S, KitamuraT. 1998. Japanese psychology students as psychiatric diagnosticians:Application of criteria of mood and anxiety disorders to written casevignettes using the RDC and DSM-IV. Psychol Rep 82(3Pt 1): 771–781.
Uhl GR, Grow RW. 2004. The burden of complex genetics in braindisorders. Arch Gen Psychiatry 61(3):223–229.
Uhl GR, Liu QR, Walther D, Hess J, Naiman D. 2001. Polysubstance abuse-vulnerability genes: Genome scans for association, using 1,004 subjectsand 1,494 single-nucleotide polymorphisms. Am J Hum Genet 69(6):1290–1300.
Uhl GR, Liu QR, Drgon T, Johnson C, Walther D, Rose JE. 2007. Moleculargenetics of nicotine dependence and abstinence: Whole genome associa-tion using 520,000 SNPs. BMC Genet 8:10.
Uhl GR, Drgon T, Johnson C, Fatusin OO, Liu QR, Contoreggi C, Li CY,Buck K, Crabbe J. 2008a. Higher order addiction molecular genetics:Convergent data from genome-wide association in humans and mice.Biochem Pharmacol 75:98–111.
Uhl GR, Drgon T, Liu QR, Johnson C, Walther D, Komiyama T, Harano M,Sekine Y, Inada T, Ozaki N, Iyo M, Iwata N, Yamada M, Sora I, Chen CK,Liu HC, Ujike H, Lin SK. 2008b. Genome-wide association for metham-phetamine dependence: Convergent results from two samples. Arc GenPsychiatry 65:345–355.
Uhl GR, Liu QR, Drgon T, Johnson C, Walther D, Rose JE, David SP, NiauraR, Lerman C. 2008c. Molecular genetics of successful smoking cessation:Convergent genome-wide association results. Arch Gen Psychiatry65:683–693.
WellcomeTrustConsortium. 2007. Genome-wide association study of14,000 cases of seven common diseases,3,000 shared controls. Nature447(7145):661–678.
190 AMERICAN JOURNAL OF MEDICAL GENETICS PART B