Embed Size (px)
Citation preview

Controlling Airport-Related AirPollution
Prepared byNortheast States for Coordinated Air Use Management
andCenter for Clean Air Policy
June 2003
ii
Members of Northeast States for Coordinated Air Use Management
Anne Gobin, Acting Bureau ChiefConnecticut Department of Environmental Protection, Bureau of Air Management
James P. Brooks, Bureau DirectorMaine Department of Environmental Protection, Bureau of Air Quality
Barbara Kwetz, Deputy Director of Air ProgramsMassachusetts Department of Environmental Protection, Bureau of Waste Prevention
Robert Scott, Acting DirectorNew Hampshire Department of Environmental Services, Air Resources Division
William O’Sullivan, AdministratorNew Jersey Department of Environmental Protection, Office of Air Quality Management
David Shaw, Acting DirectorNew York Department of Environmental Conservation, Division of Air Resources
Stephen Majkut, ChiefRhode Island Department of Environmental Management, Office of Air Resources
Richard A. Valentinetti, DirectorVermont Department of Environemnetal Conservation, Air Pollution Control Division
Kenneth A. Colburn, Executive DirectorNortheast States for Coordinated Air Use Management
iii
Center for Clean Air Policy Board Members
Governor Tony Earl*Quarles & Brady
Chairman
Commissioner Robert C. Shinn, Jr.*S2 ConceptsVice-Chair
Ned HelmeCenter for Clean Air Policy
Executive Director
Commissioner Bradley CampbellNJ Department of Environmental Protection
Frank CassidyPSEG Power
E. Donald ElliotPaul Hastings/Yale Law School
David Hawkins, Senior AttorneyNatural Resources Defense Council
Dr. Mark LevineLawrence Berkeley Laboratory
Jim Maddy,* PresidentNational Park Foundation
Andy T. Mangan, Executive DirectorApplied Sustainability
Dr. Bert MenzNetherlands National Institute of PublicHealth and the Environment
Senator Gaylord Nelson**The Wilderness Society
Secretary Mary D. NicholsThe Resources Agency of California
D. Louis Peoples
William Rosenberg, PresidentE3 Ventures
Ron RussellRussell & Russell, PC
Conrad SchneiderClean Air Task Force
Ron Sims, ExcutiveKing County Government
Victoria J. Tschinkel*Landers and Parsons
* Executive Committee members** Member Emeritus

iv
Controlling Airport-Related Air Pollution
Northeast States for Coordinated Air Use Management(NESCAUM)
and
Center for Clean Air Policy(CCAP)
Coralie Cooper (NESCAUM)Dave Park (NESCAUM)Jake Schmidt (CCAP)
Ingrid Ulbrich (NESCAUM)Steve Winkelman (CCAP)
EditorsRobert Ghisolfi (CCAP)
Arthur Marin (NESCAUM)Marika Tatsutani (NESCAUM)
Ingrid Ulbrich (NESCAUM)Leah Weiss (NESCAUM)
June 2003
vi
Acknowledgments
NESCAUM gratefully acknowledges the funding support provided by the United StatesEnvironmental Protection Agency.
CCAP would like to thank the following organizations whose financial contributions havemade this report possible: the United States Environmental Protection Agency and the GermanMarshal Fund-U.S.
This report was a joint effort between staff at NESCAUM and CCAP. NESCAUM is anassociation of the eight northeast state air pollution control programs. NESCAUM providestechnical guidance and policy advice to its member states. The Center for Clean Air Policy seeks topromote and implement innovative solutions to major environmental and energy problems. Throughefforts at the state, federal, and international levels, the Center emphasizes the need for cost-effective, pragmatic, and comprehensive long-term solutions.
NESCAUM and CCAP would like to acknowledge the contributions provided by severalindividuals who were not listed as authors. Dan Meszler (EEA) developed the emissions models foraircraft and GSE and provided input for the control measures chapter. Kenneth Resnik, Esq. drafteda memo that served as the basis for much of the discussion in Chapter 5. Lindsay Kiefer, an internwith the Center, assisted in the research on many portions of this report.
The draft version of this report was sent to a wide list of peer reviewers, including federalagencies (such as EPA, FAA, and NASA), numerous State and Local governments, industryrepresentatives (engine manufacturers, airline organizations, and airport operators), technicalconsultants, and environmental organizations. NESCAUM and CCAP also thank the followingindividuals for providing comments on the draft report:
Frederick Civian, Massachusetts Department of Environmental ProtectionCarolyn Cunningham, National Resources Defense CouncilBetty Derosiers, MassportTim Johnson, Aviation Environment FederationBrian Hug, Maryland Department of the EnvironmentTonalee Key, New Jersey Department of Environmental ProtectionJim Lerner, California Air Resources BoardBryan Manning, US EPAKevin McGarry, New York Department of Environmental ConservationBeatrice Schell, European Federation for Transportation and Environment (T&E)David Stonefield, US EPAChris Trostle, Pennsylvania Bureau of Air QualityIan Waitz, Massachusetts Institute of TechnologySandy Webb, The Environmental Consulting Group, LLCChowen Wey, US NASAArt Williams, Jefferson County (KY) Air Pollution Control District
vii
Table of Contents
Acknowledgments ............................................................................................................................... viExecutive Summary.........................................................................................................................ES-1I. Introduction................................................................................................................................. I-1
A. Overview................................................................................................................................. I-1B. Study Design and Goals.......................................................................................................... I-6C. Impact of Airport-Related Emissions on Public Health and the Environment....................... I-6
C.1 Sources, Levels and Trends in Airport Emissions.............................................................. I-6C.2 Public Health Impacts....................................................................................................... I-10C.3 Environmental Impacts..................................................................................................... I-11
II. Emission Inventories for Three Northeast Airports...................................................................II-1A. Overview................................................................................................................................II-1
A.1 Characteristics of the Airports of Study ............................................................................II-2B. Aircraft Emissions .................................................................................................................II-5
B.1 Methodology......................................................................................................................II-7B.2 Aircraft Emission Results ................................................................................................II-11B.3 Discussion........................................................................................................................II-18
C. Auxiliary Power Unit Inventory and Method......................................................................II-20C.1 Methodology....................................................................................................................II-21C.2 Results .............................................................................................................................II-21C.3 Discussion........................................................................................................................II-22
D. Ground Service Equipment (GSE) Inventory and Method..................................................II-23D.1 Background......................................................................................................................II-23D.2 GSE Emissions Inventory Model ....................................................................................II-24D.3 Emission Modeling Results .............................................................................................II-32
E. Conclusions .........................................................................................................................II-37III. Technical and Operational Measures for Reducing Airport Emissions .................................. III-1
A. Introduction.......................................................................................................................... III-1B. Options for Reducing Aircraft Emissions............................................................................ III-1
B.1 Technology Options......................................................................................................... III-1B.2 Operational Options......................................................................................................... III-7
C. Options for Reducing Ground Support Equipment (GSE) Emissions............................... III-12C.1 Technology Options for Reducing GSE Emissions ...................................................... III-12
D. Options for Reducing Emissions from Ground Access Vehicles (GAV).......................... III-22D.1 Technology Options....................................................................................................... III-22D.2 Operational Options....................................................................................................... III-24
E. Replacing Short-Haul Air Travel with Rail Service.......................................................... III-26E.1 Amtrak/Acela Express Train Service in the Northeast U.S........................................... III-26E.2 Germany ........................................................................................................................ III-27E.3 France ............................................................................................................................ III-27
F. Conclusions ....................................................................................................................... III-28
viii
IV. Policy Strategies for Reducing Airport Emissions .................................................................. IV-1A. Overview.............................................................................................................................. IV-1B. Policy Options ..................................................................................................................... IV-1
B.1 Emissions Standards ........................................................................................................ IV-1B.2 Activity Limits................................................................................................................. IV-5B.3 Cap-and-Trade or “Bubble” Programs ............................................................................ IV-5B.4 Fee-Based Programs ........................................................................................................ IV-8B.5 Innovative Regulatory Strategies for Reducing GSE and GAV Fleet Emissions ......... IV-10B.6 High-Speed Rail Service................................................................................................ IV-11B.7 Reduced Passenger Private Vehicle Trips to and from the Airport............................... IV-12
C. Case Studies....................................................................................................................... IV-13C.1 Logan International Airport: Voluntary Emissions Limit ............................................. IV-14C.2 Dallas/Ft. Worth and Houston Airports: GSE Voluntary Agreement ........................... IV-16C.3 California South Coast: Program to Reduce Aviation Emissions ................................. IV-18C.4 Sacramento International Airport: Targeted efforts at various airport sources ............. IV-19C.5 Switzerland: engine emissions charge and airport emissions goal................................ IV-21C.6 Sweden: engine emissions charge ................................................................................. IV-24
V. Statutory and Regulatory Opportunities and Constraints ......................................................... V-1A. Overview............................................................................................................................... V-1B. Statutory and Regulatory Policies Surrounding State Action............................................... V-1
B.1 International Law.............................................................................................................. V-1B.2 U.S. Law ........................................................................................................................... V-5
C. Opportunities for State Actions .......................................................................................... V-10C.1 Brief Review of Preemption Doctrine ............................................................................ V-11C.2 State Regulation of Ground-Level Operation of Aircraft............................................... V-11C.3 Regulations on the Number of Operations at Airports ................................................... V-16C.4 Limiting Flight Procedures ............................................................................................. V-16C.5 Controls on Types of Planes Using the Airport.............................................................. V-16C.6 State Petition................................................................................................................... V-17C.7 State Limits on Emissions from Ground Support Equipment (GSE) ............................. V-17C.8 Regulation of Ground Access Vehicles.......................................................................... V-20C.9 Landing Fees................................................................................................................... V-21C.10 Regulation of “Airport Bubbles” ............................................................................... V-25C.11 Other Opportunities for State Involvement ................................................................ V-26
D. Summary............................................................................................................................. V-27D.1 Aircraft............................................................................................................................ V-27D.2 Ground Service Equipment............................................................................................. V-27D.3 Ground Access Vehicles................................................................................................. V-28D.4 Emissions-based Fees ..................................................................................................... V-28D.5 Airport “Bubbles”........................................................................................................... V-28
VI. Conclusions ............................................................................................................................. VI-1A. Overview.............................................................................................................................. VI-1B. Emission Inventories ........................................................................................................... VI-1C. Technical and Operational Control Measures ..................................................................... VI-2

ix
D. Policy Approaches ............................................................................................................... VI-3E. Legal .................................................................................................................................... VI-4F. Recommendations................................................................................................................ VI-5
ReferencesAppendix AAppendix BAppendix C
x
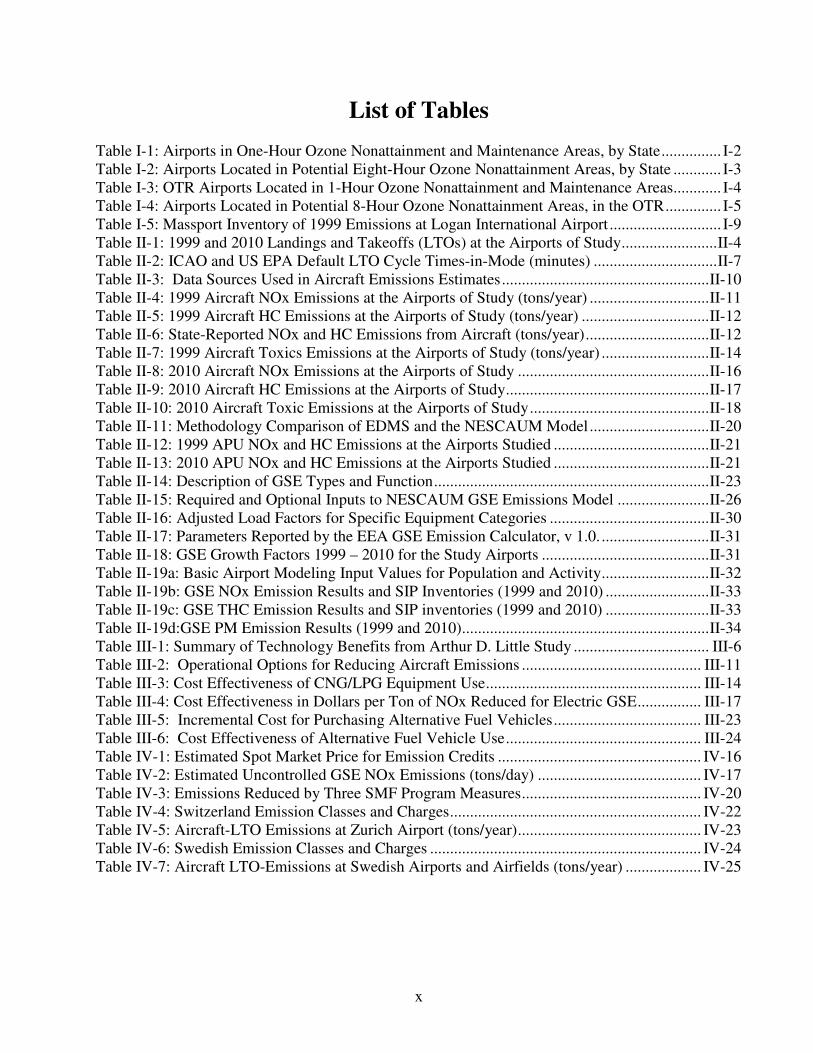
List of TablesTable I-1: Airports in One-Hour Ozone Nonattainment and Maintenance Areas, by State............... I-2Table I-2: Airports Located in Potential Eight-Hour Ozone Nonattainment Areas, by State ............ I-3Table I-3: OTR Airports Located in 1-Hour Ozone Nonattainment and Maintenance Areas............ I-4Table I-4: Airports Located in Potential 8-Hour Ozone Nonattainment Areas, in the OTR.............. I-5Table I-5: Massport Inventory of 1999 Emissions at Logan International Airport ............................ I-9Table II-1: 1999 and 2010 Landings and Takeoffs (LTOs) at the Airports of Study........................II-4Table II-2: ICAO and US EPA Default LTO Cycle Times-in-Mode (minutes) ...............................II-7Table II-3: Data Sources Used in Aircraft Emissions Estimates....................................................II-10Table II-4: 1999 Aircraft NOx Emissions at the Airports of Study (tons/year) ..............................II-11Table II-5: 1999 Aircraft HC Emissions at the Airports of Study (tons/year) ................................II-12Table II-6: State-Reported NOx and HC Emissions from Aircraft (tons/year)...............................II-12Table II-7: 1999 Aircraft Toxics Emissions at the Airports of Study (tons/year) ...........................II-14Table II-8: 2010 Aircraft NOx Emissions at the Airports of Study ................................................II-16Table II-9: 2010 Aircraft HC Emissions at the Airports of Study...................................................II-17Table II-10: 2010 Aircraft Toxic Emissions at the Airports of Study.............................................II-18Table II-11: Methodology Comparison of EDMS and the NESCAUM Model..............................II-20Table II-12: 1999 APU NOx and HC Emissions at the Airports Studied .......................................II-21Table II-13: 2010 APU NOx and HC Emissions at the Airports Studied .......................................II-21Table II-14: Description of GSE Types and Function.....................................................................II-23Table II-15: Required and Optional Inputs to NESCAUM GSE Emissions Model .......................II-26Table II-16: Adjusted Load Factors for Specific Equipment Categories ........................................II-30Table II-17: Parameters Reported by the EEA GSE Emission Calculator, v 1.0. ...........................II-31Table II-18: GSE Growth Factors 1999 – 2010 for the Study Airports ..........................................II-31Table II-19a: Basic Airport Modeling Input Values for Population and Activity...........................II-32Table II-19b: GSE NOx Emission Results and SIP Inventories (1999 and 2010) ..........................II-33Table II-19c: GSE THC Emission Results and SIP inventories (1999 and 2010) ..........................II-33Table II-19d:GSE PM Emission Results (1999 and 2010)..............................................................II-34Table III-1: Summary of Technology Benefits from Arthur D. Little Study .................................. III-6Table III-2: Operational Options for Reducing Aircraft Emissions ............................................. III-11Table III-3: Cost Effectiveness of CNG/LPG Equipment Use...................................................... III-14Table III-4: Cost Effectiveness in Dollars per Ton of NOx Reduced for Electric GSE................ III-17Table III-5: Incremental Cost for Purchasing Alternative Fuel Vehicles..................................... III-23Table III-6: Cost Effectiveness of Alternative Fuel Vehicle Use................................................. III-24Table IV-1: Estimated Spot Market Price for Emission Credits ................................................... IV-16Table IV-2: Estimated Uncontrolled GSE NOx Emissions (tons/day) ......................................... IV-17Table IV-3: Emissions Reduced by Three SMF Program Measures............................................. IV-20Table IV-4: Switzerland Emission Classes and Charges............................................................... IV-22Table IV-5: Aircraft-LTO Emissions at Zurich Airport (tons/year).............................................. IV-23Table IV-6: Swedish Emission Classes and Charges .................................................................... IV-24Table IV-7: Aircraft LTO-Emissions at Swedish Airports and Airfields (tons/year) ................... IV-25
xi
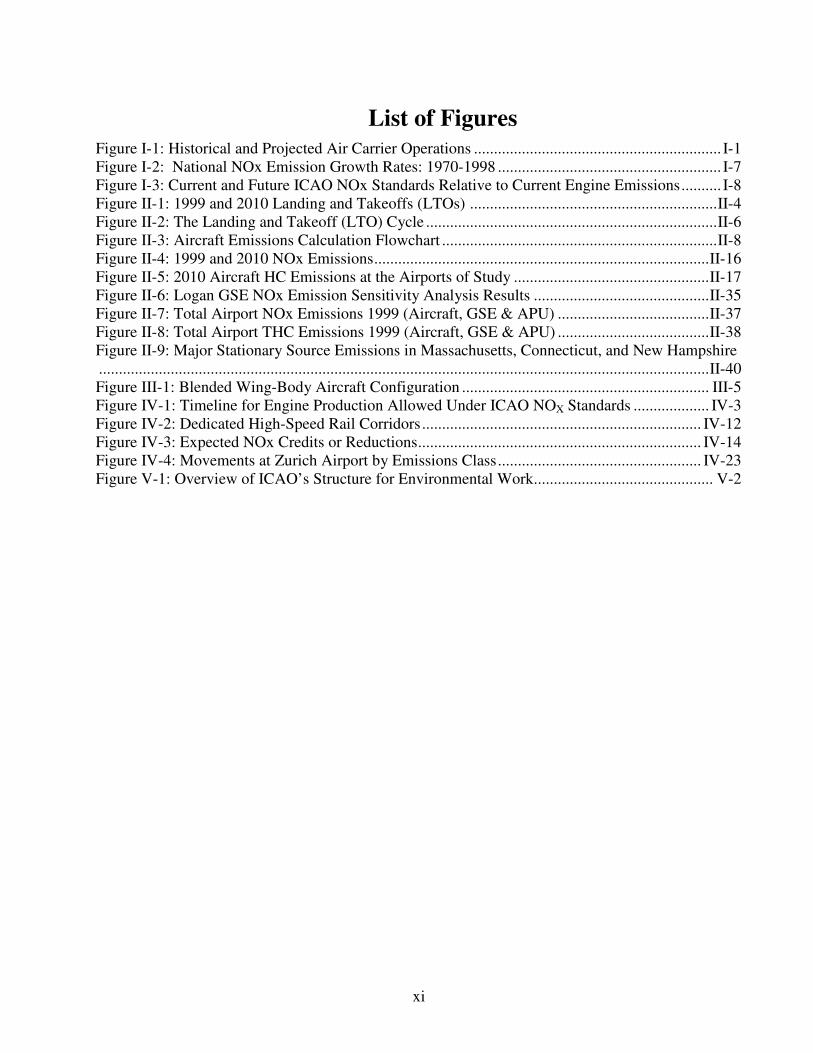
List of FiguresFigure I-1: Historical and Projected Air Carrier Operations .............................................................. I-1Figure I-2: National NOx Emission Growth Rates: 1970-1998 ........................................................ I-7Figure I-3: Current and Future ICAO NOx Standards Relative to Current Engine Emissions.......... I-8Figure II-1: 1999 and 2010 Landing and Takeoffs (LTOs) ..............................................................II-4Figure II-2: The Landing and Takeoff (LTO) Cycle .........................................................................II-6Figure II-3: Aircraft Emissions Calculation Flowchart .....................................................................II-8Figure II-4: 1999 and 2010 NOx Emissions....................................................................................II-16Figure II-5: 2010 Aircraft HC Emissions at the Airports of Study .................................................II-17Figure II-6: Logan GSE NOx Emission Sensitivity Analysis Results ............................................II-35Figure II-7: Total Airport NOx Emissions 1999 (Aircraft, GSE & APU) ......................................II-37Figure II-8: Total Airport THC Emissions 1999 (Aircraft, GSE & APU) ......................................II-38Figure II-9: Major Stationary Source Emissions in Massachusetts, Connecticut, and New Hampshire.........................................................................................................................................................II-40Figure III-1: Blended Wing-Body Aircraft Configuration .............................................................. III-5Figure IV-1: Timeline for Engine Production Allowed Under ICAO NOX Standards ................... IV-3Figure IV-2: Dedicated High-Speed Rail Corridors...................................................................... IV-12Figure IV-3: Expected NOx Credits or Reductions....................................................................... IV-14Figure IV-4: Movements at Zurich Airport by Emissions Class................................................... IV-23Figure V-1: Overview of ICAO’s Structure for Environmental Work............................................. V-2

xii
ES-1
Executive Summary
This report was undertaken by the Northeast States for Coordinated Air Use Management(NESCAUM) and the Center for Clean Air Policy (CCAP) as part of an effort to assist policymakersat the national, state, and local levels in better understanding the contribution of the aviation sector toair pollution problems and in developing control options for reducing airport-related emissions.
Airport-related activities result in the emission of a host of air pollutants that adversely affectpublic health and the environment, including nitrogen oxides (NOx), hydrocarbons (HC), particulate(PM), carbon monoxide (CO), and toxics. NOx and HC are precursor emissions of ground-levelozone, which causes lung irritation and aggravates diseases such as asthma, chronic bronchitis, andemphysema. Particulates have adverse cardiopulmonary effects and contribute to regionalenvironmental problems such as haze and acid rain. Toxics such as benzene and formaldehyde areknown or probable human carcinogens. Nationally, the number of aircraft operations (defined as onetakeoff or one landing) has grown substantially from around 15 million in 1976 to almost 30 millionin 2000, a cumulative growth of about 105 percent. While emissions from most source sectors aredeclining due to the implementation of more stringent control programs, the growth in air travel1 andthe continued lack of federal control programs for aircraft engines is resulting in increased pollutionfrom airports. States in non-attainment of criteria pollutant National Ambient Air Quality Standards(NAAQS) are required by federal law to reduce ambient levels of these pollutants. Given theexistence of stringent control programs for other industry sectors, reductions in airport-related airpollution are necessary in order for states to lower emissions to meet air quality and public healthgoals. Absent control measures to reduce airport-related emissions, further emissions reductionsfrom other sectors will be needed in order for states to attain air quality requirements.
The study involved: (1) quantifying airport-related emissions for three Northeast airports; (2)assessing control options; (3) outlining various policy options for achieving cost-effectivereductions; and (4) outlining and assessing legal opportunities and barriers to actions by states. Thisreport contains six chapters. Chapter I introduces the issue and describes the study. Chapter IIpresents the results of the emission inventory assessment for several airports in the Northeast andexplains the methodology NESCAUM used. The inventory includes non-military aircraft, auxiliarypower units (APU), and ground service equipment (GSE). Stationary source emissions were notestimated. Chapter III is an assessment of technological and operational control options for varioussources of emissions at airports. Chapter IV highlights policy options available to reduce airport-related emissions and provides case studies of approaches currently in place or proposed in the U.S.and abroad. Chapter V evaluates and summarizes statutory and regulatory options and constraintswith regard to controlling airport-related pollution. Chapter VI summarizes the findings andrecommendations of the study.
1 FAA’s revised Terminal Air Forecast shows that national aircraft operations will increase by about 1 percent per yearfrom 2000 to 2020. Recent analysis by ICAO’s Forecasting and Economic Analysis Support Group (FESG) predictsworldwide growth of 4.3 percent per year between 2000 and 2020 (FESG, Report of the FESG/CAEP/6 Traffic and FleetForecast, 2003).
ES-2
A. Emissions Inventories for Three Selected Airports
• In aggregate, aircraft at Logan International Airport (Boston, MA), Bradley InternationalAirport (Windsor Locks, CT), and Manchester Airport (Manchester, NH) emitted 3,538 tonsof NOx, 4,461 tons of CO, and 700 tons of HC in 1999. Combined aircraft-related emissionsof benzene totaled 20 tons at Logan, Bradley, and Manchester in 1999. For comparison,aggregate benzene emissions from the largest stationary sources in Massachusetts,Connecticut, and New Hampshire combined totaled six tons in 1996.2
• At the three airports studied, 85 percent of airport NOx emissions are from aircraft. Ofaircraft emissions, air carriers contribute the majority of the NOx. In 1999, air taxioperations contributed one-third of aircraft-related HC emissions and air carrier operationscontributed two-thirds.3
• Auxiliary power units and ground service equipment combined account for approximately 15percent of aviation-related NOx emissions at the three airports studied.
• Significant increases in airport operations are predicted over the next decade at airports in theNortheast region. Aircraft operations are projected to grow by 8 percent at Logan, 30 percentat Bradley, and 14 percent at Manchester over the next ten years.4
• Regionalization, or the shift in traffic from larger to smaller airports, will cause rapidexpansion at smaller airports over the next decade in the Northeast.
B. Control Options
• In the long term, cost effective options to reduce fuel consumption and criteria pollutantsfrom aircraft engines are technically feasible; an example of such options is aerodynamicaircraft bodies.
• Aircraft operational changes such as single engine taxi and reduced use of reverse thrust(used at the pilot’ s discretion) cost little or nothing to implement and provide fuel-usesavings and emissions reductions.
• Electrification of ground support equipment provides reductions in all pollutants, and cansave the airport operators and air carriers money over the long term due to the increasedefficiency of electric motors compared to gasoline and diesel engines.
2 EPA Office of Air Quality Planning and Standards, http://www.epa.gov/air/data/ Geographic Area Report from NTI’ sFacilities Emissions Data, February 15, 2001.3 Aircraft are generally grouped into four categories: air carriers, air taxis, general aviation, and military. Thesedenominations are based on the operator of the aircraft, not on the aircraft themselves. Air carriers own and operate atleast one aircraft that seats at least 60 passengers or has a payload of at least 18,000 pounds. Air carriers may also ownsmaller aircraft, but their landings and takeoffs (LTOs) are reported with those of the larger aircraft. Air taxis operatesmaller certified aircraft as defined in 14 CFR Part 298. Air taxis usually fly short routes and are considered regional orshuttle carriers. General aviation includes small planes that are usually privately owned or belong to corporations.4 Aircraft activity after September 11, 2001 decreased dramatically. However, Federal Aviation Administration (FAA)forecasts for growth in the number of landings and takeoffs have not changed and thus aircraft activity is expected toreturn to pre-9/11 rates within a few years.
ES-3
• Gate electrification is one of the most cost-effective options examined in this study. Gateelectrification in some cases provides a cost benefit within two years of installation.
• Operation of factory-built, dedicated compressed natural gas (CNG) and liquid propane gas(LPG) ground service equipment reduce emissions of NOx, HC, CO, and PM relative togasoline and diesel-powered equipment. Conversions from diesel or gasoline to CNG/LPGprovide NOx and PM reductions but can sometimes increase HC and CO emissions.
• A federal program called the Federal Aviation Administration’ s Inherently Low-EmissionAirport Vehicle Pilot Program (ILEAV) provides financial incentives for airports to reduceemissions by introducing clean alternative fuel ground service and ground access vehiclesinto fleets. A total of ten airports have been selected to receive funding.
C. Policy Options
• A variety of regulatory and policy options exist for states, localities, and airport operators tocontrol airport-related emissions. Innovative programs have been initiated at many airportsaround the world.
• While emission standards are in place for aircraft engines, most engines currently inproduction emit NOx at levels below the national standards. Efforts at the national andinternational levels to increase the stringency of engine emission standards could play a rolein reducing air pollution from aviation and in driving technology development.
• “ Cap-and-trade” or airport “ bubble” approaches have the potential to limit airport-relatedemissions, provide flexibility in achieving reductions, and encourage the use anddevelopment of cleaner technologies. The operators of Logan Airport (Massport) haveestablished a cap on airport emissions; any emissions increases that result from airportactivity must be offset by on-airport emission reductions, reductions near the airport, or bypurchasing emission credits.
• Fee-based strategies, such as increased or variable landing fees, are another potentially usefultool that officials at the state, local, and airport level can use to reduce emissions. Variableaircraft landing fees are have been implemented at Zurich and Geneva Airports inSwitzerland, and at nineteen airports in Sweden. The fees are emissions-based and result in agreater charge being levied on higher polluting aircraft entering those airports.
• Regulatory approaches such as 1) promoting or requiring the purchase of cleaner alternativeswhen fleet vehicles or equipment are replaced or added; and 2) developing a declining fleetemissions target can be utilized to achieve emissions reductions from ground serviceequipment and ground access vehicles.
• Emission reductions can also be achieved through voluntary agreements. Currently, states,the airline industry, the US EPA, the FAA, environmental groups and others are discussing avoluntary national program to reduce airport-related emissions.
ES-4
• Voluntary agreements at the local level are also possible to reduce emissions from aircraftground activities (taxi and gate operation), ground service equipment, ground accessvehicles, and stationary sources. A voluntary agreement has been reached at airports in theDallas-Forth Worth and Houston areas of Texas, where the airlines have agreed to reduceNOX emissions from ground service equipment. A similar program is being developed forairports in southern California.
D. Regulatory Context
• The International Civil Aviation Organization (ICAO) and its Committee on Aviation andEnvironmental Protection (CAEP) seek to coordinate the development of consistentinternational standards for aircraft engines.
• US EPA is required by Section 231 of the Clean Air Act Amendments of 1990 to regulateaircraft engine emissions and has generally adopted the standards recommended by ICAO asthe applicable federal standards in the U.S.
• The Clean Air Act provides states with some authority to require emissions reductions atairports, although legal barriers constrain this authority.
• States (within narrow confines) could impose controls on ground operation of aircraft.Regulations that do not impact safety and the movement of aircraft are most likely to avoidpreemption.
• States may petition EPA to control aircraft engine emissions to more stringent standards.The Administrative Procedure Act provides that “ interested person[s]” have the right topetition an Agency to amend or repeal a rule.5 Since the EPA sets standards for aircraftengine emissions as part of its rulemaking capacity, any interested person may petition theAgency to revise the rule.
• Emissions controls for ground service equipment could be implemented through “ in-uselimits” on their operation, provided that fleet operators have options available that do notrequire modifications to the equipment.
• States that are proprietors of airports can impose requirements on fleets operating within theairport. A fleet emission requirement could be established, provided that the fleet operatorhad options available to meet the requirement without modifying the fleet engines.
• States acting as proprietors of airports may be able to impose landing fees on airplanes,provided that the fees are “ reasonable” and used wholly for “ airport or aeronauticalpurposes.”
• States may be permitted, as a condition of modifying or expanding an airport, to set a limiton airport emissions under the “ indirect source review” provisions of the Clean Air Act.
5 5 U.S.C., section 553(e).
ES-5
E. Conclusions
• Airport-related emissions are increasing while emissions from nearly all other major sourcesectors are decreasing.
• There are a host of technical and operational control options for reducing airport-relatedemissions.
• Establishing an airport emissions cap can serve to encourage the introduction of controltechnologies such as gate electrification, less polluting aircraft engines, and alternative fuelground service equipment and ground access vehicles.
• National and international agreements to encourage the development of less polluting, moreefficient aircraft engines and more aerodynamic aircraft bodies can result in aircraft thatpollute substantially less, are quieter, and burn less fuel than today’ s airplanes.
• States have some authority under the Clean Air Act to require emissions reductions fromairport sources.
• Without technology forcing emission standards that provide incentives for reductions incriteria pollutants and more efficient engines, NOx emissions from aircraft engines willlikely increase for the foreseeable future.

ES-6
I-1
I. Introduction
A. Overview
Airport-related activities result in the emission of a host of air pollutants that adversely affectpublic health and the environment. While emissions from most source sectors are declining due tothe implementation of various national, state, and local control programs, the rapid growth in airtravel and the lack of technology-forcing federal or international control programs is resulting inincreased pollution from airports.
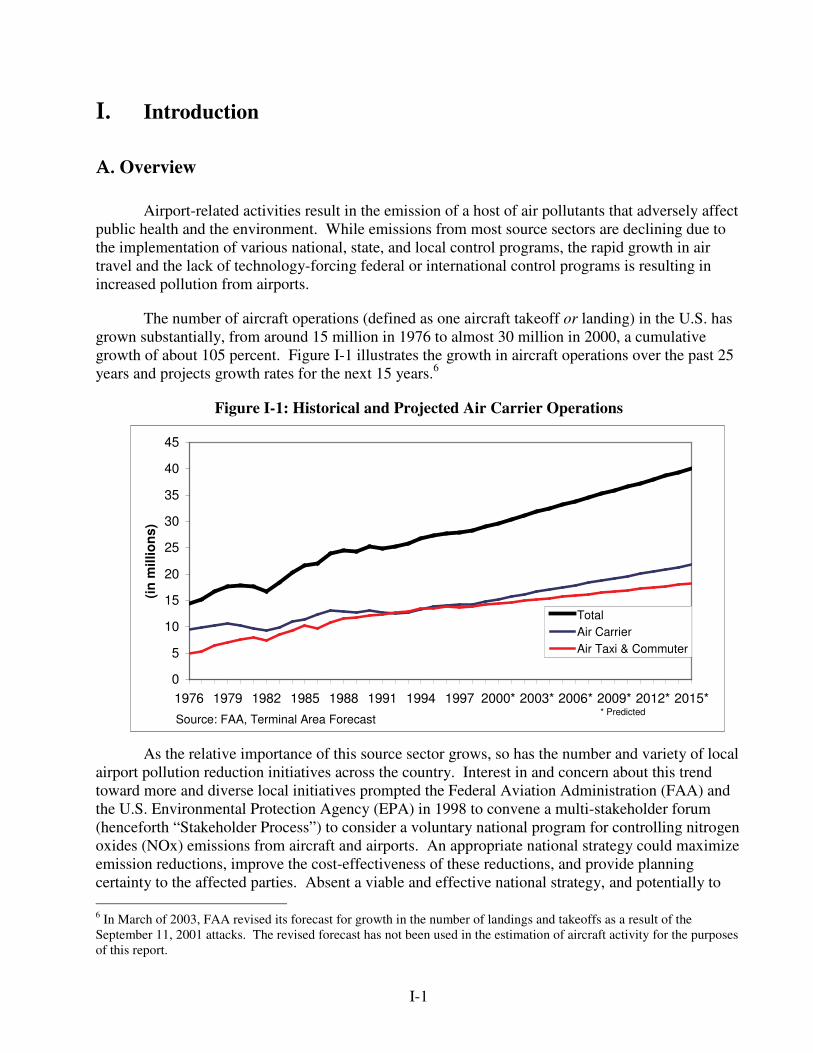
The number of aircraft operations (defined as one aircraft takeoff or landing) in the U.S. hasgrown substantially, from around 15 million in 1976 to almost 30 million in 2000, a cumulativegrowth of about 105 percent. Figure I-1 illustrates the growth in aircraft operations over the past 25years and projects growth rates for the next 15 years.6
Figure I-1: Historical and Projected Air Carrier Operations
As the relative importance of this source sector grows, so has the number and variety of localairport pollution reduction initiatives across the country. Interest in and concern about this trendtoward more and diverse local initiatives prompted the Federal Aviation Administration (FAA) andthe U.S. Environmental Protection Agency (EPA) in 1998 to convene a multi-stakeholder forum(henceforth “ Stakeholder Process” ) to consider a voluntary national program for controlling nitrogenoxides (NOx) emissions from aircraft and airports. An appropriate national strategy could maximizeemission reductions, improve the cost-effectiveness of these reductions, and provide planningcertainty to the affected parties. Absent a viable and effective national strategy, and potentially to 6 In March of 2003, FAA revised its forecast for growth in the number of landings and takeoffs as a result of theSeptember 11, 2001 attacks. The revised forecast has not been used in the estimation of aircraft activity for the purposesof this report.
0
5
10
15
20
25
30
35
40
45
1976 1979 1982 1985 1988 1991 1994 1997 2000* 2003* 2006* 2009* 2012* 2015*
(in m
illio
ns)
TotalAir CarrierAir Taxi & Commuter
* PredictedSource: FAA, Terminal Area Forecast
I-2
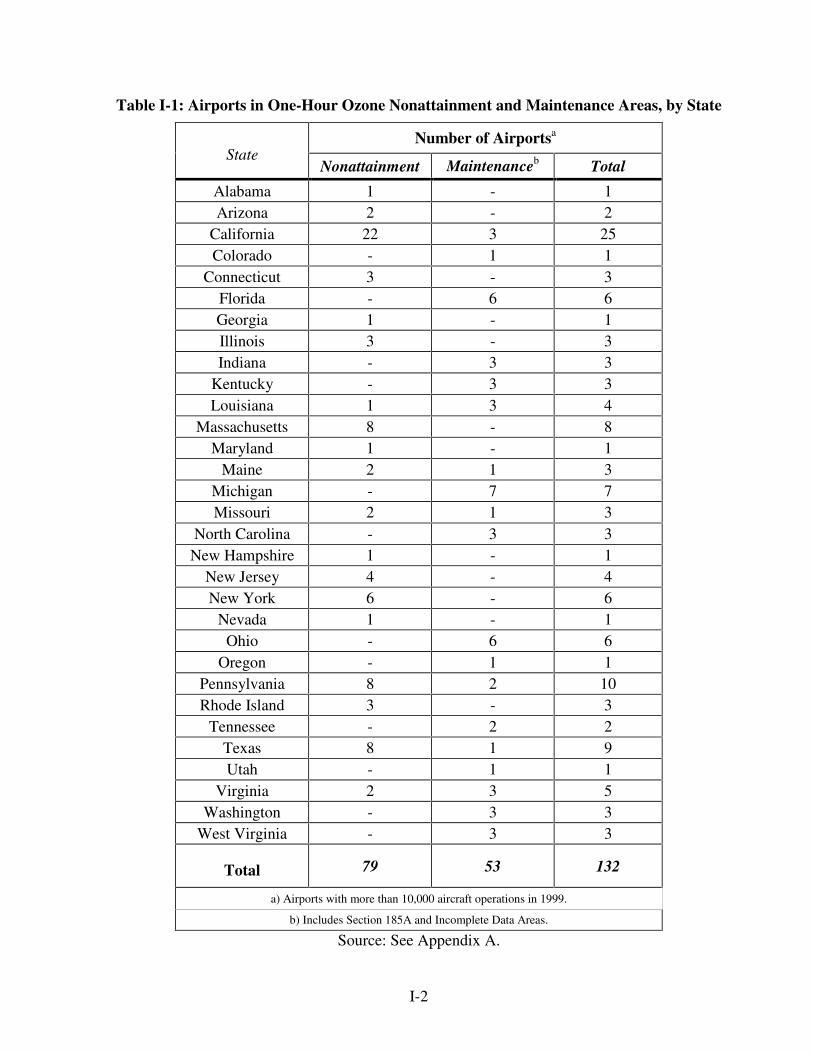
Table I-1: Airports in One-Hour Ozone Nonattainment and Maintenance Areas, by State
Number of Airportsa
StateNonattainment Maintenanceb Total
Alabama 1 - 1Arizona 2 - 2
California 22 3 25Colorado - 1 1
Connecticut 3 - 3Florida - 6 6Georgia 1 - 1Illinois 3 - 3Indiana - 3 3
Kentucky - 3 3Louisiana 1 3 4
Massachusetts 8 - 8Maryland 1 - 1
Maine 2 1 3Michigan - 7 7Missouri 2 1 3
North Carolina - 3 3New Hampshire 1 - 1
New Jersey 4 - 4New York 6 - 6
Nevada 1 - 1Ohio - 6 6
Oregon - 1 1Pennsylvania 8 2 10Rhode Island 3 - 3
Tennessee - 2 2Texas 8 1 9Utah - 1 1
Virginia 2 3 5Washington - 3 3
West Virginia - 3 3
Total 79 53 132
a) Airports with more than 10,000 aircraft operations in 1999.
b) Includes Section 185A and Incomplete Data Areas.
Source: See Appendix A.
I-3
complement a national strategy, state and local governments across the country will pursue programsto reduce airport-related emissions in their jurisdictions.
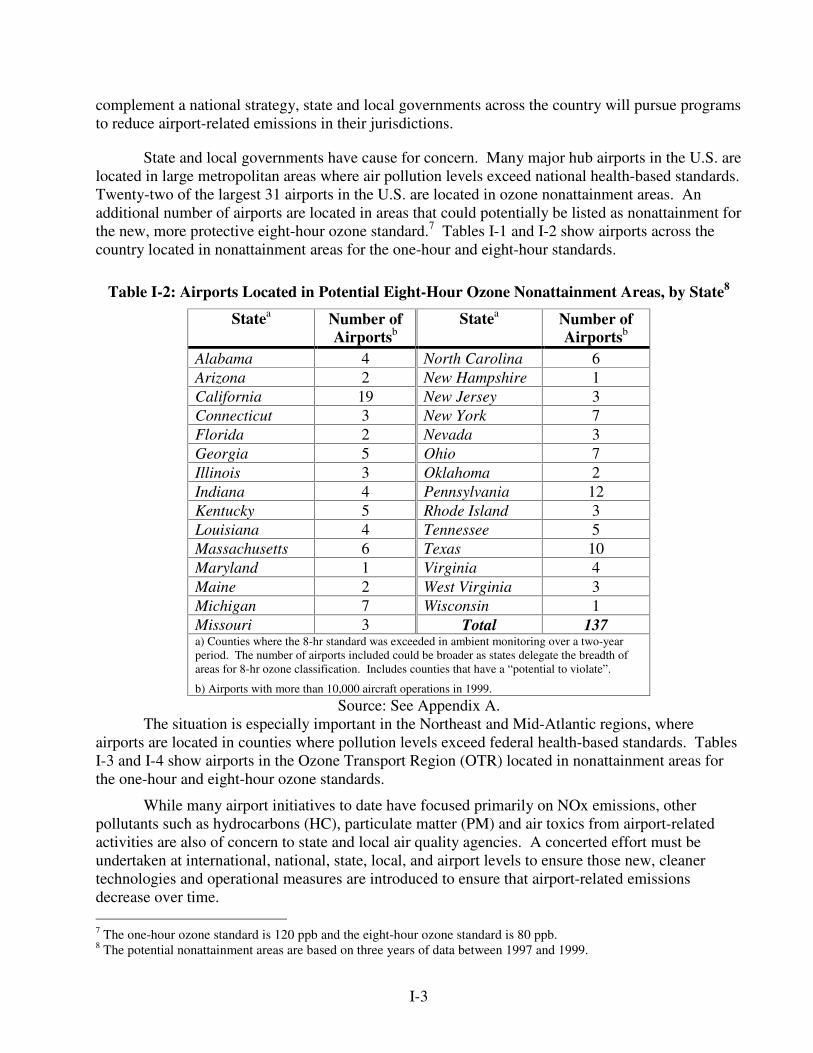
State and local governments have cause for concern. Many major hub airports in the U.S. arelocated in large metropolitan areas where air pollution levels exceed national health-based standards.Twenty-two of the largest 31 airports in the U.S. are located in ozone nonattainment areas. Anadditional number of airports are located in areas that could potentially be listed as nonattainment forthe new, more protective eight-hour ozone standard.7 Tables I-1 and I-2 show airports across thecountry located in nonattainment areas for the one-hour and eight-hour standards.
Table I-2: Airports Located in Potential Eight-Hour Ozone Nonattainment Areas, by State8
Statea Number ofAirportsb
Statea Number ofAirportsb
Alabama 4 North Carolina 6Arizona 2 New Hampshire 1California 19 New Jersey 3Connecticut 3 New York 7Florida 2 Nevada 3Georgia 5 Ohio 7Illinois 3 Oklahoma 2Indiana 4 Pennsylvania 12Kentucky 5 Rhode Island 3Louisiana 4 Tennessee 5Massachusetts 6 Texas 10Maryland 1 Virginia 4Maine 2 West Virginia 3Michigan 7 Wisconsin 1Missouri 3 Total 137a) Counties where the 8-hr standard was exceeded in ambient monitoring over a two-yearperiod. The number of airports included could be broader as states delegate the breadth ofareas for 8-hr ozone classification. Includes counties that have a “ potential to violate” .
b) Airports with more than 10,000 aircraft operations in 1999.
Source: See Appendix A.The situation is especially important in the Northeast and Mid-Atlantic regions, where
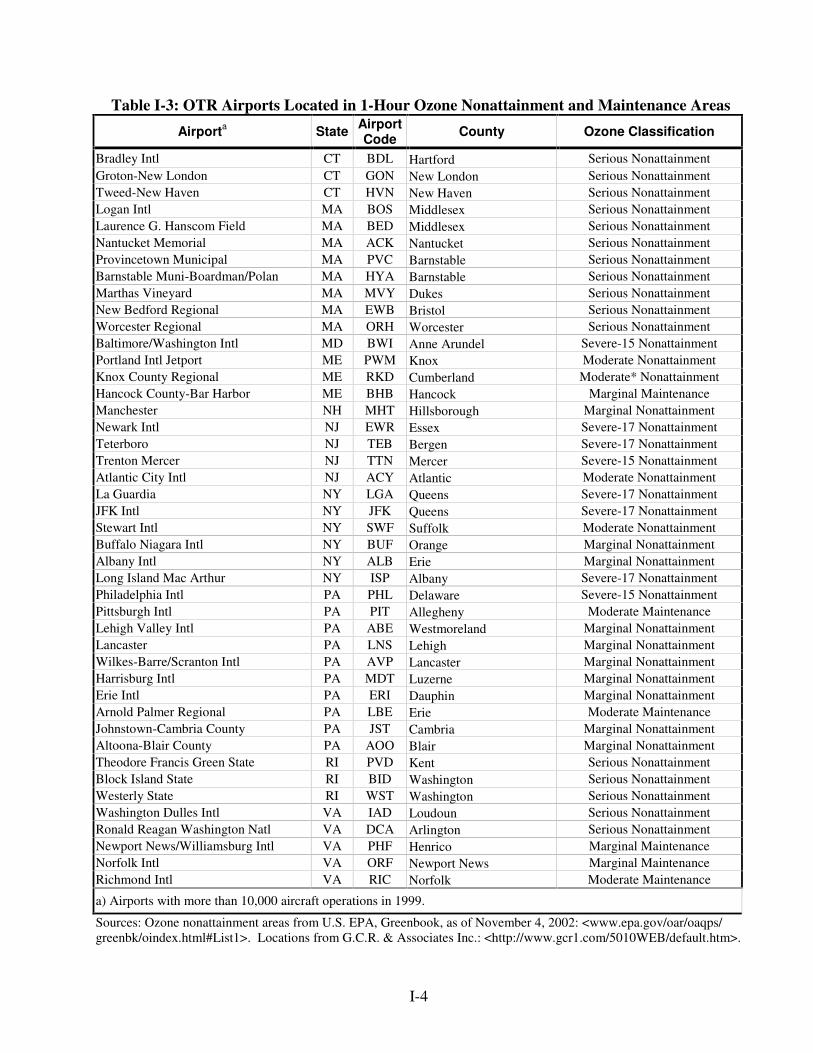
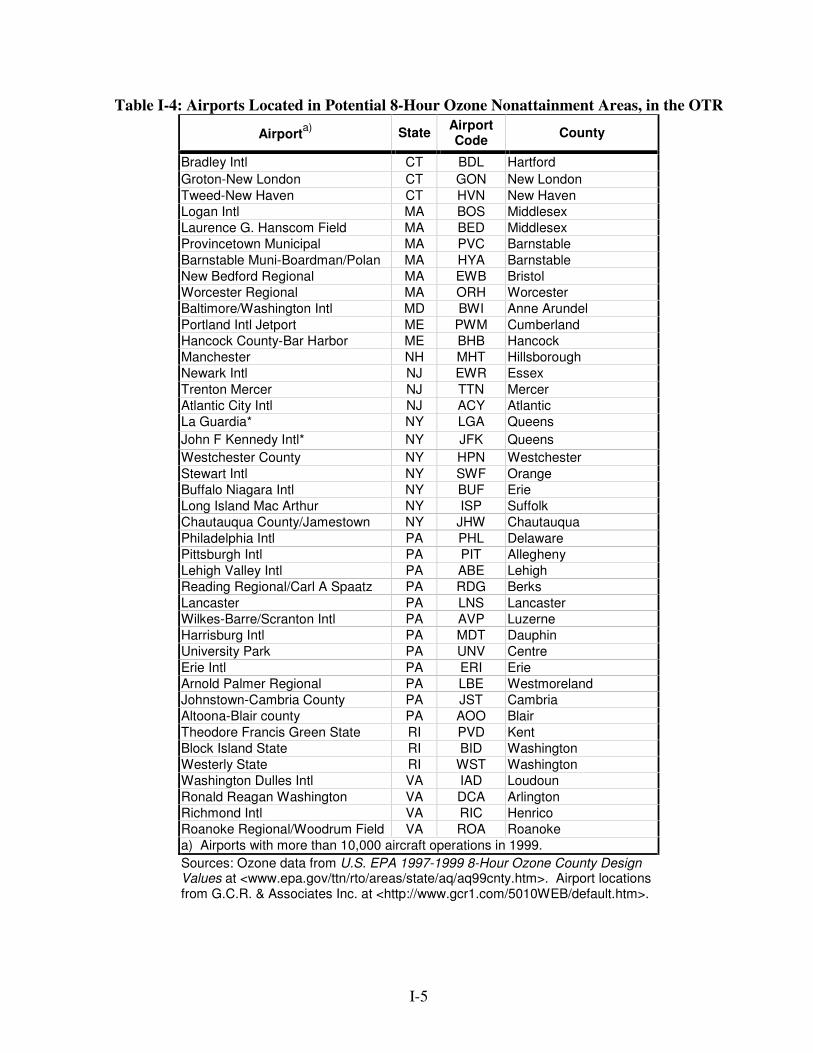
airports are located in counties where pollution levels exceed federal health-based standards. TablesI-3 and I-4 show airports in the Ozone Transport Region (OTR) located in nonattainment areas forthe one-hour and eight-hour ozone standards.
While many airport initiatives to date have focused primarily on NOx emissions, otherpollutants such as hydrocarbons (HC), particulate matter (PM) and air toxics from airport-relatedactivities are also of concern to state and local air quality agencies. A concerted effort must beundertaken at international, national, state, local, and airport levels to ensure those new, cleanertechnologies and operational measures are introduced to ensure that airport-related emissionsdecrease over time. 7 The one-hour ozone standard is 120 ppb and the eight-hour ozone standard is 80 ppb.8 The potential nonattainment areas are based on three years of data between 1997 and 1999.
I-4
Table I-3: OTR Airports Located in 1-Hour Ozone Nonattainment and Maintenance AreasAirporta State Airport
Code County Ozone Classification
Bradley Intl CT BDL Hartford Serious NonattainmentGroton-New London CT GON New London Serious NonattainmentTweed-New Haven CT HVN New Haven Serious NonattainmentLogan Intl MA BOS Middlesex Serious NonattainmentLaurence G. Hanscom Field MA BED Middlesex Serious NonattainmentNantucket Memorial MA ACK Nantucket Serious NonattainmentProvincetown Municipal MA PVC Barnstable Serious NonattainmentBarnstable Muni-Boardman/Polan MA HYA Barnstable Serious NonattainmentMarthas Vineyard MA MVY Dukes Serious NonattainmentNew Bedford Regional MA EWB Bristol Serious NonattainmentWorcester Regional MA ORH Worcester Serious NonattainmentBaltimore/Washington Intl MD BWI Anne Arundel Severe-15 NonattainmentPortland Intl Jetport ME PWM Knox Moderate NonattainmentKnox County Regional ME RKD Cumberland Moderate* NonattainmentHancock County-Bar Harbor ME BHB Hancock Marginal MaintenanceManchester NH MHT Hillsborough Marginal NonattainmentNewark Intl NJ EWR Essex Severe-17 NonattainmentTeterboro NJ TEB Bergen Severe-17 NonattainmentTrenton Mercer NJ TTN Mercer Severe-15 NonattainmentAtlantic City Intl NJ ACY Atlantic Moderate NonattainmentLa Guardia NY LGA Queens Severe-17 NonattainmentJFK Intl NY JFK Queens Severe-17 NonattainmentStewart Intl NY SWF Suffolk Moderate NonattainmentBuffalo Niagara Intl NY BUF Orange Marginal NonattainmentAlbany Intl NY ALB Erie Marginal NonattainmentLong Island Mac Arthur NY ISP Albany Severe-17 NonattainmentPhiladelphia Intl PA PHL Delaware Severe-15 NonattainmentPittsburgh Intl PA PIT Allegheny Moderate MaintenanceLehigh Valley Intl PA ABE Westmoreland Marginal NonattainmentLancaster PA LNS Lehigh Marginal NonattainmentWilkes-Barre/Scranton Intl PA AVP Lancaster Marginal NonattainmentHarrisburg Intl PA MDT Luzerne Marginal NonattainmentErie Intl PA ERI Dauphin Marginal NonattainmentArnold Palmer Regional PA LBE Erie Moderate MaintenanceJohnstown-Cambria County PA JST Cambria Marginal NonattainmentAltoona-Blair County PA AOO Blair Marginal NonattainmentTheodore Francis Green State RI PVD Kent Serious NonattainmentBlock Island State RI BID Washington Serious NonattainmentWesterly State RI WST Washington Serious NonattainmentWashington Dulles Intl VA IAD Loudoun Serious NonattainmentRonald Reagan Washington Natl VA DCA Arlington Serious NonattainmentNewport News/Williamsburg Intl VA PHF Henrico Marginal MaintenanceNorfolk Intl VA ORF Newport News Marginal MaintenanceRichmond Intl VA RIC Norfolk Moderate Maintenance
a) Airports with more than 10,000 aircraft operations in 1999.
Sources: Ozone nonattainment areas from U.S. EPA, Greenbook, as of November 4, 2002: <www.epa.gov/oar/oaqps/greenbk/oindex.html#List1>. Locations from G.C.R. & Associates Inc.: <http://www.gcr1.com/5010WEB/default.htm>.
I-5
Table I-4: Airports Located in Potential 8-Hour Ozone Nonattainment Areas, in the OTR
Airporta) State AirportCode County
Bradley Intl CT BDL HartfordGroton-New London CT GON New LondonTweed-New Haven CT HVN New HavenLogan Intl MA BOS MiddlesexLaurence G. Hanscom Field MA BED MiddlesexProvincetown Municipal MA PVC BarnstableBarnstable Muni-Boardman/Polan MA HYA BarnstableNew Bedford Regional MA EWB BristolWorcester Regional MA ORH WorcesterBaltimore/Washington Intl MD BWI Anne ArundelPortland Intl Jetport ME PWM CumberlandHancock County-Bar Harbor ME BHB HancockManchester NH MHT HillsboroughNewark Intl NJ EWR EssexTrenton Mercer NJ TTN MercerAtlantic City Intl NJ ACY AtlanticLa Guardia* NY LGA QueensJohn F Kennedy Intl* NY JFK QueensWestchester County NY HPN WestchesterStewart Intl NY SWF OrangeBuffalo Niagara Intl NY BUF ErieLong Island Mac Arthur NY ISP SuffolkChautauqua County/Jamestown NY JHW ChautauquaPhiladelphia Intl PA PHL DelawarePittsburgh Intl PA PIT AlleghenyLehigh Valley Intl PA ABE LehighReading Regional/Carl A Spaatz PA RDG BerksLancaster PA LNS LancasterWilkes-Barre/Scranton Intl PA AVP LuzerneHarrisburg Intl PA MDT DauphinUniversity Park PA UNV CentreErie Intl PA ERI ErieArnold Palmer Regional PA LBE WestmorelandJohnstown-Cambria County PA JST CambriaAltoona-Blair county PA AOO BlairTheodore Francis Green State RI PVD KentBlock Island State RI BID WashingtonWesterly State RI WST WashingtonWashington Dulles Intl VA IAD LoudounRonald Reagan Washington VA DCA ArlingtonRichmond Intl VA RIC HenricoRoanoke Regional/Woodrum Field VA ROA Roanokea) Airports with more than 10,000 aircraft operations in 1999.Sources: Ozone data from U.S. EPA 1997-1999 8-Hour Ozone County DesignValues at <www.epa.gov/ttn/rto/areas/state/aq/aq99cnty.htm>. Airport locationsfrom G.C.R. & Associates Inc. at <http://www.gcr1.com/5010WEB/default.htm>.
I-6
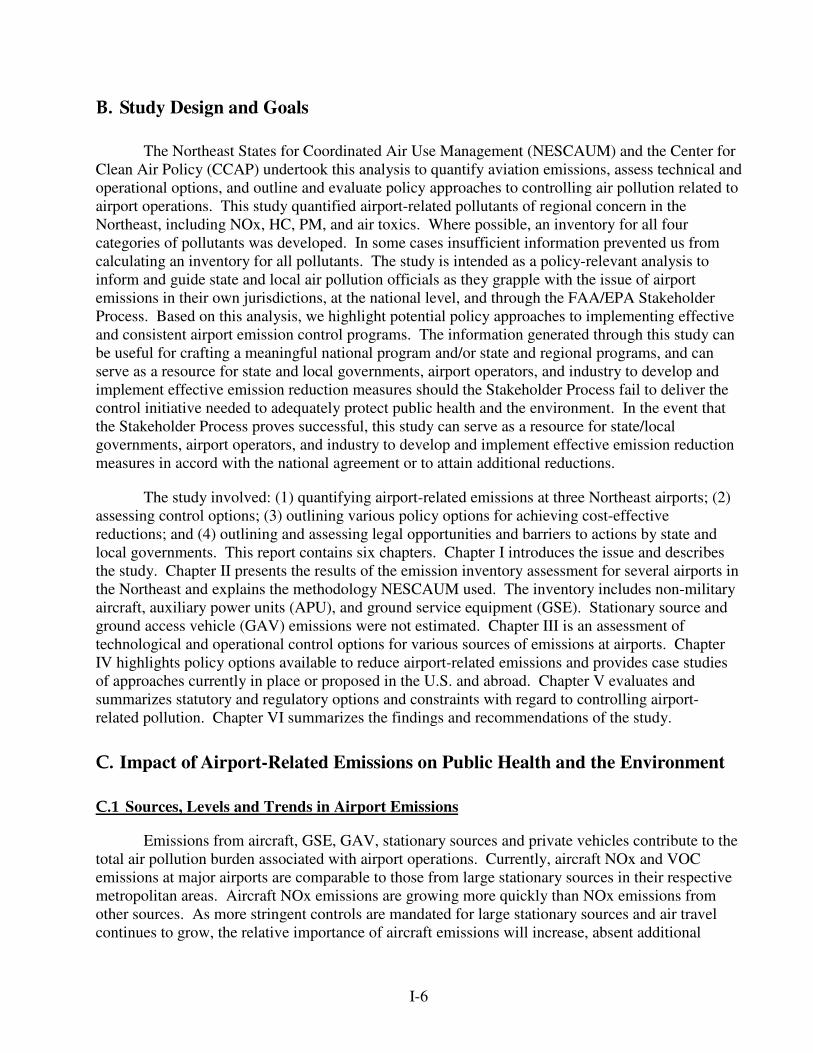
B. Study Design and Goals
The Northeast States for Coordinated Air Use Management (NESCAUM) and the Center forClean Air Policy (CCAP) undertook this analysis to quantify aviation emissions, assess technical andoperational options, and outline and evaluate policy approaches to controlling air pollution related toairport operations. This study quantified airport-related pollutants of regional concern in theNortheast, including NOx, HC, PM, and air toxics. Where possible, an inventory for all fourcategories of pollutants was developed. In some cases insufficient information prevented us fromcalculating an inventory for all pollutants. The study is intended as a policy-relevant analysis toinform and guide state and local air pollution officials as they grapple with the issue of airportemissions in their own jurisdictions, at the national level, and through the FAA/EPA StakeholderProcess. Based on this analysis, we highlight potential policy approaches to implementing effectiveand consistent airport emission control programs. The information generated through this study canbe useful for crafting a meaningful national program and/or state and regional programs, and canserve as a resource for state and local governments, airport operators, and industry to develop andimplement effective emission reduction measures should the Stakeholder Process fail to deliver thecontrol initiative needed to adequately protect public health and the environment. In the event thatthe Stakeholder Process proves successful, this study can serve as a resource for state/localgovernments, airport operators, and industry to develop and implement effective emission reductionmeasures in accord with the national agreement or to attain additional reductions.
The study involved: (1) quantifying airport-related emissions at three Northeast airports; (2)assessing control options; (3) outlining various policy options for achieving cost-effectivereductions; and (4) outlining and assessing legal opportunities and barriers to actions by state andlocal governments. This report contains six chapters. Chapter I introduces the issue and describesthe study. Chapter II presents the results of the emission inventory assessment for several airports inthe Northeast and explains the methodology NESCAUM used. The inventory includes non-militaryaircraft, auxiliary power units (APU), and ground service equipment (GSE). Stationary source andground access vehicle (GAV) emissions were not estimated. Chapter III is an assessment oftechnological and operational control options for various sources of emissions at airports. ChapterIV highlights policy options available to reduce airport-related emissions and provides case studiesof approaches currently in place or proposed in the U.S. and abroad. Chapter V evaluates andsummarizes statutory and regulatory options and constraints with regard to controlling airport-related pollution. Chapter VI summarizes the findings and recommendations of the study.
C. Impact of Airport-Related Emissions on Public Health and the Environment
C.1 Sources, Levels and Trends in Airport Emissions
Emissions from aircraft, GSE, GAV, stationary sources and private vehicles contribute to thetotal air pollution burden associated with airport operations. Currently, aircraft NOx and VOCemissions at major airports are comparable to those from large stationary sources in their respectivemetropolitan areas. Aircraft NOx emissions are growing more quickly than NOx emissions fromother sources. As more stringent controls are mandated for large stationary sources and air travelcontinues to grow, the relative importance of aircraft emissions will increase, absent additional
I-7
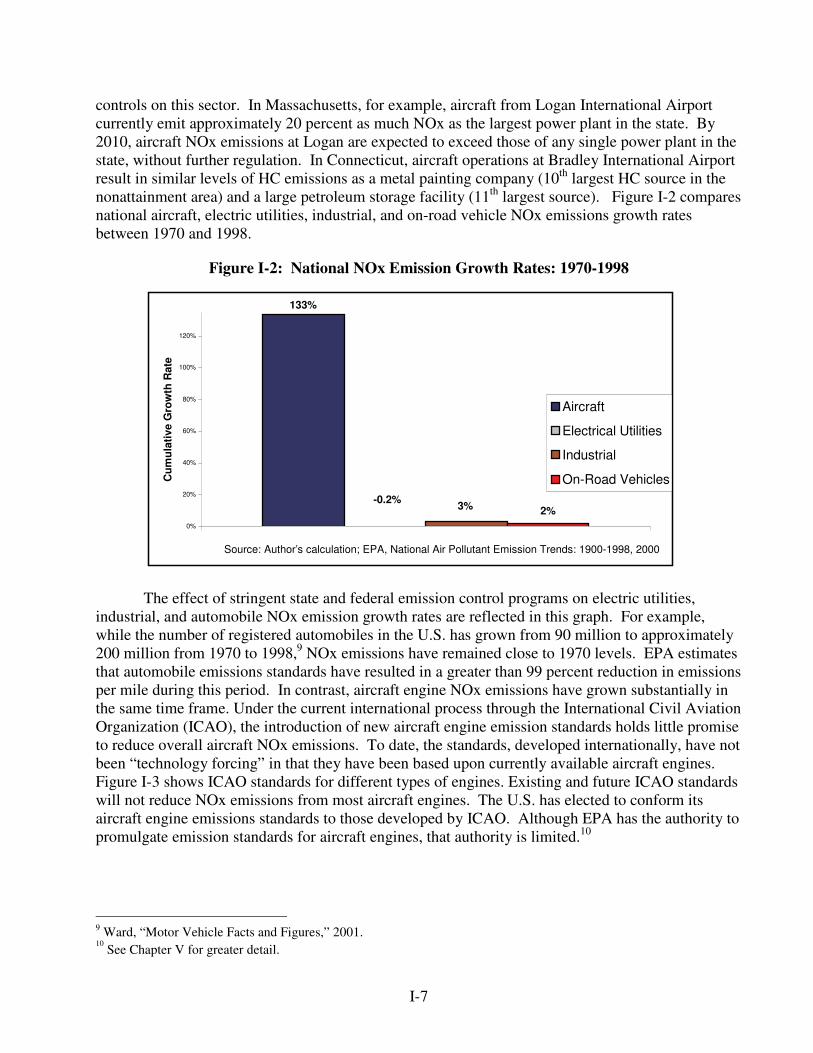
controls on this sector. In Massachusetts, for example, aircraft from Logan International Airportcurrently emit approximately 20 percent as much NOx as the largest power plant in the state. By2010, aircraft NOx emissions at Logan are expected to exceed those of any single power plant in thestate, without further regulation. In Connecticut, aircraft operations at Bradley International Airportresult in similar levels of HC emissions as a metal painting company (10th largest HC source in thenonattainment area) and a large petroleum storage facility (11th largest source). Figure I-2 comparesnational aircraft, electric utilities, industrial, and on-road vehicle NOx emissions growth ratesbetween 1970 and 1998.
Figure I-2: National NOx Emission Growth Rates: 1970-1998
The effect of stringent state and federal emission control programs on electric utilities,industrial, and automobile NOx emission growth rates are reflected in this graph. For example,while the number of registered automobiles in the U.S. has grown from 90 million to approximately200 million from 1970 to 1998,9 NOx emissions have remained close to 1970 levels. EPA estimatesthat automobile emissions standards have resulted in a greater than 99 percent reduction in emissionsper mile during this period. In contrast, aircraft engine NOx emissions have grown substantially inthe same time frame. Under the current international process through the International Civil AviationOrganization (ICAO), the introduction of new aircraft engine emission standards holds little promiseto reduce overall aircraft NOx emissions. To date, the standards, developed internationally, have notbeen “ technology forcing” in that they have been based upon currently available aircraft engines.Figure I-3 shows ICAO standards for different types of engines. Existing and future ICAO standardswill not reduce NOx emissions from most aircraft engines. The U.S. has elected to conform itsaircraft engine emissions standards to those developed by ICAO. Although EPA has the authority topromulgate emission standards for aircraft engines, that authority is limited.10
9 Ward, “ Motor Vehicle Facts and Figures,” 2001.10 See Chapter V for greater detail.
2%
133%
3%
0%
20%
40%
60%
80%
100%
120%
Cum
ulat
ive
Gro
wth
Rat
e
Aircraft
Electrical Utilities
Industrial
On-Road Vehicles
Source: Author’s calculation; EPA, National Air Pollutant Emission Trends: 1900-1998, 2000
-0.2%
I-8
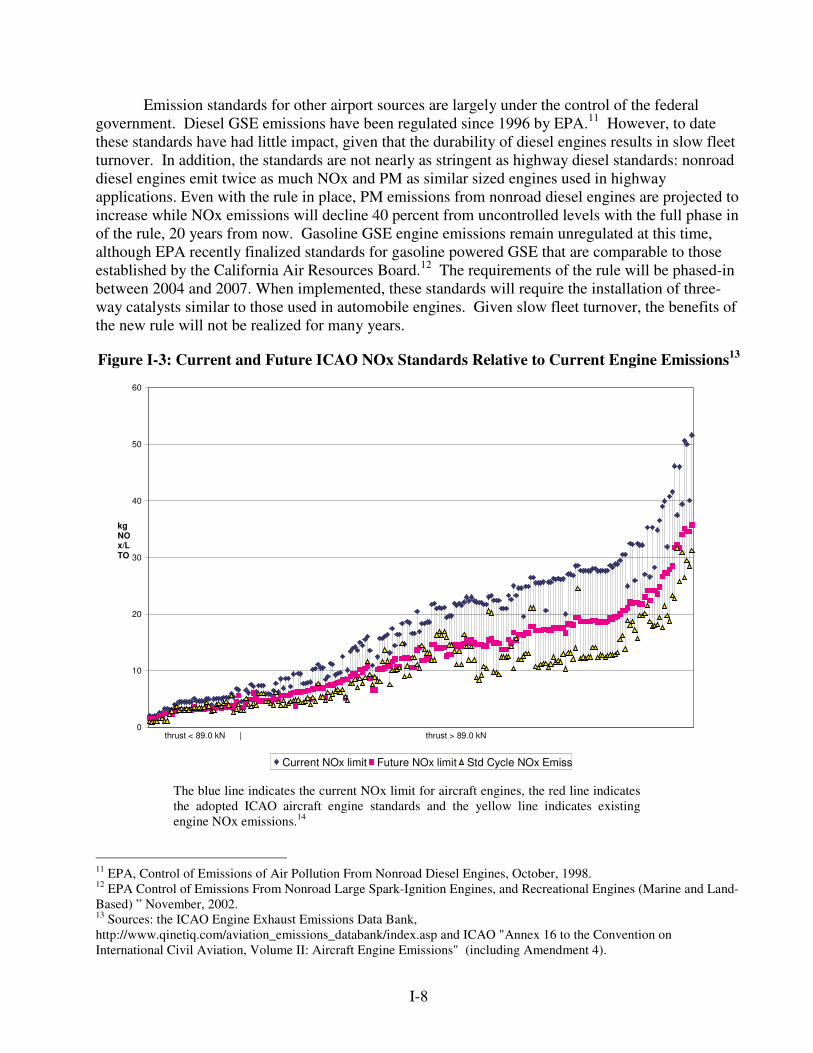
Emission standards for other airport sources are largely under the control of the federalgovernment. Diesel GSE emissions have been regulated since 1996 by EPA.11 However, to datethese standards have had little impact, given that the durability of diesel engines results in slow fleetturnover. In addition, the standards are not nearly as stringent as highway diesel standards: nonroaddiesel engines emit twice as much NOx and PM as similar sized engines used in highwayapplications. Even with the rule in place, PM emissions from nonroad diesel engines are projected toincrease while NOx emissions will decline 40 percent from uncontrolled levels with the full phase inof the rule, 20 years from now. Gasoline GSE engine emissions remain unregulated at this time,although EPA recently finalized standards for gasoline powered GSE that are comparable to thoseestablished by the California Air Resources Board.12 The requirements of the rule will be phased-inbetween 2004 and 2007. When implemented, these standards will require the installation of three-way catalysts similar to those used in automobile engines. Given slow fleet turnover, the benefits ofthe new rule will not be realized for many years.
Figure I-3: Current and Future ICAO NOx Standards Relative to Current Engine Emissions13
The blue line indicates the current NOx limit for aircraft engines, the red line indicatesthe adopted ICAO aircraft engine standards and the yellow line indicates existingengine NOx emissions.14
11 EPA, Control of Emissions of Air Pollution From Nonroad Diesel Engines, October, 1998.12 EPA Control of Emissions From Nonroad Large Spark-Ignition Engines, and Recreational Engines (Marine and Land-Based) ” November, 2002.13 Sources: the ICAO Engine Exhaust Emissions Data Bank,http://www.qinetiq.com/aviation_emissions_databank/index.asp and ICAO "Annex 16 to the Convention onInternational Civil Aviation, Volume II: Aircraft Engine Emissions" (including Amendment 4).
0
10
20
30
40
50
60
kg NOx/LTO
Current NOx limit Future NOx limit Std Cycle NOx Emiss
thrust < 89.0 kN | thrust > 89.0 kN
I-9
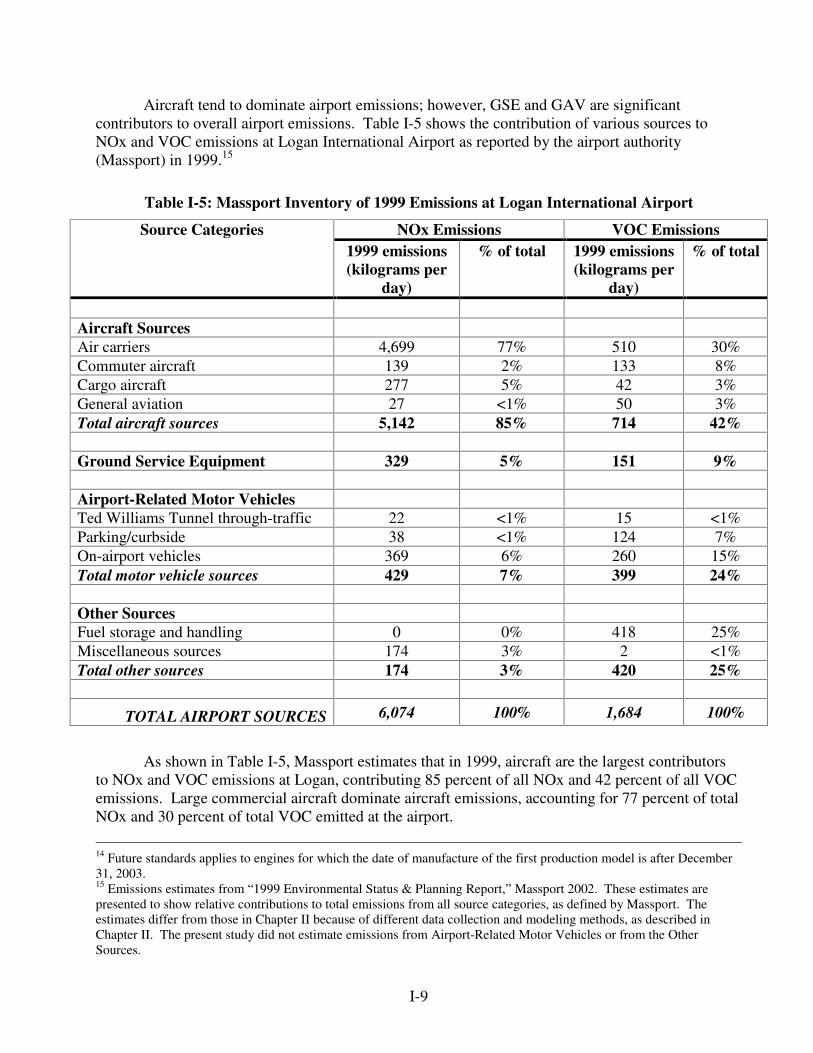
Aircraft tend to dominate airport emissions; however, GSE and GAV are significantcontributors to overall airport emissions. Table I-5 shows the contribution of various sources toNOx and VOC emissions at Logan International Airport as reported by the airport authority(Massport) in 1999.15
Table I-5: Massport Inventory of 1999 Emissions at Logan International Airport
NOx Emissions VOC EmissionsSource Categories1999 emissions(kilograms per
day)
% of total 1999 emissions(kilograms per
day)
% of total
Aircraft SourcesAir carriers 4,699 77% 510 30%Commuter aircraft 139 2% 133 8%Cargo aircraft 277 5% 42 3%General aviation 27 <1% 50 3%Total aircraft sources 5,142 85% 714 42%
Ground Service Equipment 329 5% 151 9%
Airport-Related Motor VehiclesTed Williams Tunnel through-traffic 22 <1% 15 <1%Parking/curbside 38 <1% 124 7%On-airport vehicles 369 6% 260 15%Total motor vehicle sources 429 7% 399 24%
Other SourcesFuel storage and handling 0 0% 418 25%Miscellaneous sources 174 3% 2 <1%Total other sources 174 3% 420 25%
TOTAL AIRPORT SOURCES 6,074 100% 1,684 100%
As shown in Table I-5, Massport estimates that in 1999, aircraft are the largest contributorsto NOx and VOC emissions at Logan, contributing 85 percent of all NOx and 42 percent of all VOCemissions. Large commercial aircraft dominate aircraft emissions, accounting for 77 percent of totalNOx and 30 percent of total VOC emitted at the airport.
14 Future standards applies to engines for which the date of manufacture of the first production model is after December31, 2003.15 Emissions estimates from “ 1999 Environmental Status & Planning Report,” Massport 2002. These estimates arepresented to show relative contributions to total emissions from all source categories, as defined by Massport. Theestimates differ from those in Chapter II because of different data collection and modeling methods, as described inChapter II. The present study did not estimate emissions from Airport-Related Motor Vehicles or from the OtherSources.
I-10
Commuter aircraft are a significant source of VOCs (8 percent of the airport total) but a relativelyminor source of NOx (2 percent of the airport total). Cargo planes emit about 9 percent of airport-related NOx and 3 percent of all VOCs. GSE emit about 5 percent of total NOx and 9 percent oftotal VOC. Fuel storage accounts for 25 percent of total VOCs, but is not a source of NOx.
C.2 Public Health Impacts
Air regulators are concerned with NOx emissions because they are precursors of ozone andsecondary fine particles. Ozone is a highly irritating gas that produces acute effects includingcoughing, shortness of breath, and impaired lung function. Because of the adverse effects of ozone,EPA established a daily maximum one-hour average standard of 120 ppb in 1979. However, currentdata show impaired lung function at levels below this standard. The effects range from reversibledamage to potentially irreversible lung damage.
Studies show that there is a progressive increase in the severity of lung damage from ozoneexposure. Exposures of one to three hours during heavy exercise lead to increasingly severepulmonary effects as the concentration of ozone increases from 120 to 200 ppb. In addition, equallysevere damage occurs from exposures of six to eight hours to ozone concentrations as low as 80 ppbduring moderate exercise. Thus, low ozone exposures of six to eight hours duration produce similareffects as those found at ozone exposures of short duration. Based on the health effects associatedwith longer-term exposure to ozone, EPA finalized a new ozone primary standard of 80 ppb in 1997based on an eight-hour averaging time.
Hydrocarbons are also ozone precursors, and some constituents of total hydrocarbon areknown or probable carcinogens, including aldehydes (formaldehyde, acetaldehye, and acrolein),benzene, toluene, polycyclic aromatic hydrocarbons, and 1,3 butadiene. Elevated ambient levels ofthese compounds have been measured in all counties of the Northeast and throughout the country.
Particulate pollution is a region-wide concern as well. Recent health effects studies haveshown an association between existing levels of fine particles and health effects such as increasedrespiratory illness, cardio-pulmonary morbidity, and premature mortality.16 For example, a linkbetween air pollution and mortality was demonstrated in two studies using data collected by theAmerican Cancer Society.17 The study tracked over 500,000 adults in 51 cities over an 8-yearperiod. The adjusted risk of mortality in cities with the highest levels of fine particulate pollutionwas approximately 15 to 25 percent higher than in cities with the lowest particulate levels. Afollow-up analysis determined that each 10 microgram elevation in fine particulate air pollution wasassociated with an increase of approximately 8 percent in lung cancer mortality and a 6 percentincrease in cardiopulmonary mortality.
A number of studies have examined the relationship between airport-related pollution andpublic health impacts. A study conducted for the Health Council of the Netherlands concluded that
16 Douglas W. Dockery, et al. “ An Association Between Air Pollution and Mortality in Six U.S. Cities,” New EnglandJournal of Medicine, Volume 329:1753-1759, December 9, 1993.17 Pope CA III, et al. “ Particulate air pollution as a predictor of mortality in a prospective study of US adults.” AmericanJournal of Respiratory Critical Care Medicine, 151:669-674, 1995, and Pope CA III, et al “ Lung cancer,cardiopulmonary mortality, and long-term exposure to fine particulate air pollution.” Journal of the American MedicalAssociation Vol. 287 No. 9, March, 2002.
I-11
“ there is sufficient evidence that episodes of air pollution with levels observed within an airportoperations system can cause short-term effects like an increased mortality rate and an increasedfrequency of hospital admissions due to acute respiratory and cardiovascular morbitity.” 18 A studysummarized in the report showed that male workers at Birmingham International Airportdemonstrated a statistically significant association between high exposure to aviation fuel or jetstream and a cough with phlegm. The report concluded that exposure to airport-related air pollutionappears to cause similar health effects as does exposure to urban air. The study authors also notedthat more work needs to be done to determine the health impacts of airport-related air pollutiongiven the relatively small number of studies available.
C.3 Environmental Impacts
After more than a quarter century of concerted effort, large areas of the NESCAUM regioncontinue to experience unhealthful air that exceeds the federal ozone standard. Ozone is not directlyemitted; NOx and VOC are the primary precursor emissions that result in the formation of ozone. Aseries of aggressive HC and NOx control initiatives have helped to improve air quality in the region;however, these strategies have fallen short of the reductions needed to bring all areas of the regioninto compliance with the federal ozone standard. Monitoring and modeling data suggest that, on aregional basis, NOx controls provide greater ozone reduction benefits than comparable levels of HCreductions. NOx is also a significant contributor to acid deposition, estuary eutrophication, fineparticulate matter formation and regional haze. EPA has established a secondary ozone standard toprotect vegetation. Since the response of vegetation to ambient ozone is cumulative in nature, asecondary standard based on some cumulative, perhaps seasonal, form is thought to better reflectbiologically relevant measures of exposure than a short-term average concentration form.
Particulate matter represents a direct threat to public health and contributes to visibilitydegradation. In light of the compelling epidemiological evidence linking levels of ambientparticulate concentrations to increase mortality and morbidity, in 1997, EPA established a newNAAQS for fine particulates less than or equal to 2.5 micron in size (PM2.5). The 24-hour standardfor PM2.5 is 65 µg/m3; the annual PM2.5 standard is 15 µg/m3. A revised NAAQS based on a PM2.5
indicator may dramatically alter the current nonattainment situation in the Northeast. The transitionto the PM2.5 standard will shift the focus to fine particulates resulting from combustion, whichconstitutes a substantially larger fraction of overall particulate levels in the East.
An important regulatory complexity is introduced by the fact that the fine particulate problemin the Northeast is likely to have two dimensions: microscale or “ hot spot” areas of high PMconcentrations, in which local sources play a critical role, and a macroscale or regional problem inwhich long-range transported pollution plays a key role. Particulate can be transported thousands ofmiles which increases the complexity of crafting effective control strategies. States are currentlyembarking on efforts to develop long-term strategies to reduce fine PM and regional haze. Efforts toreduce direct fine PM emissions, as well as species that form fine PM such as nitrates and sulfates,will be critical to improving visibility in the Northeast. NESCAUM’ s analysis of preliminary finePM data indicates that many areas of the NESCAUM region have ambient levels of fine PM thathover near the annual standard of 15 µg/m3. Early reductions in fine PM emissions may allow someareas to meet the federal standard before nonattainment designations are made.
18 Health Council of the Netherlands “ Public Health Impacts of Large Airports,” September, 1999.
I-12
In addition to emissions of NOx, HC, CO, and PM, carbon dioxide (CO2) emissions arebecoming increasingly important to air quality officials due to its impact on global climate change.In addition, aircraft NOx emissions are of special concern for global climate change since NOx fromaircraft are emitted at high altitudes and can have an impact on the climate system.19
19 Royal Aeronautical Society, The Society of British Aerospace Companies “ Air Travel - Greener by Design, theTechnology Challenge,” 2000.
II-1
II. Emission Inventories for Three Northeast Airports
A. Overview
This chapter presents the results of an emissions inventory analysis for three Northeastairports: The General Edward Lawrence Logan International Airport in Boston, MA; BradleyInternational Airport in Windsor Locks, CT; and Manchester Airport in Manchester, NH. While adetailed emissions inventory for all airports in the Northeast region was beyond the scope of thisstudy, the three selected airports represent a range of airport types, including a large establishedairport, a medium-sized airport, and a small, rapidly growing airport. Beginning in the mid-1990s,growth shifted from the overcrowded Logan Airport to smaller airports in the region, such asBradley and Manchester Airports.
In designing control programs, it is helpful to understand the relative contribution of differentsources to the overall air quality problem. The purpose of this effort is to provide a relative sense of:(1) the contribution of airports to the total emission burden in a given area and (2) the contribution ofemissions from various airport sources to the overall airport inventory. Hydrocarbons (HC),nitrogen oxides (NOx), and toxic emissions from different sources were quantified to the extent dataexisted to support such estimates. Sources within the inventory were classified into the followingprimary sectors: aircraft, auxiliary power units (APU), and ground service equipment (GSE). It wasthe intent of the report organizers to include ground access vehicles and airport-related stationarysources in the study; however, resource limitations required a focus on the lesser-understood areas ofaircraft and GSE emissions. It is generally accepted that state inventories account for ground accessvehicle emissions using traditional mobile source modeling tools (US EPA’ s Mobile model), and forstationary source emissions using AP-42 emission factors. Emissions estimates were developed fora base year (1999) and a projection year (2010).20
In conducting the inventory analysis, NESCAUM used the best available emission factors,activity rates, and numerical estimates of aircraft, GSE, and APUs. Although the Federal AviationAdministration’ s (FAA’ s) Emissions and Dispersion Model System (EDMS) is the federallyapproved model for estimating emissions from these sources, new models were required toincorporate more detailed input data. NESCAUM contracted Energy and Environmental Analysis(EEA) to design new emissions models that incorporated a world aircraft inventory,21 andincorporated airport-specific GSE information, and allowed the modeler to easily change the defaultsfor aircraft and GSE used in EDMS. The resulting aircraft/APU model utilizes 1999 landing andtakeoff (LTO) data from FAA to generate estimates of aircraft and APU emissions at any U.S.airport. The model allows the user to easily include airport-specific mixing heights and taxi times, asavailable. An additional version of the model was produced to estimate emissions for the 2010projection year. The resulting GSE model used information from the U.S. Environmental
20 This study commenced before the events of September 11, 2001. Forecasts reflecting these events were released byFAA in March, 2003 and have not been incorporated in this study.21 The world aircraft inventory reports aircraft/engine combinations and populations for aircraft owned by airlines andgovernments worldwide.
II-2
Protection Agency’ s (EPA’ s) Draft NONROAD model, and the California Air Resources Board(CARB)22 OFFROAD model.
Because the EPA and CARB models are populated with data primarily obtained fromsurveys of GSE in southern California and other southern U.S. airport, NESCAUM contacted theairlines, fixed base operators (FBOs), and the airports of study to obtain information about GSEpopulation and usage. This effort was necessary to obtain complete GSE estimates for the Northeastairports since the South Coast has no winter-related equipment such as snowplows and deicers, andthis equipment is used infrequently at the Dallas/Ft. Worth airports.
A.1 Characteristics of the Airports of Study
The three airports selected for this study represent a range of airport sizes with varyingprojections of growth. In addition, these airports are located near major and small cities in ozonenonattainment areas. The airports are described below.
Logan International Airport, Boston, MA
Logan is a large airport, serving about 27 million passengers and shipping almost one billionpounds of cargo in 1999. In 1995, Logan projected passenger levels of 37.5 million in 2010, buteconomic changes, the introduction of the Acela high-speed train between Boston and Washington,DC, and a push toward the increased utilization of regional airports such as Manchester Internationalin Manchester, NH and T.F. Greene in Providence, RI have slowed growth. In 2000, Logan officialsrevised their growth projections to 37.5 million passengers in 2015.
Because of its northeastern location, Logan is not a hub for any major airline, nor is itexpected to become one. There is no dominant carrier at Logan. Large commercial air carriers runthe majority of flights from Logan, but air taxi (regional shuttle) traffic accounted for almost200,000 operations (40% of total operations) in 1999. Logan has very little general aviation(private) or military aircraft traffic. Located in Boston Harbor, Logan is just 2.25 miles fromBoston’ s downtown and its runways are as close as a quarter mile to residential areas. With suchproximity to the city, Logan’ s noise and pollutant emissions have a direct impact on Boston and thesurrounding communities.
Bradley International Airport, Windsor Locks, CT
As recently as 1999, Bradley International Airport was a medium-sized airport, serving 6.3million passengers annually. However, in 2000, Bradley broke into the large airport category, with apassenger increase of 15.8 percent to 7.3 million. By 2010, Bradley is projected to serve as many as10 million passengers annually.
Bradley airport serves western Massachusetts, Connecticut, and southern Vermont, and islocated 15 minutes from Hartford, CT. Bradley has almost as many shuttle (air taxi) flights asflights by larger carriers. Bradley also has a significant number of landings and takeoffs by generalaviation aircraft, and has the largest number of military flights of the airports studied for this report.
22 CARB is the air pollution control division within the California Environmental Protection Agency. CARB developsits own mobile source emissions models and does not use federal models for SIP inventory development.
II-3
Manchester Airport, Manchester, NH
Manchester Airport is the smallest of the airports included in this survey. Manchester served2.8 million passengers in 1999 and is technically a medium-sized airport. However, this level ofservice represented rapid expansion since 1997, when the airport served just 1.1 million passengers.The growth at Manchester can be attributed to two main factors. First, in an effort to easecongestion at Boston’ s airport, Logan has worked to encourage travelers (especially those residingoutside the immediate Boston area) to fly from “ regional” airports in Providence, RI; Manchester,NH; and Worcester, MA. Trips from these airports reduce the demand for flights from Logan and insome cases decrease miles traveled by passengers to reach the airport. Second, the introduction ofservice by Southwest Airlines was an important factor in increasing traffic at Manchester. Byoffering low fares, which were in turn matched by other airlines serving Manchester, Southwesthelped to make Manchester and other smaller airports competitive with Logan. Fares fromManchester are often much lower than fares from Boston to the same destination. Continued growthis expected to bring 5.3 million passengers to Manchester Airport in 2010.
Manchester Airport is located a short distance from Manchester, NH in the southern portionof the state. This facility supports commercial and air taxi flights, but has almost as many operationsby general aviation aircraft as these categories combined. As air carrier and air taxi traffic increase,general aviation activity will fall at Manchester.
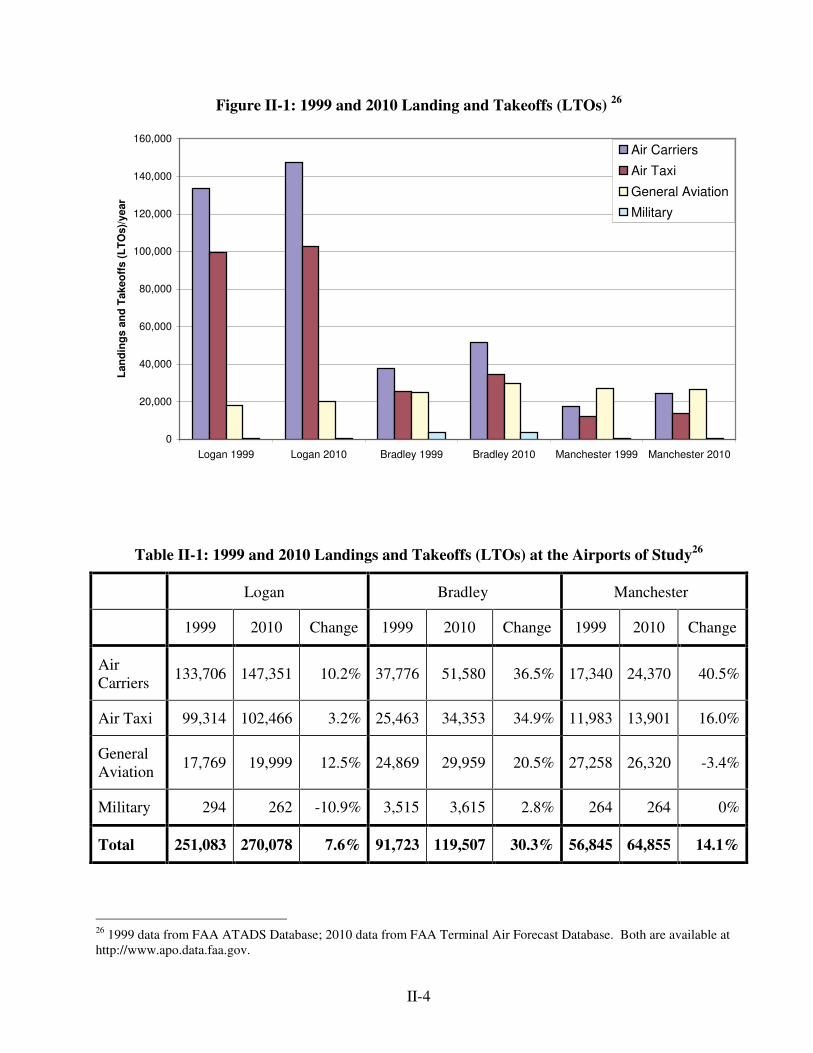
The number of landings and takeoffs by different types of aircraft at each airport are shownfor 1999 and 2010 in Figure II-1 and Table II-1. The figure and table show that landings andtakeoffs by commercial airlines at the three airports studied in this report will grow 10 to 40 percentover the next 10 years.23 Air taxi24 activity growth will be more modest at Manchester and Loganthan at Bradley, where growth of up to 35 percent will occur over the next ten years. Generalaviation growth will be highest at Bradley. Manchester is forecast to see a decrease in generalaviation LTOs, mainly from “ touch and go” (T&G) operations. T&Gs are takeoff and landingexercises for general aviation aircraft, usually with a very short ground time. It is expected that theexceptional 40 percent increase in commercial aviation operations at Manchester will decrease thetime and runway availability previously used by general aviation aircraft for T&G operations.Military flights are, by default, forecast to be constant as a matter of national security. If changes aremade in military operations, they generally reflect FAA knowledge of change in military activity.Small changes in military operations at the three airports are incorporated and reflect historicchanges in these operations.25 However, as discussed in the next section, the aircraft inventory (forNOx in particular) is dominated by commercial aircraft emissions. Thus, the most important changesto note in Table II-1 are the significant increases in air carrier landings and takeoffs.
23 The LTO projections are taken directly from FAA’ s Terminal Air Forecast (TAF). The TAF Forecast Method statesthat FAA performs linear multiple regression analysis to project national counts which are then split out to individualairports. These numbers are reviewed by an FAA analyst and are approved by each region and district. There is noadditional information about the development of the inventory.24 Air carrier, air taxi, and general aviation are further defined in the next section.25 Emissions from military aircraft are not included in this inventory due to lack of available data with sufficient detail tomatch the rest of the inventory. As military aircraft account for less than one percent of LTOs at Logan and Manchesterairports and four percent of LTOs at Bradley, this omission does not significantly impact the inventory.
II-4
Figure II-1: 1999 and 2010 Landing and Takeoffs (LTOs) 26
Table II-1: 1999 and 2010 Landings and Takeoffs (LTOs) at the Airports of Study26
Logan Bradley Manchester
1999 2010 Change 1999 2010 Change 1999 2010 Change
AirCarriers 133,706 147,351 10.2% 37,776 51,580 36.5% 17,340 24,370 40.5%
Air Taxi 99,314 102,466 3.2% 25,463 34,353 34.9% 11,983 13,901 16.0%
GeneralAviation 17,769 19,999 12.5% 24,869 29,959 20.5% 27,258 26,320 -3.4%
Military 294 262 -10.9% 3,515 3,615 2.8% 264 264 0%
Total 251,083 270,078 7.6% 91,723 119,507 30.3% 56,845 64,855 14.1%
26 1999 data from FAA ATADS Database; 2010 data from FAA Terminal Air Forecast Database. Both are available athttp://www.apo.data.faa.gov.
0
20,000
40,000
60,000
80,000
100,000
120,000
140,000
160,000
Logan 1999 Logan 2010 Bradley 1999 Bradley 2010 Manchester 1999 Manchester 2010
Land
ings
and
Tak
eoff
s (L
TOs)
/yea
r
Air Carriers
Air Taxi
General Aviation
Military
II-5
B. Aircraft Emissions
Like all combustion engines, aircraft engines produce a host of criteria and other pollutantsthat affect ambient air quality. Unlike many other sources, however, aircraft emit pollutants over arange of altitudes, and their emissions may have different impacts at different altitudes. Emissionsbelow the mixing height27 contribute to ground-level air pollution, while certain types of emissionsmay have a greater potential impact on climate change when emitted above the mixing layer. Thisstudy considers only aircraft emissions below the mixing height. Monthly average mixing heights atthe airports studied ranged between 1,930 and 4,510 feet.
Aircraft are generally grouped into four categories when FAA counts LTOs. Thesedenominations are based on the operator of the aircraft, not on the aircraft, per se. Air carriers ownand operate at least one aircraft that seats at least 60 passengers or has a payload of at least 18,000pounds.28 Air carriers may also own smaller aircraft, but the LTOs of these aircraft are reported inthe air carriers’ totals. Air taxis operate only smaller certified aircraft,29 usually fly short routes, andare considered regional or shuttle carriers. General aviation consists of small planes that are usuallyprivately owned or belong to corporations. Military aircraft sometimes fly from commercialairports. As previously mentioned, due to a lack of specific information about the types of militaryaircraft used, emissions from this small sector were not included in the inventory.
All aircraft operate through a range of power settings while active below the mixing height.These power settings can be described by four phases of operation: approach, taxi/idle, takeoff, andclimbout (Figure II-2). The approach phase begins as a plane enters the mixing height during itsdescent and ends when the plane touches down. All low-power movement on the ground is includedin the taxi/idle phase. The takeoff phase begins when the engines are set to full power to start downthe runway and continues until the plane has reached an altitude of 500 feet.30 Takeoff isimmediately followed by the climbout phase, which concludes when the plane leaves the mixingheight. These four phases collectively constitute the landing and takeoff (LTO) cycle. A fifth phase,
27 The mixing height is the elevation below which air and pollutants will mix. Vertical mixing processes are extremelycomplicated in the lower atmosphere; however, under typical conditions some vertical transport mechanisms aregenerally well understood. For example, as a parcel of air is warmed at the ground, it starts to rise. As the parcel rises, itmixes with surrounding air and slowly cools. As long as the parcel remains warmer than the surrounding air, it willcontinue to rise, mix, expand, and cool. When the (now dilute) parcel and the surrounding air are the same temperature,the parcel stops rising, thus defining the top of the mixing height, or boundary layer. Any pollutants emitted within theboundary layer will eventually become uniformly mixed in this fashion. Conversely, any pollutants emitted above themixing height will not mix down to ground level. As the ground warms during the day, air parcels become warmer andcan reach higher in the atmosphere before cooling to the temperature of surrounding air. Thus, the mixing height growsto a higher altitude as well. This daily expansion and contraction of the boundary layer can re-entrain pollutants thathave may have accumulated above the mixing height overnight.28 "Airport Activity Statistics of Certificated Air Carriers, Twelve Months Ending December 31, 1999". U.S. DOT,Bureau of Transportation Statistics, Office of Airline Information, Washington, D.C., 200029 An air taxi operator , as defined in 14 CFR 298.3, “ directly engages in the air transportation of persons of property ormail, … do[es] not directly or indirectly utilize large aircraft,” [defined in 14 CFR 298.2 as “ any aircraft designed tohave a maximum passenger capacity of more than 60 seats or a maximum payload capacity of more than 18,000pounds” ] and follows other regulatory guidelines set forth in the same chapter.30 This study incorporates recent FAA data indicating that takeoff lasts until a plane has reached 1000 feet. See sectionB.1 Methodology, Discussion of Model Inputs in this chapter for more information.
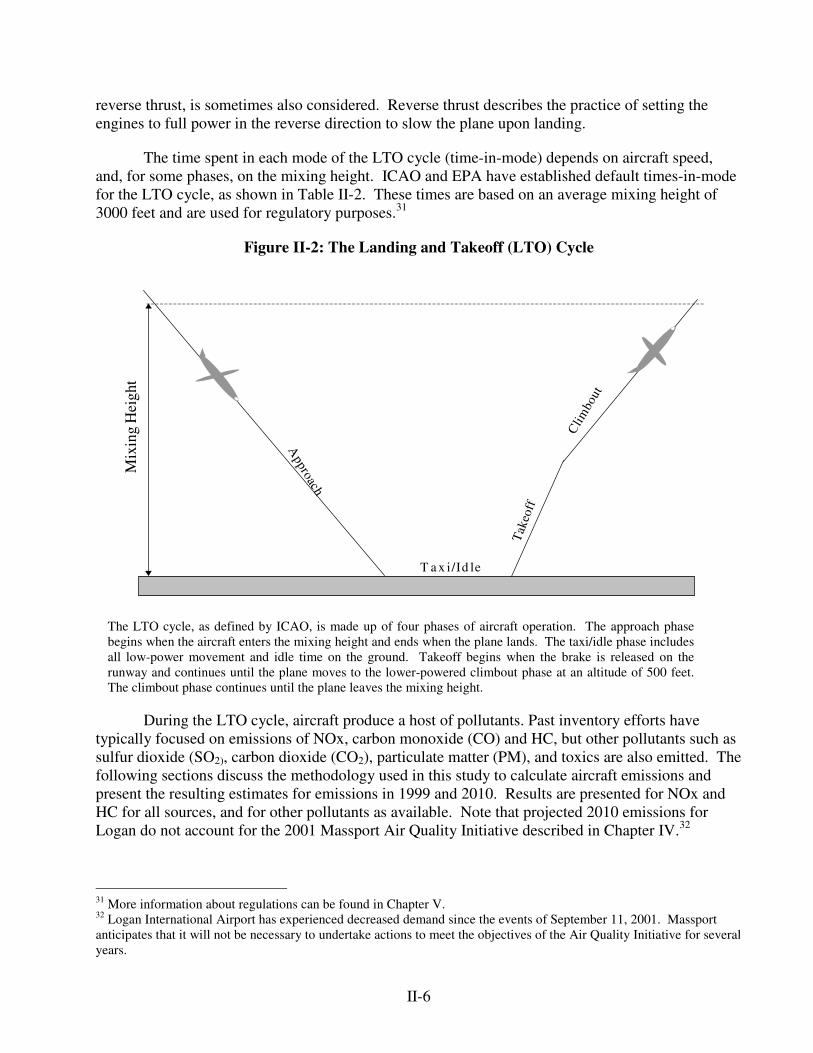
II-6
reverse thrust, is sometimes also considered. Reverse thrust describes the practice of setting theengines to full power in the reverse direction to slow the plane upon landing.
The time spent in each mode of the LTO cycle (time-in-mode) depends on aircraft speed,and, for some phases, on the mixing height. ICAO and EPA have established default times-in-modefor the LTO cycle, as shown in Table II-2. These times are based on an average mixing height of3000 feet and are used for regulatory purposes.31
Figure II-2: The Landing and Takeoff (LTO) Cycle
Mix
ing
Hei
ght
Approach
Take
off
Clim
bout
T a x i/Id le
The LTO cycle, as defined by ICAO, is made up of four phases of aircraft operation. The approach phasebegins when the aircraft enters the mixing height and ends when the plane lands. The taxi/idle phase includesall low-power movement and idle time on the ground. Takeoff begins when the brake is released on therunway and continues until the plane moves to the lower-powered climbout phase at an altitude of 500 feet.The climbout phase continues until the plane leaves the mixing height.
During the LTO cycle, aircraft produce a host of pollutants. Past inventory efforts havetypically focused on emissions of NOx, carbon monoxide (CO) and HC, but other pollutants such assulfur dioxide (SO2), carbon dioxide (CO2), particulate matter (PM), and toxics are also emitted. Thefollowing sections discuss the methodology used in this study to calculate aircraft emissions andpresent the resulting estimates for emissions in 1999 and 2010. Results are presented for NOx andHC for all sources, and for other pollutants as available. Note that projected 2010 emissions forLogan do not account for the 2001 Massport Air Quality Initiative described in Chapter IV.32
31 More information about regulations can be found in Chapter V.32 Logan International Airport has experienced decreased demand since the events of September 11, 2001. Massportanticipates that it will not be necessary to undertake actions to meet the objectives of the Air Quality Initiative for severalyears.
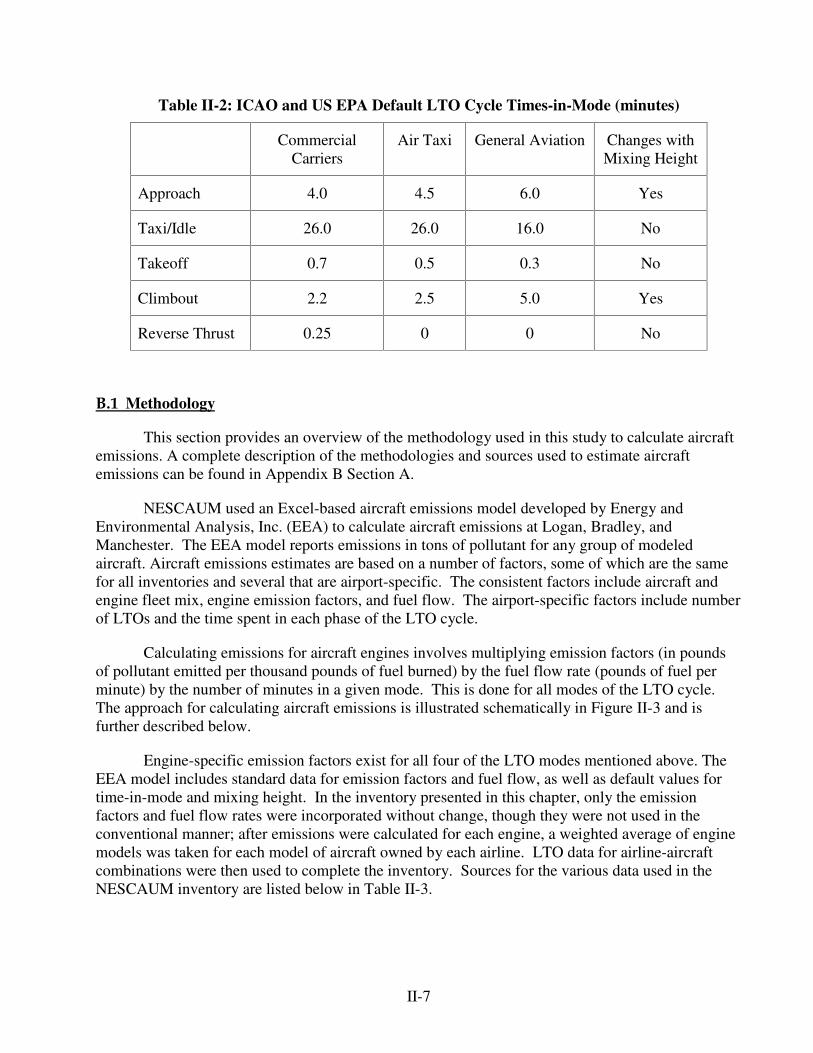
II-7
Table II-2: ICAO and US EPA Default LTO Cycle Times-in-Mode (minutes)
CommercialCarriers
Air Taxi General Aviation Changes withMixing Height
Approach 4.0 4.5 6.0 Yes
Taxi/Idle 26.0 26.0 16.0 No
Takeoff 0.7 0.5 0.3 No
Climbout 2.2 2.5 5.0 Yes
Reverse Thrust 0.25 0 0 No
B.1 Methodology
This section provides an overview of the methodology used in this study to calculate aircraftemissions. A complete description of the methodologies and sources used to estimate aircraftemissions can be found in Appendix B Section A.
NESCAUM used an Excel-based aircraft emissions model developed by Energy andEnvironmental Analysis, Inc. (EEA) to calculate aircraft emissions at Logan, Bradley, andManchester. The EEA model reports emissions in tons of pollutant for any group of modeledaircraft. Aircraft emissions estimates are based on a number of factors, some of which are the samefor all inventories and several that are airport-specific. The consistent factors include aircraft andengine fleet mix, engine emission factors, and fuel flow. The airport-specific factors include numberof LTOs and the time spent in each phase of the LTO cycle.
Calculating emissions for aircraft engines involves multiplying emission factors (in poundsof pollutant emitted per thousand pounds of fuel burned) by the fuel flow rate (pounds of fuel perminute) by the number of minutes in a given mode. This is done for all modes of the LTO cycle.The approach for calculating aircraft emissions is illustrated schematically in Figure II-3 and isfurther described below.
Engine-specific emission factors exist for all four of the LTO modes mentioned above. TheEEA model includes standard data for emission factors and fuel flow, as well as default values fortime-in-mode and mixing height. In the inventory presented in this chapter, only the emissionfactors and fuel flow rates were incorporated without change, though they were not used in theconventional manner; after emissions were calculated for each engine, a weighted average of enginemodels was taken for each model of aircraft owned by each airline. LTO data for airline-aircraftcombinations were then used to complete the inventory. Sources for the various data used in theNESCAUM inventory are listed below in Table II-3.
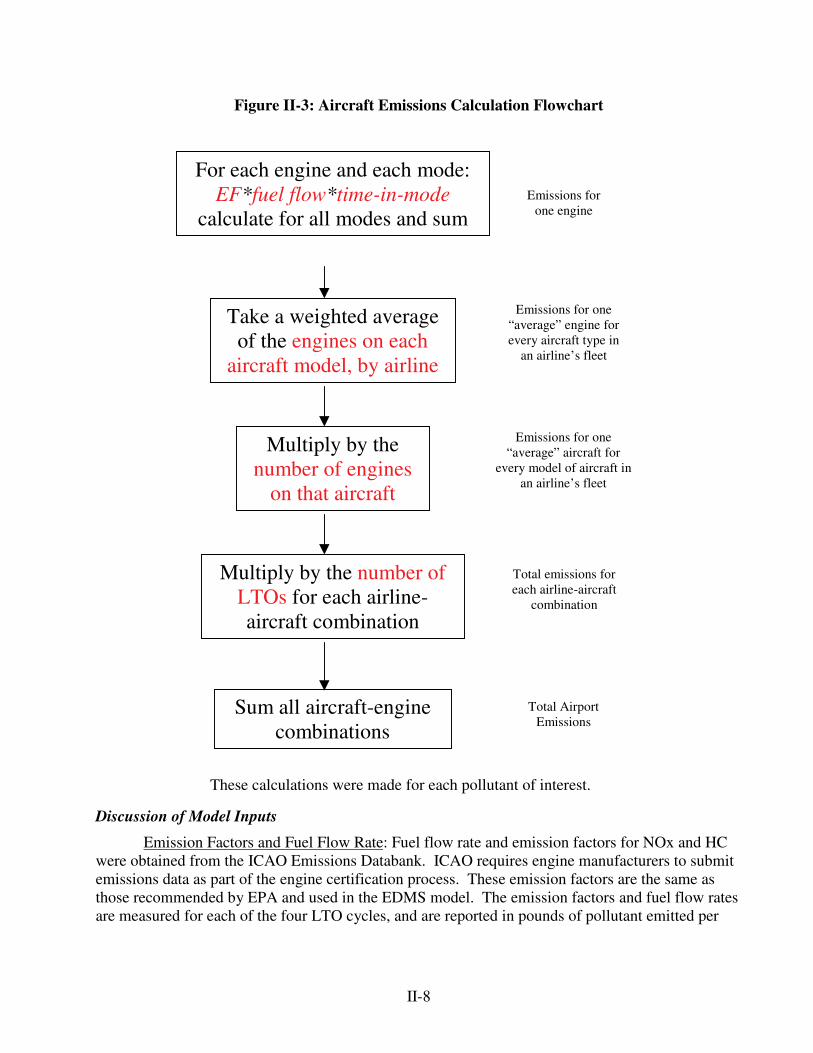
II-8
Figure II-3: Aircraft Emissions Calculation Flowchart
Discussion of Model Inputs
Emission Factors and Fuel Flow Rate: Fuel flow rate and emission factors for NOx and HCwere obtained from the ICAO Emissions Databank. ICAO requires engine manufacturers to submitemissions data as part of the engine certification process. These emission factors are the same asthose recommended by EPA and used in the EDMS model. The emission factors and fuel flow ratesare measured for each of the four LTO cycles, and are reported in pounds of pollutant emitted per
These calculations were made for each pollutant of interest.
Emissions forone engine
Emissions for one“ average” engine forevery aircraft type in
an airline’ s fleet
Emissions for one“ average” aircraft for
every model of aircraft inan airline’ s fleet
Total emissions foreach airline-aircraft
combination
Total AirportEmissions
For each engine and each mode:EF*fuel flow*time-in-mode
calculate for all modes and sum
Take a weighted averageof the engines on each
aircraft model, by airline
Multiply by thenumber of engines
on that aircraft
Multiply by the number ofLTOs for each airline-aircraft combination
Sum all aircraft-enginecombinations
II-9
thousand pounds of fuel burned. The emission factors were gathered from newly manufacturedengines and do not account for deterioration.33
Aircraft/Engine Combinations: Since several models of aircraft engines can power the sameaircraft body, the assignment of engines, and therefore emission factors, to specific aircraft bodiesmust be determined. Data on the type and number of engines used on aircraft in service around theworld are available from Jet Information Services’ World Aircraft Inventory. This inventory alsoincludes the number and types of planes owned by commercial carriers and governments worldwide,and specifies the engines used on those planes. In the NESCAUM inventory, engines were assignedas listed in the World Aircraft Inventory, and a weighted average of engine types for each aircraftbody in an airline’ s fleet was developed. For example, weighted averages were taken forContinental’ s Boeing 727-200s (four engine models on nine planes), Continental’ s Boeing 737-300s(two engine models on 65 planes), and FedEx’ s Airbus 310-200s (four engine models on 40 planes),etc. The aircraft/engine combinations for the projection year were created using Boeing and Airbusforecasts and current orders to adjust the current fleet mix.
Time in Mode: For each operation mode in the LTO cycle, ICAO has determined a defaulttime, as shown in Table II-2. NESCAUM modified these times when more accurate data wasavailable. The default taxi/idle time was replaced with monthly, airport-specific taxi times fromDOT’ s Bureau of Transportation Statistics.34 These substitutions reduced taxi/idle time forManchester and Bradley airports, and in most cases increased taxi/idle time at Logan. The defaulttimes for approach and climbout were adjusted with meteorological data from mixing height stationsnear the airports of study. Mixing height data from US EPA’ s Support Center for Regulatory AirModels (SCRAM) were used to calculate monthly average times-in-mode for approach andclimbout. Flight profile data from FAA’ s Integrated Noise Model (INM) were incorporated. Thesenew data, indicating that takeoff power is sustained to 1000 feet of altitude, not the 500 feet ofaltitude assumed in the ICAO default times, were used to increase the modeled takeoff time.Reverse thrust time was not affected. The impact of using these data is explained later in thischapter.
Changes to these revised times-in-mode were minimal for the forecast year. Becausemeteorology is not expected to change significantly, no changes were made to the times for approachor climbout. Similarly, no changes in takeoff operations are expected, so takeoff times were notchanged. By contrast, as airports experience growth that leads to congestion, taxi/idle times areexpected to change. Taxi/idle times were adjusted based on information from airport planning
33 As engines age and parts wear, engine combustion processes tend to become inefficient, especially without propermaintenance. These inefficiencies tend to lead to increased fuel consumption and increased emissions, or “ deterioration”in cleanliness of the engine. However, because aircraft engines are continually maintained to meet strict safetystandards, parts are kept in good condition. Studies of emissions deterioration under cruise conditions (Lukachko, 1997)show results from competing influences. Performance deterioration with age (increased fuel burn per minute) occurs andimplies higher NOx emissions. However, deteriorations in different engine components have opposing effects, andoverall changes in NOx emissions at cruise conditions can be either positive or negative, and are of small magnitude(-1% to 4%). The performance deterioration has diminished very slightly with newer engines, but the magnitude of theresultant NOx emissions could be larger, since newer engines emit more NOx at their higher temperatures and pressures.It is impossible to extrapolate these effects to the LTO cycle without further research.34 US DOT, Bureau of Transportation Statistics. Airline On-Time Statistics. Available online at<http://www.bts.gov/ntda/oai/index.shtml>.
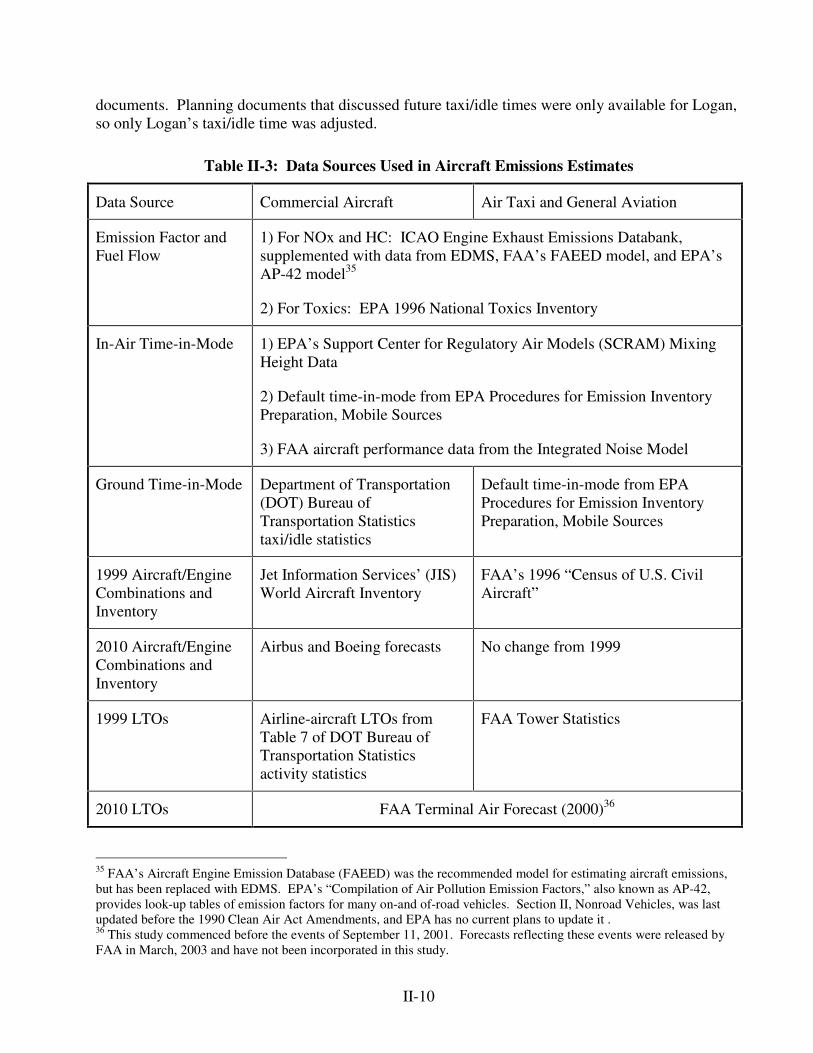
II-10
documents. Planning documents that discussed future taxi/idle times were only available for Logan,so only Logan’ s taxi/idle time was adjusted.
Table II-3: Data Sources Used in Aircraft Emissions Estimates
Data Source Commercial Aircraft Air Taxi and General Aviation
Emission Factor andFuel Flow
1) For NOx and HC: ICAO Engine Exhaust Emissions Databank,supplemented with data from EDMS, FAA’ s FAEED model, and EPA’ sAP-42 model35
2) For Toxics: EPA 1996 National Toxics Inventory
In-Air Time-in-Mode 1) EPA’ s Support Center for Regulatory Air Models (SCRAM) MixingHeight Data
2) Default time-in-mode from EPA Procedures for Emission InventoryPreparation, Mobile Sources
3) FAA aircraft performance data from the Integrated Noise Model
Ground Time-in-Mode Department of Transportation(DOT) Bureau ofTransportation Statisticstaxi/idle statistics
Default time-in-mode from EPAProcedures for Emission InventoryPreparation, Mobile Sources
1999 Aircraft/EngineCombinations andInventory
Jet Information Services’ (JIS)World Aircraft Inventory
FAA’ s 1996 “ Census of U.S. CivilAircraft”
2010 Aircraft/EngineCombinations andInventory
Airbus and Boeing forecasts No change from 1999
1999 LTOs Airline-aircraft LTOs fromTable 7 of DOT Bureau ofTransportation Statisticsactivity statistics
FAA Tower Statistics
2010 LTOs FAA Terminal Air Forecast (2000)36
35 FAA’ s Aircraft Engine Emission Database (FAEED) was the recommended model for estimating aircraft emissions,but has been replaced with EDMS. EPA’ s “ Compilation of Air Pollution Emission Factors,” also known as AP-42,provides look-up tables of emission factors for many on-and of-road vehicles. Section II, Nonroad Vehicles, was lastupdated before the 1990 Clean Air Act Amendments, and EPA has no current plans to update it .36 This study commenced before the events of September 11, 2001. Forecasts reflecting these events were released byFAA in March, 2003 and have not been incorporated in this study.
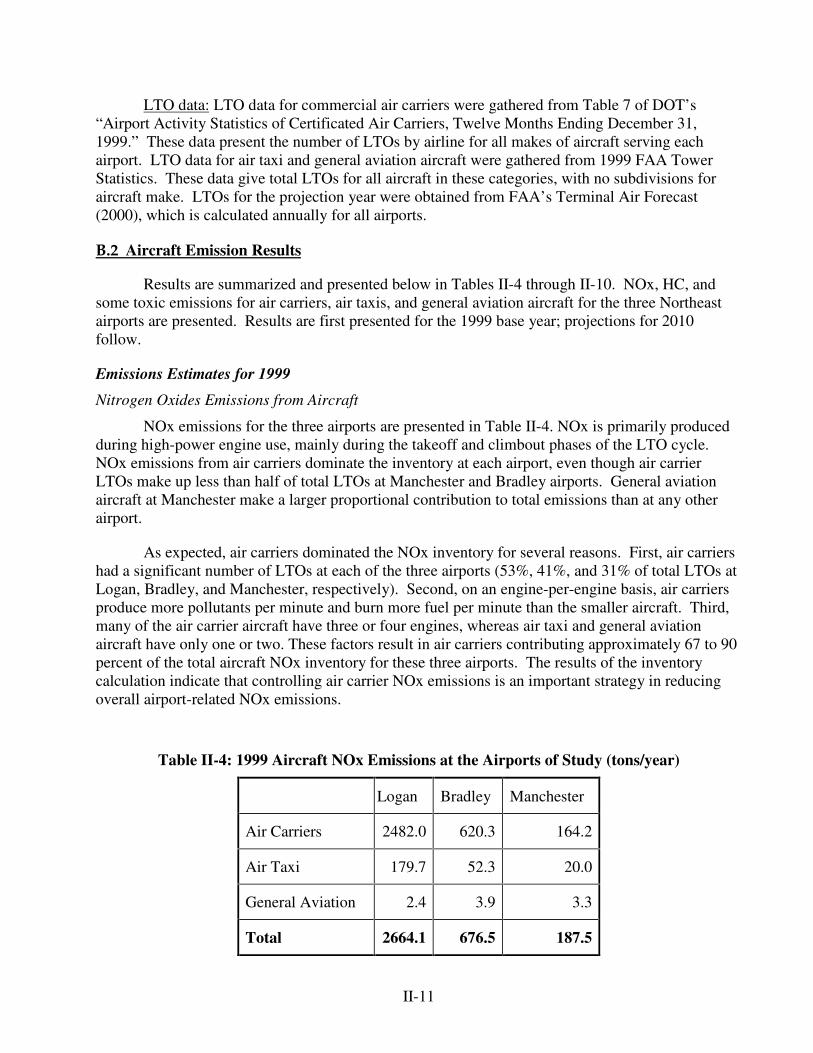
II-11
LTO data: LTO data for commercial air carriers were gathered from Table 7 of DOT’ s“ Airport Activity Statistics of Certificated Air Carriers, Twelve Months Ending December 31,1999.” These data present the number of LTOs by airline for all makes of aircraft serving eachairport. LTO data for air taxi and general aviation aircraft were gathered from 1999 FAA TowerStatistics. These data give total LTOs for all aircraft in these categories, with no subdivisions foraircraft make. LTOs for the projection year were obtained from FAA’ s Terminal Air Forecast(2000), which is calculated annually for all airports.
B.2 Aircraft Emission Results
Results are summarized and presented below in Tables II-4 through II-10. NOx, HC, andsome toxic emissions for air carriers, air taxis, and general aviation aircraft for the three Northeastairports are presented. Results are first presented for the 1999 base year; projections for 2010follow.
Emissions Estimates for 1999
Nitrogen Oxides Emissions from Aircraft
NOx emissions for the three airports are presented in Table II-4. NOx is primarily producedduring high-power engine use, mainly during the takeoff and climbout phases of the LTO cycle.NOx emissions from air carriers dominate the inventory at each airport, even though air carrierLTOs make up less than half of total LTOs at Manchester and Bradley airports. General aviationaircraft at Manchester make a larger proportional contribution to total emissions than at any otherairport.
As expected, air carriers dominated the NOx inventory for several reasons. First, air carriershad a significant number of LTOs at each of the three airports (53%, 41%, and 31% of total LTOs atLogan, Bradley, and Manchester, respectively). Second, on an engine-per-engine basis, air carriersproduce more pollutants per minute and burn more fuel per minute than the smaller aircraft. Third,many of the air carrier aircraft have three or four engines, whereas air taxi and general aviationaircraft have only one or two. These factors result in air carriers contributing approximately 67 to 90percent of the total aircraft NOx inventory for these three airports. The results of the inventorycalculation indicate that controlling air carrier NOx emissions is an important strategy in reducingoverall airport-related NOx emissions.
Table II-4: 1999 Aircraft NOx Emissions at the Airports of Study (tons/year)
Logan Bradley Manchester
Air Carriers 2482.0 620.3 164.2
Air Taxi 179.7 52.3 20.0
General Aviation 2.4 3.9 3.3
Total 2664.1 676.5 187.5
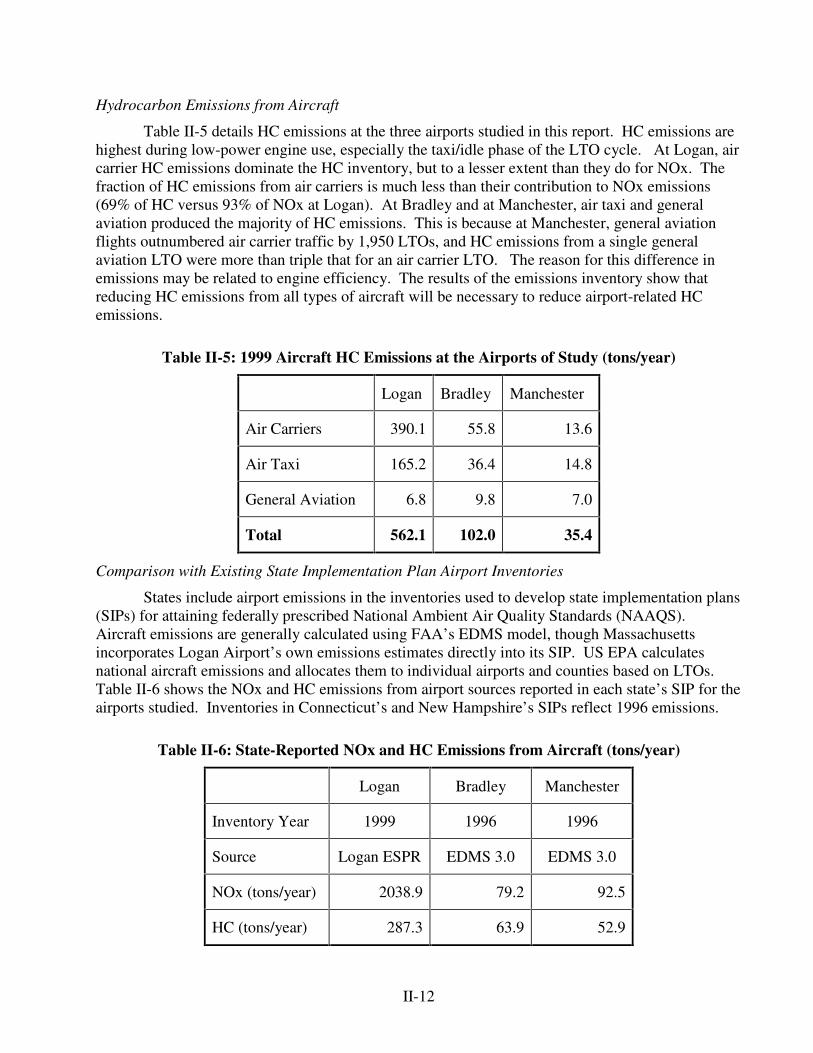
II-12
Hydrocarbon Emissions from Aircraft
Table II-5 details HC emissions at the three airports studied in this report. HC emissions arehighest during low-power engine use, especially the taxi/idle phase of the LTO cycle. At Logan, aircarrier HC emissions dominate the HC inventory, but to a lesser extent than they do for NOx. Thefraction of HC emissions from air carriers is much less than their contribution to NOx emissions(69% of HC versus 93% of NOx at Logan). At Bradley and at Manchester, air taxi and generalaviation produced the majority of HC emissions. This is because at Manchester, general aviationflights outnumbered air carrier traffic by 1,950 LTOs, and HC emissions from a single generalaviation LTO were more than triple that for an air carrier LTO. The reason for this difference inemissions may be related to engine efficiency. The results of the emissions inventory show thatreducing HC emissions from all types of aircraft will be necessary to reduce airport-related HCemissions.
Table II-5: 1999 Aircraft HC Emissions at the Airports of Study (tons/year)
Logan Bradley Manchester
Air Carriers 390.1 55.8 13.6
Air Taxi 165.2 36.4 14.8
General Aviation 6.8 9.8 7.0
Total 562.1 102.0 35.4
Comparison with Existing State Implementation Plan Airport Inventories
States include airport emissions in the inventories used to develop state implementation plans(SIPs) for attaining federally prescribed National Ambient Air Quality Standards (NAAQS).Aircraft emissions are generally calculated using FAA’ s EDMS model, though Massachusettsincorporates Logan Airport’ s own emissions estimates directly into its SIP. US EPA calculatesnational aircraft emissions and allocates them to individual airports and counties based on LTOs.Table II-6 shows the NOx and HC emissions from airport sources reported in each state’ s SIP for theairports studied. Inventories in Connecticut’ s and New Hampshire’ s SIPs reflect 1996 emissions.
Table II-6: State-Reported NOx and HC Emissions from Aircraft (tons/year)
Logan Bradley Manchester
Inventory Year 1999 1996 1996
Source Logan ESPR EDMS 3.0 EDMS 3.0
NOx (tons/year) 2038.9 79.2 92.5
HC (tons/year) 287.3 63.9 52.9
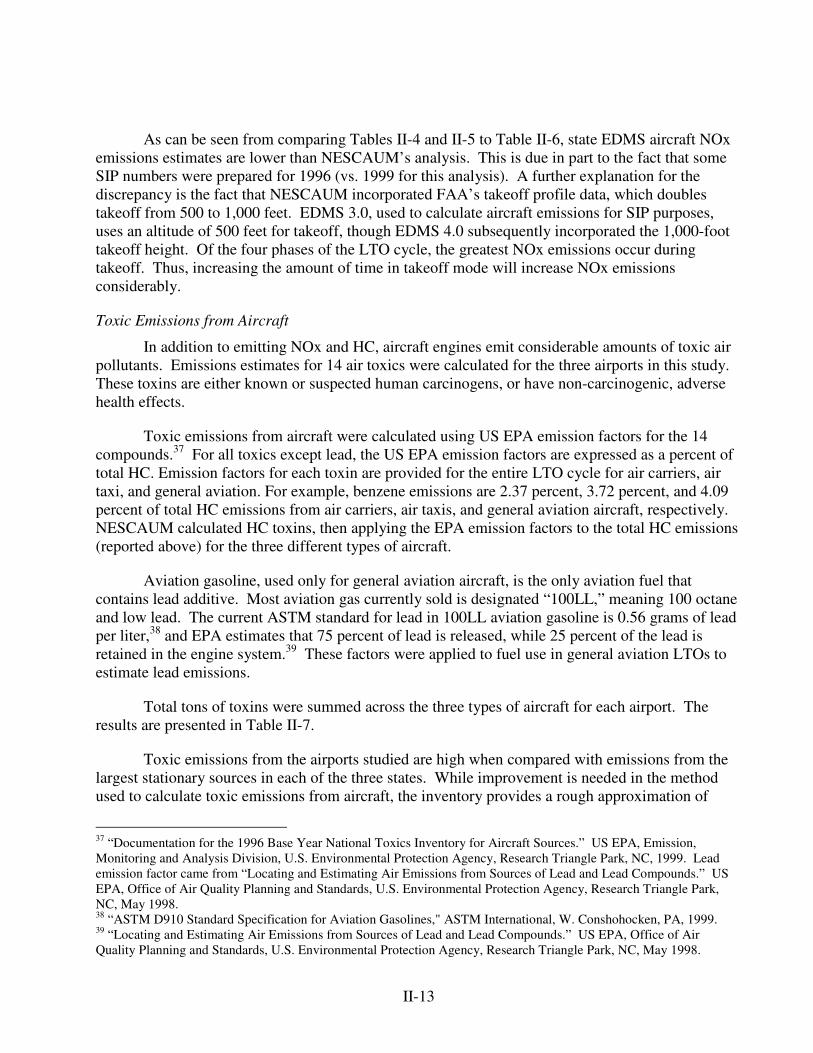
II-13
As can be seen from comparing Tables II-4 and II-5 to Table II-6, state EDMS aircraft NOxemissions estimates are lower than NESCAUM’ s analysis. This is due in part to the fact that someSIP numbers were prepared for 1996 (vs. 1999 for this analysis). A further explanation for thediscrepancy is the fact that NESCAUM incorporated FAA’ s takeoff profile data, which doublestakeoff from 500 to 1,000 feet. EDMS 3.0, used to calculate aircraft emissions for SIP purposes,uses an altitude of 500 feet for takeoff, though EDMS 4.0 subsequently incorporated the 1,000-foottakeoff height. Of the four phases of the LTO cycle, the greatest NOx emissions occur duringtakeoff. Thus, increasing the amount of time in takeoff mode will increase NOx emissionsconsiderably.
Toxic Emissions from Aircraft
In addition to emitting NOx and HC, aircraft engines emit considerable amounts of toxic airpollutants. Emissions estimates for 14 air toxics were calculated for the three airports in this study.These toxins are either known or suspected human carcinogens, or have non-carcinogenic, adversehealth effects.
Toxic emissions from aircraft were calculated using US EPA emission factors for the 14compounds.37 For all toxics except lead, the US EPA emission factors are expressed as a percent oftotal HC. Emission factors for each toxin are provided for the entire LTO cycle for air carriers, airtaxi, and general aviation. For example, benzene emissions are 2.37 percent, 3.72 percent, and 4.09percent of total HC emissions from air carriers, air taxis, and general aviation aircraft, respectively.NESCAUM calculated HC toxins, then applying the EPA emission factors to the total HC emissions(reported above) for the three different types of aircraft.
Aviation gasoline, used only for general aviation aircraft, is the only aviation fuel thatcontains lead additive. Most aviation gas currently sold is designated “ 100LL,” meaning 100 octaneand low lead. The current ASTM standard for lead in 100LL aviation gasoline is 0.56 grams of leadper liter,38 and EPA estimates that 75 percent of lead is released, while 25 percent of the lead isretained in the engine system.39 These factors were applied to fuel use in general aviation LTOs toestimate lead emissions.
Total tons of toxins were summed across the three types of aircraft for each airport. Theresults are presented in Table II-7.
Toxic emissions from the airports studied are high when compared with emissions from thelargest stationary sources in each of the three states. While improvement is needed in the methodused to calculate toxic emissions from aircraft, the inventory provides a rough approximation of
37 “ Documentation for the 1996 Base Year National Toxics Inventory for Aircraft Sources.” US EPA, Emission,Monitoring and Analysis Division, U.S. Environmental Protection Agency, Research Triangle Park, NC, 1999. Leademission factor came from “ Locating and Estimating Air Emissions from Sources of Lead and Lead Compounds.” USEPA, Office of Air Quality Planning and Standards, U.S. Environmental Protection Agency, Research Triangle Park,NC, May 1998.38 “ ASTM D910 Standard Specification for Aviation Gasolines," ASTM International, W. Conshohocken, PA, 1999.39 “ Locating and Estimating Air Emissions from Sources of Lead and Lead Compounds.” US EPA, Office of AirQuality Planning and Standards, U.S. Environmental Protection Agency, Research Triangle Park, NC, May 1998.
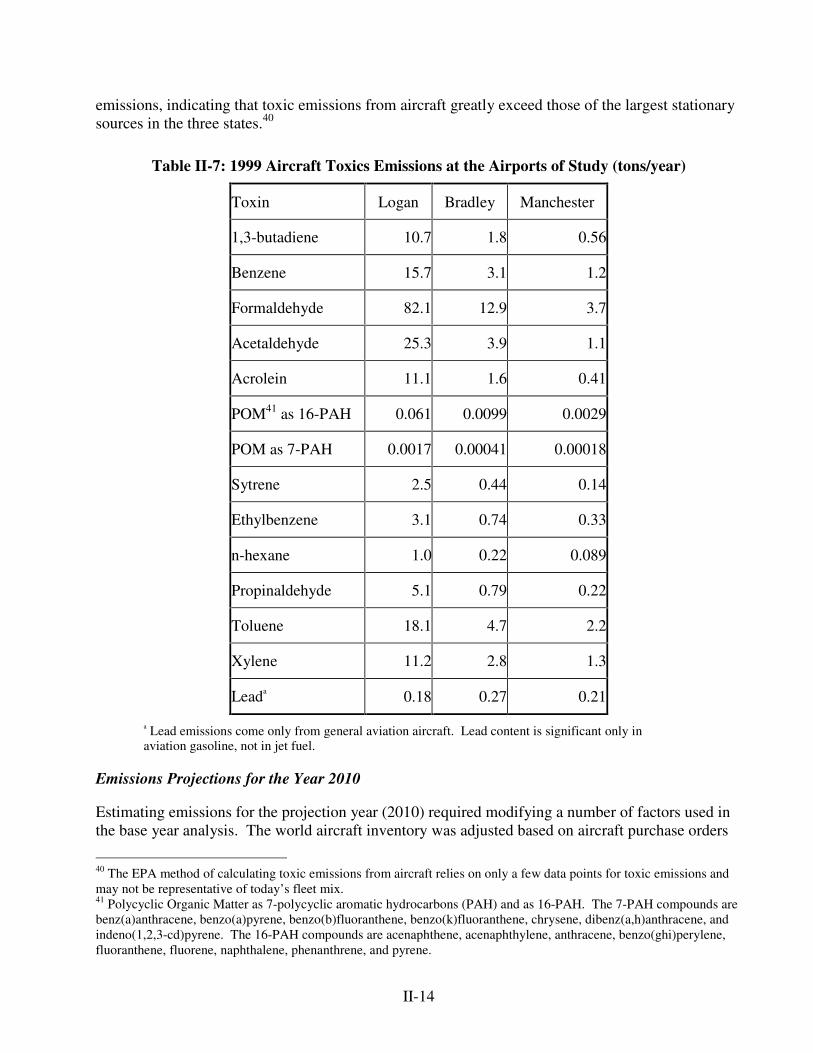
II-14
emissions, indicating that toxic emissions from aircraft greatly exceed those of the largest stationarysources in the three states.40
Table II-7: 1999 Aircraft Toxics Emissions at the Airports of Study (tons/year)
Toxin Logan Bradley Manchester
1,3-butadiene 10.7 1.8 0.56
Benzene 15.7 3.1 1.2
Formaldehyde 82.1 12.9 3.7
Acetaldehyde 25.3 3.9 1.1
Acrolein 11.1 1.6 0.41
POM41 as 16-PAH 0.061 0.0099 0.0029
POM as 7-PAH 0.0017 0.00041 0.00018
Sytrene 2.5 0.44 0.14
Ethylbenzene 3.1 0.74 0.33
n-hexane 1.0 0.22 0.089
Propinaldehyde 5.1 0.79 0.22
Toluene 18.1 4.7 2.2
Xylene 11.2 2.8 1.3
Leada 0.18 0.27 0.21
a Lead emissions come only from general aviation aircraft. Lead content is significant only inaviation gasoline, not in jet fuel.
Emissions Projections for the Year 2010
Estimating emissions for the projection year (2010) required modifying a number of factors used inthe base year analysis. The world aircraft inventory was adjusted based on aircraft purchase orders
40 The EPA method of calculating toxic emissions from aircraft relies on only a few data points for toxic emissions andmay not be representative of today’ s fleet mix.41 Polycyclic Organic Matter as 7-polycyclic aromatic hydrocarbons (PAH) and as 16-PAH. The 7-PAH compounds arebenz(a)anthracene, benzo(a)pyrene, benzo(b)fluoranthene, benzo(k)fluoranthene, chrysene, dibenz(a,h)anthracene, andindeno(1,2,3-cd)pyrene. The 16-PAH compounds are acenaphthene, acenaphthylene, anthracene, benzo(ghi)perylene,fluoranthene, fluorene, naphthalene, phenanthrene, and pyrene.
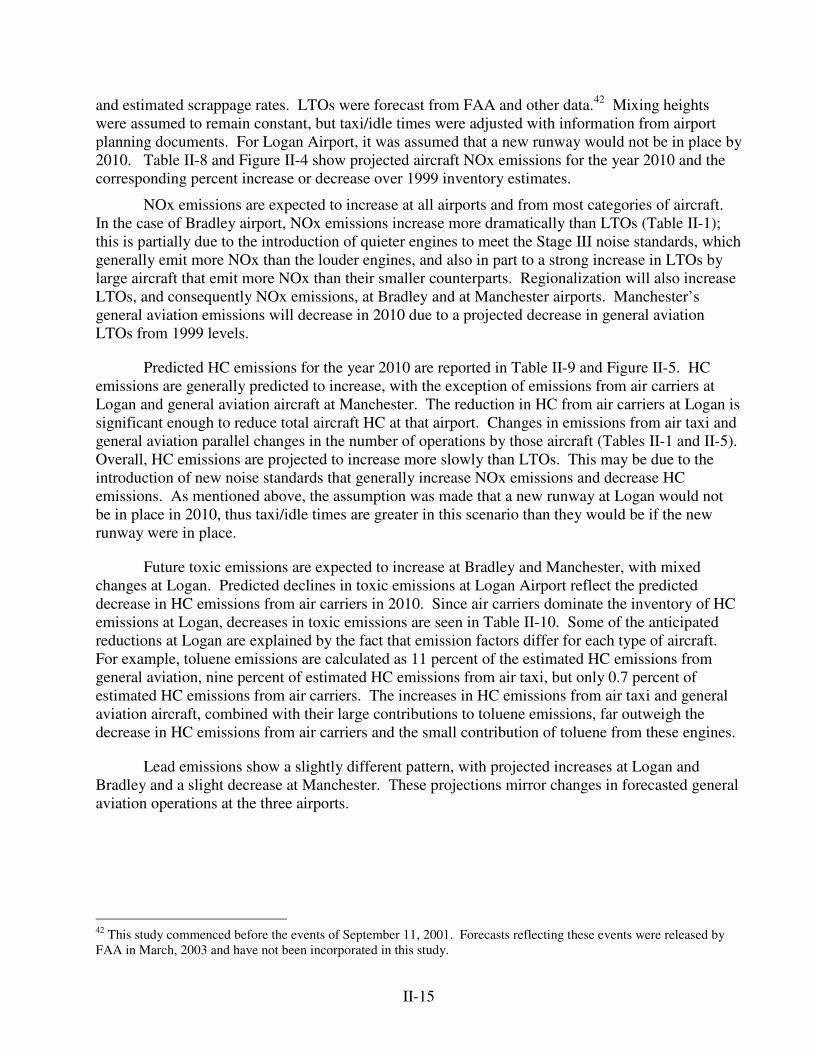
II-15
and estimated scrappage rates. LTOs were forecast from FAA and other data.42 Mixing heightswere assumed to remain constant, but taxi/idle times were adjusted with information from airportplanning documents. For Logan Airport, it was assumed that a new runway would not be in place by2010. Table II-8 and Figure II-4 show projected aircraft NOx emissions for the year 2010 and thecorresponding percent increase or decrease over 1999 inventory estimates.
NOx emissions are expected to increase at all airports and from most categories of aircraft.In the case of Bradley airport, NOx emissions increase more dramatically than LTOs (Table II-1);this is partially due to the introduction of quieter engines to meet the Stage III noise standards, whichgenerally emit more NOx than the louder engines, and also in part to a strong increase in LTOs bylarge aircraft that emit more NOx than their smaller counterparts. Regionalization will also increaseLTOs, and consequently NOx emissions, at Bradley and at Manchester airports. Manchester’ sgeneral aviation emissions will decrease in 2010 due to a projected decrease in general aviationLTOs from 1999 levels.
Predicted HC emissions for the year 2010 are reported in Table II-9 and Figure II-5. HCemissions are generally predicted to increase, with the exception of emissions from air carriers atLogan and general aviation aircraft at Manchester. The reduction in HC from air carriers at Logan issignificant enough to reduce total aircraft HC at that airport. Changes in emissions from air taxi andgeneral aviation parallel changes in the number of operations by those aircraft (Tables II-1 and II-5).Overall, HC emissions are projected to increase more slowly than LTOs. This may be due to theintroduction of new noise standards that generally increase NOx emissions and decrease HCemissions. As mentioned above, the assumption was made that a new runway at Logan would notbe in place in 2010, thus taxi/idle times are greater in this scenario than they would be if the newrunway were in place.
Future toxic emissions are expected to increase at Bradley and Manchester, with mixedchanges at Logan. Predicted declines in toxic emissions at Logan Airport reflect the predicteddecrease in HC emissions from air carriers in 2010. Since air carriers dominate the inventory of HCemissions at Logan, decreases in toxic emissions are seen in Table II-10. Some of the anticipatedreductions at Logan are explained by the fact that emission factors differ for each type of aircraft.For example, toluene emissions are calculated as 11 percent of the estimated HC emissions fromgeneral aviation, nine percent of estimated HC emissions from air taxi, but only 0.7 percent ofestimated HC emissions from air carriers. The increases in HC emissions from air taxi and generalaviation aircraft, combined with their large contributions to toluene emissions, far outweigh thedecrease in HC emissions from air carriers and the small contribution of toluene from these engines.
Lead emissions show a slightly different pattern, with projected increases at Logan andBradley and a slight decrease at Manchester. These projections mirror changes in forecasted generalaviation operations at the three airports.
42 This study commenced before the events of September 11, 2001. Forecasts reflecting these events were released byFAA in March, 2003 and have not been incorporated in this study.
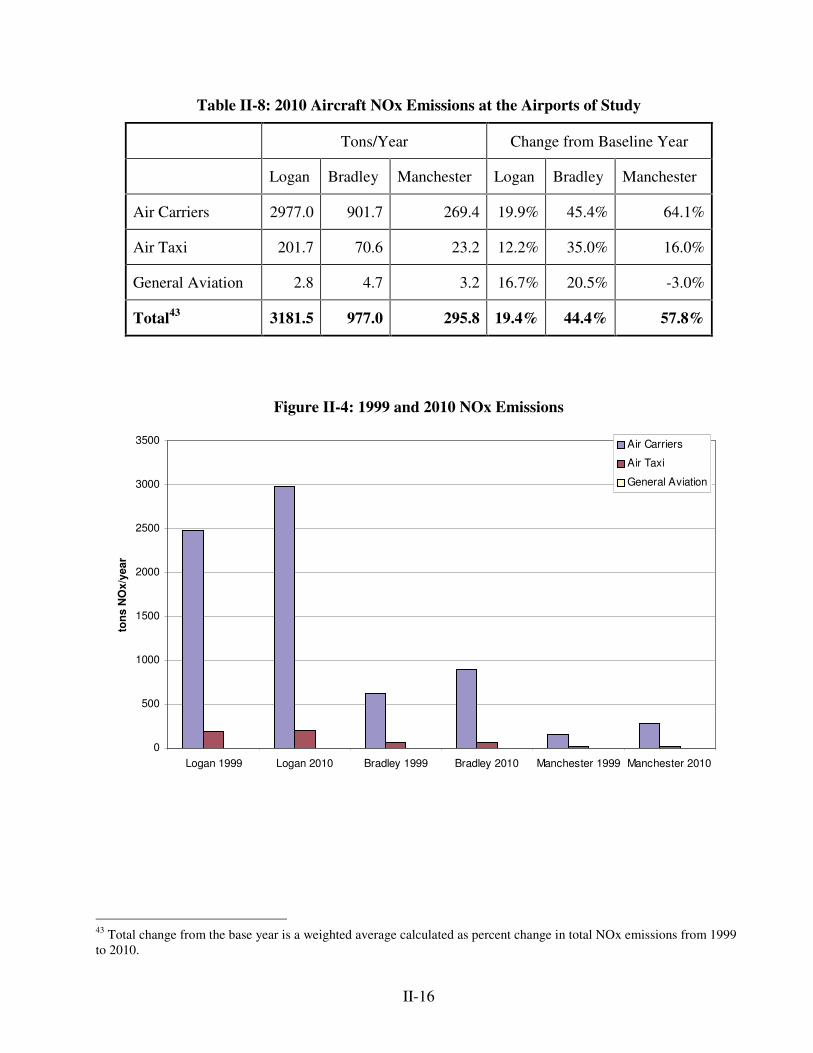
II-16
Table II-8: 2010 Aircraft NOx Emissions at the Airports of Study
Tons/Year Change from Baseline Year
Logan Bradley Manchester Logan Bradley Manchester
Air Carriers 2977.0 901.7 269.4 19.9% 45.4% 64.1%
Air Taxi 201.7 70.6 23.2 12.2% 35.0% 16.0%
General Aviation 2.8 4.7 3.2 16.7% 20.5% -3.0%
Total43 3181.5 977.0 295.8 19.4% 44.4% 57.8%
Figure II-4: 1999 and 2010 NOx Emissions
0
500
1000
1500
2000
2500
3000
3500
Logan 1999 Logan 2010 Bradley 1999 Bradley 2010 Manchester 1999 Manchester 2010
tons
NO
x/ye
ar
Air Carriers
Air Taxi
General Aviation
43 Total change from the base year is a weighted average calculated as percent change in total NOx emissions from 1999to 2010.
II-17
Table II-9: 2010 Aircraft HC Emissions at the Airports of Study
Tons/Year Change from Baseline Year
Logan Bradley Manchester Logan Bradley Manchester
Air Carriers 261.1 56.7 17.8 -33.1% 1.6% 30.9%
Air Taxi 226.5 49.2 17.2 37.1% 35.2% 16.2%
General Aviation 8.1 11.8 6.7 19.1% 20.4% -4.3%
Total 495.7 117.7 41.7 -11.8% 15.4% 17.8%
Figure II-5: 2010 Aircraft HC Emissions at the Airports of Study
0
50
100
150
200
250
300
350
400
Logan 1999 Logan 2010 Bradley 1999 Bradley 2010 Manchester 1999 Manchester 2010
tons
HC
/yea
r
Air Carriers
Air Taxi
General Aviation
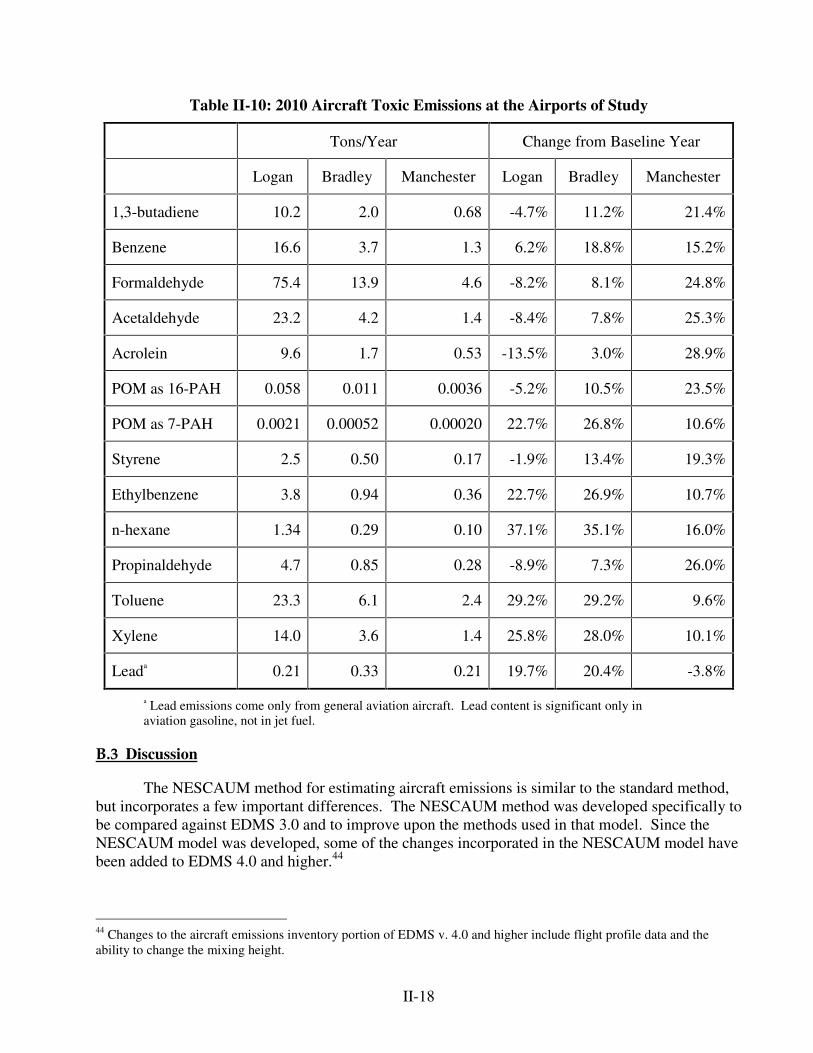
II-18
Table II-10: 2010 Aircraft Toxic Emissions at the Airports of Study
Tons/Year Change from Baseline Year
Logan Bradley Manchester Logan Bradley Manchester
1,3-butadiene 10.2 2.0 0.68 -4.7% 11.2% 21.4%
Benzene 16.6 3.7 1.3 6.2% 18.8% 15.2%
Formaldehyde 75.4 13.9 4.6 -8.2% 8.1% 24.8%
Acetaldehyde 23.2 4.2 1.4 -8.4% 7.8% 25.3%
Acrolein 9.6 1.7 0.53 -13.5% 3.0% 28.9%
POM as 16-PAH 0.058 0.011 0.0036 -5.2% 10.5% 23.5%
POM as 7-PAH 0.0021 0.00052 0.00020 22.7% 26.8% 10.6%
Styrene 2.5 0.50 0.17 -1.9% 13.4% 19.3%
Ethylbenzene 3.8 0.94 0.36 22.7% 26.9% 10.7%
n-hexane 1.34 0.29 0.10 37.1% 35.1% 16.0%
Propinaldehyde 4.7 0.85 0.28 -8.9% 7.3% 26.0%
Toluene 23.3 6.1 2.4 29.2% 29.2% 9.6%
Xylene 14.0 3.6 1.4 25.8% 28.0% 10.1%
Leada 0.21 0.33 0.21 19.7% 20.4% -3.8%
a Lead emissions come only from general aviation aircraft. Lead content is significant only inaviation gasoline, not in jet fuel.
B.3 Discussion
The NESCAUM method for estimating aircraft emissions is similar to the standard method,but incorporates a few important differences. The NESCAUM method was developed specifically tobe compared against EDMS 3.0 and to improve upon the methods used in that model. Since theNESCAUM model was developed, some of the changes incorporated in the NESCAUM model havebeen added to EDMS 4.0 and higher.44
44 Changes to the aircraft emissions inventory portion of EDMS v. 4.0 and higher include flight profile data and theability to change the mixing height.
II-19
Standard inventories use FAA’ s EDMS model, the tool required by FAA for aircraftemission inventories. EDMS generally follows the same basic emissions calculation as theNESCAUM model (emissions = emission factor * fuel flow * time-in-mode) and utilizes the samedata for emissions factor and fuel flow, but many of the inputs are different. For example, EDMS3.0 requires the user to assign one engine to each make of aircraft for the entire airport, whereas theNESCAUM model incorporates a world aircraft inventory that reflects actual engine and aircraftpopulations. Most inventories use the default times-in-mode suggested by ICAO instead of theairport-specific times developed in this study. The standard methodology incorporates landing andtakeoff (LTO) data by aircraft for the airport being studied, whereas the NESCAUM method usesmore specific LTO data for aircraft models by airline. These differences are summarized in TableII-11.
The NESCAUM methodology for estimating aircraft emissions yields robust results thatovercome some deficiencies of the standard methodologies by using an inventory of aircraft/enginecombinations owned by each airline, tallied for a specific calendar year. NESCAUM also calculatesthe mixing height and adjusted times-in-mode for each airport. At the airports studied, the annualmixing height is below the default of 3000 feet, tending to reduce emissions estimates compared tothe standard methodology. Moreover, because the NESCAUM method calculates monthlyemissions, it is sensitive to seasonal changes in mixing height. This is important as some air qualityconcerns, such as ozone (which is formed primarily in the summertime), are seasonal in nature.Additionally, NESCAUM incorporated FAA flight profile data that suggested that the takeoff phaseof the LTO cycle extends to an altitude of 1000 feet, not the default of 500 feet. This lengthens thetime-in-mode for the takeoff – the highest-powered phase – while simultaneously decreasing thetime-in-mode for the climbout phase, causing a net increase in calculated NOx emissions.
Despite the additional data used in the NESCAUM methodology for estimating aircraftemissions, uncertainties remain in all aviation inventories. First, the NESCAUM model and EDMSare based on data from the ICAO Emissions Databank, measured at four power settings representingthe four phases of aircraft operations in a reference LTO cycle. These power settings may not becharacteristic of actual LTO cycles. For example, the taxi/idle phase includes aircraft movement atspeeds up to about 30 miles per hour as well as idling on the runway and at the gate. A single powersetting of seven percent captures only an average emission factor, and does not include anyemissions changes for acceleration. Second, engine safety requirements effect emissions duringtakeoff. In two-engine planes, each engine must be strong enough to support the aircraft if the othershould fail. This means that each engine is capable of much greater thrust than is needed to lift theplane, so many takeoffs are made at “ reduced thrust,” with corresponding reduced emissions. Theassumption that takeoff occurs at full power then, likely overestimates emissions. Becauseinformation about actual in-flight operations is considered confidential and is not always recordedautomatically during flights, it is very difficult to gather accurate data about this factor. The sameoverestimation is included in EDMS. Third, emission factors do not reflect deterioration in eithermodel; the effects of this omission are not well known (see footnote 33 on page II-9).
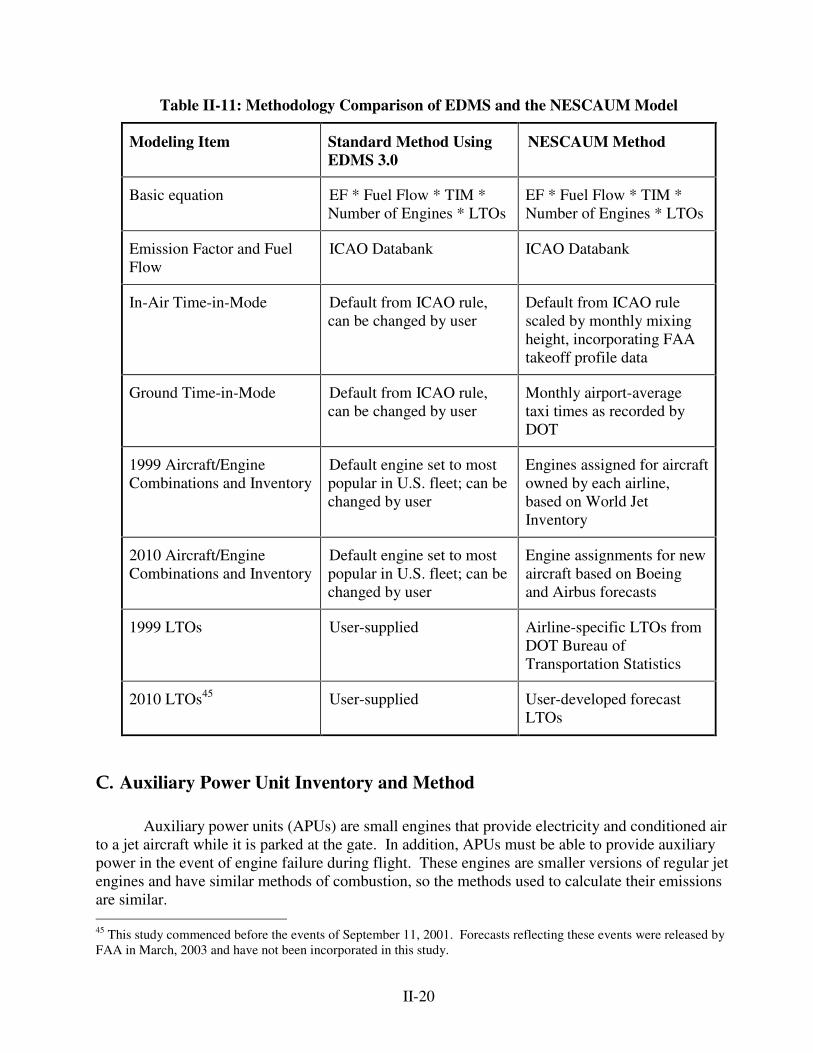
II-20
Table II-11: Methodology Comparison of EDMS and the NESCAUM Model
Modeling Item Standard Method UsingEDMS 3.0
NESCAUM Method
Basic equation EF * Fuel Flow * TIM *Number of Engines * LTOs
EF * Fuel Flow * TIM *Number of Engines * LTOs
Emission Factor and FuelFlow
ICAO Databank ICAO Databank
In-Air Time-in-Mode Default from ICAO rule,can be changed by user
Default from ICAO rulescaled by monthly mixingheight, incorporating FAAtakeoff profile data
Ground Time-in-Mode Default from ICAO rule,can be changed by user
Monthly airport-averagetaxi times as recorded byDOT
1999 Aircraft/EngineCombinations and Inventory
Default engine set to mostpopular in U.S. fleet; can bechanged by user
Engines assigned for aircraftowned by each airline,based on World JetInventory
2010 Aircraft/EngineCombinations and Inventory
Default engine set to mostpopular in U.S. fleet; can bechanged by user
Engine assignments for newaircraft based on Boeingand Airbus forecasts
1999 LTOs User-supplied Airline-specific LTOs fromDOT Bureau ofTransportation Statistics
2010 LTOs45 User-supplied User-developed forecastLTOs
C. Auxiliary Power Unit Inventory and Method
Auxiliary power units (APUs) are small engines that provide electricity and conditioned airto a jet aircraft while it is parked at the gate. In addition, APUs must be able to provide auxiliarypower in the event of engine failure during flight. These engines are smaller versions of regular jetengines and have similar methods of combustion, so the methods used to calculate their emissionsare similar. 45 This study commenced before the events of September 11, 2001. Forecasts reflecting these events were released byFAA in March, 2003 and have not been incorporated in this study.
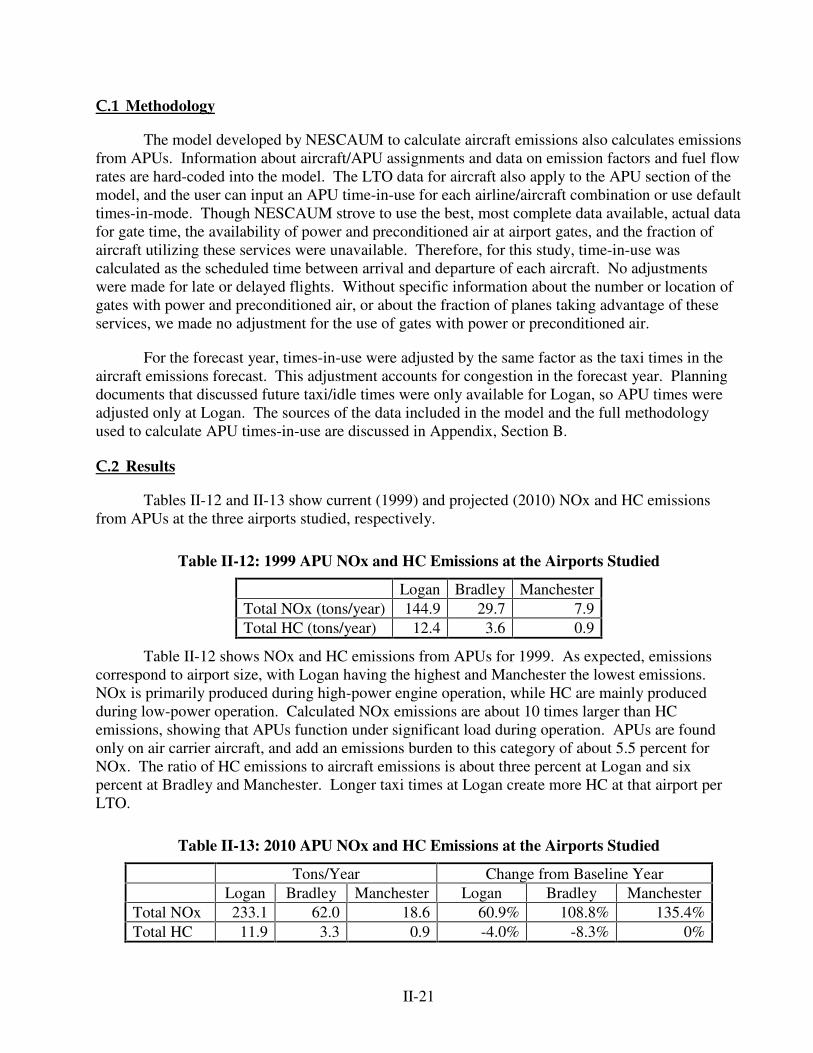
II-21
C.1 Methodology
The model developed by NESCAUM to calculate aircraft emissions also calculates emissionsfrom APUs. Information about aircraft/APU assignments and data on emission factors and fuel flowrates are hard-coded into the model. The LTO data for aircraft also apply to the APU section of themodel, and the user can input an APU time-in-use for each airline/aircraft combination or use defaulttimes-in-mode. Though NESCAUM strove to use the best, most complete data available, actual datafor gate time, the availability of power and preconditioned air at airport gates, and the fraction ofaircraft utilizing these services were unavailable. Therefore, for this study, time-in-use wascalculated as the scheduled time between arrival and departure of each aircraft. No adjustmentswere made for late or delayed flights. Without specific information about the number or location ofgates with power and preconditioned air, or about the fraction of planes taking advantage of theseservices, we made no adjustment for the use of gates with power or preconditioned air.
For the forecast year, times-in-use were adjusted by the same factor as the taxi times in theaircraft emissions forecast. This adjustment accounts for congestion in the forecast year. Planningdocuments that discussed future taxi/idle times were only available for Logan, so APU times wereadjusted only at Logan. The sources of the data included in the model and the full methodologyused to calculate APU times-in-use are discussed in Appendix, Section B.
C.2 Results
Tables II-12 and II-13 show current (1999) and projected (2010) NOx and HC emissionsfrom APUs at the three airports studied, respectively.
Table II-12: 1999 APU NOx and HC Emissions at the Airports Studied
Logan Bradley ManchesterTotal NOx (tons/year) 144.9 29.7 7.9Total HC (tons/year) 12.4 3.6 0.9
Table II-12 shows NOx and HC emissions from APUs for 1999. As expected, emissionscorrespond to airport size, with Logan having the highest and Manchester the lowest emissions.NOx is primarily produced during high-power engine operation, while HC are mainly producedduring low-power operation. Calculated NOx emissions are about 10 times larger than HCemissions, showing that APUs function under significant load during operation. APUs are foundonly on air carrier aircraft, and add an emissions burden to this category of about 5.5 percent forNOx. The ratio of HC emissions to aircraft emissions is about three percent at Logan and sixpercent at Bradley and Manchester. Longer taxi times at Logan create more HC at that airport perLTO.
Table II-13: 2010 APU NOx and HC Emissions at the Airports Studied
Tons/Year Change from Baseline YearLogan Bradley Manchester Logan Bradley Manchester
Total NOx 233.1 62.0 18.6 60.9% 108.8% 135.4%Total HC 11.9 3.3 0.9 -4.0% -8.3% 0%
II-22
Table II-13 shows estimated NOx and HC emissions for 2010.46 Logan is projected tocontinue to produce more emissions than the other airports, and its NOx emissions are forecast to beabout 20 times larger than its HC emissions. Note that the changes from the 1999 baseline are muchlarger than the growth in LTOs or than the combined growth of LTOs and increase of APU time atLogan. The growth from the baseline and the change in the ratio of NOx to HC can be explained bythe changes in the APUs on new aircraft expected to enter service in the coming decade. On manyof the new aircraft, the APUs tend to have NOx to HC ratios of 20 or more on an LTO basis,whereas more of the older aircraft have APUs with NOx to HC ratios closer to four. This change infleet mix also can explain why HC emissions do not grow at the Bradley and Manchester airports.APUs in newer planes have significantly lower HC emissions than those in older planes.
C.3 Discussion
Many approximations and simplifying assumptions were necessary to estimate emissionsfrom APUs. First, data on APU emission factors and aircraft/APU combinations are sparse. Theseengines do not fall under the emission requirements for the main engines, and therefore are notsubject to any controls or emission certification programs. Emission factors come from severalsources, and work comparing conditions for emissions testing to in-use conditions for these enginesis not available.
Second, time-in-use calculations included some substitutions. Time-in-use was calculated asthe gate turnaround time, or the difference between arrival and departure times, for an aircraft.These calculations were made from airport schedules with varying levels of detail and completeness.For example, the schedule used for Manchester Airport only gave aircraft make (i.e., Boeing 737 orDC-9), whereas Bradley Airport’ s schedule also specified model (i.e., Boeing 737-300 or DC-9-50).The schedules did not include all of the aircraft listed in the LTO table, so substitutions of APUtime-in-use were necessary. Substitutions were made using similarly sized aircraft, but the need forsubstitutions added a degree of uncertainty to the calculation that is difficult to measure. Scheduleswere not available for Logan’ s domestic flights, so APU times for Bradley were used in the Logancalculations.
Third, assumptions about the use of electrified gates were conservative. Because informationabout the number and locations of gates was not available, the APU emissions calculations assumedthat no powered gates were in use. However, powered gates are in use at portions of the airportsstudied. This assumption pushes the results toward the upper limit of actual emissions.
To date, emissions from APUs have rarely been included in SIPs or other inventories.Though not a large contributor to airport emissions, these small engines produce a sizeable quantityof NOx and HC at airports. As can be seen from Tables II-12 and II-13, APU emissions representapproximately five percent of airport NOx emissions. Large increases in APU NOx emissions in2010 can be attributed to growth at Bradley and Manchester due to regionalization. Although APUsare a relatively small source of emissions in comparison with aircraft engines, cost effectivemeasures to reduce APU emissions exist, and are discussed in the next chapter.
46 This study commenced before the events of September 11, 2001. Forecasts reflecting these events were released byFAA in March, 2003 and have not been incorporated in this study.
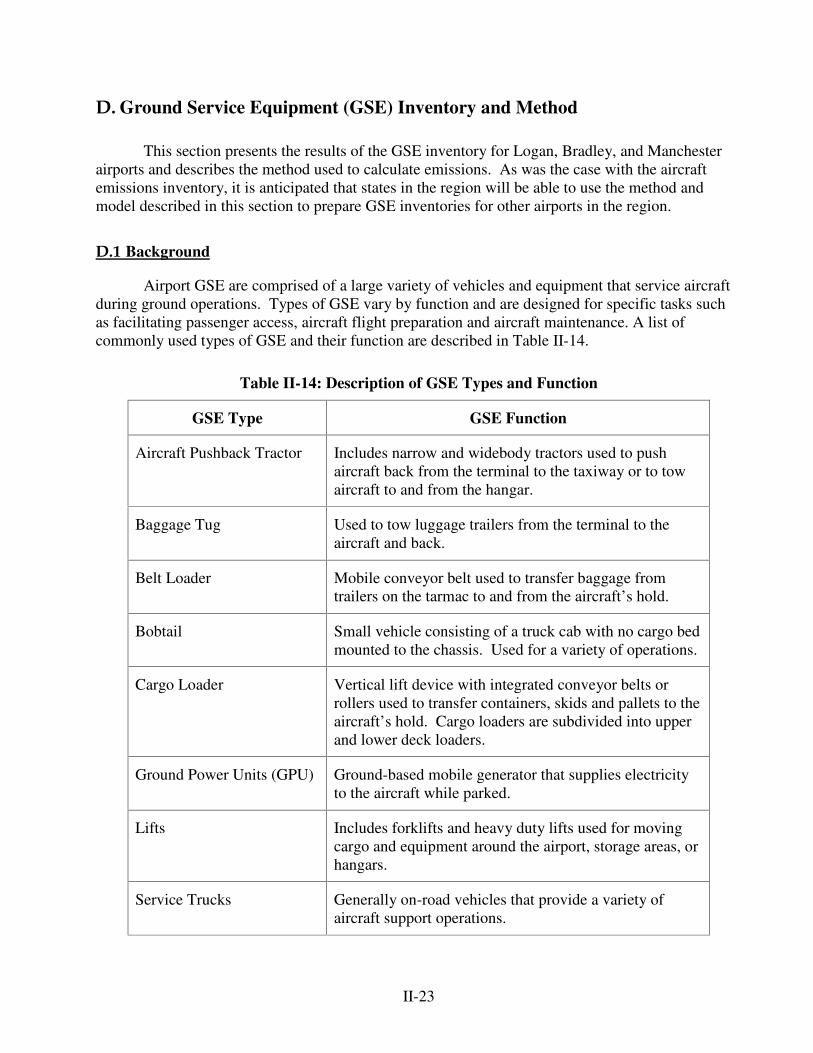
II-23
D. Ground Service Equipment (GSE) Inventory and Method
This section presents the results of the GSE inventory for Logan, Bradley, and Manchesterairports and describes the method used to calculate emissions. As was the case with the aircraftemissions inventory, it is anticipated that states in the region will be able to use the method andmodel described in this section to prepare GSE inventories for other airports in the region.
D.1 Background
Airport GSE are comprised of a large variety of vehicles and equipment that service aircraftduring ground operations. Types of GSE vary by function and are designed for specific tasks suchas facilitating passenger access, aircraft flight preparation and aircraft maintenance. A list ofcommonly used types of GSE and their function are described in Table II-14.
Table II-14: Description of GSE Types and Function
GSE Type GSE Function
Aircraft Pushback Tractor Includes narrow and widebody tractors used to pushaircraft back from the terminal to the taxiway or to towaircraft to and from the hangar.
Baggage Tug Used to tow luggage trailers from the terminal to theaircraft and back.
Belt Loader Mobile conveyor belt used to transfer baggage fromtrailers on the tarmac to and from the aircraft’ s hold.
Bobtail Small vehicle consisting of a truck cab with no cargo bedmounted to the chassis. Used for a variety of operations.
Cargo Loader Vertical lift device with integrated conveyor belts orrollers used to transfer containers, skids and pallets to theaircraft’ s hold. Cargo loaders are subdivided into upperand lower deck loaders.
Ground Power Units (GPU) Ground-based mobile generator that supplies electricityto the aircraft while parked.
Lifts Includes forklifts and heavy duty lifts used for movingcargo and equipment around the airport, storage areas, orhangars.
Service Trucks Generally on-road vehicles that provide a variety ofaircraft support operations.
II-24
There are three categories of GSE operators: individual airlines, fixed base operators (FBO)and airport management. Airlines are defined as air carriers holding a Certificate of PublicConvenience and Necessity issued by the US Department of Transportation (US DOT) to engage inair transportation. Fixed base operators are service providers permanently located at an airport thatprovide a variety of services to airlines, passengers, and airport operators. In this study, the primaryFBOs of interest are those engaged in GSE, fuel, and maintenance service contracts to airlines andairport managers. Airport management authorities are responsible for the day-to-day operation ofairport facilities, including runway maintenance, grounds keeping, safety, and security.
Comparison with Existing Method to Calculate GSE Emissions
The approach taken in this study was to calculate GSE emissions from an inventory ofequipment and hours of use at airports. The more common approach to developing GSE populationand activity data is through the use of a regression equation that estimates GSE activity based onLTOs. While NESCAUM has performed such calculations in a previous effort, we chose to directlysurvey airports to create a bottom-up inventory for this analysis due to deficits identified with theregression methodology.47 Two main shortcomings were identified in the existing regressionequations. First, the regression approach may not provide an emissions inventory representative ofairports in the Northeast. The studies which were used to develop the existing regression equationswere located primarily in California and Texas, where snow removal equipment is not necessary andadditional activity associated with delays and deicing was not found.48 Second, the regressionequations are derived exclusively from airline data. Using data solely from airlines excludes aninventory component crucial to airport operation: airport management vehicles. These vehiclesoperate at every airport and perform the day-to-day functions that keep the airport operating safely.Airport management vehicles include ground maintenance vehicles such as runway sweepers, grasscutting equipment, snow removal equipment and crash/fire/rescue vehicles.
D.2 GSE Emissions Inventory Model
The GSE emission inventory for each airport was calculated using a model developed forNESCAUM by EEA specifically for this analysis: the “ GSE Emissions Calculator, v. 1.0,” (“ themodel” ). The model is built on a Microsoft Excel spreadsheet platform. Emissions are calculatedusing the following equation:
47 “ Heavy-Duty Engine Emissions in the Northeast,” Northeast States for Coordinated Air Use Management, May 1997.48 The regression method was first developed for the California South Coast Air Basin FIP in 1995 (DraftTechnical Support Document, Aircraft/Airports California FIP IFR, Energy and Environmental Analysis, Inc., preparedfor USEPA, Motor Vehicle Emission Laboratory, 1995, pp. 2-59). This approach applies a statistically derivedequation that associates GSE activity with aircraft LTOs. In 1999, a new regression equation was derived forestimating GSE populations which is more representative of airports outside of Southern California.(“ Technical Support for Development of Airport Ground Support Equipment Emission Reductions,” EPA420-R-99-007,USEPA, May 1999.) This new equation is based on inventories collected from fourteen airlines at ten airports.Although this inventory uses information collected from airports outside of California, six of the tenparticipating airports were located either in the southwestern U.S. Only two airports represent areas outsideof the western United States. These are Boston’s Logan airport and BWI located in Baltimore, Maryland.
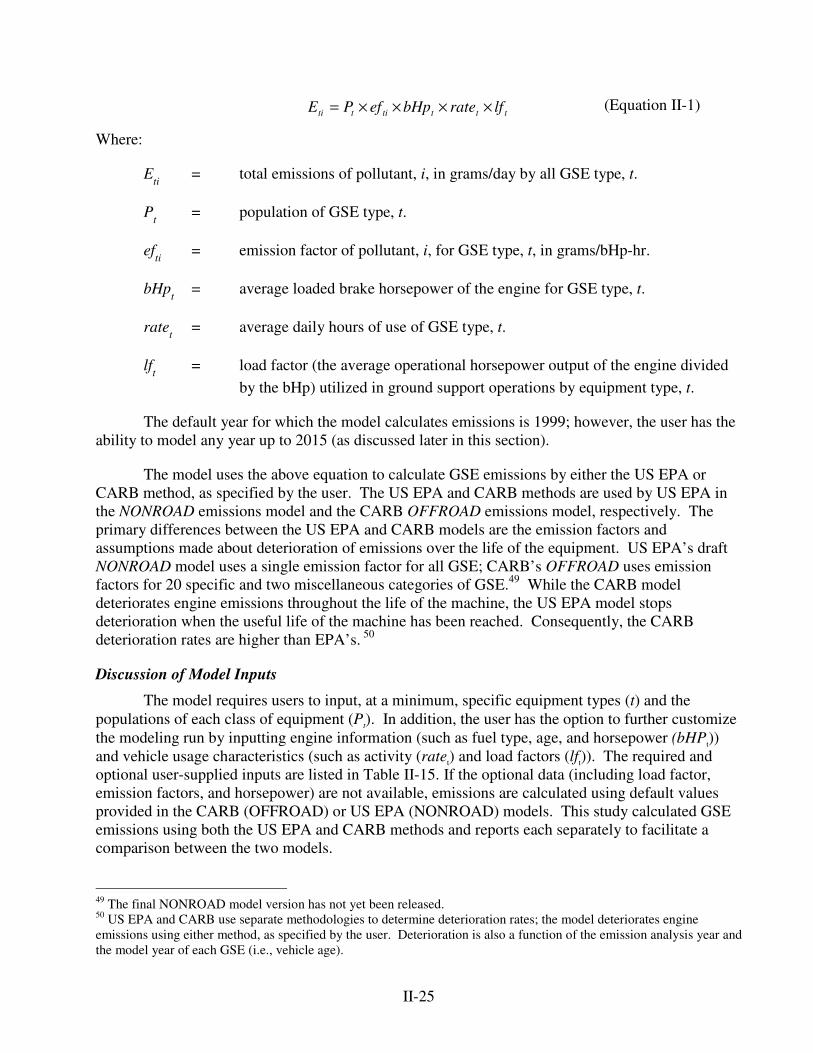
II-25
(Equation II-1)
Where:
Eti = total emissions of pollutant, i, in grams/day by all GSE type, t.
Pt = population of GSE type, t.
efti = emission factor of pollutant, i, for GSE type, t, in grams/bHp-hr.
bHpt = average loaded brake horsepower of the engine for GSE type, t.
ratet = average daily hours of use of GSE type, t.
lft = load factor (the average operational horsepower output of the engine dividedby the bHp) utilized in ground support operations by equipment type, t.
The default year for which the model calculates emissions is 1999; however, the user has theability to model any year up to 2015 (as discussed later in this section).
The model uses the above equation to calculate GSE emissions by either the US EPA orCARB method, as specified by the user. The US EPA and CARB methods are used by US EPA inthe NONROAD emissions model and the CARB OFFROAD emissions model, respectively. Theprimary differences between the US EPA and CARB models are the emission factors andassumptions made about deterioration of emissions over the life of the equipment. US EPA’ s draftNONROAD model uses a single emission factor for all GSE; CARB’ s OFFROAD uses emissionfactors for 20 specific and two miscellaneous categories of GSE.49 While the CARB modeldeteriorates engine emissions throughout the life of the machine, the US EPA model stopsdeterioration when the useful life of the machine has been reached. Consequently, the CARBdeterioration rates are higher than EPA’ s. 50
Discussion of Model Inputs
The model requires users to input, at a minimum, specific equipment types (t) and thepopulations of each class of equipment (Pt). In addition, the user has the option to further customizethe modeling run by inputting engine information (such as fuel type, age, and horsepower (bHPt))and vehicle usage characteristics (such as activity (ratet) and load factors (lft)). The required andoptional user-supplied inputs are listed in Table II-15. If the optional data (including load factor,emission factors, and horsepower) are not available, emissions are calculated using default valuesprovided in the CARB (OFFROAD) or US EPA (NONROAD) models. This study calculated GSEemissions using both the US EPA and CARB methods and reports each separately to facilitate acomparison between the two models.
49 The final NONROAD model version has not yet been released.50 US EPA and CARB use separate methodologies to determine deterioration rates; the model deteriorates engineemissions using either method, as specified by the user. Deterioration is also a function of the emission analysis year andthe model year of each GSE (i.e., vehicle age).
ttttitti lfratebHpefPE ××××=
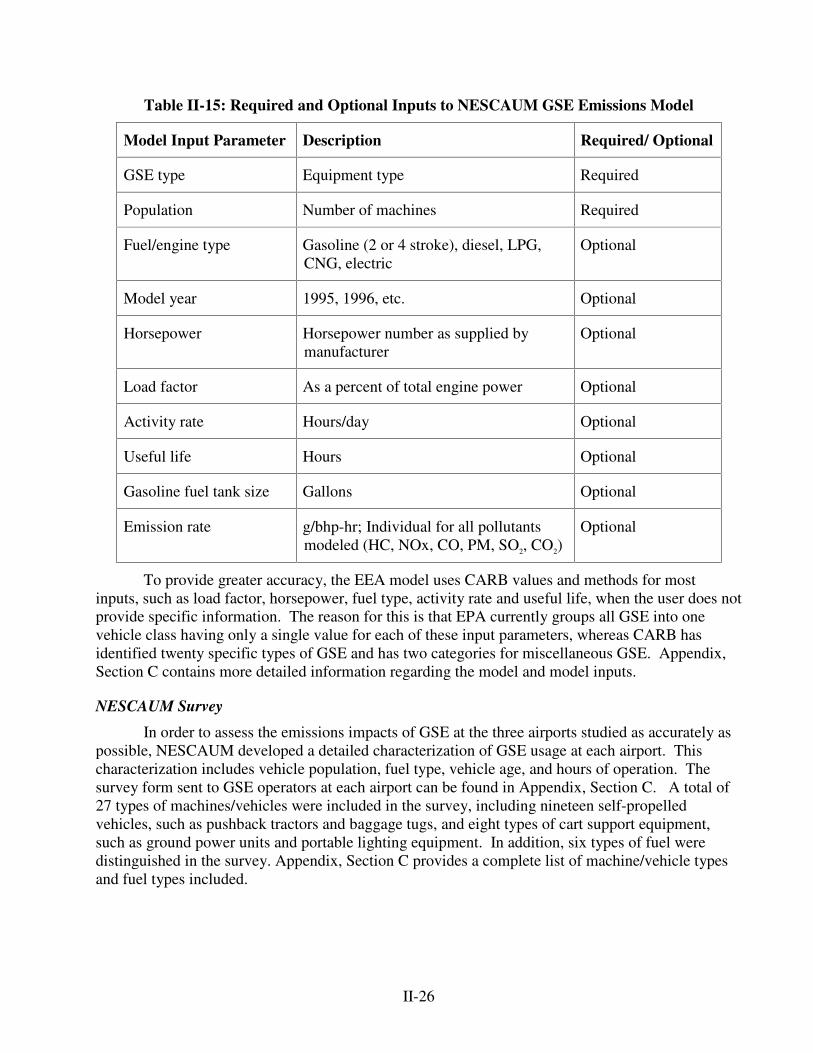
II-26
Table II-15: Required and Optional Inputs to NESCAUM GSE Emissions Model
Model Input Parameter Description Required/ Optional
GSE type Equipment type Required
Population Number of machines Required
Fuel/engine type Gasoline (2 or 4 stroke), diesel, LPG,CNG, electric
Optional
Model year 1995, 1996, etc. Optional
Horsepower Horsepower number as supplied bymanufacturer
Optional
Load factor As a percent of total engine power Optional
Activity rate Hours/day Optional
Useful life Hours Optional
Gasoline fuel tank size Gallons Optional
Emission rate g/bhp-hr; Individual for all pollutantsmodeled (HC, NOx, CO, PM, SO2, CO2)
Optional
To provide greater accuracy, the EEA model uses CARB values and methods for mostinputs, such as load factor, horsepower, fuel type, activity rate and useful life, when the user does notprovide specific information. The reason for this is that EPA currently groups all GSE into onevehicle class having only a single value for each of these input parameters, whereas CARB hasidentified twenty specific types of GSE and has two categories for miscellaneous GSE. Appendix,Section C contains more detailed information regarding the model and model inputs.
NESCAUM Survey
In order to assess the emissions impacts of GSE at the three airports studied as accurately aspossible, NESCAUM developed a detailed characterization of GSE usage at each airport. Thischaracterization includes vehicle population, fuel type, vehicle age, and hours of operation. Thesurvey form sent to GSE operators at each airport can be found in Appendix, Section C. A total of27 types of machines/vehicles were included in the survey, including nineteen self-propelledvehicles, such as pushback tractors and baggage tugs, and eight types of cart support equipment,such as ground power units and portable lighting equipment. In addition, six types of fuel weredistinguished in the survey. Appendix, Section C provides a complete list of machine/vehicle typesand fuel types included.
II-27
GSE Population and Activity Data Collection
Individual airlines, FBOs, and airport management authorities were initially contacted andasked to supply information on:
• equipment type (see Appendix, Section C, Table B.3-1 for a list of types),
• fuel type,
• internal combustion engine type (compression ignition or spark ignited),
• on road certification,
• number of pieces of equipment,
• annual hours of operation,
• horsepower, and
• fuel usage per year.
If the airline indicated that it was willing to supply the requested information, but did notreturn the survey form, an interview was requested and a NESCAUM representative visited thatorganization’ s offices to conduct the interview. In the case of Bradley and Manchester airports, fewresponses were elicited from the survey and interview requests; therefore a NESCAUMrepresentative made site visits to each airport to collect population data based on a visual inspectionof the airlines’ fleets.51
Site visits at Manchester and Bradley airports involved counting GSE fleet vehicles from theairport terminals. These two airports do not have significant indoor storage areas for equipment,therefore most, if not all, of the GSE is parked outside. GSE vehicle counts were made for all fleetsoperating at each airport, including vehicles for which estimates had been provided by the operator.Data previously supplied by the paper survey were then used to validate the results of the visualinspection. The visually-collected population data correlated well with the survey data. The majorconfounding factor of the visual inspection method is the similarity of appearance between certaintypes of equipment, such as air start units, ground power units, and conditioned air units. In certaincases the surveyor must make a judgment as to the equipment’ s function. Another shortcoming ofthe visual inspection method is the inability of the surveyor to collect fuel type and usageinformation, as well as activity rates. NESCAUM recommends visual surveys of GSE populationsonly when more formal methods of inventory development (paper and interview type surveying) fail.
The survey data were compiled by airport into composite lists of vehicles that include allavailable individual vehicle characteristics and usage information. Where possible, load factorswere derived from fuel usage and engine horsepower data collected in the survey.
51 This visual inspection was made before September 11, 2001. Repeating this survey would likely be more difficultunder the current security practices at U.S. airports; however, states may have more success in working with airlines andairports than was found in this effort.
II-28
Since many paper surveys were returned with incomplete information, some identifying onlypopulation and engine fuel type, NESCAUM relied on the default activity rate data and load factorssupplied by the model when values were missing. In very specific instances, NESCAUM was ableto develop fleet-specific activity rates. For example, usage rates were not supplied for any snowremoval equipment; however, snow removal operations were characterized in an interview with anairport manager. Based on this information and 1999 National Weather Service snowfall datarecorded at each airport, NESCAUM estimated annual activity for these machines.
An additional complication arose related to the model’ s input requirements for very specificcategories of GSE types. In some cases, categories of GSE equipment were identified in the surveywhich were not included in the GSE model. In these cases, the closest model type in terms of enginesize and use characteristics was substituted. For example, the model does not provide a category for“ Crash/Fire/Rescue vehicles,” therefore these have been input into the model as “ WB Pushback”tractors.52 A full list of cross-referenced vehicles can be found in Appendix, Section C. Similarly,participants in NESCAUM’ s airport survey identified fuels that were not included in the model.Therefore the closest fuel was selected for use in the model. The two sources of energy primarilyidentified in the survey that were not included in the model are hybrid vehicles and vehicles fueledwith Jet A, a type of jet fuel with combustion characteristics similar to diesel fuel. A cross-referenced listing of fuels identified in the survey and their model equivalents are listed in Appendix,Section C.
Load Factors Used
Engine load factor required special consideration in the NESCAUM study. Engine loadfactor is the ratio of the average power output from the engine when used at its rated power. Thedefault load factors in the EEA model, as with other default inputs, are derived from the CARB orUS EPA models, as chosen by the user. This is a measure of the utilization of the available powerwhen the machine is in operation. In examining the default load factors supplied by the model(ranging from 0.20 to 0.90, Table II-16), a sensitivity analysis revealed that these were developed foractivity rates that only account for equipment operating under load and exclude equipment idletime53 (see the sensitivity analysis discussion in section D.3). The default values for equipmentactivity in the models are significantly lower than the usage information NESCAUM collected,indicating that idling time is not accounted for in the default activity rates. 54 The use ofincompatible activity rates and load factors can significantly alter emission modeling results. Thediscussion of the sensitivity analysis performed on the GSE model delves further into this matter.
Since the GSE activity data collected through the NESCAUM survey included equipmentoperation time as well as equipment idle time, the default load factors supplied by the model seemedinappropriate for the NESCAUM dataset. Therefore NESCAUM calculated actual load factors(where possible) based on equipment fuel usage collected during the survey effort.
An estimate of load can be derived by the following equation:
52 WB Pushback is the abbreviation for widebody aircraft pushback tractor.53 Since an engine uses relatively little of the available power during idling periods, a load factor which includes all timethat the engine is running would be much lower than those used in the model.54 Since respondents reported hours of use differently, it is difficult to assess exactly what surveyed companies werereporting.
II-29
(Equation II-2)
Where:
lft = load factor (the average operational horsepower output of the enginedivided by the bHp) utilized in ground support operations byequipment type, t.
BSFCt(actual) = actual brake specific fuel consumption [actual lb. fuel consumption ofthe engine] / [rated hp·hr]
BSFCt(rated) = rated brake specific fuel consumption [rated lb. fuel consumption ofthe engine] / [rated hp·hr]
Seventy percent of those responding to the paper survey provided activity data for their GSEfleets, while fuel consumption data were collected from seventeen percent of those surveyed. Thesedata were used to generate load factors more characteristic of the fleets studied. Table II-16 displaysthe default load factors supplied by the model, compared with calculated load factors using theabove method.
Model outputs
The model reports GSE emissions of CO, CO2, NOx, SO2, HC, and PM. The user has theflexibility to further specify how hydrocarbons should be reported: as total hydrocarbons (THC),total organic gases (TOG), non-methane hydrocarbons (NMHC), non-methane organic gases(NMOG), or volatile organic compounds (VOC). The model also affords the flexibility to specifyhow particulate matter emissions should be reported. The default setting for PM emissions is totalPM, however the user can specify PM to be reported as PM10 or PM2.5.
The model output parameters are listed in Table II-17. Emissions are reported by individualclasses of vehicles and in composite form, where emissions from all equipment are summed bypollutant. The model automatically converts grams/day to lbs/day, short tons/day, kg/day or metrictons/day. If output units are not specified by the user, the model automatically reports emissions inlbs/day.
)()(
ratedBSFCactualBSFC
lft
tt =
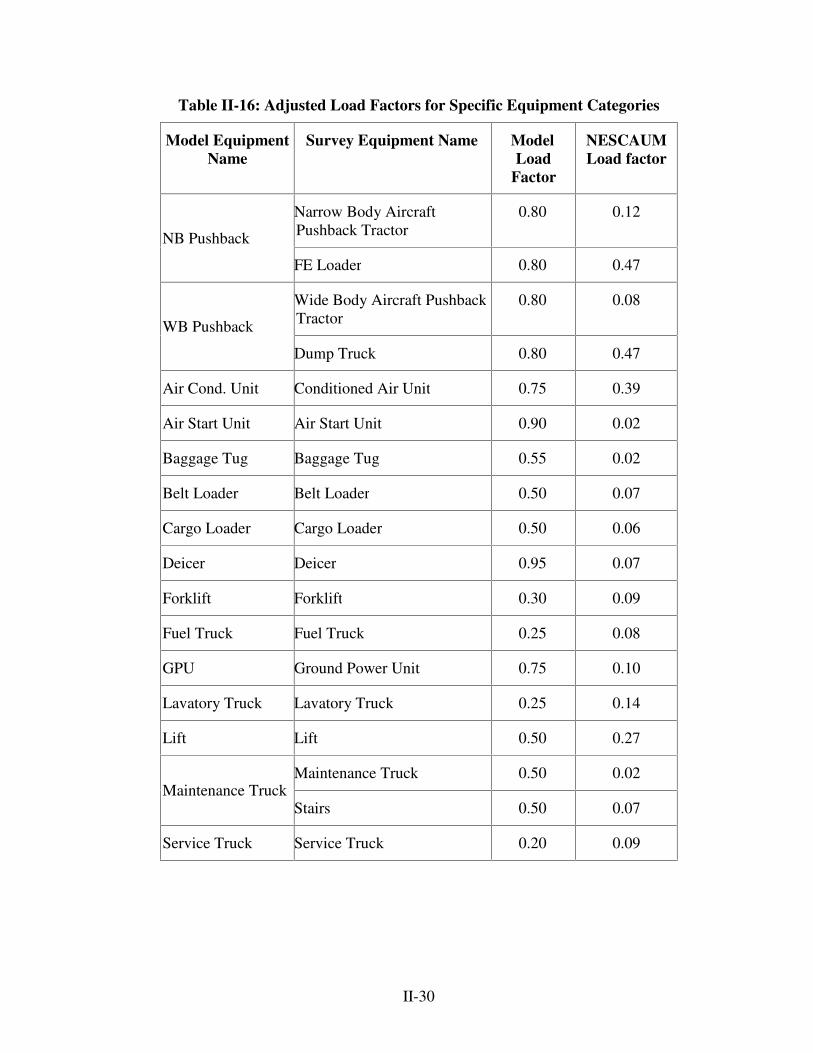
II-30
Table II-16: Adjusted Load Factors for Specific Equipment Categories
Model EquipmentName
Survey Equipment Name ModelLoad
Factor
NESCAUMLoad factor
Narrow Body AircraftPushback Tractor
0.80 0.12
NB Pushback
FE Loader 0.80 0.47
Wide Body Aircraft PushbackTractor
0.80 0.08
WB Pushback
Dump Truck 0.80 0.47
Air Cond. Unit Conditioned Air Unit 0.75 0.39
Air Start Unit Air Start Unit 0.90 0.02
Baggage Tug Baggage Tug 0.55 0.02
Belt Loader Belt Loader 0.50 0.07
Cargo Loader Cargo Loader 0.50 0.06
Deicer Deicer 0.95 0.07
Forklift Forklift 0.30 0.09
Fuel Truck Fuel Truck 0.25 0.08
GPU Ground Power Unit 0.75 0.10
Lavatory Truck Lavatory Truck 0.25 0.14
Lift Lift 0.50 0.27
Maintenance Truck 0.50 0.02Maintenance Truck
Stairs 0.50 0.07
Service Truck Service Truck 0.20 0.09
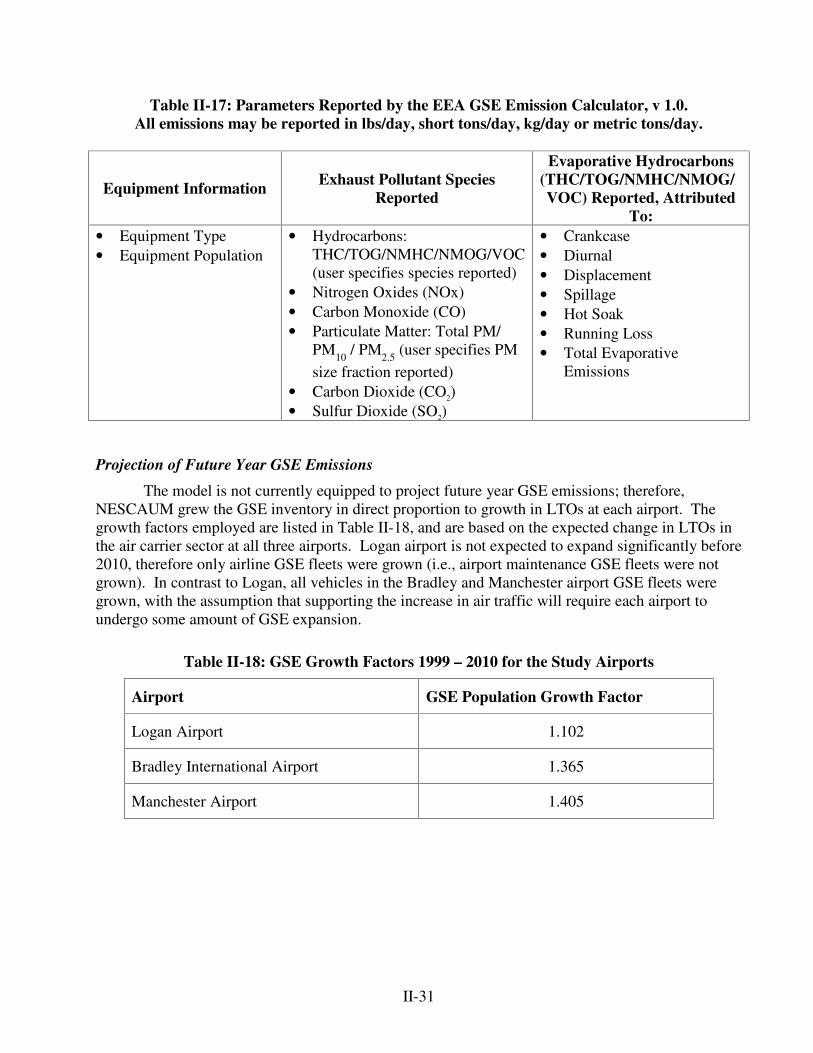
II-31
Table II-17: Parameters Reported by the EEA GSE Emission Calculator, v 1.0.All emissions may be reported in lbs/day, short tons/day, kg/day or metric tons/day.
Equipment Information Exhaust Pollutant SpeciesReported
Evaporative Hydrocarbons(THC/TOG/NMHC/NMOG/VOC) Reported, Attributed
To:• Equipment Type• Equipment Population
• Hydrocarbons:THC/TOG/NMHC/NMOG/VOC(user specifies species reported)
• Nitrogen Oxides (NOx)• Carbon Monoxide (CO)• Particulate Matter: Total PM/
PM10 / PM2.5 (user specifies PMsize fraction reported)
• Carbon Dioxide (CO2)• Sulfur Dioxide (SO2)
• Crankcase• Diurnal• Displacement• Spillage• Hot Soak• Running Loss• Total Evaporative
Emissions
Projection of Future Year GSE Emissions
The model is not currently equipped to project future year GSE emissions; therefore,NESCAUM grew the GSE inventory in direct proportion to growth in LTOs at each airport. Thegrowth factors employed are listed in Table II-18, and are based on the expected change in LTOs inthe air carrier sector at all three airports. Logan airport is not expected to expand significantly before2010, therefore only airline GSE fleets were grown (i.e., airport maintenance GSE fleets were notgrown). In contrast to Logan, all vehicles in the Bradley and Manchester airport GSE fleets weregrown, with the assumption that supporting the increase in air traffic will require each airport toundergo some amount of GSE expansion.
Table II-18: GSE Growth Factors 1999 – 2010 for the Study Airports
Airport GSE Population Growth Factor
Logan Airport 1.102
Bradley International Airport 1.365
Manchester Airport 1.405
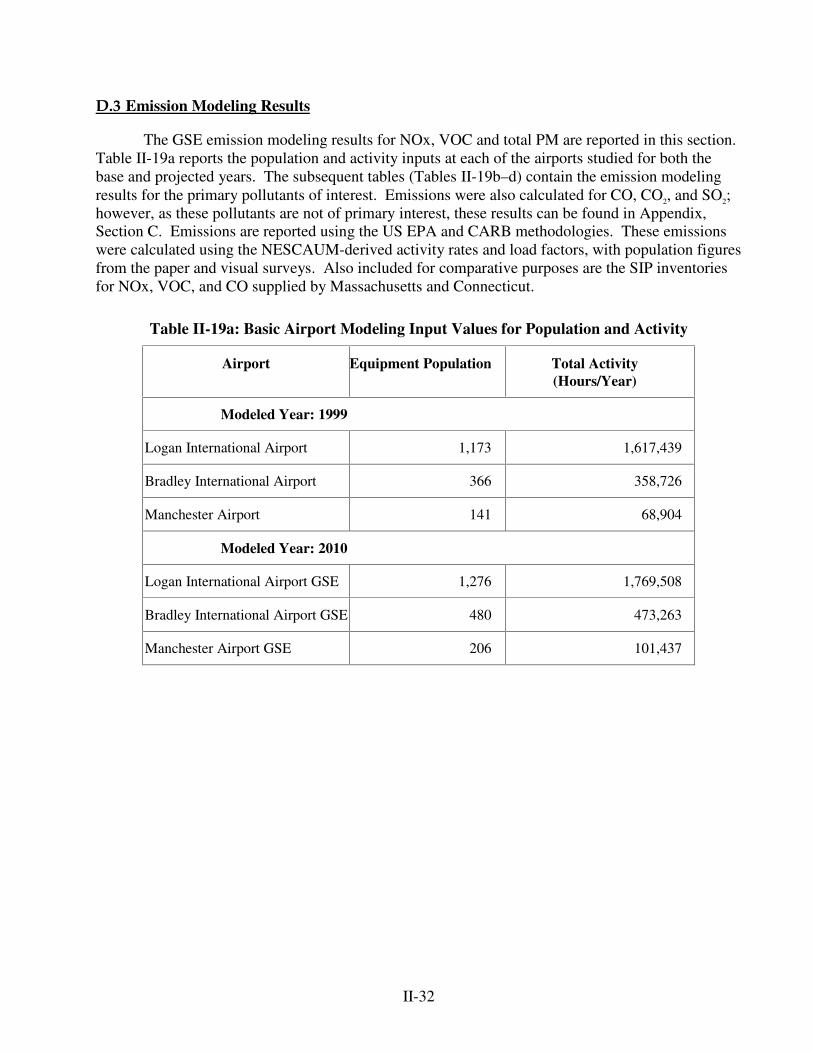
II-32
D.3 Emission Modeling Results
The GSE emission modeling results for NOx, VOC and total PM are reported in this section.Table II-19a reports the population and activity inputs at each of the airports studied for both thebase and projected years. The subsequent tables (Tables II-19b–d) contain the emission modelingresults for the primary pollutants of interest. Emissions were also calculated for CO, CO2, and SO2;however, as these pollutants are not of primary interest, these results can be found in Appendix,Section C. Emissions are reported using the US EPA and CARB methodologies. These emissionswere calculated using the NESCAUM-derived activity rates and load factors, with population figuresfrom the paper and visual surveys. Also included for comparative purposes are the SIP inventoriesfor NOx, VOC, and CO supplied by Massachusetts and Connecticut.
Table II-19a: Basic Airport Modeling Input Values for Population and Activity
Airport Equipment Population Total Activity(Hours/Year)
Modeled Year: 1999
Logan International Airport 1,173 1,617,439
Bradley International Airport 366 358,726
Manchester Airport 141 68,904
Modeled Year: 2010
Logan International Airport GSE 1,276 1,769,508
Bradley International Airport GSE 480 473,263
Manchester Airport GSE 206 101,437
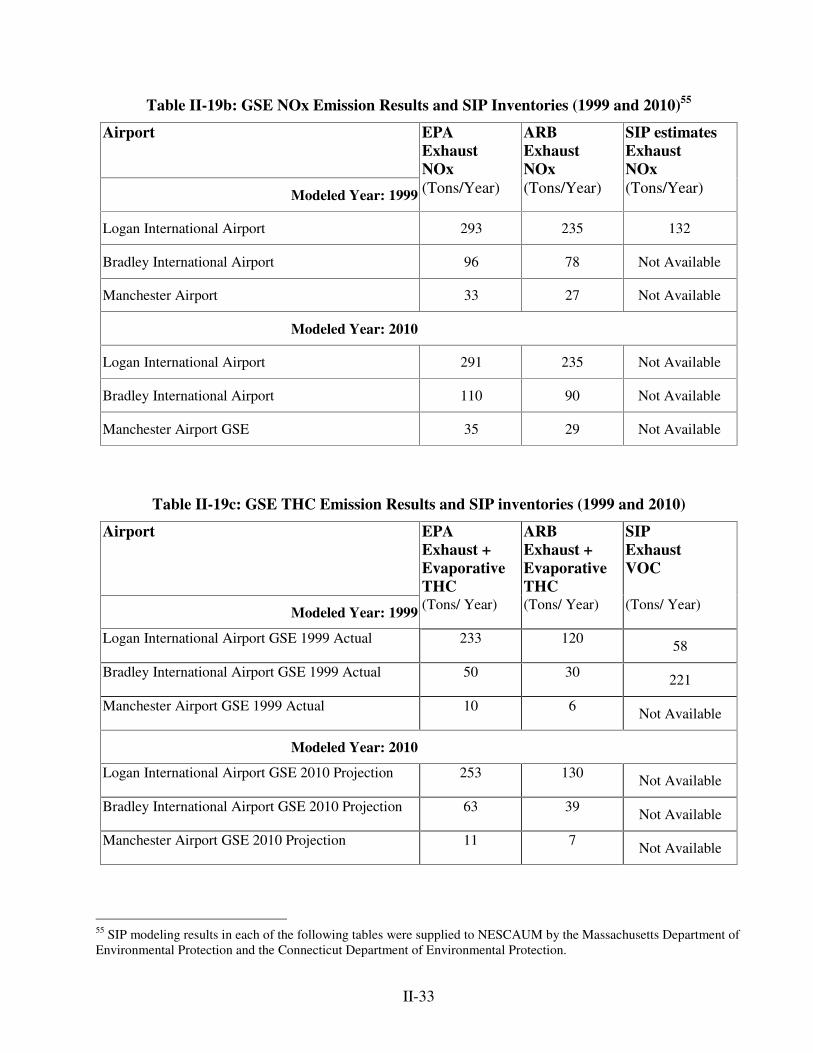
II-33
Table II-19b: GSE NOx Emission Results and SIP Inventories (1999 and 2010)55
Airport EPAExhaustNOx
ARBExhaustNOx
SIP estimatesExhaustNOx
Modeled Year: 1999 (Tons/Year) (Tons/Year) (Tons/Year)
Logan International Airport 293 235 132
Bradley International Airport 96 78 Not Available
Manchester Airport 33 27 Not Available
Modeled Year: 2010
Logan International Airport 291 235 Not Available
Bradley International Airport 110 90 Not Available
Manchester Airport GSE 35 29 Not Available
Table II-19c: GSE THC Emission Results and SIP inventories (1999 and 2010)
Airport EPAExhaust +EvaporativeTHC
ARBExhaust +EvaporativeTHC
SIPExhaustVOC
Modeled Year: 1999 (Tons/ Year) (Tons/ Year) (Tons/ Year)
Logan International Airport GSE 1999 Actual 233 120 58
Bradley International Airport GSE 1999 Actual 50 30 221
Manchester Airport GSE 1999 Actual 10 6 Not Available
Modeled Year: 2010
Logan International Airport GSE 2010 Projection 253 130 Not Available
Bradley International Airport GSE 2010 Projection 63 39 Not Available
Manchester Airport GSE 2010 Projection 11 7 Not Available
55 SIP modeling results in each of the following tables were supplied to NESCAUM by the Massachusetts Department ofEnvironmental Protection and the Connecticut Department of Environmental Protection.
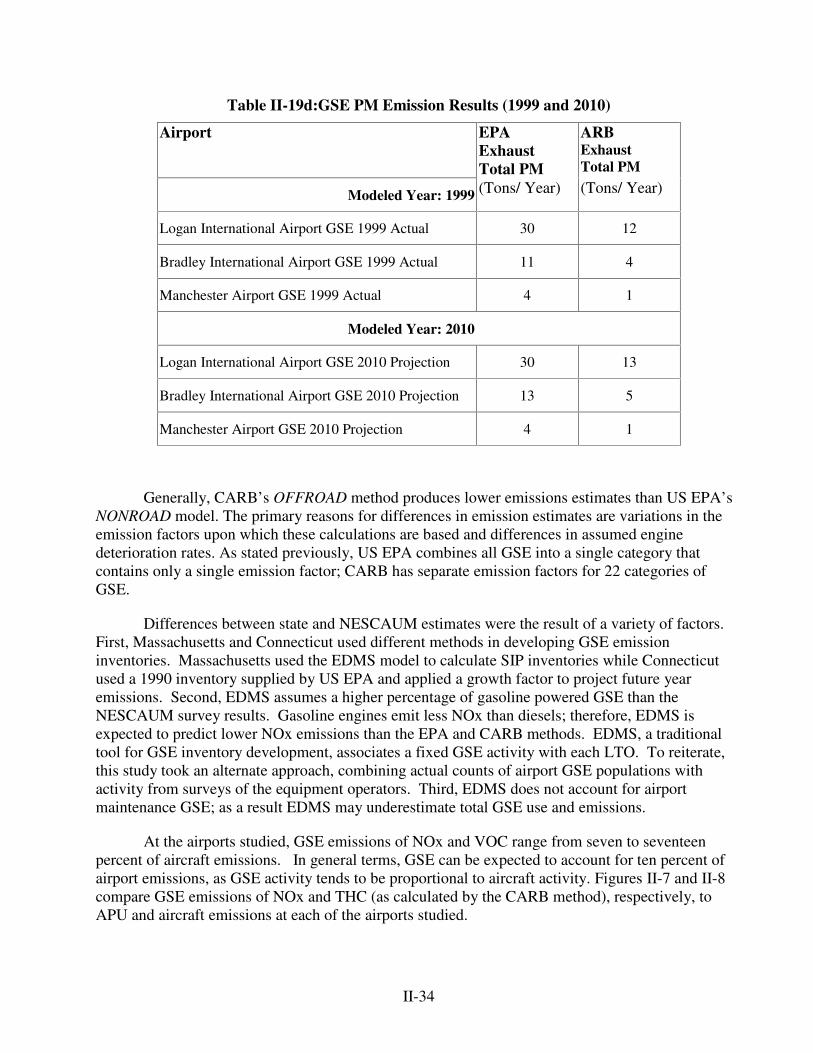
II-34
Table II-19d:GSE PM Emission Results (1999 and 2010)
Airport EPAExhaustTotal PM
ARBExhaustTotal PM
Modeled Year: 1999 (Tons/ Year) (Tons/ Year)
Logan International Airport GSE 1999 Actual 30 12
Bradley International Airport GSE 1999 Actual 11 4
Manchester Airport GSE 1999 Actual 4 1
Modeled Year: 2010
Logan International Airport GSE 2010 Projection 30 13
Bradley International Airport GSE 2010 Projection 13 5
Manchester Airport GSE 2010 Projection 4 1
Generally, CARB’ s OFFROAD method produces lower emissions estimates than US EPA’ sNONROAD model. The primary reasons for differences in emission estimates are variations in theemission factors upon which these calculations are based and differences in assumed enginedeterioration rates. As stated previously, US EPA combines all GSE into a single category thatcontains only a single emission factor; CARB has separate emission factors for 22 categories ofGSE.
Differences between state and NESCAUM estimates were the result of a variety of factors.First, Massachusetts and Connecticut used different methods in developing GSE emissioninventories. Massachusetts used the EDMS model to calculate SIP inventories while Connecticutused a 1990 inventory supplied by US EPA and applied a growth factor to project future yearemissions. Second, EDMS assumes a higher percentage of gasoline powered GSE than theNESCAUM survey results. Gasoline engines emit less NOx than diesels; therefore, EDMS isexpected to predict lower NOx emissions than the EPA and CARB methods. EDMS, a traditionaltool for GSE inventory development, associates a fixed GSE activity with each LTO. To reiterate,this study took an alternate approach, combining actual counts of airport GSE populations withactivity from surveys of the equipment operators. Third, EDMS does not account for airportmaintenance GSE; as a result EDMS may underestimate total GSE use and emissions.
At the airports studied, GSE emissions of NOx and VOC range from seven to seventeenpercent of aircraft emissions. In general terms, GSE can be expected to account for ten percent ofairport emissions, as GSE activity tends to be proportional to aircraft activity. Figures II-7 and II-8compare GSE emissions of NOx and THC (as calculated by the CARB method), respectively, toAPU and aircraft emissions at each of the airports studied.
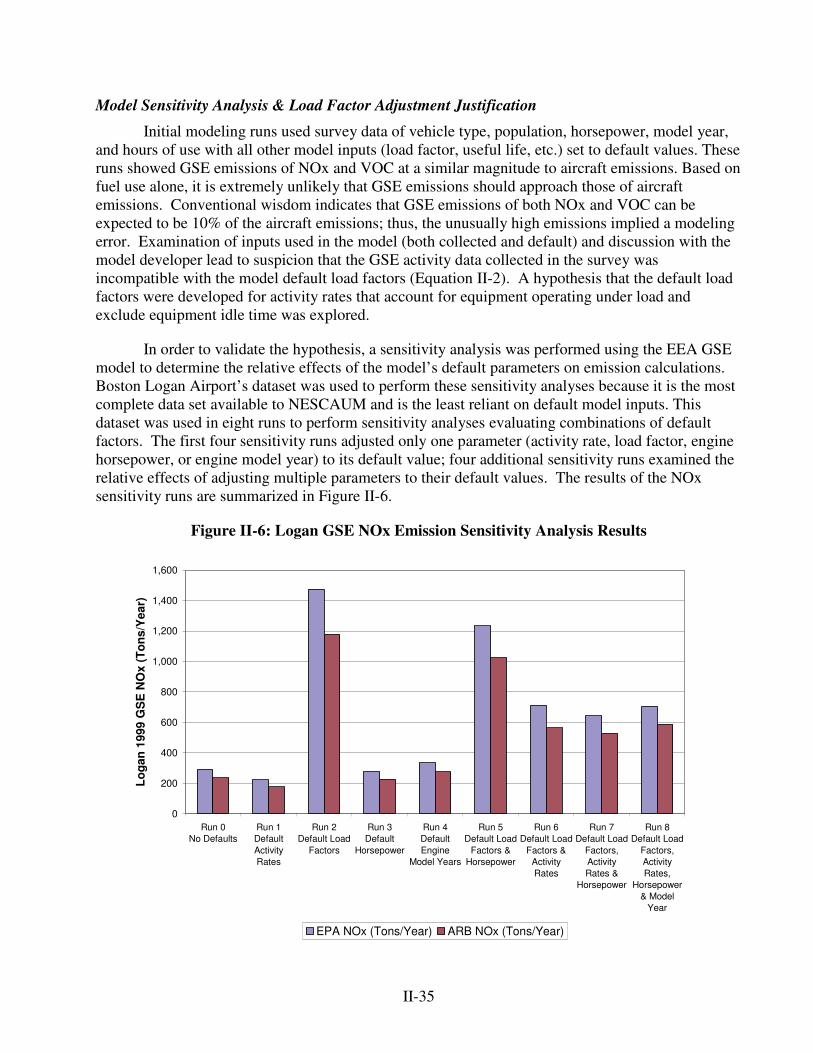
II-35
Model Sensitivity Analysis & Load Factor Adjustment Justification
Initial modeling runs used survey data of vehicle type, population, horsepower, model year,and hours of use with all other model inputs (load factor, useful life, etc.) set to default values. Theseruns showed GSE emissions of NOx and VOC at a similar magnitude to aircraft emissions. Based onfuel use alone, it is extremely unlikely that GSE emissions should approach those of aircraftemissions. Conventional wisdom indicates that GSE emissions of both NOx and VOC can beexpected to be 10% of the aircraft emissions; thus, the unusually high emissions implied a modelingerror. Examination of inputs used in the model (both collected and default) and discussion with themodel developer lead to suspicion that the GSE activity data collected in the survey wasincompatible with the model default load factors (Equation II-2). A hypothesis that the default loadfactors were developed for activity rates that account for equipment operating under load andexclude equipment idle time was explored.
In order to validate the hypothesis, a sensitivity analysis was performed using the EEA GSEmodel to determine the relative effects of the model’ s default parameters on emission calculations.Boston Logan Airport’ s dataset was used to perform these sensitivity analyses because it is the mostcomplete data set available to NESCAUM and is the least reliant on default model inputs. Thisdataset was used in eight runs to perform sensitivity analyses evaluating combinations of defaultfactors. The first four sensitivity runs adjusted only one parameter (activity rate, load factor, enginehorsepower, or engine model year) to its default value; four additional sensitivity runs examined therelative effects of adjusting multiple parameters to their default values. The results of the NOxsensitivity runs are summarized in Figure II-6.
Figure II-6: Logan GSE NOx Emission Sensitivity Analysis Results
0
200
400
600
800
1,000
1,200
1,400
1,600
Run 0 No Defaults
Run 1DefaultActivityRates
Run 2Default Load
Factors
Run 3Default
Horsepower
Run 4DefaultEngine
Model Years
Run 5Default Load
Factors &Horsepower
Run 6Default Load
Factors &ActivityRates
Run 7Default Load
Factors,ActivityRates &
Horsepower
Run 8Default Load
Factors,ActivityRates,
Horsepower& Model
Year
Loga
n 19
99 G
SE
NO
x (T
ons/
Yea
r)
EPA NOx (Tons/Year) ARB NOx (Tons/Year)
II-36
The initial modeling results are shown in Figure II-6 by Sensitivity Run 2, Default LoadFactor. The high estimation of emissions occurs because the default load factors (which are high,see Table II-16) are combined with the survey hours of use (which include idling time). The productof the two large numbers overestimates emissions. Comparing Run 2 to Runs 1, 3, and 4 (using onlydefault activity rate, horsepower, and model year, respectively), it is clear that default load factor isthe problematic input.
Sensitivity Runs 5 through 8 indicate that the default load factor is counterbalanced to someextent by the other default parameters of the model. Load factor and activity rate are the two mostclosely linked input parameters. Activity rate is the time in which the vehicle or engine is operated,and load factor is calculated as full power divided by activity rate. If the activity rate includesengine idle time, the load factor should be relatively low, as very little power output is necessary foridling; however, if activity rate excludes idling time and only includes time in which the engine isperforming its assigned task, the load factor would be higher.
Sensitivity Run 6 shows the impact of using default activity rates and load factors with theLogan dataset. When these default values are used in combination, the emissions fall between theresults seen in Runs 1 and 2 (which use model default values). As expected, activity rate has thegreatest effect on damping the impact of default load factors on emissions. In fact, Runs 6 through 8show that the other factors have very little effect when default load factor and activity rates are usedtogether.
NESCAUM took the “ No Defaults” case as the best estimate of emissions. This run madeuse of all survey data and the NESCAUM load factors calculated from the survey (Table II-16).These results are of the expected magnitude of emissions compared to aircraft and make use of thebest data available about the GSE fleet in the Northeast.
NESCAUM GSE Survey Reporting Results
As it is not possible to determine the exact number of GSE operating at each airport using thesurvey techniques employed for this report, percent data capture was estimated by using acombination of GSE data gathered at each airport and LTOs of individual airlines at each airport.One major issue confounds the ability to calculate GSE data capture rates: many airlines contractGSE services to FBOs. NESCAUM collected GSE data from the majority of FBOs operating ateach of the airports studied; however, limited information was collected regarding the extent towhich these FBOs service individual airlines.
At Bradley International Airport, approximately 80 percent of the GSE fleet was accountedfor by NESCAUM based on the various survey methods employed (four paper and eleven visualsurveys). At Logan International Airport, anywhere from 69 to 82 percent of the GSE fleet wasaccounted for, using the survey methods described. Of the 86 airlines that operated at Logan in1999, GSE that service twenty-one air carriers were identified. This inventory is based on ten papersurveys, two in-person interviews and one telephone interview. Approximately 99 percent of theGSE population at Manchester Airport was accounted for with six paper and 11 visual surveys. Ofthe 21 airlines identified as operating out of Manchester Airport, all major-air-carrier GSE and twoof four national-air-carrier GSE populations were accounted for; the remaining air carriers representless than one percent of total aircraft activity at Manchester Airport. Appendix, Section C providesdetailed information on survey reporting statistics.
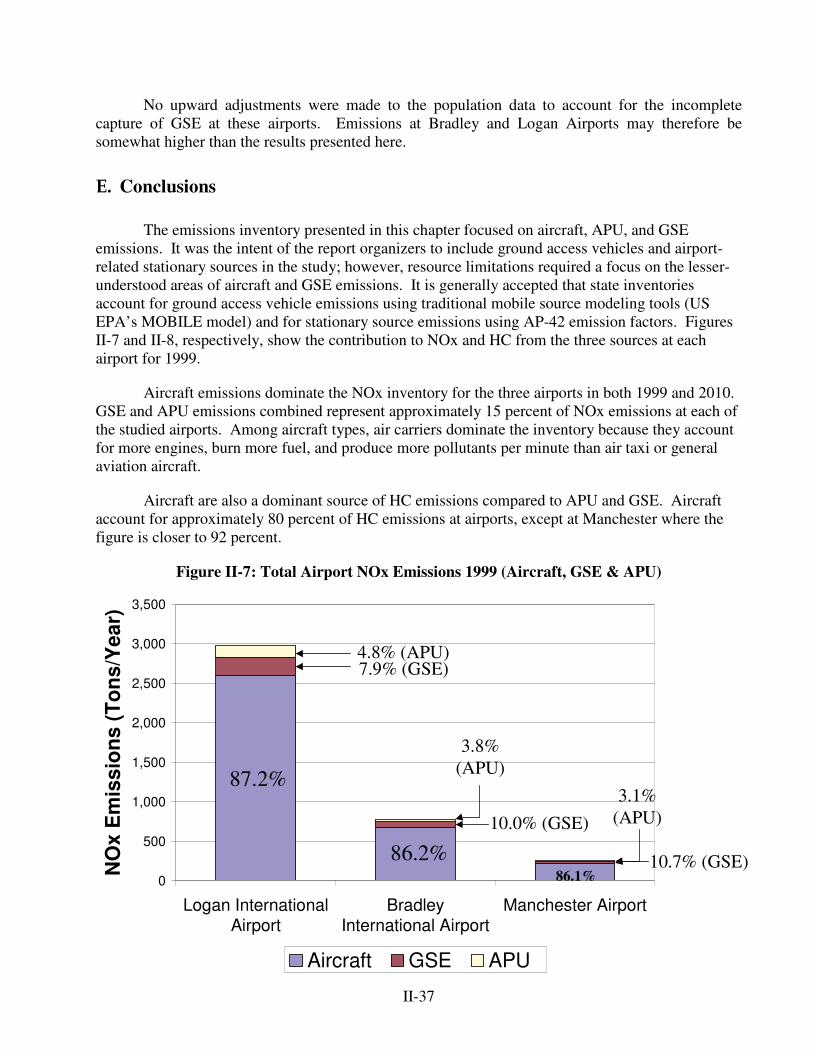
II-37
No upward adjustments were made to the population data to account for the incompletecapture of GSE at these airports. Emissions at Bradley and Logan Airports may therefore besomewhat higher than the results presented here.
E. Conclusions
The emissions inventory presented in this chapter focused on aircraft, APU, and GSEemissions. It was the intent of the report organizers to include ground access vehicles and airport-related stationary sources in the study; however, resource limitations required a focus on the lesser-understood areas of aircraft and GSE emissions. It is generally accepted that state inventoriesaccount for ground access vehicle emissions using traditional mobile source modeling tools (USEPA’ s MOBILE model) and for stationary source emissions using AP-42 emission factors. FiguresII-7 and II-8, respectively, show the contribution to NOx and HC from the three sources at eachairport for 1999.
Aircraft emissions dominate the NOx inventory for the three airports in both 1999 and 2010.GSE and APU emissions combined represent approximately 15 percent of NOx emissions at each ofthe studied airports. Among aircraft types, air carriers dominate the inventory because they accountfor more engines, burn more fuel, and produce more pollutants per minute than air taxi or generalaviation aircraft.
Aircraft are also a dominant source of HC emissions compared to APU and GSE. Aircraftaccount for approximately 80 percent of HC emissions at airports, except at Manchester where thefigure is closer to 92 percent.
Figure II-7: Total Airport NOx Emissions 1999 (Aircraft, GSE & APU)
0
500
1,000
1,500
2,000
2,500
3,000
3,500
Logan InternationalAirport
BradleyInternational Airport
Manchester Airport
NO
x E
mis
sion
s (T
ons/
Yea
r)
Aircraft GSE APU
87.2%
86.2%86.1%
7.9% (GSE)4.8% (APU)
10.0% (GSE)
3.8%(APU)
10.7% (GSE)
3.1%(APU)
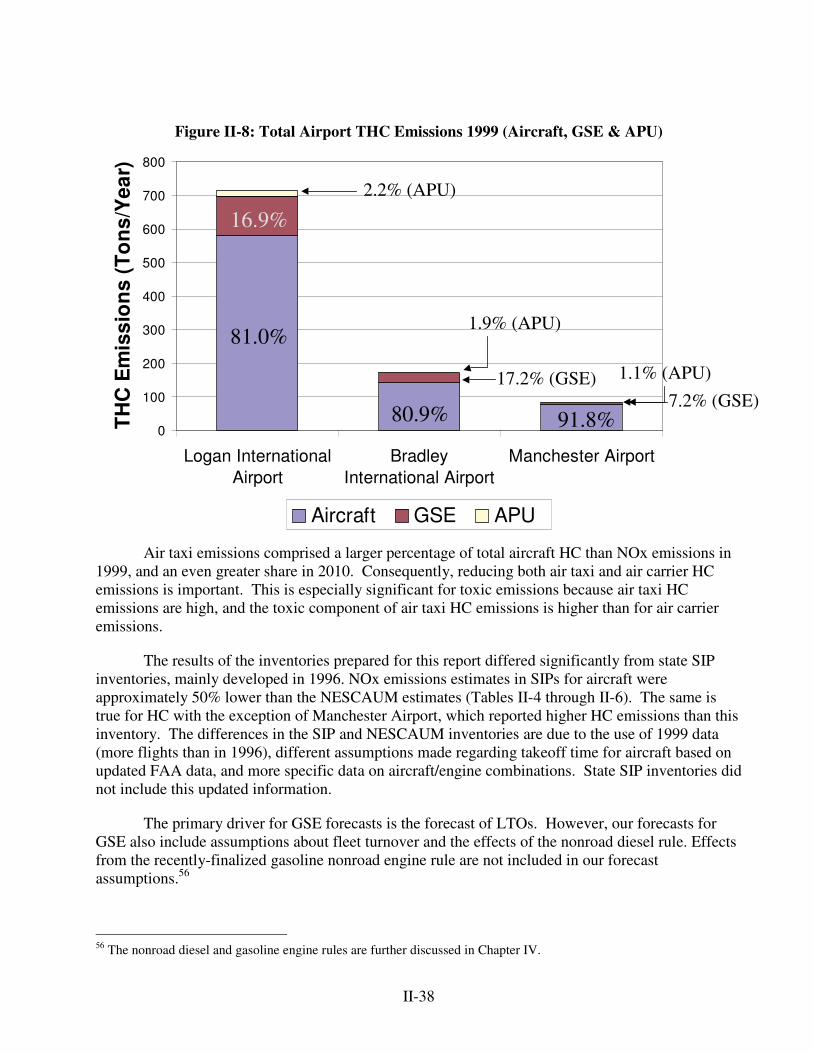
II-38
Figure II-8: Total Airport THC Emissions 1999 (Aircraft, GSE & APU)
Air taxi emissions comprised a larger percentage of total aircraft HC than NOx emissions in1999, and an even greater share in 2010. Consequently, reducing both air taxi and air carrier HCemissions is important. This is especially significant for toxic emissions because air taxi HCemissions are high, and the toxic component of air taxi HC emissions is higher than for air carrieremissions.
The results of the inventories prepared for this report differed significantly from state SIPinventories, mainly developed in 1996. NOx emissions estimates in SIPs for aircraft wereapproximately 50% lower than the NESCAUM estimates (Tables II-4 through II-6). The same istrue for HC with the exception of Manchester Airport, which reported higher HC emissions than thisinventory. The differences in the SIP and NESCAUM inventories are due to the use of 1999 data(more flights than in 1996), different assumptions made regarding takeoff time for aircraft based onupdated FAA data, and more specific data on aircraft/engine combinations. State SIP inventories didnot include this updated information.
The primary driver for GSE forecasts is the forecast of LTOs. However, our forecasts forGSE also include assumptions about fleet turnover and the effects of the nonroad diesel rule. Effectsfrom the recently-finalized gasoline nonroad engine rule are not included in our forecastassumptions.56
56 The nonroad diesel and gasoline engine rules are further discussed in Chapter IV.
0
100
200
300
400
500
600
700
800
Logan InternationalAirport
BradleyInternational Airport
Manchester Airport
THC
Em
issi
ons
(To
ns/Y
ear)
Aircraft GSE APU
81.0%
16.9%2.2% (APU)
80.9%
17.2% (GSE)
91.8%7.2% (GSE)
1.9% (APU)
1.1% (APU)
II-39
Continued improvements in emissions models, such as those incorporated in the EEA aircraftand GSE models, could improve state emissions inventories for airports. Future versions of EDMS,EPA’ s NONROAD model, and CARB’ s OFFROAD model should consider the findings of thisreport (especially regarding fuel use in GSE) and incorporate these changes. Allowing states toeasily incorporate local data will also increase the utility of the models.
Airport-related NOx and HC emissions are expected to increase over the next ten years. 57
The three airports studied can expect growth rates in aircraft flights of 10% to 40% over the next tenyears, based on FAA data. Aircraft, GSE, and APU emissions are predicted to increase atapproximately the same rate, primarily because projected LTO increases were used to “ grow” allthree of these sectors. Regionalization will cause a greater percentage increase in air carrier andAPU NOx emissions at Bradley and Manchester than at Logan.
Figure II-9 compares NOx emissions from large stationary sources in each of the three stateswith combined aircraft, APU, and GSE NOx emissions at the studied airports. Numerous controlstrategies imposed upon major stationary sources will lead to dramatic emissions reductions over thenext decade, while emissions at airport continue to grow. In fact, Logan and Bradley airports will begreater contributors to statewide NOx emissions than these power plants in 2010. In NewHampshire, the largest utility will still exceed Manchester Airport’ s NOx emissions in 2010. Thislarge growth in emissions underscores the importance of controlling airport-related emissions.
57 This study commenced before the events of September 11, 2001. Forecasts reflecting these events were released byFAA in March, 2003 and have not been incorporated in this study.
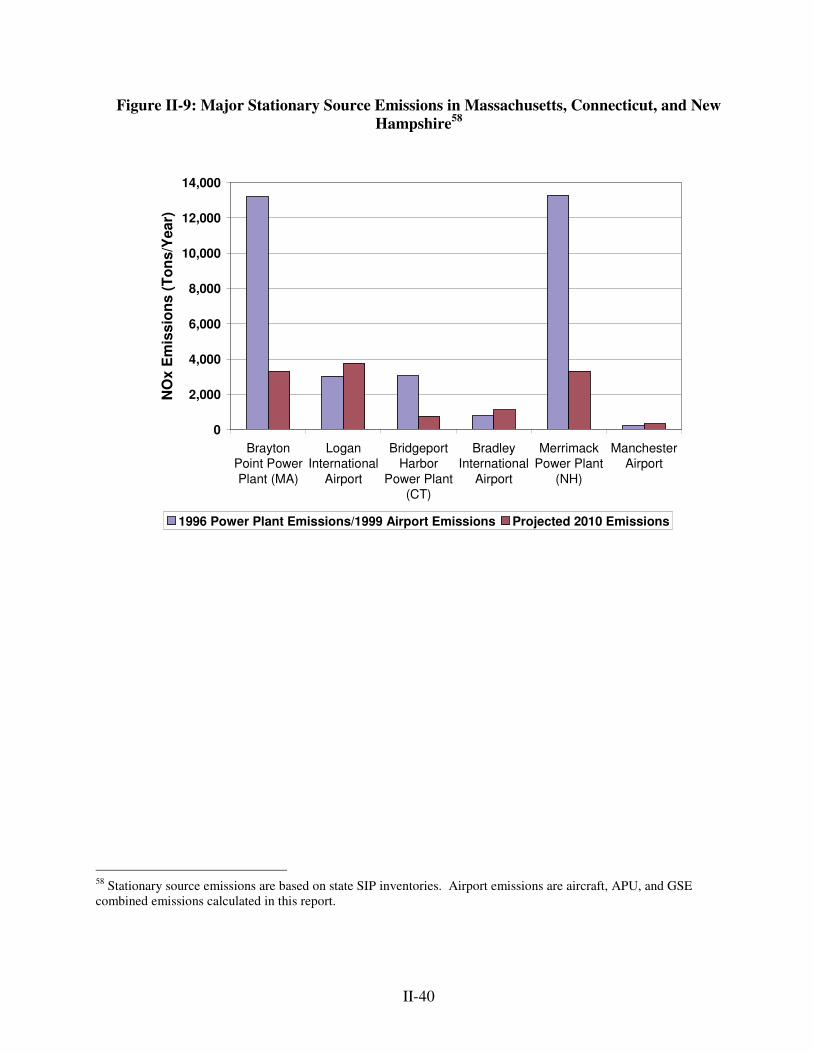
II-40
Figure II-9: Major Stationary Source Emissions in Massachusetts, Connecticut, and NewHampshire58
58 Stationary source emissions are based on state SIP inventories. Airport emissions are aircraft, APU, and GSEcombined emissions calculated in this report.
0
2,000
4,000
6,000
8,000
10,000
12,000
14,000
BraytonPoint PowerPlant (MA)
LoganInternational
Airport
BridgeportHarbor
Power Plant(CT)
BradleyInternational
Airport
MerrimackPower Plant
(NH)
ManchesterAirport
NO
x E
mis
sion
s (T
ons/
Yea
r)
1996 Power Plant Emissions/1999 Airport Emissions Projected 2010 Emissions
III-1
III. Technical and Operational Measures for Reducing AirportEmissions
A. Introduction
This chapter describes options for reducing emissions at airports and examines theconstraints, potential emission benefits, and where available, the costs associated with theseoptions. The chapter is divided into three sections covering: aircraft, ground support equipment(including ground power units and auxiliary power units), and ground access vehicles.59 Withineach source category, control options are organized into two categories: technological andoperational measures. Examples of technological control options include engine improvements,electrification, and alternative fuel technologies. Examples of operational control optionsinclude congestion management and changes in taxiing, takeoff, and landing procedures.Summary tables comparing emissions benefits,60 as well as cost and cost-effectiveness estimates,are provided at the end of each source category section. The chapter concludes with a sectiondescribing how rail service could replace short-haul air travel.
B. Options for Reducing Aircraft Emissions
As noted previously, aircraft typically account for the great majority (45-85%61) of totalairport emissions. A variety of aircraft types operate at commercial airports, including largecommercial jets, smaller commuter aircraft powered by turboprop engines, piston–enginedgeneral aviation aircraft, and other miscellaneous aircraft. In addition, military aircraft alsooperate at some commercial airports. This chapter primarily focuses on measures relating tolarge commercial jets, since their emissions typically represent 80 percent of the total emissionsinventory for all types of aircraft (i.e., air carriers, commuter, cargo and general aircraft). Sourcesof aircraft emissions include airplane engines and auxiliary power units used to provideelectricity, ventilation, and air conditioning to the airplane at the gate. Control options for APUswill be discussed in the section on GSE since measures to reduce APU usage also reduce use ofground power units.62
B.1 Technology Options
Past trends in engine performance and efficiency improvements provide compellingevidence for the potential of technological advancement. Overall, the intensity of aircraft energy
59 The inventory presented in Chapter II did not include GAV emissions, however this chapter presents someavailable information and cost effectiveness estimates.60 In general, the discussion focuses on CO, NOx and VOC emission reduction benefits. Where available,information on PM reductions and fuel economy impacts (which directly affect CO2 emissions) is also presented.Note that emission estimates from sources are given in terms of hydrocarbons (HC) rather than VOC. HC and VOC,though technically distinct in scientific terms, can be considered essentially interchangeable for the purposes of thisdiscussion61 See Table I-5 and Figures II-7 and II-8.62 Ground power units are a category of GSE.
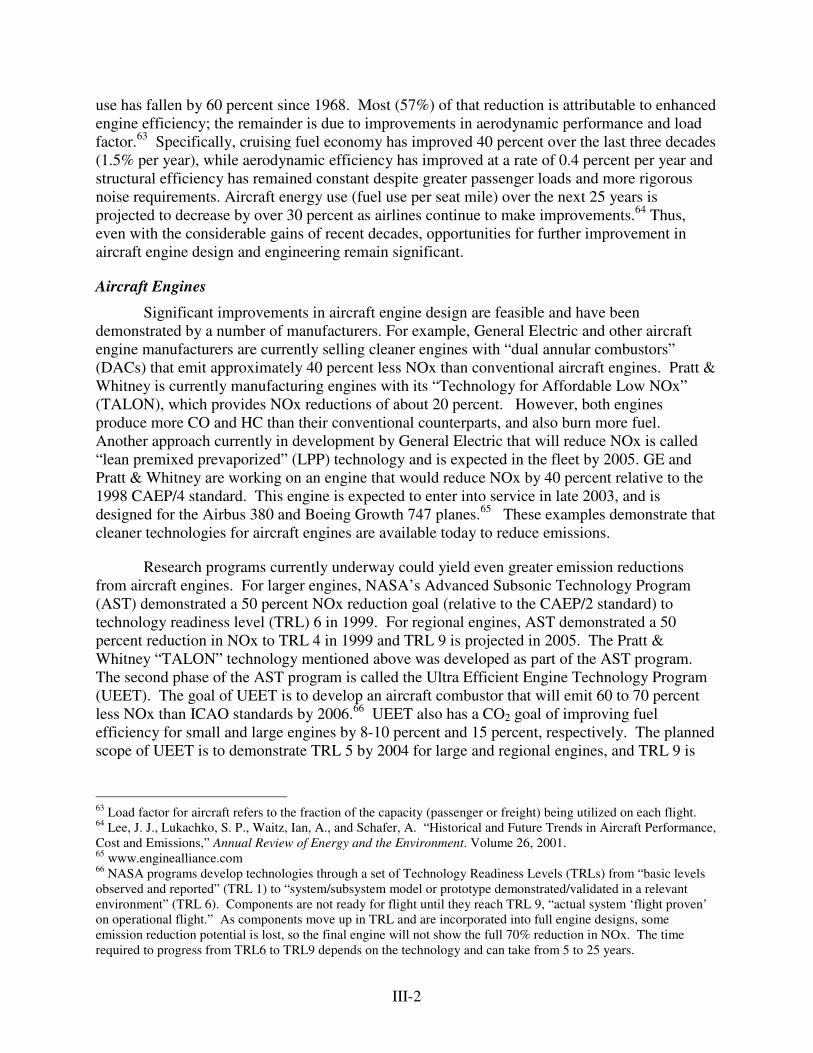
III-2
use has fallen by 60 percent since 1968. Most (57%) of that reduction is attributable to enhancedengine efficiency; the remainder is due to improvements in aerodynamic performance and loadfactor.63 Specifically, cruising fuel economy has improved 40 percent over the last three decades(1.5% per year), while aerodynamic efficiency has improved at a rate of 0.4 percent per year andstructural efficiency has remained constant despite greater passenger loads and more rigorousnoise requirements. Aircraft energy use (fuel use per seat mile) over the next 25 years isprojected to decrease by over 30 percent as airlines continue to make improvements.64 Thus,even with the considerable gains of recent decades, opportunities for further improvement inaircraft engine design and engineering remain significant.
Aircraft Engines
Significant improvements in aircraft engine design are feasible and have beendemonstrated by a number of manufacturers. For example, General Electric and other aircraftengine manufacturers are currently selling cleaner engines with “ dual annular combustors”(DACs) that emit approximately 40 percent less NOx than conventional aircraft engines. Pratt &Whitney is currently manufacturing engines with its “ Technology for Affordable Low NOx”(TALON), which provides NOx reductions of about 20 percent. However, both enginesproduce more CO and HC than their conventional counterparts, and also burn more fuel.Another approach currently in development by General Electric that will reduce NOx is called“ lean premixed prevaporized” (LPP) technology and is expected in the fleet by 2005. GE andPratt & Whitney are working on an engine that would reduce NOx by 40 percent relative to the1998 CAEP/4 standard. This engine is expected to enter into service in late 2003, and isdesigned for the Airbus 380 and Boeing Growth 747 planes.65 These examples demonstrate thatcleaner technologies for aircraft engines are available today to reduce emissions.
Research programs currently underway could yield even greater emission reductionsfrom aircraft engines. For larger engines, NASA’ s Advanced Subsonic Technology Program(AST) demonstrated a 50 percent NOx reduction goal (relative to the CAEP/2 standard) totechnology readiness level (TRL) 6 in 1999. For regional engines, AST demonstrated a 50percent reduction in NOx to TRL 4 in 1999 and TRL 9 is projected in 2005. The Pratt &Whitney “ TALON” technology mentioned above was developed as part of the AST program.The second phase of the AST program is called the Ultra Efficient Engine Technology Program(UEET). The goal of UEET is to develop an aircraft combustor that will emit 60 to 70 percentless NOx than ICAO standards by 2006.66 UEET also has a CO2 goal of improving fuelefficiency for small and large engines by 8-10 percent and 15 percent, respectively. The plannedscope of UEET is to demonstrate TRL 5 by 2004 for large and regional engines, and TRL 9 is
63 Load factor for aircraft refers to the fraction of the capacity (passenger or freight) being utilized on each flight.64 Lee, J. J., Lukachko, S. P., Waitz, Ian, A., and Schafer, A. “ Historical and Future Trends in Aircraft Performance,Cost and Emissions,” Annual Review of Energy and the Environment. Volume 26, 2001.65 www.enginealliance.com66 NASA programs develop technologies through a set of Technology Readiness Levels (TRLs) from “ basic levelsobserved and reported” (TRL 1) to “ system/subsystem model or prototype demonstrated/validated in a relevantenvironment” (TRL 6). Components are not ready for flight until they reach TRL 9, “ actual system ‘flight proven’on operational flight.” As components move up in TRL and are incorporated into full engine designs, someemission reduction potential is lost, so the final engine will not show the full 70% reduction in NOx. The timerequired to progress from TRL6 to TRL9 depends on the technology and can take from 5 to 25 years.
III-3
anticipated to be demonstrated in 2007 to 2010. NASA also has a Quiet Aircraft Technology(QAT) program for noise reduction.
The European Commission’ s research goal for aircraft engines is to reduce NOx by 60percent from the CAEP/2 standard by 2008 (TRL 9) and 80 percent by 2015. The Commission’ sCO2 goals are a 12 percent reduction relative to 1997 best-in-service by the year 2008, and a 20percent reduction by 2015. It could take many years for the emissions benefits of thesetechnologies to accrue, given the slow turnover in the aircraft fleet.
While the most dramatic improvements are available in new engines, the emissionscharacteristics and performance of older engines can also be improved through retrofit optionssuch as high-pressure turbine nozzles, steam injection, and upgraded gas turbines. For example,in 1999, Pratt & Whitney developed and certified a retrofit combustor “ E-kit” for the JT8D-200engine utilizing TALON technology. Retrofit kits for other engines are also available.
Regulatory mechanisms for promoting the introduction of cleaner aircraft (such asemissions standards or emissions-based landing fees) are discussed in the next chapter. Evenabsent regulatory intervention, some technological advances naturally penetrate the aircraft fleetas older planes are retired and replaced. Newer aircraft typically have lower emissions of NOx,HC and CO per passenger seat than the aircraft they replace. However, given the current trendtoward improving efficiency through increased engine cycle pressure ratios, engines now beingdesigned and developed may have higher NOx emissions than those currently being introduced(unless there is also a change in combustor technology).
Most of the advances that reduce noise or noxious emissions have occurred at the sametime as reductions in fuel burn. As pressure ratio continues to increase to further reduce fuelburn, measures to improve fuel economy will continue to be in conflict with measures to reducenoise and NOx, and vice versa. However, active research programs in Europe and the USA areaimed at demonstrating new combustor and engine design concepts that reduce NOx emissionssubstantially while improving fuel burn. If these are successful, technologies could enter serviceon production engines within the next ten to fifteen years. Existing technologies are alsoavailable to improve efficiency without a resulting NOx increase. For example, improving by-pass air ratio will simultaneously reduce NOx and fuel burn. Under current ICAO standards,however, NOx emissions are allowed to increase linearly with engine pressure ratio. Thus, thestructure of the current regulations does not encourage simultaneous efficiency increases andNOx reductions.
Aircraft Design
Many of the improvements cited above are projected to be achieved using the existing“ swept wing” aircraft body configuration, without making significant design changes to theaircraft body. By developing new aircraft body materials and improving aerodynamic efficiency,greater reductions in fuel use and emissions could be realized. For example, the B2 bomber andthe Raytheon business jet have achieved radical reductions in weight through the extensive use(over 80%) of composite materials in those aircraft bodies. While these aircraft designs areunique today, they could become the industry standard in the future.
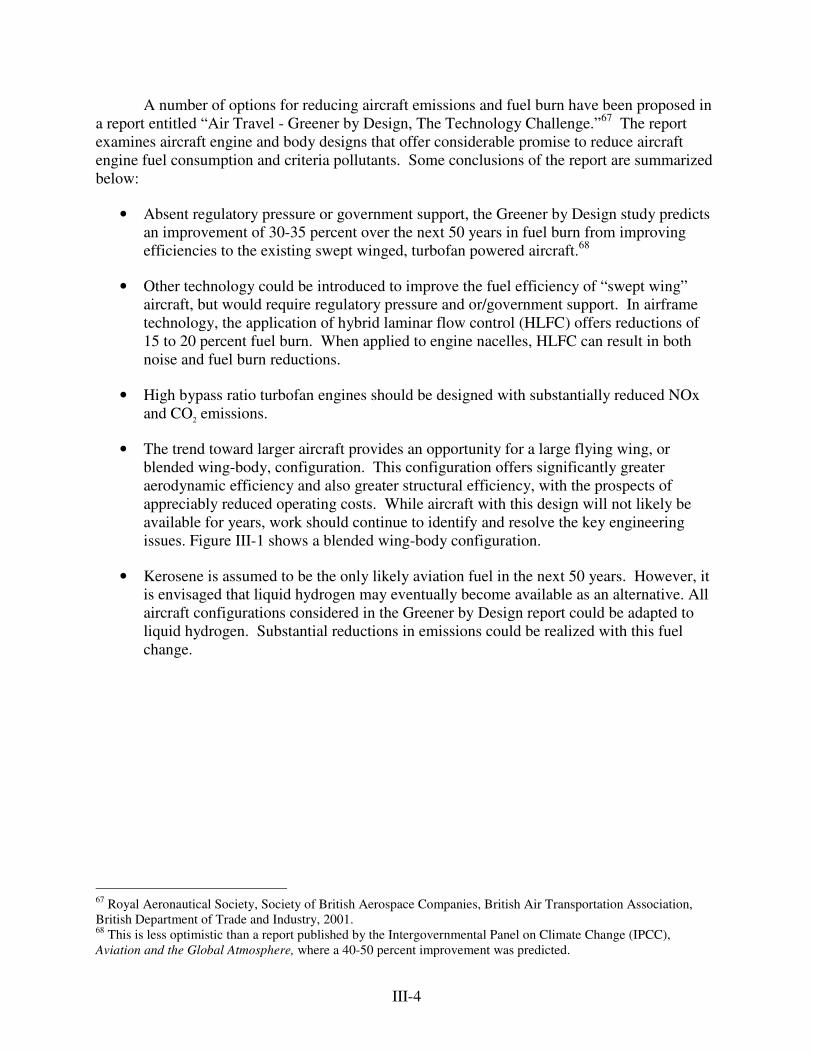
III-4
A number of options for reducing aircraft emissions and fuel burn have been proposed ina report entitled “ Air Travel - Greener by Design, The Technology Challenge.” 67 The reportexamines aircraft engine and body designs that offer considerable promise to reduce aircraftengine fuel consumption and criteria pollutants. Some conclusions of the report are summarizedbelow:
• Absent regulatory pressure or government support, the Greener by Design study predictsan improvement of 30-35 percent over the next 50 years in fuel burn from improvingefficiencies to the existing swept winged, turbofan powered aircraft.68
• Other technology could be introduced to improve the fuel efficiency of “ swept wing”aircraft, but would require regulatory pressure and or/government support. In airframetechnology, the application of hybrid laminar flow control (HLFC) offers reductions of15 to 20 percent fuel burn. When applied to engine nacelles, HLFC can result in bothnoise and fuel burn reductions.
• High bypass ratio turbofan engines should be designed with substantially reduced NOxand CO2 emissions.
• The trend toward larger aircraft provides an opportunity for a large flying wing, orblended wing-body, configuration. This configuration offers significantly greateraerodynamic efficiency and also greater structural efficiency, with the prospects ofappreciably reduced operating costs. While aircraft with this design will not likely beavailable for years, work should continue to identify and resolve the key engineeringissues. Figure III-1 shows a blended wing-body configuration.
• Kerosene is assumed to be the only likely aviation fuel in the next 50 years. However, itis envisaged that liquid hydrogen may eventually become available as an alternative. Allaircraft configurations considered in the Greener by Design report could be adapted toliquid hydrogen. Substantial reductions in emissions could be realized with this fuelchange.
67 Royal Aeronautical Society, Society of British Aerospace Companies, British Air Transportation Association,British Department of Trade and Industry, 2001.68 This is less optimistic than a report published by the Intergovernmental Panel on Climate Change (IPCC),Aviation and the Global Atmosphere, where a 40-50 percent improvement was predicted.
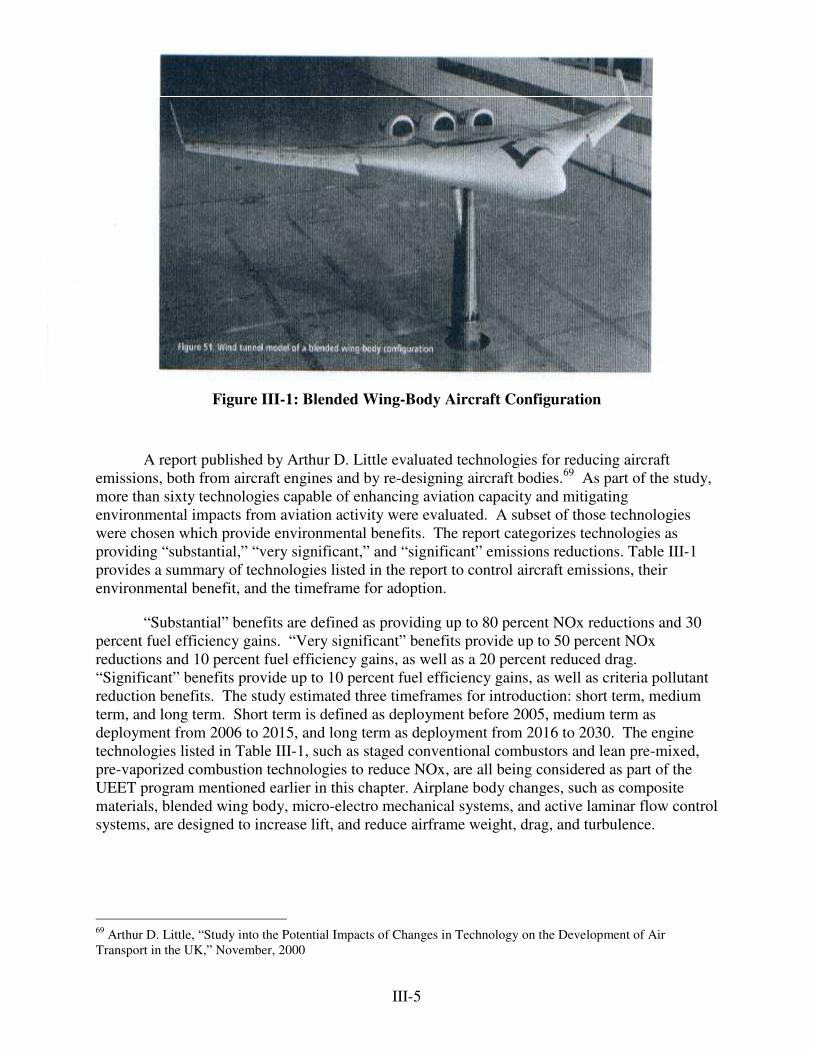
III-5
Figure III-1: Blended Wing-Body Aircraft Configuration
A report published by Arthur D. Little evaluated technologies for reducing aircraftemissions, both from aircraft engines and by re-designing aircraft bodies.69 As part of the study,more than sixty technologies capable of enhancing aviation capacity and mitigatingenvironmental impacts from aviation activity were evaluated. A subset of those technologieswere chosen which provide environmental benefits. The report categorizes technologies asproviding “ substantial,” “ very significant,” and “ significant” emissions reductions. Table III-1provides a summary of technologies listed in the report to control aircraft emissions, theirenvironmental benefit, and the timeframe for adoption.
“ Substantial” benefits are defined as providing up to 80 percent NOx reductions and 30percent fuel efficiency gains. “ Very significant” benefits provide up to 50 percent NOxreductions and 10 percent fuel efficiency gains, as well as a 20 percent reduced drag.“ Significant” benefits provide up to 10 percent fuel efficiency gains, as well as criteria pollutantreduction benefits. The study estimated three timeframes for introduction: short term, mediumterm, and long term. Short term is defined as deployment before 2005, medium term asdeployment from 2006 to 2015, and long term as deployment from 2016 to 2030. The enginetechnologies listed in Table III-1, such as staged conventional combustors and lean pre-mixed,pre-vaporized combustion technologies to reduce NOx, are all being considered as part of theUEET program mentioned earlier in this chapter. Airplane body changes, such as compositematerials, blended wing body, micro-electro mechanical systems, and active laminar flow controlsystems, are designed to increase lift, and reduce airframe weight, drag, and turbulence.
69 Arthur D. Little, “ Study into the Potential Impacts of Changes in Technology on the Development of AirTransport in the UK,” November, 2000
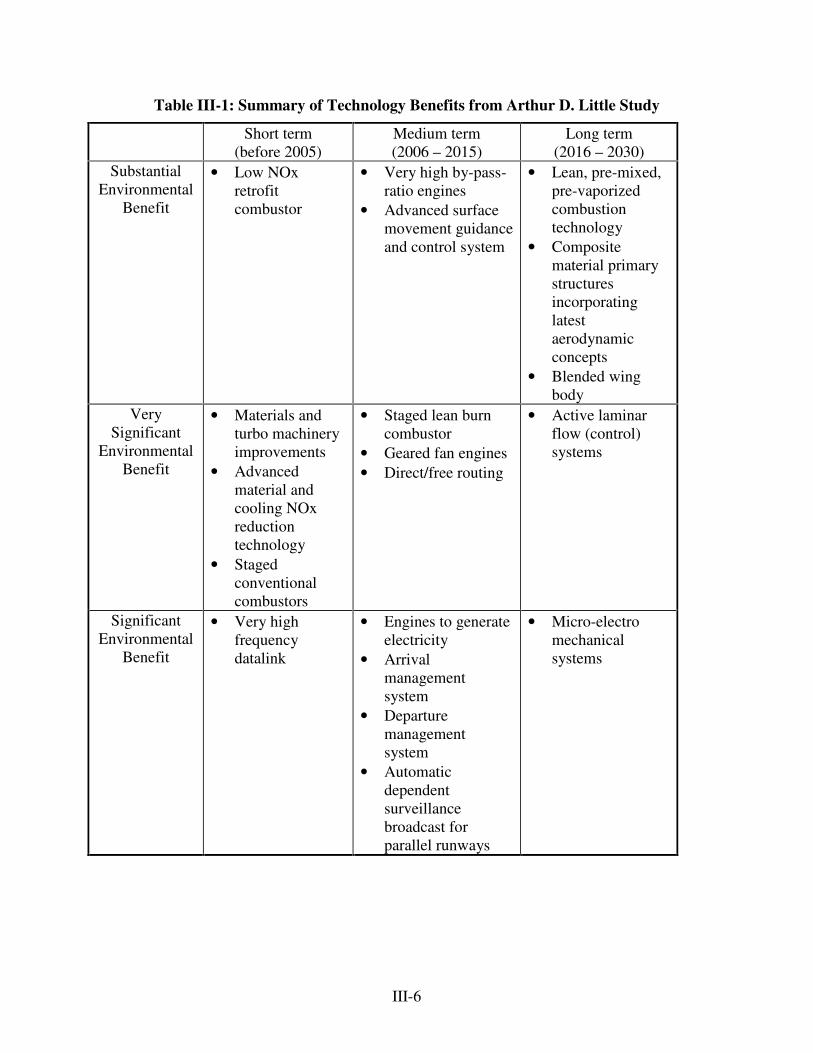
III-6
Table III-1: Summary of Technology Benefits from Arthur D. Little Study
Short term(before 2005)
Medium term(2006 – 2015)
Long term(2016 – 2030)
SubstantialEnvironmental
Benefit
• Low NOxretrofitcombustor
• Very high by-pass-ratio engines
• Advanced surfacemovement guidanceand control system
• Lean, pre-mixed,pre-vaporizedcombustiontechnology
• Compositematerial primarystructuresincorporatinglatestaerodynamicconcepts
• Blended wingbody
VerySignificant
EnvironmentalBenefit
• Materials andturbo machineryimprovements
• Advancedmaterial andcooling NOxreductiontechnology
• Stagedconventionalcombustors
• Staged lean burncombustor
• Geared fan engines• Direct/free routing
• Active laminarflow (control)systems
SignificantEnvironmental
Benefit
• Very highfrequencydatalink
• Engines to generateelectricity
• Arrivalmanagementsystem
• Departuremanagementsystem
• Automaticdependentsurveillancebroadcast forparallel runways
• Micro-electromechanicalsystems
III-7
In sum, engine and aircraft designers can make choices as they move forward to improveefficiency and simultaneously reduce noise and NOx emissions. Researching and developingengines with increased bypass ratio is one approach. Taking steps to improve aircraftstructurally and aerodynamically will also improve efficiency and simultaneously lower criteriapollutants. Structural and aerodynamic designs being discussed by the industry include blendedwing-body, turbo engine fans, and the development of a wholly laminar flying wing. Thesedesigns have the potential to make quieter aircraft with decreased fuel burn and substantial NOxemissions reductions. New engine emission standards that encourage a move toward increasedefficiency and reduced fuel consumption are needed in order to signal to the industry theimportance of developing engines that meet both goals.
In addition to engine technologies, Table III-1 also includes technologies that can reduceaircraft taxi and idling times by improving the management of aircraft traffic on the runway.These technologies could augment operational measures discussed in the next section to reduceaircraft emissions associated with taxi and idling time. For example, advanced surfacemovement guidance, very high frequency (VHF) datalink, arrival and departure managementsystems, and automatic dependent surveillance broadcast systems are technologies that canreduce aircraft taxi and idling times by making the on-airport movement of aircraft moreefficient. The technologies facilitate a constant rate of passage in all weather conditions,improve aircraft guidance and routing, coordinate the aircraft queue for take off, provide fasterand more direct communication between air and ground crew, and optimize ground traffic flowin and around the terminal maneuvering area. Operational measures are further discussed in thenext section.
B.2 Operational Options
A variety of options for reducing aircraft emissions are available which do not involvechanges to current engines or aircraft design. These options generally fall into three categories:
• Improving airlines’ overall operational efficiency (in terms of emissions per passengerserved),
• Reducing taxi time, and
• Reducing power output during taxi, takeoff and landing.
Improving Airline Efficiency
Airlines can improve their operational efficiency by maximizing the number ofpassengers on each flight, thereby minimizing emissions per passenger. Airlines already have astrong profit incentive to increase their “ load factors” – the percent of occupied seats on a givenflight. For example, a single flight serving more passengers on a larger airplane may reduceemissions – and airline costs – compared to multiple flights using smaller airplanes to serve thesame route. However, other considerations often apply, such as the desire to provide customerswith frequent flight options. Depending on how landing fees are structured, it may also be moreexpensive in some cases to land one large airplane compared to two smaller craft. Beyondimproving load factors, airlines could reduce emissions per passenger by managing their fleets tomaximize the use of their cleanest aircraft, particularly into heavily trafficked airports that are
III-8
especially susceptible to delays. The opportunity for this type of optimization depends on thesize and diversity of a given airline’ s fleet.
Reducing Taxi Time
As discussed in Chapter II, aircraft emissions of CO and HC tend to be particularly highduring taxi-in and taxi-out, when aircraft engines are operating at less than maximum efficiency.Hence, operational changes that reduce aircraft idling and taxi time can directly reduce pollutantemissions. A variety of options exist for reducing taxi time. For example, so-called “ dispatchtowing” – especially with high-speed tugs – can be used to move aircraft between the terminalgate and runway more efficiently and with fewer frequent stops than with standard practices.Since taxi-out time tends to be longer than taxi-in time, this option is likely to be most feasibleon departing flights. Potential emissions benefits for this option are somewhat offset byadditional emissions from the tow tug engine (unless it is electric powered) and from continuedoperation of the aircraft’ s APU for ventilation and electricity during towing.
Taxi time can also be reduced by airport designs that allow planes to stay close torunways between landing and takeoff. This can be accomplished by decentralized gate designswherein passengers are brought to and from the aircraft by other transport vehicles. For example,Dulles International Airport near Washington, DC was originally designed to work this way.Again, the resulting reduction in aircraft emissions would be somewhat offset by increasedemissions from ground passenger transport vehicles.
A broad set of congestion reduction measures can be used to further reduce aircraft taxitime. Such measures can include gatehold procedures that keep planes at the gate until they areready for takeoff, thereby limiting unnecessary idling time on the runway. Widening, extendingor building new taxiways can help reduce intermittent stops, increase access between taxiways,and allow for more direct taxi routes. Taxi turnouts designed to allow aircraft to enter or exit therunway at higher speeds can also reduce stops and expedite clearing of the runway to minimizedelays. Another option that may be appropriate, provided safety concerns can be addressed, isallowing aircraft to access the runway at the intersection of the taxiway and the runway, as mostaircraft do not need to use the full length of runway for takeoff.
In addition to congestion reduction measures on the ground, strategies to address in-aircongestion can help reduce delays and unnecessary taxi time by minimizing the time thatdeparting aircraft spend waiting for incoming aircraft – which have priority – to land. Strategiesfor reducing in-air congestion include using separate runways for commercial and smalleraircraft, which operate at lower speed, and reducing the longitudinal separation between inboundand outbound flights in the air to maximize the rate at which airplanes can leave and enter theairport vicinity.
The Arthur D. Little study summarized above described a number of technologies which,if introduced, could facilitate operational efforts to reduce taxi and idling times. These included:arrival and departure management systems, the A-SMGCS system, the automatic dependentsurveillance broadcast (ADS-B), data-link flight information service, runway managementsystem, and surface management system. The systems are designed to allow for aircraftmovement rates under all weather conditions and to optimize traffic flow.
III-9
Minimizing Engine Use
A third category of operational strategies to reduce aircraft emissions involvesminimizing engine use, particularly in inefficient, low-power modes during taxi and landing. Forexample, most large aircraft have two to four engines, one or more of which can be shut downduring taxi. This not only reduces emissions, but allows the remaining engines to operate moreefficiently at higher RPM, resulting in fuel savings, as well as lower HC and CO emissions perpound of fuel consumed. Potential reductions from this relatively simple measure are highest fordeparting flights, which generally have longer taxi times than incoming flights. Airports thatencourage this practice, such as Heathrow Airport in the United Kingdom, typically leave it tothe pilots’ discretion, as shutting down some engines can reduce aircraft control and may beinfeasible under certain conditions or with certain aircraft. In addition, it is necessary to take intoaccount the fact that engines must be run two minutes prior to take off to achieve thermalstability and two minutes after landing to cool down.
A related measure that can help to substantially reduce NOx emissions is “ deratedtakeoff,” wherein engines are not set to full power during takeoff. Typically, full engine thrust isonly needed under extreme conditions, such as in hot weather or with a heavily loaded plane, andengine thrust can be safely reduced from the maximum during takeoff.70 Again, this option isrelatively simple to implement, but may be constrained by other considerations, such as the needto clear the runway quickly to avoid congestion, or to follow a steep flight path to minimizenoise impacts on surrounding communities. Engine power and emissions can sometimes also bereduced during landing by minimizing the use of reverse thrust to help slow the aircraft. Onlarger, heavier planes and at airports with relatively shorter runways, engines are often run nearfull power with the thrust reversers engaged during landing. This can produce substantial NOxemissions. Safety, runway length, and airport design (some airports require aircraft to slowsignificantly before exiting the runway) are key considerations in implementing this option. Inaddition, most pilots – in an effort to land the aircraft smoothly – will use as much of the runwayas possible instead of forcing the plane down earlier. This promotes heavier use of reversethrust. Air carriers have stated that they currently minimize engine use when feasible, but littledata on the use of these techniques is available, so the extent to which further introduction ofthese measures is possible needs further exploration.
An approach currently being discussed to reduce aircraft emissions is improvement to theNational Airspace System (NAS) with a focus on improvements in the Communication,Navigation, and Surveillance/Air Traffic Management (CNS/ATM). CNS/ATM offers anumber of operational measures to reduce aviation emissions. In the U.S., the airline industry isfocusing on the concept of “ Free Flight” 71 for its CNS/ATM modernization. Free flight wouldreduce the amount of air traffic control restrictions placed on flight routes and would allow wind-optimized cruise trajectories and altitudes, and more efficient surface traffic operations. Inrecent years, free flight has become technically feasible with advances in information systems.An FAA report estimated that 10 billion pounds of fuel could be saved in 2015 with National
70 In addition, FAA requires one full throttle takeoff per month to ensure that the engines are capable of full thrust ifnecessary.71 In “ free flight,” operators have the freedom to select their path and speed in real-time. Restrictions are placed onsome aspects to ensure separation, to preclude exceeding airport capability, and to ensure safety, among others.
III-10
Airspace System (NAS) modernization. 72 This would translate to an annual reduction of 209million pounds of NOx, 211 million pounds of CO, and 59 million pounds of HC; these arereductions of over nine percent, 12 percent, and 18 percent, respectively. Most of the savingswould occur above 3,000 feet in altitude (up to 94 percent); however, the proposed operationalchanges would still reduce approximately four million pounds of NOx below 3,000 feet in 2015according to the FAA study.
Table III-2 shows the costs per ton of NOx, HC, and CO reduced for some of theoperational measures described above.73 These measures are inherently cost effective (reducedoperating costs result in an overall cost savings), even before taking into account the reductionsin pollutants that occur as a result of the operational changes. As would be expected, reductionsin HC and CO are greatest for those measures that reduce idling time. Similarly, reductions inNOx are greatest for those measures that reduce full load engine operation.
As is discussed in the next chapter, more stringent engine emission standards couldprovide an impetus for further substantial improvement in the emissions performance of newaircraft engines. However, EPA has historically deferred to ICAO in setting standards, and whilethe EPA has authority to establish new engine standards, it must coordinate with FAA on thelevel of control proposed. Of the measures available to state and local authorities, the most likelyto be implemented as “ retrofit” measures at existing airports are aircraft towing, congestionreduction, reduced engine taxi, and derated takeoff. Each of these measures has very low costswhich are more than paid back in operational costs savings. In each case, the high volume ofaircraft traffic through many airports means that the relatively small percentage emissionsreductions achievable from each measure on a per-flight basis translate into large potentialemissions reductions in aggregate. Importantly, these types of strategies can also be implementedat airports without the need to make major changes to current structures and systems. Indeed, allof them have been implemented to some extent at certain airports, though the extent to whichthey are routinely practiced is unknown. Many other measures mentioned in this section will befeasible only for new airports, where they can be incorporated into airport design. Those thatrequire changes to the aircraft fleet or to airline schedules will have to be examined in thecontext of cost and customer service constraints.
72 FAA, “ The Impact of National Airspace System (NAS) Modernization of Aircraft Emissions” , September 199873 Information for Table III-2 comes from EEA 1994 and EEA 1997. Emission reduction percentages werecalculated in several steps. First, emissions for one aircraft (a Boeing 737 or 767 in most cases) were calculated forbaseline and controlled cases. Emissions were calculated as the product of emission factor (lb pollutant/lb fuel), fuelconsumption (lb fuel/minute), and time in mode for one phase of the LTO cycle (standard time or adjusted time forthe control measure). Percent reductions were calculated as controlled emissions minus uncontrolled emissions as afraction of uncontrolled emissions. Emissions reductions reported in the table are for one aircraft operating in theeffected phase of the LTO cycle.
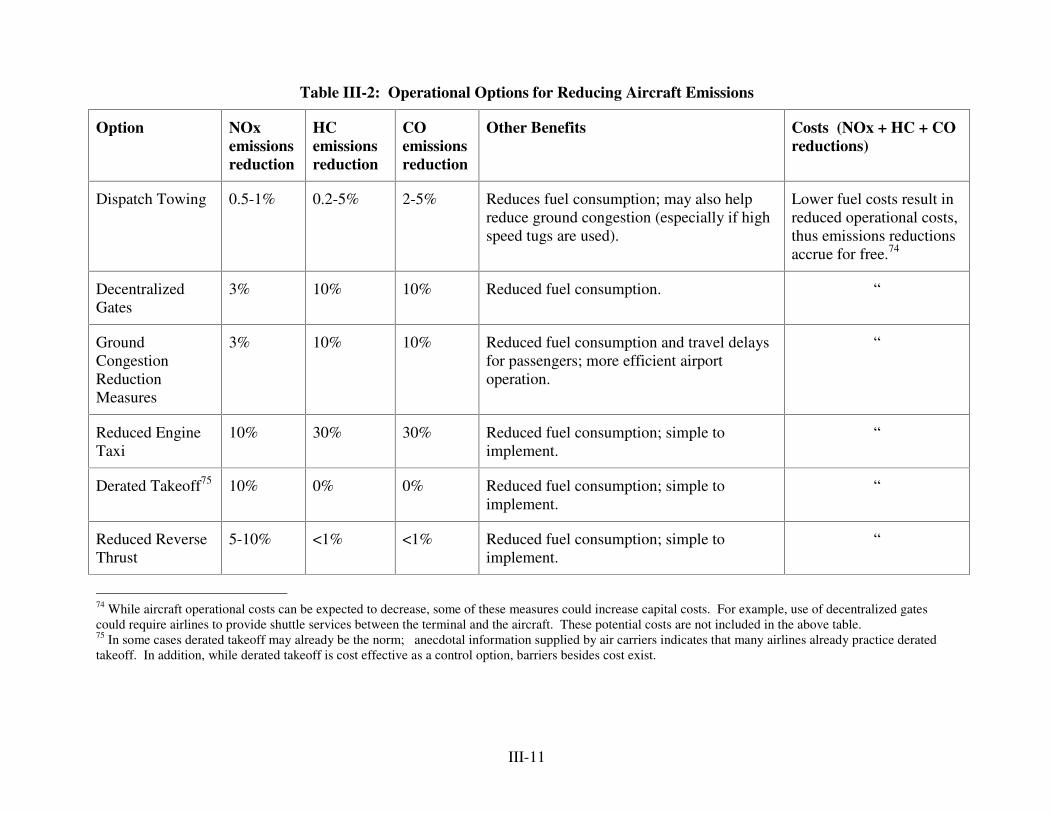
III-11
Table III-2: Operational Options for Reducing Aircraft Emissions
Option NOxemissionsreduction
HCemissionsreduction
COemissionsreduction
Other Benefits Costs (NOx + HC + COreductions)
Dispatch Towing 0.5-1% 0.2-5% 2-5% Reduces fuel consumption; may also helpreduce ground congestion (especially if highspeed tugs are used).
Lower fuel costs result inreduced operational costs,thus emissions reductionsaccrue for free.74
DecentralizedGates
3% 10% 10% Reduced fuel consumption. “
GroundCongestionReductionMeasures
3% 10% 10% Reduced fuel consumption and travel delaysfor passengers; more efficient airportoperation.
“
Reduced EngineTaxi
10% 30% 30% Reduced fuel consumption; simple toimplement.
“
Derated Takeoff75 10% 0% 0% Reduced fuel consumption; simple toimplement.
“
Reduced ReverseThrust
5-10% <1% <1% Reduced fuel consumption; simple toimplement.
“
74 While aircraft operational costs can be expected to decrease, some of these measures could increase capital costs. For example, use of decentralized gatescould require airlines to provide shuttle services between the terminal and the aircraft. These potential costs are not included in the above table.75 In some cases derated takeoff may already be the norm; anecdotal information supplied by air carriers indicates that many airlines already practice deratedtakeoff. In addition, while derated takeoff is cost effective as a control option, barriers besides cost exist.
III-12
C. Options for Reducing Ground Support Equipment (GSE) Emissions
As mentioned in Chapter II, airport ground support equipment is comprised of a wide varietyof machines used by airlines and airports to service aircraft during ground operations and to maintainrunways. Table II-14 describes the variety of equipment operating at airports and their functions.Four types of equipment dominate the GSE population: aircraft push back tractors, baggage tugs,baggage belt loaders, and tool carts. At the three airports studied, GSE accounted for nine percent oftotal aircraft emissions (excluding APU emissions).
The first emissions regulations for engines used to power diesel GSE were introduced formodel year 1996.76 Gasoline GSE emissions remain unregulated, although EPA finalized a rule in2002 which will require significant reductions in gasoline GSE emissions when the rule is fullyimplemented (full fleet turnover will take about 30 years).77 The new standards will phase-inbetween 2004 and 2007. Since emissions regulations for gasoline engines do not yet exist andrelatively few diesel engines are controlled, large reductions from GSE emissions are possible as acost-effective control option.
C.1 Technology Options for Reducing GSE Emissions
This section discusses three approaches to reducing GSE emissions: (1) replacement or re-power of diesel and gasoline powered machines with alternative fuels such as natural gas, propane,or electricity; (2) gate electrification to reduce GSE, GPU, and APU use; and (3) retrofittingmachines in existing fleets with emission control devices. The options discussed in this sectioninclude those currently being used to reduce emissions. No advanced technology options, such ashybrid electric GSE or fuel cells, are discussed here; while these technologies will likely be availablein the near future, they are currently in the design or prototype stages.
Alternative Fuels
Three types of alternative fuels have been used at airports to reduce GSE emissions: propane(liquefied petroleum gas or LPG), compressed natural gas (CNG), and electricity. Convertinggasoline or diesel powered GSE units to alternative fuels or electricity can achieve substantialemissions reductions. This option has been implemented at a number of airports to help meetambient air quality standards in the area and to protect the health of airport employees andcustomers. In the past, baggage handler associations complained that workers are exposed to dieseland gasoline emissions while working in enclosed spaces. Sometimes GSE exhaust fumes enter theterminal, where they can affect other airline personnel and passengers; this has been the case atairports in New York and Denver, prompting airport authorities to promote fuel switching of GSEunits at these locations.78
76 EPA, “ Control of Air Pollution; Determination of Significance for Nonroad Sources and Emission Standards for NewNonroad Compression Ignition Engines at or Above 37 Kilowatts,” June, 1994.77 EPA “ Control of Emissions from Nonroad Large Spark Ignition Engines and Recreational Engines (Marine and Land-based), Final Rule, November, 2002.78 Arcadis, Geraghty & Miller, 1999
III-13
Compressed Natural Gas and Liquefied Petroleum Gas Replacement of Conventional Engines
Conversion or replacement of conventionally-fueled GSE machines with LPG or CNG canprovide significant emissions benefits. Purpose-built CNG and LPG equipment are available as areconversion kits. For gasoline-powered equipment, conventional engines are able to use alternativefuels by replacing the existing carburetor or fuel injection system with a new system capable ofhandling CNG/LPG. Existing fuel tanks are replaced with high pressure tanks for CNG or lowpressure tanks for liquefied natural gas (LNG). Modifications are also made to the engine controls.79
Since diesel engines cannot be converted entirely to alternative fuels (as they do not have sparkplugs) they are generally converted to dual fuel vehicles, which run 20 percent of the time on dieseland 80 percent of the time on alternative fuels.
The chief constraint in switching GSE to lower emissions fuels is the up-front capital cost ofmodifying existing gasoline or diesel engines to run on a different fuel, or the cost of purchasingnew, dedicated alternative-fueled equipment.80 In addition, installing alternative fuel facilities(especially in the case of compressed natural gas) requires significant capital outlay. Typically, it isfar more costly to convert diesel-powered equipment than gasoline-powered equipment because theformer requires the substitution of a modified engine (as mentioned above). Generally, dieselengines are not converted for this reason. Conversion costs for belt loaders and baggage tractors toLPG cost about $1,700. For aircraft push back tractors the cost is approximately $2,700.Conversions of gasoline powered GSE to CNG costs approximately $5,000 while the incrementalcost for purpose-built CNG ground service equipment is approximately $30,000.81 Additional costsfor refueling and storage infrastructure also apply to CNG or LPG alternatives. LPG systems requirepressurized tanks and CNG refueling infrastructure involves high-pressure storage units, electric-powered compressors, and a dispenser system. Accommodating this infrastructure may becomplicated by space constraints at some airports and by additional safety and maintenanceconsiderations.
CNG stations provide compressed natural gas for vehicle refueling (the gas is under pressureof 3,000 pounds per square inch, or “ psi” ). There are two types of stations: slow-fill and fast-fill.Slow-fill stations are less expensive but require fueling to take place overnight. The fast-fill methodallows for re-fueling within an hour. A fast-fill station that can refuel 50 pieces of GSE equipmentcosts approximately $750,000. LPG uses a different system, in which the fuel is delivered torefueling stations in a liquid form and is kept in pressurized, insulated storage tanks.
Once installed, both CNG/LPG engines are often less costly to maintain and last longer,requiring less-frequent routine service than conventionally fueled engines. This is because diesel andgasoline contain contaminants that build up in the cylinders and exhaust system, and therefore
79 The fuel to air ratio is typically leaner for CNG than for gasoline vehicles. Because the compression ratio cannot bechanged, converted gasoline engines are less efficient than dedicated natural gas engines. These factors lead to increasedfuel costs and emissions (over dedicated CNG/LPG engines). Converted engines are sometimes calibrated rich ratherthan lean.80 Note that new, “ dedicated” vehicles designed to maximize performance on alternative fuels typically produce greateremissions benefits that converted conventional vehicles. If conversions are not properly installed emissions can increasefrom the conventional systems. Because demand for alternatively-fueled vehicles and engines has been minimal to date,dedicated machines have not been developed at mass production levels and incremental costs are high relative to theirconventional counterparts.81 The costs in this section come from the Energy and Environmental Analysis report of 1994
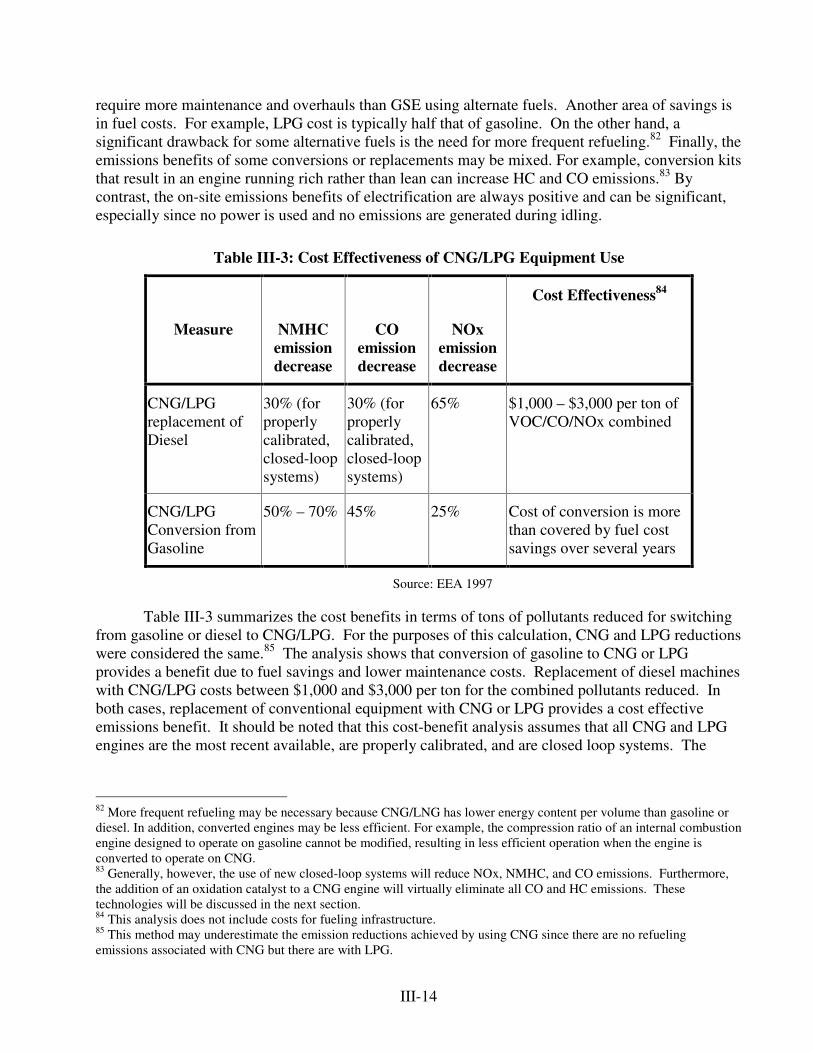
III-14
require more maintenance and overhauls than GSE using alternate fuels. Another area of savings isin fuel costs. For example, LPG cost is typically half that of gasoline. On the other hand, asignificant drawback for some alternative fuels is the need for more frequent refueling.82 Finally, theemissions benefits of some conversions or replacements may be mixed. For example, conversion kitsthat result in an engine running rich rather than lean can increase HC and CO emissions.83 Bycontrast, the on-site emissions benefits of electrification are always positive and can be significant,especially since no power is used and no emissions are generated during idling.
Table III-3: Cost Effectiveness of CNG/LPG Equipment Use
Measure NMHCemissiondecrease
COemissiondecrease
NOxemissiondecrease
Cost Effectiveness84
CNG/LPGreplacement ofDiesel
30% (forproperlycalibrated,closed-loopsystems)
30% (forproperlycalibrated,closed-loopsystems)
65% $1,000 – $3,000 per ton ofVOC/CO/NOx combined
CNG/LPGConversion fromGasoline
50% – 70% 45% 25% Cost of conversion is morethan covered by fuel costsavings over several years
Source: EEA 1997
Table III-3 summarizes the cost benefits in terms of tons of pollutants reduced for switchingfrom gasoline or diesel to CNG/LPG. For the purposes of this calculation, CNG and LPG reductionswere considered the same.85 The analysis shows that conversion of gasoline to CNG or LPGprovides a benefit due to fuel savings and lower maintenance costs. Replacement of diesel machineswith CNG/LPG costs between $1,000 and $3,000 per ton for the combined pollutants reduced. Inboth cases, replacement of conventional equipment with CNG or LPG provides a cost effectiveemissions benefit. It should be noted that this cost-benefit analysis assumes that all CNG and LPGengines are the most recent available, are properly calibrated, and are closed loop systems. The
82 More frequent refueling may be necessary because CNG/LNG has lower energy content per volume than gasoline ordiesel. In addition, converted engines may be less efficient. For example, the compression ratio of an internal combustionengine designed to operate on gasoline cannot be modified, resulting in less efficient operation when the engine isconverted to operate on CNG.83 Generally, however, the use of new closed-loop systems will reduce NOx, NMHC, and CO emissions. Furthermore,the addition of an oxidation catalyst to a CNG engine will virtually eliminate all CO and HC emissions. Thesetechnologies will be discussed in the next section.84 This analysis does not include costs for fueling infrastructure.85 This method may underestimate the emission reductions achieved by using CNG since there are no refuelingemissions associated with CNG but there are with LPG.
III-15
emissions benefit could be much lower with some older, poorly-calibrated CNG and LPGequipment.86 The analysis does not include the cost of fueling infrastructure.
Electric GSE
Ground service equipment is either purpose-built for electric power, or can be converted toelectric power. Successful examples of both approaches can be found in the U.S. and in Europe. Inelectric GSE, conventional engines are substituted with electric motors and fuel tanks are replacedwith lead acid batteries. Electric aircraft tugs, potable water carts, baggage conveyor belts, and othermachines are commercially available. The benefits of electric GSE include the elimination of on-airport GSE emissions, noise, and the odor associated with gasoline or diesel machines. The costsassociated with the use of electric equipment include installation of recharging units, incrementalcosts associated with the purchase of purpose-built electric GSE or conversion of conventionalequipment, battery replacement, and mechanics and operator training.
The initial cost of purchasing dedicated electric GSE – which is, for example, 27 percenthigher for an electric baggage tractor with batteries than for a diesel – is largely offset by fuel andmaintenance costs savings over the lifetime of the machine (assumed to be 8 to 10 years, dependingon the type of equipment). Some types of GSE, such as belt loaders, have an even lower incrementalcost and thus a shorter payback time than baggage tractors. The maintenance needs of electricequipment are very different than their conventional counterparts. Electrical equipment requiresvery little routine service other than maintaining the battery’ s water and acid levels. Every 3,000 to6,000 hours, however, lead-acid batteries must be replaced. Battery technology is improving,however, and alternatives to lead-acid designs tend to have longer lifetimes, although the initial costis still significantly higher.
The cost of charging infrastructure should be included in any cost effectiveness calculation,as in the current analysis. Airport operators can choose from a number of types of charginginfrastructures, including slow and fast charging, which will impact the cost of the conversion. Slowcharging is the least costly option, but can require up to 8 hours of recharging time, while fastrecharging can take 45 minutes. While the fast charging systems are more expensive, they havecollateral benefits which should be considered, such as the convenience of periodic “ opportunity”charging and the ability to increase battery life by as much as 300 percent. Slow charging canrequire the installation of more power stations since nearly all machines will need to be charged atthe same time. To offset the costs of electric charging infrastructure, some companies are offeringfast charging services which include design, start up, maintenance, and service over several years.
Table III-4 presents an analysis comparing the cost effectiveness of replacing diesel andgasoline GSE with electric GSE. The Nonroad Electric Vehicle Application (NREVA) lifecycle costmodel, used for this analysis, was developed Energy Resources Group and Boston Systems andSolutions for the Electric Power Research Institute in 1997. The NREVA inputs include energycosts, tax rates, capital and operating vehicle costs, and charging infrastructure costs. Some of theassumptions of the model include:
86 It should be noted that the costs reported for the use of CNG or LPG varied considerably among the Arcadis and EEAreports. However, improvements in CNG and LPG engine calibration have considerably improved emissions. Thus, allcosts cited here represent costs associated with purpose-built and properly-calibrated engines.
III-16
• Electric vehicle charging takes place two times a day: 4 hours during peak times and 4 hoursduring non-peak times, so as not to under or overestimate costs associated with recharging.
• Extra battery needs and costs are estimated for individual equipment based on ERG/EPRIairport interviews.
• Tax data was taken from the U.S. Statistical Abstract and gasoline and diesel fuel prices fromthe U.S. DOE.
• Outputs are annualized in dollars per year for vehicle costs, charger, additional batteries,electric equipment, maintenance, and amortized capital costs of taxes.
• Electric costs are based on Southern California Edison rates.
• The model assumes that electric equipment lasts two years longer than conventionalequipment. As a result, battery costs are amortized over a longer period than if theassumption is made that they operate for the same amount of time as diesel and gasmachines.
• Assumes approximately 4,000 gallons of gasoline or diesel are used each year per piece ofequipment.
• Emissions associated with power generation are not included.
• Horsepower, load factor, lifetime, and annual hours of use come from the ARB OFFROADmodel.
While Table III-4 does not have columns for all of these inputs and assumptions, they areimbedded in the model calculations.
The Arcadis study concluded that certain types of electric equipment cost significantly less topurchase and operate than diesel or gasoline equivalents. For others, such as baggage tractors anddiesel aircraft tugs, emission reduction cost ranged from $1,900 to $5,800 per ton. A cost of $1,900per ton of NOx reduced is considered cost-effective according to the EPA guidelines established aspart of the Ozone Transport Assessment Group (OTAG) process. It is important to note that theArcadis study did not take into account electric utility emissions associated with the use of electricGSE. In some regions of the country, including the Northeast, including these emissions wouldsomewhat reduce the emissions cost effectiveness of using electric GSE. Thus, a calculation of netemissions benefits at the regional level would have to account for the sources of power used and theefficiency of power generation, distribution, storage, and use.
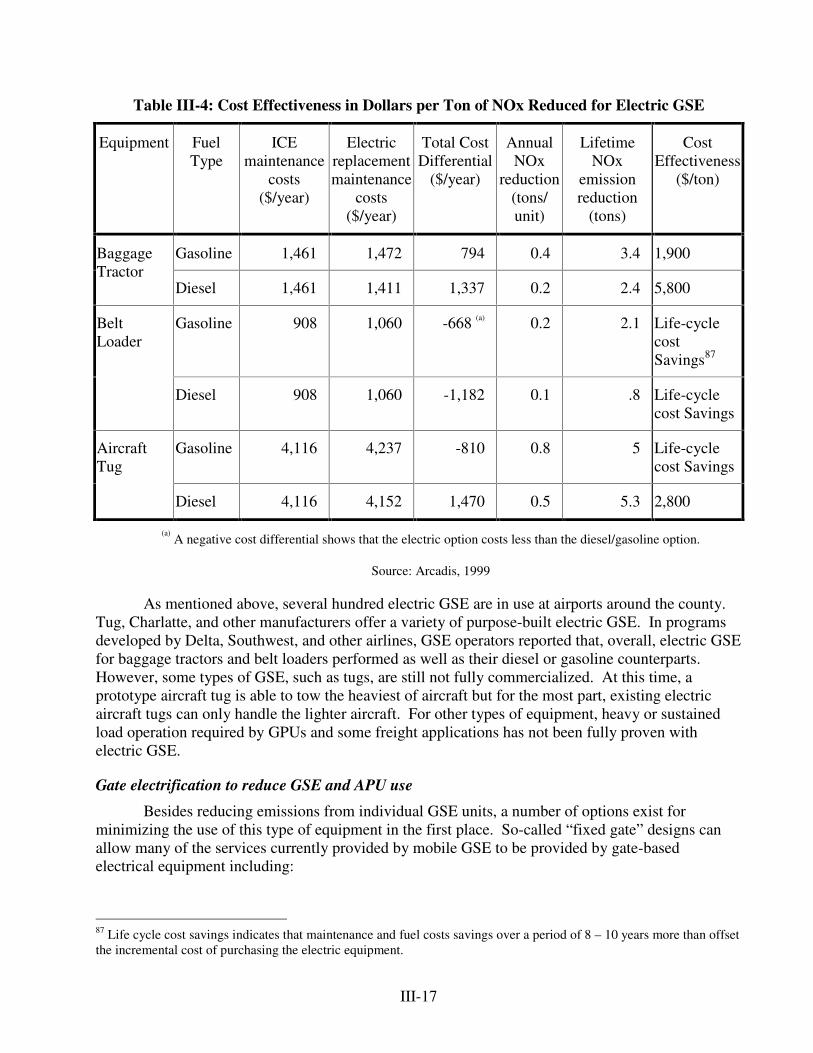
III-17
Table III-4: Cost Effectiveness in Dollars per Ton of NOx Reduced for Electric GSE
Equipment FuelType
ICEmaintenance
costs($/year)
Electricreplacementmaintenance
costs($/year)
Total CostDifferential
($/year)
AnnualNOx
reduction(tons/unit)
LifetimeNOx
emissionreduction
(tons)
CostEffectiveness
($/ton)
Gasoline 1,461 1,472 794 0.4 3.4 1,900BaggageTractor
Diesel 1,461 1,411 1,337 0.2 2.4 5,800
Gasoline 908 1,060 -668 (a) 0.2 2.1 Life-cyclecostSavings87
BeltLoader
Diesel 908 1,060 -1,182 0.1 .8 Life-cyclecost Savings
Gasoline 4,116 4,237 -810 0.8 5 Life-cyclecost Savings
AircraftTug
Diesel 4,116 4,152 1,470 0.5 5.3 2,800
(a) A negative cost differential shows that the electric option costs less than the diesel/gasoline option.
Source: Arcadis, 1999
As mentioned above, several hundred electric GSE are in use at airports around the county.Tug, Charlatte, and other manufacturers offer a variety of purpose-built electric GSE. In programsdeveloped by Delta, Southwest, and other airlines, GSE operators reported that, overall, electric GSEfor baggage tractors and belt loaders performed as well as their diesel or gasoline counterparts.However, some types of GSE, such as tugs, are still not fully commercialized. At this time, aprototype aircraft tug is able to tow the heaviest of aircraft but for the most part, existing electricaircraft tugs can only handle the lighter aircraft. For other types of equipment, heavy or sustainedload operation required by GPUs and some freight applications has not been fully proven withelectric GSE.
Gate electrification to reduce GSE and APU use
Besides reducing emissions from individual GSE units, a number of options exist forminimizing the use of this type of equipment in the first place. So-called “ fixed gate” designs canallow many of the services currently provided by mobile GSE to be provided by gate-basedelectrical equipment including:
87 Life cycle cost savings indicates that maintenance and fuel costs savings over a period of 8 – 10 years more than offsetthe incremental cost of purchasing the electric equipment.
III-18
• Toilet disposal and fresh water delivery,
• Food catering,
• Baggage delivery from a conveyor belt system rather than mobile tractors, and
• Refueling from a gate-based hydrant and filter system rather than a fuel truck.
Full incorporation of these systems can result in a “ vehicle-free gate,” largely eliminating on-site emissions from mobile GSE.88 In addition, fixed gate designs can significantly reduce emissionsfrom the aircraft APU and from ground power units (GPU) by allowing gate-based power and airhook-ups to supply energy directly to the aircraft. To implement this option, power must beconverted from the type the utility supplies to the type that the aircraft uses. Different systems canbe used to distribute power to terminal gates including:89
• Centralized fixed power and preconditioning systems,
• Point-of-use pre-conditioned air and power systems,
• Mini-central fixed power systems (electricity only), and
• Pneumatic power (air-conditioning only).
Centralized power and preconditioning systems include a centrally-located power supply orair-conditioning unit. Wiring or hoses are then connected from this unit to the individual gates toprovide power or air conditioning throughout the airport. This type of system has the advantage ofhandling many aircraft and widely varying power loads.
Provided the fixed system is capable of supplying all the aircraft’ s electrical and airconditioning needs (not currently the case for most fixed systems in use today), APU use could bereduced from an average of 45 minutes per layover to approximately 7 minutes for a narrow body jetand from 120 minutes to 7 minutes for a wide-body jet,90 with corresponding emissions reductions.Obviously, implementation of any of the above systems would require an up-front capitalinvestment, but once installed, fuel and labor savings and other efficiencies generated by fixed gatesystems tend to result in a relatively short payback time (less than 2 years). As an example, point-of-use gate based power provides a cost savings in fuel of $29 per hour over APU use. As a result, thissystem pays for itself in just over one year. For every year afterward, the airport receives botheconomic and emissions benefits. Besides their emissions and cost benefits, fixed-gate systemsprovide a number of other benefits: they are less obtrusive, reduce GSE-to-aircraft accidents, require 88 Some of these systems are largely intended for new terminal construction and can be extremely difficult to retrofit intoexisting terminals. A baggage conveyer belt is such an example.89 Specific codes and operational regulations that will affect the installation of such systems vary by airport. In addition,implementation of some systems may require changes to gate design or terminal layout, which may in turn becomplicated by zoning and building regulations. Fully centralized power systems, for example, are difficult to installbecause all gates must be wired to a central location. However, mini-centralized systems may have difficulty managingwidely varying power loads while point-of-use systems may have difficulty handling large loads.90 APUs must be run about 5 minutes prior to departure to conduct an initial flight check and to start the main engines,even if a fixed power system is used.
III-19
less fueling and little maintenance, and can significantly reduce the complexity of ground serviceoperations.
Not all airports, however, are able to install fixed gate power. In some instances, providingpower systems can be difficult for airports with power limitations on their incoming cable.Furthermore, the retrofit of fully centralized systems may be hindered by existing terminalarchitecture, and in these cases, centralized systems will be better suited to new terminal installation.Retrofit problems are less likely with mini-centralized and point-of-use systems. However, thesetwo types of systems are not always able to handle widely varying loads or the largest aircraft.
Even with these constraints, fixed gate power and preconditioned air can be installed inexisting and new buildings. Because of the cost, emissions, and operational benefits, gate basedelectrical power and air conditioning are already in widespread use. Several large airports includingLos Angeles, Phoenix, and Boston have replaced up to 90 percent of APU-based power generationwith fixed gate power.
Experiences with Alternate-Fuel GSE
Many airports have already begun to use alternate fuel GSE technology. The 1999 Arcadisstudy details a number of these efforts. Although none of the airports examined have information onemission benefits specifically stemming from the new GSE projects, they have useful information oncosts and cost effectiveness. In general, commercially-available, electric ground service equipmentperforms well and has lower maintenance and fuel costs than conventional equipment. A number ofexamples from the Arcadis study are summarized.
Southwest Airlines at Sky Harbor Airport, Phoenix, Arizona
Southwest Airlines replaced some traditional systems with electric equipment. The airlineuses electric baggage tractors, belt loaders, and narrow body aircraft tugs. With a fast-chargingsystem called Electrix, charging time for baggage tractor batteries is reduced from 8 hours to 45minutes. Short charging periods permit rotation of equipment being charged, requiring less spacethan a slower system would. Although the models of electric GSE used by Southwest are moreexpensive than conventional ones, the company believes that most have proven to be cost-effective.The baggage tractors and belt-loaders compensate for high initial costs by savings in fuel costs. Thefast-charging Electrix system is more expensive than a conventional charger, but the installation costis lower because it requires less modification to the existing system. A study commissioned byElectrix found that the cost benefit for the fast charging system over a conventional one is about$4/truck/day.
Southwest Airlines at Ontario International Airport, Ontario, California
Southwest Airlines’ Ontario project is similar to the project at Sky Harbor. The airlineelectrified baggage tractors, belt loaders and aircraft tugs. No major infrastructure changes werenecessary to install a charger system. Results of the conversion were similar to those at the Phoenixairport. The baggage tractor and belt loader performed well, while the aircraft tug proved to be cost-ineffective despite fuel cost savings. As discussed earlier, although electric vehicles and fastcharging systems are more expensive than conventional ones, fuel savings and extended battery lifemakes the new systems most cost-effective.
III-20
United Airlines and the South Coast Air Quality Management District at Los Angeles InternationalAirport, Los Angeles, California
United Airlines developed an electric aircraft tug with a large towing capacity and aninductive charging system for smaller electric tugs already being used by the airline at LAX. Thetug uses an inductive charging system composed of a charging port and a charging station at a tug’ sparking space. The use of the electric tug required no infrastructure changes, while the inductivecharging system required the installation of a charging system and the modification of tugs thatwould use it. The commercial version of the electric tug might cost between $50,000 and $125,000,depending on performance requirements and the size of the order.
Delta Airlines at Atlanta-Hartsfield International Airport, Atlanta, Georgia
Delta Airlines purchased 70 electric baggage tractors in 1996. The airline charges thetractors’ batteries overnight. This more conventional charging system is satisfactory because theequipment is only operated 9-10 hours a day, which leaves sufficient downtime. The cost of eachtug is approximately $25,000 excluding the battery. A conventional equivalent costs between$16,000 and $19,000.
American Airlines and Toyota Industrial Equipment Partnership
As a part of American Airlines’ goal to electrify all of its GSE by 2010, the airline is workingwith Toyota in a 10-year partnership to provide electric forklifts on three-year leases. Airportoperators are trained to charge the forklifts whenever they are not in use; this type of “ opportunitycharging” allows charging whenever it is convenient. The partnership decided to install one chargerfor each forklift. Although the total cost of the program has yet to be determined, the airline expectscost savings because of decreased maintenance.
Retrofit and Fuel Improvement Options
As noted previously, the current GSE fleet is comprised primarily of diesel and gasolineengines, with a small percentage of propane and CNG engines. This section discusses retrofitdevices that are attached in the exhaust stream (usually as a replacement muffler) to controlemissions. Retrofit devices include oxidation and 3-way catalysts, as well as particulate filters. Inaddition, alternate diesel fuels that work alone or in conjunction with the retrofit control technologieswill be mentioned in this section.
Oxidation catalysts can be applied engines that run “ lean,” such as diesel and natural gasengines, to oxidize HC, CO, and PM to CO2 and H2O. Emissions of CO and HC can be reduced byas much as 90 percent, and an approximate reduction of 24 percent is seen in PM emissions. Thecost for oxidation catalysts is approximately $7 per hp, or, on average, about $1,000 for a catalystthat would fit a typically sized GSE.91 Oxidation catalysts can be retrofitted onto most highway andnonroad engines with little or no customization beyond sizing the catalyst. One limitation, however,is that catalysts may not be appropriate for machines in a state of poor maintenance or those that idlea substantial amount of time. Approximately 2 million oxidation catalysts have been installed onhighway diesel vehicles, and several thousand on nonroad machines, to date. The technology is fully
91 Personal communication with the Manufacturers of Emission Controls Association (MECA).
III-21
commercialized. While oxidation catalysts have been used most often to control diesel emissions,they can be used on natural gas engines to reduce HC and CO emissions.
Particulate filters for diesel engines can virtually eliminate particulate emissions. The filterstrap both the soluble and the carbonaceous particles in a ceramic honeycomb and the particulates areburned to form CO2 and H2O by either “ passive” or “ active” regeneration. In passive regeneration,the exhaust temperature alone heats up the ceramic honeycomb to a level sufficient to burn off thetrapped soot.92 In active regeneration, an outside heat source, such as an electrical burner, is used toheat the ceramic and induce regeneration. Active systems are appropriate for those machines withcool exhaust temperatures or for machines that idle frequently. If active regeneration systems areused indoors, venting of the gases is necessary. Particulate filters cost $14 per horsepower, orapproximately $3,000 to $5,000 per unit. Over 2,000 filters have been installed to date on nonroadmachines, largely in the mining and materials handling sectors to meet mining and occupationalhealth safety standards.
Finally, another approach to reduce diesel emissions is the use of water emulsion fuel.CARB has verified one product, PuriNOx, for use in diesel engines. The company thatmanufacturers PuriNOx (Lubrizol) is currently working with EPA to verify its product under theEPA retrofit program. Once verified, states will be able to claim SIP credits for NOx reductionsresulting from the use of PuriNOx in diesel engines. Emulsified diesel reduces NOx emissions by20 percent and particulates by 40 percent. Emulsified diesel fuels work by lowering combustionchamber temperatures and by improving fuel dissipation in the combustion chamber, therebyreducing the amount of unburned fuel and particulate that is produced. Diesel emulsion fuel canreplace regular diesel fuel with no mechanical changes to the engine. Emulsified diesel fuel isavailable in most of the U.S. and costs approximately 10 percent more than diesel fuel.
While diesel engines can be equipped with oxidation catalysts to reduce PM, CO, and HCemissions, gasoline engines can be equipped with 3-way catalysts such as those used in automobilesto control NOx, HC, and CO pollution. These catalysts are designed to operate in the richenvironment of spark-ignited engines. Tens of millions of 3-way catalysts have been installed inmotor vehicles to meet exhaust emissions standards over the last 25 years. The same technology canbe used in nonroad gasoline machines to reduce NOx, HC, and CO. Under optimum conditions, a 3-way catalyst can reduce these pollutants up to 70 percent. 3-way catalysts can be installed forapproximately $500 per unit on most engine models. For some engine configurations, the retrofit ofexisting engines with 3-way catalysts may also require changes to the fuel system to ensure that theengines run at stoichiometry (balanced air/fuel ratio). These changes would increase the cost ofretrofitting from $500 to $1,500 per machine. In either case, retrofit with 3-way catalysts would bean extremely effective control option given the low cost of installation and the large emissionreduction benefits that can be achieved.
92 Temperatures of 300 degrees centigrade are needed during 25 percent of operating time in order for passiveregeneration to work. Passive filters will only work on those machines with fairly high load factors.
III-22
D. Options for Reducing Emissions from Ground Access Vehicles (GAV)
Ground access vehicles (GAV) are responsible for a sizeable amount of total airportemissions. As mentioned in Chapter I, Logan Airport found that GAV contributed 7 percent ofairport-related NOx and 24 percent of airport-related HC emissions. In addition, airport-related tripsmake a significant contribution to overall emissions in many metropolitan areas, typicallyaccounting for 2 to 4 percent of all motor vehicle emissions and 1 to 2 percent of the total emissionsinventory. Since state SIPs account for passenger car trips to and from the airport separately fromairport-related emissions, this report does not focus on passenger car trips to and from airports inprivate vehicles. This section focuses specifically on employee private vehicles, public transportvehicles and shuttles, and cargo vehicles for deliveries. As in previous sections, this discussion ofGAV emissions reduction strategies is divided into technological and operational options.
GAV emissions estimates usually include a vehicle’ s entire trip, not just emissions that occurwithin airport boundaries. Since vehicles may make several unrelated stops during a trip to theairport, emissions from the total trip cannot all be attributed to airport-related activity. An offsettingunder-assignment of emissions is possible however. Emissions associated with off-site, airport-related vehicle activity not directly related to the transport of passengers should arguably be assignedto the airport, but typically are not.
Calculating emissions for GAV requires collecting information on reference trip emissions.Reference trip emissions are those produced by all ground vehicles before any control measures areimplemented. Calculations must also take into account: total airport vehicle miles traveled, totalairport trips, trip length, passenger access mode (solo driver, car-pool), emission factors by vehicletype, parking characteristics, average idle time, and rental car fleet size. Traffic and environmentalstudies at individual airports provide a template for estimating the above factors.
D.1 Technology Options
Commercial vehicles that serve the airport, including taxis, rental cars, buses and shuttles,provide an opportunity for reducing emissions in the airport vicinity. Los Angeles (LAX),Baltimore-Washington International (BWI), Logan International, and Phoenix Sky Harbor Airportsall have introduced CNG-powered shuttles and buses and are planning for continued growth in theuse of alternatively-fueled airport vehicles.
Many of the costs and constraints associated with switching commercial GAV to alternativefuels are similar to those previously described for ground service equipment. Potential emissionsreductions are significant, but the costs and logistical challenges of converting a large portion of thefleet and establishing the necessary refueling infrastructure can also be substantial, and can outweighthe short-term savings of fuel costs. Nonetheless, airports around the country are investing inalternative fuel infrastructure and vehicles. Once alternative fueling infrastructure is in place, it canaccommodate both GSE and GAV.
For example, Logan Airport’ s procurement of airport-owned vehicles favors alternative fuels.All of Logan’ s 40-foot buses, which provide transportation to and from the subway, satellite parking,and between terminals, are now CNG-powered. At BWI, 65 percent of airport shuttle buses arecurrently CNG-powered and all future procurements will be exclusively CNG buses. At LAX, 40
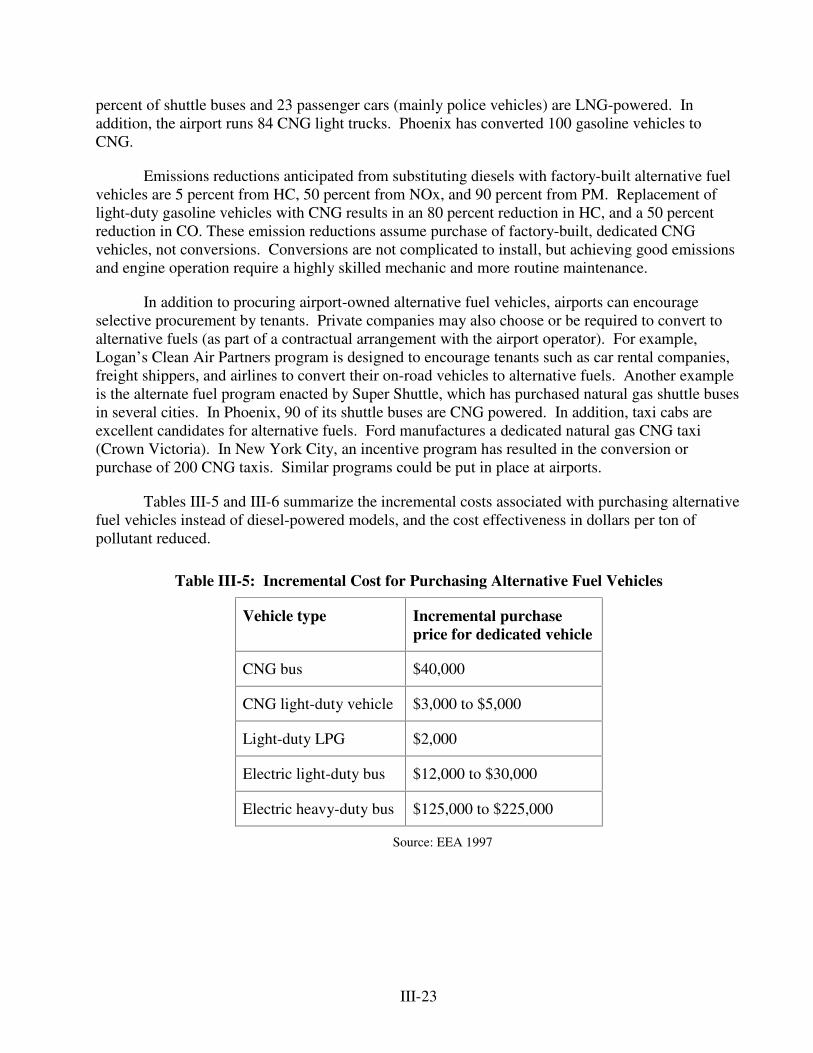
III-23
percent of shuttle buses and 23 passenger cars (mainly police vehicles) are LNG-powered. Inaddition, the airport runs 84 CNG light trucks. Phoenix has converted 100 gasoline vehicles toCNG.
Emissions reductions anticipated from substituting diesels with factory-built alternative fuelvehicles are 5 percent from HC, 50 percent from NOx, and 90 percent from PM. Replacement oflight-duty gasoline vehicles with CNG results in an 80 percent reduction in HC, and a 50 percentreduction in CO. These emission reductions assume purchase of factory-built, dedicated CNGvehicles, not conversions. Conversions are not complicated to install, but achieving good emissionsand engine operation require a highly skilled mechanic and more routine maintenance.
In addition to procuring airport-owned alternative fuel vehicles, airports can encourageselective procurement by tenants. Private companies may also choose or be required to convert toalternative fuels (as part of a contractual arrangement with the airport operator). For example,Logan’ s Clean Air Partners program is designed to encourage tenants such as car rental companies,freight shippers, and airlines to convert their on-road vehicles to alternative fuels. Another exampleis the alternate fuel program enacted by Super Shuttle, which has purchased natural gas shuttle busesin several cities. In Phoenix, 90 of its shuttle buses are CNG powered. In addition, taxi cabs areexcellent candidates for alternative fuels. Ford manufactures a dedicated natural gas CNG taxi(Crown Victoria). In New York City, an incentive program has resulted in the conversion orpurchase of 200 CNG taxis. Similar programs could be put in place at airports.
Tables III-5 and III-6 summarize the incremental costs associated with purchasing alternativefuel vehicles instead of diesel-powered models, and the cost effectiveness in dollars per ton ofpollutant reduced.
Table III-5: Incremental Cost for Purchasing Alternative Fuel Vehicles
Vehicle type Incremental purchaseprice for dedicated vehicle
CNG bus $40,000
CNG light-duty vehicle $3,000 to $5,000
Light-duty LPG $2,000
Electric light-duty bus $12,000 to $30,000
Electric heavy-duty bus $125,000 to $225,000
Source: EEA 1997
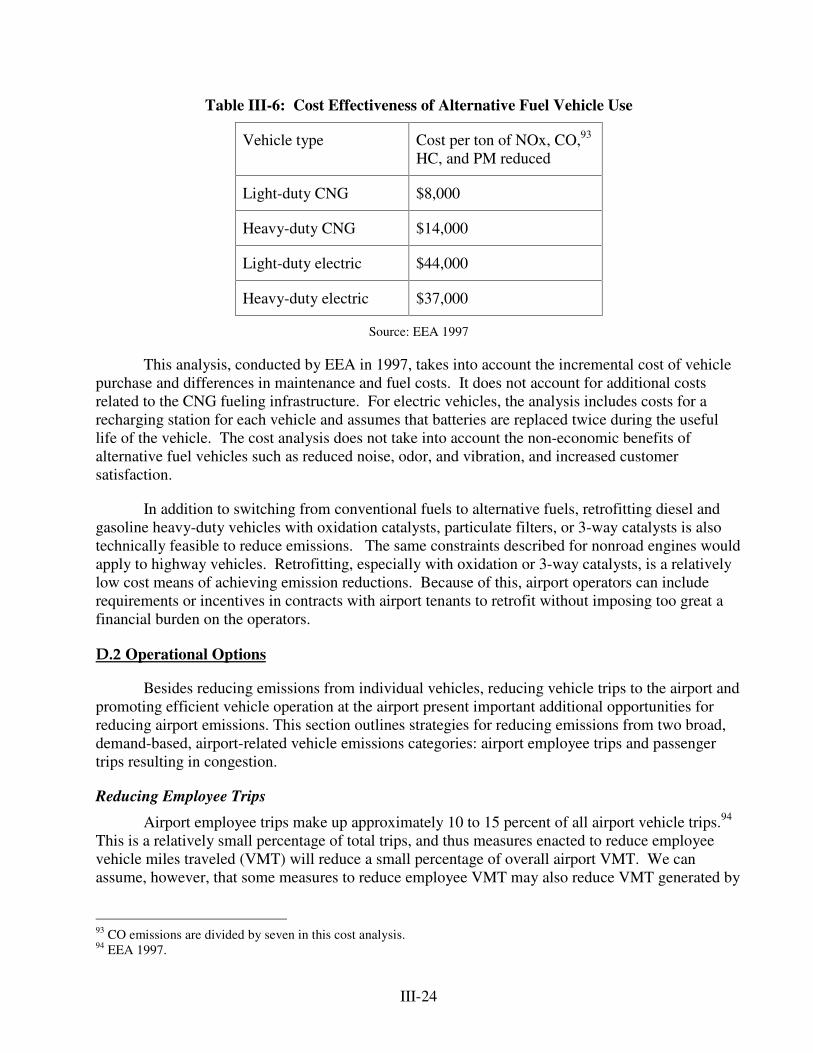
III-24
Table III-6: Cost Effectiveness of Alternative Fuel Vehicle Use
Vehicle type Cost per ton of NOx, CO,93
HC, and PM reduced
Light-duty CNG $8,000
Heavy-duty CNG $14,000
Light-duty electric $44,000
Heavy-duty electric $37,000
Source: EEA 1997
This analysis, conducted by EEA in 1997, takes into account the incremental cost of vehiclepurchase and differences in maintenance and fuel costs. It does not account for additional costsrelated to the CNG fueling infrastructure. For electric vehicles, the analysis includes costs for arecharging station for each vehicle and assumes that batteries are replaced twice during the usefullife of the vehicle. The cost analysis does not take into account the non-economic benefits ofalternative fuel vehicles such as reduced noise, odor, and vibration, and increased customersatisfaction.
In addition to switching from conventional fuels to alternative fuels, retrofitting diesel andgasoline heavy-duty vehicles with oxidation catalysts, particulate filters, or 3-way catalysts is alsotechnically feasible to reduce emissions. The same constraints described for nonroad engines wouldapply to highway vehicles. Retrofitting, especially with oxidation or 3-way catalysts, is a relativelylow cost means of achieving emission reductions. Because of this, airport operators can includerequirements or incentives in contracts with airport tenants to retrofit without imposing too great afinancial burden on the operators.
D.2 Operational Options
Besides reducing emissions from individual vehicles, reducing vehicle trips to the airport andpromoting efficient vehicle operation at the airport present important additional opportunities forreducing airport emissions. This section outlines strategies for reducing emissions from two broad,demand-based, airport-related vehicle emissions categories: airport employee trips and passengertrips resulting in congestion.
Reducing Employee Trips
Airport employee trips make up approximately 10 to 15 percent of all airport vehicle trips.94
This is a relatively small percentage of total trips, and thus measures enacted to reduce employeevehicle miles traveled (VMT) will reduce a small percentage of overall airport VMT. We canassume, however, that some measures to reduce employee VMT may also reduce VMT generated by
93 CO emissions are divided by seven in this cost analysis.94 EEA 1997.
III-25
airport passengers. For example, efforts to improve transit service at the airport could result inreduced overall VMT.
Most airports are served by one or more modes of public transport. The most common is busservice, though this tends to be perceived as a “ low-value” way to access the airport. Rail links thatprovide direct service between terminals and metropolitan centers are likely to be more attractive tomany passengers. At Boston’ s Logan Airport, for example, an existing subway link is estimated tohandle approximately 7 percent of all airport patrons, including employees. However, constructingnew rail links where they do not already exist is capital-intensive. Door-to-door shuttle services,though typically private operations out of the direct control of airport authorities, can provide animportant complement to other transit options. An example of a shuttle service that is reducing GAVVMT is Super Shuttle. They offer an environmentally friendly alternative to taxi, rental car, andprivate car trips. The decision to use natural gas vehicles at several airports has improved theirenvironmentally friendly stance.
Airports can do a number of things to encourage employees to choose these transportationoptions instead of solo vehicle travel. These include advertising for bus, shuttle and rail servicewithin the airport itself and enhancing access to transit stations from the terminal. To the extent thattransit fares are significantly lower than airport parking fees, this can provide an added incentive forthe use of public transit or shuttle services rather than private vehicles. Studies conducted by theUniversity of California at Davis and others have shown that transit subsidies can significantlyincrease transit ridership.
Employee GAV emissions can also be reduced by strategies such as compressed workschedules, telecommuting, ride sharing, and parking pricing. For example, compressed workschedules allow employees to work longer hours but fewer days (e.g. a 10-hour per day, 4-dayschedule), while telecommuting allows employees to work from home. In both cases, the number ofwork-related trips is reduced. Telecommuting works best for administrative employees at the airportwhose jobs can be done at home and have more flexibility; this option is less likely to be feasible formany airport workers whose jobs require them to be physically present, including ticketing agents,baggage handlers, and food service personnel. For those employees who must come to the airport,employers can promote ridesharing and carpooling with incentives such as preferential parking,monetary rewards, or, as a negative inducement, the elimination of parking subsidies for personalvehicles. Effective implementation of these strategies must take into account the availability ofattractive transit alternatives on the one hand, and the existence of low-cost parking options outsidebut near the airport on the other. Removing parking subsidies is, of course, only effective if airportparking was once free or employers subsidized parking. The measure may also be ineffective if low-cost parking options exist near the airport, as employees will simply begin to park there. Finally, it iscrucial that alternate transportation options be in place, convenient and competitively priced forparking pricing or other transit inducements to have the desired effect.
Reducing Congestion at Airports
Apart from reducing airport-related travel demand, strategies to reduce idling and to improvethe efficiency of traffic flow through airports present additional opportunities for reducing GAVemissions. Because many of the vehicles that access the airport spend a significant amount of timeidling, numerous airports have attempted to implement idle restrictions for at least some types ofGAV. These restrictions are most likely to be successful for commercial or cargo vehicles.
III-26
Idling restrictions may be difficult to impose in remote locations within the airport wheredrivers run engines for air-conditioning (such as at loading areas), or for drivers of private vehicleswho are restricted from spending much time at curbside in the interests of congestion mitigation andairport security. In sum, overall emissions reductions achievable through idling restrictions mayrepresent only a small percent of the airport inventory; nevertheless these small reductions can bequite cost-effective given the low cost to implement them (especially if no new personnel are neededto enforce restrictions). In addition, these efforts are particularly important in reducing exposure toPM and toxics.
Improved traffic circulation and congestion management can increase airport efficiency,improve customer satisfaction and lower total emissions. A variety of traffic management strategiescan be implemented at most airports and are particularly feasible at new airports. For example,rental agencies, hotels and parking providers often provide shuttle services that run along the sameroute. Consolidated shuttles can cut down on emissions by providing one multi-stop service in placeof several separate shuttles. The effectiveness of an airport shuttle depends on the degree of overlapof shuttle routes. EEA estimates that 50 percent of non-parking related shuttle services can beconsolidated at most US airports. In addition, most airports already limit curb access to facilitatetraffic flow. Such limits could be enhanced by curb access pricing schemes to further limit thenumber of vehicles at the curb at any point in time, and/or by creating holding areas for commercialvehicles and centralizing rental car offices. The costs of such measures are typically quite low, butobviously passenger satisfaction, convenience, safety concerns, and other objectives must beconsidered before they can be implemented.
E. Replacing Short-Haul Air Travel with Rail Service
One option that could reduce emissions from aircraft, GSE, and GAV is the replacement ofshort air trips with rail trips. In the Northeast, Amtrak currently carries more than half of allcombined rail and air passengers between Boston and Washington, D.C. and three quarters of allpassengers traveling between New York City and Washington D.C. With the introduction of thefaster Acela service, Amtrak hopes to increase that market share. In Europe, several promising highspeed rail projects are reducing air travel. These initiatives are described below. This section doesnot provide any cost effectiveness data since none are available at this time. The Arthur D. Littlestudy discussed earlier in this chapter also lists magnetic levitation high speed rail as a option whichcould provide significant environmental benefits with a medium time frame for introduction.
E.1 Amtrak/Acela Express Train Service in the Northeast U.S.
In 2001, Amtrak held a 58 percent share of the 4.5 million air and rail trips for the entireBoston-Washington Northeast Corridor. Between Boston and New York City, air dominates with a65.4 percent share, or 611,000 trips, versus 323,000 trips by rail. Between New York andWashington, Amtrak has a 76.3 percent market share. Amtrak’ s strategy is to protect itscommanding market share south of New York, and to increase its market share north of New Yorkto approximately 50 percent. Between mid-2000 and March of 2001, Amtrak increased its share oftrips between Boston and New York City by nearly seven percent. This was partially a result of railelectrification into Boston in early 2000, which reduced the trip from to New York City from 5 hoursto 3.5 hours. In January 2001, Amtrak partnered with Continental Airlines to create an air/rail
III-27
codeshare (much like those in Europe, described below), allowing passengers from Philadelphia,PA; Wilmington, DE; New Haven, CT; and Stamford, CT to easily transfer from rail to air atNewark Airport.95 This program will increase Amtrak passenger levels between some of these cities(for example, Amtrak offers 17 trains per day between Philadelphia and Newark – more than anyairline) and replaces some discontinued air service to other cities. To develop other corridorsnationally, Amtrak is focusing on densely populated regions with major cities located within a 300-350 mile range. Fifteen airports with a total of 45,000 short trips per month are potential candidatesfor new fast rail service.
E.2 Germany
The German federal government has set a target to reduce the environmental effects of airtransport through the transfer of short-haul air traffic to rail service.96 Several government andprivate initiatives have arisen out of this goal. Two such initiatives are discussed below.
As an alternative to air travel within Germany, the German railway company, DeutscheBahn, offers “ Rail & Fly / Fly & Rail” tickets. With these tickets, international travelers can usetheir airline tickets, from more than 80 international airlines, for travel on a connecting railway line.Therefore, instead of having to purchase a separate ticket for air and rail travel, passengers canpurchase one ticket that includes both modes of transportation. The intent is to make it easier forairline passengers to utilize rail as a part of their travel plans, including possibly using rail for aportion of their trip instead of air travel.
In another program to greater utilize rail, Luftansa made a commitment to replace alldomestic air travel from Frankfurt airport with rail travel by 2002. Part of the motivation for thispolicy is to open up landing slots at the Frankfurt airport by reducing or eliminating some short-haulflights. The company expects that the decision will free slots for more highly profitable internationalflights.97
E.3 France
Paris’ Charles de Gaulle Airport98 has worked with several airlines and high-speed railservice providers to encourage the use of high-speed rail service for the short-haul portion of aconnecting flight. Luftansa, United, Air France, and American Airlines have developed a ticketingagreement with SNCF where passengers have the option of taking the TGV high-speed rail for thefinal, short-haul portion of their trip.99 Under the American Airlines deal, passengers can extendtheir journey from Charles de Gaulle airport by taking the high-speed rail network to Lille, Lyon orNantes. Likewise, the Air France agreement gives customers the option of taking the high-speedtrain from Charles de Gaulle to Lyon, Lille, Angers, Le Mans, Poitiers, Tours, or Brussels.100
95 Morningstar News, January 17, 2002. <http://news.morningstar.com/news/PR/M01/D17/1011277270525.html>96 Coalition Contract, 1998 and German Transportation Report, 2000.97 Friends of the Earth. From planes to trains: realizing the potential from shifting short-flights to rail. June 2000.98 With the recent addition of two new runways, Charles de Gaulle is now the world’s eighth busiest airport with 516,657aircraft operations in 2000 (ACI, 2000).99 The Train à Grande Vitesse (TGV) is the high-speed train in France and is owned and operated by the French nationalrailways, Société Nationale des Chemins de Fer Français (SNCF).100 Friends of the Earth. From planes to trains: realizing the potential from shifting short-flights to rail. June 2000.
III-28
A growing number of passengers and airlines in Germany and France are introducing similarair-to-rail services.101 Since the opening of the TGV terminal at Charles de Gaulle in 1994, thenumber of air/rail connecting passengers has grown steadily. Of the 1.3 million rail travelers whoused the TGV at Charles de Gaulle in 2000, 850,000 were connecting passengers from either rail toair or vice versa. With the recently developed air/rail transfer possibility, some declines have beenwitnessed in short-haul flights at Charles de Gaulle. Domestic aircraft movements at Charles deGaulle have declined from 62,410 in 1999 to 61,074 in 2000.102
In 1999, Air France developed a ticketing agreement with Thalys, the Belgian high-speedtrain, where passengers ticketed with Air France can use the train for their connection to Brussels.This agreement has yielded a dramatic shift from air to rail service. Prior to this agreement, AirFrance had approximately 1,825 flights a year to Brussels, but rail service has completely replacedair service and Air France has discontinued all flights from Charles de Gaulle to Brussels.103
While no estimates of emissions reductions have been developed for the programs inGermany and France, several estimates have been developed to determine the impact of replacingshort-haul with rail service in other regions. One such study in the United Kingdom estimated thatNOX could be reduced by as much as 6,300 tons in 2015 if all domestic passenger traffic withinmainland United Kingdom and half of international connections were transferred to rail. Thisanalysis also examined replacement of air service with rail service for international services betweenLondon and other European airports. Under these scenarios, NOX emissions were reduced by 2,500to 7,000 tons by 2015, depending on the degree of replacement.104
Generally, air-to-rail programs seek to enable the transfer between these modes by providingeasy access from rail stations to the airport, streamlining check-in by allowing easy transfer of bagsfrom the airplane to the train, and by simplifying ticketing. The aim has been to make rail servicemore attractive and more competitive with air travel. The recent “ World Business Council forSustainable Development” report concluded that transportation emissions that contribute to globalwarming are growing in both developed and developing countries, and that recommended thesupport of the development and use of high-speed passenger rail to reduce air trips of 310 miles orless to reduce these emissions.
F. Conclusions
A wide range of options is available to reduce airport-related emissions. Technical optionssuch as improving aircraft and engine design, introducing alternative fuels into the GSE and GAVfleets, and reducing overall air trips through improved high speed rail service are all viable options.Operational measures can also be extremely cost effective. Some of the most cost effective optionsoutlined in the chapter are the introduction of gate and GSE electrification, as well as certaintransportation control measures. In some cases, these improvements will take place by themselvesas airlines move to increase efficiency, as can be seen with gate electrification. In other instances,
101 Tagliabue, John, “ Airlines Feel Pressure of Europe’ s Fast Trains,” New York Times. August 12, 2001. Included asAppendix C.102 Air France, 2000.103 Ibid.104 FOE, 2000. Values were converted from metric tons to short tons.

III-29
regulatory mechanisms will be needed to encourage introduction of emission reduction measures.The policy and regulatory options available to states will be explored in the next two chapters of thisreport.

III-30
IV-1
IV. Policy Strategies for Reducing Airport Emissions
A. Overview
Chapter III describes technological and operational measures for reducing emissions fromaircraft, ground service equipment, and ground access vehicles at airports. This chapter discussespolicy strategies that could be used to compel or encourage the implementation of the technologicaland operational options to reduce emissions that were discussed in the previous chapter. This chapteris divided into two sub-sections. The first subsection discusses the general regulatory approachesthat states and potentially localities could utilize, and the second subsection consists of case studiesof programs that have been proposed or implemented at airports. Due to statutory or legalconstraints -- or in some cases for political reasons-- some of the approaches described in the firstportion of the chapter may not be available to environmental regulators, especially at the state andlocal levels. Notwithstanding, there are a variety of strategies that could be pursued. The innovativeapproaches described in the second portion of the chapter highlight how a number of the approachesmentioned in the first portion of the chapter have been applied in practice, some using a combinationof policies. In most cases, these efforts encompass a range of emissions reducing measures.
B. Policy Options
This sub-section covers a number of the more promising regulatory opportunities for stateand local policymakers to reduce airport-related emissions. Specifically, this portion of the chapterdiscusses: (1) standards and activity restrictions; (2) more innovative regulatory approaches likeemissions-based fees, cap-and-trade, and “ bubble” programs; (3) initiatives targeted at GSE andcommercial GAV fleets; and (4) efforts to increase high-speed rail and reduce passenger GAV tripsto the airport. For each policy, a general overview of the approach is discussed, along with severalof the key design considerations and advantages of the option. While some of the potential legalbarriers are highlighted, Chapter V provides greater detail on applicable legal considerations andpreemption issues.
B.1 Emissions Standards
Emissions standards represent a viable mechanism for promoting the introduction of cleaneraircraft and equipment at airports. This command-and-control approach played an important role inpast regulatory efforts to improve air quality in the U.S. and has dramatically reduced emissionsfrom pollution sources as diverse as automobiles, waste incinerators and architectural coatings.
As a regulatory option, emissions standards have a number of important advantages. Chiefamong these is that they can provide certain, lasting, and substantial air quality benefits within adefined timeframe. Applied across a broad source category such as automobiles or aircraft, the costof achieving standards on a per unit basis tends to be low and widely distributed amongmanufacturers and consumers. Moreover, standards can have an important technology forcing effecton driving future innovations in emissions control. Implementing this regulatory approach poses itsown political, technical, and procedural challenges. Typically, a legislative mandate is followed by a
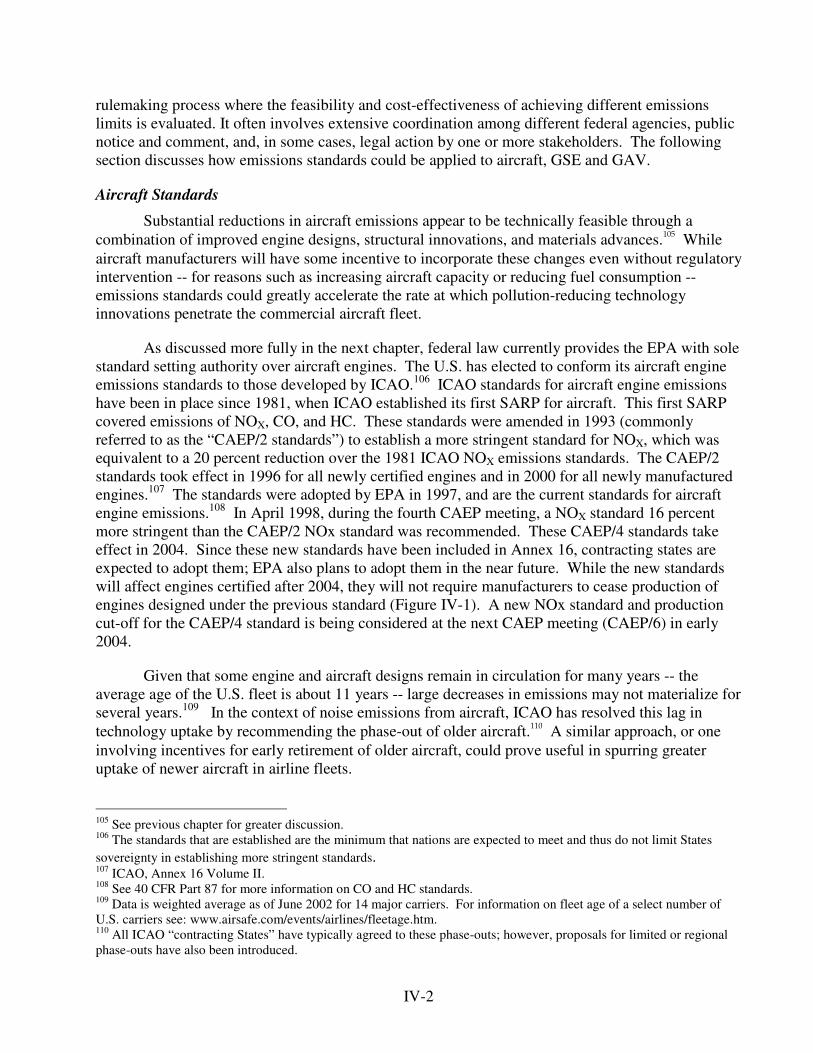
IV-2
rulemaking process where the feasibility and cost-effectiveness of achieving different emissionslimits is evaluated. It often involves extensive coordination among different federal agencies, publicnotice and comment, and, in some cases, legal action by one or more stakeholders. The followingsection discusses how emissions standards could be applied to aircraft, GSE and GAV.
Aircraft Standards
Substantial reductions in aircraft emissions appear to be technically feasible through acombination of improved engine designs, structural innovations, and materials advances.105 Whileaircraft manufacturers will have some incentive to incorporate these changes even without regulatoryintervention -- for reasons such as increasing aircraft capacity or reducing fuel consumption --emissions standards could greatly accelerate the rate at which pollution-reducing technologyinnovations penetrate the commercial aircraft fleet.
As discussed more fully in the next chapter, federal law currently provides the EPA with solestandard setting authority over aircraft engines. The U.S. has elected to conform its aircraft engineemissions standards to those developed by ICAO.106 ICAO standards for aircraft engine emissionshave been in place since 1981, when ICAO established its first SARP for aircraft. This first SARPcovered emissions of NOX, CO, and HC. These standards were amended in 1993 (commonlyreferred to as the “ CAEP/2 standards” ) to establish a more stringent standard for NOX, which wasequivalent to a 20 percent reduction over the 1981 ICAO NOX emissions standards. The CAEP/2standards took effect in 1996 for all newly certified engines and in 2000 for all newly manufacturedengines.107 The standards were adopted by EPA in 1997, and are the current standards for aircraftengine emissions.108 In April 1998, during the fourth CAEP meeting, a NOX standard 16 percentmore stringent than the CAEP/2 NOx standard was recommended. These CAEP/4 standards takeeffect in 2004. Since these new standards have been included in Annex 16, contracting states areexpected to adopt them; EPA also plans to adopt them in the near future. While the new standardswill affect engines certified after 2004, they will not require manufacturers to cease production ofengines designed under the previous standard (Figure IV-1). A new NOx standard and productioncut-off for the CAEP/4 standard is being considered at the next CAEP meeting (CAEP/6) in early2004.
Given that some engine and aircraft designs remain in circulation for many years -- theaverage age of the U.S. fleet is about 11 years -- large decreases in emissions may not materialize forseveral years.109 In the context of noise emissions from aircraft, ICAO has resolved this lag intechnology uptake by recommending the phase-out of older aircraft.110 A similar approach, or oneinvolving incentives for early retirement of older aircraft, could prove useful in spurring greateruptake of newer aircraft in airline fleets.
105 See previous chapter for greater discussion.106 The standards that are established are the minimum that nations are expected to meet and thus do not limit Statessovereignty in establishing more stringent standards.107 ICAO, Annex 16 Volume II.108 See 40 CFR Part 87 for more information on CO and HC standards.109 Data is weighted average as of June 2002 for 14 major carriers. For information on fleet age of a select number ofU.S. carriers see: www.airsafe.com/events/airlines/fleetage.htm.110 All ICAO “ contracting States” have typically agreed to these phase-outs; however, proposals for limited or regionalphase-outs have also been introduced.
IV-3
ICAO standards are on a rate-basis, and therefore do not control aggregate emissions at anairport or in an airshed.111 The environmental impact of the program is therefore uncertain, sinceincreased activity will lead to higher aggregate emissions even when the standards are met.Historically, the standards for aircraft engines have not been “ technology-forcing” ; many of theengines in service at the time the standards are established already comply with them.112 Greaterconsideration of aggregate emissions and technology-forcing standards could help reduce emissionsfrom aircraft. In addition, emissions standards have been based on the emissions performance of theaircraft engine. This feature does not account for the emissions impact of airframe designs. Forexample, an airframe with reduced drag will reduce fuel burn and thereby reduce all emissions. Astandard based on the emissions performance of the whole aircraft, not just the engine, could furtherimprove the effect of these standards.
Figure IV-1: Timeline for Engine Production Allowed Under ICAO NOX Standards
Engines of a type or model for which the date of manufacture of the first individualproduction model was on or before 31 December 1995 and for which the date ofmanufacture of the individual engine was on or before 31 December 1999
Engines of a type or model for which the date of manufacture of the first individualproduction model was after 31 December 1995 or for which the date of manufactureof the individual engine was after 31 December 1999
Engines of a type of model for which the date of manufacture of the first individualproduction model was after 31 December 2003
NOTE: ICAO adopted NOx standards for aircraft engines in 1981 and 1993. These standards applied to engines being designedand produced, and did not affect the emissions standards for engines in use at the time the standards were adopted. The currentstandard, adopted by EPA in 1997 and shown above in red, applies to engines models whose first manufacture was in 1996 or later,or to individual engines produced in 2000 or later. The new standard, passed by ICAO in 1999 but not yet adopted by EPA andshown above in maroon, applies only to engine models produced in 2004 and later. When this standard was adopted, the previousstandard was not constrained, allowing engines produced under the current standard to continue in production after the newstandard takes effect.
Given the international aspects of aircraft manufacture, sale and use, it would likely bepolitically problematic for the EPA to reassert its standard-setting authority over domestically soldaircraft. However, the U.S. could establish more stringent standards than those developed throughICAO, thereby influencing other countries and ICAO to follow suit. If standards were notinternationally harmonized, this approach would likely raise concerns that U.S. carriers would be
111 Aircraft emissions standards have been based on a per LTO-cycle basis in g/kN.112 See Figure I-4 in Chapter I.
Engine Models Production
Individual Engine
Production
1994 1996 1998 2000 2002 2004 20061993 1995 1997 1999 2001 2003 2005
Year
IV-4
placed at a competitive disadvantage, since U.S. airlines would be required to purchase potentiallymore expensive engine and airframe designs while non-U.S. carriers would not be required to makesuch investments. However, since a large share of aircraft are sold to U.S. carriers, engine andairframe manufacturers might be forced to design engines and airframes that meet U.S. standards.113
Either this option, or an option involving wider international efforts to increase the stringency andimprove the design of current ICAO standards, remains important in the array of regulatory toolsavailable to governments for reducing airport emissions.
Meanwhile, state and local authorities accountable for meeting health-based ambient airquality standards are effectively pre-empted from establishing aircraft emissions standards.However, states may petition EPA to set stricter standards for aircraft engine emissions. Thepetition must be based upon “ new information” . States may also consider petitioning the U.S.Department of Transportation (DOT), since the establishment of aircraft standards by EPA is inconsultation with DOT. 114 Additional opportunities exist for states to advance the development ofmore stringent standards. For example, states could seek opportunities to engage the FAA and EPAas they develop the U.S. position on new standards for CAEP/6 and future CAEP meetings.115
GSE and GAV Standards
The EPA sets emissions standards for on-road and nonroad engines. As mentioned earlier inthis report, emission standards for diesel powered GSE were first promulgated in 1996, and havebeen proposed for gasoline powered GSE machines beginning in 2004 and 2007.116 While thegasoline engine GSE standards will require manufacturers to use four-stroke, closed-loop enginetechnology with three-way catalysts, similar to the technology used for gasoline highway vehicles,the engines will not be optimized to run as cleanly as their heavy-duty gasoline highwaycounterparts. Further design improvements to the engines could be made, given that the engines aresimilar to those used in highway applications. Consequently, more stringent federal standards arefeasible for this category of engines, and states should consider bringing this to EPA’ s attention.
In contrast, standards for diesel powered GSE do not require the use of advanced emissioncontrols such as catalysts. Technology developments in recent years have led to the adoption ofstringent PM and NOx standards for diesel highway engines. The same technologies designed tomeet these standards could be used to reduce diesel GSE emissions. More stringent standards fordiesel powered nonroad engines such as those used in GSE are economically and technicallyfeasible, and should be introduced by the federal government.
For highway vehicles, three Northeast states have adopted the California Low EmissionVehicle Program (LEV) and several other states are participating in the federal Tier 2 program.Taxicab and van service emissions will be dictated by either of these two programs (depending upon
113 In 2000, U.S. customers bought approximately 57 percent of the civil jet aircraft shipped by U.S. manufacturers. SeeAerospace Industries Association, Aerospace Statistics: 2001, series 21, available at: <www.aia-aerospace.org/stats/aero_stats/stat21.pdf>.114 See Chapter V for greater discussion of the legal aspects of such an approach.115 Such involvement may include regular one-on-one communications with these agencies, participating in existingforum on the development of the U.S. position for CAEP, and some level of participation in CAEP working groups.116 US EPA, in Proposal for Cleaner Recreational Vehicles, Sept. 14, 2001, included a proposed new standard for largespark-ignition engines, which would include all gasoline powered GSE engines. For more information see<http://www.epa.gov/otaq/largesi.htm>.
IV-5
the state in which the airport is located). For new highway heavy-duty engines, new federalstandards for diesel and gasoline will greatly reduce new engine emissions over the long term.However, in the short term, the federal government could require that older engines be retrofittedwith emission control technologies in order to reduce emissions from existing, highly durable dieselengines found in buses and trucks, similar to the Urban Bus Program described below.
B.2 Activity Limits
Activity limits represent a blunt but potentially effective regulatory mechanism for limitingairport emissions. To implement this approach, state governments, localities, or airport authoritiescould limit total airport activity by, for example, limiting the total number of take-off and landingslots available each day. Several airports, including Chicago’ s O’ Hare, Washington’ s National, andNew York’ s Kennedy and LaGuardia airports have placed limits on landing slots to reducecongestion. Typically, slot limits are determined by the airport’ s capacity and are set separately fordifferent categories of air operators (air carrier, commuter and general aviation).
For political and economic reasons it may be difficult to establish activity limits except incases where airport capacity is already strained and safety is becoming an issue. Similar constraintswould likely apply to any efforts to limit GAV activity. The FAA is the only body that can setairport LTO limits and is authorized to do so only on the basis of safety concerns. The emissionsbenefits of restricting activity at one airport might be partially offset by a resulting shift of aircraftactivity to other airports in the region. Unless activity limits are designed to recognize the differentemissions intensities of the various aircraft, they will fail to promote a preference for lower emittingaircraft.
B.3 Cap-and-Trade or “Bubble” Programs
In recent decades, market-based regulatory programs have increasingly been used to replaceor complement “ command-and-control” type approaches, such as emissions standards. The federalAcid Rain program, for example, imposes a cap on national emissions of sulfur dioxide from electricutilities, and leaves it to the companies to decide how to meet that overall cap. More recentregulatory efforts aimed at reducing NOx emissions from power plants for purposes of ozonemitigation have adopted similar programs at the state and regional levels. Under a cap-and-tradeprogram, a cap (i.e., a limit) is placed on the total allowable emissions from the applicable source(s)and each individual entity can buy or sell emissions allowances in order to maintain emissions belowthe cap. Put simply, those sources that can reduce their emissions more cheaply will tend to “ over-control” and sell the “ excess” allowances, while those sources that cannot implement reductionscost-effectively will likely buy allowances instead. The advantage of a cap-and-trade type approachis that there is an assurance of the environmental benefit since, by definition, the total quantity ofemissions from the covered sources is limited by the level of the overall “ cap” . In addition, the costof compliance is reduced, since each marginal increment of pollution reduction required to meet theoverall cap or budget occurs where it can be most cost-effectively implemented. The total cost ofcompliance, however, is unknown, since it depends on the market price of emissions reductions.
IV-6
The same concept can be applied to airports, and has been proposed for Boston’ s LoganInternational Airport.117 Conceptually, a “ bubble” is placed around either the airport as a whole orfor a distinct category of sources or operations within the airport (e.g. aircraft, APUs, GSE, GAVand stationary sources). Emissions within the bubble are then limited by a defined cap or budget.Caps may be fixed or decline over time.118 The cap can be established in absolute terms (e.g., tonsper year) or on a rate-basis (e.g., tons per LTO or passenger). Absolute caps provide certainty of theenvironmental outcome, since the level of emissions cannot exceed the emissions cap. However,under a rate-based cap, emissions would naturally grow with increased activity or units in operation.Emissions levels would therefore be uncertain; however, estimations of activity levels can providesome expectations of emissions.119 Emissions from any individual source within the bubble mayvary as long as the overall cap or budget is not exceeded. Usually, owners of sources are responsiblefor finding the most effective means to maintain emissions below the limit.
The first steps in establishing a cap-and-trade program include: defining the sources includedin the cap, identifying the entities responsible for complying with the cap, estimating current andprojected emissions from included sources, defining an appropriate cap level, and deciding whetherthe cap should be dynamic or fixed. In deciding whether a particular source or source categoryshould be included in the cap, regulators should consider whether the source makes a significantcontribution to overall emissions, and – crucially – whether emissions from the source can bereliably measured and verified.120 In terms of which entities should be responsible for complyingwith an airport cap-and-trade program, the two leading options are likely to be the generators ofemissions (i.e., air carriers and fixed-based operators) and those who administer and operate airports(i.e., airport authorities and localities). In the first option, air carriers and fixed-based operatorswould be responsible for the emissions associated with operating their equipment and forimplementing needed control measures and/or purchasing additional allowances to cover any excessemissions.121 While some other entity would need to oversee the program (i.e., track allowances andverify compliance, etc.), the advantage of this approach is that compliance responsibility rests withthe same entities that have direct control over the emissions sources covered. The second option isfor the airport authority to assume responsibility for complying with the cap, including developingemissions reduction programs and, if necessary, purchasing emissions allowances or offsets fromother sources to cover excess emissions over the cap limit.
Measurement, verification and enforcement are critical elements of a successful cap-and-trade program and present perhaps the most difficult challenge in applying this regulatory approachto airports. The most successful cap-and-trade programs to date have been applied to power plants, arelatively homogenous source category for which emissions can be directly and continuously
117 See case studies later in this chapter.118 In theory caps could also be allowed to grow over time to accommodate increased demand. For example, a fixedgrowth rate could be applied to a given cap in anticipation of future growth. Such an approach could be used in the earlyyears of a program to ease transition to a “ hard” cap.119 Rate-base approaches have generally not been used in past cap-and-trade programs, since the aim is usually to provideabsolute environmental benefits relative to the status quo. This can only be achieved if aggregate emissions are fixed ordecline, regardless of demand growth. However, rate-based approaches for aviation may avoid some perception issuesby encouraging efficiency rather than absolute improvements.120 See Chapter II for tools for measuring airport emissions and the contribution of the various sources.121 Obligations would need to be further defined to take account of flights flown under alliances and other partnerships,as well as shared usage of equipment.
IV-7
measured by smokestack monitors. By contrast, airports include a wide variety of potentialemissions sources. For many of these sources it would be impractical to measure actual emissions.Instead, emissions would have to be estimated using the types of modeling and emissions factortools used to develop national and state emissions inventories.122 To allow for consistent andreasonably accurate emissions estimates, inventories of fuel use, flight operations, and LTOs, as wellas APU and GSE usage and GAV activity, would need to be uniformly measured and accuratelyrecorded. In addition to necessary record-keeping requirements, successful enforcement mechanismsand stringent penalties for non-compliance are important elements of a successful cap-and-tradeprogram.
Other important design issues include the allocation method used to distribute emissionsallowances to sources at the outset of the program, provisions for trading and, if desired, additionalflexibility mechanisms such as banking123 and “ open market” 124 trading. Briefly, choices of allocationmethods include: (1) grandfathering (in which allowances are distributed according to historicemissions levels);125 (2) auctioning (in which sources bid at auction for an initial allotment ofallowances); and (3) output or performance-based allocations (in which all sources are assignedallowances based on a common emissions factor multiplied by their current or recent activitylevel).126 Similarly, there are a number of options for defining the scope of trading. For example,assuming that air carriers have primary responsibility for implementing a cap on aircraft NOxemissions, allowance trading could be allowed: (1) within air carriers; (2) between a group of aircarriers (up to and including all carriers); (3) between air carriers and other emissions sourcescovered by an emissions cap; and (4) between air carriers and other emissions sources not coveredby an emissions cap (i.e., so-called “ open-market” trading127). Finally, the consequences of non-compliance would need to be defined, particularly if the entity responsible for compliance is anairport authority or locality. If airport emissions exceed the cap, such an authority could be requiredto purchase allowances or offsets from sources outside the airport to compensate. The costsassociated with this requirement could, in turn, be passed on to air carriers and other sourceoperators or owners according to their contribution to the overall emissions inventory. This approacheffectively creates a monetary incentive for all covered sources to do their part toward ensuringcompliance.
122 Further discussion of available modeling tools such as EDMS may be found in Chapter II, which covers inventorydevelopment.123 Banking is when a source is allowed to “ bank” or retain excess allowances from one compliance period and use thoseallowances in a later period.124 In open-market trading, uncapped sources generate project-based emissions reductions that are real, verifiable, andsurplus.125 New entrants who do not have historic emissions on which to base their allocations are typically accommodated undera grandfathering system by a “ set-aside” pool of allowances under the cap.126 For example, if annual NOx emissions from aircraft landings and take-offs (LTOs) is to be limited to 1000 tons peryear and there are 10,000 LTOs at an airport each year, emissions from each LTO would need to be limited to 0.1 tons,on average. An air carrier with 1000 LTOs per year would receive an allocation of 100 tons per year (1000 LTOs x 0.1tons/LTO) under a performance-based system. To maintain a fixed or declining cap, allocation factors would need to beadjusted over time as activity levels increase.127 Open-Market Trading (OMT) maximizes the compliance flexibility afforded to individual sources. However itpresents the challenge of ensuring that eligible offsets are real, quantifiable, surplus (to reductions that would happenunder other regulatory requirements), enforceable and permanent. Some states, such as Massachusetts and New Jerseyhave existing OMT programs. For overview of trading options see <http://www.evomarkets.com/mk_em.html>.
IV-8
A cap-and-trade program could also be extended to a number of airports in an area. Inessence, this would mean introducing airport bubbles in a city, airshed, and/or region, and allowingtrading among the emissions sources within those bubbles. This approach provides the addedincentive of increasing the size of the market and providing greater opportunities to find cost-effective reductions.
B.4 Fee-Based Programs
Like cap-and-trade programs, fee-based programs make use of market forces to promotecost-effective emissions reductions across a source category or facility. However, unlike a cap-and-trade program, the final level of emissions that will be achieved under a fee-based program is notknown in advance. Rather, final emissions depend on the magnitude of the price signal relative to thecost of implementing reductions.128 As long as businesses can reduce emissions for less than the costof the fees they incur by not reducing emissions, they will implement control measures. As soon asthe cost of control exceeds the fee, on the other hand, affected businesses will stop makingreductions.
Given some of the technical difficulties and potential legal issues involved in implementingeither “ command-and-control” type emissions standards or cap-and-trade programs at airports,emissions-based fees may provide an attractive regulatory alternative for addressing airportemissions. Aircraft are already required to pay landing fees at most airports to cover the costsincurred by providing airport services. Currently, most landing fees are tied to aircraft weight:heavier planes pay larger fees than lighter craft. If landing fees were tied to the relative emissionsperformance of different aircraft, they would create an economic incentive for utilizing cleaneraircraft. Ultimately, this incentive should affect the behavior of airlines and engine manufacturersby: (1) encouraging carriers to utilize lower emitting aircraft for flights to airports with emissions-based landing fees; and (2) providing an incentive to develop and incorporate cleaner engines intofuture aircraft designs. Incorporating emissions considerations need not change the overall feesassessed to air carriers; a fee-based program could be designed to be revenue-neutral relative to thestatus quo.129 Alternatively, fees could be set to collect extra revenues to fund emission reductionprograms.130
An emissions-based charging system can take several forms. Key design issues to beresolved in structuring such a system include the level of the charge, determining activities andentities to be charged, and the use of resulting revenues. In setting the level of a charge or fee, onebroad objective would be to ensure that the price signal is strong enough to produce anenvironmentally positive response. Within that broad objective, regulators have a number ofoptions: they could simply restructure current fee levels to provide a marginal incentive foremissions reductions; attempt to estimate the specific fee level that would be required to achieve a
128 Note that in a cap-and-trade program, final emissions are known, but final cost (in terms of the maximum amountspent per ton of reductions to achieve the cap) is not. In that sense, the choice between a cap-based program rather than afee-based program translates to a choice between environmental versus cost certainty.129 Under revenue-neutral fees, other fees in aggregate are reduced. Fees paid by individual entities can however changedepending on the structure of the charging system.130 At present, landing fees are generally not to be used to generate excess revenues above the cost of providing airportservices. However, maintaining acceptable air quality standards may be construed as part of the airport’ s obligation inproviding those services.
IV-9
defined emissions target; or set fees to “ internalize” the environmental costs of airport emissions.131
Note that if fees are intended to achieve a particular emissions target it will be necessary to conductan analysis of the sensitivity of air carriers, aircraft manufacturers and perhaps even airlinecustomers to different price signals and adjust the level of the charge regularly to account forchanges in price sensitivity. It is often difficult in practice to estimate the exact change in priceneeded to generate a given response since this requires accurate assessments of the responsiveness ofindividuals to these changes.
Another important up-front decision in designing a fee-based system concerns whichemissions sources or activities will be covered and which entities will be charged. For example, afee-based program could be designed to cover only aircraft LTOs or aircraft LTOs plus emissionsfrom ground service equipment.132 Fees could be based on actual emissions133, aircraft and/orequipment movements (e.g. LTO cycles)134, or fuel use.135 If the chief purpose of designing a feesystem is to reduce emissions, it will make the most sense to tie fees directly to emissions rather thanto a proxy. For example, fees based on LTOs or equipment movements may reduce emissions bycreating incentives to reduce activity, but won’ t directly promote preferential use of cleanertechnologies. In terms of which entities are charged, obvious candidates are air carriers and (in caseswhere GSE is included) fixed based operators.136 Ultimately, at least some of the cost would likely bepassed on to airline customers (i.e., passengers). However, as noted previously, under a revenue-neutral fee, aggregate costs need not increase relative to existing landing fees and other airportcharges. Since landing fees represent a small fraction (i.e., two to three percent) of operating costs,the impact of such an approach may be limited.137 Furthermore, the decrease in other airport feesmay offset existing funding for environmental projects and therefore have minimal impact on overallairport mitigation expenditures.
If a new emissions-based fee system is designed to be revenue-neutral, its proceeds are likelyto go toward covering airport costs, just as current fees do. If additional revenues are generated,these can be spent in a number of ways. Obvious choices include using excess revenues to supportadditional emissions mitigation measures at the airport or in the region, or to support research anddevelopment into new aviation technologies that can further reduce pollution. 131 Several studies have been undertaken in Europe to evaluate the external costs of aviation emissions. For example, seeINFRAS, External Costs of Transport, March 2000.132 Fees could be established separately for aircraft and GSE based upon the emissions from each piece of equipment.Alternatively, one fee could be placed on each aircraft LTO that includes an assumed or default GSE emissionsincrement. The assumed GSE emissions value could be differentiated based upon the type of aircraft being served (i.e.,narrow-body versus wide-body) and its operation (i.e., short-haul versus long-haul).133 Preferably emissions can be monitored, but in many cases they will need to be estimated from information on enginetype, activity level or fuel consumption, and other factors -- or by using default values, perhaps linked to the emissionscharacteristics of a piece of equipment as certified upon manufacture or sale. The latter approach has been used inSwitzerland and Sweden, as described later in this chapter.134 While it is easy to track aircraft LTOs, accurately tracking movements by ground service equipment may present asignificantly more difficult challenge.135 Tying fees to fuel use makes the most sense where reduction of CO2 emissions is a priority objective. Emissions ofNOx, VOC, and other pollutants of concern in a local air quality context, however, are not directly related to fuel use butrather depend heavily on engine design, operating conditions, etc.136 In theory, the airport authority could directly charge passengers or owners of cargo, but this is likely to be morecomplex than simply charging the air carriers who have direct control over equipment choices and allowing them to passon the costs.137 See Massachusetts Port Authority, Air Quality Initiative for Boston Logan International Airport, March 2001.
IV-10
To date, emissions-based fee systems have been implemented only outside the U.S., inSwitzerland and Sweden. The program introduced at Logan Airport has a fee-based portion inaddition to the airport “ bubble” .138 The viability of landing fees in a regional or national contextmust be carefully assessed (e.g., a regional program may encourage cleaner planes in that area, but agreater proportion of dirty planes would then converge on other regions). It should be noted thatsome fee-based systems could potentially face legal challenge as well; this is discussed more fully inthe next chapter.
B.5 Innovative Regulatory Strategies for Reducing GSE and GAV Fleet Emissions
In addition to the regulatory approaches discussed previously in this chapter for limitingemissions from airports as a whole, or from aircraft as a particular source category, regulatoryoptions may be available for limiting GSE and GAV fleet emissions. This section discusses howairport operators might craft control programs for either GSE or GAV fleets by: (1) promoting orrequiring the purchase of cleaner alternatives when fleet vehicles or equipment are replaced oradded; (2) developing a declining fleet emissions target; and (3) adopting a combined approach thatutilizes both of these strategies. The federal Urban Bus Program139 provides a useful model; thoughit targets only particulate emissions, it could readily be adapted for other pollutants. 140
An approach modeled after the Urban Bus Program would incorporate a performance-basedrequirement and a fleet-averaging mechanism. Affected vehicles would be required to meet aspecific emissions standard at the time the engine is rebuilt or replaced. The requirement would beautomatically waived if no engines certified to meet the standard are available for less than aspecified cost.141 The program would contain “ fallback” requirements specifying that “ waived”engine families must be retrofitted to achieve a minimum percent reduction in emissions, relative tolevels emitted with the original engine configuration. For airport-related vehicles, similarperformance standards could be established for airport buses, shuttles and taxis, as well as forground service equipment. Maximum stringency in the case of GAV might be CNG or electrictechnology; for GSE, electric machines would likely represent the cleanest commercially availabletechnology.
Rather than being subjected to performance standards on an engine-by-engine basis, fleetoperators would have the option of meeting a declining annual average emissions target across theirentire fleets. The target level for each fleet (TLF) would be calculated for each year of the program.For any given year, the average emissions rate from all of the operator’ s vehicles with a model yearthat is earlier than the beginning date of the program (e.g., 1994) must be at or below the TLFestablished for that calendar year. The requirement would apply until all pre-1994 vehicles havebeen retired from the operator’ s fleet. Under the Urban Bus Program, TLFs are based on EPA’ sdetermination of the projected emission level for each engine model year in the operator’ s pre-1994model year urban bus fleet.
138 These programs are discussed in the case studies presented at the end of this chapter.139 The Urban Bus Program was established in 1993 and requires that urban buses located in metropolitan statistical areaswith populations equal to or greater than 750,000 (as of 1992) be retrofitted with emission control devices.140 The standard is 0.1 grams per brake-horsepower per hour (g/bhp-hr). The first engine meeting this standard wascertified in 1998; subsequently a growing number of engine families have been able to meet the standard.141 In the Urban Bus Program, this cost is $7,940.
IV-11
B.6 High-Speed Rail Service
As discussed in Chapter III, increased use of rail is a potentially viable option for reducingthe number of short-haul flights between certain city pairs. Greater development of high-speed railcould expand the number of areas where rail can compete with short-haul flights. Replacing flightswith rail service could reduce air emissions.142 One study found that the ground-level NOX
emissions intensity, per passenger kilometer, of current short-haul air travel in the United Kingdomwas greater than high-speed rail service on the majority of routes studied.143 When evaluating theuse of only electric high-speed rail, the study found that ground-level NOX emissions were lowerthan air services on all routes.144 The situation in the U.S. is obviously different; however, acomparable evaluation in the U.S. would highlight routes where high-speed rail could reduceemissions between certain city pairs.
Several factors affect the competitiveness of high-speed rail with air travel. Assessing thesefactors helps determine the viability of high-speed rail in a given location. The first issue is thedistance between destinations, since travelers consider time an important factor in their choice oftravel modes. In assessing viable routes, planners typically focus on regions with major cities within370 miles of each other. Over these distances, high-speed rail can be time competitive when the timeassociated with transportation to/from the airport, check-in, taxiing, take off/landing, holdingpatterns, and other trip-related events are taken into account, especially when the final destination isa central city.145 Another important factor in determining viable routes is the density of travel, i.e.,those short-haul routes where there are a large number of passenger trips per day. Routes with high-density and short distances are prime candidates for high-speed rail. According to Amtrak, fifteenU.S. airports with a total of 45,000 short trips per month are potential candidates for new fast railservice.146 Other important considerations for assessing the viability of high-speed rail are the costsand benefits of rail service compared to alternative travel options. This means weighing such factorsas the costs of constructing a new runway or airport, the costs of expanding or adding high-speed railservice, and the potential to improve airport services and optimal resource use by reducing airportdelays due to congestion. In regions where high-speed rail is already operating, costs may beassociated with expanding and improving current rail service to accommodate more passengers (e.g.,increasing the number of cars or the frequency of service) and with improving rail-air linkages sothat passengers can use rail for the short-haul portion of their trip.147 Where high-speed rail does notcurrently operate, costs will obviously be higher due to the need for large infrastructure investmentsin upgrading or laying new track, constructing power lines, and purchasing engines and cars. Onestudy estimated that the cost of building new infrastructure ranged between two and 50 milliondollars per route-mile, depending on the type of infrastructure.148 The low-end estimate -- upgrading 142 See Chapter III for discussion of factors affecting the environmental performance of such a program.143 The study also found that high-speed rail had lower CO2 emissions, CO, and VOCs. Emissions of PM10 were foundto be broadly the same between these modes; however, variation occurred according to route. See Watkis et. al, AComparative Study of the Environmental Effects of Rail and Short-haul Air Travel, September 2001.144 The majority of trains on these routes use electric traction; however, there are some diesel trains on the studied routes.The sensitivity analysis analyzed the routes with only electric trains.145 See European Federation for Transport and Environment, Aviation and its impact on the Environment, December1999.146 Personal communication with Richard Remington (Amtrak), October 1, 2001.147 The program at Newark Airport, discussed later, is an example of an effort to better link the airport to the rail servicein a given area. Also, see Chapter III for discussion of air-to-rail services in Europe.148 U.S. Federal Railroad Administration, High-Speed Ground Transportation for America, September 1997.
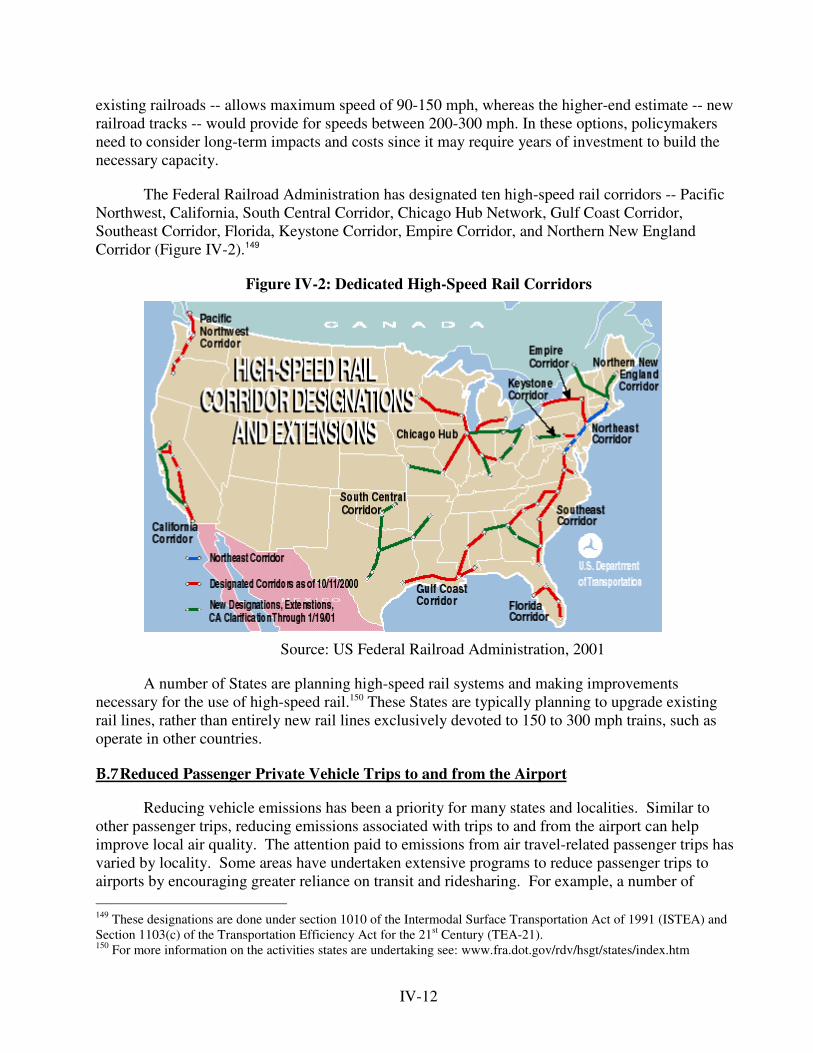
IV-12
existing railroads -- allows maximum speed of 90-150 mph, whereas the higher-end estimate -- newrailroad tracks -- would provide for speeds between 200-300 mph. In these options, policymakersneed to consider long-term impacts and costs since it may require years of investment to build thenecessary capacity.
The Federal Railroad Administration has designated ten high-speed rail corridors -- PacificNorthwest, California, South Central Corridor, Chicago Hub Network, Gulf Coast Corridor,Southeast Corridor, Florida, Keystone Corridor, Empire Corridor, and Northern New EnglandCorridor (Figure IV-2).149
Figure IV-2: Dedicated High-Speed Rail Corridors
Source: US Federal Railroad Administration, 2001
A number of States are planning high-speed rail systems and making improvementsnecessary for the use of high-speed rail.150 These States are typically planning to upgrade existingrail lines, rather than entirely new rail lines exclusively devoted to 150 to 300 mph trains, such asoperate in other countries.
B.7 Reduced Passenger Private Vehicle Trips to and from the Airport
Reducing vehicle emissions has been a priority for many states and localities. Similar toother passenger trips, reducing emissions associated with trips to and from the airport can helpimprove local air quality. The attention paid to emissions from air travel-related passenger trips hasvaried by locality. Some areas have undertaken extensive programs to reduce passenger trips toairports by encouraging greater reliance on transit and ridesharing. For example, a number of 149 These designations are done under section 1010 of the Intermodal Surface Transportation Act of 1991 (ISTEA) andSection 1103(c) of the Transportation Efficiency Act for the 21st Century (TEA-21).150 For more information on the activities states are undertaking see: www.fra.dot.gov/rdv/hsgt/states/index.htm
IV-13
airports have raised parking fees or limited the number of available parking slots. Success in thisregard has been mixed. Sacramento International Airport has found that, as a result of their parkinglimitations, people have avoided parking and instead utilized another person for pick-up and drop-off. This doubles the number of trips to/from the airport and increases emissions.151 However, acombination of approaches at London’ s Heathrow Airport, such as higher parking fees combinedwith bus priority, has had some success in increasing the portion of employees and travelers utilizingpublic transportation.152 The environmental result of such programs depends on many factors,including the ensuing transportation choice and emissions performance of the alternative mode.Depending on the current infrastructure, a variety of tools are available to local and state regulators.Where mass transit currently operates to the airport, improving the service may greatly increaseridership. For example, the monorail at Newark Airport was recently connected to the rail station,making it easier for passengers to access Amtrak, the PATH, and NJ Transit.153 This has madeaccess to New York City, the New Jersey suburbs, and other surrounding communities easier, sinceboth rail and public transit are better connected to the airport. Other potential improvements include:(1) placing check-in counters close to the transit station (as has been done in Atlanta); (2)designating more convenient locations for bus stops; (3) providing adequate bus shelters; (4) givingbuses priority over private vehicles and taxis within the airport (bus lanes, traffic signal priority); and(5) adding space for baggage in transit vehicles. At airports where transit service is limited,improving bus service should be the first priority, including designating priority bus lanes on themain approach routes to the airport and providing traffic signal prioritization for buses. While railaccess does not make sense for all airports, it should be considered in regions that already have a railsystem. The addition of airport rail connections is underway in Minneapolis, New York and SanFrancisco and is under consideration in the Dallas-Fort Worth area.
C. Case Studies
The remainder of this chapter describes specific initiatives being undertaken to reduce airportemissions in the U.S. and abroad. These include initiatives at Boston’ s Logan International Airportin Massachusetts and Sacramento International Airport in California, as well as initiatives in theSouth Coast of California and at several airports in the Dallas/Ft. Worth and Houston-Galveston-Brazoria areas of Texas. Overseas initiatives described here include a Swiss program that affectsairports at Zurich and Geneva, and a Swedish program being applied to nine airports in that country.For each case study, chief elements of the pollution reduction effort are described together with theplayers involved, implementation timelines, anticipated costs and expected emission reductions.Where possible, actual emissions reductions to date are estimated using available data. Whereemissions data were not available, general information was provided on the impact of theseprograms. Due to the innovative nature of the initiatives included here, many of these estimates arenecessarily imprecise.
151 See Sacramento International Airport, Parking and Traffic Studies at Sacramento International Airport, presented atthe Airport Air Quality Symposium, California, March 1, 2001.152 See BAA, Travel Choices: BAA Heathrow’s Travel Plan 2000/2001, available at<www.baa.co.uk/pdf/heathrowtravel2001.pdf>.153 For more information see <http://www.njtransit.com/an_capitalprojects_project008.shtm>.
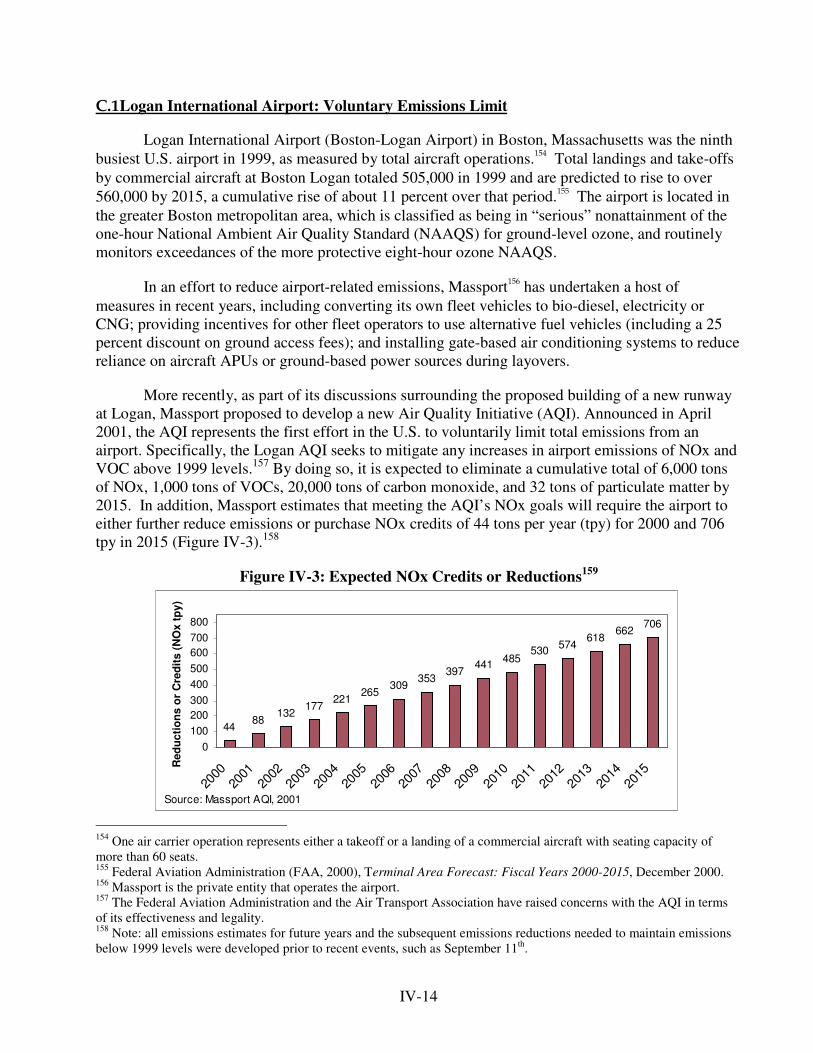
IV-14
C.1 Logan International Airport: Voluntary Emissions Limit
Logan International Airport (Boston-Logan Airport) in Boston, Massachusetts was the ninthbusiest U.S. airport in 1999, as measured by total aircraft operations.154 Total landings and take-offsby commercial aircraft at Boston Logan totaled 505,000 in 1999 and are predicted to rise to over560,000 by 2015, a cumulative rise of about 11 percent over that period.155 The airport is located inthe greater Boston metropolitan area, which is classified as being in “ serious” nonattainment of theone-hour National Ambient Air Quality Standard (NAAQS) for ground-level ozone, and routinelymonitors exceedances of the more protective eight-hour ozone NAAQS.
In an effort to reduce airport-related emissions, Massport156 has undertaken a host ofmeasures in recent years, including converting its own fleet vehicles to bio-diesel, electricity orCNG; providing incentives for other fleet operators to use alternative fuel vehicles (including a 25percent discount on ground access fees); and installing gate-based air conditioning systems to reducereliance on aircraft APUs or ground-based power sources during layovers.
More recently, as part of its discussions surrounding the proposed building of a new runwayat Logan, Massport proposed to develop a new Air Quality Initiative (AQI). Announced in April2001, the AQI represents the first effort in the U.S. to voluntarily limit total emissions from anairport. Specifically, the Logan AQI seeks to mitigate any increases in airport emissions of NOx andVOC above 1999 levels.157 By doing so, it is expected to eliminate a cumulative total of 6,000 tonsof NOx, 1,000 tons of VOCs, 20,000 tons of carbon monoxide, and 32 tons of particulate matter by2015. In addition, Massport estimates that meeting the AQI’ s NOx goals will require the airport toeither further reduce emissions or purchase NOx credits of 44 tons per year (tpy) for 2000 and 706tpy in 2015 (Figure IV-3).158
Figure IV-3: Expected NOx Credits or Reductions159
154 One air carrier operation represents either a takeoff or a landing of a commercial aircraft with seating capacity ofmore than 60 seats.155 Federal Aviation Administration (FAA, 2000), Terminal Area Forecast: Fiscal Years 2000-2015, December 2000.156 Massport is the private entity that operates the airport.157 The Federal Aviation Administration and the Air Transport Association have raised concerns with the AQI in termsof its effectiveness and legality.158 Note: all emissions estimates for future years and the subsequent emissions reductions needed to maintain emissionsbelow 1999 levels were developed prior to recent events, such as September 11th.
4488
132177
221265
309353
397441 485
530 574618
662706
0100200300400500600700800
2000
2001
2002
2003
2004
2005
2006
2007
2008
2009
2010
2011
2012
2013
2014
2015
Red
uctio
ns o
r C
redi
ts (N
Ox
tpy)
Source: Massport AQI, 2001
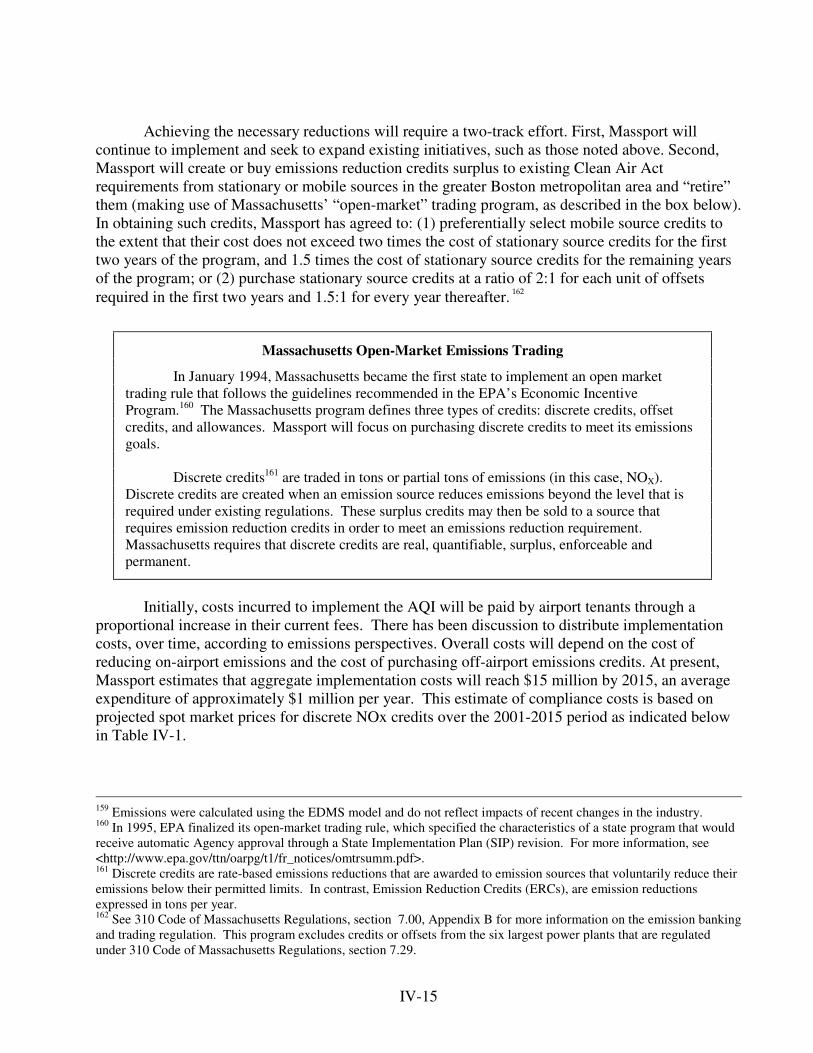
IV-15
Achieving the necessary reductions will require a two-track effort. First, Massport willcontinue to implement and seek to expand existing initiatives, such as those noted above. Second,Massport will create or buy emissions reduction credits surplus to existing Clean Air Actrequirements from stationary or mobile sources in the greater Boston metropolitan area and “ retire”them (making use of Massachusetts’ “ open-market” trading program, as described in the box below).In obtaining such credits, Massport has agreed to: (1) preferentially select mobile source credits tothe extent that their cost does not exceed two times the cost of stationary source credits for the firsttwo years of the program, and 1.5 times the cost of stationary source credits for the remaining yearsof the program; or (2) purchase stationary source credits at a ratio of 2:1 for each unit of offsetsrequired in the first two years and 1.5:1 for every year thereafter. 162
Initially, costs incurred to implement the AQI will be paid by airport tenants through aproportional increase in their current fees. There has been discussion to distribute implementationcosts, over time, according to emissions perspectives. Overall costs will depend on the cost ofreducing on-airport emissions and the cost of purchasing off-airport emissions credits. At present,Massport estimates that aggregate implementation costs will reach $15 million by 2015, an averageexpenditure of approximately $1 million per year. This estimate of compliance costs is based onprojected spot market prices for discrete NOx credits over the 2001-2015 period as indicated belowin Table IV-1.
159 Emissions were calculated using the EDMS model and do not reflect impacts of recent changes in the industry.160 In 1995, EPA finalized its open-market trading rule, which specified the characteristics of a state program that wouldreceive automatic Agency approval through a State Implementation Plan (SIP) revision. For more information, see<http://www.epa.gov/ttn/oarpg/t1/fr_notices/omtrsumm.pdf>.161 Discrete credits are rate-based emissions reductions that are awarded to emission sources that voluntarily reduce theiremissions below their permitted limits. In contrast, Emission Reduction Credits (ERCs), are emission reductionsexpressed in tons per year.162 See 310 Code of Massachusetts Regulations, section 7.00, Appendix B for more information on the emission bankingand trading regulation. This program excludes credits or offsets from the six largest power plants that are regulatedunder 310 Code of Massachusetts Regulations, section 7.29.
Massachusetts Open-Market Emissions Trading
In January 1994, Massachusetts became the first state to implement an open markettrading rule that follows the guidelines recommended in the EPA’ s Economic IncentiveProgram.160 The Massachusetts program defines three types of credits: discrete credits, offsetcredits, and allowances. Massport will focus on purchasing discrete credits to meet its emissionsgoals.
Discrete credits161 are traded in tons or partial tons of emissions (in this case, NOX).Discrete credits are created when an emission source reduces emissions beyond the level that isrequired under existing regulations. These surplus credits may then be sold to a source thatrequires emission reduction credits in order to meet an emissions reduction requirement.Massachusetts requires that discrete credits are real, quantifiable, surplus, enforceable andpermanent.
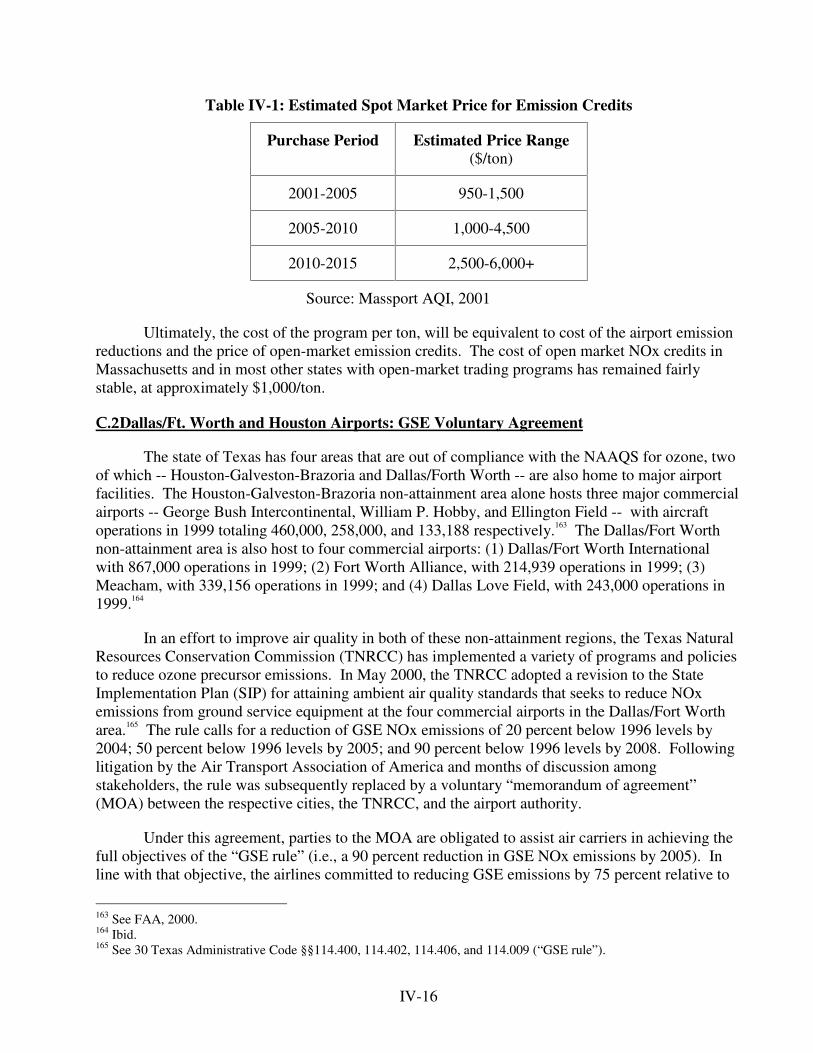
IV-16
Table IV-1: Estimated Spot Market Price for Emission Credits
Purchase Period Estimated Price Range($/ton)
2001-2005 950-1,500
2005-2010 1,000-4,500
2010-2015 2,500-6,000+
Source: Massport AQI, 2001
Ultimately, the cost of the program per ton, will be equivalent to cost of the airport emissionreductions and the price of open-market emission credits. The cost of open market NOx credits inMassachusetts and in most other states with open-market trading programs has remained fairlystable, at approximately $1,000/ton.
C.2 Dallas/Ft. Worth and Houston Airports: GSE Voluntary Agreement
The state of Texas has four areas that are out of compliance with the NAAQS for ozone, twoof which -- Houston-Galveston-Brazoria and Dallas/Forth Worth -- are also home to major airportfacilities. The Houston-Galveston-Brazoria non-attainment area alone hosts three major commercialairports -- George Bush Intercontinental, William P. Hobby, and Ellington Field -- with aircraftoperations in 1999 totaling 460,000, 258,000, and 133,188 respectively.163 The Dallas/Fort Worthnon-attainment area is also host to four commercial airports: (1) Dallas/Fort Worth Internationalwith 867,000 operations in 1999; (2) Fort Worth Alliance, with 214,939 operations in 1999; (3)Meacham, with 339,156 operations in 1999; and (4) Dallas Love Field, with 243,000 operations in1999.164
In an effort to improve air quality in both of these non-attainment regions, the Texas NaturalResources Conservation Commission (TNRCC) has implemented a variety of programs and policiesto reduce ozone precursor emissions. In May 2000, the TNRCC adopted a revision to the StateImplementation Plan (SIP) for attaining ambient air quality standards that seeks to reduce NOxemissions from ground service equipment at the four commercial airports in the Dallas/Fort Wortharea.165 The rule calls for a reduction of GSE NOx emissions of 20 percent below 1996 levels by2004; 50 percent below 1996 levels by 2005; and 90 percent below 1996 levels by 2008. Followinglitigation by the Air Transport Association of America and months of discussion amongstakeholders, the rule was subsequently replaced by a voluntary “ memorandum of agreement”(MOA) between the respective cities, the TNRCC, and the airport authority.
Under this agreement, parties to the MOA are obligated to assist air carriers in achieving thefull objectives of the “ GSE rule” (i.e., a 90 percent reduction in GSE NOx emissions by 2005). Inline with that objective, the airlines committed to reducing GSE emissions by 75 percent relative to
163 See FAA, 2000.164 Ibid.165 See 30 Texas Administrative Code §§114.400, 114.402, 114.406, and 114.009 (“ GSE rule” ).
IV-17
1996 levels. The Cities of Dallas and Fort Worth, and the Dallas-Forth Worth International AirportBoard have agreed to reduce emissions by the remaining amount -- 15 percent below 1996 levels.166
Required reductions can be achieved on-airport or in the surrounding Dallas/Forth Worth ozone non-attainment area. To implement the MOA, the TNRCC adopted “ agreed orders” with AmericanAirlines, Delta Airlines, and Southwest Airlines as revisions to the Texas SIP. 167
Under the agreed orders, American Airlines will reduce NOx emissions from their operationsat Dallas/Fort Worth International airport by 3.05 tons per day (tpd) by 2005. Delta and Southwesthave agreed to implement increasing reductions in NOx from their 1996 GSE fleet emissions.Relative to this baseline, reduction targets are 25 percent before 2004, 50 percent before 2005 and 75percent before 2008.168 Under all three orders, airlines may choose their own means of compliance,which may include converting or retrofitting their GSE fleet and/or implementing controls onequipment (such as aircraft APUs) operated elsewhere in the Dallas/Fort Worth non-attainment area.In addition, the airlines may purchase NOx emissions credits and offsets, provided they are surplusto other regulatory requirements, and are real and verifiable.169
A voluntary agreement, with similar emissions reduction targets, was reached betweenTNRCC and Continental Airlines, Southwest Airlines, and the City of Houston170 to reduce GSENOx emissions in the Houston-Galveston-Brazoria non-attainment area.171
Table IV-2 lists 1996 emissions and expected emissions in 2007 absent the program for theairports located in the Dallas-Fort Worth and Houston-Galveston-Brazoria non-attainment areasunder the above-described agreements.
Table IV-2: Estimated Uncontrolled GSE NOx Emissions (tons/day)
Airport Location 1996 Emissions 2007 Emissions
Dallas-Fort Worth Area 5.40 6.80
Houston-Galveston-Brazoria Area 3.83 5.65
Source: TNRCC, 2000a and TNRCC, 2000b
166 The City of Dallas agreed to achieve a reduction in NOx of 0.193 tons/day at Love Field; the City of Fort Worthagreed to achieve a reduction of 0.039 tons/day at Alliance and Meacham airports; and the Dallas/Fort WorthInternational Airport Board agreed to achieve a reduction of 1.305 tons/day at Dallas-Fort Worth International fromCNG conversion of buses operated by the airport.167 See TNRCC Agreed Order Docket No. 2000-1149-SIP, TNRCC Agreed Order Docket No. 2001-0221-AIR, andTNRCC Agreed Order Docket No. 2001-0222-AIR.168 In addition, Delta and Southwest have agreed to replace or retrofit all ground service equipment purchased after 1996,as needed, to achieve a 75 percent NOx reduction relative to uncontrolled emissions levels. These vehicles must beinstalled with Reasonable Available Controls Considering Costs (RACCC) and those purchased after 2004 must installBest Available Technology (BAT).169 These actions must be creditable and result in equivalent emission reductions pursuant to the TNRCC EmissionsBanking Program (30 Texas Administrative Code §101.29).170 The City of Houston agreed to achieve a NOx reduction of 1.809 tons/day within the Houston airport system --namely, at George Bush Intercontinental, William P. Hobby, and Ellington Field.171 See TNRCC Agreed Order Docket No. 2000-0826-SIP, TNRCC Agreed Order Docket No. 2000-0827-SIP, andTNRCC Memorandum of Agreement between TNRCC and the City of Houston.
IV-18
The NOx reductions that can be expected from this agreement depend on emissions growthbetween now and 2007, absent the program. Given the 1996 emissions shown in Table IV-2, GSEemissions in 2007 in Dallas-Fort Worth and Houston areas are estimated to be 0.54 and 0.38 tons ofNOx per day, respectively, after the agreement is implemented. It is important to note that emissionsfrom the GSE fleet in these areas could be larger than these estimates, since the agreements allow thepurchase of equivalent emission reductions from non-GSE sources to meet the agreement. However,the total expected emissions reductions for the area would be equivalent to this amount regardless ofwhere the emissions occur.172
C.3 California South Coast: Program to Reduce Aviation Emissions
In its 1994 SIP, the State of California requested that the Federal government undertake aninitiative to reduce aviation emissions in the South Coast portion of the state. The South Coast ofCalifornia includes five major airports: Los Angeles International, Ontario International, Burbank,John Wayne and Long Beach. In this SIP request, the Federal government was tasked withachieving aircraft reductions of 3 tpd of reactive organic gases (ROG)173 and 4 tpd of NOX.174
Subsequently, EPA initiated a consultative process in California with stakeholders to discuss effortsto reduce aircraft emissions. At EPA’ s suggestion, the airlines proposed to work voluntarily with theregulatory agencies on developing the terms of an agreement under which the air carriers wouldreduce emissions from their fleets of ground service equipment. The California Air ResourcesBoard (CARB) agreed to participate in the effort but indicated to EPA that, because the groundservice equipment was under CARB regulatory authority, CARB would not recognize any emissionreductions realized from such an agreement as meeting EPA’ s obligation to reduce aircraftemissions.
In 2002, seventeen Air Transport Association airlines175 that operated at the five South Coastairports and CARB entered into a GSE voluntary agreement to reduce emissions in the South Coast.Under the agreement, by 2010, the participating airlines agree to reduce ROG + NOx fleet averageemissions from the 1997 baseline GSE fleet to 2.65 grams per brake-horsepower hour --approximately an 80 percent reduction -- and to have 30 percent of this fleet consist of zeroemissions vehicles (ZEVs) by 2010. For the “ growth fleet,” (those GSE added to the fleet after2003, one year after the signing of the MOU), the participating airlines agreed to have ZEVsrepresent at least 45 percent of new GSE equipment by 2010.176 Each GSE in the growth fleet mustalso meet established emissions standards at the time of its introduction into the South Coast fleet.
172 For comparison, the emissions reductions from all sources estimated to be necessary to bring these areas intoattainment of the ozone NAAQS is 180 and 91 tpd in the Dallas-Forth Worth and Houston area, respectively (TNRCC,2000a and TNRCC, 2000b).173 For purposes of this discussion, the term reactive organic gases (ROG) is interchangeable with the term volatileorganic compound (VOC) used elsewhere in this report.174 California Air Resources Board, The California State Implementation Plan for Ozone: Volume II, adopted November15, 1994.175 Airline signatories to the MOA include: Alaska Airlines, American Airlines, Continental Airlines, DHL Airways,Hawaiian Airlines, Midwest Express Airlines, Southwest Airlines, United Parcel Service, Airborne Express, AmericaWest Airlines, American Trans Air, Delta Airlines, Federal Express, Jetblue Airways Corp., Northwest Airlines, UnitedAirlines, and US Airways.176 The agreement excluded cargo loaders, ground power units, air starts, and cargo tractors from this requirement. Thisequipment will be reviewed during a 2006 technology review to determine whether additional emission reductionrequirements are technically feasible and appropriate.
IV-19
The participating airlines also committed to reduce diesel particulate emissions by installingCARB-verified filters or oxidation catalysts according to phase-in schedules that vary depending onage and type of vehicle. The participating airlines are required to install diesel particulate filters forspecific GSE categories where the technology is proven to be technically feasible, does not posesafety or reliability problems, and are cost-effective. Where these criteria are not met, participatingairlines are required to install diesel oxidation catalysts. To support the development of dieselparticulate retrofit technology, participating airlines and CARB agreed to undertake a jointly fundeddemonstration project.
The requirements of this MOU are to be met in aggregate by participating airlines and do notspecify an established reduction strategy. By 2010, California estimates that this program willreduce NOx and ROG emissions by approximately a total of 2 tpd.177
C.4 Sacramento International Airport: Targeted efforts at various airport sources
Several airports, including Sacramento International Airport (SMF), are located in theSacramento area of California, which is classified as being in severe non-attainment of the ozoneNAAQS. Aircraft operations at SMF have been steadily increasing since 1991, when total aircraftoperations were 152,161. In 1999, total aircraft operations at SMF were 154,165; they are predictedto increase to almost 217,766 by 2015, an increase of approximately 40 percent.178
As discussed more fully in the next chapter, a state is responsible under federal law forensuring that new or expanding airports do not interfere with the attainment or maintenance of airquality standards in a particular region.179 As a result, airports in some states are required to receive acertificate from the state attesting to compliance with this requirement before implementing certainprojects. California conditions issuance of these certificates -- known as Air Quality Certifications(AQCs) -- on the development of a mitigation program to provide reasonable assurance thatproposed projects will “ be located, designed, constructed, and operated in compliance with airquality standards” .180
In 1982, the California Air Resources Board (CARB) issued an AQC to SMF forconstructing a second runway. The AQC is valid until the airport reaches a threshold level of 7million annual passengers, 139,000 annual air carrier operations, and 4,270 permanent publicparking spaces. The airport was required under this certificate to develop an Air Quality Programwith a goal of reducing total emissions by 30 percent by the time the threshold level is met.181 Tocomply, the Sacramento Department of Airports (DOA) must reduce emissions from GAV, GSE,and aircraft. The DOA’ s Air Quality Program specifies a variety of projects including: eliminatingaircraft “ power-backs” from the gates; streamlining the ground queuing of aircraft; reducing aircrafttaxi distances; installing bridge-mounted electric power and pre-conditioned air units; replacing off-road fuel tanker diesel engines with on-road diesel engines; requiring airport shuttle and taxi service
177 CARB. Draft 2003 South Coast State Implementation Plan, January 2003.178 See FAA, 2000.179 See Airport Improvement Act, Title 49, Section 47106 (c)(1).180 Heroy-Rogalski, Kim and Jim Humphries, Evaluation of Air Pollution Emission Reduction Measures at SacramentoInternational Airport, presented April 12-14, 1999.181 At the time the AQC was issued, the threshold level was expected to be met in the 2005-2007 timeframe. Due tohigher than expected growth rates, this level was met prior to the expected dates.
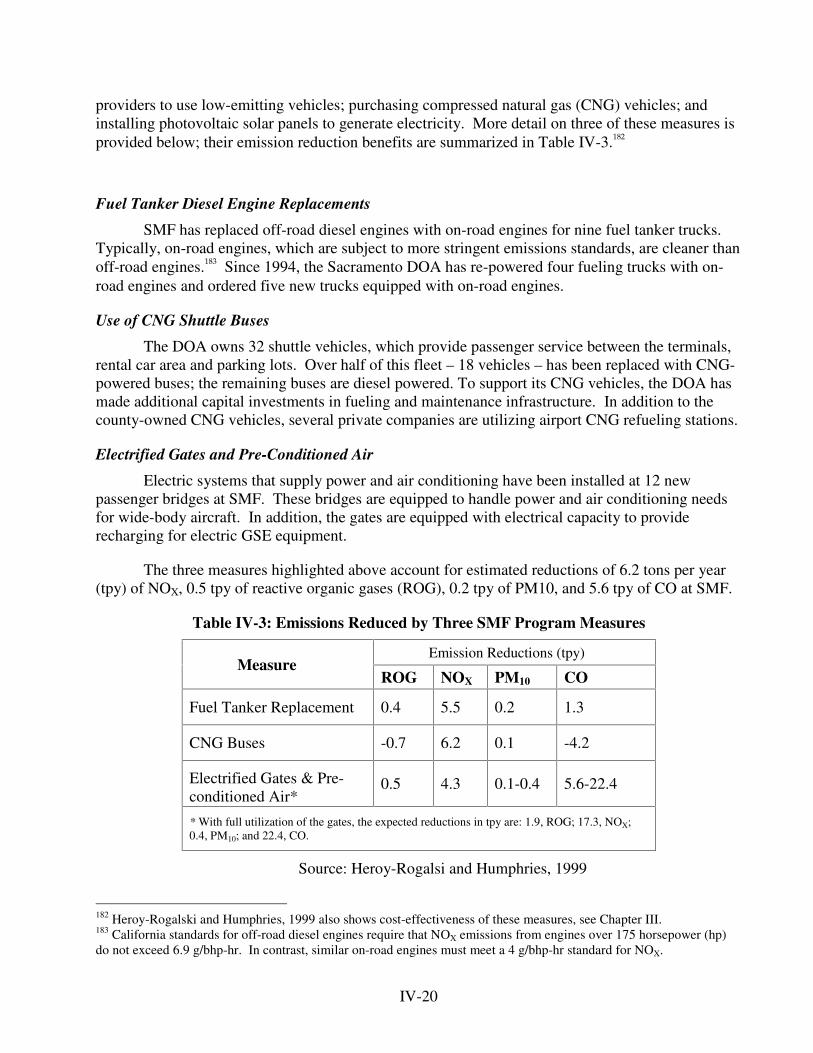
IV-20
providers to use low-emitting vehicles; purchasing compressed natural gas (CNG) vehicles; andinstalling photovoltaic solar panels to generate electricity. More detail on three of these measures isprovided below; their emission reduction benefits are summarized in Table IV-3.182
Fuel Tanker Diesel Engine Replacements
SMF has replaced off-road diesel engines with on-road engines for nine fuel tanker trucks.Typically, on-road engines, which are subject to more stringent emissions standards, are cleaner thanoff-road engines.183 Since 1994, the Sacramento DOA has re-powered four fueling trucks with on-road engines and ordered five new trucks equipped with on-road engines.
Use of CNG Shuttle Buses
The DOA owns 32 shuttle vehicles, which provide passenger service between the terminals,rental car area and parking lots. Over half of this fleet – 18 vehicles – has been replaced with CNG-powered buses; the remaining buses are diesel powered. To support its CNG vehicles, the DOA hasmade additional capital investments in fueling and maintenance infrastructure. In addition to thecounty-owned CNG vehicles, several private companies are utilizing airport CNG refueling stations.
Electrified Gates and Pre-Conditioned Air
Electric systems that supply power and air conditioning have been installed at 12 newpassenger bridges at SMF. These bridges are equipped to handle power and air conditioning needsfor wide-body aircraft. In addition, the gates are equipped with electrical capacity to providerecharging for electric GSE equipment.
The three measures highlighted above account for estimated reductions of 6.2 tons per year(tpy) of NOX, 0.5 tpy of reactive organic gases (ROG), 0.2 tpy of PM10, and 5.6 tpy of CO at SMF.
Table IV-3: Emissions Reduced by Three SMF Program Measures
Emission Reductions (tpy)Measure
ROG NOX PM10 CO
Fuel Tanker Replacement 0.4 5.5 0.2 1.3
CNG Buses -0.7 6.2 0.1 -4.2
Electrified Gates & Pre-conditioned Air*
0.5 4.3 0.1-0.4 5.6-22.4
* With full utilization of the gates, the expected reductions in tpy are: 1.9, ROG; 17.3, NOX;0.4, PM10; and 22.4, CO.
Source: Heroy-Rogalsi and Humphries, 1999
182 Heroy-Rogalski and Humphries, 1999 also shows cost-effectiveness of these measures, see Chapter III.183 California standards for off-road diesel engines require that NOX emissions from engines over 175 horsepower (hp)do not exceed 6.9 g/bhp-hr. In contrast, similar on-road engines must meet a 4 g/bhp-hr standard for NOX.
IV-21
The largest NOX reductions resulted from the introduction of CNG buses into the airlineshuttle fleet. This measure had the added benefit of decreasing diesel particulate matter. However, italso increased ROG and CO emissions, which are of air quality concern. Replacing diesel engineson fuel tankers led to a decrease in the emissions of all targeted pollutants and required the lowestadditional capital investment.184 On the other hand, because the size of the tanker fleet is limited,total reductions achievable through this measure may be small compared to other options. Themeasure with the lowest NOx reduction benefit was the installation of bridge-mounted power andpre-conditioned air; however, greater usage of these gates would increase the total emissionreductions from this approach and lower the cost of this measure.185
C.5 Switzerland: engine emissions charge and airport emissions goal
Under Switzerland’ s Clean Air Ordinance (CAO), individual Swiss cantons186 are obliged todevelop air quality programs to reduce emissions when pollution levels exceed prescribed limits.187
Subject to this obligation, the cantons of Geneva and Zurich petitioned the Swiss federal governmentto develop a strategy for reducing emissions from aviation-related sources, including evaluation ofan emissions-based landing charge or incentive charge.188 Responding to this petition, a SwissFederal Council resolution in 1993 directed Switzerland’ s Department of Transport and Energy toprepare a strategy for introducing an emissions charging system for air traffic. The Federal Officefor Civil Aviation (FOCA) subsequently developed guidance requiring that “ When fixing landingcharges, airports have to take into account differing noise and gaseous emissions of aircraft.”
Most air travel in Switzerland passes through the airports in Zurich and Geneva. In 2000,total aircraft operations at Zurich and Geneva International Airports totaled 325,622 and 170,751respectively, meaning that these airports ranked as the 43rd and 106th busiest airports worldwide.189
Thus, the implementation of emissions-based fee systems at these airports will affect the majority ofair travel in Switzerland.
In September 1997, Zurich airport introduced an emissions charge for all civil aircraftlanding at the airport; the Geneva airport introduced a similar program in November 1998. The feesystem utilized at these airports is based on a FOCA classification system designed to reflect NOX
and VOC emissions during the LTO-cycle.190 It is structured to create incentives for increasedefficiency and to normalize emissions incentives between large and small aircraft by accounting forthe size of the aircraft. To calculate applicable emissions fees, an engine emission factor (EEF) iscalculated as follows:
184 Ibid. The additional capital cost was $27,000.185 Ibid.186 Swiss cantons are roughly equivalent to U.S. states.187 The Swiss Clean Air Ordinance is comparable to the U.S. Clean Air Act. Just as the U.S. Clean Air Act requiresstates to devise State Implementation Plans to achieve national ambient air quality standards, Swiss cantons are requiredby the Ordinance to develop air quality programs to remedy excessive pollution levels.188 Cantons are required to petition the federal government if the measures fall within the competency of the federalgovernment.189 Airports Council International (ACI), ACI Traffic Data: World airports ranking by total movements-2000(preliminary), 2001.190 For a detailed description of the system at Zurich airport see Zurich Airport: Aircraft Engine Emission Charges,January 2000.
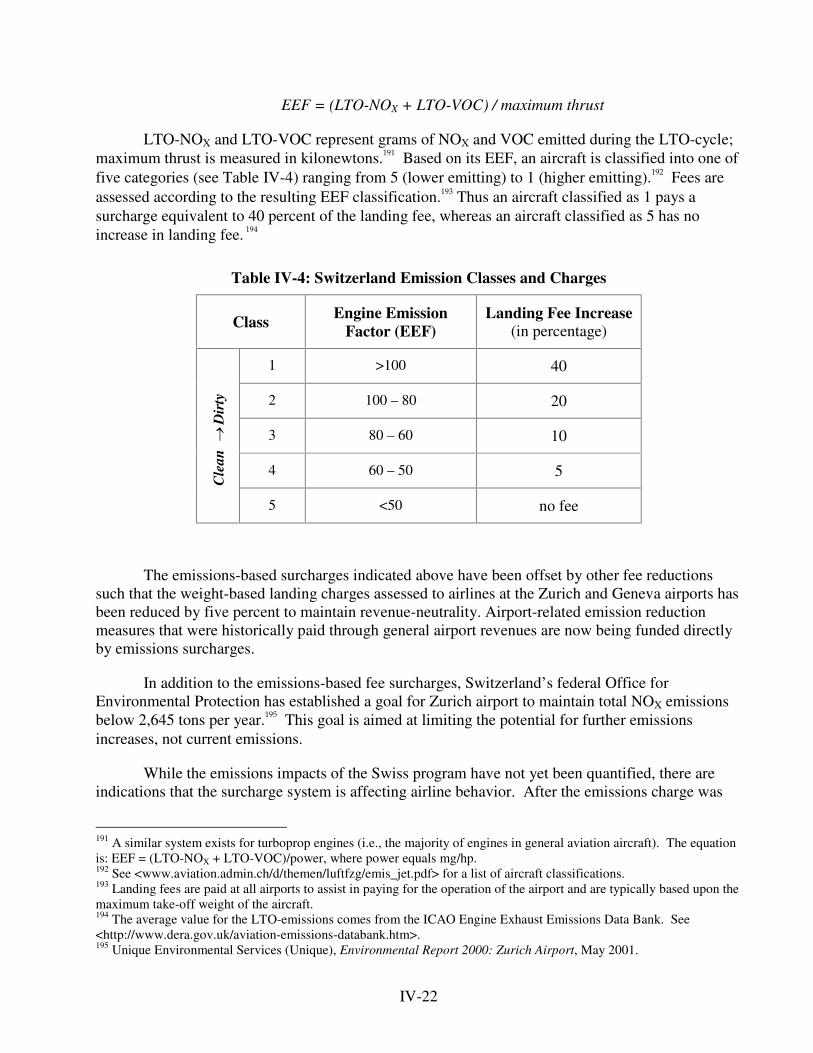
IV-22
EEF = (LTO-NOX + LTO-VOC) / maximum thrust
LTO-NOX and LTO-VOC represent grams of NOX and VOC emitted during the LTO-cycle;maximum thrust is measured in kilonewtons.191 Based on its EEF, an aircraft is classified into one offive categories (see Table IV-4) ranging from 5 (lower emitting) to 1 (higher emitting).192 Fees areassessed according to the resulting EEF classification.193 Thus an aircraft classified as 1 pays asurcharge equivalent to 40 percent of the landing fee, whereas an aircraft classified as 5 has noincrease in landing fee. 194
Table IV-4: Switzerland Emission Classes and Charges
Class Engine EmissionFactor (EEF)
Landing Fee Increase(in percentage)
1 >100 40
2 100 – 80 20
3 80 – 60 10
4 60 – 50 5
Cle
an o
Dir
ty
5 <50 no fee
The emissions-based surcharges indicated above have been offset by other fee reductionssuch that the weight-based landing charges assessed to airlines at the Zurich and Geneva airports hasbeen reduced by five percent to maintain revenue-neutrality. Airport-related emission reductionmeasures that were historically paid through general airport revenues are now being funded directlyby emissions surcharges.
In addition to the emissions-based fee surcharges, Switzerland’ s federal Office forEnvironmental Protection has established a goal for Zurich airport to maintain total NOX emissionsbelow 2,645 tons per year.195 This goal is aimed at limiting the potential for further emissionsincreases, not current emissions.
While the emissions impacts of the Swiss program have not yet been quantified, there areindications that the surcharge system is affecting airline behavior. After the emissions charge was
191 A similar system exists for turboprop engines (i.e., the majority of engines in general aviation aircraft). The equationis: EEF = (LTO-NOX + LTO-VOC)/power, where power equals mg/hp.192 See <www.aviation.admin.ch/d/themen/luftfzg/emis_jet.pdf> for a list of aircraft classifications.193 Landing fees are paid at all airports to assist in paying for the operation of the airport and are typically based upon themaximum take-off weight of the aircraft.194 The average value for the LTO-emissions comes from the ICAO Engine Exhaust Emissions Data Bank. See<http://www.dera.gov.uk/aviation-emissions-databank.htm>.195 Unique Environmental Services (Unique), Environmental Report 2000: Zurich Airport, May 2001.
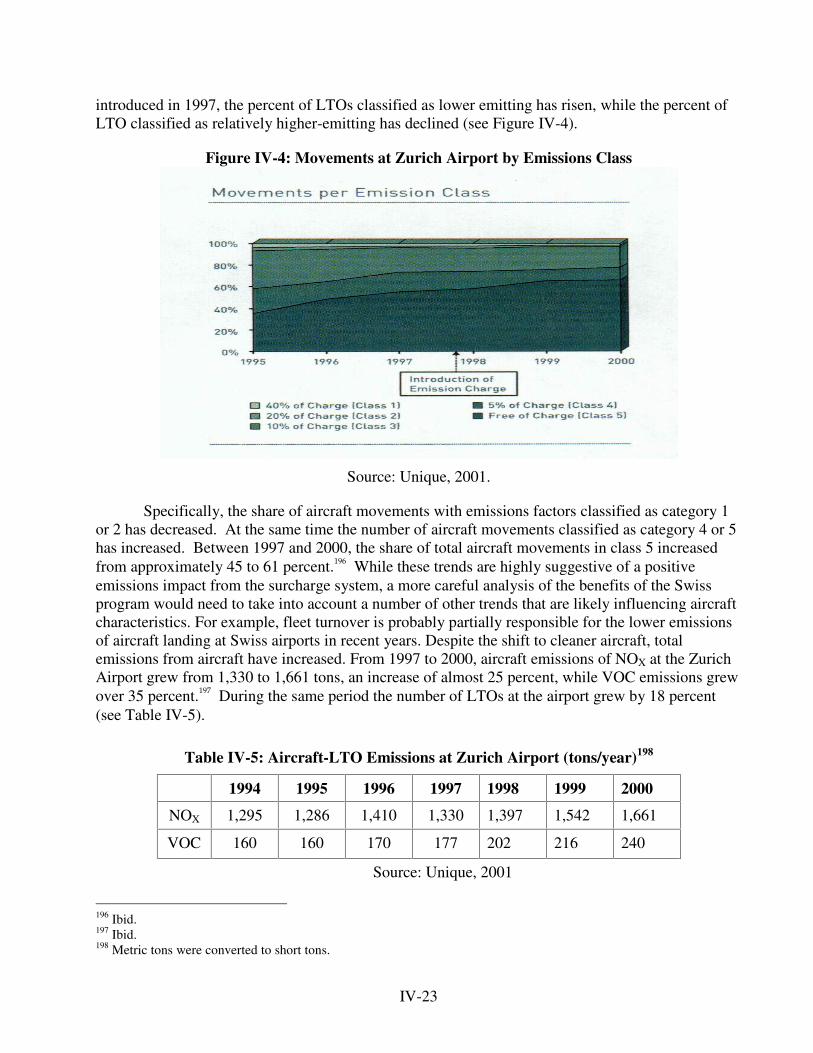
IV-23
introduced in 1997, the percent of LTOs classified as lower emitting has risen, while the percent ofLTO classified as relatively higher-emitting has declined (see Figure IV-4).
Figure IV-4: Movements at Zurich Airport by Emissions Class
Source: Unique, 2001.
Specifically, the share of aircraft movements with emissions factors classified as category 1or 2 has decreased. At the same time the number of aircraft movements classified as category 4 or 5has increased. Between 1997 and 2000, the share of total aircraft movements in class 5 increasedfrom approximately 45 to 61 percent.196 While these trends are highly suggestive of a positiveemissions impact from the surcharge system, a more careful analysis of the benefits of the Swissprogram would need to take into account a number of other trends that are likely influencing aircraftcharacteristics. For example, fleet turnover is probably partially responsible for the lower emissionsof aircraft landing at Swiss airports in recent years. Despite the shift to cleaner aircraft, totalemissions from aircraft have increased. From 1997 to 2000, aircraft emissions of NOX at the ZurichAirport grew from 1,330 to 1,661 tons, an increase of almost 25 percent, while VOC emissions grewover 35 percent.197 During the same period the number of LTOs at the airport grew by 18 percent(see Table IV-5).
Table IV-5: Aircraft-LTO Emissions at Zurich Airport (tons/year)198
1994 1995 1996 1997 1998 1999 2000
NOX 1,295 1,286 1,410 1,330 1,397 1,542 1,661
VOC 160 160 170 177 202 216 240
Source: Unique, 2001
196 Ibid.197 Ibid.198 Metric tons were converted to short tons.
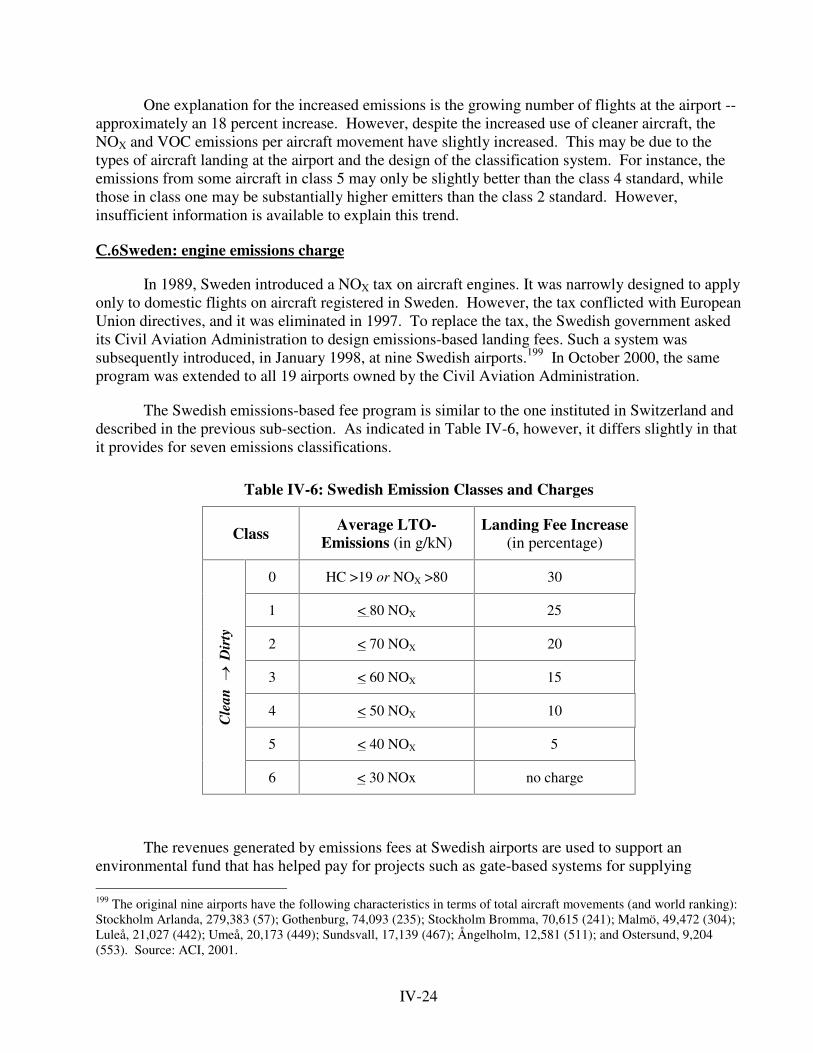
IV-24
One explanation for the increased emissions is the growing number of flights at the airport --approximately an 18 percent increase. However, despite the increased use of cleaner aircraft, theNOX and VOC emissions per aircraft movement have slightly increased. This may be due to thetypes of aircraft landing at the airport and the design of the classification system. For instance, theemissions from some aircraft in class 5 may only be slightly better than the class 4 standard, whilethose in class one may be substantially higher emitters than the class 2 standard. However,insufficient information is available to explain this trend.
C.6 Sweden: engine emissions charge
In 1989, Sweden introduced a NOX tax on aircraft engines. It was narrowly designed to applyonly to domestic flights on aircraft registered in Sweden. However, the tax conflicted with EuropeanUnion directives, and it was eliminated in 1997. To replace the tax, the Swedish government askedits Civil Aviation Administration to design emissions-based landing fees. Such a system wassubsequently introduced, in January 1998, at nine Swedish airports.199 In October 2000, the sameprogram was extended to all 19 airports owned by the Civil Aviation Administration.
The Swedish emissions-based fee program is similar to the one instituted in Switzerland anddescribed in the previous sub-section. As indicated in Table IV-6, however, it differs slightly in thatit provides for seven emissions classifications.
Table IV-6: Swedish Emission Classes and Charges
Class Average LTO-Emissions (in g/kN)
Landing Fee Increase(in percentage)
0 HC >19 or NOX >80 30
1 < 80 NOX 25
2 < 70 NOX 20
3 < 60 NOX 15
4 < 50 NOX 10
5 < 40 NOX 5
Cle
an o
Dir
ty
6 < 30 NOx no charge
The revenues generated by emissions fees at Swedish airports are used to support anenvironmental fund that has helped pay for projects such as gate-based systems for supplying 199 The original nine airports have the following characteristics in terms of total aircraft movements (and world ranking):Stockholm Arlanda, 279,383 (57); Gothenburg, 74,093 (235); Stockholm Bromma, 70,615 (241); Malmö, 49,472 (304);Luleå, 21,027 (442); Umeå, 20,173 (449); Sundsvall, 17,139 (467); Ångelholm, 12,581 (511); and Ostersund, 9,204(553). Source: ACI, 2001.
IV-25
electricity and pre-conditioned air. Meanwhile, base landing fees at Swedish airports have beenreduced to ensure that the overall program is revenue neutral.
The direct impact of this charging system has not been evaluated. However, the Swedishgovernment reports aircraft LTO-emissions from airports and airfields at the 19 locations where theCAA carries out airport operations, including operations at five military airfields. Since theintroduction of the emissions charge at nine airports in 1998 and the remainder in 2000, aircraft LTOemissions of both NOX and HC have declined (see Table IV-7).
Table IV-7: Aircraft LTO-Emissions at Swedish Airports and Airfields (tons/year)200
1997 1998 1999 2000
NOX 1,131 1,163 1,162 1,134
HC 229 257 263 228
Source: Swedish CAA, 2001
As the table indicates, there was an increase in NOX emissions between 1997 and 1999;however, by 2000, NOX emissions had declined almost to 1997 levels. This decline occurred despitegrowth in aircraft operations over the same period.
200 Metric tons were converted to short tons.

IV-26
V-1
V. Statutory and Regulatory Opportunities and Constraints
A. Overview
This chapter discusses the statutory and regulatory framework that underlies stateefforts to reduce emissions from commercial aviation-related sources, and evaluates thelegal opportunities and barriers for a number of emissions reduction approaches that arediscussed in this report.201 A discussion of state and local laws pertaining to aviationemissions sources is not included in this chapter; instead, the chapter provides anoverview of the international and national policies that influence the ability of states tointroduce programs to reduce emissions. The discussion focuses on the relevant sectionsof statutes, regulations, policies, and case law pertaining to various aviation-relatedemissions sources. The chapter is broken into two sections. The first section provides anoverview of international and national policies influencing state efforts to reduceaviation-related emissions. The second section provides a preliminary assessment ofstate opportunities to reduce emissions, including the legality of or legal barriers tointroducing policies at the state level. This chapter focuses on actions that states maytake, and does not discuss the opportunities of the federal government or the internationalcommunity to develop policies to reduce these emissions.
This study relies on relevant statutes and case law as well as interpretations ofcase law provided through work on aviation emissions. The section on national statutesand state opportunities to reduce emissions was based on work undertaken for CCAP by alegal consultant (Kenneth M. Resnik, Esq.).
B. Statutory and Regulatory Policies Surrounding State Action
This section of the chapter is broken into two parts: relevant international policies,and relevant U.S. laws.
B.1 International Law
International aviation policies are largely coordinated through the InternationalCivil Aviation Organization. Many nations also develop bilateral agreements (known asair service agreements) in an effort to coordinate international activities. Understandingthe international guidance and policy towards aviation emissions is important sincenations, including the United States, aim to coordinate activities with those of othercountries. However, as in any international policy, individual countries retain theirnational sovereignty to establish policies in accordance with national priorities.Therefore, the international framework provides a basis for action, but is not binding onindividual nations.
201 The statutory and regulatory context for military aircraft is not covered in this chapter since it is beyondthe scope of this report.
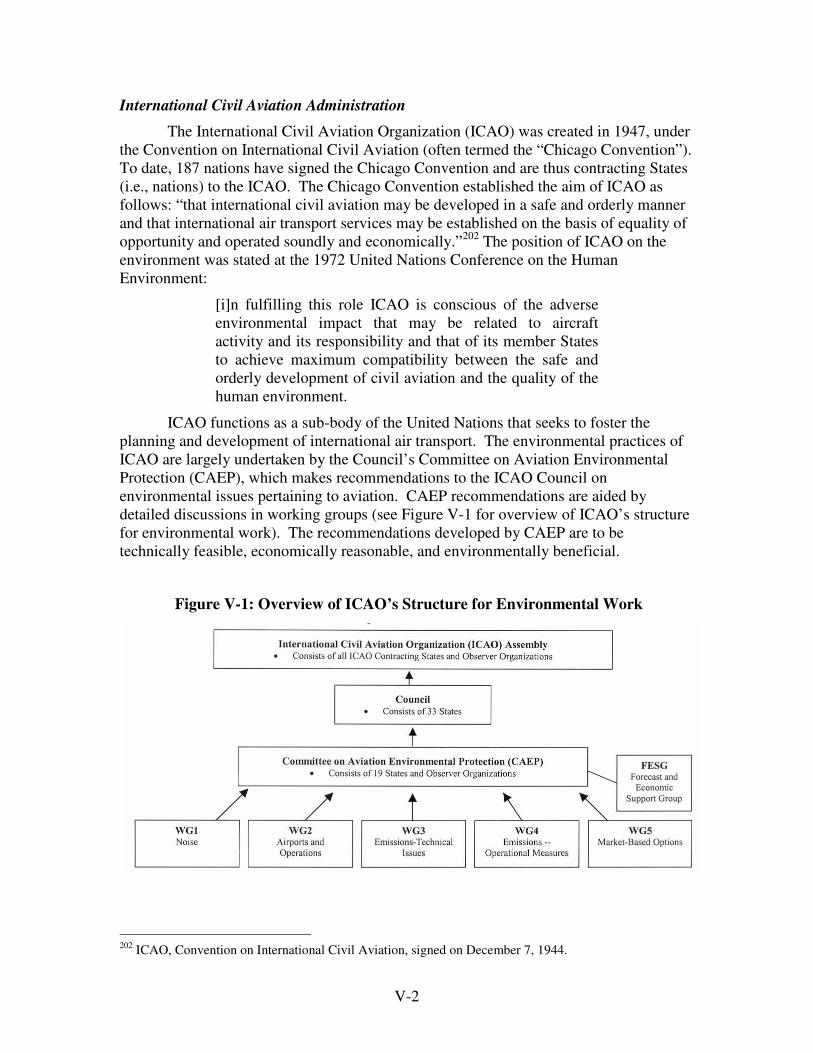
V-2
International Civil Aviation Administration
The International Civil Aviation Organization (ICAO) was created in 1947, underthe Convention on International Civil Aviation (often termed the “ Chicago Convention” ).To date, 187 nations have signed the Chicago Convention and are thus contracting States(i.e., nations) to the ICAO. The Chicago Convention established the aim of ICAO asfollows: “ that international civil aviation may be developed in a safe and orderly mannerand that international air transport services may be established on the basis of equality ofopportunity and operated soundly and economically.” 202 The position of ICAO on theenvironment was stated at the 1972 United Nations Conference on the HumanEnvironment:
[i]n fulfilling this role ICAO is conscious of the adverseenvironmental impact that may be related to aircraftactivity and its responsibility and that of its member Statesto achieve maximum compatibility between the safe andorderly development of civil aviation and the quality of thehuman environment.
ICAO functions as a sub-body of the United Nations that seeks to foster theplanning and development of international air transport. The environmental practices ofICAO are largely undertaken by the Council’ s Committee on Aviation EnvironmentalProtection (CAEP), which makes recommendations to the ICAO Council onenvironmental issues pertaining to aviation. CAEP recommendations are aided bydetailed discussions in working groups (see Figure V-1 for overview of ICAO’ s structurefor environmental work). The recommendations developed by CAEP are to betechnically feasible, economically reasonable, and environmentally beneficial.
Figure V-1: Overview of ICAO’s Structure for Environmental Work
202 ICAO, Convention on International Civil Aviation, signed on December 7, 1944.
V-3
In relation to controlling aviation emissions, ICAO functions include: establishingstandards and recommended practices and developing guidance on the use of taxes andcharges.
Standards and Recommended Practices
Under the Chicago Convention, all participating nations have an obligation toadopt the ICAO standards to the extent possible. However, a nation that does not adoptthe ICAO standards must provide a written explanation to ICAO describing the“ differences between its own practice and that established by the internationalstandard.” 203 Other nations are therefore absolved of their obligations to “ recognize asvalid” the certificate of airworthiness issued by that nation since that certificate will nothave been issued under standards “ equal to or above” ICAO standards.204 In other words,nations do not have to allow aircraft belonging to that nation right to travel through theirairspace.205 Recommendations agreed to by the ICAO Assembly are established asStandards and Recommended Practices (SARPs) and are included in Annex 16 to theChicago Convention. After ICAO adopts a standard, it is put into effect by each ICAOContracting State (i.e., nation). While ICAO seeks to establish common internationalstandards for all aspects under its authority, the standards that are established are theminimum that nations are expected to meet, and thus do not limit national sovereignty inestablishing more stringent standards. However, due to competitiveness concerns,national policies are typically identical to those recommendations made by ICAO.
Guidance on Taxes and Charges
In addition to engine emission standards, ICAO has evaluated the role ofenvironmental levies in reducing aircraft emissions for air quality and climate changepurposes. ICAO separates environmental levies into two categories: taxes and charges.In current ICAO definitions, taxes raise general national and local governmental revenuesthat are applied for non-aviation purposes, whereas charges defray the costs of providingfacilities and services for civil aviation. While the Chicago Convention did not explicitlydiscuss environmental levies, it contained several provisions related to them. Article 24requires member States to exempt from customs duties and other similar duties any fuelimported and retained on an aircraft arriving from an international flight. Article 15requires that charges should be applied in a non-discriminatory manner and that they maynot be imposed “ solely in respect” of the right of transit, entry or exit.
ICAO has given little guidance to date on emission-related levies. Current ICAOguidance on environmental levies is highlighted in a recent ICAO AssemblyResolution.206 The resolution articulates a preference for charges over taxes, and statesthat:
203 Ibid, Article 38.204 Ibid, Article 33.205 If a nation fails to submit a written notification it will be in default of its obligations and risk mandatoryexclusion of its aircraft from the airspace of others and the loss of its voting power in the Assembly and theCouncil (Article 87 and 88 of the Chicago Convention).206 The ICAO 33rd Assembly in A33-7, Appendix I reaffirmed a 1996 ICAO Council interim guidance ontaxes and charges. See <www.icao.int/icao/en/assembl/a33/resolutions_a33.pdf>.
V-4
the funds collected should be applied in the first instance tomitigating the environmental impact of aircraft engineemissions, for example to [sic]:
a) addressing the specific damage caused by these emissions,if that can be identified;
b) funding scientific research into their environmentalimpact; or
c) funding research aimed at reducing their environmentalimpact, through developments in technology and newapproaches to aircraft operations.207
This interim guidance also indicated that: (1) there should be no fiscal aim behindthe charges; (2) the charges should be related to costs; and (3) the charges should notdiscriminate against air transport compared with other modes of transport.
Air Service Agreements
Air service agreements (ASAs) negotiated between nations traditionally seek areciprocal balance of benefits for the airlines of the participating countries. Theseagreements establish a regulatory mechanism for the performance of commercial airservice between the participating countries. A bilateral agreement places directlimitations on carriers from each of the contracting states, permitting air service only tothose cities specified in the bilateral agreement. In the United States, bilateral airtransport agreements do not require ratification from the Senate but can instead be signeddirectly by the President.
Worldwide, there are over 3,000 ASAs with typical provisions related to safetyand security, the right to use airports in the other’ s country, fair competition, taxes andduties, and user charges.208 Two such provisions are most relevant to this assessment, asthey have implications for national and local efforts to control aviation-related emissions.The first provision typically exempts uplifted aviation fuel209 from taxation. Forexample, the agreement between the U.S. and Malta exempts the “ fuel, lubricants andconsumable technical supplies introduced into or supplied in the territory of a Party foruse in an aircraft of an airline of the other Party” from taxes, levies, duties, fees andcharges.210 Agreements with this provision limit the ability of nations to apply a tax onthe fuel used on aircraft from another country and therefore limit efforts to reduce aircraftemissions by applying a tax on fuel-use. The second relevant provision in many ASAsapplies to the cost basis of user charges, and limits what can be charged under such a fee.A large number of the ASAs state that user charges should be just, reasonable, equitablyapportioned among categories of users and not unjustly discriminatory. Any program
207 International Civil Aviation Organization (ICAO), Council Resolution on Environmental Charges andTaxes, Adopted by Council December 9, 1996.208 User charges pay for the cost of aviation infrastructure. Typical charges include airport and airnavigation service charges, which pay for the operation of the airport and the air traffic control systems.209 “ Uplifted aviation fuel” is fuel on-board the aircraft upon takeoff.210 United States Government, Air Transport Agreement between the Government of the United States ofAmerica and the Government of Malta, October, 2000.
V-5
that seeks to reduce aviation emissions through user charges must often meet thesecriteria.
Recent ASAs in the U.S. have been developed under the "Open Skies"initiative.211 Whereas past ASAs were developed with limited liberalization of aviationmarkets, open skies agreements expanded the liberalization efforts by permittingunrestricted international air service between the participating countries, withoutrestrictions on where carriers fly, the number of flights they operate, and the prices theycharge. These agreements therefore place further constraints on the ability ofparticipating nations to impose restrictions on international aviation. In considering thelegal merits of a given policy approach, due consideration should be given to ASAs;however, full consideration of the implications of ASAs is beyond the scope of thisreport.
B.2 U.S. Law
This section discusses national statutes and regulations affecting the control ofcommercial aviation-related emissions. It includes policies that directly shape the controlof emissions from aviation and those that indirectly influence the regulation of aviationemissions. The Clean Air Act establishes a framework for state and national control ofaviation emissions similar to that which applies to other emission sources. Additionally,regulations related to the control of aviation activity influence the ability of states todevelop programs to reduce aviation-related emissions. The statutes discussed in thisregard include: the Airline Deregulation Act, the Anti-Head Tax Act, and the FederalAviation Act. Discussion is also provided on state petitions under the AdministrativeProcedure Act.
Clean Air Act
The Clean Air Act (CAA) establishes standards for six criteria pollutants: ozone,carbon monoxide (CO), lead, nitrogen dioxide (NO2), sulfur dioxide (SO2), and particulatematter. These standards, termed National Ambient Air Quality Standards (NAAQS),establish minimum ambient levels for each pollutant that must be met by every area, butallows states to develop pollution control programs that result in less pollution thanspecified by the NAAQS. In drafting the CAA, Congress endorsed a particular schemeof regulation. Generally, while Title I of the CAA empowers the states to regulateemissions from stationary sources, and Title II of the CAA empowers the EPA to regulatemobile sources, other CAA provisions limit the extent of this dichotomy,212 Thefollowing section highlights the relevant portions of the CAA as they relate to airport-related emissions; it assumes a basic familiarity with the CAA.
Aircraft Engines
Policy regarding the setting of standards for aircraft engines is detailed in Title IIof the CAA. In section 233, Congress expressly preempted state power to regulateaircraft engine emissions: 211 The U.S. currently has 95 ASAs, including 53 bilateral open-skies” agreements and one multilateralopen skies agreement. See <http://ostpxweb.dot.gov/aviation/> for detailed list of current U.S. agreements.212 It is important to note that Title I does not explicitly limit state authority to stationary sources, butmerely extends that authority to the states.
V-6
No state or political subdivision thereof may adopt orattempt to enforce any standard respecting emissions of anyair pollutant from any aircraft or engine thereof, unlesssuch standard is identical to a standard applicable to suchaircraft under this part.
Although EPA has the authority to promulgate emission standards for aircraftengines, that authority is limited. Section 231(b) provides that such regulations will takeeffect “ after such period as the Administrator finds necessary (after consultation with theSecretary of Transportation) to permit the development and application of the requisitetechnology, giving appropriate consideration to the cost of compliance within suchperiod.” Further, section 231(c) dictates that such regulations will not take effect if“ disapproved by the President . . . on the basis of a finding by the Secretary ofTransportation that any such regulation would create a hazard to aircraft safety.” Theresponsibility for enforcing the standards lies with the Secretary of Transportation whohas delegated responsibility to the FAA.
Nonroad Engines
The CAA classifies engines and vehicles that are not used on the road as nonroadvehicles. In this regard, most GSE is classified as nonroad vehicles. The control ofemissions from nonroad engines is outlined in section 209 of the CAA Amendments of1990. Section 209 gives EPA the authority to establish emissions standards for newnonroad engines and vehicles. In relevant parts, section 209(e)(1) outlines federalpreemption for certain types of nonroad equipment:
No state or political subdivision thereof shall adopt orattempt to enforce any standard or other requirementrelating to the control of emissions from either of thefollowing new nonroad engines or nonroad vehicles subjectto regulation under this chapter – (A) [Construction andagricultural equipment], (B) [Locomotives].
Further specifications for the control of other nonroad equipment is outlined insection 209(e)(2), and provides that:
(A) In the case of any nonroad vehicles or engines otherthan those referred to in subparagraph (A) and (B) ofparagraph (1), the Administrator shall, after notice andopportunity for public hearing, authorize California toadopt and enforce standards and requirements relating tothe control of emissions from such vehicles or engines . . .
(B) Any State other than California which has planprovisions approved under part D of subchapter I of thischapter may adopt and enforce after notice to theAdministrator, for any period, standards relating to thecontrol of emissions from nonroad vehicles or engines(other than those referred to in subparagraph (A) or (B) ofparagraph (1)) and take such actions as are referred to in
V-7
subparagraph (A) of this paragraph respecting suchvehicles or engines if – (i) [standards must be identical toCalifornia], and (ii) [two year notice period].
Under this authority, the standards “ shall achieve the greatest degree of emissionreduction achievable through the application of technology which the Administratordetermines will be available for the engines or vehicles to which such standards apply,giving appropriate consideration to the cost of applying such technology within theperiod of time available to manufacturers and to noise, energy, and safety factorsassociated with the application of such technology.” 213
Among other rulemaking activities related to section 209, EPA issued aninterpretive rule, stating, in part, that “ EPA believes that states are not precluded undersection 209 from regulating the use and operations of nonroad engines, such asregulations on hours of use, daily mass emission limits or sulfur limits on fuel.” 214 InEngine Manufacturers Ass’ n v EPA the D.C. Circuit Court of Appeals upheld EPA’ s rulein this regard.215
On-road Vehicles
On-road vehicles using the airport (e.g., GAV) are subject to the same set ofregulations and requirements as similar vehicles serving non-airport facilities. Undersection 209 of the CAA, states are prohibited from adopting or attempting to enforceemissions standards for new motor vehicles or new motor vehicle engines. However,Section 209 authorizes California to adopt “ standards (other than crankcase emissionstandards) for the control of emissions from new motor vehicles” with a waiver from theEPA. Upon the adoption of such a standard by California, Section 177 permits otherstates to follow suit and adopt the identical policy. The CAA gives states the authority toestablish Transportation Control Measures (TCMs) in ozone non-attainment areas inorder to reduce emissions from on-road vehicles. A variety of TCMs have beenintroduced at airports including: express bus service from remote parking areas,ridesharing, mass transit, parking management, and free bus service.
Stationary Sources
The CAA under Title I specifies a set of responses to emissions of stationarysources, and a variety of regulations have been developed in response to theserequirements. Under the CAA, stationary sources at airport facilities are treated thesame as stationary sources off the airport; therefore, they must meet the same regulationsas similar off-airport sources. The control of stationary sources is contingent on thefacility type and the applicable rules for such a source.
Indirect Sources
Section 110 of the CAA confers broad authority on the states to regulate indirectsources. Congress has provided that states could include “ indirect source review
213 42 U.S.C., section 213 (a) 3.214 59 FR 31306, 40 C.F.R. Part 89, Appendix A to Subpart A.215 88F.3d 1075, 1094 (1996)), hereafter referred to as Engine Manufacturers Ass’ n v EPA.
V-8
programs” in a State Implementation Plan (SIP).216 An “ indirect source” is defined as “ afacility, building, structure, installation, real property, road, or highway which [sic]attracts, or may attract, mobile sources of pollution.” 217 Further, the previous sectionclearly states that airports are “ indirect sources,” providing that as expressed in section110(a)(5)(B):
The Administrator shall have the authority to promulgate,implement and enforce regulations under subsection (c) ofthis section respecting indirect source review programswhich apply only to federally assisted highways, airports,and other major federally assisted indirectsources...(emphasis added).
In order to regulate indirect sources, states would need to include an indirectsource review program in their SIPs and provide details on the program. A number ofstates currently have such a program included in their SIPs.218
General Conformity
Federal entities are prohibited under Section 176(c)(4) of the CAA from takingactions in nonattainment or maintenance areas, which do not conform to the SIP of agiven area. The EPA promulgated regulations (“ General Conformity Regulations” 219),applicable to everything but highways and mass transit220, to ensure that federal actionsconformed to the SIPs.221 The purpose of conformity is to: “ (1) ensure Federal activitiesdo not interfere with the budgets in the SIPs; (2) ensure actions do not cause or contributeto new NAAQS violations, and (3) ensure attainment and maintenance of theNAAQS.” 222 All federal actions are covered unless otherwise exempt (e.g., actionscovered by transportation conformity, actions with clearly de minimis emissions, exemptactions listed in the conformity rule, or actions covered by a presumed-to-conform listingby a specific agency).
Conformity can be demonstrated by: (1) showing emission increases are includedin the relevant SIP; (2) the State agreeing to include the emissions increases in its SIP; (3)in areas without SIPs , showing no new violations of NAAQS and/or no increases in thefrequency/severity of violations; (4) using offsets, and (5) implementing mitigationmeasures. Some emissions are excluded from conformity determination, such as thosealready subject to new source review; those resulting from the ComprehensiveEnvironmental Response, Compensation, and Liability Act (CERCLA) or compliancewith other environmental laws, and indirect emissions from the actions and projects thatare not reasonably foreseeable, or that are not under a continuing program responsibility
216 42 U.S.C., section 110(a)(5)(A)(i).217 42 U.S.C., section 110(a)(5)(C).218 States that have such requirements include: California, Connecticut, Minnesota, New York, NorthCarolina, Oregon, Utah, Vermont, and Wisconsin (FAA, 1997).219 40 CFR 93.150-160.220 Highways and mass transit are covered under EPA’ s Transportation Conformity Regulations (58 C.F.R.62188).221 58 C.F.R. 63214.222 U.S. EPA, General Conformity Website, see: <www.epa.gov/ttn/oarpg/genconformity.html>.
V-9
of the relevant agency. In September 2002, the FAA and EPA released a guidancedocument that provides answers to a specific set of questions on implementing generalconformity for airports. 223
The Airline Deregulation Act
The Airline Deregulation Act (ADA), passed in 1978, introduced fare and routecompetition, and permitted unrestricted entry into the air passenger marketplace by newdomestic carriers. Section 41713(b)(1) of the ADA limits the power of states with regardto price, route, or service in that it specifies:
Except as provided in this subsection, a State, politicalsubdivision of a State, or political authority of at least 2States may not enact or enforce a law, regulation, or otherprovision having the force and effect of law related to aprice, route, or service of an air carrier that may provide airtransportation under this subpart.
The Anti-Head Tax Act
The Anti-Head Tax Act (AHTA) was originally passed in 1973. It provides thefoundation for Passenger Facility Charges224 at airports. The guidelines for such chargesis specified in section 40116(c):
A State or political subdivision of a State may levy orcollect a tax on or related to a flight of a commercialaircraft or an activity or service on the aircraft only if theaircraft takes off or lands in the State or politicalsubdivision as part of the flight.
The statute also specifies that “ [e]xcept as provided in subsection (d) of thissection, a State or political subdivision of a State may levy or collect . . . reasonable . . .landing fees . . . from aircraft operators for using airport facilities of an airport owned oroperated by that State or subdivision.” 225 Subsection (d) does not permit states to “ levyor collect a . . . fee . . . first taking effect after August 23, 1994, exclusively upon anybusiness located at a commercial service airport or operating as a permitee of such anairport other than a . . . fee . . . wholly utilized for airport or aeronautical purposes.”
The Federal Aviation Act
The Federal Aviation Act, originally passed in 1958, grants the FAA soleresponsibility for the nation's civil-military system of air navigation and air trafficcontrol. Among many other provisions, the Federal Aviation Act provides that “ [t]heAdministrator of the Federal Aviation Administration shall promote safe flight of civilaircraft in air commerce . . . ” 226 In addition, two sections of the Act specifically addressnoise. Section 44715(a)(1)(A)(ii) dictates that the Administrator of the FAA, “ as he
223 For more information, see: <www.epa.gov/ttn/oarpg/conform/airport_qa.pdf>.224 Passenger Facility Charges are applied to the ticket price and are used to pay for the operation of theairport.225 49 U.S.C., section 40116(e)(2).226 49 U.S.C., section 44701(a).
V-10
deems necessary” shall promulgate regulations to “ control and abate” aircraft noise. TheAct further dictates that the EPA must be consulted in this process.227 Another section ofthe Act specifies that “ noise policy must be carried out at the national level.” 228 Specificprovisions of the Act will be discussed below where appropriate.
The Airport and Airway Development Act
The Airport and Airway Development Act (AADA) of 1970 authorized theDepartment of Transportation (DOT) administrator to set minimum safety standards forairports and issue operating certificates for airports meeting those standards. In relevantpart the Act states:
(1) The Secretary [of Transportation] shall not approve any projectapplication for a project involving airport location, a major runwayextension, or runway location unless the Governor of the State in whichsuch project may be located certifies in writing to the Secretary that thereis a reasonable assurance that the project will be located, designed,constructed, and operated so as to comply with applicable air and waterquality standards . . . 229
State Petitions
States may petition the EPA to set stricter standards for aircraft engine emissions.The Administrative Procedure Act provides that “ interested person[s]” have the right topetition an Agency to amend or repeal a rule.230 Since the EPA sets standards for aircraftengine emissions as part of its rulemaking capacity, any interested person may petitionthe Agency to revise the rule. Further, EPA’ s denial of such a petition would bereviewable by the U.S. Circuit Court.231
C. Opportunities for State Actions
It is clear from the structure of the CAA (see above) that states may not simplyimpose regulations governing emissions from aircraft engines. Thus, a state could notissue a regulation dictating that individual aircraft engines operating in that state emit lessthan a certain amount of NOX. This does not necessarily mean that states cannotpromulgate and defend regulations to reduce aggregate airport emissions. The followingsection discusses a variety of opportunities for states to develop programs to reduceairport-related emissions. The opportunities evaluated in this legal analysis include: (1)regulation of the ground-level operation of aircraft; (2) programs to limit the emissions ofGSE; (3) emissions-based landing fees; (4) regulation of GAVs; (5) “ airport bubbles” ; (6)state petitions; and (7) other opportunities (see chapter IV for greater details on theseprograms). This section broadly examines legal issues related to aviation and toimplementing of these options. It is impossible to predict the success or failure of any
227 49 U.S.C., section 44715(a)(2). See also 49 U.S.C. §§ 44715(c) and 44715(d).228 49 U.S.C., section 47521(3).229 49 U.S.C. 47106(c)(1)(B).230 5 U.S.C., section 553(e).231 Oljato Chapter of the Navajo Tribe v. Train, (hereafter Oljato), 515 F.2d 654, 66-67 (D.C. Cir. 1975).
V-11
particular regulation in the abstract; the drafting of that regulation is particularlyimportant in determining whether it will withstand scrutiny. This section also addresseswhether a particular course of action by the states would be pre-empted by federal law, aspre-emption is a primary obstacle -- although by no means the only one -- facing stateefforts to regulate airport emissions. Other obstacles must also be considered, and theyreceive cursory attention here. These obstacles include state regulations that would beimpermissible because they violate the Commerce Clause or the Equal Protection clauseof the United States Constitution.232 Any potential course of action by a particular statewould require detailed legal analysis before any attempt to implement it was made.
C.1 Brief Review of Preemption Doctrine
The question examined in this section is whether federal law preempts state lawor regulation in a particular area. Thus, a review of preemption doctrine is necessary.The Supremacy Clause of the United States Constitution provides that federal law takesprecedence over state law, and thus federal law may preempt a state law.233 Preemptionis not intended to intrude unduly on state sovereignty.234 In determining preemption, thesole consideration is the intent of Congress.235 Congress must have intended for theenacted statute to preempt state law.236
There are three ways in which federal law can preempt state law. First, Congressmay expressly state in a statute that it is preempting state law.237 Second, Congressionalintent to preempt state law may be inferred “ where the scheme of federal regulation issufficiently comprehensive to make reasonable the inference that Congress ‘left no room’for supplementary state regulations” , known as “ field preemption.” 238 Third, state lawmay be preempted if it actually conflicts with federal law, if it is “ physically impossible”to comply with both laws, or if the state law is “ an obstacle to the accomplishment andexecution of the full purposes and objectives of Congress.” 239
C.2 State Regulation of Ground-Level Operation of Aircraft
As a general proposition, states may seek to regulate emissions from airports byregulating the ground-level operation of aircraft, for example, limiting the time andmanner in which an airplane may idle or regulating the means of supplying aircraft withpower at the gate.
The Clean Air Act
As discussed above, section 233 of the CAA prohibits states from setting aircraftemissions standards. While some may argue that this restriction extends to regulating
232 The Commerce Clause is Article I section 8. The Equal Protection clause is the Fourteenth Amendment.233 U.S. Constitution, Article VI.234 Shaw v. Delta Air Lines, Inc., (hereafter Shaw), 463 U.S. 85, 95 (1983).235 California Fed. Savings and Loan Assoc. v. Guerra, (hereafter California Fed. Savings), 479 U.S. 272,280 (1986).236 Shaw, 463 U.S. at 95.237 California Fed. Savings, 479 U.S. at 280.238 Ibid at 281. See also Rice v. Santa Fe Elevator Corp., 331 U.S. 218 (1947).239 Ibid.
V-12
ground-level use and operation of airline engines, it is unlikely that such an argumentwould succeed.
In regulating motor vehicles, section 202 of the CAA empowers EPA to setemissions limits for new vehicles, and provides that states “ shall not adopt or attempt toenforce any standard relating to the control of emissions from new motor vehicles or newmotor vehicle engines subject to this part.” However, Congress also provided that“ [n]othing in this part shall preclude or deny to any State or political subdivision thereofthe right otherwise to control, regulate, or restrict the use, operation, or movement ofregistered or licensed motor vehicles.240 The question is whether a similar scheme existsfor aircraft. The CAA is silent as to whether the states retain the power to regulateground-level use and operation of aircraft.
In California v. Navy, the court held that “ Section 233 preemption is aimed atprotecting the owner and the manufacturer of the vehicle and the engine against the‘chaos’ of multiplex standards for entities which readily transverse state lines” (emphasisin original).241 The Ninth Circuit Court of Appeals affirmed the district court ruling,agreeing that “ if the state pollution regulations can be met without affecting the design,structure, operation, or performance of the aircraft engine, then the state emissionregulations are not preempted by § 233.” 242 Therefore, any operating requirements thatwere not deemed to oppose this portion could be upheld.
Since preemption of state power to regulate ground-level operation of aircraftwould not fit the stationary scheme the courts found Congress was setting in the CAA,and would not subject manufacturers and owners or aircraft engines to myriad conflictingregulations, there is a strong argument that section 233 should be construed narrowly asnot preempting such state regulatory efforts.
Preemption under the Federal Aviation Act
The FAA has articulated the position that the Federal Aviation Act “ preemptsstate and local regulations of aircraft operations.” 243 The FAA cites sections 40103(b)and (d), 41713, and 44715 of the Federal Aviation Act. Turning first to whether any ofthese provisions expressly preempt state regulation of ground-level aircraft operations, itis seemingly evident that they do not. Section 40103(b) provides that the Administratorof the FAA shall develop plans and policies for the use of airspace and “ assign byregulation or order the use of the airspace . . .” The section further provides that the FAAshall prescribe air traffic regulations. Section 40103(d) appears inapposite, since itregulates the aircraft of the armed forces of foreign countries. Section 41713 is the ADA,and section 44715 allows the FAA to control aircraft noise.
240 42 U.S.C. § 7502(d). As noted in Section 1, the courts have approved a similar scheme relating tononroad engines.241 California v. Navy, 431 F.Supp. 1271, 1285 (N.D. Ca. 1977)(aff’ d 624 F.2d 885 (9th Cir. 1980)).242 California v. Navy, (hereafter California v. Navy, 1980), 624 F.2d 885, 888 (9th Cir. 1980).243 Federal Aviation Administration, (hereafter FAA Memo), Legality of Emission Based Airport LandingFees, Memo to EPA/FAA Stakeholder Process on June 22, 2000.
V-13
The Airline Deregulation Act
The only statute containing an express preemption provision is the ADA. ThatAct provides that the states may not enact or enforce any law or regulation “ relating torates, routes, or services of any air carrier.” The Supreme Court first dealt with the scopeof preemption in Morales v. Trans World Airlines, Inc.244 Morales addressed thequestion of whether states could enforce the guidelines of the National Association ofAttorneys General with respect to airline fare advertisements. The Court noted that thekey to understanding the scope of ADA preemption was the phrase “ relating to.” 245 TheCourt found that “ [s]tate enforcement actions having a connection with, or reference to,airline ‘rates, routes, or services’ are pre-empted . . .” 246 The Court made clear, however,that “ some state actions may affect airline fares in too tenuous, remote, or peripheral amanner to have pre-emptive effect.” 247 Finally, the Court noted that it was notdetermining where a line might be drawn between state actions that would or would not“ relate to” airline rates.248
The Supreme Court addressed ADA preemption further in American Airlines, Inc.v. Wolens.249 In Wolens, plaintiffs sued American Airlines, contending that the “ frequentflyer program” modifications imposed by American violated Illinois law and were abreach of contract. The Illinois Supreme Court had found no preemption, because thefrequent flyer programs were not “ essential” to the airline and the plaintiffs’ claims only“ tenuously” related to rates, routes, and services. The U.S. Supreme Court reversed,finding first that the ADA made no distinction between “ essential” and “ unessential”matters.250 Further, the Court found that the claims related to “ ‘rates, i.e. American’ scharges in the form of mileage credits . . . and to ‘services,’ i.e. access to flights andclass-of-service upgrades . . .” 251 The Court found that plaintiffs’ claims under Illinoisstate law were preempted.252 For reasons not relevant to this report, it also found that theADA did not preempt a contract between private parties.253
In Federal Express Corp. v. California Public Utilities Comm’ n, the Ninth CircuitCourt of Appeals found that Federal Express was an “ air carrier” and that trucks were “ anessential component” of its system to deliver packages.254 The Court held that the PublicUtility Commission’ s regulation of “ rates, of discounts and promotional pricing, ofclaims, of overcharges, of bills of lading and freight bills, and its imposition of fees entersthe zone Congress has forbidden the states to enter.” 255 Thus, the Court found such aregulation was preempted by the ADA. However, the Court pointed out that “ it is
244 Morales v. Trans World Airlines, Inc., (hereafter Morales), 504 U.S. 374 (1992).245 Ibid at 382.246 Ibid at 384.247 Ibid at 390.248 Ibid.249 American Airlines, Inc. v. Wolens, (hereafter Wolens), 513 U.S. 219 (1995).250 Ibid at 226.251 Ibid.252Ibid at 228.253 Ibid at 233.254 Federal Express Corp. v. California Public Utilities Comm’ n., (hereafter Federal Express), 936 F.2d1075 (9th Cir. 1991) at 1076-77.255 Ibid at 1078.
V-14
uncontested in this case that the general traffic laws of California and its safetyrequirements for trucks on its highways apply to Federal Express; only economicregulation is challenged.” 256
It would seem logical to conclude from these decisions that state regulation ofground-level airport operations would, as non-economic regulation, be held to be sotenuously connected to “ rates, routes, and services” as to not be preempted under theADA. A note of caution is appropriate in this analysis. A regulation that might bedeemed related to “ safety,” such as a regulation requiring that aircraft be towed, ratherthan taxi, from the gate to the runway, might be preempted. This is because certain statecourts have held that state laws restricting an airline’ s selection of an employee based onphysical characteristics necessarily has a connection to airline services, since they affectthe safety of those services.257 These courts held, in essence, that any law affecting safetyhas a connection to services, and thus were preempted by the Act. The same logic couldbe applied to state regulation of ground-level operations, provided there was a basis forfinding the regulations affected safety. With this caveat, it is probable that certain stateregulations aimed a ground-level operation of aircraft would not be preempted under theADA since they do not infringe on safety.
Section 40103
Section 40103 empowers the Administrator of the Federal AviationAdministration to regulate “ airspace.” Specifically, section 40103(b)(2) dictates that theAdministrator “ shall prescribe air traffic regulations on the flight of aircraft” (emphasisadded). The FAA might argue that this provision results in field preemption of any statelaws or regulations, including any regulation related to ground level operation ofaircraft.258
The notion that preemption exists simply because a Federal Agency has issuedregulations concerning an issue, even comprehensive regulations that leave no space forstate regulation, is one that has been rejected by the Supreme Court. “ To inferpreemption whenever an agency deals with a problem comprehensively is virtuallytantamount to saying that whenever a federal agency decides to step into a field, itsregulations will be exclusive. Such a rule, of course, would be inconsistent with thefederal-state balance embodied in our Supremacy Clause jurisprudence.” 259 However,there is little to suggest that the courts would disagree with the view that the ADApreempts all local control of aircraft operations, including ground operations. Courtshave, in fact, given expansive definition to the scope of the FAA’ s authority.260 Becauseregulations mandating single or reduced engine taxiing or towing aircraft from the gatemay fairly be seen as impinging on the safety of takeoffs and landings, it is likely thatsuch regulations would be struck down. More likely to survive legal challenge would be
256 Ibid.257 See Wellons v. Northwest Airlines, Inc., 165 F.3d 493, 495 (6th Cir. 1999)(collecting cases).258 FAA Memo.259 Hillsborough County v. Automated Medical Laboratories, Inc., 471 U.S. 710, 713 (1985).260 See Burbank-Glendale-Pasadena Airport Authority v. City of Los Angeles, 979 F.3d 1338, 1341 (9th Cir.1992) that stated: “ The proper placement of taxiways and runways is critical to the safety of takeoffs andlandings and essential to the efficient management of the surrounding airspace” .
V-15
regulations that do not affect the movement of aircraft, such as requiring the installationand use of fixed-based power and pre-conditioned air.
Section 44715
Section 44715 is the re-codification of what was known as the Federal NoisePollution Control Act. The FAA and the airlines have looked to decisions based on thisstatute to support arguments that the entire field of aircraft regulation is preempted.Specifically, the airlines and FAA have used the Supreme Court’ s decision in City ofBurbank v. Lockheed Air Terminal, Inc in support of this preemption.261 In Burbank, theCity of Burbank promulgated a city ordinance forbidding any jet aircraft from taking offfrom Hollywood-Burbank Airport between 11:00 p.m. and 7:00 a.m., and forbidding theairport from permitting any such take-offs. While the case was pending in the lowercourts, Congress passed the Noise Control Act of 1972, amending the Federal AviationAct. The Court found that the Burbank ordinance was preempted, holding that “ [i]t is thepervasive nature of the scheme of federal regulation of aircraft noise that leads us toconclude that there is pre-emption (emphasis added).” 262 The Court also found that if asignificant number of communities followed the Burbank example, “ it is obvious thatfractionalized control of the timing of takeoffs and landings would severely limit theflexibility of the FAA in controlling air traffic flow. The difficulties of scheduling flightsto avoid congestion and the concomitant decrease in safety would be compounded.” 263
Thus, the Supreme Court’ s holding does not rest exclusively on the provisions ofthe Noise Control Act, but largely so. The decision can be, and has been, interpreted tohold that state and local controls of noise by aircraft, even if those controls come in theform of such regulations as curfews, are pre-empted.264 Certainly, it is not clear from theSupreme Court’ s decision that Congress intended to preempt any other area of regulationthan noise, despite the decision’ s somewhat broad language regarding safety. Further,neither the airlines nor FAA have identified a court decision broadening the Burbankholding to show that the statutes preempt the entire field of aircraft regulation.
Ground regulations may still run afoul of the FAA regulations on Notice ofApproval of Airport Noise and Access Regulations (“ Part 161” ).265 Even thoseregulations not intended to curtail or limit noise pollution fall under Part 161 if thoseregulations are ones “ affecting access or noise that affects the operation of Stage 2 orStage 3 aircraft…” 266 Under this Part, regulations which must be submitted to the FAAfor approval are exempt, as are peak-usage pricing schemes. Further, “ [o]ther noiseabatement procedures, such as taxiing and engine runups, are not subject to this partunless the procedures imposed limit the total number of Stage 2 or Stage 3 aircraftoperations, or limit the hours of Stage 2 or Stage 3 aircraft operations, at the airport.” 267
261 City of Burbank v. Lockheed Air Terminal, Inc., (hereafter Burbank), 411 U.S. 624 (1973).262 Ibid at 633.263 Ibid at 639.264 See Faux-Burhans v. County Comm’ rs of Frederick County, 674 F.Supp. 1172, 1174 (D.Md.1987)(interpreting Burbank as limited to preemption of noise regulations and upholding broad zoningregulations).265 14 C.F.R. section 161.266 14 C.F.R. section 161.5.267 Ibid.
V-16
Thus, so long as state regulations of ground-level aircraft operation are notintended to curtail noise pollution, and do not impinge on safety requirements nor onFAA regulations regarding such topics as takeoffs and landings, it is possible that statesor political subdivisions would have the authority to impose such regulations. However,it is likely that the FAA would protest any such regulation, and that courts may besympathetic to the FAA’ s claims that such regulation was preempted. Further, the FAAhas defined safety broadly, and there are indications that the courts would agree. In atleast one instance, an airport convinced environmental regulators that requiring towing ofaircraft from the gate was beyond the authority of the airport to implement, since theFAA maintained “ preemptory control” over “ operating procedures.” 268
C.3 Regulations on the Number of Operations at Airports
States may not regulate either the number of takeoffs or landings at an airport norlimit the performance of ground operations. The Federal Aviation Act would almostcertainly preempt regulating the number of takeoffs and landings.269 State regulationlimiting the performance of the number of operations would, with almost equal certainty,be found to violate the preemption provisions of the ADA, since they would be a stateregulation of airline services. Thus, neither of these options is available to states.
C.4 Limiting Flight Procedures
States may not limit flight procedures by requiring, for example, reduced use ofreverse thrust on landing or requiring derated takeoffs. Such procedures are clearlywithin the jurisdiction of the FAA, which regulates flight safety. Thus, the FederalAviation Act would preempt such regulations. In addition, imposing such requirementsand the court challenge they would provoke could result in unfavorable law, since theCourts have not to this point determined the breadth of preemption under the FederalAviation Act.
C.5 Controls on Types of Planes Using the Airport
It is unlikely that states could control the types of planes using airports (forexample, requiring that only certain planes known to have low emissions may use theairport), even at airports where they are proprietors. This was, in effect, the strategy usedin Burbank, where the airport limited the times that certain planes could use the airport.Although its decision was limited to preemption because of noise regulation, the Courtalso noted that such a curfew would have deleterious effects on the FAA’ s control oftraffic flow. Limiting planes on the basis of their emissions characteristics would appearto have the same effect, and thus would likely result in preemption.
268 Airports Council International - North America, (hereafter ACI-NA, 2001), Environmental RegulationsImpacting Airports, available at: <http://www.aci-na.org/new_website/frame_publications.html>, 2001.269 See Burbank (finding regulation disallowing takeoffs or landings during certain hours invalid and notingthat it would “ severely limit the flexibility of the FAA in controlling traffic flow.” ).
V-17
C.6 State Petition
States may petition the EPA to set stricter standards for aircraft engine emissions,and the Agency’ s denial of such a petition would be reviewable by the U.S. Circuit Court(see above). If the EPA were to deny the petition, it would have to set forth its reasonsfor doing so, and the petitioner could then seek judicial review.270 Oljato set a procedurewhere, when an Agency had promulgated a standard under the Clean Air Act and theperiod for appeal of that standard under section 307 had passed, an interested party couldpetition the Agency for revision of the standard. In order to do so, “ [t]he person seekingrevision of a standard of performance . . . should petition EPA to revise the standard inquestion. The petition should be submitted together with supporting materials, orreferences to supporting materials.” 271
These materials must include “ new information” on which the petition forrevision is based. Only material that became available after the promulgation of thestandard and the review period had passed would be allowed. Failure to base the petitionon new information would, essentially, be a challenge to the original promulgation of thestandard. Such a challenge is not permitted after the review period set forth in section307 has passed.
In the case of aircraft engine emissions, the states might consider petitioning notonly the EPA, but also the DOT. While the DOT does not have the power to revisestandards, EPA’ s ability to promulgate new standards without DOT cooperation would belimited, at best. Note that there is no explicit procedure for petitioning both agencies.
C.7 State Limits on Emissions from Ground Support Equipment (GSE)
States may be able to limit emissions of GSE, as part of the promulgation of theirSIPs, so long as the limitations do not create an “ emissions standard” for new, nonroadengines. However, decisions by the First and Second Circuits make such stateregulations problematic. Also, in 2000, the Texas Natural Resource ConservationCommission (TNRCC) promulgated rules requiring emissions reductions, specifically ofNOX, by owners or operators of GSE at specified airports (see Chapter IV). The AirTransport Association sued, claiming that the regulations were preempted by section209(e) of the CAA and by the Federal Aviation Act and ADA. The parties settled the suitout of court, and the claims of the ATA were never adjudicated. However, there is areasonable chance that the TNRRC and similar plans would not be preempted.
The Clean Air Act
Section 209(e)(2) addresses nonroad equipment other than locomotives andconstruction and farm machinery. It does not expressly prohibit state regulation of other“ new” nonroad equipment. Instead, it provides that EPA shall authorize California toadopt and enforce emissions standards for nonroad engines, and allows other states toadopt emissions standards identical to those promulgated by California. As discussedabove, EPA issued regulations interpreting this section providing that “ states are notprecluded under section 209 from regulating the use and operation of nonroad engines,
270 Oljato at 666.271 Ibid.
V-18
such as regulations on hours and use, daily mass emission limits or sulfur limits onfuel.” 272 This portion of the rules was upheld by the Court of Appeals for the D.C.Circuit. The Court also found that the implied preemption found in section 209(e)(2)extends to new and existing nonroad equipment. Thus, the states cannot promulgate“ standards or other regulations” “ relating to the control of emissions from nonroadequipment.”
The question, then, is whether the TNRRC plan was a “ standard” “ relating to thecontrol of emissions” or was an “ in-use limit on operation.” California v. Navy is againinstructive, since the Ninth Circuit Court of Appeals held that “ if the state pollutionregulations can be met without affecting the design, structure, operation, or performanceof the aircraft engine, then the state emission regulations are not preempted by section233.” 273 Note that operation of the engine and operation of the equipment in which theengine is installed are two different matters.
Several recent decisions are more problematic. In American AutomobileManufacturers Assoc. v. Cahill, the Second Circuit was faced with deciding whether NewYork State’ s requirement that a certain percentage of automobiles sold in that state bezero-emission vehicles (“ ZEVs” ) was preempted under section 209(a) of the CAA. NewYork State claimed that the requirement was not a “ standard relating to the control ofemissions” and thus was not preempted. The Second Circuit disagreed, reasoning that:
To be sure, the ZEV sales requirement does not imposeprecise overall quantitative limits on levels of emissions, asdo the classification system and fleet averages. It mandatesonly that a specified percentage of the cars sold by amanufacturer in any model year be ZEVs. Nonetheless, theZEV sales requirement must be considered a standard“ relating to the control of emissions.” ZEV, after all,stands for “ zero-emission vehicle“ and a requirement that aparticular percentage of vehicle sales be ZEVs has nopurpose other than to effect a general reduction inemissions.274
The First Circuit, in Association of Int’ l. Automobile Manufacturers, Inc. v.Commissioner, agreed with the Second Circuit, finding that Massachusetts’ imposition ofZEV mandates was a “ standard relating to the control of emissions, and thus preempted.The Court noted that “ [r]ather than simply monitoring or enforcing compliance withsome distinct numerical emissions standard, the very purpose and effect of the ZEVmandates is to effect a quantitative reduction in emissions.” 275 These decisions are, ofcourse, controlling law in the First and Second Circuits, encompassing the northeaststates. It is difficult to conclude that any regulation that is aimed specifically at reducing
272 59 FR 31306.273 California v. Navy, 1980.274 American Automobile Manufacturers Assoc. v. Cahill, (hereafter Cahill), 152 F.2d 196, 200 (2d Cir.1998).275 Association of Int’ l. Automobile Manufacturers, Inc. v. Commissioner, (hereafter Commissioner), 208F.3d 1, 7 (1st Cir. 2000).
V-19
emissions from GSE in these states will be upheld. However, there are recentdevelopments in other parts of the country that indicate more flexibility.
A recent U.S. District Court decision gives more reason for optimism for theability of states to regulate GSE emissions. In 2000, the South Coast Air QualityManagement District (SCAQMD) promulgated rules mandating that, when certainoperators of local fleets purchased or replaced fleet vehicles, they acquire only specificvehicles designated by SCAQMD. The Engine Manufacturers Association (EMA) filedsuit, claiming that the fleet rules were preempted by section 209 of the CAA. TheDistrict Court disagreed, finding that “ [t]he Rules impose no new emission requirementson manufacturers whatsoever, and therefore do not run afoul of Congress’ s purposebehind motor vehicle preemption: namely, the protection of manufacturers against havingto build engines in compliance with a multiplicity of standards.” 276 The Court also foundthat “ [r]ather than impose any numerical control on new vehicles, the rules regulate thepurchase of previously certified vehicles.” 277 Thus, the court reasoned, this case wasdistinguishable from Cahill and Commissioner. Since the fleet rules did not regulatesales by manufacturers, but purchases, they were not “ standards” within the meaning ofsection 209. Therefore, states were not preempted from introducing such requirements.It must be pointed out that the California Court did not address the ruling by the FirstCircuit that if the “ purpose and effect” of the regulations is to achieve a “ quantitativereduction in emissions” the rule is impermissible under section 209.
The EPA, in a “ clarification” of comments to the rules proposed by the TNRCC,adopted a somewhat similar line of reasoning in concluding that the CAA did notpreempt the rules. The EPA reasoned, without reference to any case law, that because thefleet operators had alternatives available that did not require them to make modificationsto the equipment (including measures to restrict emissions by restricting the use oroperation of the equipment), the rules were not “ standards” within the meaning of theCAA.
Given the SCAQMD decision, a rule requiring operators of GSE fleets topurchase alternative fuel or electric vehicles might be upheld so long as such vehicleswere elsewhere defined. Of course, a state that had not adopted the California standardsfor Super Ultra Low Emissions Vehicles (SULEVs) and Ultra Low Emissions Vehicles(ULEVs) could not dictate that owners of fleets of GSE purchase vehicles meeting thosestandards. That would presumably amount to imposing a new emissions limitation. Suchstates could still require that fleet owners purchase only alternative-fueled vehicles,without dictating specific emissions standards those vehicles would have to meet. In theNortheast, however, Cahill and Commissioner dictate that a regulation intended toachieve a quantitative reduction in emissions from GSE will be overturned as preemptive.Although an argument might be made that this subverts Congressional intent, theestablished law in these circuits is, for the moment, clear.
276 Engine Manufacturers Association v. South Coast Air Quality Management District, (hereafterSCAQMD) CV 00-09065 FMC, (Slip Op. at 7)(C.D. Ca. August 21, 2001).277 Ibid.
V-20
The Airline Deregulation Act
It is doubtful that rules similar to those adopted by the TNRCC would bepreempted under the ADA, although a valid argument could be constructed for theopposite point of view. Because the rules would not constitute an “ economic regulation,”they may well escape preemption as being too “ tenuous, remote, or peripheral” to airlinerates and services (see section B.2 above). Support might be found in the Ninth Circuit’ sopinion in Federal Express that California highway and safety regulations still applied totrucks operated by an airline. However, some could argue that GSE were necessary inorder to provide airline service at all, and thus any regulation of GSE was a regulation ofservices. While it is unlikely that the ADA would be construed so broadly, it is difficultto be definitive about this interpretation in the absence of relevant case law.
Other Provisions of the Federal Aviation Act
An argument that other provisions of the Federal Aviation Act preempt regulationof GSE relies on a field preemption argument. The argument about whether there ispreemption relies on the same discussion as the state regulation of ground-leveloperations of aircraft. Here the argument that there is no federal preemption isconsiderably stronger. The FAA does not closely regulate GSE, and no provision of theFederal Aviation Act discusses GSE. Hence, it does not appear that the Federal AviationAct would preempt state regulation of GSE.
C.8 Regulation of Ground Access Vehicles
Some portion of the pollution at airports is caused by GAV including buses, taxis,and private automobiles (see Chapter II). Proposals for limiting emissions from GAVinclude requiring commercial GAV to be fueled by alternative fuels, setting emissionsstandards for GAV fleets, or imposing idle restrictions on GAV. Notably, there isnothing unique about GAV because they are associated with airports. States have thesame freedom and limitations in regulating cars, buses and taxis as they would if theywere not contributors to airport pollution. The exception to this is that states may haveincreased power as the proprietors of airports to restrict or otherwise regulate GAV.
In regulating GAV emissions, states are restricted to regulating the use ofautomobiles at airports (controlling traffic flow, prohibit idling, etc.).278 Of course, astate could, as the proprietor of an airport, ban private automobiles, but such a step wouldbe politically unpalatable, even if legally acceptable.
Alternative Fuels
As noted above, at least one federal court has upheld a California plan requiringfleet operators, when purchasing new or replacing retired fleet vehicles, to purchase onlyvehicles meeting the definition of alternative fuel vehicles (which includes a requirementthat the vehicle attain at least ULEV standards).279 It appears that states that have 278 The states may seek to regulate traffic flow by including Transportation Control Measures in their SIP.279 “ Alternative-fueled vehicle” is defined in the court decision as “ a vehicle or engine that is not poweredby gasoline or diesel fuel and emits hydrocarbon, carbon monoxide, or nitrogen oxides, on an individualbasis at least equivalent to or lower than a ULEV based on [C]ARB’ s certification data.” “ Alternative-fuelheavy-duty vehicle” is defined as a heavy-duty vehicle or engine not powered by diesel fuel and meetingthe emissions requirements of CARB’ s Urban Transit Bus Rule.
V-21
adopted the California standards for LEV, ULEV, and SULEV could promulgate similarrules with equal success.280 In states that have not adopted the California standards, suchrules could not specify a particular emissions limit, since that would likely be construedas a preempted emissions standard. It would seem that such states could definealternative-fueled vehicle, and require fleets to purchase those vehicles. The definition ofalternative-fueled vehicle could not include an emissions standard that vehicles wouldhave to meet; thus, such a regulation might only be effective if the alternative-fueledvehicles were inherently lower in emissions than the vehicles they replaced.
States that are proprietors of airports could impose requirements on fleetsoperating within the airport with impunity, even if they had not adopted the Californiastandards. While such a rule could not be promulgated in a SIP, but would have to beissued by the airport authority itself, there does not appear to be a preemption problem,because the state would not be acting under authority of its police power.
Fleet Emissions Requirements
As discussed above in relation to GSE, it is possible that a fleet emissionrequirement could be established, so long as a fleet operator had options available to meetthe requirement without modifying the engines in question. That same analysis applies toGAV. As a legal strategy, fleet emissions requirements are not without risk, since thereare no legal decisions clearly establishing a state right to impose such requirements.
Idle Restrictions
There are no legal obstacles to imposing idle restrictions, since the CAA and otherstatutes do not impinge on states’ historic powers to regulate traffic and safety. Althoughit has an environmental purpose, a statute restricting idling would likely be viewed as atraffic regulation and would survive legal challenge. Most states and localities have someform of idling restrictions.
C.9 Landing Fees
Two options have been suggested under the rubric of landing fees (see ChapterIV). In an “ increased fee” system, landing fees would be increased to cover the cost ofairport emissions reduction projects. The basis for the landing fee, however, would stillbe aircraft weight. In an “ emissions-based fee” system, planes landing at the airport withgreater emissions would pay a proportionally higher fee.
State Action
The Anti-Head Tax Act (AHTA) provides that:
A State or political subdivision of a State may levy orcollect a tax on or related to a flight of a commercialaircraft or an activity or service on the aircraft only if the
280 This is different from the ULEV, SULEV, and LEV requirements in states that have adopted theCalifornia standards. It would require that these vehicles be purchased in a particular area (i.e., fleetsserving an airport), whereas the ULEV, SULEV, and LEV requirements specify that the manufactures mustsell a certain percentage of these vehicles in a given state.
V-22
aircraft takes off or lands in the State or politicalsubdivision as part of the flight.281
Because the statute discusses “ taxes” and “ fees,” separately (see below), andbecause the statute explicitly permits states to charge landing fees on aircraft operatorsusing airports owned or operated by the state, a landing fee would probably not bepermissible as a “ tax” under this section. Thus, landing fees charged by states areimpermissible unless they are imposed on airports that the state (or a politicalsubdivision) owns or operates.282
Actions as Owners or Proprietors of Airports
The AHTA provides that “ [e]xcept as provided in subsection (d) of this section, aState or political subdivision of a State may levy or collect . . . reasonable . . . landingfees . . . from aircraft operators for using airport facilities of an airport owned or operatedby that State or subdivision.” 283 Subsection (d) does not permit states to “ levy or collecta . . . fee . . . first taking effect after August 23, 1994, exclusively upon any businesslocated at a commercial service airport or operating as a permittee of such an airportother than a . . . fee . . . wholly utilized for airport or aeronautical purposes.”
Although this statute has not been interpreted in its new form, it would appear toallow a state operating an airport (or a political subdivision of a state operating anaircraft) to impose a landing fee so long as that fee was “ reasonable” and so long as thatfee was used wholly for “ airport or aeronautical purposes.” 284
Reasonable Charges
What makes a fee “ reasonable” has not been fully defined. The Supreme Courtestablished a three-part test. In order to be reasonable, the fee must: (1) be based onsome fair approximation of use of the facilities; (2) not be excessive in relation to thebenefits conferred; and (3) not discriminate against interstate commerce.285
In 1994, Congress passed 49 U.S.C. § 47129, which required the Secretary ofTransportation to publish standards that the DOT would use to determine whether a feewas reasonable. In 1996, the DOT published a “ Final Policy Regarding Airport Ratesand Charges.” 286 The Air Transport Association and the City of Los Angeles both soughtjudicial review of the policy. The Court of Appeals for the District of Columbia vacatedportions of the policy, finding it “ much too rough to withstand judicial review . . .” 287
That part of the policy left in place, however, included the DOT’ s policyregarding environmental costs. As stated in Policy Statement Paragraph 2.4.2: 281 49 U.S.C. § 40116(c).282 For purposes of the Act, the definition of “ state” includes “ a political authority of at least 2 states.” Forexample, the Port Authority of New York and New Jersey would be considered a state, whereas, theMassachusetts Port Authority, and similarly statute-created semi-public authorities, would be considered a“ political subdivision” of the state.283 49 U.S.C. § 40116(e)(2).284 There is some doubt whether an airline would be considered a “ business located at a commercialservice airport,” but that statute is less than a model of clarity on this point.285 Northwest Airlines v. County of Kent, Michigan, 114 S.Ct. 855 (1994).286 61 FR 31994.287 Air Transport Association of America v. Dep’ t of Transportation, 119 F.3d 38, 45 (D.C. Cir. 1997).
V-23
Airport proprietors may include reasonable environmentalcosts in the rate base to the extent that the airport proprietorincurs a corresponding actual expense. All revenuesreceived based on the inclusion of these costs in the ratebase are subject to Federal requirements on the use ofairport revenue. Reasonable environmental costs include,but are not necessarily limited to, the following:
(a) the costs of investigating and remediatingenvironmental contamination caused by airfield operationsat the airport at least to the extent that such investigation orremediation is required by or consistent with local, state orfederal environmental law, and to the extent suchrequirements are applied to other similarly situatedenterprises.
(b) the cost of mitigating the environmental impact of anairport development project (if the development project isone for which costs may be included in the rate base), atleast to the extent that these costs are incurred in order tosecure necessary approvals for such projects, including butnot limited to approvals under the National EnvironmentalPolicy Act and similar state statutes;
(c) the costs of aircraft noise abatement and mitigationmeasures, both on and off the airport, including but notlimited to land acquisition and acoustical insulationexpenses, to the extent that such measures are undertakenas part of a comprehensive and publicly-disclosed airportnoise compatibility program; and
(d) the costs of insuring against future liability forenvironmental contamination caused by current airfieldactivities. Under this provision, the costs of self-insurancemay be included in the rate base only to the extent that theyare incurred pursuant to a self-insurance program thatconforms to applicable standards for self-insurancepractices.
An argument could be made that emissions based landing fees are a “ cost” of“ remediating environmental contamination caused by airfield operations.” Althoughsome may argue that ongoing pollution is not what is intended by “ contamination,”reducing the pollution caused by aircraft use is certainly “ consistent” with state andfederal law. Further, the policy explicitly notes that reasonable environmental costs arenot limited to those enumerated.
In the context of an airport expansion, it appears that the imposition of landingfees based on emissions would fit more comfortably under the guidelines, since it wouldbe necessary for the airport to mitigate the effects of the expansion (including theincreased emissions caused by more flights).
V-24
Other sections of the policy offer at least some guidance for what is consideredreasonable. The policy explicitly states that a single approach is not required for ratesetting. Fees may be set by any methodology, “ as long as the methodology used isapplied consistently to similarly situated aeronautical users and conforms with . . . thispolicy.” 288 Although fees may not discriminate against aeronautical users, an airportproprietor may make “ reasonable distinctions” between aeronautical users, and a “ peakpricing system” would not be considered discriminatory.289
Thus, an emissions-based landing fee would not be considered unreasonable solong as it were properly structured and could be shown to be related to the costs ofmitigating pollution caused by the airport.
Airport Purposes
In the absence of any authority interpreting whether an emissions based fee mustbe one that is “ wholly used for airport services,” there is reluctance to conclude that thislanguage does not apply. However, it seems evident that the costs of mitigating pollutioncaused by the airport would be considered “ wholly used for airport services.” The feesextracted from the airlines would have to be used to remediate on-site pollution. Forexample, a landing fee applied to assist car rental agencies in purchasing LNG-poweredbuses would likely be permissible, since that is an “ airport purpose.” The use of suchlanding fees for assisting school bus operators to purchase LNG-powered buses wouldlikely not be permissible, since the school bus was not used for “ airport purposes” . Thisraises the question of whether fees used to purchase off-site credits to offset on-sitepollution would be considered “ wholly used for airport services.” There is a validargument on both sides of the question. The airlines could argue that the fees imposed onthem are not being used to mitigate airport pollution, but to subsidize pollution control atentirely remote sites. The airport could contend that the fees were being used for anairport purpose in that the pollution credits purchased were intended to mitigate on-sitepollution. Both arguments have convincing aspects, and this issue may eventually reachthe courts.
Prohibition by Part 191
As briefly discussed above in Section C.1, landing fees are subject to Part 161.Regulations subject to Part 161 include “ a program of airport use charges that has thedirect or indirect effect of controlling airport noise.” 290 Since aircraft without advancedpollution control devices may also be without noise control devices, fees aimed atreducing air pollution may also control noise and thus be subject to Part 161. Forrestrictions of Stage 2 aircraft, Part 161 requires a notice of public comment period, aswell as a detailed analysis of the proposed restriction.291 For restrictions on Stage 3aircraft, Part 161 requires the airport operator to reach an agreement with all aircraftoperators that the fee is applied to, provides a notice and comment period, and requiresFAA approval. Thus far, it does not appear that any restrictions have been approved by
288 Policy Statement par. 2.1.289 Ibid, par. 3.1.1, 3.2.290 14 C.F.R. section 161.5.291 14 C.F.R. section 161.201 et seq.
V-25
the FAA under Part 161. Thus, although a more complete analysis is required, Part 161appears to pose significant obstacle to the imposition of a landing fee system.
Preemption Under Other Statutes
Some have argued that emissions based landing fees would be preempted undercurrent statutes. Because Congress has explicitly permitted states, as proprietors ofairports, to impose fees in accordance with the law, other federal law cannot preemptsuch fees.
C.10 Regulation of “Airport Bubbles”
It has been proposed that the state could regulate total emissions from an airportby regulating an “ airport bubble.” That is, the state would consider all of the emissionsarising from the airport, no matter what their source, and set a total cap on the emissions.The airport proprietor would then have to develop a plan to reduce emissions to levels nogreater than the level of the cap.
This approach raises some issues regarding the source of the state authority toregulate an airport bubble. The CAA provides that stationary sources may be regulatedusing the “ bubble” concept, but although the question has never been directly litigated, itis clear that airports are not stationary sources under the Act.292 Further, at least oneCircuit Court has held that a facility cannot be a stationary source and an indirectsource.293 According to this interpretation, airports could not be regulated as a stationarysource.
It appears that the only source of authority is the state’ s power, under the CAA, toregulate “ indirect sources” of pollution. As discussed above, airports likely qualify as“ indirect sources” under the CAA. The decision “ whether and how to regulate [indirectsources] is left largely to the states.” 294 According to the CAA, the power of the states islimited to including “ indirect source review programs” in a SIP. An “ indirect sourcereview program” is defined as the “ facility-by-facility review of indirect sources of airpollution, including such measures as are necessary to assure, or assist in assuring, that anew or modified indirect source will not attract mobile sources of air pollution” so as tocause compliance problems. Thus, state power would be limited to “ new or modified”airports. The relevant section of the CAA does not define what a “ modified indirectsource” is, and this issue does not appear to have been the subject of litigation. It wouldappear that any airport expansion projects involving, for example, the addition of arunway, would be a “ modification” subject to review. The definition of an indirectsource may vary slightly in the states that currently have indirect source reviews.Generally, states establish a de minimus threshold for indirect sources (e.g., activities thatincrease aircraft operations by 1,000). An indirect source permit could be required fromthe state for such projects.
292 See Natural Resources Defense Council v. U.S. Environmental Protection Agency, 725 F.2d 761 (D.C.Cir. 1984). In this case EPA’ s original regulation of sources included airports.293 Larson.294 Sierra Club v. Larsen, (hereafter Larsen), 2 F.3d 462, 467 (1st Cir. 1993).
V-26
With the pressure for airport expansion, the limit of indirect source review to newor modified airports may not be as large a hurdle as it first appears. A number of airportsthroughout the nation are in the process of applying for expansion, or are expected toexpand and could thereby provide an opportunity to utilize this provision. If the indirectsource will cause compliance problems when modified (which may occur due to airportexpansion), the state can require mitigation measures.295 Such measures could include alimit on the total emissions of certain pollutants at the airport.
The “ airport bubble” concept could be a powerful tool for states to reduceemissions from airports that seek to expand. Plans for expansion are being considered ata number of the largest airports in the country.296 However, in the absence of airportefforts to expand, there does not appear to be a source of authority for states to imposeemissions caps on airports. This question, however, certainly deserves further research.
C.11 Other Opportunities for State Involvement
States wield considerable power over airport improvement and expansionprograms. Even given the recent severe downturn in the aviation industry, pressure onmajor metropolitan airports to expand is likely to remain considerable. Generally, airportexpansion programs are subject to environmental review under state and federal law.This provides an opportunity for states and airport authorities to formulate “ voluntary”and “ cooperative” programs for environmental mitigation, including programs informedby the airport bubble concept. For instance, the Massachusetts Port Authority (Massport)recently instituted an “ Air Quality Initiative” which, according to Massport, arose out ofdiscussions with state environmental regulators. It is unclear whether a program similarto the AQI could have been imposed in the event Massport failed to voluntarily instituteit. It seems clear that Massport was agreeable to the AQI because of its need forregulatory approval of a proposed airport expansion.
The certification process under the Airport and Airway Development Act isanother area of potential state involvement. Under this Act, the Governor is responsiblefor issuing a certification stating that certain projects at an airport “ …will be located,designed, constructed, and operated so as to comply with applicable air and water qualitystandards.” Through this process there is opportunity to develop cooperative programswhen airports seek certification for adding or extending runways. This approach hasalready been used at Sacramento International Airport.297
States also may have a number of opportunities to encourage the actions taken bydecision makers. In developing the U.S. position for upcoming ICAO meetings, draftpapers undergo consultations in the Interagency Group on International Aviation (IGIA)process, which includes representatives of federal government agencies and stakeholders(e.g., airlines, manufacturers, environmental organizations, and state organizations).During the course of ICAO meetings, IGIA participants are given updates on the meeting
295 Some analysis has shown that airport expansion can reduce emissions as a result of decreasingcongestion.296 Evaluations are currently being undertaken at over 23 airports or regions where proposals have beenmade for airport modifications, expansions, or the potential development of new airports (DOT, 2001) Inaddition, a variety of airports are expected to undergo changes in the near-future.297 See discussion of Sacramento Airport in Chapter IV for greater detail on this program.
V-27
events and provided a forum to give further input on the U.S. position on specific issuesthat arise during the course of the meetings. Through the IGIA process, states canprovide input into the U.S. position at ICAO meetings relevant to emissions. In addition,other opportunities for state input might arise during the course of the development ofnational legislation (e.g., budget authorizations and AIR-21 reauthorization).
D. Summary
This chapter broadly examined legal issues related to implementing a number ofoptions to reduce aviation-related emissions. Consideration was given to whether aparticular course of action by the states would be pre-empted by federal law. While pre-emption is the chief obstacle, it is by no means the only one for states to consider as theyevaluate the feasibility and practicality of these options. For all the options considered, itis impossible to predict the success or failure of any particular regulation in the abstract.The drafting of that regulation is particularly important in determining whether it willwithstand scrutiny. Based upon this cursory legal analysis, a number of options to reduceaviation-related emissions may be available to states, as follows:
D.1 Aircraft
Efforts are made to establish common international standards for aircraft engineemissions; however, these must be introduced individually by each nation. In addition,nations retain their national sovereignty and can therefore choose to establish more orless stringent standards. The U.S. could theoretically establish more stringent standards,but has typically conformed its standards to those developed by ICAO. Under variousstatutes, States are not allowed to establish emissions standards for aircraft engines,regulate the number of takeoffs or landings at an airport, limit flight procedures, andcontrol the types of planes using airports. However, a number of other state policies tolimit aircraft emissions might be legally permissible. State regulations of ground-leveloperation of aircraft that do not infringe on safety or affect the movement of aircraftcould possibly withstand legal challenge. Claims that such regulation were preempteddue to safety reasons may be upheld by the courts, thus making such an optionunfeasible. In addition, states may petition the EPA to set stricter standards for aircraftengine emissions. States may want to consider petitioning DOT as well, sincecooperation between EPA and DOT on aircraft standards is required.
D.2 Ground Service Equipment
Under the CAA, EPA has sole authority to establish engine emissions standardsfor GSE. However, EPA can authorize California to adopt and enforce emissionsstandards for GSE, and other states may adopt identical emissions standards. States canregulate the use and operation of GSE so long as fleet operators have options availablethat do not require modifications to the equipment. For example, states can establishregulations on hours of use and daily mass emissions limits. When operators of GSEfleets purchase replacement vehicles, recent court rulings suggest that states might beable to require that they purchase alternative fuel or electric vehicles, so long as suchvehicles are elsewhere defined. Under these rulings, a state that had not adopted the
V-28
California standards as to SULEVs and ULEVs could require that fleet owners purchaseonly alternative-fueled vehicles, without dictating specific emissions standards thosevehicles would have to meet. It would appear, however, that this option is not availableto northeastern states (those in the First and Second Circuits) unless restrictive rulings bythose Circuits are overturned.
D.3 Ground Access Vehicles
Emissions standards for private automobiles cannot be imposed by the states.Despite this preemption, an argument could be developed giving states authority toregulate GAV emissions in three ways. First, recent court rulings provide someindication that States that have adopted the California standards for LEV, ULEV, andSULEV could require fleets to purchase vehicles defined by the state as “ alternative-fueled vehicles.” This definition could not define an emissions standard that thosevehicles would have to meet. Second, the airport authority could impose requirements onfleets operating within the airport, so long as a fleet operator had options available tomeet the requirement without modifying the engines in question. Therefore, states thatare proprietors of airports could require that certain commercial vehicles operating at theairport be alternatively fueled. Third, states can regulate the use of automobiles atairports (controlling traffic flow, prohibit idling, etc.).
D.4 Emissions-based Fees
ICAO recommends that emissions-based fees should not be used as a revenue-generating source for countries, and that the charge should be related to costs. The fundscollected from such a charge should be used to mitigate the environmental impact ofaircraft engine emissions. In the U.S., a state that acts as an owner or proprietor of anairport can levy a landing fee for using the airport facility, as long as the fee is“ reasonable” and “ wholly utilized for airport or aeronautical purposes.” While an exactinterpretation of these terms has not been articulated by the courts, examples ofreasonable environmental costs provided by DOT include the costs of: investigating andremediating environmental contamination; mitigating the environmental impact of anairport development project; and insuring against future liability for environmentalcontamination. There is a strong argument that emissions based landing fees are a cost of“ remediating environmental contamination.” In the context of an airport expansion, itcould be argued that the imposition of landing fees based on emissions would benecessary for the airport to mitigate the effects of the expansion, including the increasedemissions caused by more flights. It may be that such fees are subject to the strictures ofPart 161, which would make their imposition problematic.
D.5 Airport “Bubbles”
Under the CAA, an argument could be developed that states can regulate anairport “ bubble” within their power to regulate “ indirect sources” of pollution. Under thisprovision, states can include indirect source review programs in a SIP. This review couldinclude measures to assure that a new or modified indirect source will not attract mobilesources of air pollution so as to cause compliance problems. Thus, a state may be able torequire mitigation measures for “ new or modified airports” if the project will cause

V-29
compliance problems. Such mitigation measures could include a limit on the totalemissions of certain pollutants at the airport. Furthermore, airport expansion programsare subject to environmental review under state and federal law, and this provides anopportunity for states and airport authorities to formulate “ voluntary” and “ cooperative”airport bubbles.

V-30
VI-1
VI. Conclusions
A. Overview
As the relative importance of the airport source sector grows due to declining emissions inother sectors and continuing growth in air travel, it will be necessary to continue seekingopportunities to reduce emissions from aviation-related sources. Many localities are undertakingefforts to reduce emissions in order to comply with or maintain ambient pollution levels belownational health-based standards. Under the more stringent ozone and particulate matter standardsbeing introduced in coming years, significant further reductions in criteria pollutant are likely to beneeded in many locations. To meet these standards, states and locales will require reductions fromall types of emissions sources including airport-related ones. A concerted effort must be undertakenat the international, national, state, local, and airport levels to ensure that new, cleaner technologiesand operational measures are introduced for all airport emissions sources. These initiatives mustensure that airport-related emissions decrease over time.
B. Emission Inventories
Aviation-related sources contribute a variety of emissions of concern, including NOx,hydrocarbons (HC), particulate matter, and air toxics. An inventory analysis conducted for thisreport showed that the total emissions contribution from three airports in the Northeast was alreadysignificant, relative to other major emissions sources in the area. Moreover, given the predictedincrease in aircraft LTO over the next ten years at the three airports studied, and the relatively laxemission standards for aircraft and GSE, emissions are expected to increase at all three airports. AtLogan Airport, total NOx emissions from aircraft, GSE, and APU were estimated at 3,102 tons in1999 and predicted to increase to 3,923 tons in 2010298. At Manchester Airport, NOx emissions areestimated at 239 tons in 1999 and 350 tons in 2010. At Bradley Airport, NOx emissions arepredicted to grow from 803 tons in 1999 to 1,149 tons in 2010. Aircraft emissions alone accountedfor 85 percent to 95 percent of the total emissions inventory for aircraft, GSE, and APU at the threeairports studied. Among types of aircraft, air carrier emissions (i.e. primarily from large commercialjets) dominated the NOx inventory. Given current growth rates and planned controls on existingstationary sources, airport-related NOx emissions will be greater than NOx emissions from thelargest stationary sources (power plants) in the vicinity of the airports studied by 2010.
HC emissions are also projected to grow as activity at the airports increases. For example,HC emissions at Logan are expected to grow from 562 tons in 1999 to 567 tons in 2010. While aircarriers dominate the aircraft NOx inventory, HC emissions from the air taxi category of aircraft(typically smaller, short-haul planes) comprise a larger percent of overall aircraft emissions than inthe case of NOx. Thus any HC and toxic emission reduction strategy should not focus only on aircarriers but must also address air taxi emissions. Estimated toxic emissions, such as benzene and
298 This study commenced before the events of September 11, 2001. Forecasts reflecting these events were released byFAA in March, 2003 and have not been incorporated in this study.
VI-2
formaldehyde, from aircraft operating at the three studied airports exceed those of the largeststationary sources in each of the three states where these airports are located.
State SIP inventories for airport-related NOx and HC differed significantly from theestimates developed as part of this report. In the case of aircraft NOx emissions, state estimateswere 50 percent lower than the NESCAUM estimates. The same is true for HC with the exception ofManchester Airport, which reported higher HC emissions than this inventory.
The differences in the NESCAUM and state estimates are due to the incorporation of localdata on mixing heights, new data on take-off time, and more exact assumptions about theaircraft/engine fleet mix. New versions of the widely used aircraft emissions model EDMS shouldincorporate these new data to improve state airport-related emissions inventories.
C. Technical and Operational Control Measures
Due to the variety of emissions sources at airports, policymakers must consider controlstrategies for various types of equipment, operations, and functions. Cost-effective technical andoperational options are available to reduce emissions from all airport sources. Of course, someoptions are more cost effective and easier to implement than others. The cost-effectiveness andfeasibility of the different measures can vary from airport to airport. To take one example, installingelectrified gates can be done more easily at newer airports than at older airports. In addition,consideration needs to be given to potential trade-offs as some technologies can lead to decreases inone pollutant at the expense of another. These complexities need not stand in the way of action, butthey do argue for a careful and comprehensive evaluation of all available options. Some technicalopportunities to reduce aircraft and APU emissions include gate electrification, commercialization ofcomposite, low-weight aircraft bodies, and commercialization of new, more aerodynamic wingdesign. Additionally, operational options are available to reduce aircraft emissions by, for example,improving airline operating efficiency, minimizing congestion, reducing power output, andminimizing taxi times. Similarly, a variety of options exist to reduce emissions from GSE. Theseinclude the use of alternative fuels, electric equipment, and emissions control retrofits. Options forreducing GAV emissions include using cleaner fuels or engines, increasing use of public transitalternatives, reducing employee-related trips, and limiting idling and congestion. Greater use of railservice can also play an important role in efforts to reduce airport-related emissions. Depending onthe program, this option can lead to reductions in emissions from all sources.
Technical measures to reduce aircraft emissions hold the greatest potential emissionsreduction benefit of all options examined in this report. Some of these measures, such as developingand commercializing new more aerodynamic aircraft may take several decades. However,technologies to reduce aircraft engine NOx emissions exist today (such as dual annular combustorsand improved by-pass air ratio) and could be incorporated into further aircraft engine designs.Unfortunately, existing aircraft engine emission standards do not provide much impetus for theincreased use of these technologies. Hence, a shift in the way the standards are structured is neededto further promote the application of these technologies. Operational measures to reduce aircraftengine emissions -- such as single engine taxi and reduce use of reverse thrust -- can generally beundertaken at little cost, though safety considerations, pilot training and airport design may affect theapplicability of these measures in individual situations. Operational practices of this type are already
VI-3
encouraged by many airlines; hence the remaining potential to reduce emissions using operationalstrategies is uncertain.
Electrification holds the greatest promise to reduce GSE emissions and can produce costsavings over time. Of course, not all GSE can be replaced by electric equipment. Switching tonatural gas and propane can also be effective at reducing GSE emissions, but is generally lesspromising than electrification for many types of GSE. Gate electrification and preconditioned aircan also be extremely effective at reducing emissions and can result in cost savings to the operator.Installing these systems is most feasible at airports with sufficient power supply and room for newsystems. Airports with limited power supply and with little room for system installation may not beideal candidates for electrified gates and preconditioned air systems.
Improved intercity rail service also holds some promise for reducing airport-relatedemissions. Programs in Europe and the U.S. to increase rail travel and reduce aircraft traffic havebeen successful and could greatly reduce short airline trips (less than 350 miles) and relatedemissions. Investments in rail infrastructure are needed in order to make rail more competitive withair travel.
D. Policy Approaches
To effectively reduce airport emissions, policymakers should consider developingcomprehensive policy approaches that encourage or require the utilization of both technological andoperational measures. A number of policy approaches are available to state policymakers topromote the use of cleaner technologies and operations. These opportunities include source-specificprograms, market-based approaches, and rail initiatives. Many of these programs have beenundertaken at airports in the U.S. and abroad, as discussed in the case studies section of Chapter IV.
This report highlights a number of source-specific policy approaches that could be used ontheir own or in combination with other source-specific and market-based approaches. Emissionsstandards for both aircraft and GSE could be developed by national and international policymakersto push technology and to better account for the emissions performance of the aircraft as a whole,not just the engine. Activity limits represent a blunt, but potentially effective command-and-controltype regulatory mechanism for limiting airport emissions. Use of this approach may be limited bypolitical considerations and by the difficulty of conditioning activity limits on the differentialemissions characteristics of different sources. Innovative approaches for GSE and GAV could bedesigned to promote or require the purchase of cleaner alternatives when fleet vehicles or equipmentare replaced or added and could incorporate a declining fleet emissions target. Programs focused onreducing private vehicle trips to and from the airport should be developed as a means of reducingoverall emissions in the community. Depending on available transit infrastructure, these effortscould include better connections to transit options and improvements in bus service and rail access.
Properly designed market-based approaches can utilize market forces to encourage theintroduction of cleaner technology and the utilization of emissions reducing operational measures,while providing flexibility in how emissions are reduced and minimizing overall control costs. Afee-based program, similar to the Swiss and Swedish programs, can send a direct price signal tooperators by making it more expensive to utilize higher emitting technologies and operations. Of
VI-4
course, the fee must be sufficiently high to encourage the desired emissions reductions. The use of acap-and-trade, or “ bubble” programs can provide an assurance of eventual environmental benefit andreduce the cost of compliance by allowing for flexibility in how and where emissions reductionsoccur. As in the Logan Airport program—where a cap is placed on total airport emissions and thecost of maintaining emissions below the cap is passed to airlines in the form of higher fees—emissions trading and fee-based programs can be combined.
Expanded high-speed rail could play an important role in future efforts to reduce aviation-related emissions by reducing the number of short-haul flights between certain cities. While theapplicability of high-speed rail varies by location, it nonetheless should be considered whendecision-makers develop short-term and long-term transportation plans.
E. Legal
While statutes and policies at both the international and federal levels provide some clearbarriers to state and local level action, there is room for programs in many cases. In general, stateshave little or no authority to establish emissions standards for engines from aircraft, GSE, and GAV.Despite these barriers, states have a number of opportunities to develop programs that lead toemissions reductions from airport-related sources.
While current standards for aircraft engine emissions are generally set at the internationallevel by ICAO, the U.S. could provide international leadership by promoting or introducing morestringent standards. Some state regulation of aircraft emissions could be permissible despite federalpreemption of aircraft engine emissions standards, provided state regulations pertain to the ground-level operation of aircraft, do not infringe upon safety,and do not affect aircraft movements.Additionally, states may petition the EPA to set stricter standards for aircraft engine emissions.With the exception of California, states are preempted from establishing engine emissions standardsfor GSE. 299 However, they may be able to develop in-use limits on the operation of GSE so long asfleet operators have options available to them that do not require equipment modifications. Anotheroption potentially available to states is to require that operators of GSE fleets purchase alternativefuel or electric vehicles.
Since states cannot establish emissions standards for automobiles, states options for reducingGAV emissions are limited to regulating the operation of automobiles at airports (e.g. controllingtraffic flow, limiting idling, etc.). In some cases, states might also be able institute alternative-fueledvehicle requirements for commercial fleets serving the airport.
Within certain legal constraints, states may be able to introduce market-based measures, suchas airport “ bubbles” and fee-based programs. An emissions-based landing fee would be consideredreasonable so long as it were properly structured and could be shown to be related to the costs ofmitigating pollution caused by airport activities. States may also be permitted to set an absolutelimit on airport emissions as a condition of issuing permits for airport modifications or expansionunder the “ indirect source review” provision of the Clean Air Act.
299 California has the authority under section 209 of the Clean Air Act to establish nonroad engine emission standards forengines with horsepower ratings larger than 175.
VI-5
F. Recommendations
This report is intended to provide information and suggest options useful to policymakers asthey face the challenge of reducing or limiting airport-related emissions. This report does notattempt to articulate concrete policy recommendations, rather it suggests a number of promisingpolicy directions that should be considered in the development of programs to reduce emissions fromairport-related sources. The policy context for each individual airport will depend on a variety offactors specific to the airport, locality, and state – these factors may include differing emissionsneeds, the feasibility of implementing different technological and operational options, and politicalconsiderations. The following general recommendations are made from the findings of this report.
• A detailed emissions inventory can provide useful information on the relativecontribution of specific sources and serve as a sound basis for assessing those priorityareas where emissions reducing programs should be focused. Such inventoriesshould be developed using the most recent data and analysis tools as discussed in thisreport.
• Operators and policymakers should assess and seek means to integrate technologyand operational measures that reduce emissions. A variety of cost-effective measuresare available, but the applicability and cost of the measures will vary by airport.Therefore, consideration should be given to those measures that best fit theopportunities and constraints unique to each airport.
• Innovative or aggressive state programs could speed the introduction anddevelopment of lower emitting technologies such as new types of electric GSE whichwould otherwise not be introduced. The design of airport policies and programs mustgive serious consideration to legal barriers and opportunities. A properly designedprogram could be developed within the legal framework surrounding regulation ofairport-related emissions sources.
• At the federal level, aircraft engine emission standards that encourage both fuelefficiency and reduced criteria pollutant emissions are needed. US EPA should adoptstandards that encourage both. In addition, US EPA and FAA should adoptimprovements to the EDMS model based on the modifications that were developedfor the NESCAUM/EEA model used in this report.

VI-6

References
2
Air France. L'environnement: une préoccupation majeure pour Air France. Air France PressRelease. December 18, 2000.
Air Transport Association. Unpublished data provided to the Project Advisory Team of theFAA/EPP Stakeholder Process. Email and file from Heather Miller, ATA. July 12,2000.
Air Transport Association of America v. Dep’ t of Transportation. 119 F.3d 38, 45 (D.C. Cir.1997).
Airbus Industrie. Global Market Forecast 2000-2019. AI/CP 390.0031/00. Blagnac, France;July 2000.
Airliners.net. Aircraft Data and History Section. Available online at<http://www.airliners.net/info>.
Airports Council International - North America (ACI-NA). Environmental RegulationsImpacting Airports. Available at: <http://www.aci-na.org/new_website/frame_publications.html>. 2001.
Airports Council International (ACI). ACI Traffic Data: World airports ranking by totalmovements-2000 (preliminary). Available online at<http://www.airports.org/traffic/td_movements_doc.html>.
American Automobile Manufacturers Assoc. v. Cahill. 152 F.2d 196, 200 (2d Cir. 1998).
American Airlines, Inc. v. Wolens. 513 U.S. 219 (1995).
Anti-Head Tax Act. 49 U.S.C. 40116. Codified as part of the Federal Aviation Act.
Arthur D. Little, Limited. Study into the Potential Impacts in Technology on the Development ofAir Transport in the UK. Final report to the Department of the Environment, Transport,and Regions (DETR), November, 2000.
Association of Int’ l. Automobile Manufacturers, Inc. v. Commissioner. 208 F.3d 1, 7 (1st Cir.2000).
Barnes and Noble, Inc. The Complete Encyclopedia of World Aircraft. 1999.
Boeing Commercial Airplanes. Current Market Outlook 2001. Seattle, Washington; June 2001.
California Air Resources Board. Air Pollution Mitigation Measures For Airports And AssociatedActivity. Energy and Environmental Analysis, Inc. May 1994.
3
California Air Resources Board. Assessment of Airport Ground Equipment Using Electric Poweror Low-Emitting Fuels. ARCADIS Geraghty & Miller. California: 1999.
California Air Resources Board. The California State Implementation Plan for Ozone: VolumeII. Adopted November 15, 1994.
California v. Navy, 431 F.Supp. 1271, 1285 (N.D. Ca. 1977)(aff’ d 624 F.2d 885 (9th Cir. 1980)).
California v. Navy. 624 F.2d 885, 888 (9th Cir. 1980).
California Fed. Savings and Loan Assoc. v. Guerra. 479 U.S. 272, 280 (1986).
City of Burbank v. Lockheed Air Terminal, Inc. 411 U.S. 624 (1973).
Code of Massachusetts Regulation (CMR). 310 CMR 7.00.
Committee on Aviation Environmental Protection, Fifth Meeting (CAEP/5). Market-basedmeasures: Report from Working Group 5 to the Fifth Meeting of the Committee onAviation Environmental Protection. Information Paper 22. International Civil AviationOrganization. December 2000.
Energy and Environmental Analysis, Inc. Analysis of Techniques to Reduce Air Emissions atAirports. September, 1997.
Engine Manufacturers Ass’ n v EPA. 88 F.3d 1075, 1094 (1996).
Engine Manufacturers Association v. South Coast Air Quality Management District. CV 00-09065 FMC, (Slip Op. at 7)(C.D. Ca. August 21, 2001).
European Federation for Transport and Environment. Aviation and its impact on theEnvironment. December 1999.
Faux-Burhans v. County Comm’ rs of Frederick County. 674 F.Supp. 1172, 1174 (D.Md. 1987).
Federal Express Corp. v. California Public Utilities Comm’ n. 936 F.2d 1075 (9th Cir. 1991).
Federal Republic of Germany. German Transportation Report. 2000.
Friends of the Earth. From planes to trains: realizing the potential from shifting short-flights torail. June 2000.
Geneva International Airport. Environmental Report, 1999. 2000.
Heroy-Rogalski, Kim and Jim Humphries. Evaluation of Air Pollution Emission ReductionMeasures at Sacramento International Airport. Presented at Clean Airport Summit. April12-14, 1999.
4
Hillsborough County v. Automated Medical Laboratories, Inc. 471 U.S. 710, 713 (1985).Industrial Economics. Analysis of Techniques to Reduce Air Emissions at Airports. Energy and
Environmental Analysis, Inc. September 1997.
INFRAS, Consulting Group for Policy Analysis and Implementation and IWW, UniversitaetKarlsruhe. External Costs of Transport: Accident, Environmental and Congestion Costsin Western Europe. March 2000.
International Civil Aviation Organization (ICAO). Convention on International Civil Aviation.Signed on 7 December 1944.
ICAO. Council Resolution on Environmental Charges and Taxes. Adopted by CouncilDecember 9, 1996.
ICAO. Engine Exhaust Emissions Data Bank. Available at <http://www.dera.gov.uk/aviation-emissions-databank.htm>.
ICAO. 33rd Assembly, A33-7. Adopted September 2001.
Jet Information Services. World Aircraft Inventory, Year-End 1999. Woodinville, WA, March,2000.
Lee, J. J., Lukachko, S. P., Waitz, Ian, A., and Schafer, A. “ Historical and Future Trends inAircraft Performance, Cost and Emissions,” Annual Review of Energy and theEnvironment. Volume 26, 2001
Lukachco, Stephen P. and Ian A. Waitz. “ Effects of Engine Aging on Aircraft NOx Emissions,”International Gas Turbine and Aeroengine Congress & Exhibition. Orlando, FL, June 2-5, 1997.
Massachusetts Port Authority (Massport). Air Quality Initiative for Boston Logan InternationalAirport. March 2001.
Malefront, Tom. Personal communication of Manchester Airport Flight Schedule for October,2000. October 18, 2000.
Massport. Environmental Status and Planning Report, Boston Logan International Airport.December, 2000.
Massport. Logan Airside Improvements Planning Project, Volume III: Draft EnvironmentalImpact Statement/Report, Technical Appendices A-K. February, 1999.
Massport. OAG Schedules. Available online at <http://www2.oag.com/airports/bos/index.htm>August 30, 2001.
Morales v. Trans World Airlines, Inc. 504 U.S. 374 (1992).
5
Natural Resources Defense Council v. U.S. Environmental Protection Agency. 725 F.2d 761 (D.C. Cir. 1984).
Northwest Airlines v. County of Kent, Michigan. 114 S.Ct. 855 (1994).
Oljato Chapter of the Navajo Tribe v. Train. 515 F.2d 654, 66-67 (D.C. Cir. 1975).
Personal communication with Richard Remington. Amtrak. October 1, 2001.
Rice v. Santa Fe Elevator Corp. 331 U.S. 218 (1947).
Shaw v. Delta Air Lines, Inc. 463 U.S. 85, 95 (1983).Sierra Club v. Larsen. 2 F.3d 462, 467 (1st Cir. 1993).
Society of British Aerospace Companies Limited. Air Travel – Greener by Design, TheTechnology Challenge. The Technology Sub-Group. 2001.
Swedish Civil Aviation Administration (Swedish CAA). Swedish Civil Aviation AdministrationAnnual Report 2000. 2001.
Switzerland Federal Office for Civil Aviation (FOCA). Summary report on first experiencesafter the introduction of emissions related charges in 1997/1998 at Swedish and Swissairports. 2000.
Tagliabue, John. “ Airlines Feel Pressure of Europe’ s Fast Trains.” New York Times 12 August2001:
Tebbetts, Rollin. Personal communication of Bradley Airport Consolidated Master Timetable.June 21, 2001.
Texas Administrative Code (TAC). 30 TAC.
Texas Natural Resources Conservation Commission (TNRCC, 2000a). Dallas/Fort WorthAttainment Demonstration. April, 2000.
TNRCC (2000b). Houston/Galveston Post-1999 Rate-of-Progress and AttainmentDemonstration SIP. December 6, 2000.
TNRCC. Agreed Order Docket No. 2000-0826-SIP.
TNRCC. Agreed Order Docket No. 2000-0827-SIP.
TNRCC. Agreed Order Docket No. 2000-1149-SIP.
TNRCC. Agreed Order Docket No. 2001-0221-AIR.
TNRCC. Agreed Order Docket No. 2001-0222-AIR.
6
TNRCC. Memorandum of Agreement between TNRCC and the City of Houston.
Unique Environmental Services (Unique). Environmental Report 2000: Zurich Airport. May2001.
United States Code (U.S.C). 5 U.S.C.
U.S.C. 42 U.S.C.
U.S.C. 49 U.S.C.
United States Government. Air Transport Agreement between the Government of the UnitedStates of America and the Government of Malta. October, 2000.
United States Department of Transportation. (US DOT), Bureau of Transportation Statistics.Airport Activity Statistics of Certificated Air Carriers, Twelve Months Ending December31, 1999. Washington, DC: 2000.
US DOT, Bureau of Transportation Statistics. Airline On-Time Statistics. Available online at<http://www.bts.gov/ntda/oai/index.shtml>. July 6, 2001.
US DOT. Report to the U.S. Congress on Environmental Review of Airport ImprovementProjects. May 2001.
US Environmental Protection Agency. AP-42, Compilation of Air Pollution Emission Factors,Volume II. Unpublished Working Draft Revision. Washington, D.C. circa 1991.
US EPA. Documentation for the 1996 Base Year National Toxics Inventory for Aircraft Sources.April, 1999.
US EPA. Memo to Chairman Bob Huston from Administrator Gregg Cooke. 2000.
US EPA. Mixing Heights, Wind Speeds, and Potential for Urban Air Pollution Throughout theContiguous United States. 1972.
US EPA. National Air Quality and Emissions Trends Report, 1999. Office of Air QualityPlanning and Standards. March 2001.
US EPA. PCRAMMET Model. Available at<http://www.epa.gov/scram001/tt24.htm#PCRAMMET>. June 19, 2001.
US EPA. Procedures for Emission Inventory Preparation, Volume IV: Mobile Sources.December, 1992.
US EPA. In Proposal for Cleaner Recreational Vehicles. Available at<http://www.epa.gov/otaq/largesi.htm>. Sept. 14, 2001
7
US EPA. Support Center for Regulatory Air Models (SCRAM) Mixing Height Data. Availableat <http://www.epa/gov/scram001/tt24.htm#mixing>. June 19, 2001.
US EPA. Technical Data to Support FAA’s Advisory Circular on Reducing Emissions fromCommercial Aviation. Prepared by Energy and Environmental Analysis. September 29,1995.
United States Federal Aviation Administration (US FAA). Air Quality Procedures for CivilianAirports and Air Force Bases. April 1997.
US FAA. Air Traffic Activity Query System. Available online at <http://www.apo.data.faa.gov>.
US FAA (2000). Terminal Area Forecast: Fiscal Years 2000-2015. US Dept. of Transportation,FAA-APO-00-7, December 2000. Available online at<http://www.apo.data.faa.gov/faatafall.HTM>.
US FAA. Legality of Emission Based Airport Landing Fees, Memo to EPA/FAA StakeholderProcess on June 22, 2000.
US FAA. Technical Data to Support FAA’s Advisory Circular on Reducing Emissions fromCommercial Aviation, Draft Report. Prepared by Energy and Environmental Analysis,Inc. September 29, 1995.
United States Federal Railroad Administration. Available at<http://www.fra.dot.gov/o/hsgt/states/index.htm>. December 2001.
United States Federal Register (US FR). 59 FR 31306, 40 C.F.R. Part 89.
US FR. Final Policy Regarding Airport Rates and Charges. 61 FR 31994.
Waitz, Ian A., Lecture Outline: Aircraft, Gas Turbine Engines and Emissions Primer. 3 August2001.
Wellons v. Northwest Airlines, Inc. 165 F.3d 493, 495 (6th Cir. 1999)(collecting cases).
Wilcox, Richard. Letter to Julie Draper regarding SO2 content of aviation fuel, US FAA.November 22, 2000.
Zurich Airport. Zurich Airport: Aircraft Engine Emission Charges, January 2000.

8
Appendix A: Airports Located in 1-hr and 8-hr OzoneNonattainment and Maintenance Areas
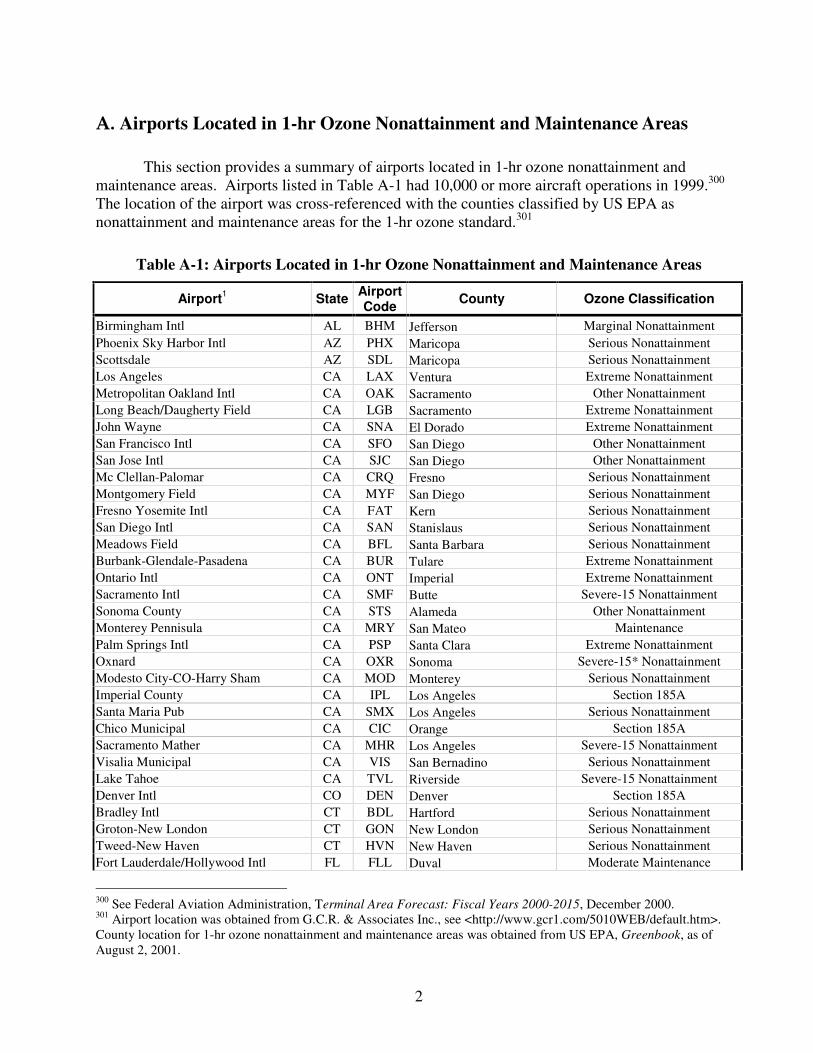
2
A. Airports Located in 1-hr Ozone Nonattainment and Maintenance Areas
This section provides a summary of airports located in 1-hr ozone nonattainment andmaintenance areas. Airports listed in Table A-1 had 10,000 or more aircraft operations in 1999.300
The location of the airport was cross-referenced with the counties classified by US EPA asnonattainment and maintenance areas for the 1-hr ozone standard.301
Table A-1: Airports Located in 1-hr Ozone Nonattainment and Maintenance Areas
Airport1 State AirportCode County Ozone Classification
Birmingham Intl AL BHM Jefferson Marginal NonattainmentPhoenix Sky Harbor Intl AZ PHX Maricopa Serious NonattainmentScottsdale AZ SDL Maricopa Serious NonattainmentLos Angeles CA LAX Ventura Extreme NonattainmentMetropolitan Oakland Intl CA OAK Sacramento Other NonattainmentLong Beach/Daugherty Field CA LGB Sacramento Extreme NonattainmentJohn Wayne CA SNA El Dorado Extreme NonattainmentSan Francisco Intl CA SFO San Diego Other NonattainmentSan Jose Intl CA SJC San Diego Other NonattainmentMc Clellan-Palomar CA CRQ Fresno Serious NonattainmentMontgomery Field CA MYF San Diego Serious NonattainmentFresno Yosemite Intl CA FAT Kern Serious NonattainmentSan Diego Intl CA SAN Stanislaus Serious NonattainmentMeadows Field CA BFL Santa Barbara Serious NonattainmentBurbank-Glendale-Pasadena CA BUR Tulare Extreme NonattainmentOntario Intl CA ONT Imperial Extreme NonattainmentSacramento Intl CA SMF Butte Severe-15 NonattainmentSonoma County CA STS Alameda Other NonattainmentMonterey Pennisula CA MRY San Mateo MaintenancePalm Springs Intl CA PSP Santa Clara Extreme NonattainmentOxnard CA OXR Sonoma Severe-15* NonattainmentModesto City-CO-Harry Sham CA MOD Monterey Serious NonattainmentImperial County CA IPL Los Angeles Section 185ASanta Maria Pub CA SMX Los Angeles Serious NonattainmentChico Municipal CA CIC Orange Section 185ASacramento Mather CA MHR Los Angeles Severe-15 NonattainmentVisalia Municipal CA VIS San Bernadino Serious NonattainmentLake Tahoe CA TVL Riverside Severe-15 NonattainmentDenver Intl CO DEN Denver Section 185ABradley Intl CT BDL Hartford Serious NonattainmentGroton-New London CT GON New London Serious NonattainmentTweed-New Haven CT HVN New Haven Serious NonattainmentFort Lauderdale/Hollywood Intl FL FLL Duval Moderate Maintenance
300 See Federal Aviation Administration, Terminal Area Forecast: Fiscal Years 2000-2015, December 2000.301 Airport location was obtained from G.C.R. & Associates Inc., see <http://www.gcr1.com/5010WEB/default.htm>.County location for 1-hr ozone nonattainment and maintenance areas was obtained from US EPA, Greenbook, as ofAugust 2, 2001.
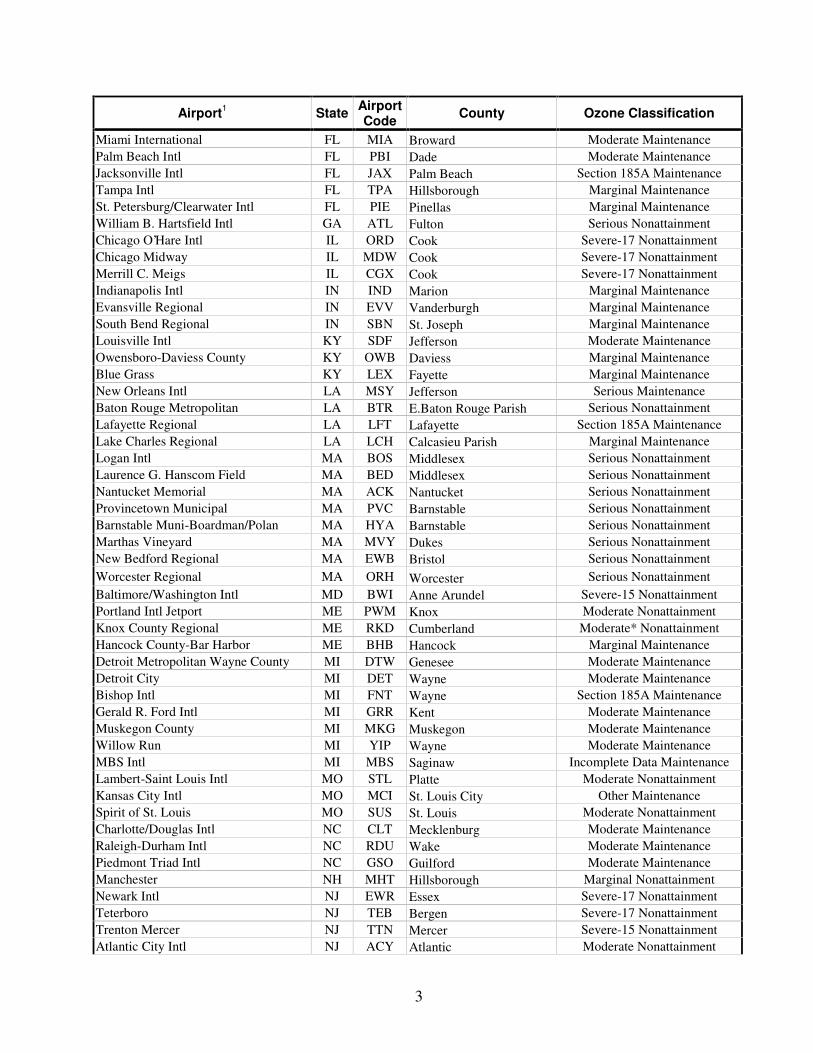
3
Airport1 State AirportCode County Ozone Classification
Miami International FL MIA Broward Moderate MaintenancePalm Beach Intl FL PBI Dade Moderate MaintenanceJacksonville Intl FL JAX Palm Beach Section 185A MaintenanceTampa Intl FL TPA Hillsborough Marginal MaintenanceSt. Petersburg/Clearwater Intl FL PIE Pinellas Marginal MaintenanceWilliam B. Hartsfield Intl GA ATL Fulton Serious NonattainmentChicago O’Hare Intl IL ORD Cook Severe-17 NonattainmentChicago Midway IL MDW Cook Severe-17 NonattainmentMerrill C. Meigs IL CGX Cook Severe-17 NonattainmentIndianapolis Intl IN IND Marion Marginal MaintenanceEvansville Regional IN EVV Vanderburgh Marginal MaintenanceSouth Bend Regional IN SBN St. Joseph Marginal MaintenanceLouisville Intl KY SDF Jefferson Moderate MaintenanceOwensboro-Daviess County KY OWB Daviess Marginal MaintenanceBlue Grass KY LEX Fayette Marginal MaintenanceNew Orleans Intl LA MSY Jefferson Serious MaintenanceBaton Rouge Metropolitan LA BTR E.Baton Rouge Parish Serious NonattainmentLafayette Regional LA LFT Lafayette Section 185A MaintenanceLake Charles Regional LA LCH Calcasieu Parish Marginal MaintenanceLogan Intl MA BOS Middlesex Serious NonattainmentLaurence G. Hanscom Field MA BED Middlesex Serious NonattainmentNantucket Memorial MA ACK Nantucket Serious NonattainmentProvincetown Municipal MA PVC Barnstable Serious NonattainmentBarnstable Muni-Boardman/Polan MA HYA Barnstable Serious NonattainmentMarthas Vineyard MA MVY Dukes Serious NonattainmentNew Bedford Regional MA EWB Bristol Serious NonattainmentWorcester Regional MA ORH Worcester Serious NonattainmentBaltimore/Washington Intl MD BWI Anne Arundel Severe-15 NonattainmentPortland Intl Jetport ME PWM Knox Moderate NonattainmentKnox County Regional ME RKD Cumberland Moderate* NonattainmentHancock County-Bar Harbor ME BHB Hancock Marginal MaintenanceDetroit Metropolitan Wayne County MI DTW Genesee Moderate MaintenanceDetroit City MI DET Wayne Moderate MaintenanceBishop Intl MI FNT Wayne Section 185A MaintenanceGerald R. Ford Intl MI GRR Kent Moderate MaintenanceMuskegon County MI MKG Muskegon Moderate MaintenanceWillow Run MI YIP Wayne Moderate MaintenanceMBS Intl MI MBS Saginaw Incomplete Data MaintenanceLambert-Saint Louis Intl MO STL Platte Moderate NonattainmentKansas City Intl MO MCI St. Louis City Other MaintenanceSpirit of St. Louis MO SUS St. Louis Moderate NonattainmentCharlotte/Douglas Intl NC CLT Mecklenburg Moderate MaintenanceRaleigh-Durham Intl NC RDU Wake Moderate MaintenancePiedmont Triad Intl NC GSO Guilford Moderate MaintenanceManchester NH MHT Hillsborough Marginal NonattainmentNewark Intl NJ EWR Essex Severe-17 NonattainmentTeterboro NJ TEB Bergen Severe-17 NonattainmentTrenton Mercer NJ TTN Mercer Severe-15 NonattainmentAtlantic City Intl NJ ACY Atlantic Moderate Nonattainment
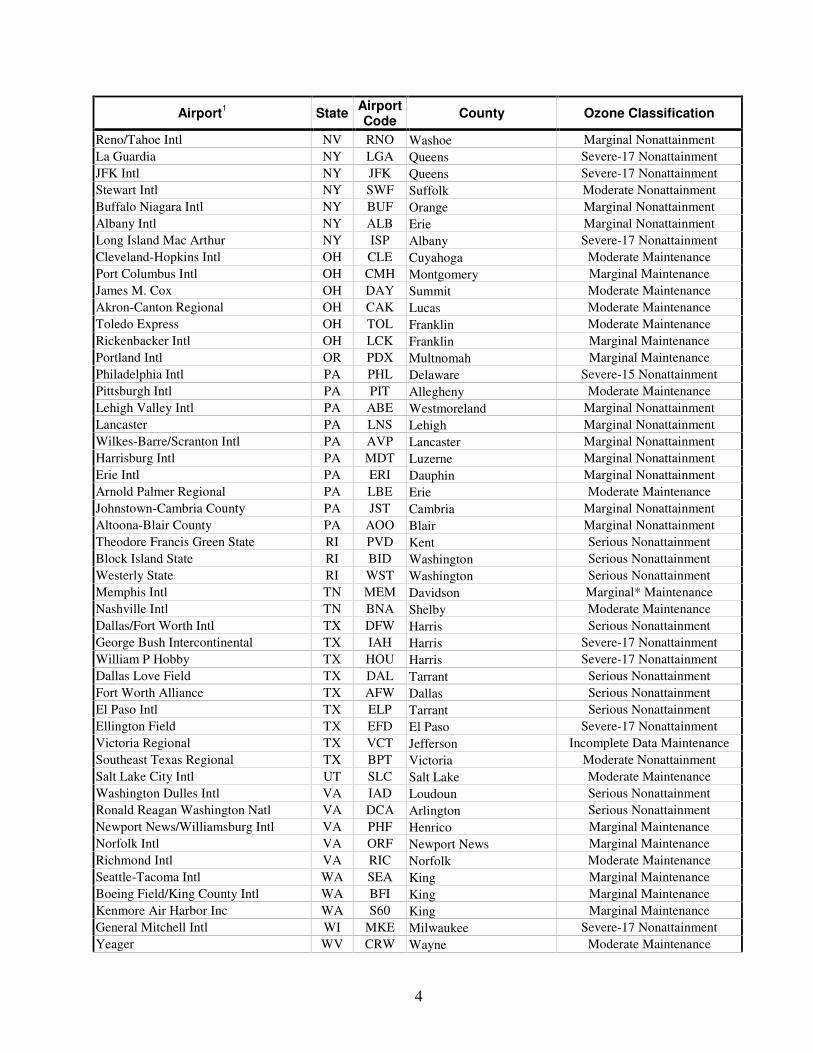
4
Airport1 State AirportCode County Ozone Classification
Reno/Tahoe Intl NV RNO Washoe Marginal NonattainmentLa Guardia NY LGA Queens Severe-17 NonattainmentJFK Intl NY JFK Queens Severe-17 NonattainmentStewart Intl NY SWF Suffolk Moderate NonattainmentBuffalo Niagara Intl NY BUF Orange Marginal NonattainmentAlbany Intl NY ALB Erie Marginal NonattainmentLong Island Mac Arthur NY ISP Albany Severe-17 NonattainmentCleveland-Hopkins Intl OH CLE Cuyahoga Moderate MaintenancePort Columbus Intl OH CMH Montgomery Marginal MaintenanceJames M. Cox OH DAY Summit Moderate MaintenanceAkron-Canton Regional OH CAK Lucas Moderate MaintenanceToledo Express OH TOL Franklin Moderate MaintenanceRickenbacker Intl OH LCK Franklin Marginal MaintenancePortland Intl OR PDX Multnomah Marginal MaintenancePhiladelphia Intl PA PHL Delaware Severe-15 NonattainmentPittsburgh Intl PA PIT Allegheny Moderate MaintenanceLehigh Valley Intl PA ABE Westmoreland Marginal NonattainmentLancaster PA LNS Lehigh Marginal NonattainmentWilkes-Barre/Scranton Intl PA AVP Lancaster Marginal NonattainmentHarrisburg Intl PA MDT Luzerne Marginal NonattainmentErie Intl PA ERI Dauphin Marginal NonattainmentArnold Palmer Regional PA LBE Erie Moderate MaintenanceJohnstown-Cambria County PA JST Cambria Marginal NonattainmentAltoona-Blair County PA AOO Blair Marginal NonattainmentTheodore Francis Green State RI PVD Kent Serious NonattainmentBlock Island State RI BID Washington Serious NonattainmentWesterly State RI WST Washington Serious NonattainmentMemphis Intl TN MEM Davidson Marginal* MaintenanceNashville Intl TN BNA Shelby Moderate MaintenanceDallas/Fort Worth Intl TX DFW Harris Serious NonattainmentGeorge Bush Intercontinental TX IAH Harris Severe-17 NonattainmentWilliam P Hobby TX HOU Harris Severe-17 NonattainmentDallas Love Field TX DAL Tarrant Serious NonattainmentFort Worth Alliance TX AFW Dallas Serious NonattainmentEl Paso Intl TX ELP Tarrant Serious NonattainmentEllington Field TX EFD El Paso Severe-17 NonattainmentVictoria Regional TX VCT Jefferson Incomplete Data MaintenanceSoutheast Texas Regional TX BPT Victoria Moderate NonattainmentSalt Lake City Intl UT SLC Salt Lake Moderate MaintenanceWashington Dulles Intl VA IAD Loudoun Serious NonattainmentRonald Reagan Washington Natl VA DCA Arlington Serious NonattainmentNewport News/Williamsburg Intl VA PHF Henrico Marginal MaintenanceNorfolk Intl VA ORF Newport News Marginal MaintenanceRichmond Intl VA RIC Norfolk Moderate MaintenanceSeattle-Tacoma Intl WA SEA King Marginal MaintenanceBoeing Field/King County Intl WA BFI King Marginal MaintenanceKenmore Air Harbor Inc WA S60 King Marginal MaintenanceGeneral Mitchell Intl WI MKE Milwaukee Severe-17 NonattainmentYeager WV CRW Wayne Moderate Maintenance
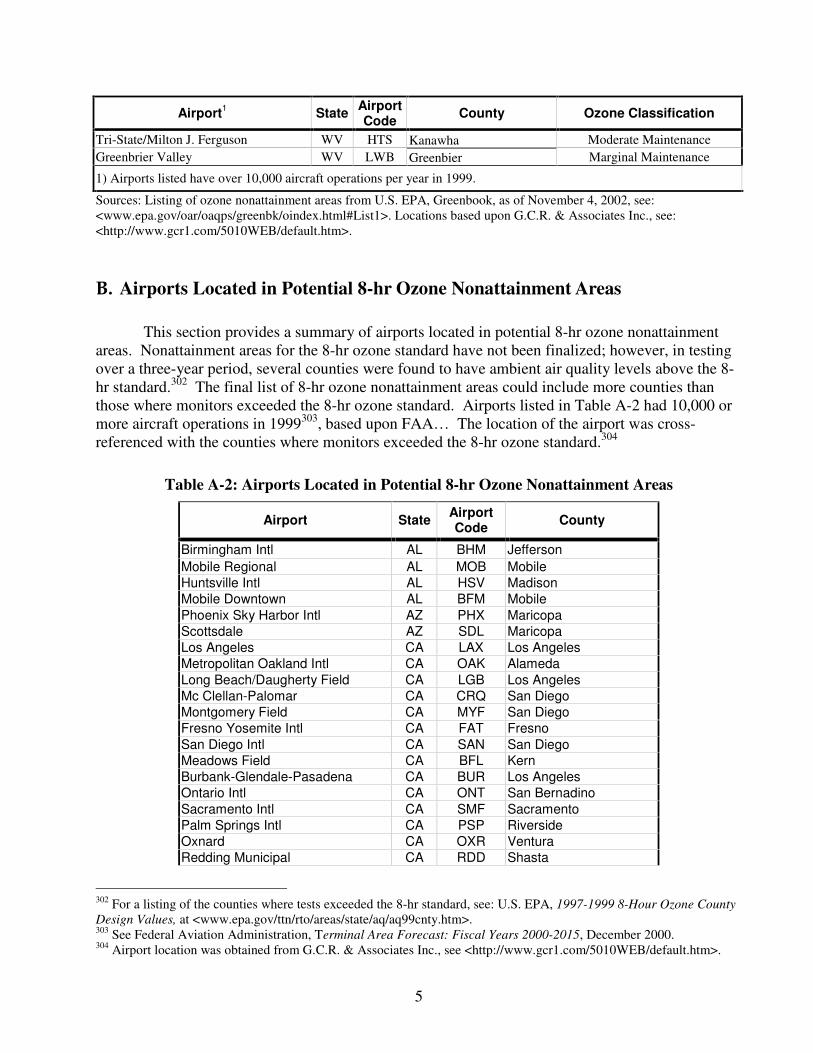
5
Airport1 State AirportCode County Ozone Classification
Tri-State/Milton J. Ferguson WV HTS Kanawha Moderate MaintenanceGreenbrier Valley WV LWB Greenbier Marginal Maintenance
1) Airports listed have over 10,000 aircraft operations per year in 1999.
Sources: Listing of ozone nonattainment areas from U.S. EPA, Greenbook, as of November 4, 2002, see:<www.epa.gov/oar/oaqps/greenbk/oindex.html#List1>. Locations based upon G.C.R. & Associates Inc., see:<http://www.gcr1.com/5010WEB/default.htm>.
B. Airports Located in Potential 8-hr Ozone Nonattainment Areas
This section provides a summary of airports located in potential 8-hr ozone nonattainmentareas. Nonattainment areas for the 8-hr ozone standard have not been finalized; however, in testingover a three-year period, several counties were found to have ambient air quality levels above the 8-hr standard.302 The final list of 8-hr ozone nonattainment areas could include more counties thanthose where monitors exceeded the 8-hr ozone standard. Airports listed in Table A-2 had 10,000 ormore aircraft operations in 1999303, based upon FAA… The location of the airport was cross-referenced with the counties where monitors exceeded the 8-hr ozone standard.304
Table A-2: Airports Located in Potential 8-hr Ozone Nonattainment Areas
Airport State AirportCode County
Birmingham Intl AL BHM JeffersonMobile Regional AL MOB MobileHuntsville Intl AL HSV MadisonMobile Downtown AL BFM MobilePhoenix Sky Harbor Intl AZ PHX MaricopaScottsdale AZ SDL MaricopaLos Angeles CA LAX Los AngelesMetropolitan Oakland Intl CA OAK AlamedaLong Beach/Daugherty Field CA LGB Los AngelesMc Clellan-Palomar CA CRQ San DiegoMontgomery Field CA MYF San DiegoFresno Yosemite Intl CA FAT FresnoSan Diego Intl CA SAN San DiegoMeadows Field CA BFL KernBurbank-Glendale-Pasadena CA BUR Los AngelesOntario Intl CA ONT San BernadinoSacramento Intl CA SMF SacramentoPalm Springs Intl CA PSP RiversideOxnard CA OXR VenturaRedding Municipal CA RDD Shasta
302 For a listing of the counties where tests exceeded the 8-hr standard, see: U.S. EPA, 1997-1999 8-Hour Ozone CountyDesign Values, at <www.epa.gov/ttn/rto/areas/state/aq/aq99cnty.htm>.303 See Federal Aviation Administration, Terminal Area Forecast: Fiscal Years 2000-2015, December 2000.304 Airport location was obtained from G.C.R. & Associates Inc., see <http://www.gcr1.com/5010WEB/default.htm>.
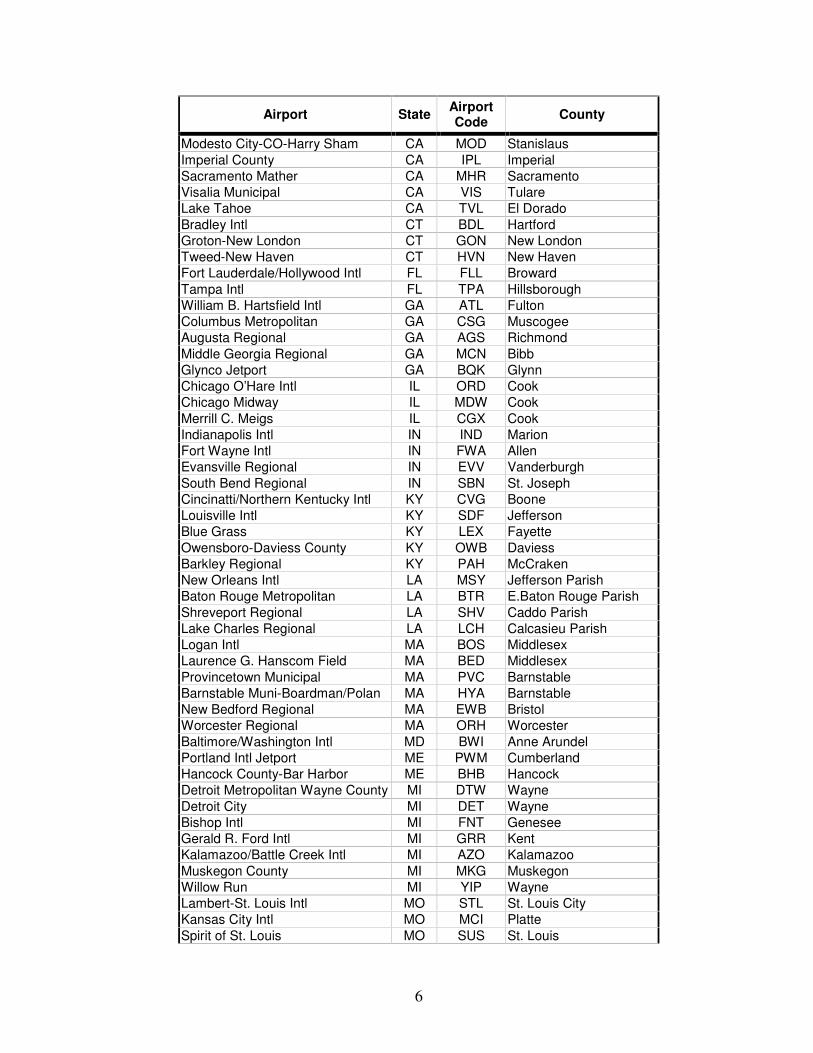
6
Airport State AirportCode County
Modesto City-CO-Harry Sham CA MOD StanislausImperial County CA IPL ImperialSacramento Mather CA MHR SacramentoVisalia Municipal CA VIS TulareLake Tahoe CA TVL El DoradoBradley Intl CT BDL HartfordGroton-New London CT GON New LondonTweed-New Haven CT HVN New HavenFort Lauderdale/Hollywood Intl FL FLL BrowardTampa Intl FL TPA HillsboroughWilliam B. Hartsfield Intl GA ATL FultonColumbus Metropolitan GA CSG MuscogeeAugusta Regional GA AGS RichmondMiddle Georgia Regional GA MCN BibbGlynco Jetport GA BQK GlynnChicago O’Hare Intl IL ORD CookChicago Midway IL MDW CookMerrill C. Meigs IL CGX CookIndianapolis Intl IN IND MarionFort Wayne Intl IN FWA AllenEvansville Regional IN EVV VanderburghSouth Bend Regional IN SBN St. JosephCincinatti/Northern Kentucky Intl KY CVG BooneLouisville Intl KY SDF JeffersonBlue Grass KY LEX FayetteOwensboro-Daviess County KY OWB DaviessBarkley Regional KY PAH McCrakenNew Orleans Intl LA MSY Jefferson ParishBaton Rouge Metropolitan LA BTR E.Baton Rouge ParishShreveport Regional LA SHV Caddo ParishLake Charles Regional LA LCH Calcasieu ParishLogan Intl MA BOS MiddlesexLaurence G. Hanscom Field MA BED MiddlesexProvincetown Municipal MA PVC BarnstableBarnstable Muni-Boardman/Polan MA HYA BarnstableNew Bedford Regional MA EWB BristolWorcester Regional MA ORH WorcesterBaltimore/Washington Intl MD BWI Anne ArundelPortland Intl Jetport ME PWM CumberlandHancock County-Bar Harbor ME BHB HancockDetroit Metropolitan Wayne County MI DTW WayneDetroit City MI DET WayneBishop Intl MI FNT GeneseeGerald R. Ford Intl MI GRR KentKalamazoo/Battle Creek Intl MI AZO KalamazooMuskegon County MI MKG MuskegonWillow Run MI YIP WayneLambert-St. Louis Intl MO STL St. Louis CityKansas City Intl MO MCI PlatteSpirit of St. Louis MO SUS St. Louis
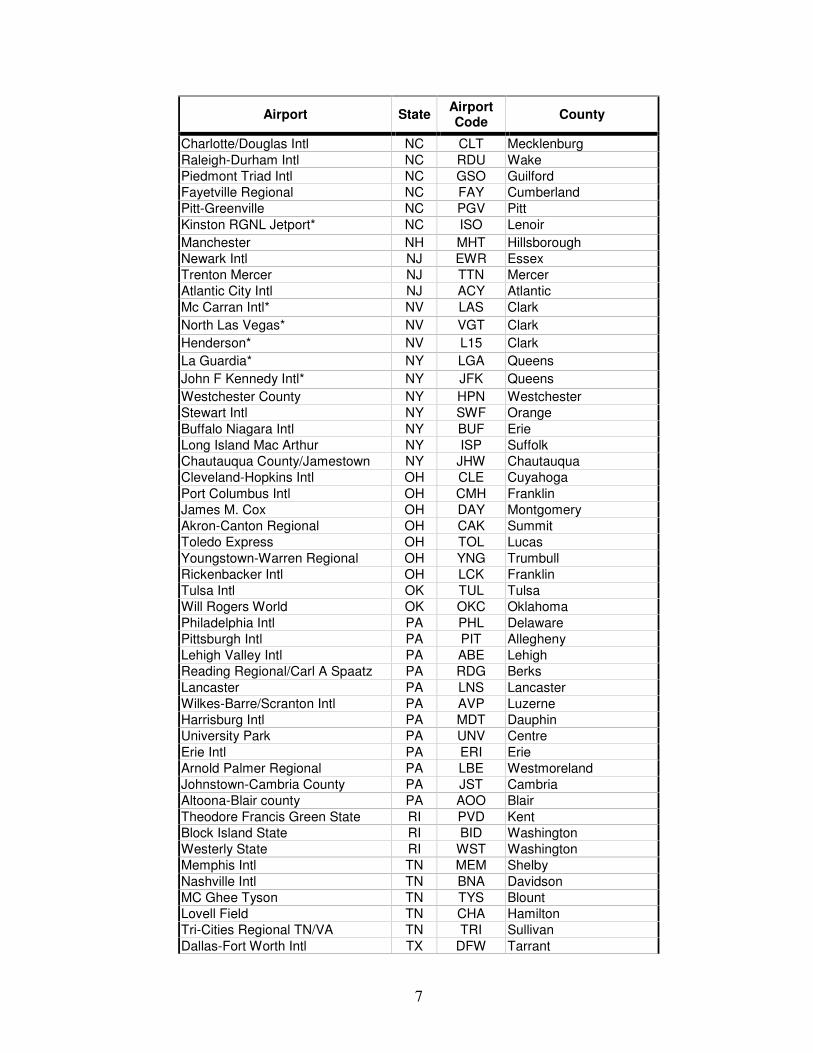
7
Airport State AirportCode County
Charlotte/Douglas Intl NC CLT MecklenburgRaleigh-Durham Intl NC RDU WakePiedmont Triad Intl NC GSO GuilfordFayetville Regional NC FAY CumberlandPitt-Greenville NC PGV PittKinston RGNL Jetport* NC ISO LenoirManchester NH MHT HillsboroughNewark Intl NJ EWR EssexTrenton Mercer NJ TTN MercerAtlantic City Intl NJ ACY AtlanticMc Carran Intl* NV LAS ClarkNorth Las Vegas* NV VGT ClarkHenderson* NV L15 ClarkLa Guardia* NY LGA QueensJohn F Kennedy Intl* NY JFK QueensWestchester County NY HPN WestchesterStewart Intl NY SWF OrangeBuffalo Niagara Intl NY BUF ErieLong Island Mac Arthur NY ISP SuffolkChautauqua County/Jamestown NY JHW ChautauquaCleveland-Hopkins Intl OH CLE CuyahogaPort Columbus Intl OH CMH FranklinJames M. Cox OH DAY MontgomeryAkron-Canton Regional OH CAK SummitToledo Express OH TOL LucasYoungstown-Warren Regional OH YNG TrumbullRickenbacker Intl OH LCK FranklinTulsa Intl OK TUL TulsaWill Rogers World OK OKC OklahomaPhiladelphia Intl PA PHL DelawarePittsburgh Intl PA PIT AlleghenyLehigh Valley Intl PA ABE LehighReading Regional/Carl A Spaatz PA RDG BerksLancaster PA LNS LancasterWilkes-Barre/Scranton Intl PA AVP LuzerneHarrisburg Intl PA MDT DauphinUniversity Park PA UNV CentreErie Intl PA ERI ErieArnold Palmer Regional PA LBE WestmorelandJohnstown-Cambria County PA JST CambriaAltoona-Blair county PA AOO BlairTheodore Francis Green State RI PVD KentBlock Island State RI BID WashingtonWesterly State RI WST WashingtonMemphis Intl TN MEM ShelbyNashville Intl TN BNA DavidsonMC Ghee Tyson TN TYS BlountLovell Field TN CHA HamiltonTri-Cities Regional TN/VA TN TRI SullivanDallas-Fort Worth Intl TX DFW Tarrant
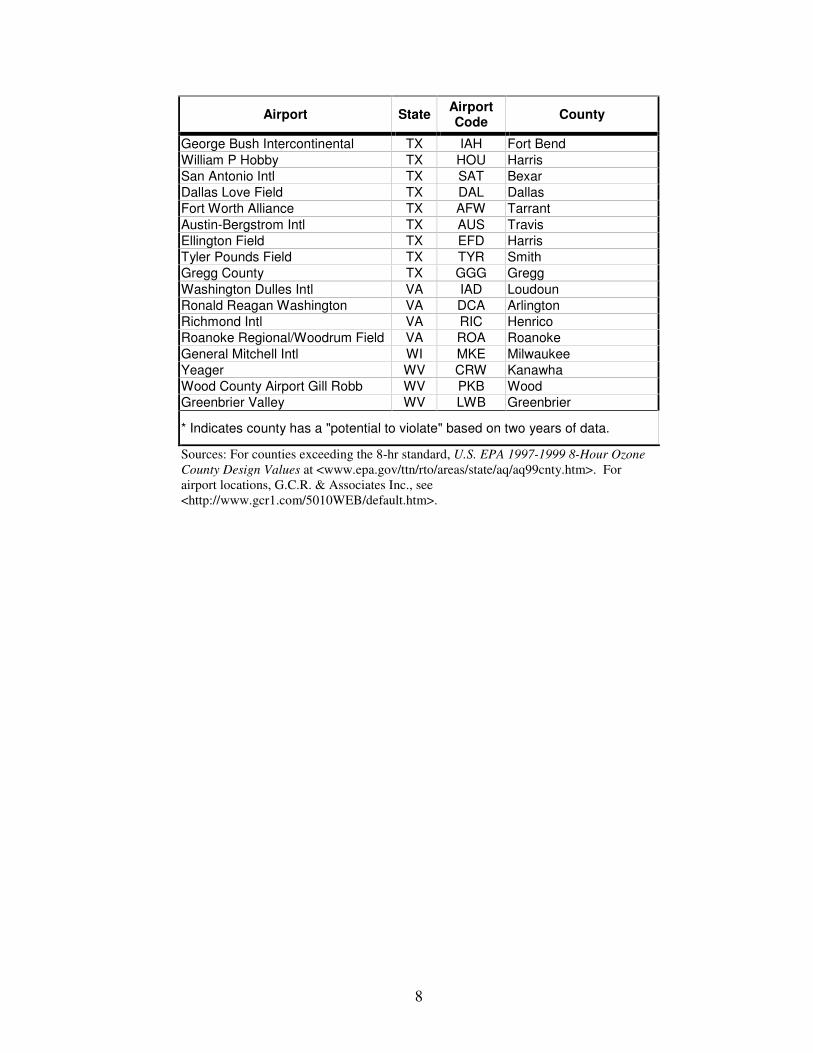
8
Airport State AirportCode County
George Bush Intercontinental TX IAH Fort BendWilliam P Hobby TX HOU HarrisSan Antonio Intl TX SAT BexarDallas Love Field TX DAL DallasFort Worth Alliance TX AFW TarrantAustin-Bergstrom Intl TX AUS TravisEllington Field TX EFD HarrisTyler Pounds Field TX TYR SmithGregg County TX GGG GreggWashington Dulles Intl VA IAD LoudounRonald Reagan Washington VA DCA ArlingtonRichmond Intl VA RIC HenricoRoanoke Regional/Woodrum Field VA ROA RoanokeGeneral Mitchell Intl WI MKE MilwaukeeYeager WV CRW KanawhaWood County Airport Gill Robb WV PKB WoodGreenbrier Valley WV LWB Greenbrier
* Indicates county has a "potential to violate" based on two years of data.
Sources: For counties exceeding the 8-hr standard, U.S. EPA 1997-1999 8-Hour OzoneCounty Design Values at <www.epa.gov/ttn/rto/areas/state/aq/aq99cnty.htm>. Forairport locations, G.C.R. & Associates Inc., see<http://www.gcr1.com/5010WEB/default.htm>.
Appendix B: Emissions Calculations
2
A. Aircraft Emissions Methodology
Aircraft emissions estimates are based on a number of factors, including aircraft and engine fleet mix, engine emission factors, the number of landings and takeoffs (LTOs), and the time spent in each phase of the LTO cycle. Commercial aircraft and air taxi emissions were calculated using weighted averages for each aircraft type owned by each airline (i.e., Continental Boeing 727-200, Continental Boeing 737-300, American Airbus 32-200, etc.), with emission factors from the ICAO Aircraft Engine Exhaust Emissions Data Bank, LTO data from FAA, and time-in-mode data calculated from EPA mixing height data. The detailed calculation for estimating aircraft emissions is described below. The development of data for these calculations for the baseline and forecast years follows.
A.1 Aircraft Emission Calculation
The emissions from one engine for each phase of the LTO cycle are calculated by
)(*)(
)(*
)()(
minmodeinTimemin
lbuseFuellbflowFuellbEmissions
E phase = (1)
where Ephase is the total emissions for that phase, Emissions/Fuel flow and Fuel use/min are engine emission factors from various sources,1,2 and Time in mode is the duration of the phase (as described in Section A.2 below).
The emissions for the entire LTO cycle are determined by
∑=phases
phasecycle EE (2)
where Ecycle is the total emissions for the LTO cycle and the phases are approach, reverse thrust, taxi/idle, take-off, and climbout.
Ecycle is the emissions from one engine, so the emissions from an aircraft, Eaircraft are given by
enginescycleaircraft NEE *= (3)
1 Emission factors for CO, HC, and NOx come from the ICAO Aircraft Engine Exhaust Emissions Data Bank. Emission factors for SO2 come from EPA jet fuel sampling data. Emission factors for toxics come from “Documentation for the 1996 Base Year National Toxics Inventory for Aircraft Sources” and are calculated in an additional step. 2 The CO2 emission factor is calculated by assuming that all carbon in the fuel is emitted as CO2, and that carbon emissions as CO or HC are negligible. (Comparing the numbers in Tables II-5 (HC emissions), B-6 (CO emissions), and B-7 (CO2 emissions) shows that this assumption is reasonable.) CO2 emissions can then be calculated as the weight fraction of carbon in fuel divided by the weight fraction of carbon in CO2. Jet fuel has a C:H ratio of about 1:2; recalling that carbon has an atomic mass of 12 and hydrogen has an atomic mass of 1, jet fuel has a carbon mass fraction of about 12/(12+2). The carbon mass fraction of CO2 is 12/(12+2*16). The mass of CO2 emitted per pound of fuel is then equal to (12 lb C/14 lb fuel)*(44 lb CO2/12 lb C) = 3.14 lb CO2/lb fuel.
3
where Nengines is the number of engines on the plane.
This calculation is performed for all aircraft/engine combinations. Because LTOs are reported by air carrier and aircraft-type (i.e., Continental Boeing 727-200), but not with the engine-type of each plane (Continental’s nine 727-200s have three different engine models), we take a weighted average of the emissions from each type of engine in the air carrier’s fleet, or
typesengineofNumber
EE typesengine
aircraft
aircraft
∑= (4)
where Eaircraft is the weighted average from one model of aircraft and Number of engine types is the number of different engines for that aircraft model owned by the air carrier, from Jet Information Services' World Aircraft Inventory.
The emissions for each airline/aircraft type is multiplied by its associated LTOs, and the results totaled to find the total emissions for the airport, given by
)*(,
aircraftairlineaircraft
aircraftairport LTOEE ∑= (5)
where Eairport is the total emissions at the airport and LTOaircraft is the number of LTOs flown by each aircraft owned by each airline, from US DOT’s annual Airport Activity Statistics of Certificated Air Carriers.
A.2 Data Preparation for 1999 Analysis
The robustness of the NESCAUM analysis is based on the development of detailed data for input to the emissions model. Data was used at the finest level of resolution that was reasonable for calculations. Several sets of inputs were available with daily or monthly data, so data was aggregated into monthly averages and monthly emissions were calculated. This section describes the process for developing input data for the 1999 emissions estimates. The following section describes how the input data were developed for the 2010 emissions estimates.
Fleet Mix
The fleet mix for commercial aircraft was compiled from Jet Information Service’s World Aircraft Inventory. This Inventory included the aircraft owners, the makes and models of aircraft in their fleets, and the engine models on those aircraft. When airline/aircraft combinations were included in the LTO tables but not in the World Aircraft Inventory, the aircraft was assigned the engine most commonly used on that aircraft.
No aircraft-specific LTO figures were available for air taxi or general aviation aircraft; therefore engines and the fraction of single- and multi-engine aircraft were assigned from a national registry. Emissions were calculated using weighted averages of the engines in the national registry.
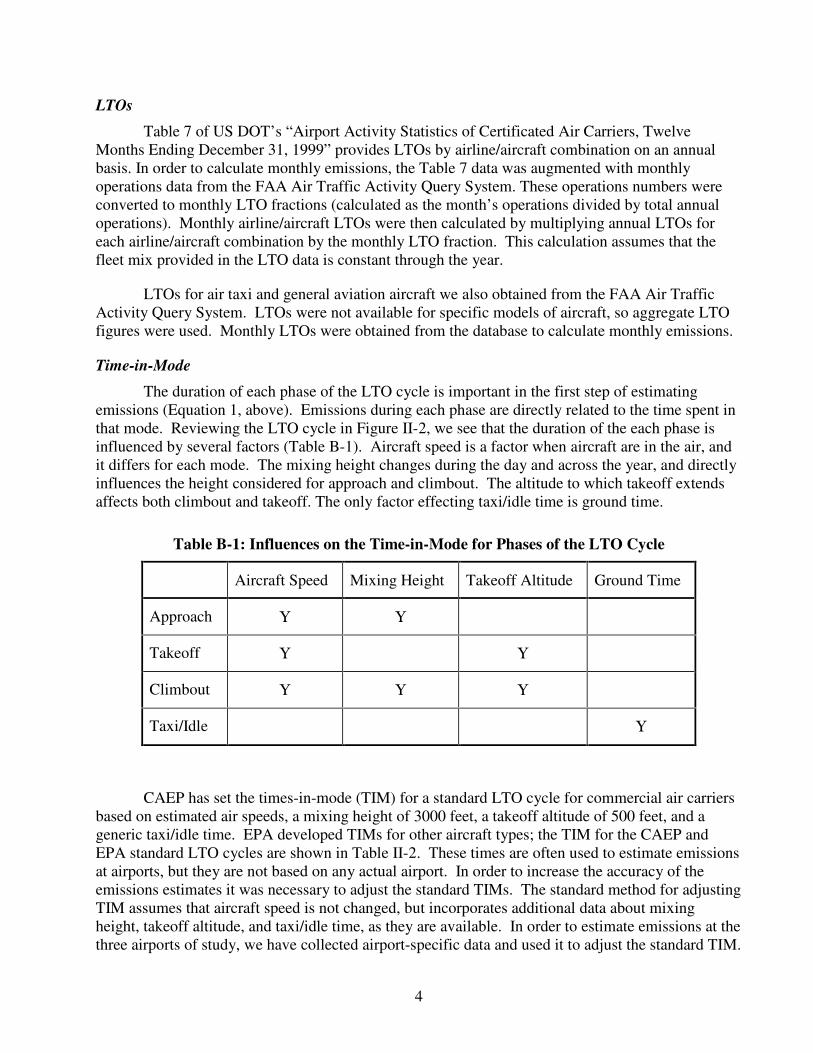
4
LTOs
Table 7 of US DOT’ s “Airport Activity Statistics of Certificated Air Carriers, Twelve Months Ending December 31, 1999” provides LTOs by airline/aircraft combination on an annual basis. In order to calculate monthly emissions, the Table 7 data was augmented with monthly operations data from the FAA Air Traffic Activity Query System. These operations numbers were converted to monthly LTO fractions (calculated as the month’ s operations divided by total annual operations). Monthly airline/aircraft LTOs were then calculated by multiplying annual LTOs for each airline/aircraft combination by the monthly LTO fraction. This calculation assumes that the fleet mix provided in the LTO data is constant through the year.
LTOs for air taxi and general aviation aircraft we also obtained from the FAA Air Traffic Activity Query System. LTOs were not available for specific models of aircraft, so aggregate LTO figures were used. Monthly LTOs were obtained from the database to calculate monthly emissions.
Time-in-Mode
The duration of each phase of the LTO cycle is important in the first step of estimating emissions (Equation 1, above). Emissions during each phase are directly related to the time spent in that mode. Reviewing the LTO cycle in Figure II-2, we see that the duration of the each phase is influenced by several factors (Table B-1). Aircraft speed is a factor when aircraft are in the air, and it differs for each mode. The mixing height changes during the day and across the year, and directly influences the height considered for approach and climbout. The altitude to which takeoff extends affects both climbout and takeoff. The only factor effecting taxi/idle time is ground time.
Table B-1: Influences on the Time-in-Mode for Phases of the LTO Cycle
Aircraft Speed Mixing Height Takeoff Altitude Ground Time
Approach Υ Υ
Takeoff Υ Υ
Climbout Υ Υ Υ
Taxi/Idle Υ
CAEP has set the times-in-mode (TIM) for a standard LTO cycle for commercial air carriers based on estimated air speeds, a mixing height of 3000 feet, a takeoff altitude of 500 feet, and a generic taxi/idle time. EPA developed TIMs for other aircraft types; the TIM for the CAEP and EPA standard LTO cycles are shown in Table II-2. These times are often used to estimate emissions at airports, but they are not based on any actual airport. In order to increase the accuracy of the emissions estimates it was necessary to adjust the standard TIMs. The standard method for adjusting TIM assumes that aircraft speed is not changed, but incorporates additional data about mixing height, takeoff altitude, and taxi/idle time, as they are available. In order to estimate emissions at the three airports of study, we have collected airport-specific data and used it to adjust the standard TIM.
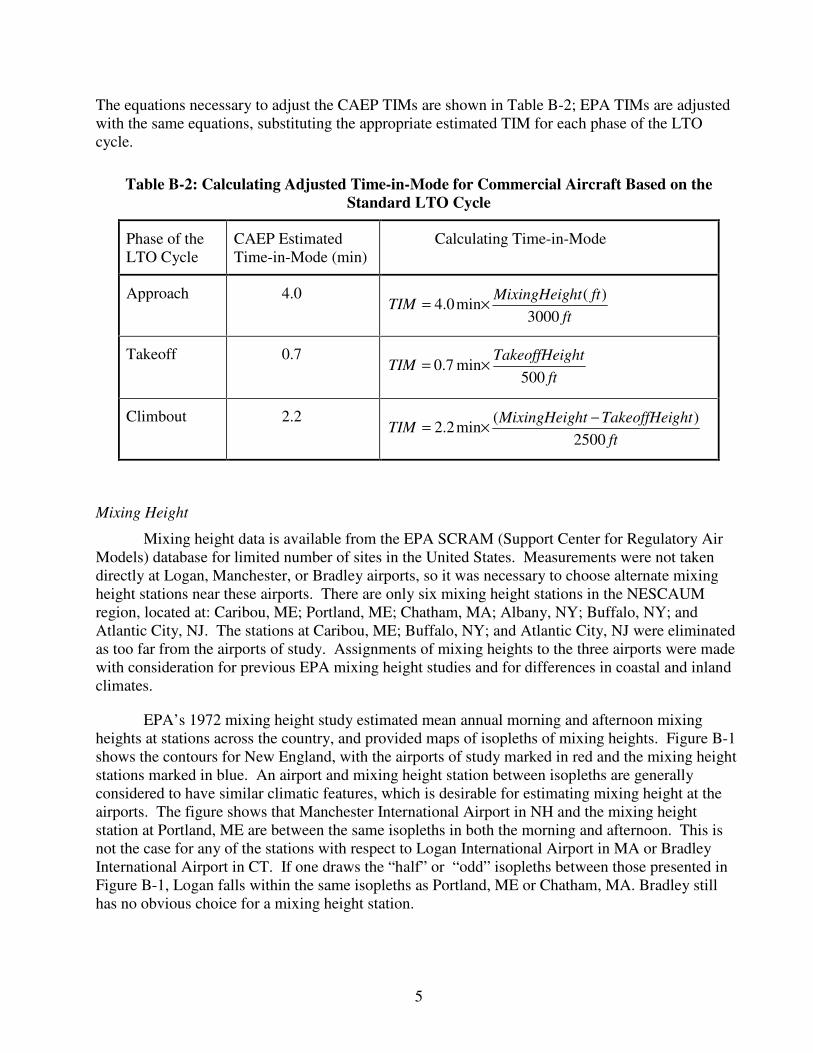
5
The equations necessary to adjust the CAEP TIMs are shown in Table B-2; EPA TIMs are adjusted with the same equations, substituting the appropriate estimated TIM for each phase of the LTO cycle.
Table B-2: Calculating Adjusted Time-in-Mode for Commercial Aircraft Based on the Standard LTO Cycle
Phase of the LTO Cycle
CAEP Estimated Time-in-Mode (min)
Calculating Time-in-Mode
Approach 4.0 ft
fthtMixingHeigTIM
3000)(
min0.4 ×=
Takeoff 0.7 ft
ghtTakeoffHeiTIM
500min7.0 ×=
Climbout 2.2 ft
ghtTakeoffHeihtMixingHeigTIM
2500)(
min2.2−×=
Mixing Height
Mixing height data is available from the EPA SCRAM (Support Center for Regulatory Air Models) database for limited number of sites in the United States. Measurements were not taken directly at Logan, Manchester, or Bradley airports, so it was necessary to choose alternate mixing height stations near these airports. There are only six mixing height stations in the NESCAUM region, located at: Caribou, ME; Portland, ME; Chatham, MA; Albany, NY; Buffalo, NY; and Atlantic City, NJ. The stations at Caribou, ME; Buffalo, NY; and Atlantic City, NJ were eliminated as too far from the airports of study. Assignments of mixing heights to the three airports were made with consideration for previous EPA mixing height studies and for differences in coastal and inland climates.
EPA’ s 1972 mixing height study estimated mean annual morning and afternoon mixing heights at stations across the country, and provided maps of isopleths of mixing heights. Figure B-1 shows the contours for New England, with the airports of study marked in red and the mixing height stations marked in blue. An airport and mixing height station between isopleths are generally considered to have similar climatic features, which is desirable for estimating mixing height at the airports. The figure shows that Manchester International Airport in NH and the mixing height station at Portland, ME are between the same isopleths in both the morning and afternoon. This is not the case for any of the stations with respect to Logan International Airport in MA or Bradley International Airport in CT. If one draws the “half” or “odd” isopleths between those presented in Figure B-1, Logan falls within the same isopleths as Portland, ME or Chatham, MA. Bradley still has no obvious choice for a mixing height station.
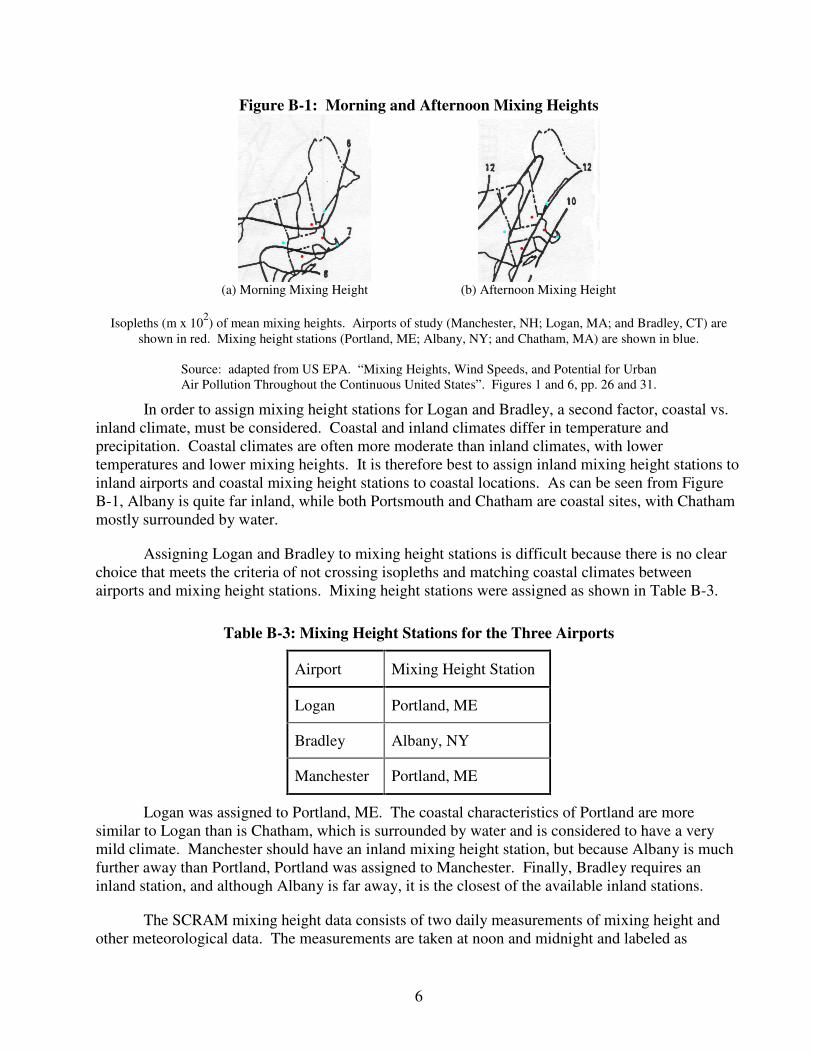
6
Figure B-1: Morning and Afternoon Mixing Heights
(a) Morning Mixing Height (b) Afternoon Mixing Height
Isopleths (m x 102) of mean mixing heights. Airports of study (Manchester, NH; Logan, MA; and Bradley, CT) are
shown in red. Mixing height stations (Portland, ME; Albany, NY; and Chatham, MA) are shown in blue.
Source: adapted from US EPA. “ Mixing Heights, Wind Speeds, and Potential for Urban Air Pollution Throughout the Continuous United States” . Figures 1 and 6, pp. 26 and 31.
In order to assign mixing height stations for Logan and Bradley, a second factor, coastal vs. inland climate, must be considered. Coastal and inland climates differ in temperature and precipitation. Coastal climates are often more moderate than inland climates, with lower temperatures and lower mixing heights. It is therefore best to assign inland mixing height stations to inland airports and coastal mixing height stations to coastal locations. As can be seen from Figure B-1, Albany is quite far inland, while both Portsmouth and Chatham are coastal sites, with Chatham mostly surrounded by water.
Assigning Logan and Bradley to mixing height stations is difficult because there is no clear choice that meets the criteria of not crossing isopleths and matching coastal climates between airports and mixing height stations. Mixing height stations were assigned as shown in Table B-3.
Table B-3: Mixing Height Stations for the Three Airports
Airport Mixing Height Station
Logan Portland, ME
Bradley Albany, NY
Manchester Portland, ME
Logan was assigned to Portland, ME. The coastal characteristics of Portland are more similar to Logan than is Chatham, which is surrounded by water and is considered to have a very mild climate. Manchester should have an inland mixing height station, but because Albany is much further away than Portland, Portland was assigned to Manchester. Finally, Bradley requires an inland station, and although Albany is far away, it is the closest of the available inland stations.
The SCRAM mixing height data consists of two daily measurements of mixing height and other meteorological data. The measurements are taken at noon and midnight and labeled as
7
“ morning” and “ afternoon,” respectively. From these twice-daily measurements and additional meteorological data available from EPA SCRAM, hourly estimates of mixing height were calculated with EPA’ s PCRAMMET model. The average mixing heights for the airports of study were calculated as the average of all mixing heights greater than 10 meters3 between 6am and midnight, averaged for each month. The hours between 6am and midnight were chosen because most airport LTOs take place between these hours.
Takeoff Height
Takeoff profile information obtained from the Air Transport Association as part of the EPA/FAA Stakeholder Process indicates that takeoff may last well past 500 feet, and perhaps as high as 1000 feet. The equations in Table B-2 incorporate alternate takeoff heights in the calculation of times-in-mode.
Taxi Time
Monthly taxi-in and taxi-out statistics for each of the airports were available from DOT’ s Bureau of Transportation Statistics. These statistics include airline-specific taxi times for large carriers as well as an airport average taxi time. The airport averages of taxi-in and taxi-out times were used, and total taxi/idle time was the sum of the taxi-in and taxi-out times.
Average mixing heights and the resulting times-in-mode for climbout and approach were calculated for each month at each of the mixing height stations. The heights and times-in-mode are shown in Table B-4. These calculations incorporate a takeoff height of 1000 feet; takeoff time was always 1.4 minutes.
A.3 Data Preparation for 2010 Emissions Estimates
Data for the 2010 emissions estimate was prepared in a similar manner to the data to 1999; however, making the projection required adjustments to the methods for developing some factors. This section describes how fleet mix, LTOs, and time-in-mode were calculated for 2010.
Fleet Mix
The fleet mix for commercial aircraft was mostly unchanged from the 1999 estimates. Scrappage in airline fleets was accomplished through adjusting LTOs, as described in the next section. The primary assumption made in this analysis was that as planes are phased out of service, their engine types are phased out in equal proportions. Engines for new aircraft are assigned based on contract press releases and similar information obtained from aircraft manufacturers. In instances where multiple contracts have been initiated, each engine is assigned to an equal share of aircraft activity. Finally, for engines that are not yet in production, emission factors for similar current engines (based on thrust) have been substituted.
The fleet mix for air taxi and general aviation aircraft were not changed from the 1999 estimates.
3 The lower limit of 10 meters was selected because the PCRAMMNET program prints a warning when calculated mixing heights are below this height.
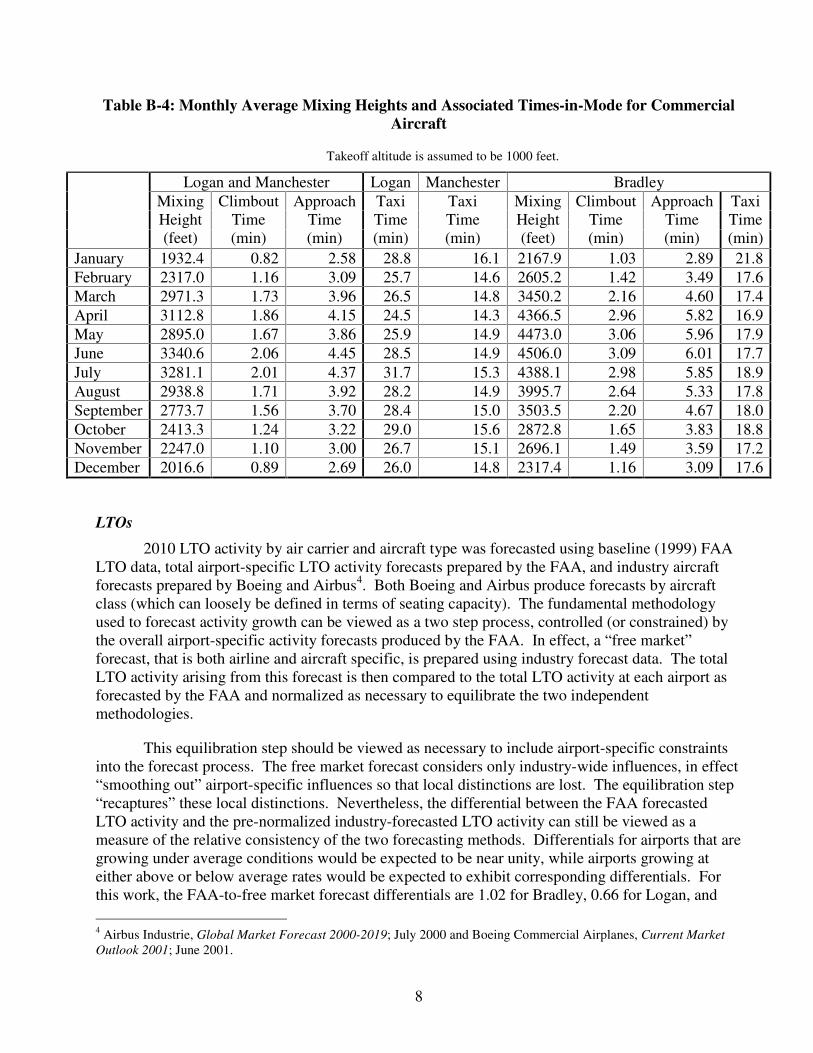
8
Table B-4: Monthly Average Mixing Heights and Associated Times-in-Mode for Commercial Aircraft
Takeoff altitude is assumed to be 1000 feet.
Logan and Manchester Logan Manchester Bradley Mixing Height (feet)
Climbout Time (min)
Approach Time (min)
Taxi Time (min)
Taxi Time (min)
Mixing Height (feet)
Climbout Time (min)
Approach Time (min)
Taxi Time (min)
January 1932.4 0.82 2.58 28.8 16.1 2167.9 1.03 2.89 21.8 February 2317.0 1.16 3.09 25.7 14.6 2605.2 1.42 3.49 17.6 March 2971.3 1.73 3.96 26.5 14.8 3450.2 2.16 4.60 17.4 April 3112.8 1.86 4.15 24.5 14.3 4366.5 2.96 5.82 16.9 May 2895.0 1.67 3.86 25.9 14.9 4473.0 3.06 5.96 17.9 June 3340.6 2.06 4.45 28.5 14.9 4506.0 3.09 6.01 17.7 July 3281.1 2.01 4.37 31.7 15.3 4388.1 2.98 5.85 18.9 August 2938.8 1.71 3.92 28.2 14.9 3995.7 2.64 5.33 17.8 September 2773.7 1.56 3.70 28.4 15.0 3503.5 2.20 4.67 18.0 October 2413.3 1.24 3.22 29.0 15.6 2872.8 1.65 3.83 18.8 November 2247.0 1.10 3.00 26.7 15.1 2696.1 1.49 3.59 17.2 December 2016.6 0.89 2.69 26.0 14.8 2317.4 1.16 3.09 17.6
LTOs
2010 LTO activity by air carrier and aircraft type was forecasted using baseline (1999) FAA LTO data, total airport-specific LTO activity forecasts prepared by the FAA, and industry aircraft forecasts prepared by Boeing and Airbus4. Both Boeing and Airbus produce forecasts by aircraft class (which can loosely be defined in terms of seating capacity). The fundamental methodology used to forecast activity growth can be viewed as a two step process, controlled (or constrained) by the overall airport-specific activity forecasts produced by the FAA. In effect, a “ free market” forecast, that is both airline and aircraft specific, is prepared using industry forecast data. The total LTO activity arising from this forecast is then compared to the total LTO activity at each airport as forecasted by the FAA and normalized as necessary to equilibrate the two independent methodologies.
This equilibration step should be viewed as necessary to include airport-specific constraints into the forecast process. The free market forecast considers only industry-wide influences, in effect “ smoothing out” airport-specific influences so that local distinctions are lost. The equilibration step “ recaptures” these local distinctions. Nevertheless, the differential between the FAA forecasted LTO activity and the pre-normalized industry-forecasted LTO activity can still be viewed as a measure of the relative consistency of the two forecasting methods. Differentials for airports that are growing under average conditions would be expected to be near unity, while airports growing at either above or below average rates would be expected to exhibit corresponding differentials. For this work, the FAA-to-free market forecast differentials are 1.02 for Bradley, 0.66 for Logan, and 4 Airbus Industrie, Global Market Forecast 2000-2019; July 2000 and Boeing Commercial Airplanes, Current Market Outlook 2001; June 2001.
9
1.11 for Manchester. These are quite consistent with expectations, with Manchester growing at a faster than average rate, Bradley growing at a near average rate, and Logan growing at a less than free market rate due to existing airport capacity constraints.
Industry forecasts were converted in airline and airport-specific activity forecasts as follows. It should first be recognized that in combining LTO and aircraft growth data, it was necessarily assumed that the growth in LTO activity would occur at the same rate as growth in aircraft ownership. With this assumption, the initial processing step consists of estimating that fraction of aircraft that will be scrapped between 1999 and 2010 (which corresponds to the expected reduction in associated LTOs). This estimate was produced using an aircraft-specific scrappage model presented in the Airbus forecast. The Airbus scrappage estimate was for 2009-to-1999 and was extrapolated to 2010 for this work. Using the scrappage estimate, the 1999 FAA LTO data for each airport was proportionally adjusted to produce an estimate of the 2010 LTO activity associated with the same airlines and aircraft observed in 1999 (in effect, an estimate of how much LTO activity is associated with the “ non scrapped” portion of the aircraft fleet). Generally, the use of continuing aircraft accounts for 35-40 percent of forecasted 2010 LTOs.
The second step in the free market forecast utilizes the Boeing and Airbus forecast data to calculate aircraft class-specific 1999-2010 growth rates. These growth rates were then applied to the observed 1999 LTO data for each airport to derive total expected 2010 LTO activity. The difference between this forecasted activity and that associated with the non-scrapped fleet (as calculated during the initial processing step previously described) is the LTO activity associated with new and replacement aircraft. It is important to recognize that at this point the relationship between specific airlines and aircraft (based on 1999 FAA observations) ceases. There is no requirement that replacement aircraft be of the same class as scrapped aircraft or that the fleet grow proportionally across classes. In fact, market trends such as the shift toward smaller regional-scale jets dictates that proportionality will not occur. It is, therefore, necessary to develop a probability-type function that distributes replacement aircraft across various classes.
Such a function was developed from the industry forecasts by comparing the class-specific growth rates to the overall aircraft growth rate and assuming that differentials are accounted for by movement between each class and its nearest larger and smaller neighbors. Under this approach, a class growing at a greater than average rate will satisfy both within class replacement aircraft demand and a portion of replacement demand in the neighboring classes. Neighboring class demand fractions are assumed to be split in proportion to the difference between neighboring class and average aircraft growth. Conversely, for classes growing at less than average growth rates, all replacement aircraft are assumed to be within class aircraft.
Combining the replacement aircraft activity estimates and probability functions results in estimates of total class-specific LTO estimates. These class-specific estimates are then distributed across component aircraft in accordance with the distribution of current new aircraft orders within each class. The resulting aircraft LTOs are not assigned to any specific airline, but rather modeled as a distinct “ replacement aircraft” category.
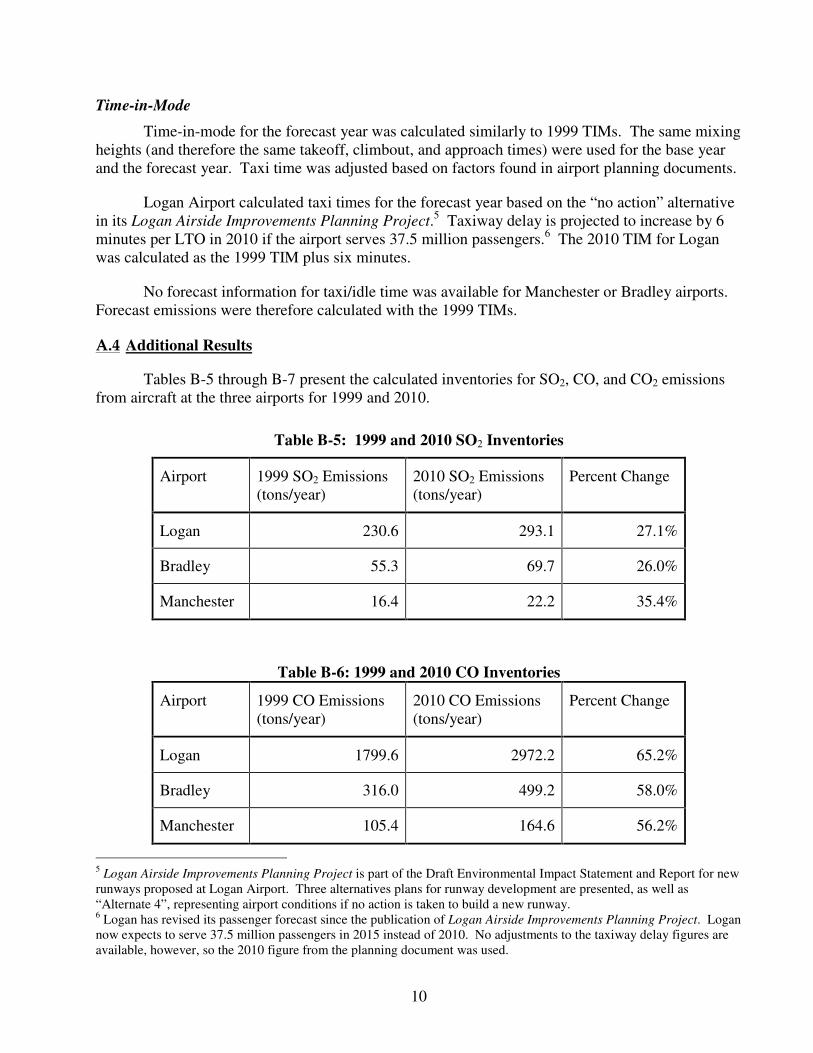
10
Time-in-Mode
Time-in-mode for the forecast year was calculated similarly to 1999 TIMs. The same mixing heights (and therefore the same takeoff, climbout, and approach times) were used for the base year and the forecast year. Taxi time was adjusted based on factors found in airport planning documents.
Logan Airport calculated taxi times for the forecast year based on the “ no action” alternative in its Logan Airside Improvements Planning Project.5 Taxiway delay is projected to increase by 6 minutes per LTO in 2010 if the airport serves 37.5 million passengers.6 The 2010 TIM for Logan was calculated as the 1999 TIM plus six minutes.
No forecast information for taxi/idle time was available for Manchester or Bradley airports. Forecast emissions were therefore calculated with the 1999 TIMs.
A.4 Additional Results
Tables B-5 through B-7 present the calculated inventories for SO2, CO, and CO2 emissions from aircraft at the three airports for 1999 and 2010.
Table B-5: 1999 and 2010 SO2 Inventories
Airport 1999 SO2 Emissions (tons/year)
2010 SO2 Emissions (tons/year)
Percent Change
Logan 230.6 293.1 27.1%
Bradley 55.3 69.7 26.0%
Manchester 16.4 22.2 35.4%
Table B-6: 1999 and 2010 CO Inventories
Airport 1999 CO Emissions (tons/year)
2010 CO Emissions (tons/year)
Percent Change
Logan 1799.6 2972.2 65.2%
Bradley 316.0 499.2 58.0%
Manchester 105.4 164.6 56.2%
5 Logan Airside Improvements Planning Project is part of the Draft Environmental Impact Statement and Report for new runways proposed at Logan Airport. Three alternatives plans for runway development are presented, as well as “ Alternate 4” , representing airport conditions if no action is taken to build a new runway. 6 Logan has revised its passenger forecast since the publication of Logan Airside Improvements Planning Project. Logan now expects to serve 37.5 million passengers in 2015 instead of 2010. No adjustments to the taxiway delay figures are available, however, so the 2010 figure from the planning document was used.
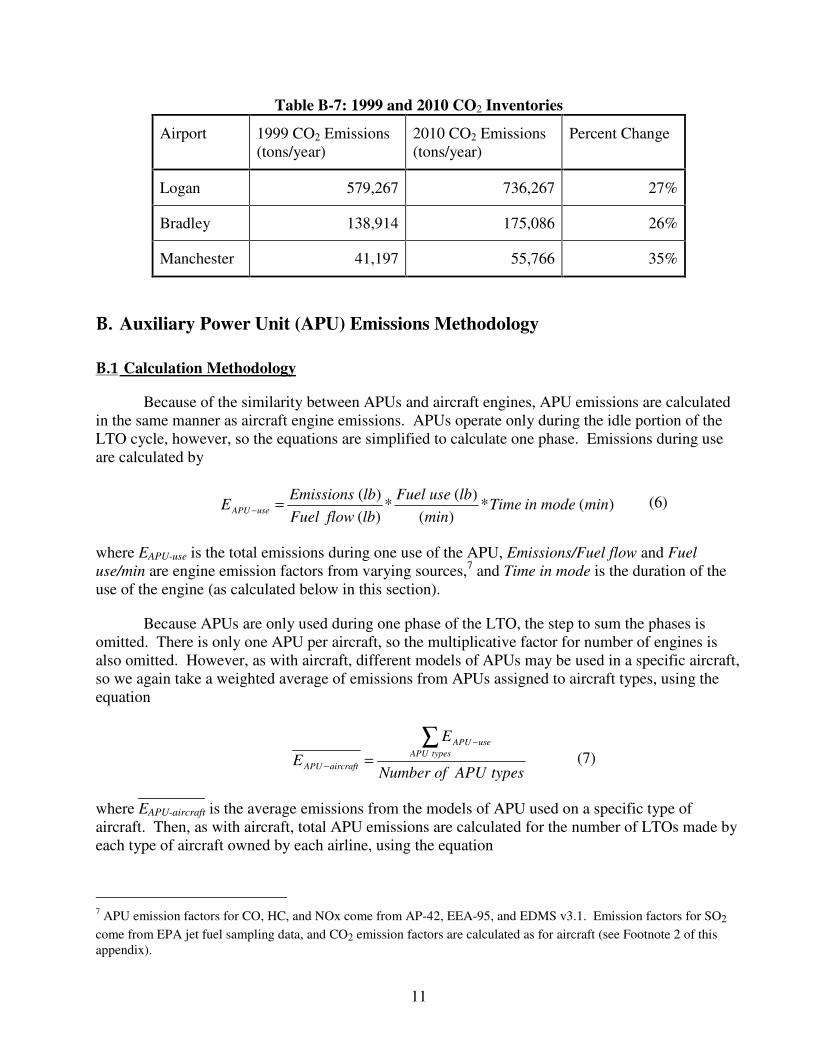
11
Table B-7: 1999 and 2010 CO2 Inventories
Airport 1999 CO2 Emissions (tons/year)
2010 CO2 Emissions (tons/year)
Percent Change
Logan 579,267 736,267 27%
Bradley 138,914 175,086 26%
Manchester 41,197 55,766 35%
B. Auxiliary Power Unit (APU) Emissions Methodology
B.1 Calculation Methodology
Because of the similarity between APUs and aircraft engines, APU emissions are calculated in the same manner as aircraft engine emissions. APUs operate only during the idle portion of the LTO cycle, however, so the equations are simplified to calculate one phase. Emissions during use are calculated by
)(*)(
)(*
)()(
minmodeinTimemin
lbuseFuellbflowFuellbEmissions
E useAPU =− (6)
where EAPU-use is the total emissions during one use of the APU, Emissions/Fuel flow and Fuel use/min are engine emission factors from varying sources,7 and Time in mode is the duration of the use of the engine (as calculated below in this section).
Because APUs are only used during one phase of the LTO, the step to sum the phases is omitted. There is only one APU per aircraft, so the multiplicative factor for number of engines is also omitted. However, as with aircraft, different models of APUs may be used in a specific aircraft, so we again take a weighted average of emissions from APUs assigned to aircraft types, using the equation
typesAPUofNumber
E
E typesAPUuseAPU
aircraftAPU
∑ −
− = (7)
where EAPU-aircraft is the average emissions from the models of APU used on a specific type of aircraft. Then, as with aircraft, total APU emissions are calculated for the number of LTOs made by each type of aircraft owned by each airline, using the equation
7 APU emission factors for CO, HC, and NOx come from AP-42, EEA-95, and EDMS v3.1. Emission factors for SO2 come from EPA jet fuel sampling data, and CO2 emission factors are calculated as for aircraft (see Footnote 2 of this appendix).
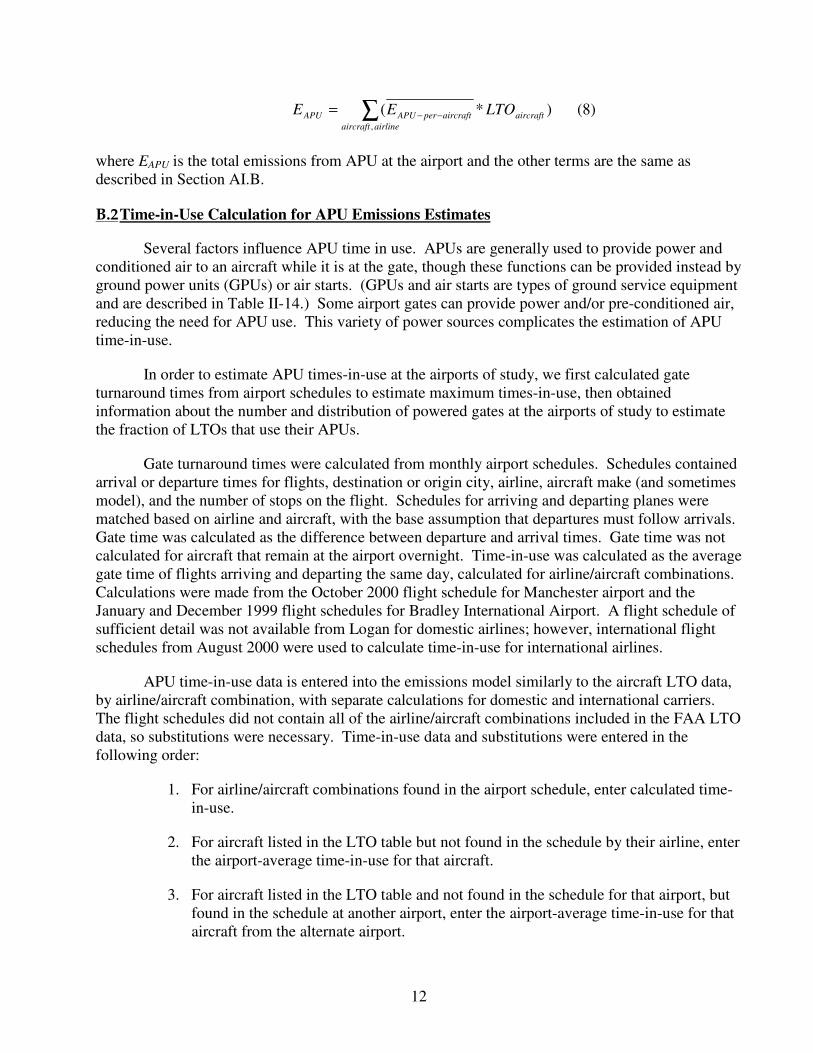
12
)*(,
aircraftairlineaircraft
aircraftperAPUAPU LTOEE ∑ −−= (8)
where EAPU is the total emissions from APU at the airport and the other terms are the same as described in Section AI.B.
B.2 Time-in-Use Calculation for APU Emissions Estimates
Several factors influence APU time in use. APUs are generally used to provide power and conditioned air to an aircraft while it is at the gate, though these functions can be provided instead by ground power units (GPUs) or air starts. (GPUs and air starts are types of ground service equipment and are described in Table II-14.) Some airport gates can provide power and/or pre-conditioned air, reducing the need for APU use. This variety of power sources complicates the estimation of APU time-in-use.
In order to estimate APU times-in-use at the airports of study, we first calculated gate turnaround times from airport schedules to estimate maximum times-in-use, then obtained information about the number and distribution of powered gates at the airports of study to estimate the fraction of LTOs that use their APUs.
Gate turnaround times were calculated from monthly airport schedules. Schedules contained arrival or departure times for flights, destination or origin city, airline, aircraft make (and sometimes model), and the number of stops on the flight. Schedules for arriving and departing planes were matched based on airline and aircraft, with the base assumption that departures must follow arrivals. Gate time was calculated as the difference between departure and arrival times. Gate time was not calculated for aircraft that remain at the airport overnight. Time-in-use was calculated as the average gate time of flights arriving and departing the same day, calculated for airline/aircraft combinations. Calculations were made from the October 2000 flight schedule for Manchester airport and the January and December 1999 flight schedules for Bradley International Airport. A flight schedule of sufficient detail was not available from Logan for domestic airlines; however, international flight schedules from August 2000 were used to calculate time-in-use for international airlines.
APU time-in-use data is entered into the emissions model similarly to the aircraft LTO data, by airline/aircraft combination, with separate calculations for domestic and international carriers. The flight schedules did not contain all of the airline/aircraft combinations included in the FAA LTO data, so substitutions were necessary. Time-in-use data and substitutions were entered in the following order:
1. For airline/aircraft combinations found in the airport schedule, enter calculated time-in-use.
2. For aircraft listed in the LTO table but not found in the schedule by their airline, enter the airport-average time-in-use for that aircraft.
3. For aircraft listed in the LTO table and not found in the schedule for that airport, but found in the schedule at another airport, enter the airport-average time-in-use for that aircraft from the alternate airport.
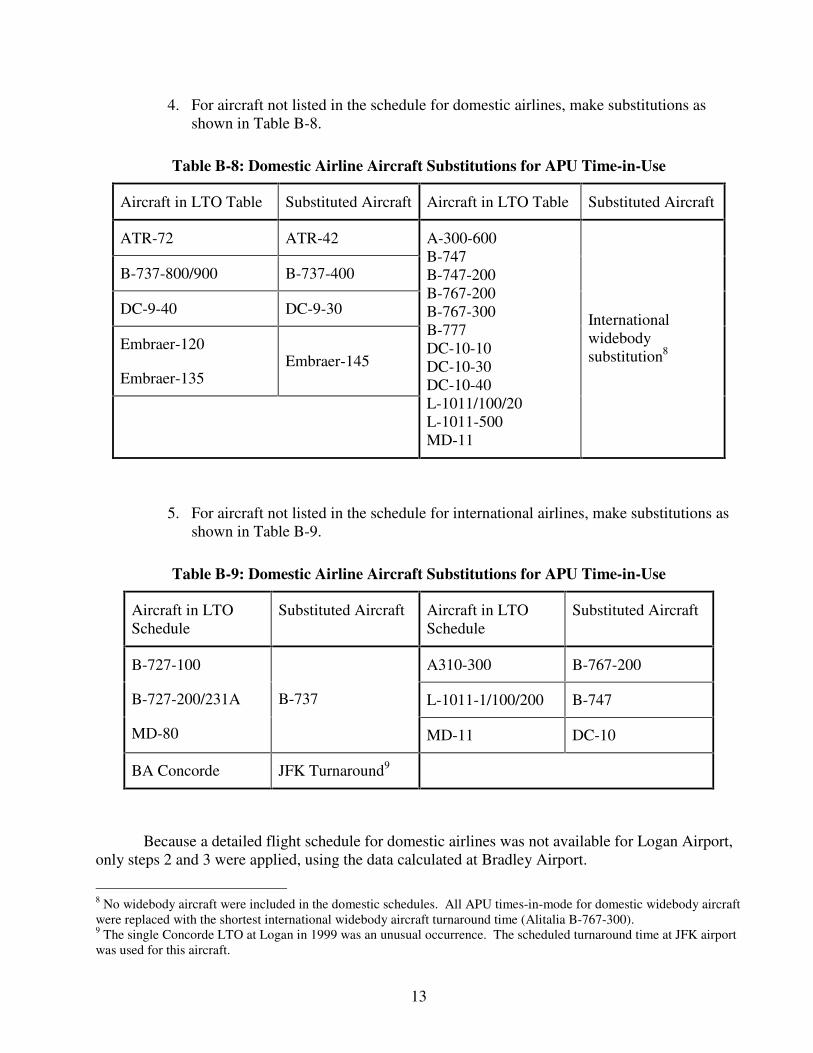
13
4. For aircraft not listed in the schedule for domestic airlines, make substitutions as shown in Table B-8.
Table B-8: Domestic Airline Aircraft Substitutions for APU Time-in-Use
Aircraft in LTO Table Substituted Aircraft Aircraft in LTO Table Substituted Aircraft
ATR-72 ATR-42
B-737-800/900 B-737-400
DC-9-40 DC-9-30
Embraer-120
Embraer-135 Embraer-145
A-300-600 B-747 B-747-200 B-767-200 B-767-300 B-777 DC-10-10 DC-10-30 DC-10-40 L-1011/100/20 L-1011-500 MD-11
International widebody substitution8
5. For aircraft not listed in the schedule for international airlines, make substitutions as shown in Table B-9.
Table B-9: Domestic Airline Aircraft Substitutions for APU Time-in-Use
Aircraft in LTO Schedule
Substituted Aircraft Aircraft in LTO Schedule
Substituted Aircraft
A310-300 B-767-200
L-1011-1/100/200 B-747
B-727-100
B-727-200/231A
MD-80
B-737
MD-11 DC-10
BA Concorde JFK Turnaround9
Because a detailed flight schedule for domestic airlines was not available for Logan Airport, only steps 2 and 3 were applied, using the data calculated at Bradley Airport.
8 No widebody aircraft were included in the domestic schedules. All APU times-in-mode for domestic widebody aircraft were replaced with the shortest international widebody aircraft turnaround time (Alitalia B-767-300). 9 The single Concorde LTO at Logan in 1999 was an unusual occurrence. The scheduled turnaround time at JFK airport was used for this aircraft.
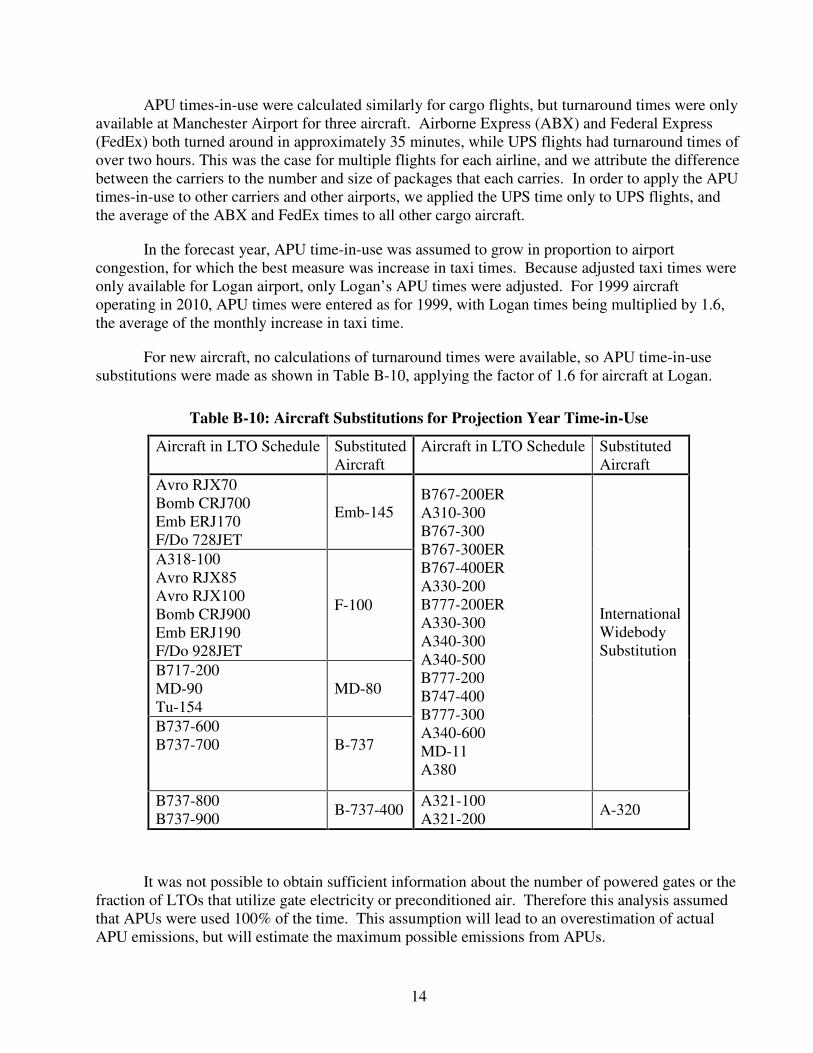
14
APU times-in-use were calculated similarly for cargo flights, but turnaround times were only available at Manchester Airport for three aircraft. Airborne Express (ABX) and Federal Express (FedEx) both turned around in approximately 35 minutes, while UPS flights had turnaround times of over two hours. This was the case for multiple flights for each airline, and we attribute the difference between the carriers to the number and size of packages that each carries. In order to apply the APU times-in-use to other carriers and other airports, we applied the UPS time only to UPS flights, and the average of the ABX and FedEx times to all other cargo aircraft.
In the forecast year, APU time-in-use was assumed to grow in proportion to airport congestion, for which the best measure was increase in taxi times. Because adjusted taxi times were only available for Logan airport, only Logan’ s APU times were adjusted. For 1999 aircraft operating in 2010, APU times were entered as for 1999, with Logan times being multiplied by 1.6, the average of the monthly increase in taxi time.
For new aircraft, no calculations of turnaround times were available, so APU time-in-use substitutions were made as shown in Table B-10, applying the factor of 1.6 for aircraft at Logan.
Table B-10: Aircraft Substitutions for Projection Year Time-in-Use
Aircraft in LTO Schedule Substituted Aircraft
Aircraft in LTO Schedule Substituted Aircraft
Avro RJX70 Bomb CRJ700 Emb ERJ170 F/Do 728JET
Emb-145
A318-100 Avro RJX85 Avro RJX100 Bomb CRJ900 Emb ERJ190 F/Do 928JET
F-100
B717-200 MD-90 Tu-154
MD-80
B737-600 B737-700
B-737
B767-200ER A310-300 B767-300 B767-300ER B767-400ER A330-200 B777-200ER A330-300 A340-300 A340-500 B777-200 B747-400 B777-300 A340-600 MD-11 A380
International Widebody Substitution
B737-800 B737-900 B-737-400 A321-100
A321-200 A-320
It was not possible to obtain sufficient information about the number of powered gates or the fraction of LTOs that utilize gate electricity or preconditioned air. Therefore this analysis assumed that APUs were used 100% of the time. This assumption will lead to an overestimation of actual APU emissions, but will estimate the maximum possible emissions from APUs.
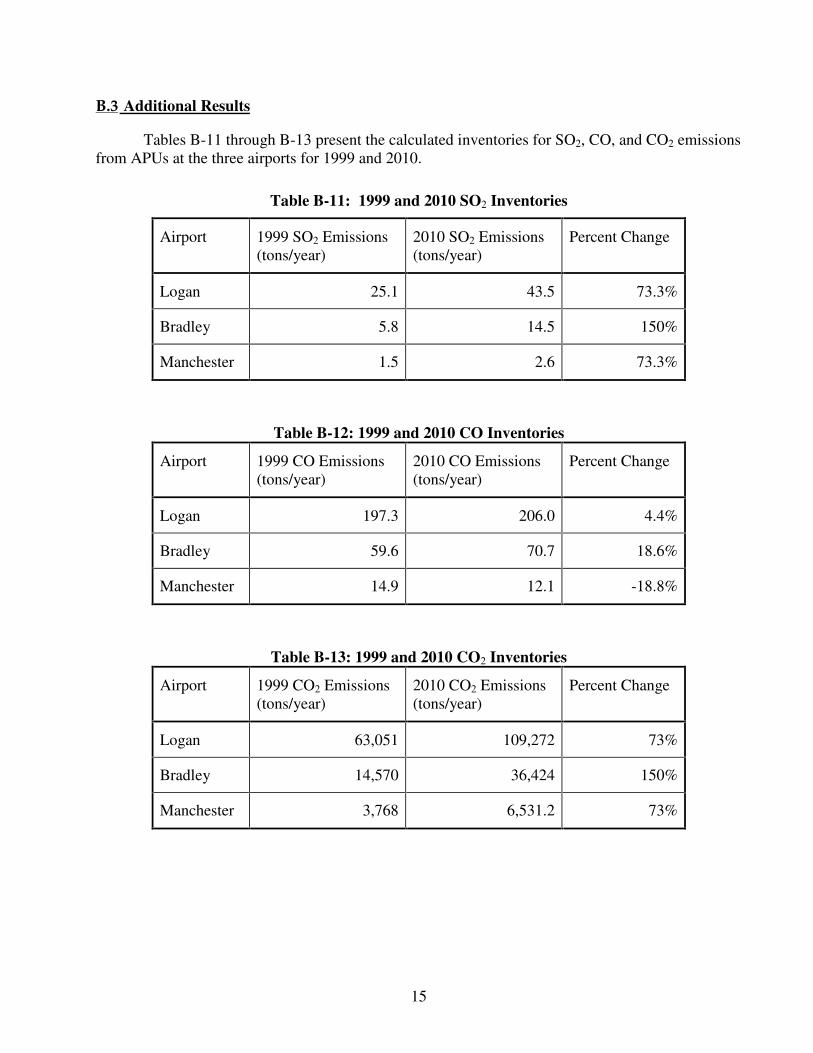
15
B.3 Additional Results
Tables B-11 through B-13 present the calculated inventories for SO2, CO, and CO2 emissions from APUs at the three airports for 1999 and 2010.
Table B-11: 1999 and 2010 SO2 Inventories
Airport 1999 SO2 Emissions (tons/year)
2010 SO2 Emissions (tons/year)
Percent Change
Logan 25.1 43.5 73.3%
Bradley 5.8 14.5 150%
Manchester 1.5 2.6 73.3%
Table B-12: 1999 and 2010 CO Inventories
Airport 1999 CO Emissions (tons/year)
2010 CO Emissions (tons/year)
Percent Change
Logan 197.3 206.0 4.4%
Bradley 59.6 70.7 18.6%
Manchester 14.9 12.1 -18.8%
Table B-13: 1999 and 2010 CO2 Inventories
Airport 1999 CO2 Emissions (tons/year)
2010 CO2 Emissions (tons/year)
Percent Change
Logan 63,051 109,272 73%
Bradley 14,570 36,424 150%
Manchester 3,768 6,531.2 73%

16
Appendix C: “Airlines Feel Pressure of Europe’s Fast Trains.”New York Times, August 12, 2001
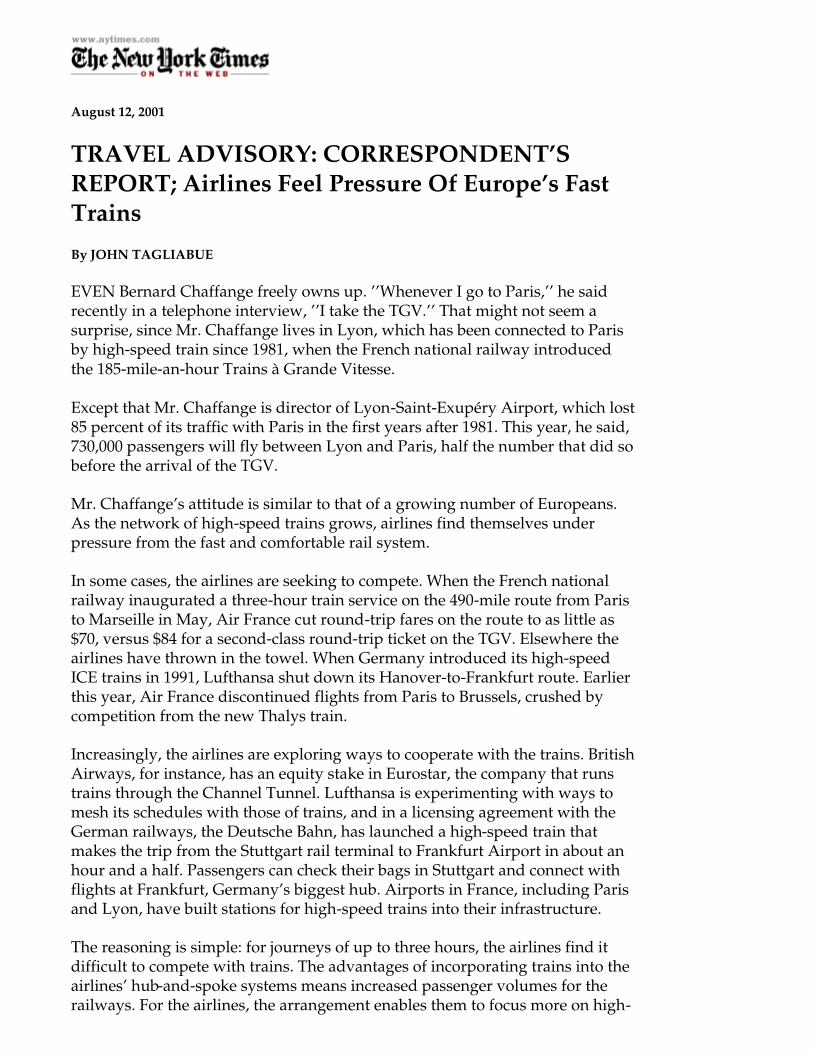
August 12, 2001
TRAVEL ADVISORY: CORRESPONDENT’S REPORT; Airlines Feel Pressure Of Europe’s Fast Trains
By JOHN TAGLIABUE
EVEN Bernard Chaffange freely owns up. ’’Whenever I go to Paris,’’ he said recently in a telephone interview, ’’I take the TGV.’’ That might not seem a surprise, since Mr. Chaffange lives in Lyon, which has been connected to Paris by high-speed train since 1981, when the French national railway introduced the 185-mile-an-hour Trains à Grande Vitesse.
Except that Mr. Chaffange is director of Lyon-Saint-Exupéry Airport, which lost 85 percent of its traffic with Paris in the first years after 1981. This year, he said, 730,000 passengers will fly between Lyon and Paris, half the number that did so before the arrival of the TGV.
Mr. Chaffange’s attitude is similar to that of a growing number of Europeans. As the network of high-speed trains grows, airlines find themselves under pressure from the fast and comfortable rail system.
In some cases, the airlines are seeking to compete. When the French national railway inaugurated a three-hour train service on the 490-mile route from Paris to Marseille in May, Air France cut round-trip fares on the route to as little as $70, versus $84 for a second-class round-trip ticket on the TGV. Elsewhere the airlines have thrown in the towel. When Germany introduced its high-speed ICE trains in 1991, Lufthansa shut down its Hanover-to-Frankfurt route. Earlier this year, Air France discontinued flights from Paris to Brussels, crushed by competition from the new Thalys train.
Increasingly, the airlines are exploring ways to cooperate with the trains. British Airways, for instance, has an equity stake in Eurostar, the company that runs trains through the Channel Tunnel. Lufthansa is experimenting with ways to mesh its schedules with those of trains, and in a licensing agreement with the German railways, the Deutsche Bahn, has launched a high-speed train that makes the trip from the Stuttgart rail terminal to Frankfurt Airport in about an hour and a half. Passengers can check their bags in Stuttgart and connect with flights at Frankfurt, Germany’s biggest hub. Airports in France, including Paris and Lyon, have built stations for high-speed trains into their infrastructure.
The reasoning is simple: for journeys of up to three hours, the airlines find it difficult to compete with trains. The advantages of incorporating trains into the airlines’ hub-and-spoke systems means increased passenger volumes for the railways. For the airlines, the arrangement enables them to focus more on high-
yield international routes that can be comfortably fed by the trains, while freeing up valuable slots at crowded hubs by shifting feeder traffic to the rails.
’’Competition? In principle, yes,’’ said Wolfgang Weinert, project manager for intermodal transport at Lufthansa. Lufthansa pioneered the use of trains to feed its hubs in the 1980’s, after it introduced the Airport Express, a train that linked Düsseldorf and Cologne with the Frankfurt airport. Passengers could check their bags on the train through to their final destinations, and the train schedules dovetailed with Lufthansa departure times. But the trains were low-speed and were later discontinued. Now the airline is test-marketing the concept with the high-speed Stuttgart-Frankfurt train.
Transportation experts say the airlines distinguish increasingly between point-to-point travel, when passengers begin a trip in, say, Paris, and end it in Lyon, and feeder-to-hub travel, when passengers set out, for example, in Lyon to travel via Paris to a third city like Los Angeles or Tokyo.
On point-to-point trips, Mr. Chaffange said, ’’the cutoff point is usually between two and three hours.’’ Under that time, passengers will choose the train; for longer trips, they take the plane. Of course leisure passengers often prefer the train while business travelers choose the plane. The high-speed train trip from Lyon to Lille, Mr. Chaffange said, takes three hours, versus 50 minutes for the flight, but the airlines have maintained a 90 percent lock on the route because most passengers are business travelers. Air France estimates it will lose about 20 percent of its traffic to the TGV on the Paris-Marseille route.
Other factors complicate the choice. Business travelers often prefer high-speed trains because it enables them to work along the way. ’’We try to take Eurostar,’’ said Christopher Logan, an analyst with Goldman, Sachs’s transportation team in London. A flight to Paris involves a trip to Heathrow Airport in London, a wait for the plane, a brief 50-minute flight and another trip from the airport into town. On the train, that time can be spent working.
Airline experts say the competition between train and plane to feed airline hubs is decided by a different yardstick, which they refer to as ’’total elapsed travel time.’’ Mr. Weinert of Lufthansa said that if the time between a passenger’s departure from, say, Stuttgart to travel via Frankfurt to Los Angeles were lengthened by taking the Stuttgart-to-Frankfurt train, passengers would probably choose a feeder flight. To reduce the total elapsed time, passengers must be able to check their luggage at the train station through to their final destination, and trains must be scheduled to fit departures at the hub airport.
From Lyon to Paris, where the train time is 2 hours 10 minutes, Air France continues to operate 10 flights a day, mainly to feed its hub at Charles de Gaulle Airport; on the Brussels-to-Paris route, which takes 80 minutes by train, it canceled the last of its connecting flights in April.
Copyright 2003 The New York Times Company | Permissions | Privacy Policy