Embed Size (px)
Citation preview
Abstract—The following article shows the steps for
developing a control system for a mobile volumetric concrete
mixer, in which you can control the strength of the material,
with the modification of the quantities of each aggregate such
as water, gravel, and sand using a microcontroller.
Index Terms—concrete, microcontroller, strength
I. INTRODUCTION
HE following document shows how a microcontroller
was installed to replace a control system based on
Programmable Logic Controller PLC [1]. The PLC of the
system was damaged, so it was necessary the installation of
a microcontroller [2] opening more possibilities to control
the automated system, this as well as a menu screen that
accepts the modification of the properties of concrete, in this
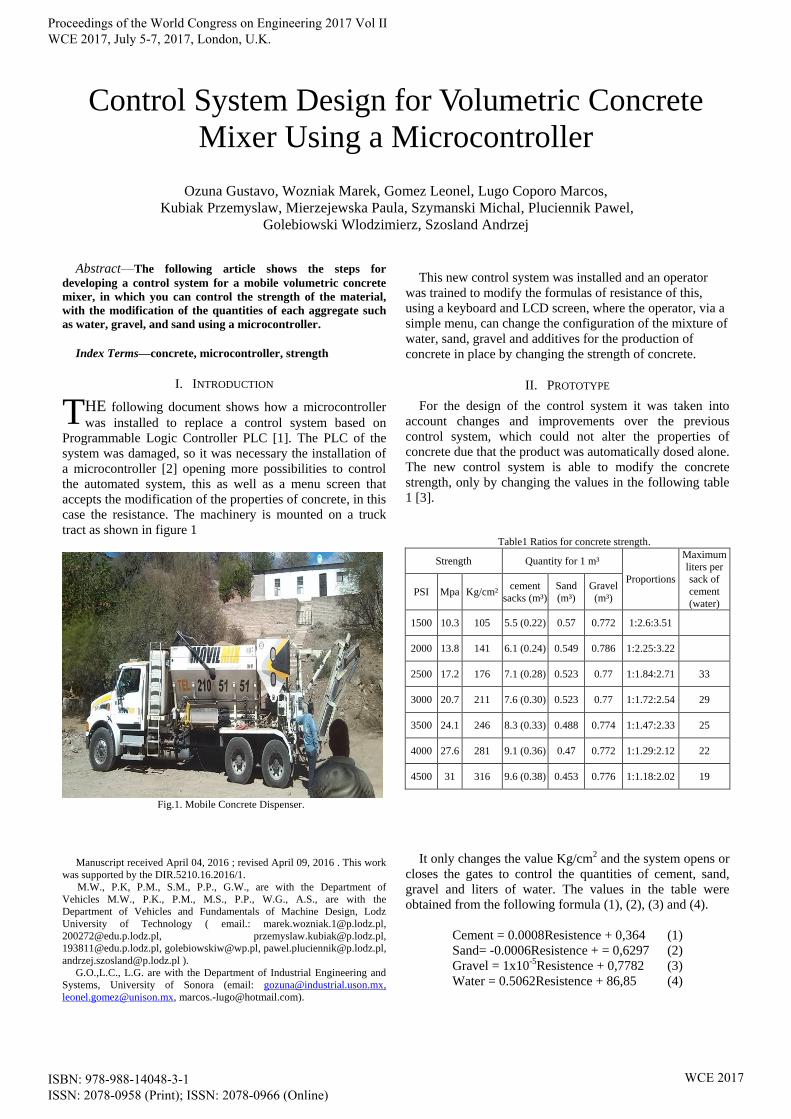
case the resistance. The machinery is mounted on a truck
tract as shown in figure 1
Fig.1. Mobile Concrete Dispenser.
Manuscript received April 04, 2016 ; revised April 09, 2016 . This work
was supported by the DIR.5210.16.2016/1.
M.W., P.K, P.M., S.M., P.P., G.W., are with the Department of
Vehicles M.W., P.K., P.M., M.S., P.P., W.G., A.S., are with the
Department of Vehicles and Fundamentals of Machine Design, Lodz
University of Technology ( email.: [email protected],
[email protected], [email protected],
[email protected], [email protected], [email protected],
G.O.,L.C., L.G. are with the Department of Industrial Engineering and
Systems, University of Sonora (email: [email protected],
[email protected], [email protected]).
This new control system was installed and an operator
was trained to modify the formulas of resistance of this,
using a keyboard and LCD screen, where the operator, via a
simple menu, can change the configuration of the mixture of
water, sand, gravel and additives for the production of
concrete in place by changing the strength of concrete.
II. PROTOTYPE
For the design of the control system it was taken into
account changes and improvements over the previous
control system, which could not alter the properties of
concrete due that the product was automatically dosed alone.
The new control system is able to modify the concrete
strength, only by changing the values in the following table
1 [3].
Table1 Ratios for concrete strength.
Strength Quantity for 1 m³
Proportions
Maximum
liters per
sack of
cement
(water) PSI Mpa Kg/cm²
cement
sacks (m³)
Sand
(m³)
Gravel
(m³)
1500 10.3 105 5.5 (0.22) 0.57 0.772 1:2.6:3.51
2000 13.8 141 6.1 (0.24) 0.549 0.786 1:2.25:3.22
2500 17.2 176 7.1 (0.28) 0.523 0.77 1:1.84:2.71 33
3000 20.7 211 7.6 (0.30) 0.523 0.77 1:1.72:2.54 29
3500 24.1 246 8.3 (0.33) 0.488 0.774 1:1.47:2.33 25
4000 27.6 281 9.1 (0.36) 0.47 0.772 1:1.29:2.12 22
4500 31 316 9.6 (0.38) 0.453 0.776 1:1.18:2.02 19
It only changes the value Kg/cm2 and the system opens or
closes the gates to control the quantities of cement, sand,
gravel and liters of water. The values in the table were
obtained from the following formula (1), (2), (3) and (4).
Cement = 0.0008Resistence + 0,364 (1)
Sand= -0.0006Resistence + = 0,6297 (2)
Gravel = 1x10⁻⁵Resistence + 0,7782 (3)
Water = 0.5062Resistence + 86,85 (4)
Control System Design for Volumetric Concrete
Mixer Using a Microcontroller
Ozuna Gustavo, Wozniak Marek, Gomez Leonel, Lugo Coporo Marcos, Kubiak Przemyslaw, Mierzejewska Paula, Szymanski Michal, Pluciennik Pawel,
Golebiowski Wlodzimierz, Szosland Andrzej
T
Proceedings of the World Congress on Engineering 2017 Vol II WCE 2017, July 5-7, 2017, London, U.K.
ISBN: 978-988-14048-3-1 ISSN: 2078-0958 (Print); ISSN: 2078-0966 (Online)
WCE 2017
III. CONTROL
To control the system it was decided to use a
microcontroller 16F887 which works up to 20 MHz and has
35 inputs or outputs, depending on how you configure the:
14 analog inputs, 2 PWM ports, Serial Port, 3 programmable
timers, I2C port, an Electrically Erasable Programmable
Read-Only Memory (EEPROM) and a standby [4]. The
inputs and outputs were connected in the following order, as
shown in table 2 and table 3.
Table 2. System inputs
Input Description
Keyboard 4X4
Inductive sensor Count RPM of motor
On button Star the system
Stop button Stop the system
Encoder G Displays the position Gate Gravel
Encoder A Displays the position Gate sand
Table 3. System outputs
Output Description
LCD Display 16x2
Motor G Gravel Gate Controls
Motor A Sand Gate Controls
Water valve Water Flow Controls
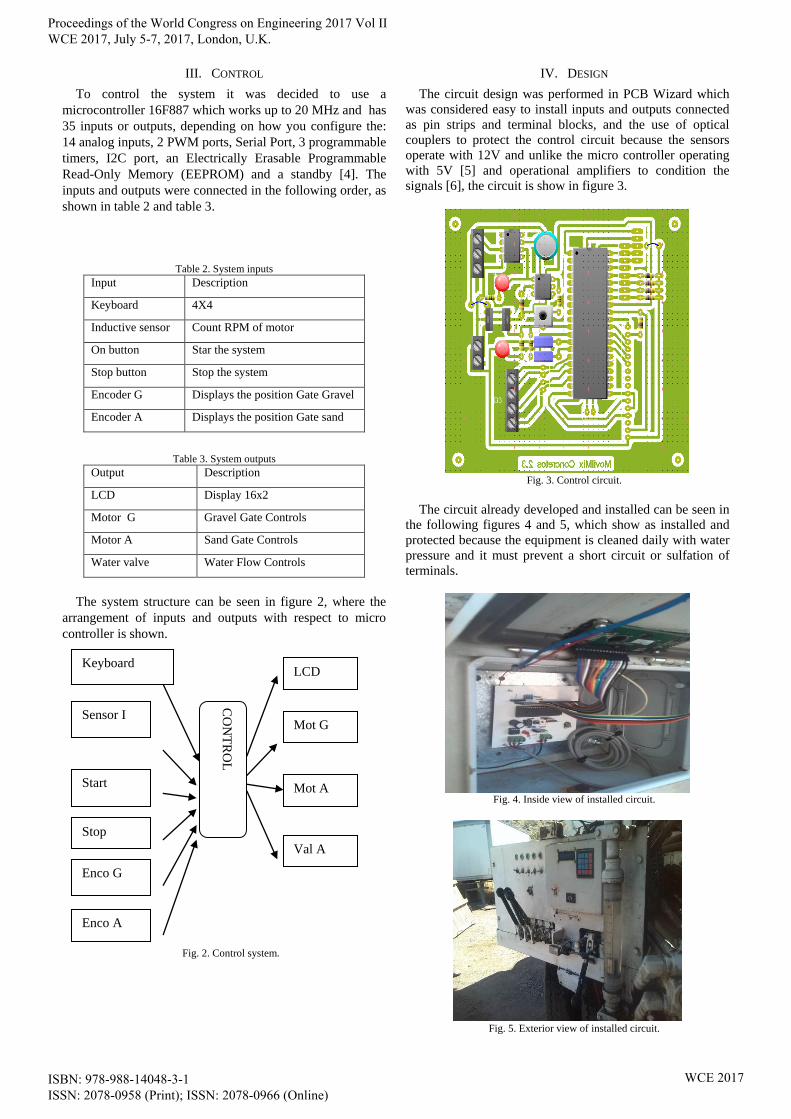
The system structure can be seen in figure 2, where the
arrangement of inputs and outputs with respect to micro
controller is shown.
Fig. 2. Control system.
IV. DESIGN
The circuit design was performed in PCB Wizard which
was considered easy to install inputs and outputs connected
as pin strips and terminal blocks, and the use of optical
couplers to protect the control circuit because the sensors
operate with 12V and unlike the micro controller operating
with 5V [5] and operational amplifiers to condition the
signals [6], the circuit is show in figure 3.
Fig. 3. Control circuit.
The circuit already developed and installed can be seen in
the following figures 4 and 5, which show as installed and
protected because the equipment is cleaned daily with water
pressure and it must prevent a short circuit or sulfation of
terminals.
Fig. 4. Inside view of installed circuit.
Fig. 5. Exterior view of installed circuit.
Sensor I
Start
Stop
Enco G
Enco A
CO
NT
RO
L
LCD
Mot G
Mot A
Val A
Keyboard
Proceedings of the World Congress on Engineering 2017 Vol II WCE 2017, July 5-7, 2017, London, U.K.
ISBN: 978-988-14048-3-1 ISSN: 2078-0958 (Print); ISSN: 2078-0966 (Online)
WCE 2017
V. COMPARISON OF RESULTS
According to the customer, each cubic meter of concrete
takes 216 liters of water depending on the concrete strength.
[3]. We know that for a cubic meter of concrete are needed
in total 1125 counts so we have to send 0192 liters per
count.
Five tests were conducted and the counts were recorded,
the kg of cement dosed and the average time required to
obtain 57 552 counts and 150 kg of cement per test therefore
required 2.6 counts per kilogram of cement. Data are in
Table 4 shown below.
Table 4 Results of sampling
TEST No. 1 2 3 4 5
counts 150 150 151 149 150
kg 56.9 57.36 57.8 57.68 58.02
Time 28.47 28.88 28.76 28.45 28.44
average counts
150.00
average Kg concrete
57.552
The results obtained are shown after performing 3 tests by
opening different gates which we will call A, B and C, with
3 repetitions each, coarse aggregate, ie, gravel and other 3
tests with fine aggregate, sand with their three respective
repetitions. The number of counts and the net weight in
kilograms of gravel and sand respectively were recorded.
Data obtained and the averages are presented in table 5-10.
Table 5. Sample gravel gate 1
A
TEST No. 1 2 3
Gate 1 1 1
Counts 151 152 150
Net weight (Kg.) 78.2 73.1 69.85
Average counts
151
Average Weight
73.716
Weight by counting as gate opening
0.488
Table 6. Sample gravel gate 2.
B
TEST No. 1 2 3
Gate 2 2 2
Counts 110 110 111
Net weight (Kg.) 86.5 90.6 87.85
Average counts
110.333
Average Weight
88.316
Weight by counting as
gate opening
0.800
Table 7. Sample gravel gate 3.
C
TEST No. 1 2 3
Gate 3 3 3
Counts 81 82 79
Net weight (Kg.) 97.3 93.2 98.05
Average counts
80.666
Average Weight
96.183
Weight by counting as
gate opening
1.192
The gate 1 obtained an average of 0.488 kg per count,
0.800 kg in gate 2 and 1,192 kg on the gate 3. These results
are shown in Figure 6. It is controlled the weight of gravel
count only by replacing the value of X with the number of
the open gate into the equation Y = 0.3521X + 0.1228.
Fig. 6. Graph of kg of gravel gate opening
The following tables show data obtained from samples for
sand. The weights are obtained by counting: for gate 1 are
0.683 kg, for gate 2 has an average weight of 1,282 kg and
gate 3, the average is 1,791 kg.
With these data the following equation Y = 0.5538X +
0.1449, with which we can obtain kg of sand per count was
obtained. In Figure 7, these results can be seen in a graph
comparing the count kg against the opening.
Table 8. Sand sample at Gate 1.
A
TEST No. 1 2 3
Gate 1 1 1
Counts 151 149 151
Net weight (Kg.) 99.55 104.4 104.45
Average counts
150.333
Average Weight
102.8
Weight by counting as
gate opening
0.683
Proceedings of the World Congress on Engineering 2017 Vol II WCE 2017, July 5-7, 2017, London, U.K.
ISBN: 978-988-14048-3-1 ISSN: 2078-0958 (Print); ISSN: 2078-0966 (Online)
WCE 2017
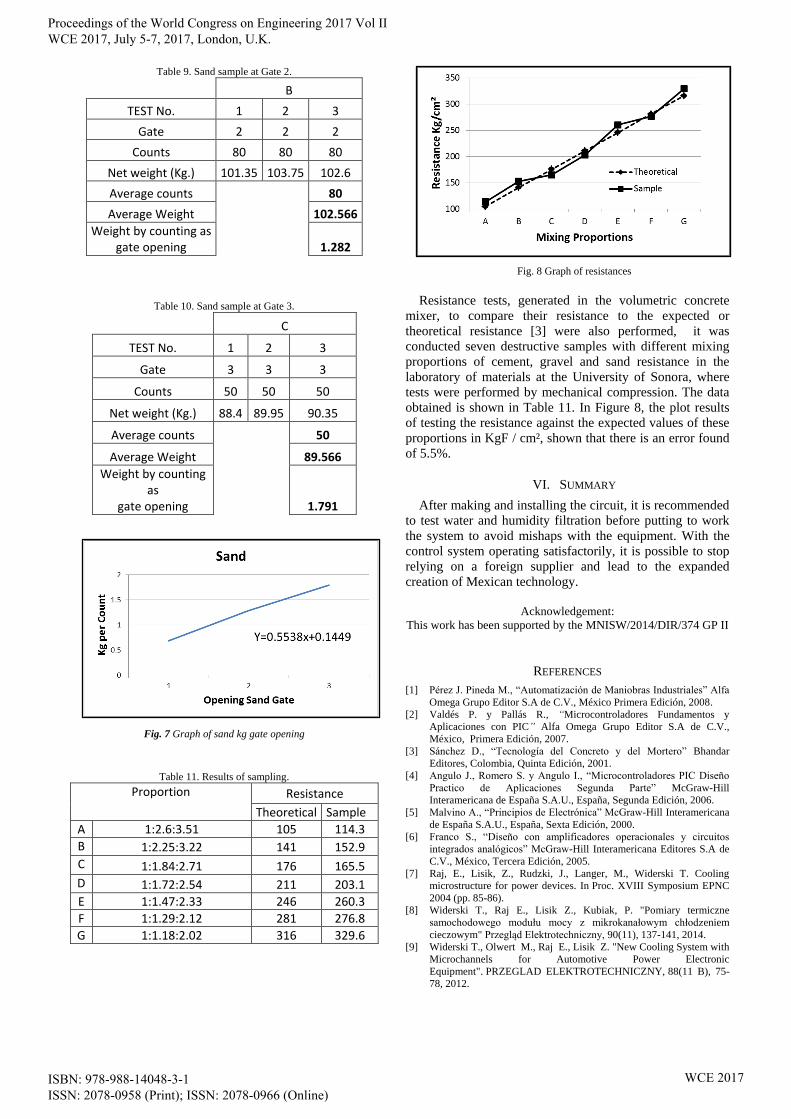
Table 9. Sand sample at Gate 2.
B
TEST No. 1 2 3
Gate 2 2 2
Counts 80 80 80
Net weight (Kg.) 101.35 103.75 102.6
Average counts
80
Average Weight
102.566
Weight by counting as gate opening
1.282
Table 10. Sand sample at Gate 3.
C
TEST No. 1 2 3
Gate 3 3 3
Counts 50 50 50
Net weight (Kg.) 88.4 89.95 90.35
Average counts
50
Average Weight
89.566
Weight by counting as
gate opening
1.791
Fig. 7 Graph of sand kg gate opening
Table 11. Results of sampling.
Proportion Resistance
Theoretical Sample
A 1:2.6:3.51 105 114.3
B 1:2.25:3.22 141 152.9
C 1:1.84:2.71 176 165.5
D 1:1.72:2.54 211 203.1
E 1:1.47:2.33 246 260.3
F 1:1.29:2.12 281 276.8
G 1:1.18:2.02 316 329.6
Fig. 8 Graph of resistances
Resistance tests, generated in the volumetric concrete
mixer, to compare their resistance to the expected or
theoretical resistance [3] were also performed, it was
conducted seven destructive samples with different mixing
proportions of cement, gravel and sand resistance in the
laboratory of materials at the University of Sonora, where
tests were performed by mechanical compression. The data
obtained is shown in Table 11. In Figure 8, the plot results
of testing the resistance against the expected values of these
proportions in KgF / cm², shown that there is an error found
of 5.5%.
VI. SUMMARY
After making and installing the circuit, it is recommended
to test water and humidity filtration before putting to work
the system to avoid mishaps with the equipment. With the
control system operating satisfactorily, it is possible to stop
relying on a foreign supplier and lead to the expanded
creation of Mexican technology.
Acknowledgement:
This work has been supported by the MNISW/2014/DIR/374 GP II
REFERENCES
[1] Pérez J. Pineda M., “Automatización de Maniobras Industriales” Alfa
Omega Grupo Editor S.A de C.V., México Primera Edición, 2008.
[2] Valdés P. y Pallás R., “Microcontroladores Fundamentos y
Aplicaciones con PIC” Alfa Omega Grupo Editor S.A de C.V.,
México, Primera Edición, 2007.
[3] Sánchez D., “Tecnología del Concreto y del Mortero” Bhandar
Editores, Colombia, Quinta Edición, 2001.
[4] Angulo J., Romero S. y Angulo I., “Microcontroladores PIC Diseño
Practico de Aplicaciones Segunda Parte” McGraw-Hill
Interamericana de España S.A.U., España, Segunda Edición, 2006.
[5] Malvino A., “Principios de Electrónica” McGraw-Hill Interamericana
de España S.A.U., España, Sexta Edición, 2000.
[6] Franco S., “Diseño con amplificadores operacionales y circuitos
integrados analógicos” McGraw-Hill Interamericana Editores S.A de
C.V., México, Tercera Edición, 2005.
[7] Raj, E., Lisik, Z., Rudzki, J., Langer, M., Widerski T. Cooling
microstructure for power devices. In Proc. XVIII Symposium EPNC
2004 (pp. 85-86).
[8] Widerski T., Raj E., Lisik Z., Kubiak, P. "Pomiary termiczne
samochodowego modułu mocy z mikrokanałowym chłodzeniem
cieczowym" Przegląd Elektrotechniczny, 90(11), 137-141, 2014.
[9] Widerski T., Olwert M., Raj E., Lisik Z. "New Cooling System with
Microchannels for Automotive Power Electronic
Equipment". PRZEGLAD ELEKTROTECHNICZNY, 88(11 B), 75-
78, 2012.
Proceedings of the World Congress on Engineering 2017 Vol II WCE 2017, July 5-7, 2017, London, U.K.
ISBN: 978-988-14048-3-1 ISSN: 2078-0958 (Print); ISSN: 2078-0966 (Online)
WCE 2017


![Stand Mixer - ProductReview.com.au · 1. Place the stand mixer on a level, stable surface. Ensure that the rotary speed control is in the OFF [ 0 ] position before plugging the mixer](https://img.pdfslide.us/doc/110x75/5f32ad36a1c6a5639a4bc443/stand-mixer-1-place-the-stand-mixer-on-a-level-stable-surface-ensure-that-the.jpg)