Embed Size (px)
Citation preview
Approved for public release; . distribution is unlimited. Title:
Author(s)
Submitted to
Implementation of Model Predictive Control on a Hydrothermal Oxidation Reactor
Muske, Ken-XCM, Villanova University Hansen,Glen-XCM Howse, James-XCM Cagliostro, Dominic-XCM Chaubal, Pinakin-Inland Steel
1998 American Control Conference Philadelphia, PA June 24-26, 1998
I
ER
Los Alamos National Laboratory, an affirmative action/equal opportunity employer, is operated by the University of California for the US. Department of Energy under contract W-7405-ENG-36. By acceptance of this article, the publisher recognizes that the U.S. Government retains a nonexclusive, royalty-free license to publish or reproduce the published form of this contribution, or to allow others to do so, for U.S. Government purposes. Los Alamos National Laboratory requests that the publisher identify this article as work performed under the auspices of the U.S. Department of Energy. The Los Alamos National Laboratory strongly supports academic freedom and a researcher's right to publish; as an institution, however, the Laboratory does not endorse the viewpoint of a publication or guarantee its technical correctness. Form 836 (1 0/96)
DISCLAIMER
This report was prepared as an account of worksponsorai by an agency of thc Unitcd States Government Neither the Unitcd States Govcramwt aor any agency thmof, nor any of their anpioy#s makes my ' I II~M~~, expms or implied, or
fdness of my Momtioe. apparatus, pmdua, OT process disclosed, o re#remu bat its usc would not infringe privateiy owned rights Reference herein to MY spc- cifc a m n d product. pnrass, or semh by trrde name, trrdemulq inaaufac- turn, or otherwise daes not ntccssarily antaifflu or imply iu ardonemcnt, rrcom- meadation, or favoring by the United States Gomrmcat 01 lay agency thereof. The vim and opinions of authors exprrsscd herein Q not acccsdiy state or reflect tbosc of the United States Government or any agatcy thereof.
~ C S my l@ liability OT r r ~ p 0 ~ 1 ~ W t y fw the .IIDEIUIC~, Wpieteaar, ot USC-
.
DISCLAIMER
Portions of this document may be illegible in electronic image products. Images are produced from the best available original document.
' P
Implementation of Model Predictive Control on a Hydrothermal Oxidation Reactor
Kenneth R. Muske Department of Chemical Engineering, Villanova University, Villanova, PA 19085
Phillip C. Dell'Orco, Loan A. Le, and Raymond L. Flesner High Explosives Science and Technology Group
Los Alamos National Laboratory, Los Alarnos, NM 87545
Abstract This paper describes the model-based control algo- rithm developed for a hydrothermal oxidation reac- tor at the Pantex Department of Energy facility in Amarillo, Texas. The combination of base hydrolysis and hydrothermal oxidation is used for the disposal of PBX 9404 high explosive at Pantex. The reactor oxidizes the organic compounds in the hydrolysate solutions obtained from the base hydrolysis process. The objective of the model predictive controller is to minimize the total aqueous nitrogen compounds in the effluent of the reactor. The controller also main- tains a desired excess oxygen concentration in the re- actor effluent to ensure the complete destruction of the organic carbon compounds in the hydrolysate.
1. Introduction Base hydrolysis is an alternative to combustion and open detonation for the destruction of energetic ma- terials. In this process, the energetic material is hy- drolyzed in a concentrated sodium hydroxide solu- tion to yield non-energetic, water soluble compounds. The reaction product is an elevated pH solution that contains sodium carboxylic acid salts, amines, and nitrites. Base hydrolysis does not have the safety and environmental problems associated with combus- tion and open detonation, however, the resulting hy- drolysate solution requires an additional treatment step before disposal to remove the organic carbon and aqueous nitrogen compounds.
One of the options for the environmentally benign treatment of the base hydrolysate is hydrothermal oxidation. This process oxidizes the organic com- pounds at elevated temperatures (400 to 450 deg C) and pressures (900 to 1000 bar) using hydrogen per- oxide or oxygen as the oxidant. Hydrothermal oxi- dation is very effective at removing organic carbon compounds, however, aqueous nitrogen compounds tend to be more difficult to completely remove. The result is the presence of nitrate and ammonium ions in the aqueous effluent stream of the hydrothermal oxidation reactor.
Since elevated concentrations of aqueous nitrogen compounds prevent the direct discharge of the aque- ous effluent, the objective of the model-based con- troller is to minimize the total aqueous nitrogen in the reactor effluent while ensuring complete destruc- tion of the organic carbon compounds. This objective must be achieved over the wide range of hydrolysate feed rate and concentration that is processed by the reactor. The controller uses a dynamic plug flow reac- tor model that incorporates a simplified kinetic model of the hydrothermal oxidation reactions. Using this model, the hydrogen peroxide injection rate required to minimize the total aqueous nitrogen compounds and maintain a desired excess oxygen concentration in the reactor effluent is determined.
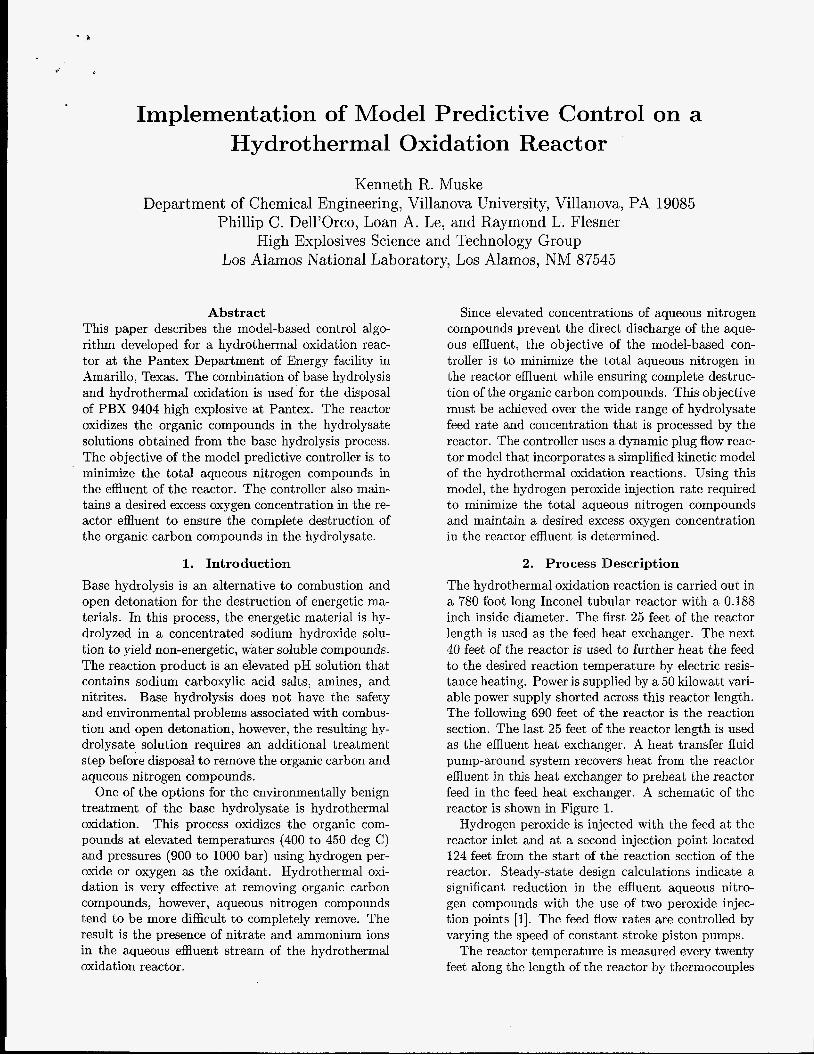
2. Process Description The hydrothermal oxidation reaction is carried out in a 780 foot long Inconel tubular reactor with a 0.188 inch inside diameter. The first 25 feet of the reactor length is used as the feed heat exchanger. The next 40 feet of the reactor is used to further heat the feed to the desired reaction temperature by electric resis- tance heating. Power is supplied by a 50 kilowatt vari- able power supply shorted across this reactor length. The following 690 feet of the reactor is the reaction section. The last 25 feet of the reactor length is used as the effluent heat exchanger. A heat transfer fluid pump-around system recovers heat from the reactor effluent in this heat exchanger to preheat the reactor feed in the feed heat exchanger. A schematic of the reactor is shown in Figure 1.
Hydrogen peroxide is injected with the feed at the reactor inlet and at a second injection point located 124 feet from the start of the reaction section of the reactor. Steady-state design calculations indicate a significant reduction in the effluent aqueous nitro- gen compounds with the use of two peroxide injec- tion points [l]. The feed flow rates are controlled by varying the speed of constant stroke piston pumps.
The reactor temperature is measured every twenty feet along the length of the reactor by thermocouples
P ft
25 ft
65 ft
189 ft
Hydrolysate Feed + 1st Peroxide Injection Feed Heat Exchanger Section
Electric Heater Section
Reaction Section
2nd Peroxide Injection I- 0 2
Gas Stream h Effluent
Effluent Separator Cooler
780 ft
NH; NO^
Figure 1: Hydrothermal oxidation reactor schematic.
brazed to the outside of the tube wall. The temper- ature measurements are performed in this manner to retain the integrity of the tubular reactor. Since there are no severe temperature gradients in the reaction section, these measurements are assumed to be rep- resentative of the fluid temperature inside the reactor. Average reaction section temperature is controlled by adjusting the power to the electrical resistance heater.
Since the reactor pressure drop is negligible, pres- sure is assumed to be constant along the reactor length. Reactor pressure is controlled by a Bafco con- trol valve located after the reactor effluent cooler. In order to reduce the pressure drop across this valve, the effluent first passes through a series of capillary tubes.
The reactor effluent is separated into liquid and gas streams in a separator vessel. The aqueous nitrogen is measured by nitrate and ammonia sensors in the effluent liquid stream. Excess oxygen is measured by an oxygen sensor in the effluent gas stream.
3. Process Model
The hydrothermal oxidation reactor is modeled as a plug flow reactor with no axial diffusion. Since the Reynolds number for this system is on the order of lo4 and the ratio of the reactor radius to average velocity is on the order of seconds, radial vari- ation of the concentration is neglected. The effect of axial diffusion is neglected since the contribution of the diffusive velocity is small compared to the convec- tive velocity. This ratio is also on the order of seconds. Further detail on the justification of these assumptions can be found in [2].
3.1. Kinetic Model A simplified kinetic model of the oxidation reaction that lumps components with similar chemical behav- ior is used in the process model. Although this kinetic model is a gross simplification of the elementary re- actions taking place in the reactor, it does capture the global reaction pathways through which organic carbon and nitrogen compounds are consumed in the reactor. It also provides an adequate representation of experimental data.
The chemical components considered in the kinetic model are total organic carbon (TOC), nitrate/nitrite (NO,), ammonia/ammonium (NH:), and oxygen (02). TOC and NO, are present in the base hydrol- ysis feed to the reactor. NH: is generated from the oxidation of the organic carbon compounds by both oxygen and NO,. Oxygen is generated from decom- position of the hydrogen peroxide injected into the reactor. Since the hydrogen peroxide is completely decomposed in the injection line before it enters the reactor, only oxygen is considered in the model.
Each reaction is assumed to be a second order oxidation-reduction reaction. The reaction rates for each of the chemical components are
in which pr is the reactor fluid density and the con- centrations are in the units of mole/kg.
The Arrhenius pre-exponential factor and activa- tion energy for the reaction rate constants and the reaction ratios are shown in Table 1. These values were determined from hydrothermal oxidation exper- iments conducted at Los Alamos National Laboratory
Ratio I Value
0.750
Table 1: Kinetic model parameters.
. or1 PBX 9404 hydrolysate solutions at temperatures between 350 C and 480 C. A more detailed discussion of the kinetic model development is contained in [3]. *
3.2. Reactor Model The reaction system is modeled by a series of four par- tial differential equations, one for each of the chemi- cal components discussed in Section 3.1, that describe the concentrations in a plug flow reactor. The partial differential equation for component c is
(5)
in which F is the volumetric feed flow rate, pf is the feed density, pr is the fluid density at reactor condi- tions, A, is the reactor cross-sectional area, [e] is the concentration of component c expressed in mole/kg, and R(c) is the rate of reaction from Eqs. 1 through 4.
The fluid density at reactor conditions is computed using the cubic form of the Peng-Robinson equation of state assuming the reactor fluid can be modeled as water.
RT aa (TI p = -- v - b W(V + b) + ~ ( T J - b)
(1 + c (1 - &) ) In this expression, P is pressure, T is temperature, w is molar volume, Tr is the reduced temperature, and a = 5.908, b = 0.01893, c = 0.9732 are functions of the critical properties of water.
The concentrations of TOC and NO, in the hy- drolysate feed are available from an analysis per- formed after the base hydrolysis reaction is complete. The 0 2 concentration in the hydrogen peroxide feed is determined by assuming complete decomposition of the 30 wt% hydrogen peroxide before it enters the re- actor. The reactor inlet concentration in mole/kg of a component, [c]i, is determined from its feed concen- tration, [ c ]~ , volumetric feed rate, F,, the hydrolysate volumetric feed rate, Fh, the first hydrogen peroxide volumetric injection rate, H I , and the feed density.
... (7)
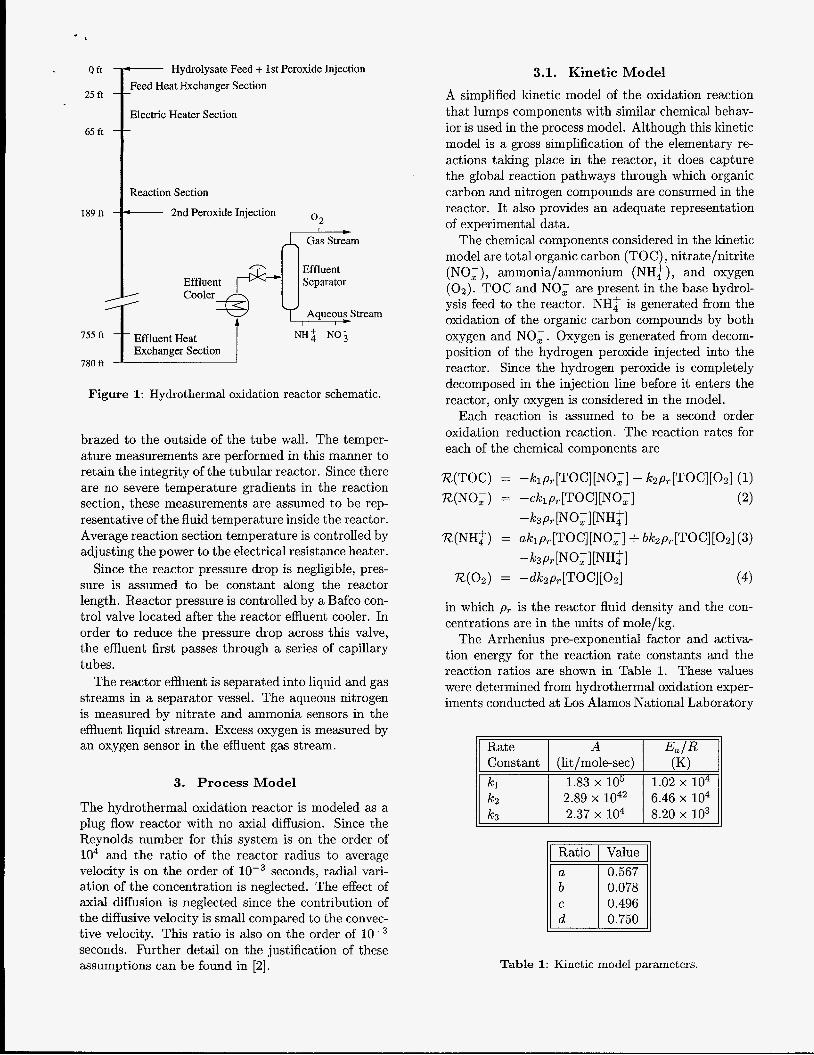
3.3. Reactor Operation The optimal reactor operation is at the minimal to- tal aqueous nitrogen concentration and a slight ex- cess oxygen concentration. Figure 2 presents the pre- dicted total aqueous nitrogen concentration as a func- tion of the initial hydrogen peroxide injection rate with an effluent excess oxygen concentration target of 0.1 mol/kg, an average reactor temperature of 435C, a reactor pressure of 990 bar, and hydrolysate feed rates ranging from 150 to 300 gal/day. The reduc- tion in the total aqueous nitrogen with reduced feed
rate is due to the increased residence time in the reac- tor. In order to reduce the total aqueous nitrogen in the effluent, the reactor typically will be operated at the lower feed rates. As the hydrolysate feed rate is reduced, however, the effluent aqueous nitrogen con- centration sensitivity to the initial hydrogen peroxide injection injection rate increases. For this reason, a model-based controller is developed.
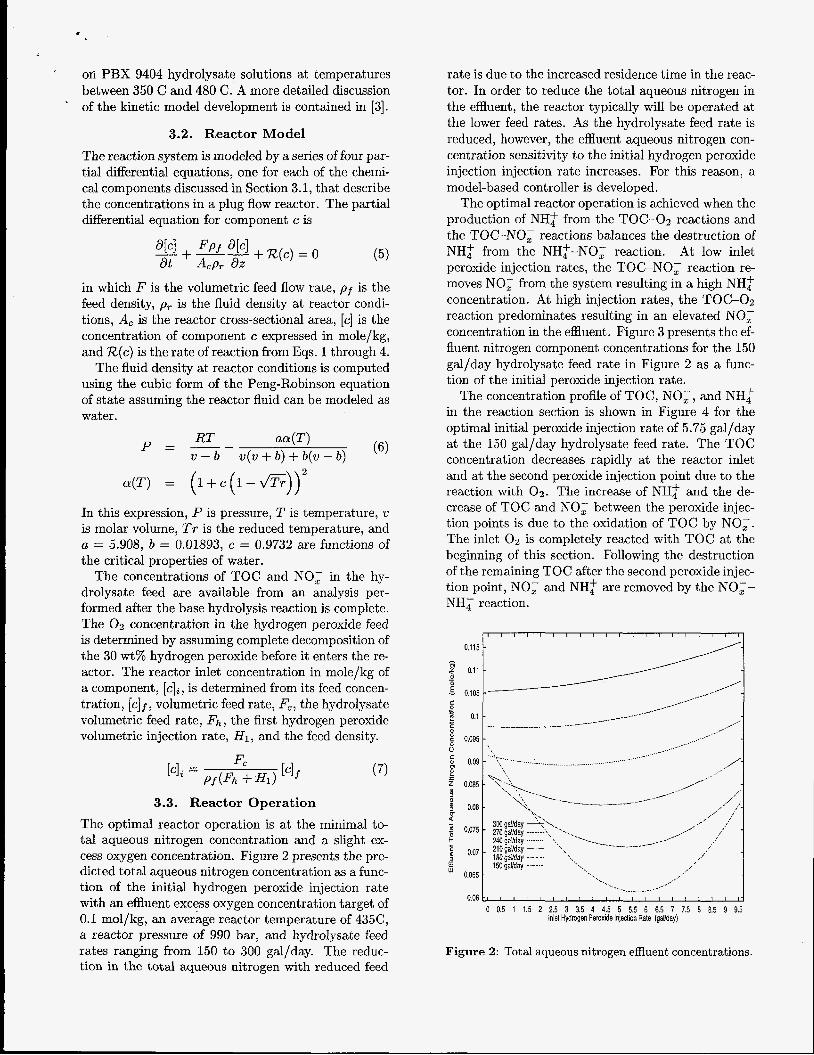
The optimal reactor operation is achieved when the production of NH$ from the TOC-02 reactions and the TOC-NO, reactions balances the destruction of NH: from the NHZ-NO; reaction. At low inlet peroxide injection rates, the TOC-NO; reaction re- moves NO; from the system resulting in a high NH$ concentration. At high injection rates, the TOC-02 reaction predominates resulting in an elevated NO; concentration in the effluent. Figure 3 presents the ef- fluent nitrogen component concentrations for the 150 gal/day hydrolysate feed rate in Figure 2 as a func- tion of the initial peroxide injection rate.
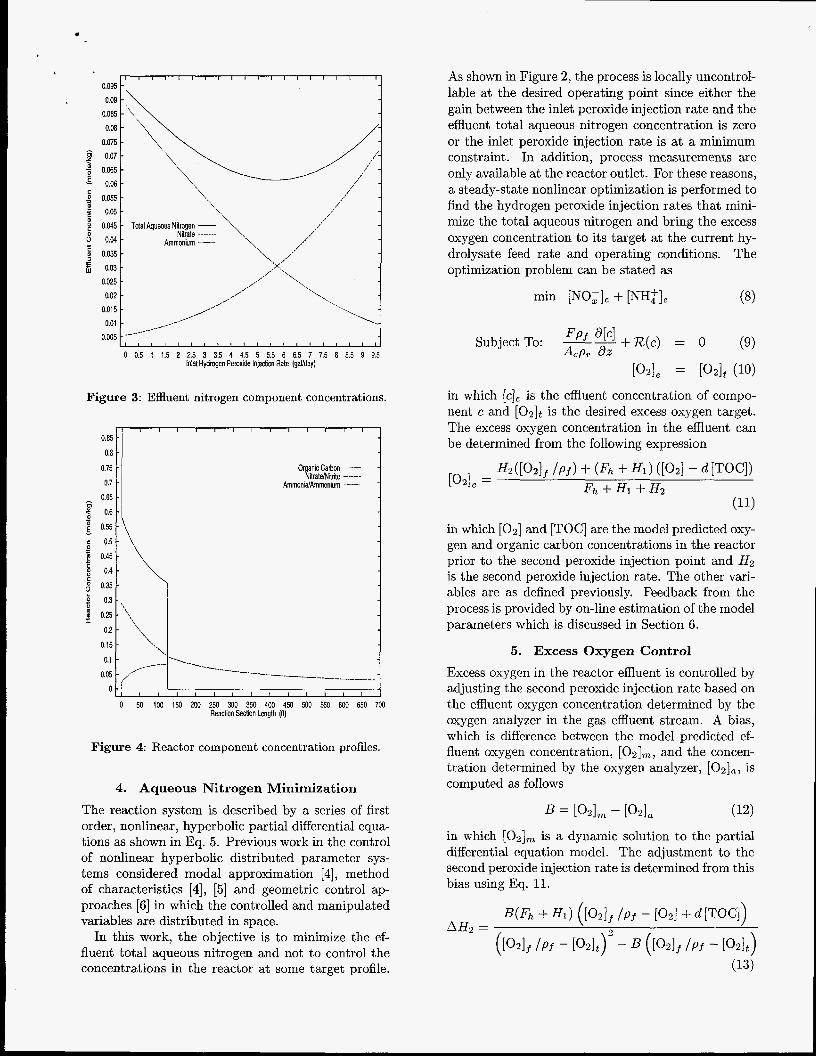
The concentration profile of TOC, NO,, and NH,f in the reaction section is shown in Figure 4 for the optimal initial peroxide injection rate of 5.75 gal/day at the 150 gal/day hydrolysate feed rate. The TOC concentration decreases rapidly at the reactor inlet and at the second peroxide injection point due to the reaction with 0 2 . The increase of NHi and the de- crease of TOC and NO, between the peroxide injec- tion points is due to the oxidation of TOC by NO,. The inlet 0 2 is completely reacted with TOC at the beginning of this section. Following the destruction of the remaining TOC after the second peroxide injec- tion point, NO, and NH: are removed by the NO,- NH,S reaction.
, , I I I , , , , , I , , , I , I , J I
0.115 - - p 0.11- m -
__I-- __.' _.-- __.- C *_-- E 0.105 -
___.-a ____---- ___-.- - __."
c 0.095 -
E 0.1 ___-__ __.----- I s f 0.09 - ......................................... I-
- _,__.... .__..__..___________-...---- --.-------
,_/ __.. .... ,... .__.- __.. .-.,. ____.... . - ~ ~ - - ~ ~ ~ ~ ' ~
,/ /--. _./,
,/I.' ,.*: -..- -..--'r-
,./ I'
*.,' .; <.I
>.,e' -. o,07 210 galday *.\,\,
3 - - ,/'
- .... %
18OgaVday ..., 150gaVday
0.065 - 3
0.063 I I I I I I I I I I 1 I I I I I I 17
0 0.5 1 1.5 2 2.5 3 3.5 4 4.5 5 5.5 6 6.5 7 7.5 8 8.5 9 9.5 inlet Hydrogen Peroxde Injection Rate (gaVday)
Figure 2: Total aqueous nitrogen effluent concentrations.
I l l l l l l l l l l l l I l l l l l I
0.095 0.09 \
0 0.5 1 1.5 2 2.5 3 3.5 4 4.5 5 5.5 6 6.5 7 7.5 8 8.5 9 9.5 Inlet Hydrogen Peroxide Injection Rate (gallday)
Figure 3: Effluent nitrogen component concentrations.
0.85
0.8
0.75
0.7
0.65
$ 0.6 0
- E 0.55 - c 0.5
5 0.45 - - f O 4 0" 0.35
0.3
0.25
0.2
0.15
0.1
0.05 0
1 1 1 1 1 1 1 I I I I I I
Organk Carbon - NtrateNlrite -------
AmmonidArnmoniurn
-7 l I I I I J I J I ( I I I '
0 50 100 150 200 250 300 350 400 450 500 550 600 650 700 Reaction Section Length (It)
Figure 4: Reactor component concentration profiles.
4. Aqueous Nitrogen Minimization The reaction system is described by a series of first order, nonlinear, hyperbolic partial differential equa- tions as shown in Eq. 5. Previous work in the control of nonlinear hyperbolic distributed parameter sys- tems considered modal approximation [4], method of characteristics [4], [5] and geometric control ap- proaches 161 in which the controlled and manipulated variables are distributed in space.
In this work, the objective is to minimize the ef- fluent total aqueous nitrogen and not to control the concentrations in the reactor at some target profile.
As shown in Figure 2, the process is locally uncontrol- lable at the desired operating point since either the gain between the inlet peroxide injection rate and the effluent total aqueous nitrogen concentration is zero or the inlet peroxide injection rate is at a minimum constraint. In addition, process measurements are only available at the reactor outlet. For these reasons, a steady-state nonlinear optimization is performed to find the hydrogen peroxide injection rates that mini- mize the total aqueous nitrogen and bring the excess oxygen concentration to its target at the current hy- drolysate feed rate and operating conditions. The optimization problem can be stated as
Subject To: -- F p f +R(c ) = 0 (9) Acp, dz
in which [e], is the effluent concentration of compo- nent c and [ O Z ] ~ is the desired excess oxygen target. The excess oxygen concentration in the effluent can be determined from the following expression
in which [ 0 2 ] and [TOC] are the model predicted oxy- gen and organic carbon concentrations in the reactor prior to the second peroxide injection point and H2 is the second peroxide injection rate. The other vari- ables are as defined previously. Feedback from the process is provided by on-line estimation of the model parameters which is discussed in Section 6 .
5. Excess Oxygen Control Excess oxygen in the reactor effluent is controlled by adjusting the second peroxide injection rate based on the effluent oxygen concentration determined by the oxygen analyzer in the gas effluent stream. A bias, which is difference between the model predicted ef- fluent oxygen concentration, [02],, and the concen- tration determined by the oxygen analyzer, [ 0 2 I a , is computed as follows
B = P 2 1 , - [021, (12)
in which [O2lm is a dynamic solution to the partial differential equation model. The adjustment to the second peroxide injection rate is determined from this bias using Eq. 11.
6. Model Update
, In order to minimize the total aqueous nitrogen in the reactor effluent, the NO, and NH: concentrations must be essentially equal after the second peroxide injection point to maximize the rate of destruction of both components. The determination of the hydro- gen peroxide injection rates necessary to achieve these concentrations is based on the reactor model as shown in Section 4. Since the kinetic model is a simplified representation of the reactions taking place, it is rea- sonable to expect that there will be some modeling error over the normal operating range of the reactor. Therefore, nonlinear parameter estimation is used to update the model based on the measured NO, and NH; concentrations in the effluent.
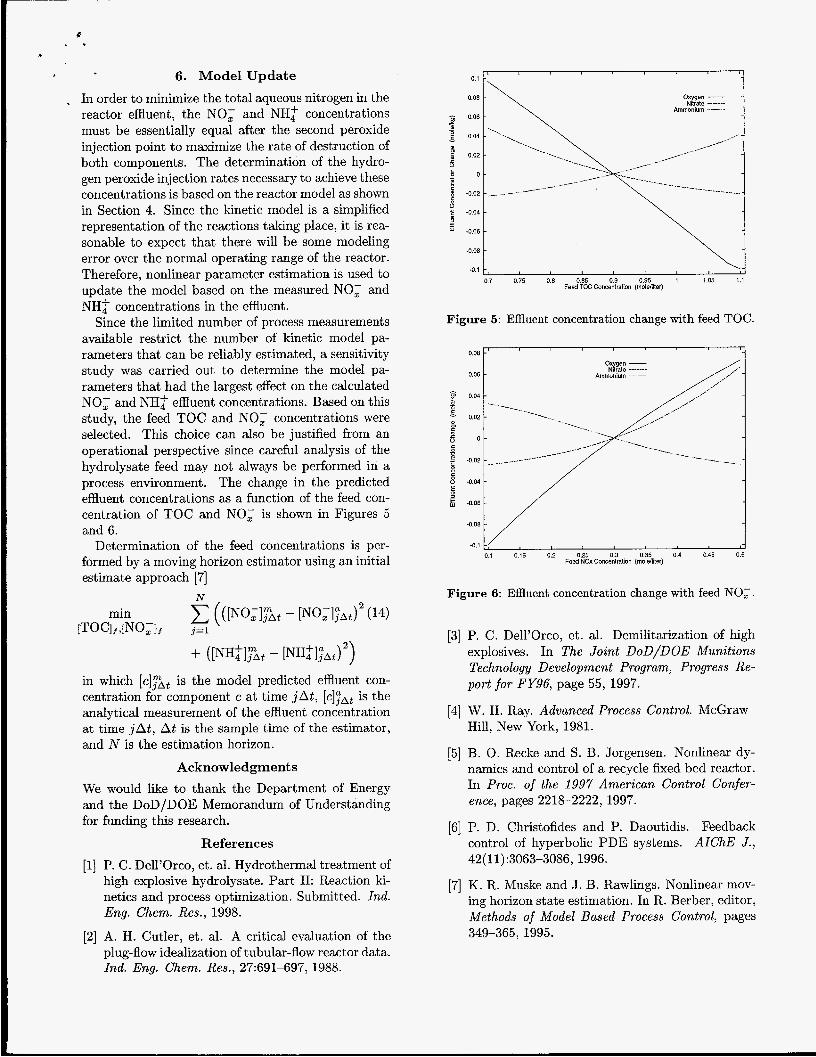
Since the limited number of process measurements available restrict the number of kinetic model pa- rameters that can be reliably estimated, a sensitivity study was carried out to determine the model pa- rameters that had the largest effect on the calculated NO, and NH; effluent concentrations. Based on this study, the feed TOC and NO; concentrations were selected. This choice can also be justified from an operational perspective since careful analysis of the hydrolysate feed may not always be performed in a process environment. The change in the predicted effluent concentrations as a function of the feed con- centration of TOC and NO, is shown in Figures 5 and 6.
Determination of the feed concentrations is per- formed by a moving horizon estimator using an initial estimate approach [7]
N
in which [ ~ ] j ” ~ is the model predicted effluent con- centration for component e at time jAt, [e]TAt is the analytical measurement of the effluent concentration at time jAt, At is the sample time of the estimator, and N is the estimation horizon.
Acknowledgments We would like to thank the Department of Energy and the DoD/DOE Memorandum of Understanding for funding this research.
References [l] P. C. Dell’Orco, et. al. Hydrothermal treatment of
high explosive hydrolysate. Part 11: Reaction ki- netics and process optimization. Submitted. Ind. Eng. Chem. Res., 1998.
[2] A. H. Cutler, et. al. A critical evaluation of the plug-flow idealization of tubular-flow reactor data. Ind. Eng. Chem. Res., 27:691-697, 1988.
0.1
0.08
/n 0.06 - r
0.04 - rn 5 0.02 6 .E 0
8 -0.02 6
9
c
E -0.04
-0.06
-0.08
-0.1
Oxygen - NIrafe ....... *mmmium
7 0.75 0.8 0.85 0.9 , 0.95 , \ i 1.05 1
Feed TM) Concentration (moleilfier)
Figure 5: Effluent concentration change with feed TOC.
0.08 I‘ Oxygen -
Ammonium Ntrale
-..._
0.06
- g 0.04 - - E 0.02 0
6 0 .= 5 -0.02
8 -0.04 L
-0.06
Feed NOx Concentration (innleiliter) 0.1 0.15 0.2 0.25 0.3 0.35 0.4 0.45 a
-0.08 -
4.1 -
Figure 6: Effluent concentration change with feed NO,.
[3] P. C. Dell’Orco, et. al. Demilitarization of high explosives. In The Joint DoD/DOE Munitions Technology Development Program, Progress Re- port for FY96, page 55, 1997.
[4] W. H. Ray. Advanced Process Control. McGraw- Hill, New York, 1981.
[5] B. 0. Recke and S. B. Jorgensen. Nonlinear dy- namics and control of a recycle fixed bed reactor. In Proc. of the 1997 American Control Confer- ence, pages 2218-2222,1997.
[6] P. D. Christofides and P. Daoutidis. Feedback control of hyperbolic PDE systems. AIChE J., 42(11):3063-3086,1996.
[7] K. R. Muske and J . B. Rawlings. Nonlinear mov- ing horizon state estimation. In R. Berber, editor, Methods of Model Based Process Control, pages 349-365,1995.