Embed Size (px)
Citation preview
Electronic Supplementary Information for:
Oxidation suppression during hydrothermal phase reversion allows synthesis of monolayer semiconducting MoS2 in stable aqueous suspension
Zhongying Wanga, Yin-Jia Zhangb, Muchun Liub, Andrew Petersona,c, Robert H. Hurta,c,*
a School of Engineering, b Department of Chemistry, cInstitute for Molecular and Nanoscale Innovation, Brown University, Providence, RI 02912, United States
Table of contents
1. Material Characterization
2. Colloidal Behavior of MoS2 Produced Hydrothermally Without Oxidation Protection
3. Additional Characterization of 1H-MoS2 Nanosheets from the Improved Synthesis Method
4. Applicability of oxygen-suppressed hydrothermal reaction to other TMDs
5. DFT Modelling of Phase-Dependent MoS2 Oxidation Pathways
6. Proposed Corrosion-Type Mechanism for MoS2 Oxidation
----------------------------
1. Material Characterization
The ce-MoS2 suspensions were prepared using a butyllithium intercalation method following previous studies.1,2 As a minor modification, the purification step was changed to anaerobic dialysis (3.5K MWCO dialysis tubing, Thermo Scientific) in a nitrogen-filled glove box to minimize oxidative dissolution, and the resulting ce-MoS2 suspension was stored under N2. The metal-to-semiconductor phase reversion was achieved through hydrothermal reactions in N2, or in air for comparison. Specifically, 10 ml ce-MoS2 suspension (from 40 to 200 mg/L of Mo) were added to a Teflon-lined autoclave (20 ml, Parr Instrument, USA) and heated at various temperatures from 70 - 210 °C for 2 h. The surface temperature of autoclave was measured by a thermocouple probe (3648K32, McMaster–Carr, Inc.). To study oxidation kinetics, ce-MoS2 and hydrothermally-treated nanosheet suspensions were added to HEPES buffer (pH 7) and incubated for predetermined time. Afterwards, the intact nanosheets were removed using centrifugal ultrafiltration (Amicon Ultra-4 3k) at 4000 rpm for 30 min, and the concentrations of soluble Mo species in the supernatant were determined by ICP-OES (JY 2000 Ultrace).
Electronic Supplementary Material (ESI) for Nanoscale.This journal is © The Royal Society of Chemistry 2017
UV-vis absorption spectra were collected in a Jasco V-630 spectrophotometer over the range 350 to 800 nm. XPS measurements were performed using a Thermo Scientific K-Alpha XPS. Surface scans were averaged over 20 runs. Material morphology characterization was carried out using field emission SEM (LEO 1530 VP), atomic force microscopy (Asylum MFP-3D Origin AFM) and high-resolution scanning transition electron microscopy (JEOL 2100F). Photoluminescence measurements were acquired under 532nm laser excitation (Coherent, Verdi) through an inverted microscope (Nikon, TE2000) coupled to an Schmidt-Czerney-Turner spectrograph (Princeton Instruments, IsoPlane SCT-320) with an electron-multiplying CCD camera (Princeton Instruments, ProEM 512BK).
2. Colloidal Behavior of MoS2 Produced Hydrothermally Without Oxidation Protection
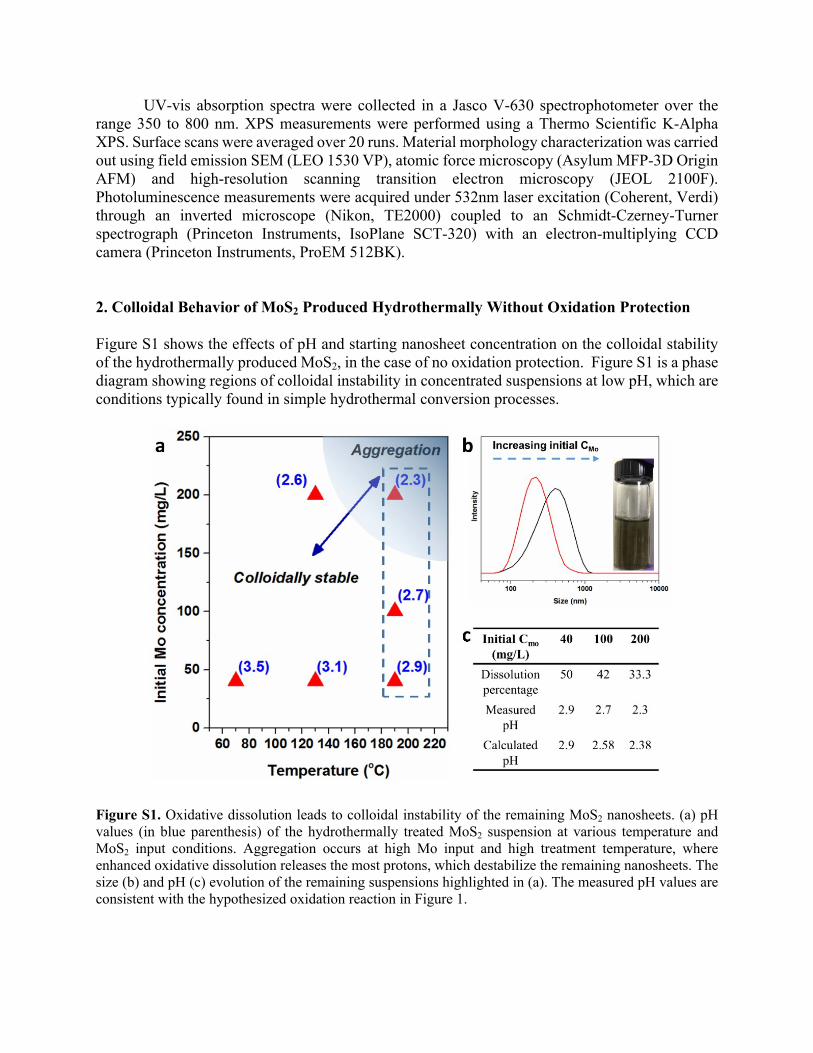
Figure S1 shows the effects of pH and starting nanosheet concentration on the colloidal stability of the hydrothermally produced MoS2, in the case of no oxidation protection. Figure S1 is a phase diagram showing regions of colloidal instability in concentrated suspensions at low pH, which are conditions typically found in simple hydrothermal conversion processes.
Figure S1. Oxidative dissolution leads to colloidal instability of the remaining MoS2 nanosheets. (a) pH values (in blue parenthesis) of the hydrothermally treated MoS2 suspension at various temperature and MoS2 input conditions. Aggregation occurs at high Mo input and high treatment temperature, where enhanced oxidative dissolution releases the most protons, which destabilize the remaining nanosheets. The size (b) and pH (c) evolution of the remaining suspensions highlighted in (a). The measured pH values are consistent with the hypothesized oxidation reaction in Figure 1.
3. Further Characterization of 1H-MoS2 Nanosheets from the Improved Synthesis Method
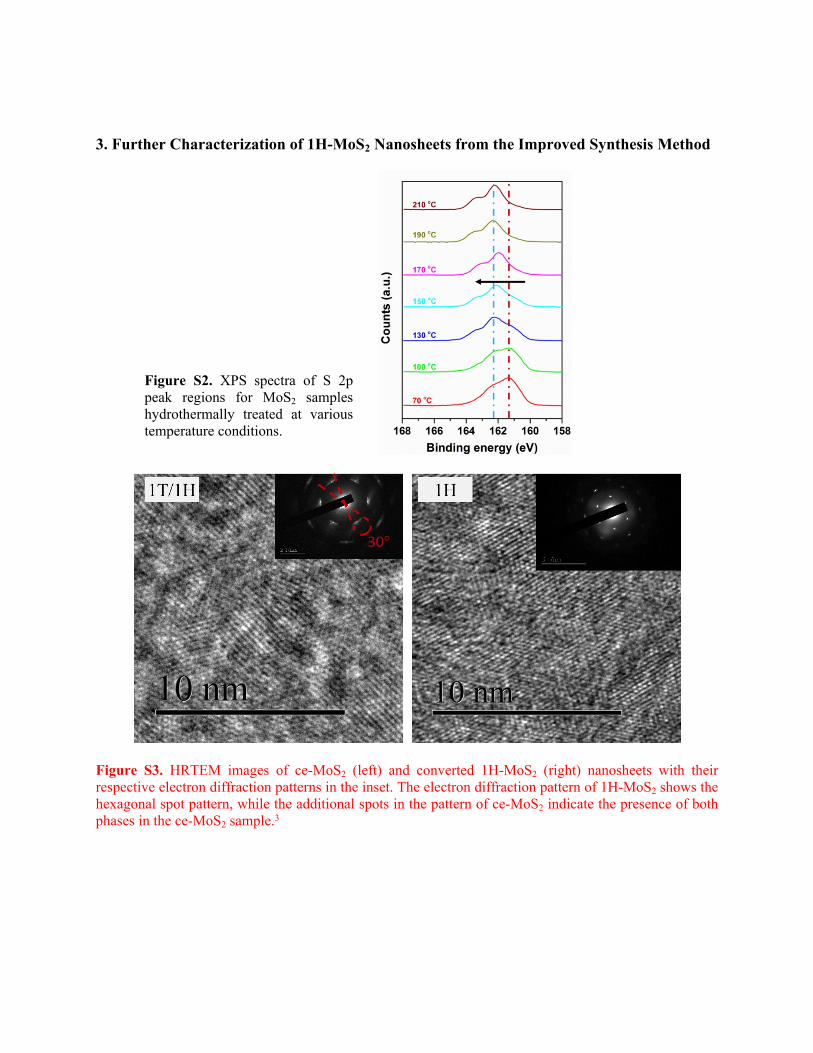
Figure S2. XPS spectra of S 2p peak regions for MoS2 samples hydrothermally treated at various temperature conditions.
Figure S3. HRTEM images of ce-MoS2 (left) and converted 1H-MoS2 (right) nanosheets with their respective electron diffraction patterns in the inset. The electron diffraction pattern of 1H-MoS2 shows the hexagonal spot pattern, while the additional spots in the pattern of ce-MoS2 indicate the presence of both phases in the ce-MoS2 sample.3
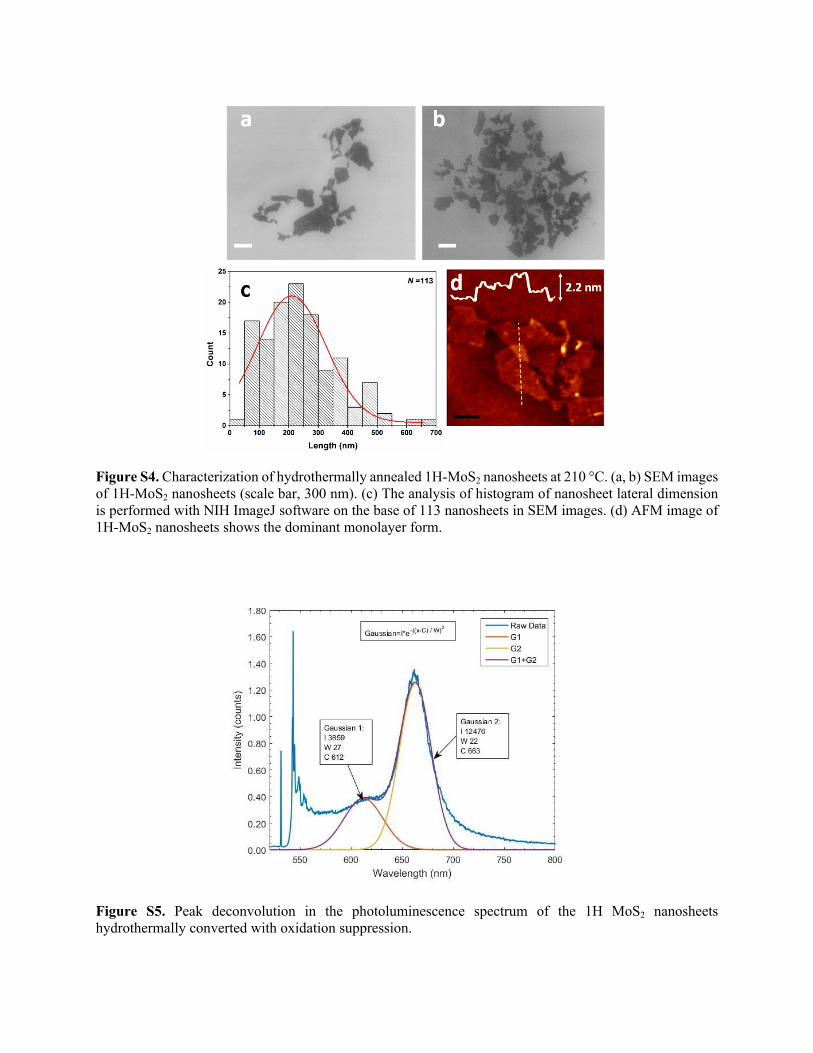
Figure S4. Characterization of hydrothermally annealed 1H-MoS2 nanosheets at 210 °C. (a, b) SEM images of 1H-MoS2 nanosheets (scale bar, 300 nm). (c) The analysis of histogram of nanosheet lateral dimension is performed with NIH ImageJ software on the base of 113 nanosheets in SEM images. (d) AFM image of 1H-MoS2 nanosheets shows the dominant monolayer form.
Figure S5. Peak deconvolution in the photoluminescence spectrum of the 1H MoS2 nanosheets hydrothermally converted with oxidation suppression.
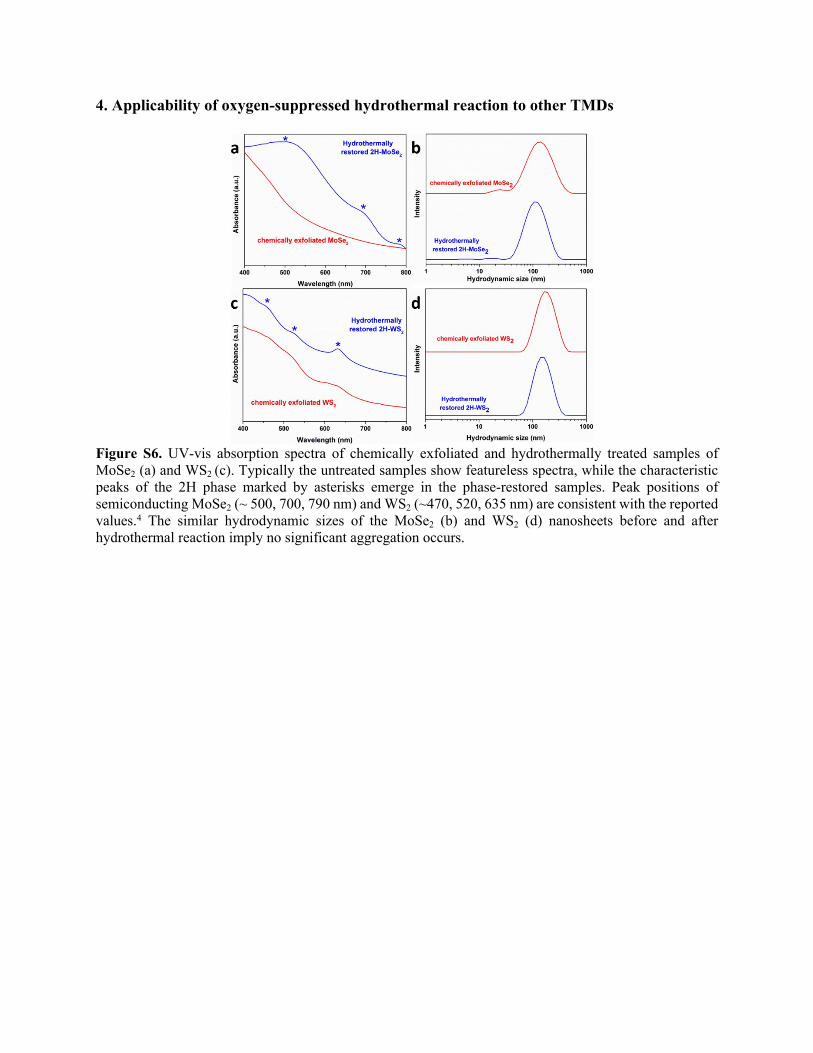
4. Applicability of oxygen-suppressed hydrothermal reaction to other TMDs
Figure S6. UV-vis absorption spectra of chemically exfoliated and hydrothermally treated samples of MoSe2 (a) and WS2 (c). Typically the untreated samples show featureless spectra, while the characteristic peaks of the 2H phase marked by asterisks emerge in the phase-restored samples. Peak positions of semiconducting MoSe2 (~ 500, 700, 790 nm) and WS2 (~470, 520, 635 nm) are consistent with the reported values.4 The similar hydrodynamic sizes of the MoSe2 (b) and WS2 (d) nanosheets before and after hydrothermal reaction imply no significant aggregation occurs.
5. DFT Modelling of Phase-dependent MoS2 Oxidation Pathways
All electronic structure calculations were carried out in planewave density functional theory (DFT) using the DACAPO calculator. The atomic models were built in the Atomic Simulation Environment (ASE).5,6 The planewave cutoff employed was 340.15 eV, the density cutoff was 500 eV. The RPBE exchange correlation functional was used,7 and a Fermi temperature of 0.1 eV was employed and extrapolated to 0 K. For surfaces with adsorbates, an electrostatic correction was added along the z-axis to counter an induced dipole. k-point sampling was 1 4 1 for 1-× ×dimensional periodic surfaces, 4 4 1 for 2-dimensional periodic 1T surfaces, and 6 4 1 for × × × ×2-dimensional periodic 1T’ surfaces. The structures were optimized until the maximum force on any unconstrained atoms was less than 0.05 eV/Å. The free energy was calculated by adding the potential energy of the surfaces (E), zero-point vibrational energy (UZPE), enthalpic temperature
correction ( ), and the entropy contributions (-TS). Vibrational modes of adsorbates were ∫𝐶𝑣𝑑𝑇
analyzed using harmonic approximation under the assumption that the surface vibrational modes are not affected by adsorbates on it. The Computational Hydrogen Electrode (CHE) model was used to estimate the free energy of (H++e-) at 0 VRHE as half of an H2 molecule free energy.8,9
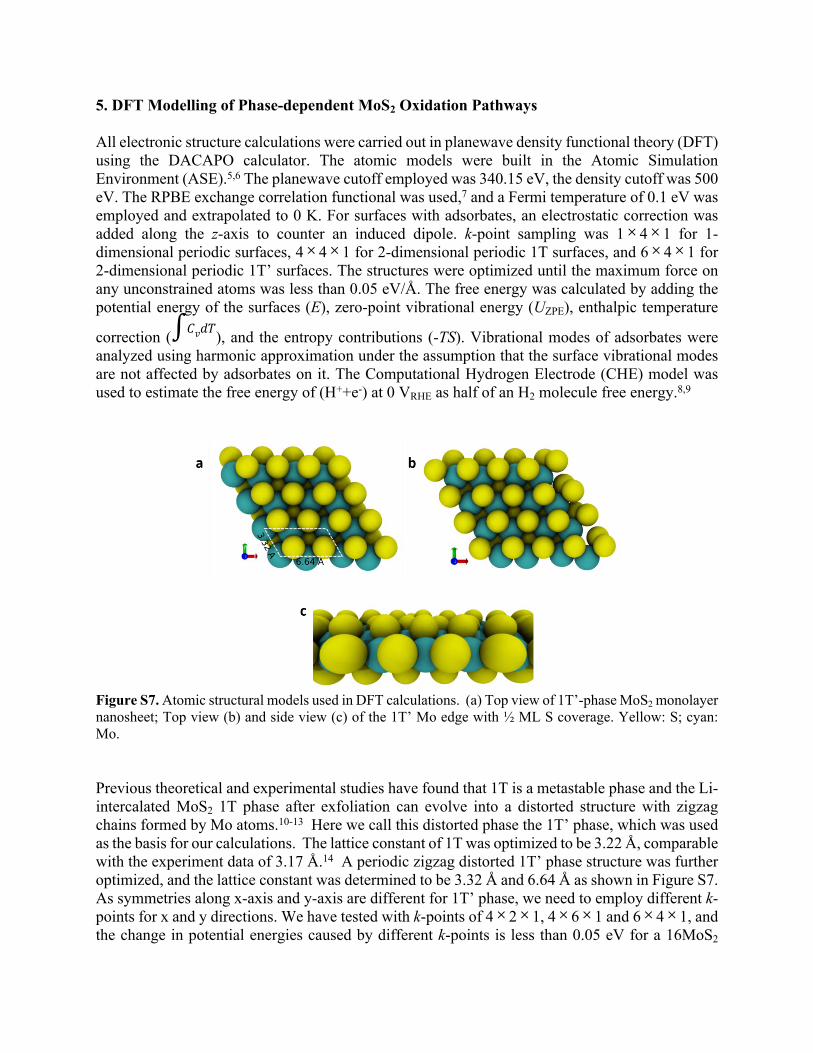
Figure S7. Atomic structural models used in DFT calculations. (a) Top view of 1T’-phase MoS2 monolayer nanosheet; Top view (b) and side view (c) of the 1T’ Mo edge with ½ ML S coverage. Yellow: S; cyan: Mo.
Previous theoretical and experimental studies have found that 1T is a metastable phase and the Li-intercalated MoS2 1T phase after exfoliation can evolve into a distorted structure with zigzag chains formed by Mo atoms.10-13 Here we call this distorted phase the 1T’ phase, which was used as the basis for our calculations. The lattice constant of 1T was optimized to be 3.22 Å, comparable with the experiment data of 3.17 Å.14 A periodic zigzag distorted 1T’ phase structure was further optimized, and the lattice constant was determined to be 3.32 Å and 6.64 Å as shown in Figure S7. As symmetries along x-axis and y-axis are different for 1T’ phase, we need to employ different k-points for x and y directions. We have tested with k-points of 4 2 1, 4 6 1 and 6 4 1, and × × × × × ×the change in potential energies caused by different k-points is less than 0.05 eV for a 16MoS2
cell. The 16MoS2 cell in 1T’ phase is 4.29 eV more stable than its 1T phase, which is consistent with the results in the literature above. The 1T phase with oxygen species adsorbates were also calculated and relaxed, but the optimized configuration shows a Mo zigzag distorted pattern in the surface, indicating the metastable property of 1T phase. The unit cell size of all surfaces is 4Mo
4Mo. The MoS2 chain farthest from the Mo edge was fixed during structure optimization for ×surfaces with adsorbates.
6. Proposed Corrosion-Type Mechanism for MoS2 Oxidation
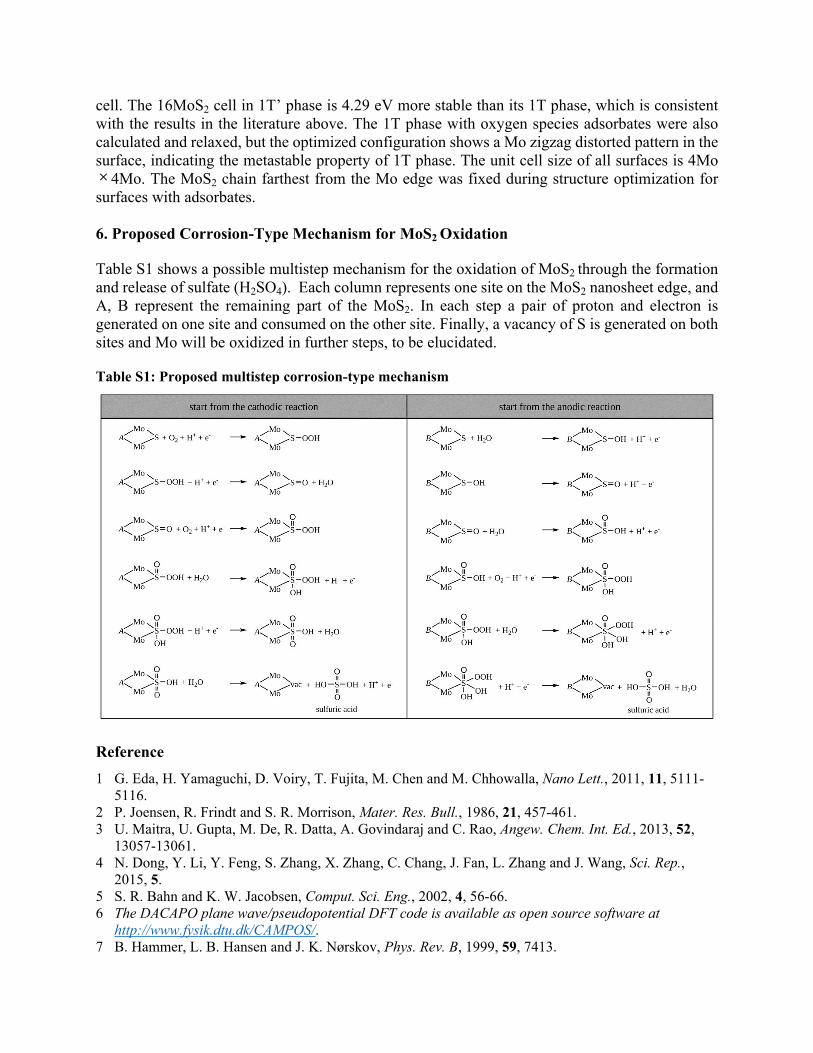
Table S1 shows a possible multistep mechanism for the oxidation of MoS2 through the formation and release of sulfate (H2SO4). Each column represents one site on the MoS2 nanosheet edge, and A, B represent the remaining part of the MoS2. In each step a pair of proton and electron is generated on one site and consumed on the other site. Finally, a vacancy of S is generated on both sites and Mo will be oxidized in further steps, to be elucidated.
Table S1: Proposed multistep corrosion-type mechanism
Reference1 G. Eda, H. Yamaguchi, D. Voiry, T. Fujita, M. Chen and M. Chhowalla, Nano Lett., 2011, 11, 5111-
5116.2 P. Joensen, R. Frindt and S. R. Morrison, Mater. Res. Bull., 1986, 21, 457-461.3 U. Maitra, U. Gupta, M. De, R. Datta, A. Govindaraj and C. Rao, Angew. Chem. Int. Ed., 2013, 52,
13057-13061.4 N. Dong, Y. Li, Y. Feng, S. Zhang, X. Zhang, C. Chang, J. Fan, L. Zhang and J. Wang, Sci. Rep.,
2015, 5.5 S. R. Bahn and K. W. Jacobsen, Comput. Sci. Eng., 2002, 4, 56-66.6 The DACAPO plane wave/pseudopotential DFT code is available as open source software at
http://www.fysik.dtu.dk/CAMPOS/.7 B. Hammer, L. B. Hansen and J. K. Nørskov, Phys. Rev. B, 1999, 59, 7413.

8 J. K. Nørskov, J. Rossmeisl, A. Logadottir, L. Lindqvist, J. R. Kitchin, T. Bligaard and H. Jonsson, J. Phys. Chem. B, 2004, 108, 17886-17892.
9 A. A. Peterson, F. Abild-Pedersen, F. Studt, J. Rossmeisl and J. K. Nørskov, Energy Environ. Sci., 2010, 3, 1311-1315.
10 X.-L. Fan, Y. Yang, P. Xiao and W.-M. Lau, J. Mater. Chem. A, 2014, 2, 20545-20551.11 D. Voiry, A. Mohite and M. Chhowalla, Chem. Soc. Rev., 2015, 44, 2702-2712.12 G. Eda, T. Fujita, H. Yamaguchi, D. Voiry, M. Chen and M. Chhowalla, ACS Nano, 2012, 6, 7311-
7317.13 J. Heising and M. G. Kanatzidis, J. Am. Chem. Soc., 1999, 121, 638-643.14 R. E. Bell and R. E. Herfert, J. Am. Chem. Soc., 1957, 79, 3351-3354.