Embed Size (px)
Citation preview
Contributions of the California
Dairy Industry to the
California Economy
A Report for the
California Milk Advisory Board
University of California Agricultural Issues Center
May 14, 2015
Daniel A. Sumner, Josué Medellín-Azuara and Eric Coughlin*
*Daniel A. Sumner is the director of the University of California Agricultural
Issues Center (AIC) and holds the Frank H. Buck Jr. Chair Professorship in the
Department of Agricultural and Resource Economics, U.C. Davis. Josué Medellín-
Azuara is a project scientist at the U.C. Davis Center for Watershed Sciences, and
Eric Coughlin is a junior research specialist at AIC.
1
Contributions of the California Dairy Industry to the California Economy
Report for the California Milk Advisory Board
Executive Summary
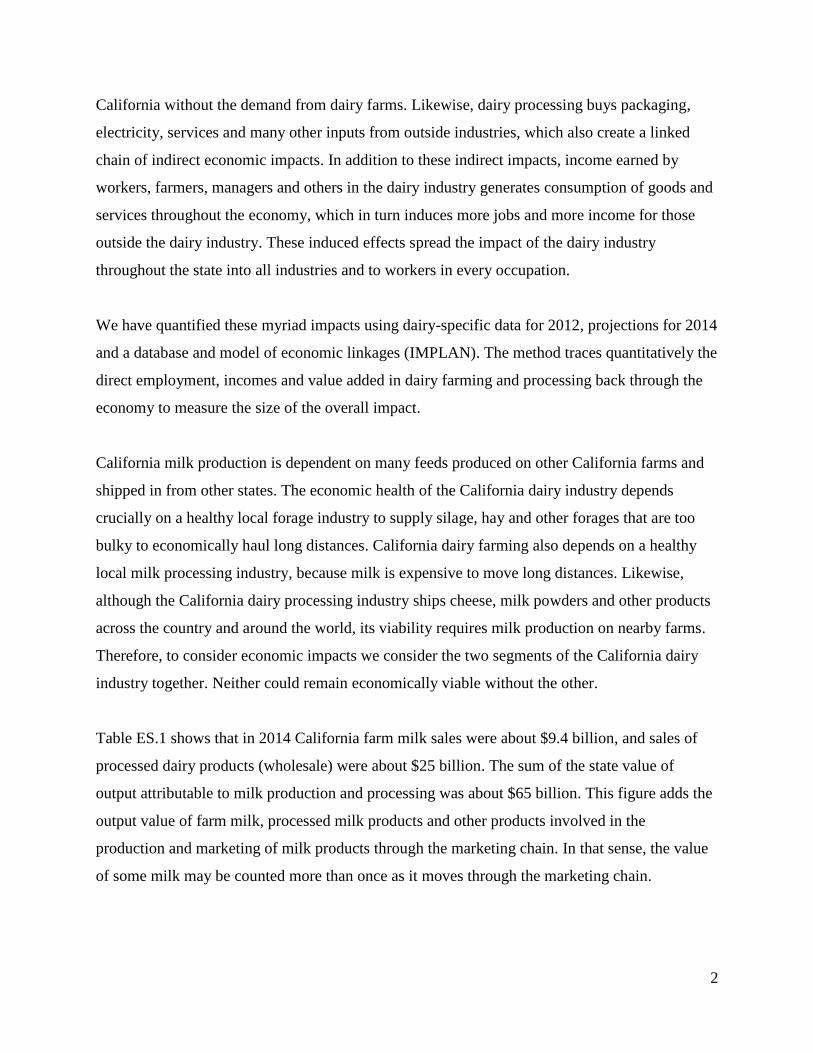
The California dairy industry is large, dynamic and closely linked to other parts of agriculture
and the California economy. The California dairy industry is by far the largest of any state in the
United States. California produces 40 percent more milk and California milk production and
processing contribute about double the jobs compared to Wisconsin, the second-largest milk
producer. California milk production and processing are closely linked. Almost all the milk
produced in California is also processed here, and almost all the milk processed in California is
produced on farms in California. That said, about 40 percent of the milk produced and processed
in California is shipped out of state in the form of cheese, whey, lactose, milk powders, butter
and other processed products and used in other parts of the United States and around the world.
Using well-established methods, we document linkages from milk production and processing
industries to the rest of the California economy and measure how dairy farming and processing
contribute to income and jobs throughout the economy. In 2014, California milk production and
processing contributed about $65 billion in total sales. Of this, $9.4 billion were from sales of
milk from the farm to processors, about $25 billion were from sales of processed dairy products
and the rest were sales from associated industries. Being careful to remove any double counting
of economic activity, the dairy industry contributed about $21 billion in value added to the gross
state product in 2014. Of this, about $5 billion were value added on the farm, $2.4 billion were
value added directly in processing and the rest were value added in associated industries and
activities. About 190,000 jobs in California were dependent on the state’s milk production and
processing. Of these, about 30,000 were on dairy farms, 20,000 were in dairy processing and the
rest were in associated industries and activities.
The economic contributions of the dairy industry begin with inputs to the dairy farms. California
dairy farms buy inputs, including feed, and services, such as veterinary treatments, from other
industries. These input purchases create indirect economic activity that would not occur in
2
California without the demand from dairy farms. Likewise, dairy processing buys packaging,
electricity, services and many other inputs from outside industries, which also create a linked
chain of indirect economic impacts. In addition to these indirect impacts, income earned by
workers, farmers, managers and others in the dairy industry generates consumption of goods and
services throughout the economy, which in turn induces more jobs and more income for those
outside the dairy industry. These induced effects spread the impact of the dairy industry
throughout the state into all industries and to workers in every occupation.
We have quantified these myriad impacts using dairy-specific data for 2012, projections for 2014
and a database and model of economic linkages (IMPLAN). The method traces quantitatively the
direct employment, incomes and value added in dairy farming and processing back through the
economy to measure the size of the overall impact.
California milk production is dependent on many feeds produced on other California farms and
shipped in from other states. The economic health of the California dairy industry depends
crucially on a healthy local forage industry to supply silage, hay and other forages that are too
bulky to economically haul long distances. California dairy farming also depends on a healthy
local milk processing industry, because milk is expensive to move long distances. Likewise,
although the California dairy processing industry ships cheese, milk powders and other products
across the country and around the world, its viability requires milk production on nearby farms.
Therefore, to consider economic impacts we consider the two segments of the California dairy
industry together. Neither could remain economically viable without the other.
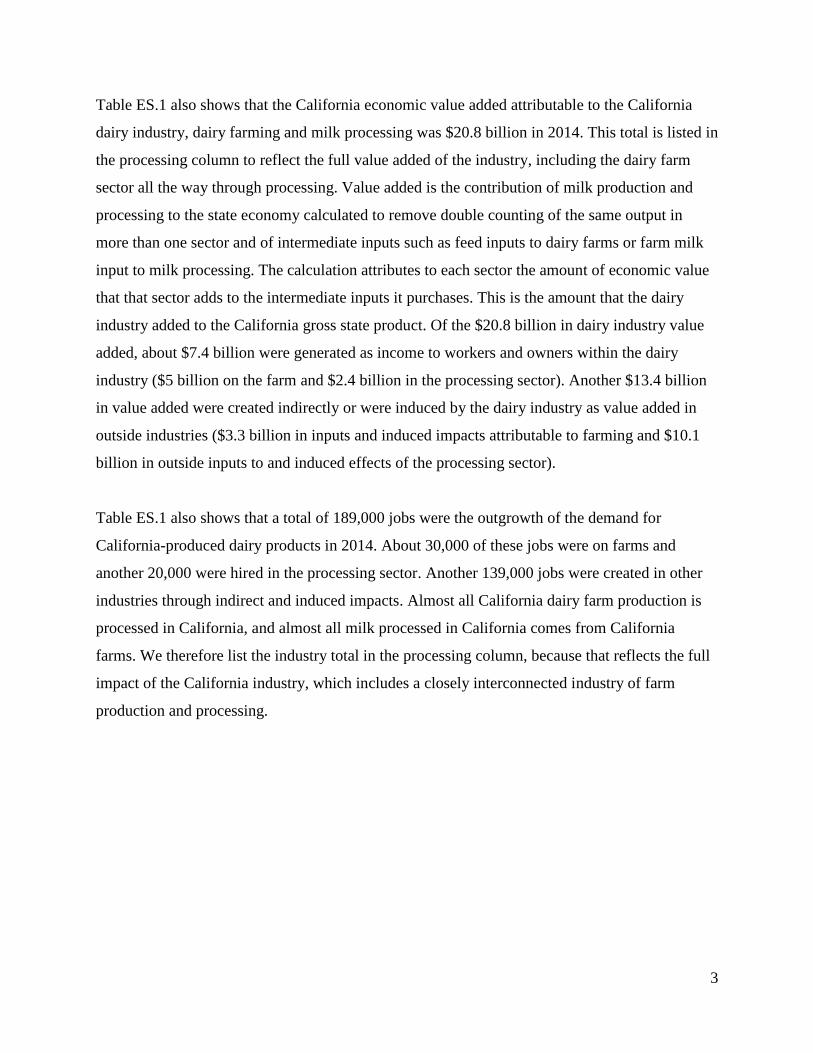
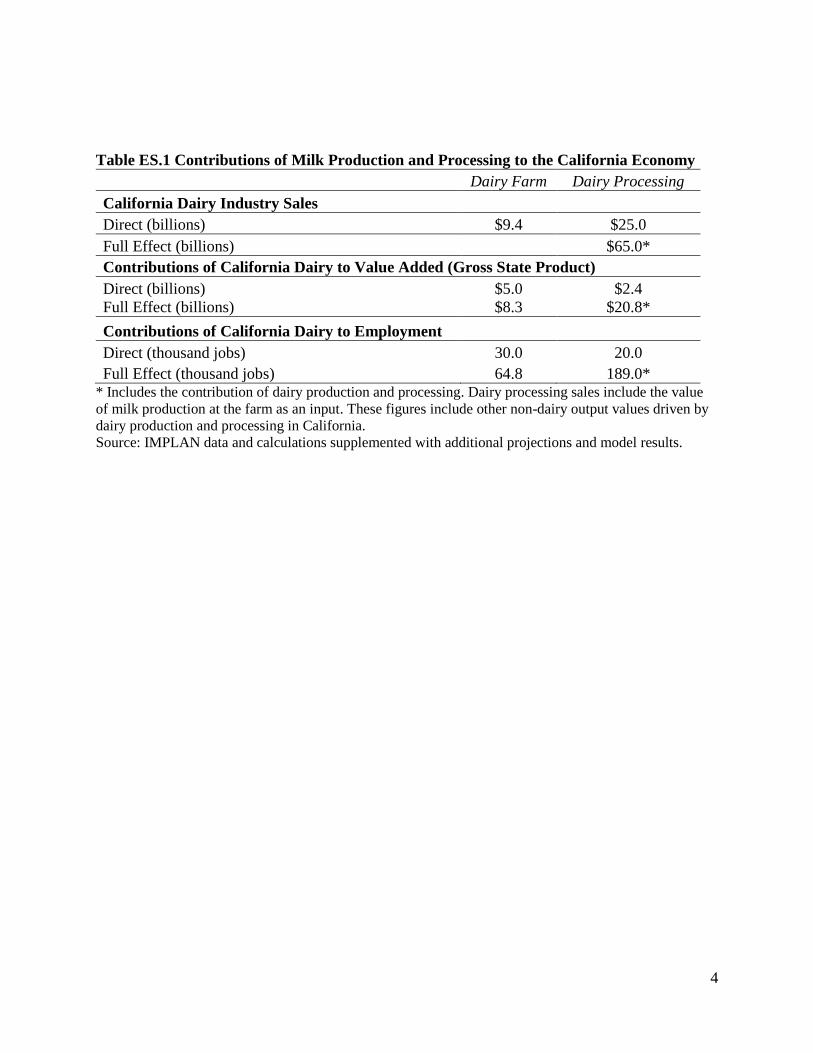
Table ES.1 shows that in 2014 California farm milk sales were about $9.4 billion, and sales of
processed dairy products (wholesale) were about $25 billion. The sum of the state value of
output attributable to milk production and processing was about $65 billion. This figure adds the
output value of farm milk, processed milk products and other products involved in the
production and marketing of milk products through the marketing chain. In that sense, the value
of some milk may be counted more than once as it moves through the marketing chain.
3
Table ES.1 also shows that the California economic value added attributable to the California
dairy industry, dairy farming and milk processing was $20.8 billion in 2014. This total is listed in
the processing column to reflect the full value added of the industry, including the dairy farm
sector all the way through processing. Value added is the contribution of milk production and
processing to the state economy calculated to remove double counting of the same output in
more than one sector and of intermediate inputs such as feed inputs to dairy farms or farm milk
input to milk processing. The calculation attributes to each sector the amount of economic value
that that sector adds to the intermediate inputs it purchases. This is the amount that the dairy
industry added to the California gross state product. Of the $20.8 billion in dairy industry value
added, about $7.4 billion were generated as income to workers and owners within the dairy
industry ($5 billion on the farm and $2.4 billion in the processing sector). Another $13.4 billion
in value added were created indirectly or were induced by the dairy industry as value added in
outside industries ($3.3 billion in inputs and induced impacts attributable to farming and $10.1
billion in outside inputs to and induced effects of the processing sector).
Table ES.1 also shows that a total of 189,000 jobs were the outgrowth of the demand for
California-produced dairy products in 2014. About 30,000 of these jobs were on farms and
another 20,000 were hired in the processing sector. Another 139,000 jobs were created in other
industries through indirect and induced impacts. Almost all California dairy farm production is
processed in California, and almost all milk processed in California comes from California
farms. We therefore list the industry total in the processing column, because that reflects the full
impact of the California industry, which includes a closely interconnected industry of farm
production and processing.
4
Table ES.1 Contributions of Milk Production and Processing to the California Economy
Dairy Farm Dairy Processing
California Dairy Industry Sales
Direct (billions) $9.4 $25.0
Full Effect (billions) $65.0*
Contributions of California Dairy to Value Added (Gross State Product)
Direct (billions) $5.0 $2.4
Full Effect (billions) $8.3 $20.8*
Contributions of California Dairy to Employment
Direct (thousand jobs) 30.0 20.0
Full Effect (thousand jobs) 64.8 189.0* * Includes the contribution of dairy production and processing. Dairy processing sales include the value
of milk production at the farm as an input. These figures include other non-dairy output values driven by
dairy production and processing in California.
Source: IMPLAN data and calculations supplemented with additional projections and model results.
5
Introduction
Milk is the most important agricultural commodity produced in California by farm revenue, and
California produces far more milk than any other state. But the dairy industry in California
extends far beyond the farm gate to include milk distribution and processing into a huge variety
of food ingredients and consumer goods, including butter, dry milk powder, whey, cheese,
yogurt, ice cream and many fluid milk products.
After briefly describing recent economic patterns and trends of the California dairy industry, this
report turns to describing the linkages between the California dairy industry and the rest of the
state’s economy. We summarize these linkages by highlighting the number of jobs in California
that are tied to milk production and processing and how much the industry contributes to the
economic gross state product.
Section 1 provides the background and context with a series of charts and tables. It then
discusses the methodology we use to measure linkages. Section 2 provides detailed data on sales,
jobs and value added of the California dairy industry and the dairy industry in the San Joaquin
Valley, which produces 90 percent of the milk in California.
6
Section 1. Background, Context and Methods for the Economic Contributions of the
California Dairy Industry
1.1 Economic Background and Context of California Milk Production and Processing
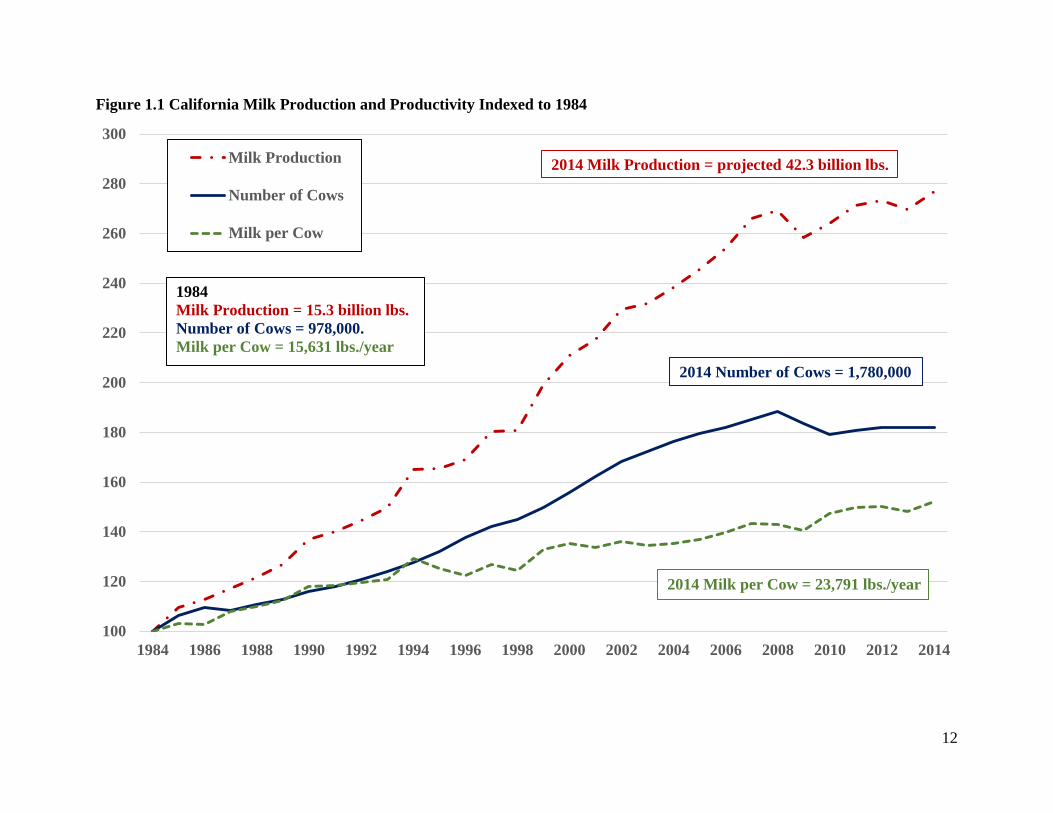
In 1984, California dairies produced just more than 15 billion pounds of milk; in 2014, milk
production in California was a little more than 42 billion pounds. This increase in milk
production is a result of an increased number of cows (until 2008) and continued increases in
milk per cow. As Figure 1.1 shows, from 1984 to 2008 the number of cows on farms increased
about 88 percent, starting at 978,000 cows in 1984. Since 2008, the number of cows has declined
slightly to 1,780,000 cows in 2014. Milk per cow has increased steadily. Since 1984, milk per
cow in California has increased approximately 50 percent, from 15,631 pounds of milk per cow
per year to almost 24,000 pounds per cow per year in 2014.
For the past eight years, California milk production has continued its recent trend of gradual
year-over-year increases. Figure 1.1 documents that even with declines in 2009 and 2013, milk
production during the last decade has increased. The rate of growth was much faster until 2008,
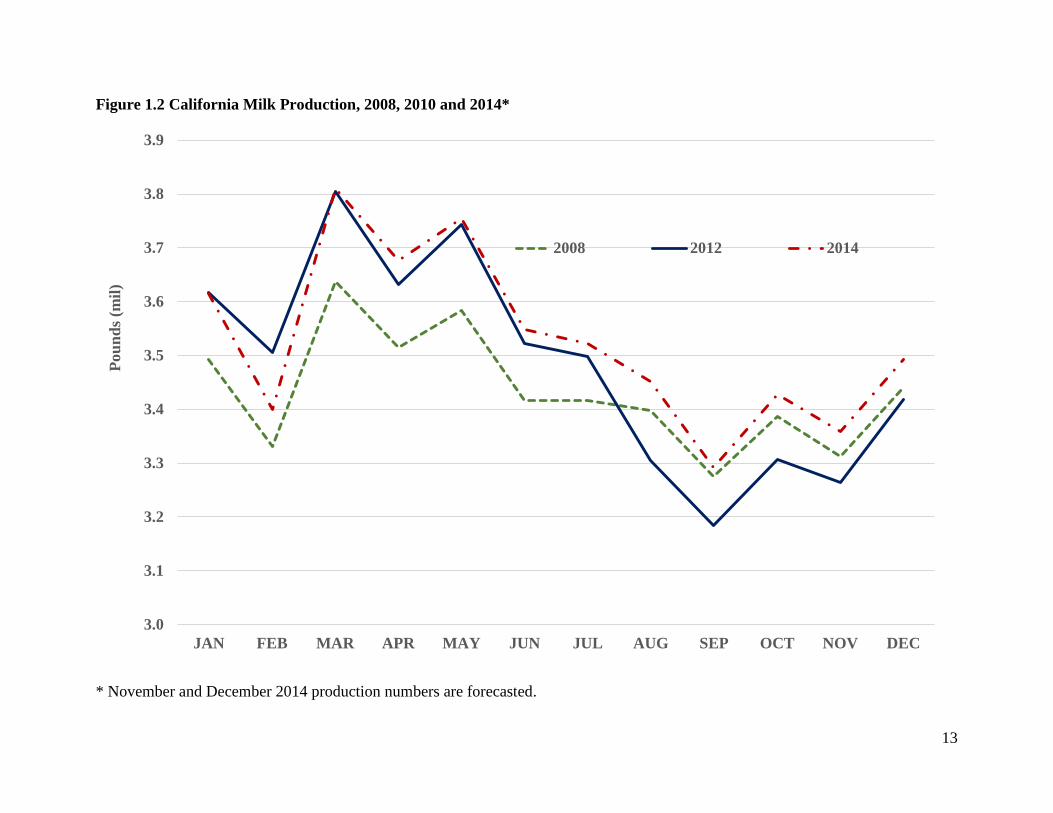
and milk production has nearly tripled during the past three decades. Figure 1.2 shows that
California milk production in 2014 was higher during each month than in 2008 and 2012, with
the exception February 2012, which had 29 days.
California’s increase in the number of milk cows accompanied a decline in the rest of the United
States, resulting in the California share of the national herd rising substantially through 2008. At
the same time, milk per cow rose much more rapidly in the rest of the United States, as dairy
farms in other regions began to adopt California practices and improve their dairy management.
California milk per cow remains well above the national average, but without as clear an
advantage as it held three decades ago.
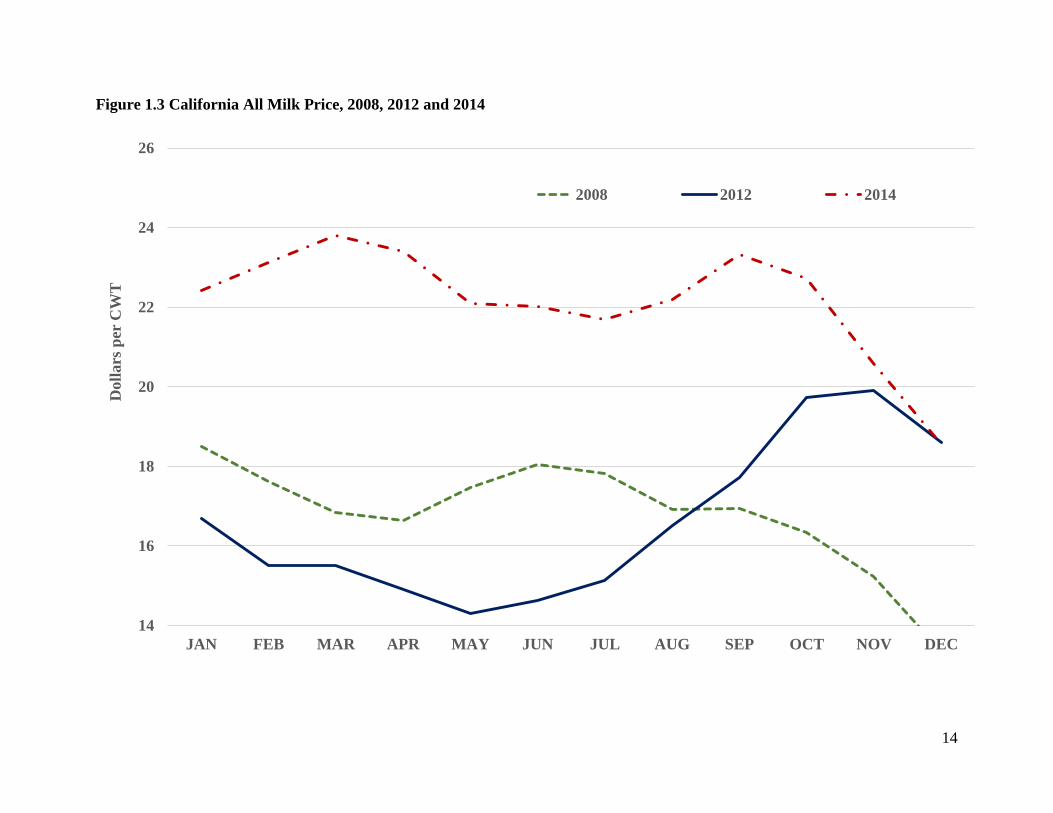
Milk prices in 2014 were much higher than in previous years, before falling precipitously in
December. Figure 1.3 shows the “All Milk” prices on a monthly basis for 2008, 2012 and 2014.
In 2014, prices were in the $22 per cwt range until November and December. The farm revenue
from milk production was about $9.4 billion in 2014, a significant increase over $6.9 billion in
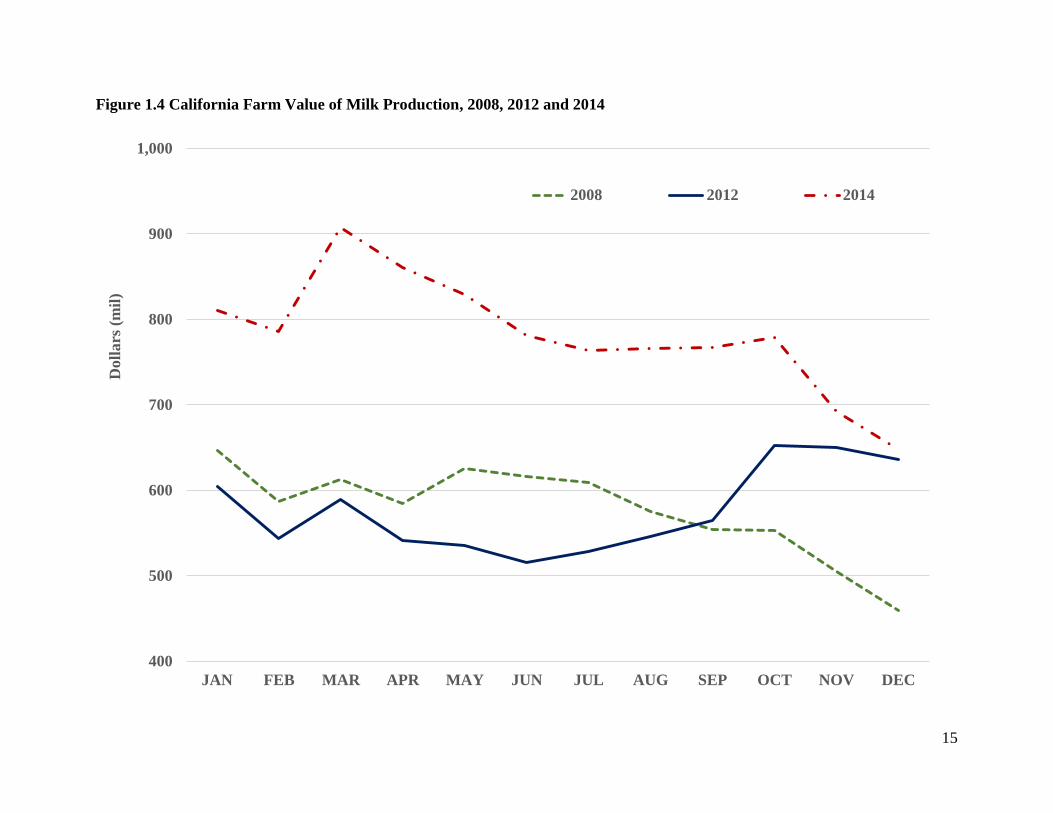
2012. This 36 percent increase was largely due to much higher milk prices in 2014. The value of
7
milk production per month (Figure 1.4) follows prices per month in all three years and declined
dramatically in November and December 2014.
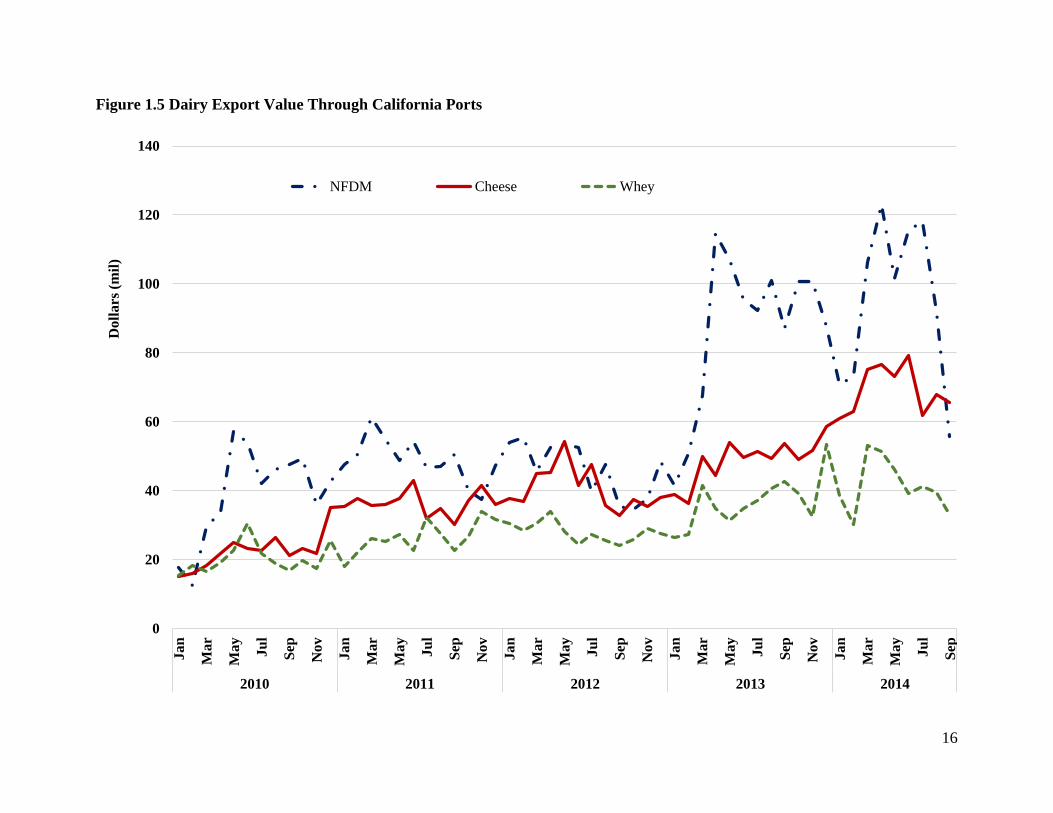
One of the reasons for strong prices in 2014 was a strong export situation for most of the year.
The value of U.S. exports shipped through California ports (mostly from California dairies) was
very high, especially in 2013 and 2014 through September (Figure 1.5). Preliminary data show a
steep decline in exports at the end of 2014.
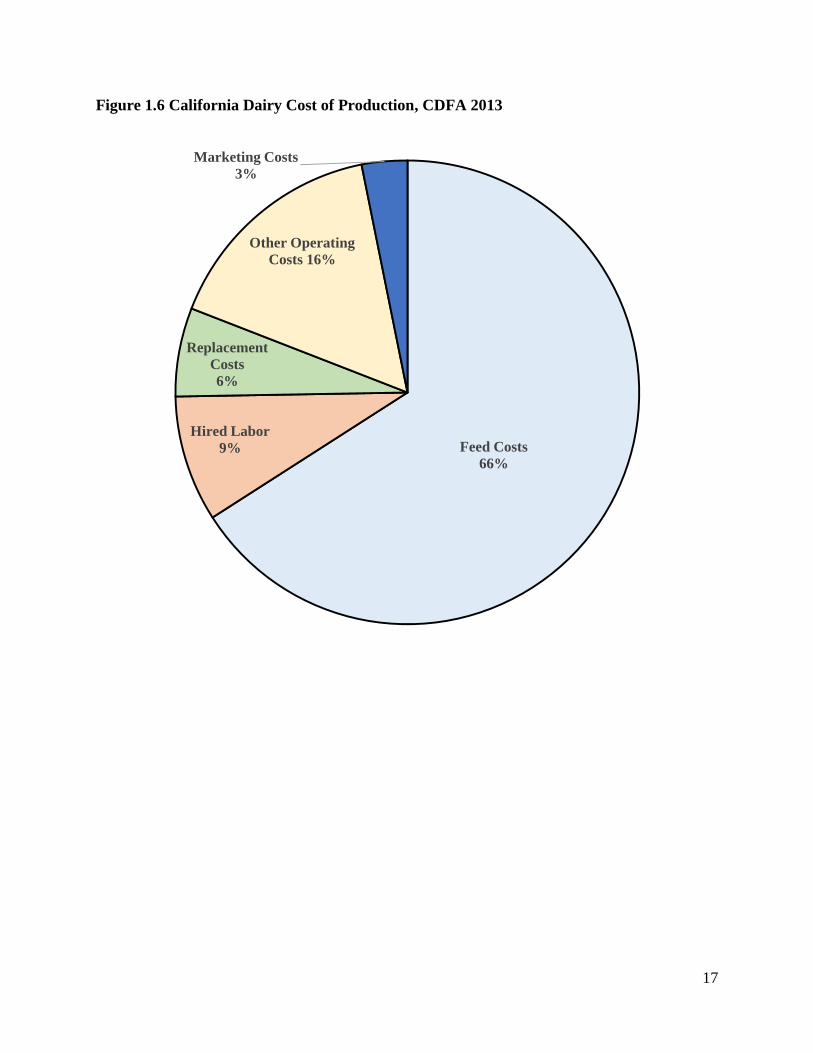
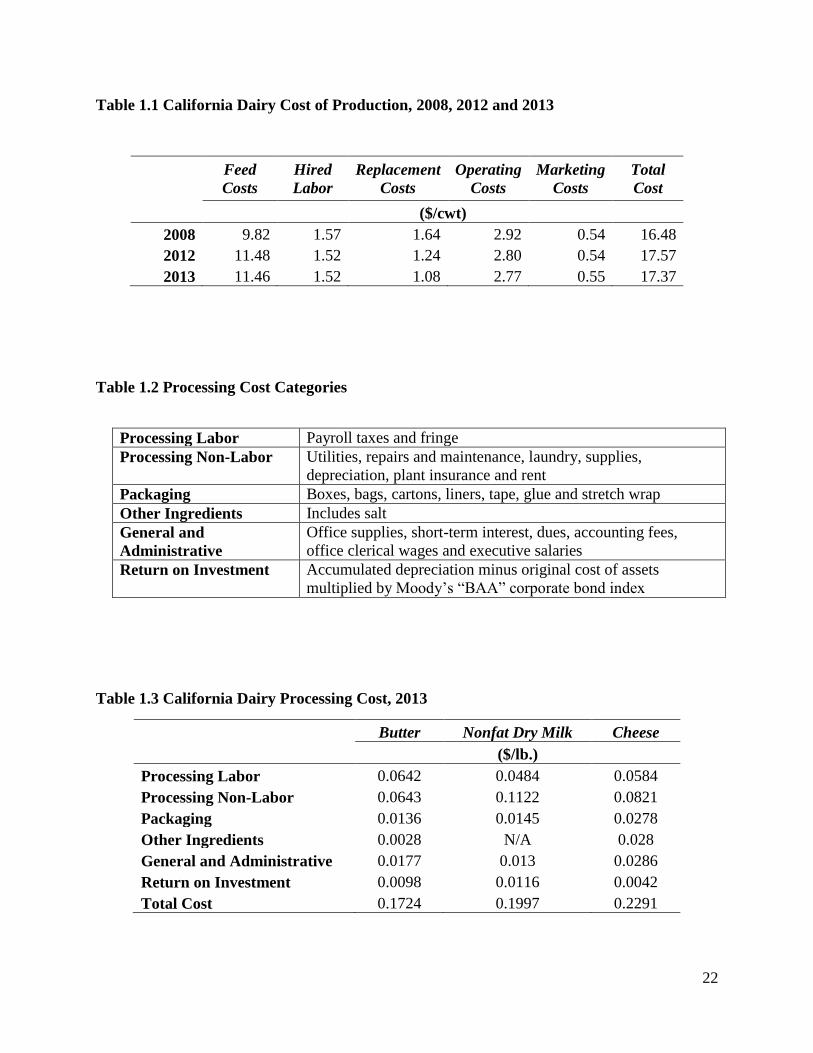
Turning from revenue to costs, Figure 1.6 and Table 1.1 show the distribution of farm production
costs among categories. The main message of Figure 1.6 is the importance of feed costs, which
compose two-thirds of total production costs as measured by the California Department of Food
and Agriculture. Table 1.1 shows that feed costs jumped by about 17 percent from 2008 to 2012
before falling slightly in 2013 (the last year for which data was available). In 2008, feed costs
represented 60 percent of total production costs. During the period from 2008 to 2013, feed costs
per cwt increased by $1.64 per cwt, or 17 percent. During that same time period, every other
production cost decreased except for marketing costs, which remained mostly flat. Overall, feed
costs in 2014 were similar to 2013 on average, with higher forage costs and lower grain and
protein feed costs.
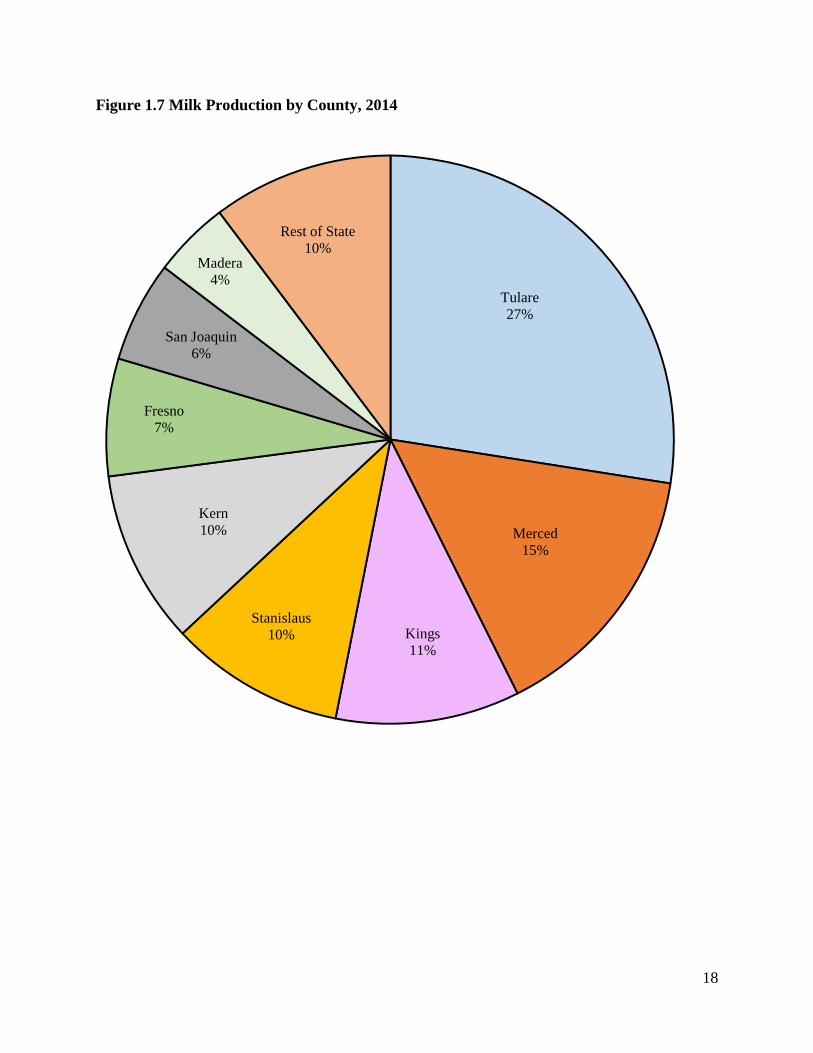
Figure 1.7 shows that about 90 percent of milk production is now concentrated in the eight
counties of the San Joaquin Valley, with more than a quarter of production in Tulare County
alone. Statewide shares of other production regions, such as east of Los Angeles and north of San
Francisco, have declined as dairies moved to the San Joaquin Valley or remained static while
valley dairies grew rapidly.
Farm milk is expensive to haul relative to its unit value, therefore almost all the milk produced in
California is processed within the state. For the same reason, and because bordering states have
small dairy industries compared to California, almost all the milk processed in California is
produced on farms and ranches within the state. These facts are important in assessing the
linkages between farm production and processing.
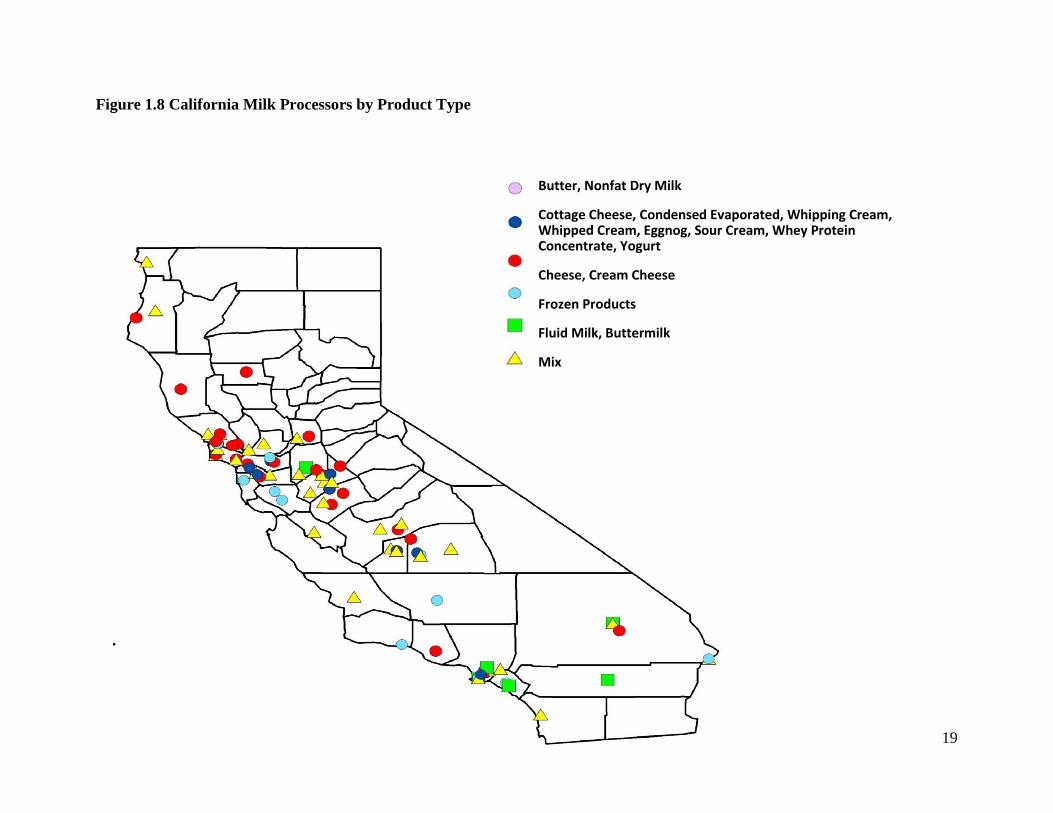
Milk processing is also concentrated in the San Joaquin Valley (Figure 1.8), but is more
geographically dispersed than production. The map shows processing plants by product type but
8
does not show the size of the plants; the largest plants that process the most milk are in the San
Joaquin Valley.
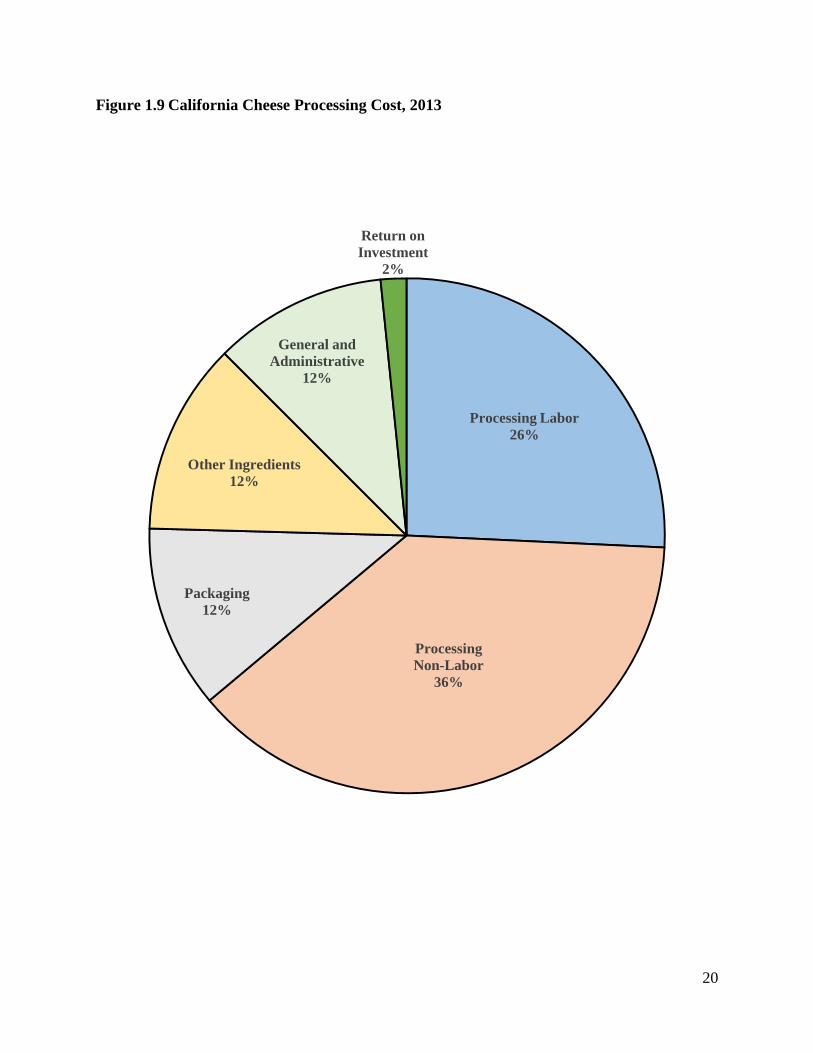
California Department of Food and Agriculture data on milk processing costs (other than the
milk purchased from farms) are defined in Table 1.2, and the distribution of these costs for
cheese production is shown in Figure 1.9. Labor and a whole set of non-labor operating costs are
major input costs in milk processing for cheese and all other products. In 2013, processing costs
were higher for cheese compared to butter and nonfat dry milk (Table 1.3). Cheese processing
costs were close to 23 cents per pound, while nonfat dry milk and butter costs were about 20 and
17 cents per pound, respectively. In all three commodities, non-labor processing was the largest
cost, representing 36 percent of the total cost for cheese, 37 percent of the total cost for butter,
and nearly 56 percent of the total processing cost of nonfat dry milk. Labor processing costs
were the second-largest share across the three commodities, representing 24 percent of nonfat
dry milk processing costs, 37 percent of butter processing costs and 25 percent of cheese
processing costs. This configuration of costs helps us understand how dairy processing links with
the rest of the California economy.
1.2 Modeling and Measuring the Economic Linkages and Contribution
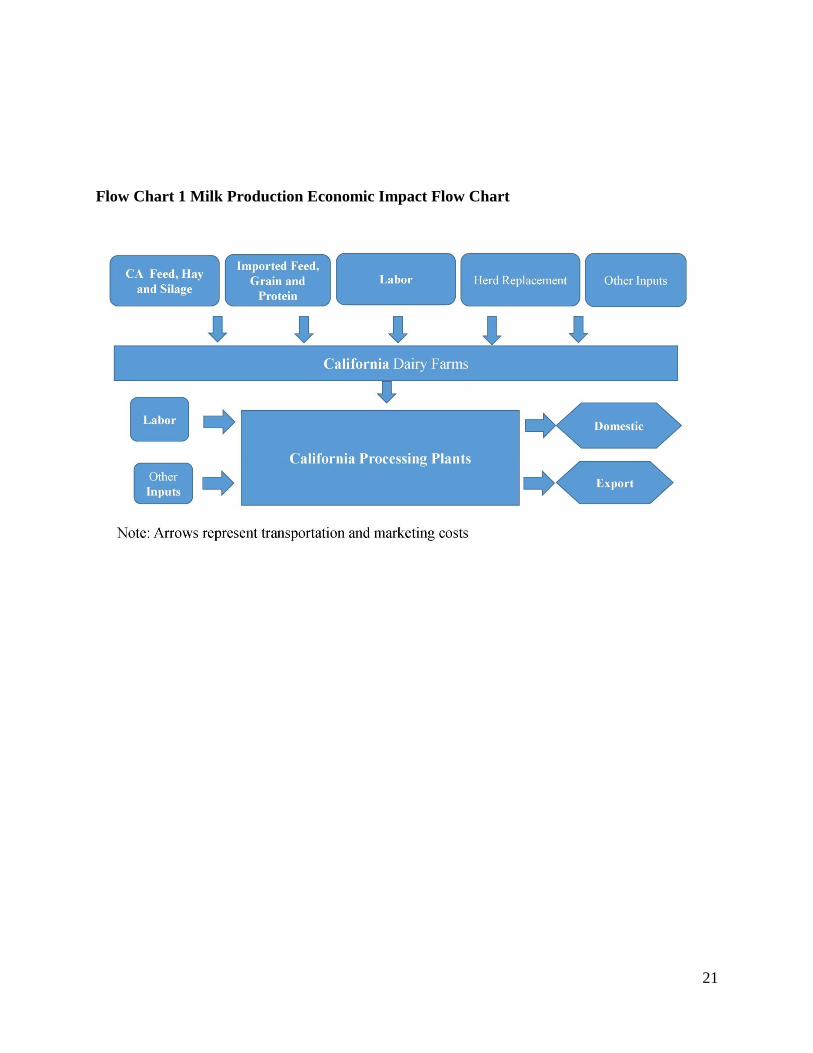
Flow Chart 1 describes economic linkages for California milk production and processing.
California dairy farms use mainly California-produced forage feeds and grains and high-protein
feed shipped into the state from elsewhere. Farm labor, herd replacements and other inputs,
including services, are mostly purchased from California suppliers. The dairy farms supply
processing plants within California, and those plants use labor and a variety of other inputs and
capital goods to make products that are then sold in California and in the rest of the United States
or exported, mostly to Asia. Transportation and marketing services are important inputs into the
dairy industry as milk and milk products flow through the economy.
9
Not shown in Flow Chart 1 are California economic impacts induced by income spent or saved
by dairy farm workers, farm owners and the many others who earn their living in jobs linked to
milk production and processing.
Our approach to tracing economic linkage and contributions uses an input-output model. Input-
output models link the magnitude of changes in an industry to the associated changes in all the
other industries and segments throughout the economy. An expansion in the demand for milk
produced and processed in California causes more employment and other economic activity on
dairy farms and processing plants. But that additional production and processing causes
increased demand for materials and services supplied by firms from outside the dairy industry,
such as feed, veterinary and accounting services; supplies used on the farm; and electricity,
packaging, equipment and trucking used by processors. Moreover, income generated by this
dairy-induced economic expansion will be spent on other services, from groceries and new cars
to schoolteachers and bus drivers. Input-output models and the associated data on economic
linkages in the economy allow us to quantify these impacts using recent spending and
employment patterns, without leaving out impacts or double counting.
We use the IMPLAN model and database for 2012. These data have a complete set of flows of
purchases among every industry and sector of the economy. It includes separate data on milk
production and marketing, milk processing and other industries with economic linkages to the
dairy business, including how workers and owners spend their incomes when they consume
goods and services.
We report contributions using three standard economic measures that have specific definitions.
Value of Output simply measures the market prices multiplied by the quantities of outputs or
services produced by an industry. For example, the value of milk output is just the average farm
price of milk produced in California, and the value of output for milk processing plants is the
sum of the prices multiplied by the quantities of each dairy product manufactured.
Value Added measures salaries and wages, proprietor income and profit and indirect business
taxes. Value added is that portion of value of output contributed by labor and capital within the
dairy industry. The dairy industry’s value added is its economic contribution above the cost of
10
goods and services that were purchased from other sectors and were therefore already measured
as the outputs of those sectors. When we consider dairy farming and processing separately, we
recognize that milk purchased from farms is the major cost item for processors. So when
measuring the contribution of processing to the economy we must “net-out” the value of the milk
purchased before assigning the value that was added in the processing stage. Value added is an
industry’s contribution to the size of the California economy, with no double counting of output
that is sold from one industry to the next.
Employment is defined as the number of jobs, including part-time or seasonal employment,
within an industry. These jobs include the business owners and family members who share in
entrepreneurial income as well as full-time and part-time hired workers.
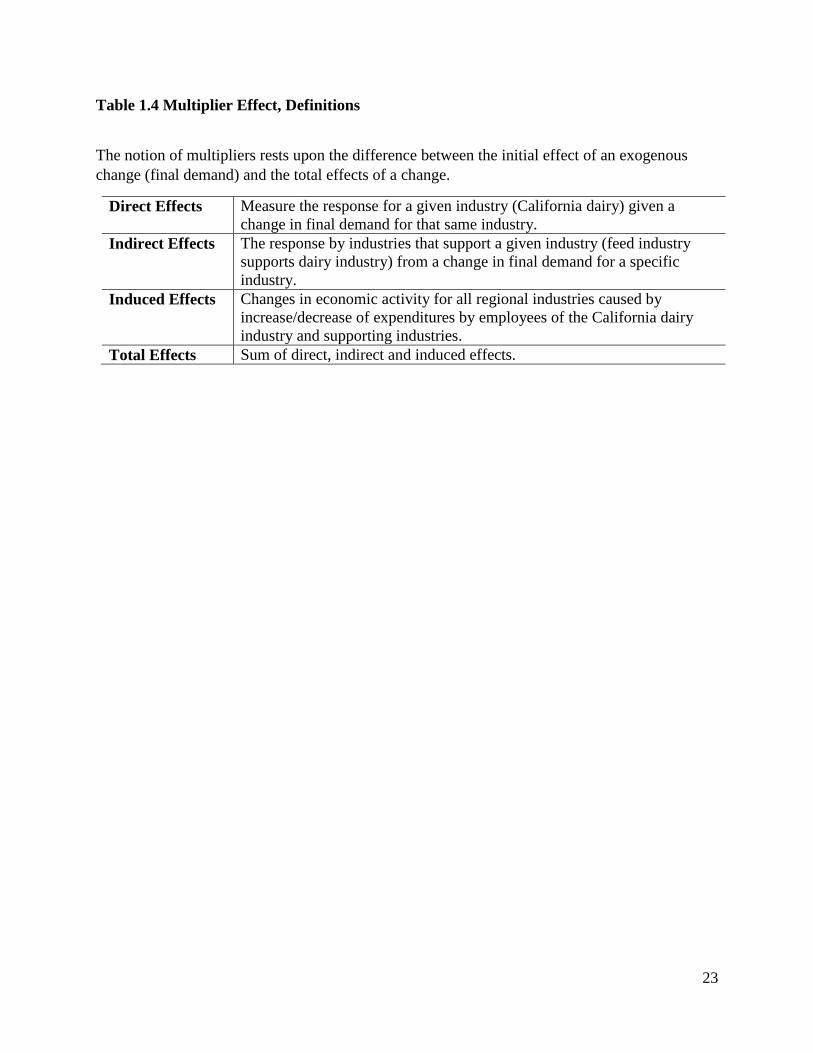
The economic impacts of additional economic activity with the dairy industry are generally
classified as direct, indirect and induced effects on each of the aggregates just defined.
Direct effects are simply impacts on output, value added or employment directly within the
affected industry. For example, when milk output goes up by $10 million, the direct effect is to
add $10 million to the value of output for the economy. When a processing plant adds a shift of
another 200 workers, the direct employment effect is 200 jobs.
Indirect effects are those changes that occur through purchases of input goods and services from
supporting industries. For example, if dairy farms produce more milk, farms also likely buy more
hay, use more electricity and hire additional hauling services. Our data has quantitative measures
of all these relationships, as the effects of purchases ripple through the economy of California.
Induced effects trace consumption expenditures. They measure the economic impacts in each
industry that result from added consumption generated by spending by those earning new income
from the direct and indirect effects. For example, milk producers selling milk for a higher price
have employees, who may get higher wages or work more hours and spend their incomes at
California grocery stores, barbershops and so on, and these local firms have workers of their
own. Workers also pay more taxes and provide more support for government services such as
schools.

11
Total effects are the sum of direct, indirect and induced impacts telling us the complete impact or
contribution of the dairy industry to California’s value of output, value added and employment.
Table 1.4 concisely defines these effects in general terms.
12
Figure 1.1 California Milk Production and Productivity Indexed to 1984
100
120
140
160
180
200
220
240
260
280
300
1984 1986 1988 1990 1992 1994 1996 1998 2000 2002 2004 2006 2008 2010 2012 2014
Milk Production
Number of Cows
Milk per Cow
1984
Milk Production = 15.3 billion lbs.
Number of Cows = 978,000.
Milk per Cow = 15,631 lbs./year
2014 Number of Cows = 1,780,000
2014 Milk per Cow = 23,791 lbs./year
2014 Milk Production = projected 42.3 billion lbs.
13
Figure 1.2 California Milk Production, 2008, 2010 and 2014*
* November and December 2014 production numbers are forecasted.
3.0
3.1
3.2
3.3
3.4
3.5
3.6
3.7
3.8
3.9
JAN FEB MAR APR MAY JUN JUL AUG SEP OCT NOV DEC
Pou
nd
s (m
il)
2008 2012 2014
14
Figure 1.3 California All Milk Price, 2008, 2012 and 2014
14
16
18
20
22
24
26
JAN FEB MAR APR MAY JUN JUL AUG SEP OCT NOV DEC
Doll
ars
per
CW
T
2008 2012 2014
15
Figure 1.4 California Farm Value of Milk Production, 2008, 2012 and 2014
400
500
600
700
800
900
1,000
JAN FEB MAR APR MAY JUN JUL AUG SEP OCT NOV DEC
Doll
ars
(m
il)
2008 2012 2014
16
Figure 1.5 Dairy Export Value Through California Ports
0
20
40
60
80
100
120
140
Jan
Mar
May
Ju
l
Sep
Nov
Jan
Mar
May
Ju
l
Sep
Nov
Jan
Mar
May
Ju
l
Sep
Nov
Jan
Mar
May
Ju
l
Sep
Nov
Jan
Mar
May
Ju
l
Sep
2010 2011 2012 2013 2014
Doll
ars
(m
il)
NFDM Cheese Whey
17
Figure 1.6 California Dairy Cost of Production, CDFA 2013
Feed Costs
66%
Hired Labor
9%
Replacement
Costs
6%
Other Operating
Costs 16%
Marketing Costs
3%
18
Figure 1.7 Milk Production by County, 2014
Tulare
27%
Merced
15%
Kings
11%
Stanislaus
10%
Kern
10%
Fresno
7%
San Joaquin
6%
Madera
4%
Rest of State
10%
19
Figure 1.8 California Milk Processors by Product Type
Butter, Nonfat Dry Milk
Cottage Cheese, Condensed Evaporated, Whipping Cream, Whipped Cream, Eggnog, Sour Cream, Whey Protein Concentrate, Yogurt
Cheese, Cream Cheese
Frozen Products
Fluid Milk, Buttermilk
Mix
20
Figure 1.9 California Cheese Processing Cost, 2013
Processing Labor
26%
Processing
Non-Labor
36%
Packaging
12%
Other Ingredients
12%
General and
Administrative
12%
Return on
Investment
2%
21
Flow Chart 1 Milk Production Economic Impact Flow Chart
22
Table 1.1 California Dairy Cost of Production, 2008, 2012 and 2013
Feed
Costs
Hired
Labor
Replacement
Costs
Operating
Costs
Marketing
Costs
Total
Cost
($/cwt)
2008 9.82 1.57 1.64 2.92 0.54 16.48
2012 11.48 1.52 1.24 2.80 0.54 17.57
2013 11.46 1.52 1.08 2.77 0.55 17.37
Table 1.2 Processing Cost Categories
Processing Labor Payroll taxes and fringe
Processing Non-Labor Utilities, repairs and maintenance, laundry, supplies,
depreciation, plant insurance and rent
Packaging Boxes, bags, cartons, liners, tape, glue and stretch wrap
Other Ingredients Includes salt
General and
Administrative
Office supplies, short-term interest, dues, accounting fees,
office clerical wages and executive salaries
Return on Investment Accumulated depreciation minus original cost of assets
multiplied by Moody’s “BAA” corporate bond index
Table 1.3 California Dairy Processing Cost, 2013
Butter Nonfat Dry Milk Cheese
($/lb.)
Processing Labor 0.0642 0.0484 0.0584
Processing Non-Labor 0.0643 0.1122 0.0821
Packaging 0.0136 0.0145 0.0278
Other Ingredients 0.0028 N/A 0.028
General and Administrative 0.0177 0.013 0.0286
Return on Investment 0.0098 0.0116 0.0042
Total Cost 0.1724 0.1997 0.2291
23
Table 1.4 Multiplier Effect, Definitions
The notion of multipliers rests upon the difference between the initial effect of an exogenous
change (final demand) and the total effects of a change.
Direct Effects Measure the response for a given industry (California dairy) given a
change in final demand for that same industry.
Indirect Effects The response by industries that support a given industry (feed industry
supports dairy industry) from a change in final demand for a specific
industry.
Induced Effects Changes in economic activity for all regional industries caused by
increase/decrease of expenditures by employees of the California dairy
industry and supporting industries.
Total Effects Sum of direct, indirect and induced effects.
24
Section 2. Economic Contributions of California Milk Production and Processing to the
California Economy
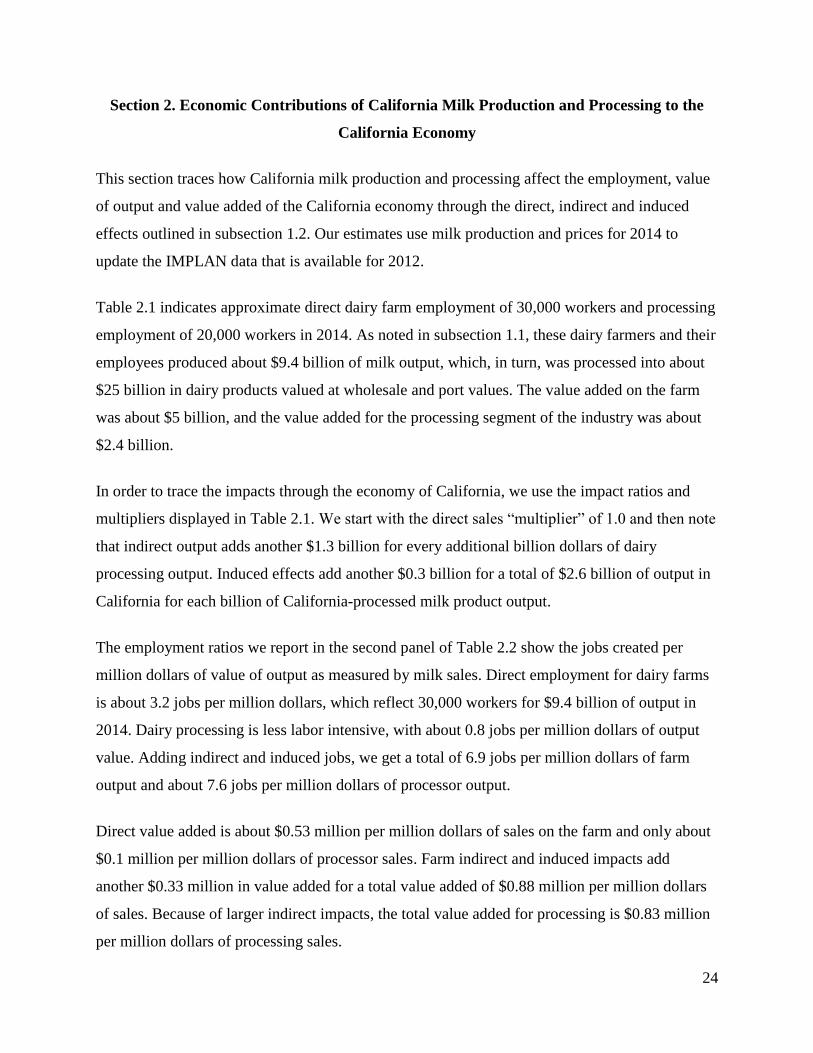
This section traces how California milk production and processing affect the employment, value
of output and value added of the California economy through the direct, indirect and induced
effects outlined in subsection 1.2. Our estimates use milk production and prices for 2014 to
update the IMPLAN data that is available for 2012.
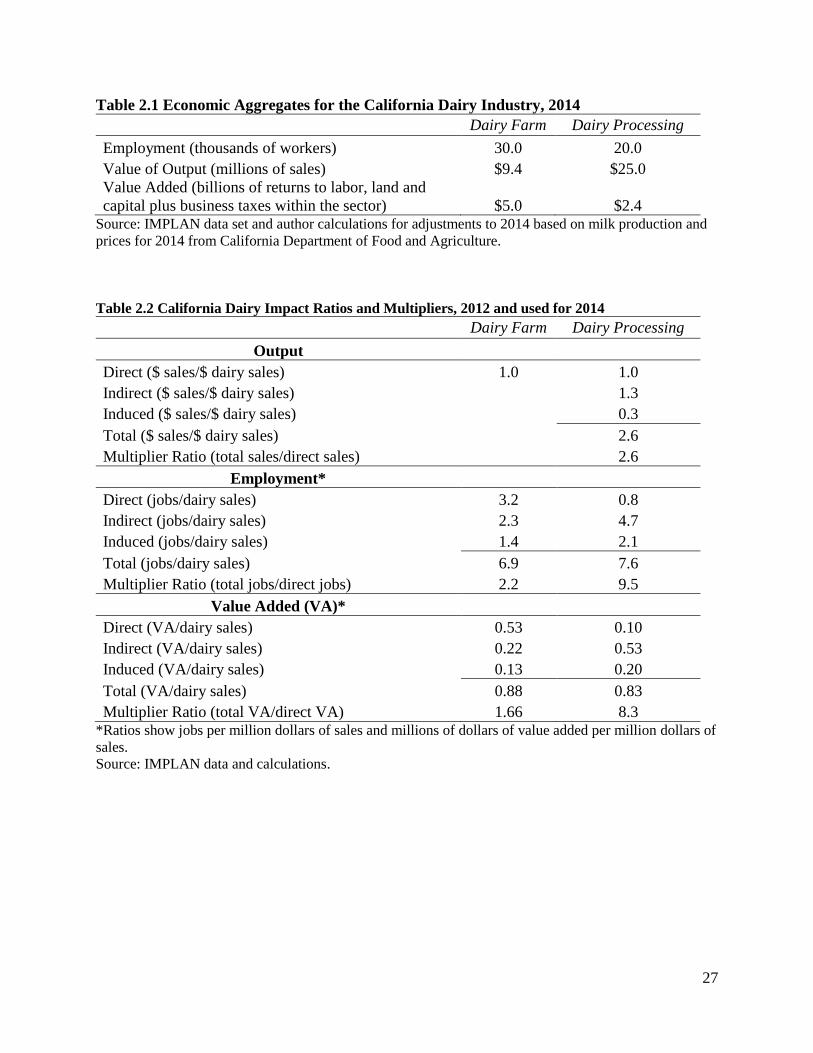
Table 2.1 indicates approximate direct dairy farm employment of 30,000 workers and processing
employment of 20,000 workers in 2014. As noted in subsection 1.1, these dairy farmers and their
employees produced about $9.4 billion of milk output, which, in turn, was processed into about
$25 billion in dairy products valued at wholesale and port values. The value added on the farm
was about $5 billion, and the value added for the processing segment of the industry was about
$2.4 billion.
In order to trace the impacts through the economy of California, we use the impact ratios and
multipliers displayed in Table 2.1. We start with the direct sales “multiplier” of 1.0 and then note
that indirect output adds another $1.3 billion for every additional billion dollars of dairy
processing output. Induced effects add another $0.3 billion for a total of $2.6 billion of output in
California for each billion of California-processed milk product output.
The employment ratios we report in the second panel of Table 2.2 show the jobs created per
million dollars of value of output as measured by milk sales. Direct employment for dairy farms
is about 3.2 jobs per million dollars, which reflect 30,000 workers for $9.4 billion of output in
2014. Dairy processing is less labor intensive, with about 0.8 jobs per million dollars of output
value. Adding indirect and induced jobs, we get a total of 6.9 jobs per million dollars of farm
output and about 7.6 jobs per million dollars of processor output.
Direct value added is about $0.53 million per million dollars of sales on the farm and only about
$0.1 million per million dollars of processor sales. Farm indirect and induced impacts add
another $0.33 million in value added for a total value added of $0.88 million per million dollars
of sales. Because of larger indirect impacts, the total value added for processing is $0.83 million
per million dollars of processing sales.
25
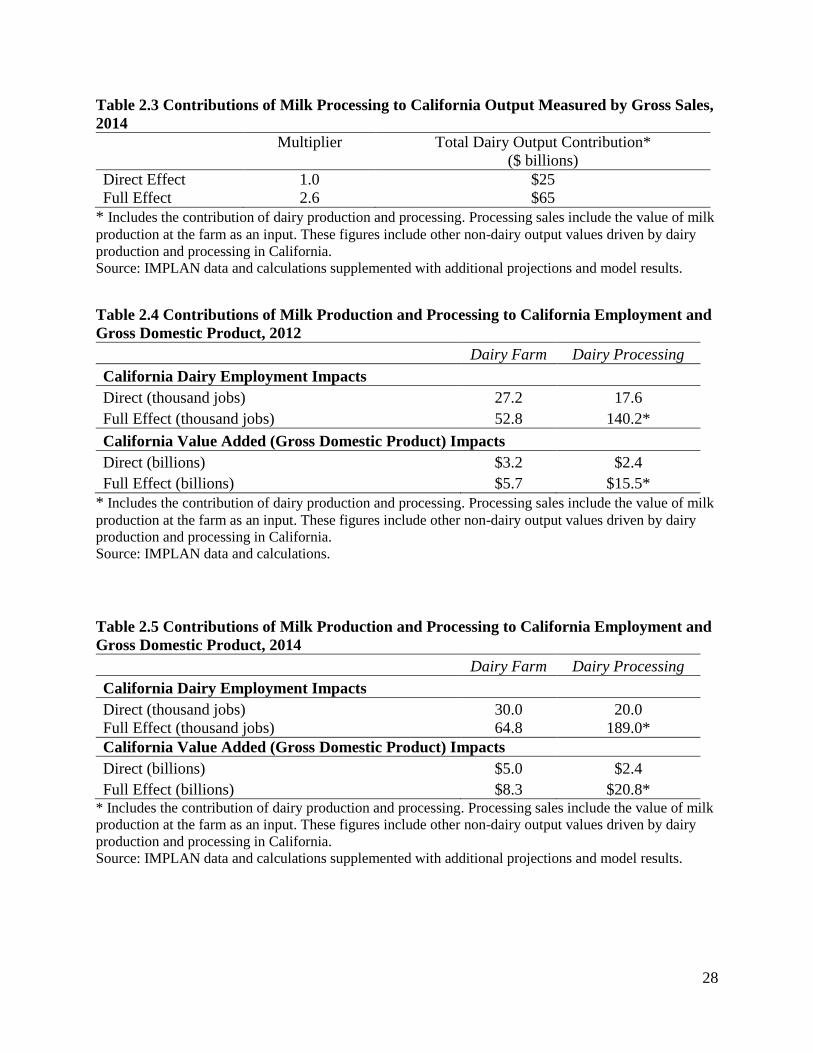
Using the multipliers of the first panel of Table 2.2, Table 2.3 shows the full effect of the value
of output associated with milk processor sales in California. We find that processed dairy
product sales of $25 billion generated sales of $65 billion in the California economy overall.
Table 2.4 shows employment and value added for 2012 to provide context for the growth of the
industry after the very low prices of 2012. Table 2.5 shows the direct and full economic impacts
of milk production and processing for 2014. The 30,000 jobs on dairy farms in 2014 led to about
65,000 jobs once indirect and induced impacts are considered. Even more important, California
milk production and processing contributed 189,000 jobs to the California economy in 2014. Of
these jobs, about 20,000 were in the processing industry. That means about 35,000 jobs were
associated indirectly with dairy farming or induced by dairy farm and employee incomes. To get
to 189,000 jobs, another 104,000 jobs were supported by indirect activity linked to dairy
processing and induced jobs supported by consumption expenditures of processor workers.
The second panel of Table 2.5 shows that direct farm value added of $5 billion generates another
$3.3 billion of value added through indirect and induced effects. Direct processor value added is
$2.4 billion. The combined direct value added of $7.4 billion for farms and processors leads to
$20.8 billion in statewide California value added. This almost $21 billion is the contribution of
the dairy industry to California’s gross state product, which is the standard measure of the size of
the economy.
Dairy industry contribution to California employment grew from about 140,000 jobs in 2012
(Table 2.4) to about 190,000 jobs in 2014 (Table 2.5). The dairy industry contribution to
statewide value added grew from about $15.5 billion in 2012 to about $21 billion in 2014. The
good economic performance of the California dairy industry in 2014 contributed strongly to
economic growth in California from 2012 to 2014.
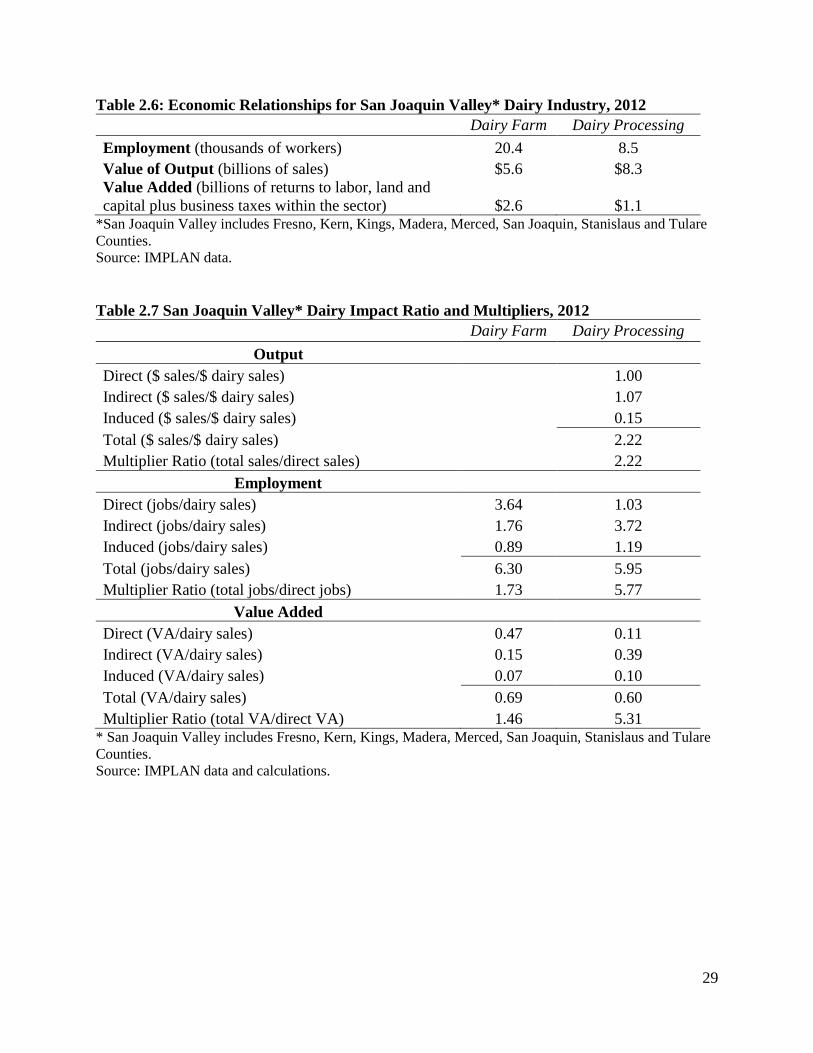
Milk production is particularly important in the San Joaquin Valley. Table 2.6 shows that dairy
farm employment was about 20,400 workers in 2012, and direct processing employment added
another 8,500 workers. Value of farm milk output was $5.6 billion, and output of processing
plants was $8.3 billion. Farm value added in 2012 was $2.6 billion, while processor value added
was $1.1 billion. In 2012, the last year for which data is available, the San Joaquin Valley had a
26
much larger share of California dairy farm employment, production value and value added than
it did of processor employment, output and value added. The ratios and multipliers in Table 2.7
allow us to calculate the employment and value added impacts for the San Joaquin Valley,
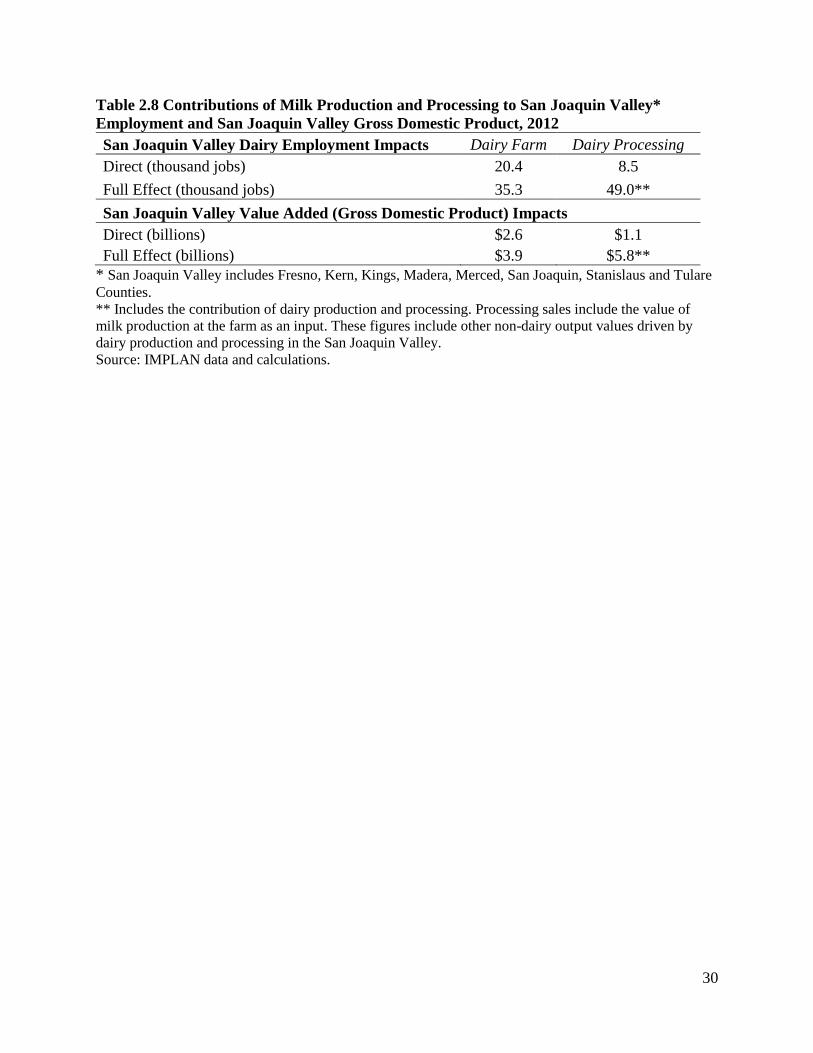
including indirect and induced effect. We note that much of the economic impact of San Joaquin
Valley milk production and processing occurs in other parts of the state, and the effects are still
large. Milk production itself contributes 35,000 jobs with about 15,000 of those off the farm
(Table 2.8). The combined impact of dairy farms and processors is almost 50,000 jobs in the San
Joaquin Valley. Dairy farms contribute about $3.9 billion in value added. The combined impact
of the dairy industry is a contribution of about $5.8 billion to the value added of the economy of
the San Joaquin Valley.
27
Table 2.1 Economic Aggregates for the California Dairy Industry, 2014
Dairy Farm Dairy Processing
Employment (thousands of workers) 30.0 20.0
Value of Output (millions of sales) $9.4 $25.0
Value Added (billions of returns to labor, land and
capital plus business taxes within the sector) $5.0 $2.4 Source: IMPLAN data set and author calculations for adjustments to 2014 based on milk production and
prices for 2014 from California Department of Food and Agriculture.
Table 2.2 California Dairy Impact Ratios and Multipliers, 2012 and used for 2014
Dairy Farm Dairy Processing
Output
Direct ($ sales/$ dairy sales) 1.0 1.0
Indirect ($ sales/$ dairy sales) 1.3
Induced ($ sales/$ dairy sales) 0.3
Total ($ sales/$ dairy sales) 2.6
Multiplier Ratio (total sales/direct sales) 2.6
Employment*
Direct (jobs/dairy sales) 3.2 0.8
Indirect (jobs/dairy sales) 2.3 4.7
Induced (jobs/dairy sales) 1.4 2.1
Total (jobs/dairy sales) 6.9 7.6
Multiplier Ratio (total jobs/direct jobs) 2.2 9.5
Value Added (VA)*
Direct (VA/dairy sales) 0.53 0.10
Indirect (VA/dairy sales) 0.22 0.53
Induced (VA/dairy sales) 0.13 0.20
Total (VA/dairy sales) 0.88 0.83
Multiplier Ratio (total VA/direct VA) 1.66 8.3 *Ratios show jobs per million dollars of sales and millions of dollars of value added per million dollars of
sales.
Source: IMPLAN data and calculations.
28
Table 2.3 Contributions of Milk Processing to California Output Measured by Gross Sales,
2014
Multiplier Total Dairy Output Contribution*
($ billions)
Direct Effect 1.0 $25
Full Effect 2.6 $65
* Includes the contribution of dairy production and processing. Processing sales include the value of milk
production at the farm as an input. These figures include other non-dairy output values driven by dairy
production and processing in California.
Source: IMPLAN data and calculations supplemented with additional projections and model results.
Table 2.4 Contributions of Milk Production and Processing to California Employment and
Gross Domestic Product, 2012
Dairy Farm Dairy Processing
California Dairy Employment Impacts
Direct (thousand jobs) 27.2 17.6
Full Effect (thousand jobs) 52.8 140.2*
California Value Added (Gross Domestic Product) Impacts
Direct (billions) $3.2 $2.4
Full Effect (billions) $5.7 $15.5*
* Includes the contribution of dairy production and processing. Processing sales include the value of milk
production at the farm as an input. These figures include other non-dairy output values driven by dairy
production and processing in California.
Source: IMPLAN data and calculations.
Table 2.5 Contributions of Milk Production and Processing to California Employment and
Gross Domestic Product, 2014
Dairy Farm Dairy Processing
California Dairy Employment Impacts
Direct (thousand jobs) 30.0 20.0
Full Effect (thousand jobs) 64.8 189.0*
California Value Added (Gross Domestic Product) Impacts
Direct (billions) $5.0 $2.4
Full Effect (billions) $8.3 $20.8* * Includes the contribution of dairy production and processing. Processing sales include the value of milk
production at the farm as an input. These figures include other non-dairy output values driven by dairy
production and processing in California.
Source: IMPLAN data and calculations supplemented with additional projections and model results.
29
Table 2.6: Economic Relationships for San Joaquin Valley* Dairy Industry, 2012
Dairy Farm Dairy Processing
Employment (thousands of workers) 20.4 8.5
Value of Output (billions of sales) $5.6 $8.3
Value Added (billions of returns to labor, land and
capital plus business taxes within the sector) $2.6 $1.1 *San Joaquin Valley includes Fresno, Kern, Kings, Madera, Merced, San Joaquin, Stanislaus and Tulare
Counties.
Source: IMPLAN data.
Table 2.7 San Joaquin Valley* Dairy Impact Ratio and Multipliers, 2012
Dairy Farm Dairy Processing
Output
Direct ($ sales/$ dairy sales) 1.00
Indirect ($ sales/$ dairy sales) 1.07
Induced ($ sales/$ dairy sales) 0.15
Total ($ sales/$ dairy sales) 2.22
Multiplier Ratio (total sales/direct sales) 2.22
Employment
Direct (jobs/dairy sales) 3.64 1.03
Indirect (jobs/dairy sales) 1.76 3.72
Induced (jobs/dairy sales) 0.89 1.19
Total (jobs/dairy sales) 6.30 5.95
Multiplier Ratio (total jobs/direct jobs) 1.73 5.77
Value Added
Direct (VA/dairy sales) 0.47 0.11
Indirect (VA/dairy sales) 0.15 0.39
Induced (VA/dairy sales) 0.07 0.10
Total (VA/dairy sales) 0.69 0.60
Multiplier Ratio (total VA/direct VA) 1.46 5.31 * San Joaquin Valley includes Fresno, Kern, Kings, Madera, Merced, San Joaquin, Stanislaus and Tulare
Counties.
Source: IMPLAN data and calculations.
30
Table 2.8 Contributions of Milk Production and Processing to San Joaquin Valley*
Employment and San Joaquin Valley Gross Domestic Product, 2012
San Joaquin Valley Dairy Employment Impacts Dairy Farm Dairy Processing
Direct (thousand jobs) 20.4 8.5
Full Effect (thousand jobs) 35.3 49.0**
San Joaquin Valley Value Added (Gross Domestic Product) Impacts
Direct (billions) $2.6 $1.1
Full Effect (billions) $3.9 $5.8**
* San Joaquin Valley includes Fresno, Kern, Kings, Madera, Merced, San Joaquin, Stanislaus and Tulare
Counties.
** Includes the contribution of dairy production and processing. Processing sales include the value of
milk production at the farm as an input. These figures include other non-dairy output values driven by
dairy production and processing in the San Joaquin Valley.
Source: IMPLAN data and calculations.
31
Concluding Remarks
The California dairy industry, including milk production on farms and milk processing, supports
about 190,000 jobs in the California economy and contributed about $21 billion in economic
value added in 2014. The health of the California dairy industry is a crucial part of the California
economy. Dairy farming and processing is nowhere more important than in the San Joaquin
Valley, which produces far more milk than any other region of the country and more than any
other state in the nation.
Besides its broad and important effects on economic activity, California milk production
contributes to state, national and global health and well-being by offering healthful, nutritious
and enjoyable products to food consumers everywhere. The California dairy industry has
developed into one of the most efficient, competitive and successful producers of milk products
in the world. The economic health of the industry is important to the economy and to consumers
locally and globally.
32
Annex A. Contributions of the Dairy Industry to the Tulare County Economy
Dairy is particularly important in Tulare County, which produces more than one-quarter of all
the milk in California and easily leads the nation in milk production.
Employment on dairy farms in Tulare County was about 5,900 jobs in 2012 (the last year for
which we have data). Milk output that year was valued at about $1.7 billion, and value added
(the direct contribution to the size of the state and county economy) was about $690 million.
Employment in dairy processing in Tulare County was about 2,500 jobs in 2012, based on a
value of product output of $2.6 billion and value added in the processing sector of about $410
million.
The total value of output counts the gross revenue of business activity stimulated by an economic
sector. In Tulare County, much but not all the milk processed locally is also produced on the
ranches of Tulare County. That means much of the milk that accounts for the processed dairy
output of $2.6 billion has already been counted in the farm milk output of $1.7 billion. This sort
of double counting issue does not arise when we consider direct employment and value added, so
we will focus on those measures of contribution.
The sum of farm and processing employment is 7,300 jobs. Indirect and induced jobs driven by
dairy farms in Tulare County add another 4,300 jobs, and the processing industry adds another
2,000 indirect and induced jobs (not counting those already attributed to dairy farming) for a
total of 13,600 jobs for the county in 2012. Note that Tulare milk production adds jobs outside
the county and, with a quarter of all milk production, contributes close to 50,000 jobs statewide.
Dairy farming contributes value added to the Tulare County economy through farming and
processing. Direct farm value added ($690 million) must be supplemented with indirect and
induced value added of $290 million driven by dairy farm production in Tulare County. In
addition, direct value added from processing ($410 million) is supplemented with additional
value added from other industries (again being careful not to double-count the dairy farm value
added). We attribute another $130 million of value added to the indirect and induced effects of
processing. The total value added contribution of Tulare County dairy to the size of the Tulare
County economy in 2012 was about $1.5 billion of value added. This was more than 10 percent
of the Tulare County economy. Moreover, Tulare dairy production and processing contributes
value added to the surrounding counties and the state of California as a whole.