Embed Size (px)
Citation preview
Economic Contributionsof the California Nursery Industry
Hoy F. Carman and Ana Maria Rodriguez
Giannini Foundation Information Series No. 04–1
July 2004
UNIVERSITY OF CALIFORNIAAGRICULTURE AND NATURAL RESOURCES

THE AUTHORS
Hoy Carman is a member of the Giannini Foundation of Agricultural Economics and a professor ofagricultural and resource economics at the University of California, Davis. Ana Maria Rodriguez is apostgraduate-research agricultural economist in the Department of Agricultural and ResourceEconomics at the University of California, Davis.Hoy Carman: E-mail – [email protected], Phone – 530.752.1525.
ACKNOWLEDGMENTS
The authors acknowledge the assistance of Professor Peter Berck, Department of Agricultural andResource Economics, University of California, Berkeley, in setting up and running the IMPLAN modelfor California. Elaine Thompson, Executive Director of the California Association of Nurseries andGarden Centers, and Robert Falconer, Director of Government Affairs for the California Association ofNurseries and Garden Centers, assisted with references, data sources, and contacts with industryparticipants. They also provided helpful comments on an earlier draft of this report. This project wassupported by a grant from California Polytechnic University Foundation of San Luis Obispo, California,with funding from the California Association of Nurseries and Garden Centers Endowment. Finally,the authors appreciate the careful comments of two reviewers who helped to clarify and improve ourpresentation.
©2004 by the Regents of the University of CaliforniaDivision of Natural ResourcesAll rights reserved.No part of this publication may be reproduced, stored in a retrieval system, or transmitted, in any form or by any means,electronic, mechanical, photocopying, recording, or otherwise, without the written permission of the publisher and theauthors.To simplify information, trade names of products have been used. No endorsement of named or illustrated products isintended, nor is criticism implied of similar products that are not mentioned or illustrated.
This publication has been anonymously peer-reviewedfor technical accuracy by University of Californiascientists and other qualified professionals.

Economic Contributions of the California Nursery Industry
i
TABLE OF CONTENTS
Executive Summary ....................................................................................................... 1
Introduction .................................................................................................................... 3
Structural Characteristics of California’sNursery and Floral Industry from 1982 to 1997 ................................................... 5
Number of Farms and Sales ............................................................................5California Nursery Farms versus Other Farms: A Comparison of Averages .........6Characteristics of Nursery-Farm Operators .......................................................6Postcensus Changes in Farm Numbers .............................................................6
Growth of the California Nursery Industry............................................................. 8
Location of Production .....................................................................................8Crops Produced ............................................................................................ 10Marketing Channels ...................................................................................... 11Number and Type of Firms ............................................................................ 11Retail Sales ................................................................................................... 12Market Shares .............................................................................................. 12Retail Margins ............................................................................................... 13
Estimated Economic Impacts.................................................................................... 15
Economic Multipliers ..................................................................................... 15Estimated Economic Impacts .......................................................................... 16
Concluding Comments .............................................................................................. 19
References ...................................................................................................................... 21
Appendix ........................................................................................................................ 23

Giannini Foundation Information Series No. 04–1
ii

Economic Contributions of the California Nursery Industry
iii
FIGURES
1. Sales for California’s Top Ten Commodities, 2001 ............................................................. 3
2. California Nursery and Floral Product Sales, Farm Value, and Percent ofCalifornia’s Total Agriculture .............................................................................................. 8
3. Nursery and Floral Production by County, Value at the Farm Gate, 2001 ................................ 9
TABLES
1. Farms Growing Nursery and Floriculture Crops, Area Under Glass, Acres in the Open,and Sales, U.S. and California, 1982 and 1997 ................................................................. 5
2. California Nursery, Flower, and Foliage Production in 2001, Top 15 Countieswith Share of State Total ................................................................................................ 10
3. Wholesale Value of California Nursery Products by Major Categories, 2000 and 2001 ..... 11
4. Statewide Taxable Sales by California Retail Florists and Farm andGarden Supply Stores, 1997–2001 ................................................................................ 12
5. Estimated Annual U.S. and California Lawn and Garden Retail Sales, 1997–2001 ............ 12
6. Estimated Market Shares of Various Retail Store Types for Sales of Flower Productsin California, 2001 ....................................................................................................... 13
7. Estimated Percentage Gross Margin for Floral and Nursery Products byRetail Store Type, Estimated Total Floral and Nursery Sales, andTotal Margin, California, 2001 ....................................................................................... 14
8. Estimated IMPLAN Multipliers for the California Nursery Industry ..................................... 15
9. Estimated Output, Employment, and Value-Added Total-Effects EconomicMultipliers for the Nursery Industry in Selected California Counties .................................. 16
10. Estimated Direct and Total Economic Effects of California Flower and NurseryProduction and Lawn and Garden Retailing, 2001 .......................................................... 17
11. Estimated Total Output, Employment, and Value-Added Effects of Nurseryand Floral Production and Lawn and Garden Retailing in California’sTop Ten Producing Counties, 2001 ................................................................................. 17
A1. California’s Top 20 Commodities with Values and Ranks for 1999–2001 .......................... 24
A2. Value (Thousand Dollars) of California Nursery, Flower, and Foliage Production byCounty, 1992–2001 ...................................................................................................... 25
A3. Five Leading Nursery Crops for Each of the Ten California CountiesProducing the Largest Amount of Nursery and Floral Products, 2001 ............................... 26
A4. Population and Value of Nursery and Floral Production by County, California, 2001 ......... 28
A5. Nursery and Floriculture Products: Number of Producers, Wholesalers, and RetailersLicensed to Sell Nursery Stock in California, 2002, by County .......................................... 29
A6. The IMPLAN System ...................................................................................................... 31

Giannini Foundation Information Series No. 04–1
iv
Economic Contributions of the California Nursery Industry
1
EXECUTIVE SUMMARY
T he California nursery and floral industries contrib- ute significantly to California’s economy. They
are the largest in the United States with the Californiafarm value of combined floral and nursery productsales totaling almost $3.086 billion in 2001. The to-tal output of nursery products places the nurseryindustry third ($2.09 billion) and the floral industryseventh (almost $1 billion) among all California agri-cultural industries. When floral and nursery productsales are combined, the industry ranks second amongall California agricultural products, following the dairyindustry, which had $4.63 billion in sales in 2001.
The number of California farms producing nurs-ery and floral crops grew from 3,263 in 1982 to 4,988in 1997 according to the Census of Agriculture (U.S.Department of Agriculture, National Agricultural Sta-tistics Service 1982–1997). The number of Californiafarms currently growing nursery and floral crops isdifficult to determine because of differences in crite-ria used in classifying farms. The most recentCalifornia directory of licensed nurserymen listed2,999 producers. As is true with many other commodi-ties, there are a large number of small producers thataccount for a very small share of total output and amoderate number of large producers that producemost of the product sold. There were 411 Californiafarms with nursery sales exceeding $1 million in 1997;this 8.2 percent of nursery farms by number ac-counted for 81.3 percent of total nursery sales.
Many California commodities faced price and/orrevenue problems during the decade from 1992 to2002. During that time, the nursery and floralindustries enjoyed steady sales increases, whichincreased the industry’s share of total Californiaagricultural production from 8.3 to 10.6 percent oftotal output. While there is floral and nurseryproduction in 55 of California’s 58 counties, tencounties with annual production valued at more than$100 million accounted for more than 73 percent of2001’s value of production. San Diego Countydominated the industry, producing more than $855million of nursery, floral, and foliage products in 2001and accounting for almost 27 percent of the California
total. The other nine, however, have annual productionexceeding $100 million, and the next five counties’production ranged from $50 to $100 million. Nurseryand flower production is a major agriculturalenterprise in several of California’s most urbanizedcounties, including Los Angeles, San Diego, Orange,Santa Clara, and Riverside, which together account formore than 54 percent of California’s population.
California is the largest single market for lawn andgarden products in the United States, accounting forfrom 10.3 to 10.4 percent of total annual U.S. salessince 1997. The majority of California’s nursery andfloral products are sold to California consumers. Basedon secondary sources, we estimate that total 2001 Cali-fornia retail lawn, garden, and floral product salesexceeded $10.1 billion. The gross margin (retail salesminus cost of goods sold) on these sales was esti-mated at almost $3.8 billion. Retail channels have beenchanging over time, with the market shares of “big-box” hardware/home improvement stores such asHome Depot and Lowe’s increasing significantly.
Market shares vary by type of retail store and prod-uct line. Retail florists have almost half of the cut flowermarket but have faced increasing competition fromsupermarkets, which now account for about one-quar-ter of cut flower sales. Garden centers are still theleading outlet for outdoor garden and bedding plants,but they have faced increasing competition from big-box stores. Retail florists, garden centers, big-boxstores, and supermarkets are all important outlets forflowering and greenhouse plants. Direct sales are im-portant for many nurseries; landscape contractors andgardeners purchase products ranging from specimentrees to bedding plants, and agricultural producerspurchase trees and strawberry plants.
A regional economic model was used to trace thedirect, indirect, and induced effects of Californianursery and floral production and lawn and gardenretailing through the California economy. The impactsare dramatic and far reaching. Overall, nursery andfloral production and lawn and garden retailingcontributed more than $10.3 billion to California’s2001 output and were responsible for almost 169,000

Giannini Foundation Information Series No. 04–1
2
jobs. Total value added attributed to California nurseryand floral production and lawn and garden retailingwas $8 billion, and the labor-income impact exceeded$4.9 billion.
The impacts of nursery and floral production andlawn and garden retailing also were estimated sepa-rately. The direct effects of nursery and floral production
were almost $4.8 billion (46 percent of the combinedtotal) while the direct effects of retailing were almost $5.5billion. Nursery and floral production generated 81,011jobs (48 percent of the combined total) while lawn andgarden retailing accounted for 87,867 jobs. Estimatedvalue added for the nursery and retail sectors was $3.55and $4.44 billion, respectively.

Economic Contributions of the California Nursery Industry
3
California’s nursery industry is the largest in theUnited States, and floral and nursery product
sales are a leading sector in the California agriculturaleconomy. The value of combined floral and nurseryproduct sales in California in 2001 totaled almost$3.086 billion at the farm level; nursery productscontributed $2.09 billion and floral sales contributedalmost $1 billion. Compared with other Californiaagricultural commodities in 2001, the nursery indus-try ranked third, following first the dairy industry($4.65 billion) and then the grape industry ($2.65billion). The floral industry ranked seventh. When2001 floral and nursery product sales are combined,the industry ranks second among all California agri-cultural products.1
Commodities among the top ten in California thatrank below floral and nursery products in terms of2001 sales include lettuce (4), cattle and calves (5),hay (6), strawberries (8), tomatoes (9), and almonds(10). California’s gross cash income from all agricul-tural production totaled $27.6 billion in 2001. Nurseryand floral sales made up 11.2 percent of that total.2
Despite its economic contributions and importanceto the state and nation, the California nursery andfloral industries are often overlooked by governmentofficials, legislators, the agricultural industry, and thegeneral public in discussions about leading agricul-tural products and producers. Though the Californianursery industry faces the same issues that confrontother agricultural producers (water, price and income,
INTRODUCTION
1 The commodity cash income data are reported in the California Department of Food and Agriculture’s (CDFA’s) 2002 resourcedirectory. While commodity rankings often change from year to year as a result of yield and price variability, nursery crops wereranked third for the last three years (1999–2001). Flowers were eighth in 1999 and seventh in 2000 and 2001. The combinedcategory of nursery and flower crops ranked second in each of the last three years (1999–2001). Rankings for the top 20commodities for 1999, 2000, and 2001 are listed in Table A1 in the Appendix.2 There are two major data series for California agricultural sales. The California Agricultural Statistics Service (CASS) publishesannual estimates of cash sales that are used by the U.S. Department of Agriculture (USDA) for calculating farm income. CASS alsopublishes the annual county agricultural commissioners’ reports, which provide estimates of the value of production for eachcommodity. Note that the California gross cash income estimate for 2001 presented here ($27.6 billion) is less than the countyagricultural commissioners’ estimate of total agricultural output ($29.8 billion).
Figure 1. Sales for California’s Top Ten Commodities, 2001
5,000
4,500
4,000
3,500
3,000
2,500
2,000
1,500
1,000
500
0Milk andCream
Grapes Nursery Lettuce Cattleand
Calves
Hay Flowers Straw-berries
Tomatoes Almonds
4,630
2,651
998
2,067
9981,370 1,352
1,021841 766 732
mill
ion
dolla
rs
Source: California Department of Food and Agriculture, Resource Directory, California Agriculture: A Tradition of Innovation, 2002.
Giannini Foundation Information Series No. 04–1
4
energy and input costs, government regulation, chang-ing market structure, competition, information, etc.),it sometimes is not included in policies and programsdesigned to benefit agricultural producers. At the ex-treme, there are individuals and organizations that donot consider the floral and nursery industries to beagricultural production. This may be due to any of anumber of factors, including the limited visibility ofproduction facilities and product movement (com-pared to commodities like tomatoes, rice, and citrus)and the decorative nature of the product (rather thanbeing a food or fiber).
The three major objectives of this report are to:Assemble economic data on the California nurs-ery and floral industries that show trends,growth patterns, and present status by location,products, and channels of distribution.Use output, employment, and value-added mul-tipliers for the California nursery and floralindustries to estimate the regional and statewideeconomic contributions of the industry.Organize economic data and analysis of theindustry’s economic contributions and impactsfor use by the California nursery industry ineducational programs for policymakers, agricul-tural leaders, and the general public.

Economic Contributions of the California Nursery Industry
5
The changing structure of the California nurseryindustry was examined for the 15-year period
from 1982 through 1997 using Census of Agriculturedata for 1982, 1987, 1992, and 1997. California leadsthe nation, and Florida typically ranks second, in to-tal sales of nursery and floriculture crops. Californiasales of nursery and floriculture crops increased from$957,232,000 in 1982, accounting for 25 percent oftotal U.S. sales, to $2,210,574,000 in 1997, account-ing for 20 percent of U.S. sales (U.S. Department ofAgriculture (USDA) National Agricultural StatisticsService (NASS) 1982–1997). After being adjusted forprice changes, California’s real sales increase from1982 to 1997 totaled 38.8 percent. The most recentUSDA reports list California’s 2001 market share fornursery and floriculture crops at 21.3 percent; Floridatrailed with 11.9 percent (USDA Economic ResearchService).
Number of Farms and Sales
The number of California farms growing nursery andfloriculture crops increased from 3,263 in 1982 to4,988 in 1997. Increases in other states were more
rapid, however, and California’s share of U.S. farmsproducing nursery and floriculture crops decreasedfrom 9 percent in 1982 to 7 percent in 1997 (Table 1).Note that California’s share of area under glass, acresin the open, and sales also decreased from 1982 to1997. However, the average California nursery opera-tion had more area under glass and approximately 2.75times the sales of the average U.S. nursery farm($443,178 versus $161,360) in 1997.
In 1982, California farms producing nursery prod-ucts with annual sales of less than $40,000 accountedfor 50.6 percent (1,652 farms) of the total number offarms but represented only 1.8 percent of total sales.There were 362 farms with sales of nursery productsexceeding $500,000 and they accounted for 76.3 per-cent of total 1982 sales. The pattern was similar in1997, with 58 percent (2,892) of the farms with salesless than $50,000 accounting for only 1.3 percent ofindustry sales. There were 411 California farms withnursery sales exceeding $1 million in 1997. Thesefarms, representing 8.2 percent of nursery farms bynumber, accounted for 81.3 percent of totalnursery sales.
Table 1. Farms Growing Nursery and Floriculture Crops, Area under Glass, Acres in the Open, and Sales,U.S. and California, 1982 and 1997
CaliforniaUnited States California Share
1982
No. of Farms 35,507 3,263 9.19%
Square Feet under Glass or Other Protection 637,388,163 143,390,104 22.50%
Acres in the Open 451,607 56,123 12.43%
Sales ($1,000) $3,821,196 $957,232 25.05%
1997
No. of Farms 67,816 4,988 7.36%
Square Feet under Glass or Other Protection 1,027,391,958 173,192,317 16.86%
Acres in the Open 1,234,510 90,544 7.33%
Sales ($1,000) $10,942,816 $2,210,574 20.20%
Source: U.S. Department of Agriculture, National Agricultural Statistics Service, Census of Agriculture, 1982–1997.
STRUCTURAL CHARACTERISTICS OF CALIFORNIA’SNURSERY AND FLORAL INDUSTRY FROM 1982 TO 1997

Giannini Foundation Information Series No. 04–1
6
California Nursery Farms versus OtherFarms: A Comparison of Averages
Nursery farms are comparatively compact and of highvalue compared to other farms in California. Therewere 74,126 farms in California in 1997 with anaverage size of 374 acres. Nursery farms represented5.8 percent of total California farms that year but, withan average of 45 acres of land per farm, they accountedfor only 0.7 percent of California land in farms. Overall,the value of the average California farm’s land andbuildings in 1997 totaled $941,170 per farm ($2,605per acre).3 The value of land and buildings of theaverage California farm growing nursery crops was$624,267 ($12,017 per acre).
The 1997 gross value of California agricultural pro-duction was estimated by county agriculturalcommissioners at $28.02 billion ($322,104 per farm)with nursery products, flowers, and foliage account-ing for about $2.5 billion of the total ($500,855 pernursery farm). This gross value was up from $21.77billion in 1992 and subsequently increased to $29.8billion in 2001 (Appendix, Table A2). The gross valueof nursery, flower, and foliage production increasedfrom a little more than $1.9 billion in 1992 to morethan $3.17 billion in 2001.
Characteristics of Nursery-Farm Operators
The average age of operators of farms producing nurs-ery crops has been increasing, a trend that holds forother farm operators in California. The number ofnursery farms operated by a person over the age of45 increased from 2,141 (66 percent) in 1982 to 3,822(77 percent) in 1997. The average age for all Califor-nia farm operators in 1997 was 56.5 years; fornursery-farm operators, the average age was 54.3 years.
In 1982, slightly more than 64 percent of allCalifornia nursery farms were operated by personswhose main occupation was farming. This sharedecreased to 58 percent in 1997. As might be expected,the pattern of part-time operators varies when incomeis considered. In 1982, almost 81 percent of the
nursery farms with sales exceeding $40,000 wereoperated by persons whose main occupation wasfarming while 52 percent of the farms with less than$40,000 in sales were operated by part-time farmers.In 1997, 78.5 percent of the farms with more than$50,000 in sales were operated by persons whosemain occupation was farming while almost 55 percentof farms with less than $50,000 in sales were operatedby part-time farmers.
The legal structure of California nursery operationsalso has changed over time. The distribution of thenumber of nursery farms in 1982 was sole propri-etors, 61 percent; partnerships, 14 percent; corporations,24 percent; and other, 1 percent. By 1997, this hadchanged to sole proprietors, 69 percent; partnerships,11 percent; corporations, 18 percent; and other, 2 per-cent.4 In the corporate category, the relative importanceof family corporations tended to decrease over time. Eventhough the share of farms organized as corporations hasdecreased over time, the share of farms owned by corpo-rations is larger for nursery operations than for any othersector in California agriculture. Note that the corporateshare of all California farms was about 7.1 percent in1997.
Postcensus Changes in Farm Numbers
While the structure of California agriculture has beenchanging since 1997, the extent of the changes isdifficult to determine because the 2002 agriculturalcensus has not yet been published. The 1997 censuslisted 4,988 California farms producing nursery andfloral products. As noted previously, 2,892 of thesefarms had less than $40,000 in sales and accountedfor only 1.3 percent of industry sales. The CaliforniaAgricultural Statistics Service (CASS), in its annualreports for the California floriculture industry, liststhe number of California floriculture producers withsales greater than $10,000. These reports show thenumber of floriculture producers decreasing fairlysteadily from 1,171 in 1998 to 973 in 2000 and to802 in 2002. The 2002 California directory of
3 The Census of Agriculture (USDA NASS) based the average value of land and buildings on a per-farm and per-acre basis on a sampleof California farms.4 The “other” category includes cooperatives, estates and trusts, institutions, etc.
Economic Contributions of the California Nursery Industry
7
nurserymen, which defines a commercial produceras someone who grows and sells a total of $1,000 ormore of nursery stock in one year, lists 2,999producers for 2002. If the total number of nursery
and floral producers has remained steady or decreasedwhile total production has increased, average sales perfarm may increase significantly.

Giannini Foundation Information Series No. 04–1
8
A s noted earlier, production by the California
nursery and floriculture industry has grownsignificantly over time, both in absolute values andrelative to the rest of California agriculture. The valueof floral products has remained generally stable overthe last decade while the value of nursery productshas increased. The total value of California nurseryand floral products grew from $1.75 billion in 1989to $3.17 billion in 2001 (an overall increase of 81percent). This growth over time is shown in Figure 2.Total output dipped slightly from 1991 to 1992 andthen grew steadily from $1.938 billion in 1992. Totaloutput increased 63.5 percent from 1992 through2001 while real output (total revenue adjusted forprice changes) increased 43.9 percent. Also shownin Figure 2 is the nursery and floriculture industry’sannual share of total California agriculturalproduction. Note that nursery’s share of totalagricultural output increased from 1989 through
1991, dropped to 8.3 percent in 1993, and thensteadily increased to 10.6 percent of total Californiaagricultural output in 2001.
Total California agricultural output grew steadily,from $21.77 billion in 1992 to $29.8 billion in 2001,with the only pause in year-to-year growth occurringin 1998. However, the ten-year growth of 36.9 per-cent for total agricultural output was less than thenursery industry’s growth of 63.5 percent, resultingin an increased share of total output for the nurseryindustry (Appendix, Table A2).
Location of Production
Nursery products and/or flowers and foliage are pro-duced in 55 of California’s 58 counties, butproduction tends to be concentrated in Central Coastand South Coast counties.5 There were ten countieswith more than $100 million in nursery, flower,
and foliage productionin 2001 (Figure 3). Sevenof the ten counties bor-der the Pacific Ocean,and Santa Clara Countyhas a coastal type ofclimate (Figure 3). Notethat Kern is the onlyCentral Valley countyin the top ten. As shown inTable 2, San Diego Countydominates the industrywith almost 27 percent oftotal production. The nextfour counties—Ventura,Orange, Monterey, and LosAngeles—combine for25.32 percent of totalCalifornia production. Theremaining five countiesaccount for 21.16 percent
Figure 2. California Nursery and Floral Product Sales, Farm Value, and Percent ofCalifornia’s Total Agriculture
1989 1991 1993 1995 1997 1999 2001
3.5
3.0
2.5
2.0
1.5
1.0
0.5
0
12.0
11.5
11.0
10.5
10.0
9.5
9.0
8.5
8.0
7.5
7.0
Total Sales
Percent of CaliforniaAgriculture
Source: California Agricultural Statistics Service, County Agricultural Commissioners’ data.
sale
s in
bill
ion
dolla
rs
percent of California agriculture
GROWTH OF THE CALIFORNIA NURSERY INDUSTRY
5 The gross value of nursery, flower, and foliage production by county is shown in Table A2 of the Appendix. Note that the countyagricultural commissioners’ reports do not include nursery and flower sales for seven counties that do have producers listed inCDFA’s 2002 directory, Nurserymen and Others Licensed to Sell Nursery Stock in California. These counties and the number of producersare Colusa (1), Imperial (10), Kings (2), Modoc (3), Plumas (3), Tuolumne (6), and Yuba (5).

Economic Contributions of the California Nursery Industry
9
Inyo
San Diego
SanBernardino
Imperial
Riverside
Orange
Los Angeles
Kern
Ventura
SantaBarbara
Monterey
SanBenito
Alameda
SantaCruz
SanMateo
Kings
Tulare
FresnoMadera
Mono
Mariposa
Tuolumne
Cala-veras
Amador
El Dorado
Placer
Nevada
ContraCosta
Sacra-mento
Merced
Sierra
SanJoaquin
Stanislaus
Solano
Colusa
Glenn
Marin
Sonoma
Lake
Alpine
ButteMendocino
TehamaPlumas
Lassen
DelNorte
SiskiyouModoc
HumboldtTrinity
Shasta
Sutter
Yuba
NapaYolo
More than $100 million
Less than $1 million
$1 to $19.99 million
$20 to 49.99 million
$50 to $99.99 million
Zero
San LuisObispo
SantaClara
Figure 3. Nursery and Floral Production by County, Value at the Farm Gate, 2001
Source: California Agricultural Statistics Service, County Agricultural Commissioners’ Data, 2001.
Giannini Foundation Information Series No. 04–1
10
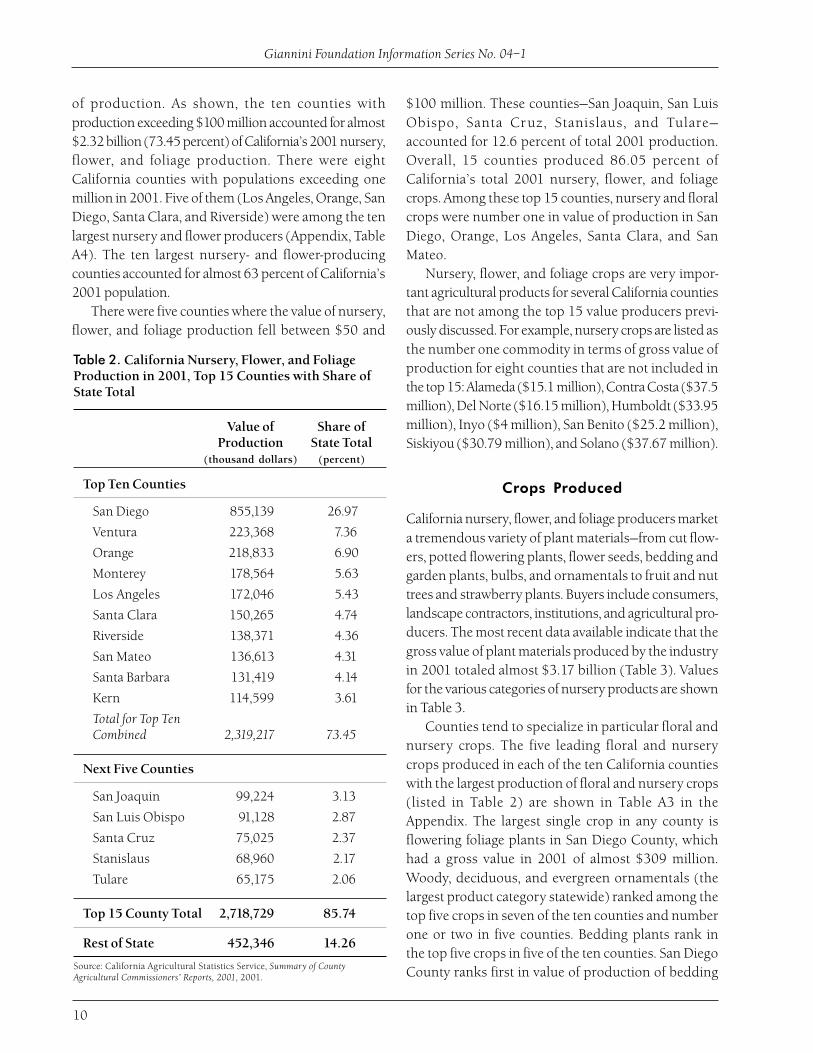
Table 2. California Nursery, Flower, and FoliageProduction in 2001, Top 15 Counties with Share ofState Total
Value of Share ofProduction State Total
(thousand dollars) (percent)
Top Ten Counties
San Diego 855,139 26.97
Ventura 223,368 7.36
Orange 218,833 6.90
Monterey 178,564 5.63
Los Angeles 172,046 5.43
Santa Clara 150,265 4.74
Riverside 138,371 4.36
San Mateo 136,613 4.31
Santa Barbara 131,419 4.14
Kern 114,599 3.61
Total for Top TenCombined 2,319,217 73.45
Next Five Counties
San Joaquin 99,224 3.13
San Luis Obispo 91,128 2.87
Santa Cruz 75,025 2.37
Stanislaus 68,960 2.17
Tulare 65,175 2.06
Top 15 County Total 2,718,729 85.74
Rest of State 452,346 14.26
Source: California Agricultural Statistics Service, Summary of CountyAgricultural Commissioners’ Reports, 2001, 2001.
of production. As shown, the ten counties withproduction exceeding $100 million accounted for almost$2.32 billion (73.45 percent) of California’s 2001 nursery,flower, and foliage production. There were eightCalifornia counties with populations exceeding onemillion in 2001. Five of them (Los Angeles, Orange, SanDiego, Santa Clara, and Riverside) were among the tenlargest nursery and flower producers (Appendix, TableA4). The ten largest nursery- and flower-producingcounties accounted for almost 63 percent of California’s2001 population.
There were five counties where the value of nursery,flower, and foliage production fell between $50 and
$100 million. These counties—San Joaquin, San LuisObispo, Santa Cruz, Stanislaus, and Tulare—accounted for 12.6 percent of total 2001 production.Overall, 15 counties produced 86.05 percent ofCalifornia’s total 2001 nursery, flower, and foliagecrops. Among these top 15 counties, nursery and floralcrops were number one in value of production in SanDiego, Orange, Los Angeles, Santa Clara, and SanMateo.
Nursery, flower, and foliage crops are very impor-tant agricultural products for several California countiesthat are not among the top 15 value producers previ-ously discussed. For example, nursery crops are listed asthe number one commodity in terms of gross value ofproduction for eight counties that are not included inthe top 15: Alameda ($15.1 million), Contra Costa ($37.5million), Del Norte ($16.15 million), Humboldt ($33.95million), Inyo ($4 million), San Benito ($25.2 million),Siskiyou ($30.79 million), and Solano ($37.67 million).
Crops Produced
California nursery, flower, and foliage producers marketa tremendous variety of plant materials—from cut flow-ers, potted flowering plants, flower seeds, bedding andgarden plants, bulbs, and ornamentals to fruit and nuttrees and strawberry plants. Buyers include consumers,landscape contractors, institutions, and agricultural pro-ducers. The most recent data available indicate that thegross value of plant materials produced by the industryin 2001 totaled almost $3.17 billion (Table 3). Valuesfor the various categories of nursery products are shownin Table 3.
Counties tend to specialize in particular floral andnursery crops. The five leading floral and nurserycrops produced in each of the ten California countieswith the largest production of floral and nursery crops(listed in Table 2) are shown in Table A3 in theAppendix. The largest single crop in any county isflowering foliage plants in San Diego County, whichhad a gross value in 2001 of almost $309 million.Woody, deciduous, and evergreen ornamentals (thelargest product category statewide) ranked among thetop five crops in seven of the ten counties and numberone or two in five counties. Bedding plants rank inthe top five crops in five of the ten counties. San DiegoCounty ranks first in value of production of bedding

Economic Contributions of the California Nursery Industry
11
plants ($165 million), but Ventura, Monterey, LosAngeles, and Santa Clara each have significant production.Cut flowers rank in the top five crops in eight of the tencounties, with the greatest production in San Diego,Ventura, and Santa Barbara. Cut roses are important inMonterey and Santa Clara. Kern, the only Central Valleycounty in the top ten, dominates production of rose plantsand is the only one of the ten that counts nursery, fruit,vine, and nut crops among its top five.
Marketing Channels
The distribution of California floral and nurserysales varies by product. A survey of Californiaflower growers conducted in 2000 found that
59 percent of flowersproduced in Californiawere sold in California, 40percent were shippedto other states, and 1 percentwas exported to other coun-tries (Prince & Prince, Inc.).Based on industry estimates,approximately 79 percent ofCalifornia nursery products aresold in California, 20 percentare shipped to other states, and1 percent is exported to othercountries.
Number andType of Firms
There are a variety of Californiafirms involved in productionand distribution of nurseryand floral products. Accordingto the 2002 Directory ofNurserymen and OthersLicensed to Sell Nursery Stockin California, there are 2,999California producers of nurseryand floral products.6 This
includes 551 producers in San Diego County, 375 inLos Angeles County, and 207 in Riverside County. Atthe other end of the range, there are between one andfive producers in each of nine counties and no registeredproducers in three counties (Appendix, Table A5). Movingforward in the channel of distribution, 3,756 retailersprimarily sell nursery and floral products. Among themare 263 integrated producer/retailer operations(producers who also retail nursery and floral products).There are also 3,465 incidental retailers registeredin California—retail outlets with multiple product lines,including nursery and floral products. Retail stores inthe incidental classification include many of the largestnursery retailers (warehouse club stores, chain stores,and mass merchandisers such as Home Depot, Lowe’s,
Table 3. Wholesale Value of California Nursery Products by Major Categories,2000 and 2001
2000 Value 2001 Value
Floral Products
Cut Flowers and Cut Greens $383,101,500 $359,810,600
Flower Seeds 5,830,700 6,074,100
Christmas Trees 10,685,800 10,304,900
Total $399,618,000 $376,189,600
Nursery Products
Potted Plants and Flowering Foliage $615,772,400 $631,386,400
Bulbs, Corm, Roots and Tubers 10,295,200 35,712,300
Flowering Propagative Materials 75,590,000 75,700,800
Bedding Plants 465,045,400 480,438,100
Rose Plants 45,936,000 54,062,000
Woody, Deciduous, and Evergreen 772,006,300 823,255,600Ornamentals
Herbaceous Perennials 30,069,200 36,175,500
Turf and Sod 42,750,300 56,724,700
Nursery Stock Other than 639,508,900 598,606,600Ornamentals
Total $2,696,973,700 $2,792,062,000
Grand Total $3,096,591,700 $3,168,251,600
Source: California Department of Food and Agriculture Nursery Program, Value of California Nursery Products,Fiscal Year 2001/2002, 2002.
6 The California Food and Agriculture Code states that “It is unlawful to sell any nursery stock without an annual license from theSecretary of Food and Agriculture.” Further, “Exemption from license is allowable to florists and others who only sell plants at retailfor the sole purpose of indoor decoration, to persons who sell no nursery stock except seeds, and to persons who only sell cutChristmas trees.” (Sections 6721 through 6744)

Giannini Foundation Information Series No. 04–1
12
Wal-Mart, K-Mart, Target, and the supermarketchains). Many producers sell directly to large-scaleretailers, performing the functions usually associatedwith wholesalers and brokers. There are also 853wholesalers and 476 jobber/broker/commissionmerchants dealing in nursery and floral products inCalifornia.
Retail Sales
Partial data on retail floral and nursery product sales inCalifornia are available from government statistics. Pri-vate data collection efforts and consultant reports alsoinclude retail sales. These multiple sources were used todevelop the best possible estimates for this study.
The California State Board of Equal-ization publishes sales data by type of retailoutlet but not by product line. There are annualretail sales data for florists and for farmand garden supply stores, two types of stores that tendto specialize in floral and nursery products. There arealso aggregate sales data forlarge multi-product retailerssuch as food stores,hardware stores, and generalmerchandise stores, but it isnot possible to determine theirshare of floral and nurseryproduct sales. Lacking moredetailed retail data, industrymembers have developedtheir own rules of thumb forestimating total retail sales.
One such method has simply doubled reported salesfor florists (based on the growing importance of flowersales by supermarkets) and farm and garden stores(based on the growth in floral and nursery sales bylarge retailers such as Home Depot, Lowe’s, Wal-Mart,Target, Price-Costco, and others that are not includedin that category). Retail sales reported by Californiaflorists and farm and garden supply stores for the five-year period from 1997 through 2001 are shown inTable 4. Note that combined sales for the two typesof stores shown in Table 4 increased from $2.75 billionin 1997 to almost $3.05 billion in 2001. There were5,338 sales tax permits for retail florists and 3,711permits for retail farm and garden stores onJuly 1, 2001.
Nursery Retailer publishes estimates of annual lawnand garden retail sales by state and also ranksAmerica’s 100 largest nursery retailers annually.California is the largest single market for lawn andgarden products in the United States, accounting forbetween 10.3 and 10.4 percent of total annual salessince 1997 (Table 5). Estimated 2001 California lawnand garden sales totaled $9.913 billion of the U.S. totalof $88.4 billion (Greenidge 2002). For the UnitedStates, the composition of estimated total sales for theproduct lines carried by lawn and garden stores were:green goods, 26 percent; equipment and tools,28.4 percent; chemicals and fertilizers, 24.8 percent;and lawn furniture, accessories, and tree trim, 20.8percent.
Market Shares
Where consumers purchase floral and nursery productshas changed significantly over time in response to
Table 5. Estimated Annual U.S. and California Lawn and GardenRetail Sales, 1997–2001
Year U.S. California California’s Sharemillion dollars million dollars of U.S. Total
1997 76,500 7,896 10.32
1998 79,100 8,154 10.31
1999 81,700 8,422 10.31
2000 84,600 8,798 10.40
2001 88,400 9,193 10.40
Source: Nursery Retailer, February/March, 1998–2002.
Table 4. Statewide Taxable Sales by California RetailFlorists and Farm and Garden Supply Stores,1997–2001
Farm andYear Florists Garden Total
thousand dollars
1997 816,185 1,936,173 2,752,358
1998 843,978 1,967,564 2,811,542
1999 921,774 1,961,504 2,883,278
2000 983,396 2,060,713 3,042,436
2001 988,022 2,059,040 3,047,062
Source: California State Board of Equalization, Taxable Sales in Californiaduring 2001, Forty-First Annual Report, 2002.

Economic Contributions of the California Nursery Industry
13
changes in the structure of re-tailing, competition in localmarkets, and growing con-sumer demand. Greenidge, ina 1995 Nursery Retailer article,listed three major lawn andgarden product distributionchannels with estimated 1994market shares. The channelsand shares of the total marketwere hardware/hardlines, 20.8percent; garden centers/nurs-eries, 39.1 percent; and massmarketers/chain stores, 40.1percent.7 In 2001, only sevenyears later, the growth of big-box stores such as HomeDepot and Lowe’s in the hardware category had in-creased the hardware/hardline’s share to 38.9 percentof the total market. The independent sector’s share(garden centers, nurseries, and farm stores) decreasedto 31.1 percent, and the share held by warehouseclubs, chain stores, and mass merchandisers (Wal-Mart and K-mart are the largest) decreased to 30percent (Greenidge 2002). These changes in marketshare, while dramatic, are not surprising given therapid growth in the number of big-box stores and typi-cal sales of lawn, garden, and nursery items in thosestores. National data, for example, show 2001 lawnand garden sales in the average Home Depot store atmore than $5.2 million annually, sales in the averageLowe’s store at $5 million annually, and sales in theaverage home center store (a category that includesHome Depot and Lowe’s) at $4.67 million annually(Morey, Morey, and Morey).
Retail florists are not included in the store typesor total sales figures reported in Table 5. In addition,Nursery Retailer’s independent sector (garden centers,nurseries, and farm stores) discussed previouslyundoubtedly includes more retailers than counted bythe California State Board of Equalization in the farmand garden supply store category shown in Table 4.Retail florists have faced competition from and lossof market share to other store types, especiallysupermarkets. Data for market share over time werenot available, but estimates of California’s 2001 floral
market shares by type of retail outlet were providedby The American Floral Endowment (AFE).
AFE collects detailed data on retail flower salesfrom a national consumer panel and uses this paneldata to develop timely detailed sales estimates for useby its subscribing members. Sales data are collectedfor three major types of flower products—cut flowers,flowering and greenhouse plants, and outdoor gar-den and bedding plants. These three floral productcategories accounted for 43, 23, and 32 percent, re-spectively, of estimated total 2001 California retailflower sales. The importance of the various retailersvaries significantly by flower product category.
The dominant outlet for cut flowers was floristshops, which had a 47.4 percent market share, fol-lowed by supermarkets, which had a 25.9 percentshare (Table 6). Home improvement/hardware stores,supermarkets, and garden centers each retailed abouta one-fifth share of flowering and greenhouse plants.Garden centers and home improvement/hardwarestores had the dominant market shares for outdoorgarden and bedding plants in California.
Retail Margins
Gross profit margins (sales revenue minus cost ofgoods sold) vary across retail store types and amongstores within a given type because of factors such asfirm size, location, services provided, product mix,product perishability, and competitive conditions.
7 Greenidge noted that garden centers, nurseries, and farm stores had about 60 percent of the market in 1980.
Table 6. Estimated Market Shares of Various Retail Store Types for Salesof Flower Products in California, 2001
Flower Cut Flowering and Outdoor GardenProduct Flowers Greenhouse Plants and Bedding
Florist Shop 47.4 12.7 0.7
Garden Center 0.6 19.0 39.5
Discount Chain 0.7 6.7 7.8
Home Improvement/ 0.2 20.9 37.4 Hardware
Supermarket 25.9 20.5 2.6
Warehouse/ Price Club 8.3 3.4 0.4
Other Store 16.9 16.8 11.6
Source: Sales estimates provided by The American Floral Endowment, Glen Carbon, Illinois.

Giannini Foundation Information Series No. 04–1
14
Estimates of gross margins are an essential componentfor deriving estimates of the economic contributionsof California’s f loral and nurser y industry.
Estimated gross margins and2001 retail sales are shown inTable 7. Gross margins rangefrom a low of 30 percent forthe largest volume retailers(hardware/big box) to a highof 50 percent for retail florists.Note that these are estimatedaverages for the categoriesand that individual storeswithin a category rangedabove and below the estimate.The weighted average retailgross margin is slightly morethan 37 percent. Total
California lawn, garden, and floral product retailsales are estimated at slightly more than $10.18billion in 2001.
Table 7. Estimated Percentage Gross Margin for Floral and NurseryProducts by Retail Store Type, Estimated Total Floral and Nursery Sales,and Total Margin, California, 2001
Gross Margin Retail Sales Total MarginRetail Store Type percent million dollars million dollars
Hardware/Big Box 30 3,576.077 1,072.8231
Independent Farm/Garden 45 2,859.023 1,286.5604
Chain/Warehouse 33 2,757.900 919.3000
Florists 50 988.022 494.0110
Total 37 10,181.112 3,772.6945
Source: Gross margin estimates provided by members of the California Association of Nurseries and GardenCenters; retail sales estimates are from Nursery Retailer and the California State Board of Equalization(Tables 4 and 5).

Economic Contributions of the California Nursery Industry
15
or retailing, indirect effects are changes in interindus-try transactions as supplying industries respond toincreased demands from nursery production or retail-ing, and induced effects are changes in local spendingthat result from income changes in the directly andindirectly affected industry sectors. The sum of direct,indirect, and induced effects is the total-effects multi-plier. We estimate Type SAM (social accountingmatrix) multipliers for output, employment, valueadded, and labor income.
Lindall and Olson describe the IMPLAN multipliers.Type SAM multipliers are the direct, indirect, and inducedeffects where the induced effect is based on informationin the social account matrix. This relationship accountsfor social security and income tax leakage, institutionsavings, and commuting. Interpretation of the tabledmultipliers follows.
8 We used IMPLAN PRO software licensed from Minnesota IMPLAN Group, Inc. (MIG) and the associated databases for California.For a detailed description of the software and data, see MIG, Implan Professional Social Accounting and Impact Analysis Software User’sGuide, Analysis Guide and Data Guide, 1997.
California’s floral and nursery sector is closelyintertwined with other sectors of the state’s
economy, and changes in flower and nurseryproduction have ripple effects throughout the state.Each dollar earned in the floral and nursery sectorstimulates economic activity in the form of jobs,income, and output. The effects of changes in floraland nursery production on total economic activity areestimated through multipliers developed from input-output models. For this study we used the IMPLAN(Impact Analyses and Planning) system, developed bythe U.S. Forest Service and USDA, to estimateeconomic input-output models for individualCalifornia counties and the state.8 The input-outputmodels provide detailed economic multipliers forgreenhouse and nursery production and retailing, aswell as for all other sectors of the California economy.A brief description of the IMPLAN system is includedin the Appendix in Table A6.
Economic Multipliers
IMPLAN models of the Califor-nia economy were constructedfor the ten individual countieswith the largest 2001 flowerand nursery production in thestate. The estimated multipliersfor California nursery produc-tion and lawn and gardenretailing are shown in Table 8.The total-effects multipliers forthe ten California counties areshown in Table 9.
IMPLAN multipliers forCalifornia nursery productionand retailing estimate threecomponents of total change fora particular county or the state.Direct effects are the initialchange in nursery production
Table 8. Estimated IMPLAN Multipliers for the California Nursery Industry
Direct Indirect Induced TotalType/Sector Effects Effects Effects Effects
Output
Nursery 1.0000 0.1646 0.3407 1.5053
Retail 1.0000 0.0999 0.3760 1.4759
Employment (jobs/$ million)
Nursery 19.9723 2.1496 3.4478 25.5696
Retail 18.4669 1.0159 3.8046 23.2874
Value Added
Nursery 0.8084 0.1029 0.2120 1.1232
Retail 0.8816 0.0626 0.2339 1.1781
Labor Income
Nursery 0.4752 0.0657 0.1318 0.6727
Retail 0.5551 0.0393 0.1455 0.7399
Source: Minnesota IMPLAN Group (MIG), Inc., 2003.
ESTIMATED ECONOMIC IMPACTS
Giannini Foundation Information Series No. 04–1
16
Output multipliers relate changes in sales to fi-nal demand by one industry (nursery or retail)to total changes in output (gross sales) by all in-dustries within the local area. An industry outputmultiplier of 1.50 would indicate that a changein sales to final demand of $1.00 by the indus-try in question would result in a total change inlocal output of $1.50.Labor-income and employment multipliers relatechanges in direct production to changes in la-bor income and employment within the localeconomy. For example, a labor-income multi-plier for a direct industry change of 1.75 indicatesthat a $1.00 change in output in the direct in-dustry will produce an employment incomechange of $1.75 in the local economy. Similarly,an employment multiplier of 25 indicates that 25jobs are created for each $1 million of output bythe industry.Value-added multipliers are interpreted the sameas labor-income and employment multipliers.They relate changes in sales in the industry ex-periencing the direct effect to total changes invalue added for the local economy. Value addedincludes employee compensation, proprietaryincome, other property type income, and indi-rect business taxes.
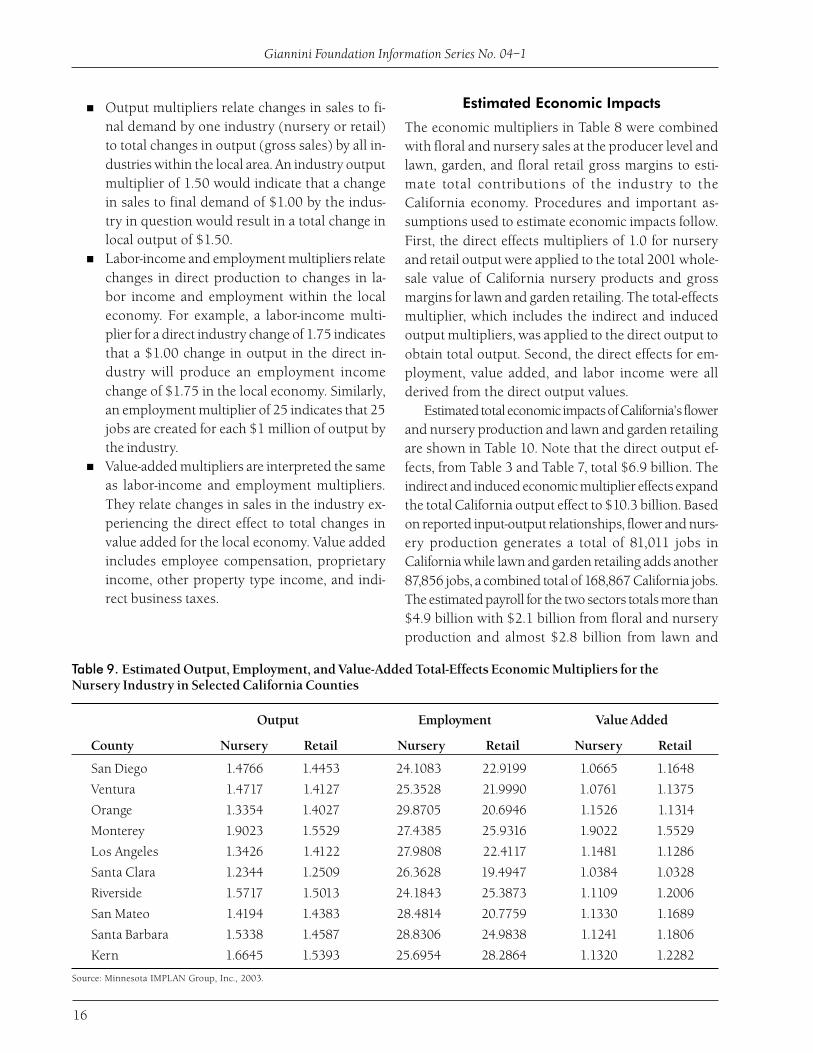
Table 9. Estimated Output, Employment, and Value-Added Total-Effects Economic Multipliers for theNursery Industry in Selected California Counties
Output Employment Value Added
County Nursery Retail Nursery Retail Nursery Retail
San Diego 1.4766 1.4453 24.1083 22.9199 1.0665 1.1648
Ventura 1.4717 1.4127 25.3528 21.9990 1.0761 1.1375
Orange 1.3354 1.4027 29.8705 20.6946 1.1526 1.1314
Monterey 1.9023 1.5529 27.4385 25.9316 1.9022 1.5529
Los Angeles 1.3426 1.4122 27.9808 22.4117 1.1481 1.1286
Santa Clara 1.2344 1.2509 26.3628 19.4947 1.0384 1.0328
Riverside 1.5717 1.5013 24.1843 25.3873 1.1109 1.2006
San Mateo 1.4194 1.4383 28.4814 20.7759 1.1330 1.1689
Santa Barbara 1.5338 1.4587 28.8306 24.9838 1.1241 1.1806
Kern 1.6645 1.5393 25.6954 28.2864 1.1320 1.2282
Source: Minnesota IMPLAN Group, Inc., 2003.
Estimated Economic Impacts
The economic multipliers in Table 8 were combinedwith floral and nursery sales at the producer level andlawn, garden, and floral retail gross margins to esti-mate total contributions of the industry to theCalifornia economy. Procedures and important as-sumptions used to estimate economic impacts follow.First, the direct effects multipliers of 1.0 for nurseryand retail output were applied to the total 2001 whole-sale value of California nursery products and grossmargins for lawn and garden retailing. The total-effectsmultiplier, which includes the indirect and inducedoutput multipliers, was applied to the direct output toobtain total output. Second, the direct effects for em-ployment, value added, and labor income were allderived from the direct output values.
Estimated total economic impacts of California’s flowerand nursery production and lawn and garden retailingare shown in Table 10. Note that the direct output ef-fects, from Table 3 and Table 7, total $6.9 billion. Theindirect and induced economic multiplier effects expandthe total California output effect to $10.3 billion. Basedon reported input-output relationships, flower and nurs-ery production generates a total of 81,011 jobs inCalifornia while lawn and garden retailing adds another87,856 jobs, a combined total of 168,867 California jobs.The estimated payroll for the two sectors totals more than$4.9 billion with $2.1 billion from floral and nurseryproduction and almost $2.8 billion from lawn and

Economic Contributions of the California Nursery Industry
17
Table 10. Estimated Direct and Total EconomicEffects of California Flower and Nursery Productionand Lawn and Garden Retailing, 2001
Type/Sector Direct Effects Total Effects
Output (million dollars)
Nursery 3,168.2516 4,769.1691
Retail 3,772.6945 5,568.1198
Total 6,940.9461 10,337.2889
Employment (jobs)
Nursery 63,277 81,011
Retail 69,670 87,856
Total 132,947 168,867
Value Added (million dollars)
Nursery 2,561.2146 3,558.5801
Retail 3,326.0075 4,444.6113
Total 5,887.2221 8,003.1915
Labor Income (million dollars)
Nursery 1,505.5532 2,131.2828
Retail 2,094.2227 2,791.4167
Total 3,599.7759 4,922.6995
Table 11. Estimated Total Output, Employment, and Value-Added Effects of Nursery and Floral Productionand Lawn and Garden Retailing in California’s Top Ten Producing Counties, 2001
Output Employment Value Addedmillion dollars number of jobs million dollars
County Nursery Retail Nursery Retail Nursery Retail
San Diego 1,262.698 453.515 20,616 7,192 912.006 365.498
Ventura 328.731 118.606 5,663 1,847 240.366 95.501
Orange 292.230 443.271 6,537 6,540 252.227 357.537
Monterey 339.682 69.022 4,900 1,153 339.664 69.022
Los Angeles 230.989 1,495.828 4,814 23,739 197.526 1,195.433
Santa Clara 185.487 233.019 3,961 3,631 156.035 192.391
Riverside 217.478 260.852 3,346 4,411 153.716 208.605
San Mateo 193.908 112.423 3,891 1,624 154.783 91.366
Santa Barbara 201.570 64.531 3,789 1,105 147.728 52.229
Kern 190.750 113.765 2,945 2,091 129.726 90.773
Total 3,443.524 3,364.833 60,461 53,332 2,683.778 2,718.355
Source: Minnesota IMPLAN Group, Inc., 2003.
garden retailing. Total value added for the two sec-tors is just slightly more than $8 billion with almost$3.6 billion from floral and nursery production and alittle more than $4.4 billion from lawn and gardenretailing. The difference between total effects and di-rect effects for each row in Table 10 is the sum ofindirect and induced effects.
The estimated economic multipliers for the tenCalifornia counties with the greatest nursery and floralproduction (Table 9) were combined with directoutput (Table 2) and estimated retail gross marginsby county to estimate total output, employment, andvalue-added effects for California’s nursery and floralproduction and lawn and garden retailing. Theresulting estimates are shown in Table 11. Note thatthe counties that produce the most are not necessarilythe largest sources of retail sales since sales and gross-margin estimates are based on each county’spopulation. While the top ten counties account formore than 73 percent of California production, theyaccount for a little less than 63 percent of the state’spopulation. The combined output effects for thenursery and retail industries in the ten counties is$6.808 billion (Table 11), which is almost 66 percentof California’s total output effect of $10.337 billion(Table 10). The nursery and floral industries have a huge

Giannini Foundation Information Series No. 04–1
18
9 A reviewer asked about the relative impact of nursery and floral production on employment. Using data from the CaliforniaDepartment of Employment Development Web site, we calculated the proportion of total 2001 employment attributed to nurseryand floral production. For all of California, the nursery and floral industries generated 1.17 percent of total employment in 2001. Forthe ten counties shown in Table 11, the largest relative employment impacts were in Monterey (3.98 percent of total countyemployment), Santa Barbara (3.02 percent), Ventura (2.65 percent), San Diego (2.30 percent), and Kern (2.18 percent). Thesmallest relative impacts were in Los Angeles (0.70 percent), Santa Clara (0.80 percent), Orange (0.93 percent), San Mateo (1.47percent), and Riverside (1.59 percent).
economic impact in San Diego County, accounting formore than 20,000 jobs, $1.26 billion in output, and $912million in value added. While not as dramatic, theoutput, employment, and value-added effects in theother nine counties are also substantial and veryimportant. The total output effects of the nurseryindustry, for example, exceed $290 million for threeof the nine counties, and three more counties havetotal output impacts ranging from $200 to $231million. In terms of employment in the nine counties,the nursery industry accounts for a low of 2,945 jobs
in Kern County to a high of 6,537 jobs in OrangeCounty (Table 11).9
Los Angeles County dominates the retail lawn andgarden sales impacts shown in Table 11. This is notsurprising given that it had 9,653,900 residents in2001, slightly more than 28 percent of California’spopulation. There are 778 incidental retailers and 824specialty retailers for nursery and floral products inLos Angeles County (Appendix, Table A5). San Diegoand Orange Counties have very important but smallerretail impacts.

Economic Contributions of the California Nursery Industry
19
The California nursery and floral industries havedemonstrated significant growth during the last
two decades, in real terms and relative to all of Cali-fornia agriculture. Dimensions of this growth includeexpansion in the number and average size of farmsproducing nursery and floral products, a threefoldincrease in crop revenues, and growth to 10.6 percentof the total value of California agricultural output.Recent growth of output has come primarily fromnursery production. The flower industry and cut flow-ers in particular have faced significant competitionfrom imports from Colombia, Costa Rica, Ecuador,Mexico, and the Netherlands.
Data for the nursery and floral industries are typi-cally reported separately. Annual county agriculturalcommissioners’ reports have ranked the nursery in-dustry third among all California commodities interms of value of production since 1994; the flowerindustry has ranked seventh. Recently, the nurseryand floral industries combined have ranked secondamong all California agricultural products. At the na-tional level, California’s nursery and flower industrieslead the nation; Florida ranks a distant second.
Fifty-five of California’s 58 counties produce nurs-ery and flower products, but output is small and notreported separately by agricultural commissioners innine of the counties. As noted, nursery and flowerproduction tends to be concentrated in coastal coun-ties from San Mateo in the north to San Diego in thesouth. Fifteen counties account for more than 86 per-cent of total production. Nursery and flower productionwas the number one agricultural product in terms ofvalue of production in 13 counties with values in 2001ranging from more than $855 million in San Diego to$4 million in Inyo. The location of many nursery andflower producers in the most urbanized areas of Cali-fornia is a distinguishing feature of the industry. Theseproducers are close to many of their customers, help-ing them to deliver quality products and minimizedistribution costs.
The large, growing, economically important nurs-ery and flower production sector is accompanied by
a large and growing retail sector. California is the larg-est single market for lawn and garden products in theUnited States with 2001 retail sales estimated at morethan $10.1 billion. The combined effects of nurseryand flower production and lawn and garden retailingon the California economy are huge.
The total economic impacts of California flowerand nursery production and lawn and garden retail-ing were estimated at more than $10.3 billion in 2001.Based on reported input-output relationships, flowerand nursery production generates 81,011 jobs in Cali-fornia while lawn and garden retailing adds another87,856 jobs, resulting in a combined total of 168,867California jobs—1.17 percent of total California em-ployment in 2001. The estimated payroll for the twosectors together exceeded $4.9 billion with $2.1 bil-lion from floral and nursery production and almost$2.8 billion from lawn and garden retailing. Totalvalue added for the two sectors was slightly more than$8 billion with almost $3.6 billion from floral andnursery production and a little more than $4.4 bil-lion from lawn and garden retailing.
The important message that the nursery and flowerindustries should deliver to policymakers, agriculturalleaders, and the general public at every available op-portunity is that the industries are large, growing, andeconomically important. In terms of total output, theCalifornia nursery industry is exceeded only by thedairy and grape industries, and when the nursery andflower industries are combined, their output is ex-ceeded only by the dairy industry. Nursery and floralproduction exceeds the output of many large, well-known, world-class California agricultural industries,including, for example, lettuce, cattle, strawberries,tomatoes, almonds, cotton, chickens, oranges, broc-coli, carrots, walnuts, avocados, celery, melons, andpeaches. Recently, more than $1.06 of every $10 ofCalifornia agricultural gross sales were from nurseryand floral products. And finally, more than one out ofevery hundred jobs in California during 2001 couldbe attributed to the direct and indirect impacts of Cali-fornia nursery production and retailing.
CONCLUDING COMMENTS

Giannini Foundation Information Series No. 04–1
20

Economic Contributions of the California Nursery Industry
21
California Agricultural Statistics Service. County Ag-ricultural Commissioners’ data. Sacramento CA,1989–2001. Available online as Microsoft Excelfiles at www.nass.usda.gov/ca/bul/agcom/indexcac.htm.
California Agricultural Statistics Service. Summary ofCounty Agricultural Commissioners’ Reports, 2001.Sacramento CA, 2001.
California Agricultural Statistics Service. California Ag-ricultural Statistics, Floriculture. Sacramento,CA, 2001 and 2002. Available online atwww.nass.usda.gov/ca/bul/agstat/indexcas.htm.
California Department of Employment Development.Labor market information. Sacramento CA, 2001.Available online at www.calmis.ca.gov/file/occup$/oes$.htm.
California Department of Employment Development.California Agricultural Bulletin. Sacramento CA,1999–2001. Available online at www.calmis.ca.gov/htmlfile/subject/agric.htm.
California Department of Finance, Demographic Re-search Unit. Population estimate data for cities,counties, and state. Sacramento CA, 2001.Available online at www.dof.ca.gov/HTML/DEMOGRAP/Hist_E-4.xls.
California Department of Food and Agriculture. Re-source Directory, California Agriculture: A Traditionof Innovation. Sacramento CA, 2002. Availableonline at www.cdfa.ca.gov/card/card_new02.htm.
California Department of Food and Agriculture, Nurs-ery Program. Value of California Nursery Products,Fiscal Year 2001/2002. Sacramento CA, 2002.
California Department of Food and Agriculture. Nurs-erymen and Others Licensed to Sell Nursery Stock inCalifornia, 2002 Directory. Sacramento CA, 2002.Available online at www.plant.cdfa.ca.gov/nurserylicense/nlmenu.asp.
California State Board of Equalization, Research andStatistics Section. Taxable Sales in California dur-ing 2001, Forty-First Annual Report. Sacramento CA,2002. Available online at www.boe.ca.gov/news/pdf/ts_a01.pdf.
Greenidge, Chuck. “Gaze into 1995. Will L>hrive?” Nursery Retailer 40(1) (1995):50–53.
Greenidge, Chuck. “2002 Looks Bright as SalesSteadily Rise.” Nursery Retailer 47(1) (2002):62–68. (Articles by Dr. Greenidge in the February/March issues for earlier years include similar dataseries.)
IMPLAN Pro 2.0.1016. Minnesota IMPLAN Group,Inc., Stillwater, Minnesota (www.implan.com).
IMPLAN data for California, 1998, MinnesotaIMPLAN Group Version 1.08.01. MinnesotaIMPLAN Group, Inc., Stillwater, Minnesota(www.implan.com).
Lindall, S.A., and D.C. Olson. The IMPLAN Input-Out-put System. Stillwater, MN: Minnesota IMPLANGroup, Inc. (www.implan.com).
Minnesota IMPLAN Group, Inc. IMPLAN ProfessionalSocial Accounting and Impact Analysis Software,User’s Guide, Analysis Guide and Data Guide. 2ded. Stillwater, MN: MIG, Inc., 1997. Availableonline at www.implan.com.
Morey, R.W., J. Morey, and C. Morey. “2002 NurseryRetailer 100.” Nursery Retailer 47(2) (2002). (TheApril/May issues for earlier years report the samedata series.)
Mulkey, W.D., and A.W. Hodges. Using IMPLAN toAssess Local Economic Impacts. Gainesville, FL: Uni-versity of Florida Institute of Food andAgricultural Sciences Fact Sheet, 2000. Availableonline at http://edis.ifas.ufl.edu/FE168.
Prince & Prince, Inc. California Cut-Flower Productionand Industry Trends 2000: A State-Wide Survey ofCut-Flower Growers. Columbus, OH: Prince &Prince, Inc. Marketing Research Report, 2000.
United States Department of Agriculture, EconomicResearch Service. Floriculture and NurseryCrops Situation and Outlook Yearbook. Washing-ton DC, 2002. Available online at http://usda.mannlib.cornell.edu.
United States Department of Agriculture, National Ag-ricultural Statistics Service. Census of Agriculture.Washington DC, 1982–1997. Available online atwww.nass.usda.gov/census/census97/volume1/vol1pubs.htm.
REFERENCES

Giannini Foundation Information Series No. 04–1
22
United States Department of Agriculture, National Ag-ricultural Statistics Service. Floriculture Crops 2001Summary. Washington DC, 2002. Available onlineat http://usda.mannlib.cornell.edu.
United States Government Printing Office. EconomicReport of the President. Washington DC, 2002.Available from online at http://w3.access.gpo.gov/usbudget/fy2003/pdf/2002_erp.pdf.

Economic Contributions of the California Nursery Industry
23
APPENDIX

Giannini Foundation Information Series No. 04–1
24
Table A1. California’s Top 20 Commodities with Values and Ranks for 1999–2001
1999 2000 2001
Value in Value in Value inCommodity Million Dollars Rank Million Dollars Rank Million Dollars Rank
Milk and Cream 4,091 1 3,707 1 4,630 1
Grapes 2,656 2 2,829 2 2,651 2
Nursery 2,009 3 2,247 3 2,087 3
Lettuce 1,130 5 1,494 4 1,370 4
Cattle and Calves 1,223 4 1,218 5 1,352 5
Hay 767 9 769 9 1,021 6
Flowers 776 8 931 7 998 7
Strawberries 904 7 840 8 841 8
Tomatoes 1,118 6 948 6 766 9
Almonds 688 10 666 11 732 10
Cotton 672 11 720 10 658 11
Chickens 515 12 471 13 532 12
Oranges 404 15 346 14 514 13
Broccoli 433 14 574 12 438 14
Carrots 434 13 322 17 434 15
Walnuts 251 19 296 18 342 16
Avocados 327 16 340 15 316 17
Celery 210 25 325 16 260 18
Melons, Cantaloupe 222 22 226 24 252 19
Peaches 238 21 252 21 247 20
Source: California Department of Food and Agriculture, Resource Directory, California Agriculture: A Tradition of Innovation, 2002.

Economic Contributions of the California Nursery Industry
25
Table A2. Value (Thousand Dollars) of California Nursery, Flower, and Foliage Productionby County, 1992–2001
County 1992 1993 1994 1995 1996 1997 1998 1999 2000 2001
Alameda 33,725 31,873 34,641 28,933 25,211 25,215 17,421 19,058 14,049 15,108Amador 19 22 30 33 48 130 174 209 216 241Butte 5,085 6,351 6,400 7,437 4,485 5,350 3,610 6,400 5,961 8,555Calaveras 471 585 856 864 883 896 740 597 452 543Contra Costa 17,884 24,940 25,409 21,782 26,219 31,288 30,663 28,202 32,105 37,510Del Norte 10,710 9,721 11,357 10,895 10,683 12,415 13,322 14,831 15,427 16,151El Dorado 3,868 4,166 3,540 4,149 4,302 4,374 4,114 4,855 5,812 5,988Fresno 16,747 21,294 23,945 16,211 16,847 36,837 29,576 32,531 28,905 32,014Glenn 2,191 2,403 2,340 2,178 2,165 2,461 2,615 3,503 3,258 4,238Humboldt 17,923 20,940 20,940 17,419 17,419 22,577 23,227 25,806 32,859 33,952Inyo 1,111 1,109 1,324 1,525 3,485 2,341 2,897 2,981 3,515 4,020Kern 58,191 59,536 62,891 68,710 72,383 79,629 82,636 99,129 106,246 114,599Kings 0 1,958 2,343 0 0 0 0 0 0 0Lake 332 332 326 6 12 408 408 408 408 408Lassen 8,730 10,440 12,329 10,683 8,702 9,512 7,702 11,609 12,336 9,860Los Angeles 151,536 147,068 153,625 156,909 166,086 172,577 186,660 180,790 170,185 172,046Madera 4,294 3,855 3,160 3,470 5,324 4,541 15,128 30,200 37,500 24,543Marin 1,151 1,199 1,000 556 576 547 683 708 814 675Mariposa 93 93 95 100 108 108 99 136 152 147Mendocino 2,596 2,123 2,296 2,510 3,092 3 ,117 2,685 2,620 2,550 2,790Merced 11,212 14,603 14,923 14,093 14,265 15,833 19,007 23,747 21,758 22,233Monterey 147,528 116,515 105,514 111,199 114,176 135,893 154,297 180,822 194,252 178,564Napa 2,176 2,666 2,615 2,881 2,181 2,749 3,804 3,156 3,250 4,720Nevada 593 509 522 639 564 752 594 633 515 334Orange 131,397 117,405 127,988 132,780 143,537 165,727 168,387 200,966 214,877 218,833Placer 8,698 7,825 7,825 8,856 9,513 10,245 10,797 12,090 11,505 12,854Plumas 1,250 1,400 1,475 0 0 0 0 0 0 0Riverside 50,257 47,551 79,537 71,169 81,943 82,827 94,549 90,377 107,520 138,371Sacramento 22,757 16,643 9,910 9,582 15,745 15,969 17,933 17,113 26,408 28,968San Benito 18,598 23,364 19,384 14 ,992 15,350 15,668 16,985 19,682 28,428 25,207San Bernardino 23,141 21,517 22,915 21,906 22,890 23,303 21,718 26,458 29,502 34,617San Diego 509,768 556,921 585,433 643,193 692,106 704,988 722,186 773,081 790,140 855,139San Francisco 356 530 475 564 702 482 447 759 727 913San Joaquin 38,701 53,722 58,538 63,601 97,916 97,059 74,115 81,937 88,257 99,224San Luis Obispo 37,230 39,301 44,585 49,607 55,546 65,188 70,155 85,149 89,168 91,128San Mateo 168,909 164,707 165,401 161,611 169,657 171,854 142,460 142,842 154,756 136,613Santa Barbara 80,573 86,755 78,753 95,244 122,857 139,849 130,038 135,042 150,669 131,419Santa Clara 48,640 46,228 45,666 40,522 42,824 40,740 45,446 48,467 177,146 150,265Santa Cruz 54,115 48,174 43,859 51,762 62,972 73,110 56,686 71,562 76,556 75,025Shasta 9,587 8,229 9,622 9,502 8,865 8,674 8,462 9,534 8,212 8,830Sierra 450 420 443 0 0 0 0 0 0 0Siskiyou 6,922 6,566 7,939 9,962 14,526 16,722 17,844 20,695 25, 076 30,789Solano 14,169 14,512 17,345 19,715 22,348 24,078 26,408 28,978 35,045 37,668Sonoma 25,864 29,297 28,797 30,996 33,078 27,427 27,836 23,133 33,272 30,069Stanislaus 26,970 28,062 30,906 29,793 32,180 35,553 36,758 64,111 68,642 68,960Sutter 6,151 8,888 9,116 10,129 7,502 11,839 9,891 11,819 8,025 9,387Tehama 1,104 867 765 1,228 1,131 1,225 1,651 1,367 1,309 1,991Trinity 12 32 32 35 35 35 37 32 32 32Tulare 19,639 22,255 24,176 28,524 43,399 51,823 65,306 69,682 72,730 65,175Ventura 97,001 105,417 111,230 108,387 124,123 138,808 162,063 180,624 204,828 223,368Yolo 3,753 3,746 4,514 5,584 5,028 5,603 2,771 4,954 4,533 6,991Yuba 1 0 0 0 0 0 0 0 0 0 0
Total Calculated 1,904,188 1,944,635 2,029,050 2,102,426 2,324,989 2,498,346 2,532,991 2,793,385 3,099,888 3,171,075
Total Reported 1,901,303 1,944,632 2,029,646 2,102,425 2,324,650 2,498,345 2,547,817 2,793,384 3,096,592 3,171,074
Total Calif. Agric. 21,766,419 23,697,420 24,373,778 24,947,169 26,260,004 28,048,589 26,950,521 28,647,905 29,349,616 29,801,768
Counties reporting no production: Colusa, Imperial, Tuolumne, Modoc, Mono.
Source: California Agricultural Statistics Service, Summary of County Agricultural Commissioners’ Reports, 2001, 2001.

Giannini Foundation Information Series No. 04–1
26
Table A3. Five Leading Nursery Crops for Each of the Ten California Counties Producingthe Largest Amount of Nursery and Floral Products, 2001
Gross Value of Percent Share ofNursery Product County Total
San Diego
Flowers Foliage Plants $308,854,200 36.12Nursery Woody Ornamentals 198,542,500 23.22Nursery Plants Bedding 165,465,500 19.35Flowers Cut Unspecified 71,822,000 8.40Flowers Poinsettia Potted 42,658,400 4.99
Ventura
Nursery Plants Bedding $65,119,000 29.15Nursery Woody Ornamentals 56,930,000 25.49Flowers Cut Unspecified 48,628,000 21.77Nursery Plants Potted Unspecified 16,963,000 7.59Nursery Flowering Propagative Materials 10,491,000 4.70
Orange
Nursery Woody Ornamentals $172,662,000 78.90Nursery Plants Potted Unspecified 25,197,600 11.51Nursery Flowering Propagative Materials 19,079,900 8.72Flowers Cut Unspecified 1,425,200 0.65Christmas Trees and Cut Greens 368,400 0.17
Monterey
Nursery Plants Vegetation. Bedding $57,634,000 32.38Nursery Plants Bedding 41,983,000 23.59Nursery Plants Orchid 18,296,000 10.28Flowers Foliage Plants 13,095,000 7.36Flowers Roses Cut Standard 8,260,000 4.64
Los Angeles
Nursery Woody Ornamentals $114,254,000 66.41Nursery Plants Bedding 40,692,000 23.65Nursery Products Miscellaneous 10,246,000 5.96Nursery Plants Potted Unspecified 3,534,000 2.05Flowers Foliage Plants 2,581,000 1.50
Santa Clara
Nursery Products Miscellaneous $89,848,000 55.96Nursery Plants Bedding 34,057,000 21.21Nursery Woody Ornamentals 14,698,000 9.15Flowers Roses Cut Standard 10,301,000 6.42Nursery Horticultural Specimens Misc. 5,665,000 3.53
continued on page 27

Economic Contributions of the California Nursery Industry
27
Table A3 (continued)
Gross Value of Percent Share ofNursery Product County Total
Riverside
Nursery Woody Ornamentals $94,015,800 67.94Nursery Turf 29,796,000 21.53Nursery Flowering Propagative Materials 13,109,000 9.47Flowers Cut Unspecified 1,035,100 0.75Christmas Trees and Cut Greens 415,400 0.30
San Mateo
Nursery Plants Potted Unspecified $56,154,000 41.10Flowers Foliage Plants 22,180,000 16.24Nursery Flowering Propagative Materials 22,119,000 16.19Flowers Cut Unspecified 16,761,000 12.27Nursery Plants Orchid 9,391,000 6.87
Santa Barbara
Flowers Cut Unspecified $48,269,000 38.44Nursery Plants Potted Unspecified 19,371,800 15.43Nursery Products Miscellaneous 16,979,200 13.52Flowers Chrysanthemum Unspecified 9,269,100 7.38Nursery Plants Orchid 6,855,000 5.46
Kern
Nursery Plants Rose $54,062,000 47.18Nursery Fruit/Vine/Nut Non-Bearing 38,222,000 33.35Nursery Turf 15,178,000 13.24Nursery Herbaceous Perennials 4,853,000 4.23
Nursery Woody Ornamentals 1,161,000 1.01
Source: California Agricultural Statistics Service, Summary of County Agricultural Commissioners’ Reports, 2001, 2001.

Giannini Foundation Information Series No. 04–1
28
Table A4. Population and Value of Nursery and Floral Production by County, California, 2001
Value ofNursery Product
County Population thousand dollars
Alameda 1,462,900 15,108Alpine 1,190 N/A
Amador 35,550 241
Butte 205,400 8,555
Calaveras 41,050 543
Colusa 19,150 0
Contra Costa 965,100 37,510
Del Norte 27,650 16,151
El Dorado 161,600 5,988
Fresno 813,200 32,014
Glenn 26,800 4,238
Humboldt 127,200 33,952
Imperial 148,300 0
Inyo 18,200 4,020
Kern 673,600 114,599
Kings 131,300 0
Lake 59,500 408
Lassen 34,300 9,860
Los Angeles 9,653,900 172,046
Madera 128,600 24,543
Marin 248,100 675
Mariposa 17,000 147
Mendocino 87,100 2,790
Merced 213,000 22,233
Modoc 9,400 0
Mono 12,950 0
Monterey 405,100 178,564
Napa 126,600 4,720
Nevada 93,100 334
Population data: California Department of Finance data available online at www.dof.ca.gov.Value of nursery product: California Agricultural Statistics Service, Summary of County Agricultural Commissioners’ Reports, 2001, 2001.
Value ofNursery Product
County Population thousand dollars
Orange 2,880,200 218,833
Placer 254,900 12,854
Plumas 20,850 0
Riverside 1,583,600 138,371
Sacramento 1,247,800 28,968
San Benito 54,400 25,207
San Bernardino 1,741,100 34,617
San Diego 2,859,900 855,139
San Francisco 785,700 913
San Joaquin 578,600 99,224
San Luis Obispo 249,700 91,128
San Mateo 712,400 136,613
Santa Barbara 403,200 131,419
Santa Clara 1,697,800 150,265
Santa Cruz 257,500 75,025
Shasta 166,700 8,830
Sierra 3,570 0
Siskiyou 44,650 30,789
Solano 398,600 37,668
Sonoma 464,300 30,069
Stanislaus 457,700 68,960
Sutter 80,100 9,387
Tehama 56,100 1,991
Trinity 13,000 32
Tulare 372,400 65,175
Tuolumne 55,200 0
Ventura 765,200 223,368
Yolo 171,800 6,991
Yuba 60,900 0
State 34,384,710 3,171,075

Economic Contributions of the California Nursery Industry
29
Table A5. Nursery and Floriculture Products: Number of Producers, Wholesalers, and Retailers Licensed toSell Nursery Stock in California, 2002, by County
Jobber/Cut Flowers/ Inci- Broker/ Total
Greens dental Commission Land- No. ofCounty Wholesalers Retailersa Merchants scapers Producersb Retailersc Companies
Alameda 15 84 15 13 43 129 273Amador 1 9 0 1 7 4 20Butte 6 31 6 6 38 45 107Calaveras 1 10 0 3 7 10 27Colusa 1 2 0 0 1 4 6Contra Costa 10 86 5 7 24 111 229Del Norte 0 2 0 1 11 6 21El Dorado 6 26 2 3 23 25 70Fresno 6 62 11 16 73 97 239Glenn 2 3 0 0 7 5 14Humboldt 9 13 4 2 40 30 87Imperial 0 8 1 1 10 14 34Inyo 1 3 1 0 4 7 12Kern 4 58 6 7 59 81 204Kings 0 5 0 0 2 12 22Lake 1 10 1 0 14 12 38Lassen 1 1 0 0 2 6 11Los Angeles 83 605 74 73 375 824 1,737Madera 2 9 3 4 25 15 52Marin 4 21 3 9 16 38 89Mariposa 2 4 1 0 4 4 13Mendocino 5 16 5 8 64 32 103Merced 1 10 1 0 13 20 50Modoc 0 2 0 0 3 1 4Mono 0 1 0 0 0 5 5Monterey 93 34 14 7 89 46 231Napa 8 12 9 5 23 24 69Nevada 3 17 4 3 22 17 51Orange 16 264 32 40 121 284 666Placer 14 33 13 17 41 44 125Plumas 0 5 0 1 3 5 13Riverside 12 139 28 37 207 208 564Sacramento 28 101 11 12 50 123 292San Benito 1 2 2 0 10 7 20San Bernardino 7 123 12 15 118 180 440San Diego 176 303 95 49 551 333 1207San Francisco 40 18 12 4 22 67 150San Joaquin 9 27 9 6 59 59 162San Luis Obispo 18 47 5 11 82 56 192San Mateo 30 39 8 6 54 75 187Santa Barbara 55 56 14 12 92 59 235Santa Clara 25 97 11 5 47 161 337
continued on page 30

Giannini Foundation Information Series No. 04–1
30
Table A5 (continued)
Jobber/Cut Flowers/ Inci- Broker/ Total
Greens dental Commission Land- No. ofCounty Wholesalers Retailersa Merchants scapers Producersb Retailersc CompaniesSanta Cruz 46 25 17 4 66 40 167Shasta 6 23 4 7 36 35 90Sierra 0 1 0 0 0 0 1Siskiyou 1 6 0 2 10 6 29Solano 7 36 3 4 17 36 95Sonoma 23 52 12 25 128 92 279Stanislaus 9 28 4 6 37 48 139Sutter 3 8 1 0 16 14 40Tehama 1 7 0 1 15 12 29Trinity 0 1 0 0 1 6 9Tulare 9 22 3 6 63 46 137Tuolumne 0 7 3 4 6 9 26Ventura 45 83 8 9 126 103 304Yolo 7 11 3 2 17 16 50Yuba 0 7 0 0 5 8 18State Total 853 2,715 476 454 2,999 3,756 9,821
Source: California Department of Food and Agriculture, Nurserymen and Others Licensed to Sell Nursery Stock in California, 2002 Directory.a An incidental retailer is an operator of a retail sales outlet for nursery stock that is handled incidental to other merchandise. Retailers such as Home Depot,
Wal-Mart, Lowe’s, and supermarkets are in this category.b A producer is a commercial producer that grows and sells a total of $1,000 or more of nursery stock in one year.c A retailer is an operator of a sales outlet that has no growing grounds except small areas devoted to production of plants for local distribution and those
producing less than $1,000.

Economic Contributions of the California Nursery Industry
31
Table A6. The IMPLAN System
The following brief description of IMPLAN is from Mulkey and Hodges.
IMPLAN, an acronym for Impact Analyses and Planning, was originally developed by the U.S. Forest Servicein cooperation with the Federal Emergency Management Agency and the U.S. Department of the Interior’sBureau of Land Management to assist in land and resource management planning. It is a computer softwarepackage that consists of procedures for estimating local input-output models and associated databases. Since1993, the IMPLAN system has been developed under exclusive rights by Minnesota IMPLAN Group, Inc.,which licenses and distributes the software to users, including universities, government agencies, and privatecompanies.
The economic data for IMPLAN comes from the system of national accounts for the United States based ondata collected by the U.S. Department of Commerce, the U.S. Bureau of Labor Statistics, and other federal andstate government agencies. Data are collected for 528 distinct producing industry sectors of the nationaleconomy corresponding to Standard Industrial Categories (SICs). Industry sectors are classified on the basisof the primary commodity or service produced. Corresponding data sets are also produced for each county inthe U.S., allowing analyses at the county level or for individual states. Data on the technological mix of inputsand levels of transactions between producing sectors are taken from detailed input-output tables of the na-tional economy. National and county level data are the basis for IMPLAN calculations of input-output tablesand multipliers for local areas.
The IMPLAN software package allows estimation of the multiplier effects of changes in final demand for oneindustry on all other industries within a local economic area. Multipliers may be estimated for a single county,for groups of contiguous counties, and for an entire state. The multipliers measure total changes in output,income, employment, and value added.
For a particular producing industry, multipliers estimate three components of total change within the localarea:
Direct effects represent the initial change in the industry in question.
Indirect effects are changes in interindustry transactions as supplying industries respond to increaseddemands from the directly affected industries.
Induced effects reflect changes in local spending that result from income changes in the directly andindirectly affected industry sectors.

Giannini Foundation Information Series No. 04–1
32

The University of California prohibits discrimination or harassment of any person on the basis of race, color, nationalorigin, religion, sex, gender identity, pregnancy (including childbirth and medical conditions related to pregnancy orchildbirth), physical or mental disability, medical condition (cancer-related or genetic characteristics), ancestry, maritalstatus, age, sexual orientation, citizenship, or status as a covered veteran (covered veterans are special disabled veterans,recently separated veterans, Vietnam era veterans, or any other veterans who served on active duty during a war or in acampaign or expedition for which a campaign badge has been authorized) in any of its programs or activities.University policy is intended to be consistent with the provisions of applicable state and federal laws.Inquiries regarding the University’s nondiscrimination policies may be directed to the Affirmative Action/Staff PersonnelServices Director, University of California, Agriculture and Natural Resources, 300 Lakeside Drive, 6th Floor, Oakland,CA 94612-3550, (510) 987-0096.

Giannini Foundation Information Series No. 04–1
GIANNINI FOUNDATION INFORMATION SERIES
The Giannini Foundation Information Series (ISSN 0899–3068) is designed to communicateselected research results to a lay audience. The first Information Report was issued in 1963, andreports are numbered serially within years.
The Giannini Foundation of Agricultural Economics was founded in 1930 from a grant made bythe Bancitaly Corporation to the University of California in tribute to its organizer and past president,Amadeo Peter Giannini of San Francisco. The broad mission of the foundation is to promote andsupport research and outreach activities in agricultural economics and rural development relevant toCalifornia. In line with those goals, the foundation encourages research in various areas of interest toagricultural and resource economists and supports dissemination of research findings to otherresearchers and to the public. Foundation membership includes agricultural economists (faculty andCooperative Extension specialists) at the Department of Agricultural and Resource Economics, Davis,and at the Department of Agricultural and Resource Economics, Berkeley. Associate members includeforestry economists in the College of Natural Resources, Berkeley, and economists in the Departmentof Environmental Sciences at Riverside.
This and other Giannini Foundation publications are available in PDF format online athttp://giannini.ucop.edu/publications.htm. Hard copies of this report may be ordered from Universityof California Agriculture and Natural Resources Communication Services.
.
Peter BerckGiannini Foundation Series EditorUniversity of California, Berkeley
Julian AlstonAssociate Editor
University of California, Davis
Julie McNamaraManaging Editor
University of California, Davis
Angie EricksonTechnical Editor
University of California, Berkeley
Natalie Karst Production
University of CaliforniaAgriculture and Natural Resources (ANR)
Communication Services6701 San Pablo Avenue, 2nd FloorOakland, California 94608–1239
Telephone: 800.994.8849 / 510.642.2431Fax: 510.643.5470
E-mail: [email protected]
Visit the ANR Communication Services Website at http://anrcatalog.ucdavis.edu
Visit the Giannini Foundation Web site at http://giannini.ucop.eduhttp://giannini.ucop.eduhttp://giannini.ucop.eduhttp://giannini.ucop.eduhttp://giannini.ucop.edu