Embed Size (px)
Citation preview
WSE REPORT / 1
Contracting Out Mandatory Counselling and
Training for Long-Term Unemployed
Private For-Profit or Non-Profit, or Keep it Public?
Bart Cockx
Stijn Baert
2015 nr. XX
WSE Report
Steunpunt Werk en Sociale Economie
Parkstraat 45 bus 5303 - 3000 Leuven
T:+32 (0)16 32 32 39
www.steunpuntwse.be

CONTRACTING OUT MANDATORY COUNSELLING AND TRAINING FOR LONG-TERM UNEMPLOYED
WSE REPORT / 2
Contracting Out Mandatory Counselling and
Training for Long-Term Unemployed
Private For-Profit or Non-Profit, or Keep it Public?
Bart Cockx
Stijn Baert
SHERPPA, UGent

WSE REPORT / 3
Een onderzoek in opdracht van de Vlaamse minister van Werk, Economie, Innovatie en Sport in het
kader van het Vlaams Programma Strategisch Arbeidsmarktonderzoek.

CONTRACTING OUT MANDATORY COUNSELLING AND TRAINING FOR LONG-TERM UNEMPLOYED
WSE REPORT / 4
Cockx, B., Baert, S. Contracting Out Mandatory Counselling and Training for Long-Term Unemployed.
Private For-Profit or Non-Profit, or Keep it Public? Gent: SHERPPA, Universiteit Gent. Steunpunt Werk
en Sociale Economie, 2015, 70p.
ISBN-XX
Copyright (2015) Steunpunt Werk en Sociale Economie
Parkstraat 45 bus 5303 – B-3000 Leuven
T: +32(0)16 32 32 39
www.steunpuntwse.be
Niets uit deze uitgave mag worden verveelvoudigd en/of openbaar gemaakt door middel van druk, fotokopie, microfilm of op welke andere
wijze ook, zonder voorafgaande schriftelijke toestemming van de uitgever.
No part of this report may be reproduced in any form, by mimeograph, film or any other means, without permission in writing from the
publisher.

WSE REPORT / 5
TABLE OF CONTENTS
TABLE OF CONTENTS ..................................................................................................................... 5
LIST OF TABLES ............................................................................................................................... 7
Main text tables ................................................................................................................................... 7
Appendix tables ................................................................................................................................... 7
LIST OF FIGURES ............................................................................................................................. 8
DUTCH SUMMARY ............................................................................................................................ 9
ABSTRACT....................................................................................................................................... 19
1. INTRODUCTION ........................................................................................................................... 20
2. INSTITUTIONAL SETTING .......................................................................................................... 22
2.1 The Context of the Public Tender ............................................................................................... 23
2.2 The Treatment for the Curative Group ........................................................................................ 24
2.3 The Features of the Public Tender ............................................................................................. 25
3. DATA ............................................................................................................................................ 28
3.1 Informational Content of the Data ............................................................................................... 28
3.2 Sample Selection ........................................................................................................................ 29
Sample Selectivity? ........................................................................................................................... 30
3.3 Descriptive Statistics ................................................................................................................... 31
4. EMPIRICAL STRATEGY .............................................................................................................. 34
4.1 Description of the Modelled Transition Process ......................................................................... 35
4.2 Identification ................................................................................................................................ 36
4.3 Accounting for the Sampling at Labelling.................................................................................... 37
5. RESULTS ..................................................................................................................................... 38
5.1 The Impact of the Treatments on the Transition Rates .............................................................. 38
5.2 Counterfactual Analysis Based on Simulations .......................................................................... 43
6. CONCLUSIONs ............................................................................................................................ 46
A.1 Additional Summary Statistics ............................................................................................... 49

CONTRACTING OUT MANDATORY COUNSELLING AND TRAINING FOR LONG-TERM UNEMPLOYED
WSE REPORT / 6
A.2 Econometric Model .................................................................................................................. 50
A.3 Simulation Method ................................................................................................................... 55
A.4 Complete Estimation Results .................................................................................................. 58
A.5 Goodness-of-Fit ........................................................................................................................ 66
REFERENCES .................................................................................................................................. 67

CONTRACTING OUT MANDATORY COUNSELLING AND TRAINING FOR LONG-TERM UNEMPLOYED
WSE REPORT / 7
LIST OF TABLES
Main Text Tables
Table 1: Summary Statistics of Observed Individual Characteristics and of Features of the Treatment. The Sample of Analysis ........................................................................................................................ 31
Table 2: Summary Statistics of (Un)employment Duration and Timing of Treatments (in Months) within the Sample of Analysis. .......................................................................................................... 33
Table 3: The Proportional Effects of Provider Types on the Transition Intensities ............................... 39
Table 4: Simulated Effects of the Overall Programme and of the Provider Type ................................. 44
Appendix Tables
Table A. 1: PES Office in the district in which the Unemployed is Registered at Labelling ....... 49
Table A. 2: The Complete Estimation Results.................................................................................. 58
Table A. 3: The Cumulative Fraction Leaving Unemployment ....................................................... 66
Table A. 4: The Cumulative Fraction Entering Treatment ............................................................... 66
Table A. 5: The Cumulative Fraction of Employed Returning to Unemployment ........................ 67

CONTRACTING OUT MANDATORY COUNSELLING AND TRAINING FOR LONG-TERM UNEMPLOYED
WSE REPORT / 8
LIST OF FIGURES
Figure 1: Timing of the Labelling and Treatment in the Unemployment Spell ...................................... 32
Figure 2: Representation of the sequence of competing risks models ................................................. 36
WSE REPORT / 9
DUTCH SUMMARY
Traditioneel ging de economische theorie ervan uit dat bij marktfalen de overheid in de plaats moest treden van de private sector door zelf goederen en diensten aan te bieden. Met de val van het Com-munisme en de grote budgettaire tekorten in vele OESO-landen op het einde van de jaren tachtig kwam echter een einde aan dit paradigma. De theorie van het overheidsfalen ontwikkelde zich en overheden trachtten in toenemende mate meer marktwerking en bedrijfseconomische principes te introduceren (Schleifer 1998; Sørensen 2014). In lijn van deze ontwikkelingen hebben publieke tewerkstellingsdien-sten in OESO-landen sinds het einde van de jaren negentig geleidelijk aan meer en meer diensten uitbesteed aan de private sector (Finn 2011). Het is in het kader van deze internationale tendens dat de Vlaamse Regering in 2005 voor het eerst aan de Vlaamse Dienst voor Arbeidsbemiddeling (VDAB) de opdracht gaf om in de zogenaamde “proeftuin trajecttendering” de begeleiding en opleiding van werklozen openbaar uit te besteden aan private organisaties. Dit experiment beoogde tegelijkertijd de capaciteit van de VDAB en de efficiëntie van de begeleiding en opleiding van werklozen te verhogen. In deze studie onderzoeken we in de eerst plaats deze laatste doelstelling, namelijk of private organi-saties inderdaad een meer kwaliteitsvolle dienstverlening voor minder geld konden leveren.
Volgens Hart, Schleifer en Vishny (1997) is de economische rationaliteit van het privatiseren van over-heidsdiensten fundamenteel verbonden aan de onmogelijkheid om “volledige” contracten te sluiten, dit wil zeggen contracten, die stipuleren wie bij de levering van een goed of dienst de gevolgen draagt voor onvoorziene gebeurtenissen die de kosten of baten van de levering beïnvloeden. In werkelijkheid be-paalt het contract enkel welke partij bij zulke gebeurtenissen moet instaan voor de kosten of kan genie-ten van het mogelijke “residuele voordeel”. De partij die het risico van deze onvoorziene omstandighe-den draagt, wordt er zo toe aangezet om zoveel mogelijk de kosten te drukken en de efficiëntie op te drijven. Bij privatisering of uitbesteding van een overheidsdienst verwerft de externe dienstverlener dit residueel voordeel en de hiermee verbonden stimulansen om de efficiëntie te verhogen. Indien de over-heid deze dienst echter in huis blijft aanbieden, dan kan ze dit residueel voordeel niet overdragen aan de interne dienstverlener, omdat deze in loondienst tegen een vaste vergoeding werkt. Hierdoor heeft de interne dienstverlener minder prikkels om de efficiënt te werken dan een extern privaat bedrijf.
In de mate dat het niet mogelijk is om de kwaliteit van de dienstverlening vooraf contractueel vast te leggen, bestaat er echter het gevaar dat bij privatisering de prikkel om de kosten te drukken ten koste gaat van de kwaliteit van de geleverde diensten. Dit probleem stelt zich voornamelijk indien de kwaliteit van de dienstverlening moeilijk te meten valt. Dit geldt zeker voor de dienstverlening die we in dit on-derzoek onder de loep nemen. De kwaliteit van begeleiding en opleiding van werkzoekenden hangt af van de mate waarin deze erin slaagt om de overgang te versnellen naar een duurzame en kwaliteits-volle tewerkstelling. Het is niet eenvoudig om dit vast te stellen. We kunnen immers niet eenvoudig waarnemen hoe snel een werkzoekende zulke baan gevonden zou hebben, of hoe duurzaam en kwa-liteitsvol die zou zijn indien deze werkzoekende niet aan de begeleiding of opleiding had deelgenomen. Hiervoor dienen we op een zorgvuldige wijze een controlegroep van werkzoekenden te construeren, die gemiddeld genomen dezelfde waargenomen en niet-waargenomen kenmerken heeft als de groep die de begeleiding of opleiding volgde, en vervolgens de uitkomsten van deze twee groepen met elkaar vergelijken. In dit onderzoek reiken we een methode aan om dit te doen. Het is echter duidelijk dat deze methode veel te complex is om hierop de vergoeding van de externe dienstverleners in de praktijk contractueel op te baseren. Bij de beleidsaanbevelingen komen we hierop terug en stellen we een veel eenvoudigere vergoedingsbasis voor.
WSE REPORT / 10
Niettemin kan het uitbesteden van publieke dienstverlening wenselijk blijven, zelfs wanneer we de kwa-liteit moeilijk kunnen meten (Schleifer 1998). Vooreerst, indien consumenten de kwaliteit van de dienst-verlening wel makkelijk kunnen beoordelen, dan zouden we de keuze van de dienstverlener kunnen overlaten aan de consument en dan kan de concurrentie tussen private (en publieke) dienstverleners ervoor zorgen dat de efficiëntie niet ten koste van de kwaliteit gaat. Dit is echter geen oplossing voor de uitbesteding van tewerkstellingsdiensten. Werklozen die een begeleiding of een opleiding volgen zijn immers niet beter in staat om de kwaliteit te beoordelen dan de interne dienstverlener. De volgende twee opties zijn wel mogelijke oplossingen. Wanneer de diensten herhaaldelijk over een lange periode geleverd worden en het eenvoudiger is om de kwaliteit van de dienstverlening over zulke lange periode te evalueren, dan kan de motivatie om een goede reputatie op te bouwen met het oog op de verwerving van toekomstige contracten volstaan om een goede kwaliteit te garanderen. Voor sociale dienstverle-ning is een andere oplossing mogelijk. Men zou de kwaliteit voor zulke dienstverlening kunnen garan-deren door enkel non-profitorganisaties te laten meedingen aan de uitbesteding. De werknemers van zulke organisaties zouden immers een “intrinsieke” motivatie hebben om voor zulke sociale dienstver-lening kwaliteit te leveren (Besley en Ghatak 2005; Gregg, Grout, Ratcliffe, Smith en Windmeijer 2011). Bij commerciële organisaties zou het winstmotief deze intrinsieke motivatie verdringen (Frey 1997; Kreps 1997; Frey en Jeger 2001; Bénabou en Tirole 2006; Bowles en Polanía-Reyes 2012). Zelfs indien non-profitorganisaties geen winst mogen uitkeren (Hansmann 1980), zouden ze toch nog meer prikkels hebben om kosten te drukken dan een overheidsdienst, omdat die laatste in tegenstelling tot de eersten niet failliet kan gaan en aan meer bureaucratische regelgeving onderhevig is (Stiglitz 1994).
Het unieke aan de hogervermelde proeftuin trajecttendering is dat binnen deze proeftuin de begeleiding en opleiding van werkzoekenden aan zowel commerciële als non-profitorganisaties uitbesteed werden. Dit biedt een unieke gelegenheid om de hypothese te toetsen of het winstmotief de intrinsieke motivatie om kwaliteit te leveren, verdringt. Dit is dan ook, naast de vraag of het uitbesteden van deze diensten aan de private (profit of non-profit) sector betere resultaten oplevert dan ze over te laten aan de interne publieke dienstverlener (met name de VDAB), de tweede essentiële doelstelling van dit onderzoek. Tot slot laat de studie ook toe om na te gaan of deze verplichte begeleiding en opleiding van langdurig werklozen, ongeacht de organisatie die deze diensten aanbiedt, al dan niet positieve effecten sorteert op de transitie naar werk en de duurzaamheid van deze tewerkstelling, dan wel dat ze enkel de uit-stroom naar inactiviteit bevordert in welk geval het beter zou zijn om de werklozen op eigen kracht werk te laten zoeken.
Bestaand onderzoek
Op basis van een literatuurstudie besluiten Andersson en Jordahl (2011) dat de uitbesteding van dien-sten waarvoor de kwaliteit eenvoudig te meten is (bijvoorbeeld voor vuilnisophaling) over het algemeen kosten bespaart, zonder dat dit ten koste gaat van de kwaliteit. Voor diensten waarvoor die kwaliteit moeilijker te meten valt, zoals voor gevangenissen of residentiële jeugdzorg, zijn de bevindingen echter gemengd. Voor de uitbesteding van tewerkstellingsdiensten vindt recent onderzoek zelfs geen enkel positief resultaat.i Winterhager (2006) en Bernhart en Wolff (2008) gebruikten niet-experimentele me-thoden om de effectiviteit van uitbesteding aan de private sector van tewerkstellingsdiensten voor werk-zoekenden in Duitsland te evalueren. Zij concludeerden dat private organisaties over het algemeen
i Zie Rehwald, Rosholm en Svarer (2015) voor een recent literatuuroverzicht. Dit overzicht vermeldt ook een vroeg experimenteel onderzoek van Carcagno, Cecil en Ohls (1982) dat aantoont dat het toewijzen in de V.S. van moeilijk te plaatsen bijstandstrekkers aan private dienstverleners niet kosteneffectief is. Dit overzicht verwijst daarnaast nog naar een studie in het Deens van Skipper en Sørensen (2013). Op basis van statistische matching vinden deze onderzoekers dat private plaatsingsdiensten voor werklozen lagere tewerkstellingskansen realiseren dan gemeentelijke job centra. Ondanks dat de private dienstverleners goedkoper waren, toont een kosten-batenanalyse aan dat ze minder kosten effectief waren dan de publieke.

WSE REPORT / 11
minder goede tewerkstellingsresultaten realiseerden dan de publieke tewerkstellingsdienst. Recent ex-perimenteel onderzoek, waarbij voor de vergelijkbaarheid test- en controlegroepen lukraak door het lot worden toegewezen, leidt tot gelijkaardige resultaten.ii Bennmarker, Grönqvist en Öckert en Laun en Toursie (2014) vinden in Zweden geen statistisch significant verschil tussen de uitkomsten van private en publieke dienstverlening voor, respectievelijk, werklozen en langdurig zieken. Krug en Stephan (2013) rapporteren eveneens dat in Duitsland voor de intensieve begeleiding van moeilijk te plaatsen werklozen de overheidsdienst minstens zo goed presteert als private organisaties. In heel recent on-derzoek rapporteren Rehwald, Rosholm and Svarer (2015) de bevindingen van experimenteel onder-zoek over de relatieve effectiviteit van private en publieke tewerkstellingsdiensten voor hooggeschoolde werklozen in Denemarken. Deze studie concludeert dat beide dienstverleners even goede resultaten boeken, zowel op vlak van tewerkstellingsresultaten als op dat van kosten. Tot slot, in een invloedrijk artikel tonen Behaghel, Crépon en Gurgand (2014) aan dat in Frankrijk de overheidsdienst via de be-geleiding van personen met een risico op langdurige werkloosheid de tewerkstellingskans dubbel zo-veel deed toenemen als private bedrijven waaraan deze begeleiding werd uitbesteed. De auteurs wijten deze bevindingen aan twee oorzaken. In de eerste plaats zou de lagere effectiviteit van de private sector een gevolg zijn van onvolmaaktheden in de resultaatscontracten. Deze contracten belonen pri-vate dienstverleners voor elke gerealiseerde overgang naar werk. Dit zet deze dienstverleners ertoe aan om aan werklozen met de hoogste tewerkstellingskansen weinig of geen begeleiding aan te bieden, omdat deze individuen de plaatsingsresultaten ook zonder enige ondersteuning kunnen behalen. In de literatuur noemt men dit het “parkeren” van klanten (Koning en Heinrich 2013). Een andere verklaring voor de minder goede prestaties van de private ondernemingen is hun gebrek aan ervaring.
Deze studies vermeldden meestal niet of de private dienstverlener een for-profit- dan wel een non-profitbedrijf was, en wanneer dit wel vermeld werd, dan was de meerderheid commercieel. Er bestaat slechts weinig onderzoek dat de relatieve prestaties van commerciële met die van non-profitorganisa-ties vergelijkt. Koning, Noailly en Visser (2007) vatten deze literatuur met betrekking tot sociale diensten (ziekenhuizen, kinderopvang en tewerkstellingsdiensten) samen. Zij concluderen dat de effectiviteit van de dienstverlening tussen deze organisaties niet veel van elkaar verschilt. Voor tewerkstellingsdiensten vinden ze gemengde resultaten, maar deze dienen met de nodige voorzichtigheid geïnterpreteerd, om-dat ze niet corrigeerden voor niet-waarneembare verschillen (zoals motivatie of gezondheid) in de sa-menstelling van de cliëntenpopulaties van deze twee organisatietypes.
Het voorwerp van dit onderzoek
Sinds februari 2004 versterkte de VDAB zijn “sluitende aanpak”. Het bood aan langdurige werklozen een intensieve begeleiding bij het zoeken naar werk of, zo nodig, een opleiding aan. Het betrof een groep van langdurige werklozen, die gedurende de laatste twee jaar geen begeleiding ontvangen had-den en die, mits een adequate ondersteuning, inzetbaar zouden zijn op de arbeidsmarkt. Deze zoge-naamde “curatieve groep” was tegelijkertijd vanaf juni van datzelfde jaar de doelgroep waarvoor de federale Rijksdienst voor Arbeidsvoorziening (RVA) de opvolging van hun zoekgedrag instelde. In deze opvolging nodigde de RVA langdurig werklozen op regelmatige tijdstippen uit op een gesprek waarop zij moesten aantonen dat ze wel degelijk op zoek waren naar werk en, indien ze dit niet waren, werden
ii Zulke lukrake toewijzing zorgt ervoor dat de samenstelling van de test- en controlegroep gemiddeld genomen dezelfde is. Dit heeft tot gevolg dat deze twee groepen in afwezigheid van de interventie gemiddeld genomen gelijke tewerkstellingskansen hebben. Indien er dan na de interventie een verschil in tewerkstellingskansen wordt vastgesteld, dan kan men die met vertrouwen toeschrijven aan de interventie. Niet-experimentele methoden trachten eveneens de samenstelling van test- en controlegroep gelijk te houden, maar zijn vaak complexer en/of steunen op sterkere veronderstellingen. Omwille van de eenvoud en transpa-rantie wordt experimenteel onderzoek over het algemeen betrouwbaarder geacht.
WSE REPORT / 12
gesanctioneerd (Cockx en Dejemeppe 2012). Door aan deze curatieve groep eerst een aantal tewerk-stellingsdiensten aan te bieden, beoogde de VDAB de repressieve aanpak van de RVA aan te vullen met een aanbod van begeleiding. Dit neemt niet weg dat indien de langdurige werkloze het dienstver-leningsaanbod van de VDAB weigerde, deze laatste deze weigering meldde aan de RVA, die dan een sanctie kon opleggen.
Om de capaciteit te kunnen opdrijven, lanceerde de Vlaamse overheid in 2005 de “proeftuin trajectten-dering” waarin bovengenoemde diensten uitbesteed werden aan private for-profit- en non-profitorgani-saties. Op die manier stonden deze externe organisaties tussen 1 januari 2006 en 31 december 2009 naast de VDAB in voor de begeleiding van 6.000 werklozen. In dit onderzoek evalueren we gelijktijdig de relatieve prestaties van deze drie dienstverleningstypes: publieke, private for-profit- en private non-profit.
Om een aantal statistische vertekeningen te vermijden, werd niet de volledige populatie weerhouden,iii maar de analyse beperkt tot een steekproef van 16.157 langdurige werklozen tussen de 25 en 50 jaar oud die de VDAB tussen 1 maart 2005 en 31 maart 2007 selecteerde (“labelde”) omdat ze op dat moment aan de criteria van de curatieve groep voldeden. Dat wil zeggen dat ze op dat moment (i) uitkeringsgerecht waren, (ii) minstens 21 maanden ingeschreven waren als werkzoekende en (iii) ge-durende de laatste twee jaar geen begeleiding of opleiding van de VDAB aangeboden hadden gekre-gen. Deze steekproef bestaat uit 1.981 individuen waarvoor de begeleiding werd uitbesteed aan de private sector (1.167 aan commerciële organisaties en 814 aan non-profitorganisaties), 8.840 indivi-duen waarvoor de VDAB zelf een traject aanbood en 5.336 werklozen die de werkloosheid verlaten hadden vooraleer ze een traject aangeboden kregen.
Methode
In de analyse maken we gebruik van een transitiemodel dat de overgangen beschrijft van een gelabelde werkloze naar “behandeling” (begeleiding of opleiding door de VDAB of een private dienstverlener), naar inactiviteit, naar werk en terug naar werkloosheid (enkel voor de groep die werk gevonden had). We volgen met dit model dus elke werkloze in de steekproef vanaf het moment dat zij door de VDAB gelabeld wordt tot de uitstroom naar inactiviteit, de terugstroom naar werkloosheid na het vinden van werk of het einde van de observatieperiode einde mei 2011. Middels het transitiemodel schatten we de effecten van alle mogelijke determinanten van deze transities: geobserveerde kenmerken van het indi-vidu, zoals geslacht, leeftijd en onderwijsniveau, niet-waargenomen vaste kenmerken van het individu, het werkloosheidsbureau waarbij het individu zich als werkzoekende inschreef, de maandelijkse pro-vinciale werkloosheidsgraad als tijdsveranderlijke determinant en ten slotte indicatoren die aangeven
iii We sluiten niet alleen werkzoekenden uit die in de laatste twee jaar een begeleiding of een opleiding aangeboden kregen, maar ook diegenen die dit aanbod eerder in hun werkloosheidsperiode ontvingen. Dit zorgt ervoor dat we enkel het effect meten van de dienstverlening aan de curatieve groep en niet gedeeltelijk ook het effect van een eerdere begeleiding of opleiding. Een tweede groep werd niet beschouwd omdat deze op het eerste mogelijke selectiemoment (selecties gebeurden telkens op de 15de van de maand) tijdelijk (minder dan drie maand) niet werkzoekend was. De VDAB selecteerde deze groep later, maar omdat het extreem moeilijk is om deze selectieregel econometrisch te modelleren, werd deze groep niet meegenomen in de analyse. Daar-naast werden jongeren onder de 25 jaar uitgesloten omdat deze groep minder lang werkloos moest zijn dan de oudere (15 in plaats van 21 maanden): dit zou de econometrische analyse al te zeer compliceren. Ten derde lieten we werklozen buiten be-schouwing die de RVA reeds vóór selectie negatief evalueerde omdat ze onvoldoende naar werk gezocht zouden hebben. We deden dit omdat we voor hen het effect van de begeleiding en opleiding niet zouden kunnen onderscheiden van dit van de negatieve evaluatie. Een laatste (kleinere) groep namen we niet op in de analyse omdat er variabelen ontbraken of inconsistenties vastgesteld waren.

WSE REPORT / 13
wanneer de werkloze een behandeling onderging waarbij de aard van de dienstverlener (publiek, com-mercieel of non-profit) expliciet gespecifieerd wordt. Op basis van deze geschatte effecten kunnen we dan met simulaties het effect meten van de verschillende behandelingen op gekozen uitkomsten (zoals de werkloosheids- en tewerkstellingsduur en de bestemming bij uitstroom, dat wil zeggen werk of inac-tiviteit). We doen dit door op basis van het model voor elk behandeld individu de hogergenoemde tran-sities te voorspellen, eenmaal onder veronderstelling dat het individu behandeld werd en eenmaal zon-der deze behandeling (of behandeld door een andere dienstverlener). We meten dan het effect van de respectievelijke behandelingen (publiek, commercieel of non-profit) door het verschil te nemen tussen deze voorspellingen. Om vertrouwen te krijgen in deze benadering, gaan we eerst na of het model in staat is om de werkelijk gerealiseerde overgangen te voorspellen. Dat blijkt het geval te zijn.
Resultaten
Het globale effect van trajectdeelname
We vinden dat trajectdeelname, ongeacht de aard van de dienstverlener, de werkloosheidsduur met gemiddeld 20 maanden inkort, maar deelname doet tegelijkertijd diegenen die werk vonden gemiddeld 5 maanden sneller hervallen in de werkloosheid.iv Dit zijn zeer grote effecten, maar ze moeten gezien worden in het licht van de aard van de doelgroep en van de verplichte deelname. De doelgroep zijn langdurig werklozen, die het contact met de VDAB verloren waren. Deze werklozen slagen er nog nau-welijks in om op eigen kracht een baan te vinden. Op basis van ons model vinden we dat één (vijf) jaar na de start van het begeleidingstraject slechts 8,8% (27,7%) van hen niet meer werkloos zou geweest zijn zonder begeleiding. De mediaanduur van deze groep valt buiten de waarnemingsperiode van ons onderzoek, maar op basis van extrapolaties, zou die meer dan 60 jaar (!) bedragen. Niettegenstaande de onbevattelijkheid van deze extrapolatie, geeft ze wel aan dat in verhouding hiermee een inkorting van de werkloosheidsperiode met 20 maanden gering is. In een recente meta-analyse tonen Card, Kluve and Weber (2015) trouwens aan dat (verplichte) begeleiding van het zoeken naar werk het best werkt voor achtergestelde groepen. Bovendien is het gemeten effect niet louter het gevolg van de tra-jectdeelname per se, maar ook gedeeltelijk van de verplichting om deel te nemen. Zowel de VDAB als de externe dienstverleners kunnen onwillige werklozen doorverwijzen naar de RVA die op zijn beurt een sanctie kan instellen. De (dreiging van) zulke sanctie kan ook de uitstroom uit werkloosheid be-werkstelligen. Dit is compatibel met internationaal onderzoekv en ook met onze bevinding dat ongeveer
de helft van de verhoogde uitstroom uit werkloosheid niet naar werk is, maar naar inactiviteit.vi Dit laat-ste is echter een hypothese, omdat onze data geen informatie bevatten over de mate van doorverwij-zing en sancties door de RVA.
Deelname verkort niet alleen de werkloosheidsperiode. Zij die werk vonden dankzij trajectdeelname verliezen dit werk ook 5 maanden sneller dan wanneer ze dit werk zonder deelname aan het pro-gramma (en dus volledig op eigen kracht) gevonden hadden. De kwaliteit van de job match lijdt dus
iv Als we in de tekst verwijzen naar het “gemiddelde effect”, bedoelen we in werkelijkheid het “mediaaneffect”, dat wil zeggen voor de helft van de groep die behandeld werd, is het effect kleiner en voor de andere is het effect groter. We doen dit omdat het consequente gebruik van de juiste uitdrukking de tekst onnodig zou verzwaren. v Zie Black, Smith, Berger en Noel 2003; Geerdsen 2006; Geerdsen en Holm 2007; Rosholm en Svarer 2008; van den Berg, Bergemann en Caliendo 2009 voor onderzoek naar het effect van de dreiging van verplichte deelname aan verplichte active-ringsprogramma’s en van den Berg, van der Klaauw en van Ours 2004; Abbring, van den Berg en van Ours 2005; Lalive, van Ours en Zweimüller 2005; Svarer 2011; van der Klaauw en van Ours 2013 voor onderzoek van sancties naar de uitstroom naar werk. vi Zie Manning (2009) en Petrongolo (2009) voor gelijkaardige resultaten in internationaal onderzoek.

WSE REPORT / 14
onder de verplichte deelname aan deze trajecten.vii We onderzochten welk van deze twee effecten (verkorting van de werkloosheidsduur en verkorting van het hervallen in werkloosheid) domineert. Hier-voor vergeleken we in onze simulaties het tijdsaandeel dat een deelnemer gedurende de eerste volle-dige cyclus van werkloosheid en werk tewerkgesteld was. Hieruit blijkt dat het eerste effect het tweede domineert. Het tijdsaandeel van tewerkstelling verhoogt immers met 29 procentpunten.
For-profit, non-profit, of publieke dienstverlening?
In tegenstelling tot hogervermeld internationaal onderzoek dat geen of een negatieve impact vindt van de uitbesteding van publieke tewerkstellingsdiensten aan private (commerciële of niet-commerciële) organisaties op de tewerkstellingskans, toont ons onderzoek aan dat, in vergelijking met de publieke overheidsdienst, private commerciële organisaties erin slagen om langdurig werklozen gemiddeld 1,6 maanden sneller aan werk te krijgen en om, voor diegenen die werk vonden, het hervallen in de werk-loosheid gemiddeld met 1,4 maanden te vertragen. Hierdoor verhoogt het aandeel gewerkte tijd in de eerste werkloosheids-werkcyclus met 4 procentpunten. Begeleiding of opleiding door private commer-ciële organisaties verhoogt ook de kans om inactief te worden, maar dit effect is niet significant op het 5%-significantieniveau.
We vinden ook dat commerciële organisaties iets beter presteren dan non-profitorganisaties, maar het verschil is steeds kleiner dan dat met de overheidsdienst en nooit statistisch significant verschillend van nul: gemiddeld vinden cliënten van commerciële organisaties 0,8 maanden sneller werk dan cliënten van non-profitorganisaties en blijven ze 2,0 maanden langer aan het werk. Samen verhoogt dit het aandeel van de tewerkgestelde tijd met 3 procentpunten. Dit laatste effect nadert statistische signifi-cantie op het 5%-niveau. De uitstroom naar inactiviteit verschilt niet tussen commerciële en non-profit-organisaties.
Zelfs al verschillen de besproken effecten niet erg veel tussen beide private dienstverleners, dan nog mogen we stellen dat commerciële organisaties meer waar voor geld leverden, aangezien hun een-heidsprijs (zonder Btw) gemiddeld 5,9% lager was dan deze van de VDAB en 11,6% lager dan die van de non-profitorganisaties. Dit prijsverschil is nog groter indien we er rekening mee houden dat de wer-kelijke betaling gelinkt was aan de gerealiseerde prestaties in termen van plaatsingskans in de 6de, 7de en 8ste maand na de beëindiging van het traject. Omdat het merendeel van de externe organisaties de vooropgestelde norm niet hebben gehaaldviii is de effectief uitbetaalde eenheidsprijs per traject lager dan de voornoemde, die enkel zou uitbetaald worden indien de norm gehaald was. Op basis van deze prijs waren commerciële organisaties zelfs gemiddeld 11,2% en 14,4% goedkoper, respectievelijk dan de VDAB en de non-profit organisaties. Deze cijfers betekenen tegelijk dat non-profitorganisaties duur-der waren zonder dat ze significant beter presteerden dan de VDAB. Voor hen valt de vergelijking dus het minst gunstig uit.
Bij de prijsvergelijking tussen de private dienstverleners en de VDAB is echter enige voorzichtigheid geboden. We gebruiken als eenheidsprijs voor de dienstverlening van de VDAB deze die ze in de aan-besteding werd gerapporteerd. Deze prijs is een schatting van de kosten op basis van ongeveer 5.000 vergelijkbare curatieve trajecten die in 2003 en 2004 werden beëindigd. De werkelijke kosten kunnen
vii Dit is in overeenstemming met het onderzoek van Petrongolo 2009; Arni, Lalive en Van Ours 2013; van den Berg en Vikström 2014. viii Noteer dat het niet is omdat een organisatie de beoogde plaatsingskans niet behaalt, dat ze geen positief netto-effect op tewerkstelling kan realiseren. We stellen in dit onderzoek inderdaad vast dat commerciële organisaties efficiënter zijn dan de andere, ondanks ze de norm niet halen.

WSE REPORT / 15
hiervan afwijken. Deze kostenraming was evenwel de beste die de VDAB ons kon bezorgen. Onze conclusie dat de commerciële organisaties efficiënter waren dan de VDAB blijft dus enkel overeind in de mate dat de werkelijke kost niet veel (minstens 11,2%) lager was dan de gerapporteerde. Dit heeft echter geen enkele invloed op onze conclusie dat for-profitorganisaties efficiënter waren dan non-pro-fitorganisaties.
Verklaringen
Hoe kunnen we verklaren dat commerciële organisaties het beter doen dan private en publieke non-profitorganisaties? Dit lijkt niet de stroken met hogervermeld bestaand onderzoek. Hierin vond men dat de publieke tewerkstellingsdienst het nooit slechter en in één onderzoek zelfs significant beter deed dan private organisaties waaraan de dienstverlening werd uitbesteed. In dat onderzoek kon men even-wel het onderscheid tussen private commerciële en non-profitorganisaties niet maken. In ander, meer algemeen onderzoek, werd echter aangetoond dat non-profitorganisaties voor dienstverlening met so-ciale doelen meer aandacht besteden aan kwaliteit dan commerciële organisaties: de commerciële doelstelling om winst te maken verdringt de sociale doelstelling. Het verschaffen van begeleiding en opleiding voor langdurige werklozen die al minstens twee jaar werden uitgesloten van enige ondersteu-ning heeft ongetwijfeld een sociaal doel. Waarom presteren commerciële organisaties in de proeftuin trajecttendering dan toch beter dan de non-profitorganisaties?ix
Een eerste mogelijke verklaring is te vinden in ander recent internationaal onderzoek. Op basis van experimentele analyses concluderen Ashraf, Bandiera en Kelsey (2014) en Ashraf, Bandiera en Lee (2015) dat, zelfs wanneer een (profit- of non-profit) organisatie een sociale doelstelling nastreeft, zoals het leveren van begeleiding en opleiding voor langdurige werklozen, materiële stimulansen (i) werkne-mers en hun managers kunnen motiveren om beter te presteren en (ii) het mogelijk maken om meer getalenteerde werknemers aan te trekken die ook goed presteren in de sociale dimensie waarvoor ze geen specifieke stimulansen ontvangen. Dit betekent dat de winstdoelstelling niet hoeft in strijd te zijn met de sociale doelstelling, maar dat ze elkaar kunnen aanvullen.x Een tweede verklaring is dat de commerciële organisaties er meer belang bij hebben om een goede reputatie op te bouwen. In tegen-stelling tot de non-profitorganisaties, die al jaren samenwerkten met de VDAB, waren de commerciële organisaties immers nieuwe deelnemers in de markt. De onderzochte openbare aanbesteding was aangekondigd als de eerste in een reeks, zodat de commerciële organisaties er konden vanuit gaan dat, indien ze goed zouden presteren in deze eerste aanbesteding, ze meer kansen zouden krijgen om in de volgende weerhouden te worden. Ten derde, de commerciële organisaties waren allemaal groter dan de non-profitorganisaties. Dit betekende dat ze meer van schaalvoordelen konden genieten. Com-merciële organisaties maakten daarenboven ook gebruik van een goedkopere begeleidingstechnolo-gie. Veel meer dan non-profitorganisaties boden ze begeleiding aan in groep. Deze technologie was blijkbaar tegelijk efficiënter dan de individuele begeleiding die non-profitorganisaties aanboden.
In de hogervermelde Franse studie was misbruik van de resultaatsfinanciering een belangrijke verkla-ring voor de minder goede prestaties van de private sector in vergelijking met die van de overheids-dienst: de cliënten die op eigen kracht werk konden vinden, werden geparkeerd, dit wil zeggen dat de
ix For-profitorganisaties presteren beter, zoals eerder vermeld, niet omdat ze significant betere resultaten leveren, maar omdat ze deze resultaten leveren aan een lagere kostprijs.
x We veronderstellen hier impliciet dat de sociale doelstelling erin bestaat om een zo kwaliteitsvol mogelijke tewerkstelling voor trajectdeelnemers te realiseren. Deze sociale doelstelling wordt echter mogelijk anders ingevuld. Zo zou het doel van de dienst-verlener eerder, breder dan tewerkstelling, een verhoging van de “levenskwaliteit” van de deelnemers kunnen behelzen. De beschikbare data laten ons echter niet toe om deze hypothese te toetsen.

WSE REPORT / 16
dienstverlening voor deze groep minimaal werd gehouden, zodat meer dienstverlening op de zwakkere cliënten kon ingezet worden. Omdat de begeleiding voor zwakkere cliënten minder opleverde dan voor de eerstgenoemde groep, en omdat de overheidsdienst de betere cliënten niet parkeerde, kon de over-heidsdienst er betere resultaten voorleggen dan de private sector. Zelfs indien in de Vlaamse uitbeste-ding de financiering minder resultaatsgericht was dan de bestudeerde aanbestedingen in het buiten-land,xi suggereert onze analyse dat ook in Vlaanderen de private commerciële en non-profitorganisaties hun beste cliënten parkeerden.xii Het verschil is evenwel dat in Vlaanderen dit opportunistisch gedrag van de private dienstverleners geen negatieve impact gehad heeft op de effectiviteit van hun dienstver-lening. Integendeel, aangezien de begeleiding en opleiding van de minst inzetbare langdurig werklozen de uitstroomkans naar werk het meest verhoogde, heeft dit gedrag de effectiviteit van de private dienst-verlening eerder versterkt.
Beleidsimplicaties
We vonden we dat het begeleiden van werklozen globaal, ongeacht de organisatie die deze begeleiding voor haar rekening nam, de uitstroom naar werk substantieel kan verhogen. Tegelijkertijd lijkt de inter-ventie echter te leiden naar substantieel minder duurzame jobs. Het eerste effect domineert echter het tweede, zodat de trajectdeelnemer gemiddeld meer tijd in tewerkstelling doorbrengt dan in het geval hij of zij niet had deelgenomen. De trajectdeelname was nochtans niet onverdeeld succesvol. De helft van de overgangen die uit trajectdeelname resulteerden ging immers naar inactiviteit in de plaats van naar werk. Dit komt wellicht omdat deelname de kans op doorverwijzing naar en sanctionering door de RVA verhoogt. Het succes van deze interventie hangt dus af van het relatieve gewicht dat men geeft aan de verhoogde kansen op tewerkstelling enerzijds en inactiviteit anderzijds. Dit is een normatieve keuze die de beleidsvoerder moet maken. Om een juiste afweging te maken kan het belangrijk zijn te weten welke inactieve arbeidstoestand trajectdeelname juist bevordert. Bijvoorbeeld, gaat het om ziekte of invalidi-teit, of om een andere vorm van inactiviteit? Het was echter niet mogelijk om de aard van inactiviteit in het onderzoek te bepalen.
De voornaamste doelstelling van de studie bestond in een vergelijking van de prestaties van drie ver-schillende soorten dienstverleners: private for-profit of non-profit, dan wel publieke. We vonden dat private for-profit- en non-profitorganisaties niet zo zeer verschilden in de resultaten die ze realiseerden, dan wel in de eenheidsprijs waartegen ze de dienstverlening leverden. Aangezien commerciële orga-nisaties in de proeftuin trajecttendering voor het eerst hun diensten aanboden voor de begeleiding van werklozen, terwijl non-profitorganisaties daarin al heel wat ervaring hadden opgebouwd, hadden non-profitorganisaties in het gunningscriterium “deskundigheid en ervaring” een niet te overbruggen voor-deel in vergelijking met commerciële organisaties. Het bieden van een zo laag mogelijke prijs was daarom voor commerciële organisaties een noodzakelijke strategie om de tender te winnen. Omdat, in tegenstelling tot non-profitorganisaties, commerciële organisaties niet van de Btw-heffing van 21% wer-den vrijgesteld, was deze prijszettingsstrategie des te belangrijker. Niettemin kan de differentiële Btw-
xi Slechts 30% van de eenheidsprijs was resultaatsgebonden, terwijl dit aandeel in de hogervermelde evaluaties van buitenlandse uitbestedingen varieerde tussen 55% en 100%.
xii In de onderzochte openbare aanbesteding wees de VDAB cliënten toe aan de private dienstverleners. Bijgevolg, zelfs al vinden we dat de cliënten van de commerciële organisaties gemakkelijker inzetbaar waren op de arbeidsmarkt dan die van non-profitorganisaties, en dat die laatsten op hun beurt gemakkelijker inzetbaar waren dan die van de VDAB, kunnen we deze “afro-ming” van de betere cliënten niet zien als bewust opportunistisch gedrag vanwege de private dienstverleners om op die wijze gemakkelijker aan de resultaatsverbintenis te kunnen voldoen en hun vergoeding te maximaliseren. De private dienstverleners konden immers niet zelf hun cliënten uitkiezen.

WSE REPORT / 17
heffing geen rol hebben gespeeld in deze prijszettingsstrategie, aangezien er slechts bij de gunnings-beslissing gecommuniceerd is dat de geboden prijzen inclusief Btw zouden worden vergeleken. Naar-mate commerciële organisaties erin slagen om een goede reputatie op te bouwen, zal de concurrentie non-profitorganisaties ertoe aansporen om lagere prijzen te zetten of de kwaliteit van de dienstverlening te verbeteren (in de mate dat de vergoeding of de gunningscriteria dit voldoende in rekening kunnen brengen). De differentiële Btw-heffing blijft echter een belangrijke bron van concurrentievervalsing. Voor een goede marktwerking is de opheffing van deze verschillende behandeling cruciaal. Maar dit volstaat niet. Een goede marktwerking vereist eveneens dat de prestatievergoeding op correcte wijze rekening houdt met de kwaliteit van de dienstverlening.
In dit onderzoek meten we de kwaliteit van de dienstverlening door de werkelijke effectiviteit van de dienstverlener. Met werkelijke effectiviteit bedoelen we de mate waarin de dienstverlener een bepaalde uitkomst (bijvoorbeeld plaatsing in werk) heeft bewerkstelligd die er zonder zijn tussenkomst niet zou geweest zijn. Dit contrasteert met het onjuiste criterium waarbij de gerealiseerde uitkomst na interventie (zoals bijvoorbeeld de “plaatsingskans” in de hier onderzochte “proeftuin trajecttendering”) niet verge-leken wordt. Het komt er niet op aan om te meten hoe hoog de tewerkstellingskans van een trajectdeel-nemer is, maar wel in welke mate dat deelname deze kans verhoogt. In termen van plaatsingskans presteerden de commerciële organisaties minder goed dan non-profitorganisaties. Omdat de “proef-tuintrajectendering” de plaatsingskans als basis gebruikte voor de prestatievergoeding, ontvingen com-merciële dienstverleners bijgevolg niet de beloning naar hun werkelijke prestatie. In de latere aanbe-stedingen heeft de VDAB dit criterium wel verbeterd door het te koppelen aan de tewerkstellingskans, zodat uitstroom naar inactiviteit niet meer beloond wordt. Maar dit lost het probleem niet ten gronde op. De werkelijke effectiviteit wordt immers gemeten door het verschil tussen de gerealiseerde tewerkstel-lingskans van de cliënten en de tewerkstellingskans die zou gerealiseerd zijn indien de cliënt geen begeleiding of opleiding had gekregen (of, wanneer we de relatieve effectiviteit willen meten, indien ze die had gekregen van een andere dienstverlener). Aangezien er geen enkele garantie bestaat dat de werkelijke effectiviteit positief gecorreleerd is met het plaatsingscriterium, is er op dit ogenblik geen enkele garantie dat de meest effectieve organisaties beloond worden.
Het is niet evident een globale oplossing te vinden voor laatstgenoemde probleem. In de literatuur (bijvoorbeeld Besley en Ghatak 2005; Bénabou en Tirole 2006) stelt men voor om, in situaties waarin de kwaliteit van de dienstverlening moeilijk te meten is, de uitbesteding aan non-profitorganisaties voor te behouden. Werknemers van zulke organisaties zouden immers een “intrinsieke motivatie” hebben om een kwaliteitsvolle dienstverlening te leveren. Deze studie toont aan dat deze oplossing in de be-studeerde situatie niet werkt. Niettemin zijn verbeteringen denkbaar. Een mogelijkheid bestaat erin om de betaling te laten afhangen van de relatieve prestatie van dienstverleners in een subregio. Indien de VDAB de cliënten in elke regio lukraak aan minstens twee verschillende dienstverleners toewijst, dan zorgt dit ervoor dat het verschil in de gemiddelde uitkomsten van deze dienstverleners (bijvoorbeeld de kans op een duurzame tewerkstelling een vast aantal maanden na de toewijzing van de cliënten) de werkelijke relatieve effectiviteit meet. De lukrake toewijzing is hiervoor cruciaal, aangezien anders het verschil in uitkomsten gedeeltelijk verklaard kan worden door de verschillende samenstelling van de cliëntenpopulaties tussen deze dienstverleners in dezelfde subregio: het zorgt ervoor dat zonder de begeleiding en opleiding deze cliëntenpopulaties geen statistisch verschillende kans zouden hebben om werk te vinden. Het is ook cruciaal om deze vergelijking enkel te maken tussen verschillende dienst-verleners die in dezelfde sub-regio opereren. Dit zorgt ervoor dat de verschillen in prestatie geen ver-schillen in arbeidsmarktomstandigheden reflecteren.
Kunnen we nu concluderen dat het verantwoord is om tewerkstellingsdiensten verder uit te besteden aan de private sector? In deze studie vonden we weliswaar dat commerciële organisaties meer waar voor minder geld konden leveren, maar de prestatieverbetering was beperkt en de kostprijsvergelijking

WSE REPORT / 18
is mogelijk vertekend (naar boven of naar beneden), omdat de kostprijs van de dienstverlening door de VDAB gebaseerd is op een schatting en niet op de werkelijke kostprijs. Indien we er rekening mee houden dat non-profitorganisaties duurder waren zonder dat hun prestaties significant afweken van deze van de andere dienstverleners, dan is het daarom lang niet zeker of de openbare aanbesteding globaal meer waar voor geld leverde. Immers, als de organisatiekosten van de aanbestedingen in re-kening gebracht worden, is het sop de kool mogelijk niet waard. Deze organisatiekosten verhogen de kostprijs met 14%.xiii De VDAB betaalde aan de externe partners ongeveer 5% minder dan de ge-
raamde kostprijs van hun dienstverlening in huis,xiv terwijl ze gezamenlijk (profit en non-profit) maar een beetje beter presteerden. Het is bovendien niet raadzaam om op basis van één enkel onderzoek algemene conclusies te trekken. Wetenschappers doen dit enkel indien wetenschappelijke studies de-zelfde resultaten herhaaldelijk repliceren. Internationaal onderzoek toont aan dit het positieve resultaat dat we hier voor de private for-profit dienstverleners vonden een uitzondering is op de bevindingen van andere onderzoekers. Niettemin hopen we dat onze resultaten onderzoekers zal aansporen om na te gaan of ze kunnen worden bevestigd en om te onderzoeken welke factoren aan de betere prestaties van commerciële dienstverleners ten grondslag liggen. Een beter inzicht in de rol van het prestatiever-goedingssysteem verdient hierin een bijzondere aandacht. We hopen dat de verantwoordelijke overhe-den onderzoekers financieel zullen ondersteunen om zulk onderzoek, liefst experimenteel omwille van de grotere betrouwbaarheid, te realiseren. Enkel op die manier kunnen we inzicht verwerven in welk beleid werkt.
xiii De totale kostprijs van de curatieve tender was 20.231.217€, waarvan 17.807.071€ aan de externe partners werd uitbetaald (Tabel 106, Devisscher et al. 2009, p.232). (20.231.217/17.807.071-1)*100 = 14%. xiv De gemiddelde effectief betaalde eenheidsprijs voor de externe dienstverleners bedroeg 2.606,41€. Dit is 5% lager dan de geraamde kostprijs van de VDAB: (1-2.606,41/2.757,50)*100=5%.

WSE REPORT / 19
ABSTRACT
This study evaluates the effectiveness of contracting out mandatory publicly provided counselling and training for long-term unemployed in Flanders (Belgium) to private for-profit and non-profit organisations (FPOs and NPOs). A multivariate transition model exploits timing-of-events and novel exclusion restrictions to account for selection on unobservables. Overall, the intervention was highly effective in reducing unemployment duration, but also spurred employment instability and withdrawals from the labour force. FPOs slightly, but significantly enhanced exits to employment without reinforcing recidivism relative to the public provider but not significantly relative to NPOs. FPOs also charged lower prices and hence were the best performing providers.

WSE REPORT / 20
1. INTRODUCTION
Traditionally, economic theory justified public provision of goods and services in case of market failure. To account for monopoly power, externalities and other market failures, this has led to the nationalisa-tion of private firms, such as in the sectors of insurance, mining and telecommunications. However, since the early 1980s, the large budget deficits in many OECD countries and the fall of Communism have led to an end of this paradigm. Public production is increasingly privatised, and a theory of gov-ernment failures has subsequently begun to develop. According to this theory, the conditions under which state provision is superior to private provision are highly limited (Schleifer 1998). It is in this con-text that governments increasingly attempted to transfer methods of private business management to the public sector and started to outsource public services through competitive tenders to the private sector (Sørensen 2014). Since the late 1990s, this privatisation effort also led to a growing tendency to outsource public employment services for job seekers (Finn 2011). In this study, our key objectives are to discover whether (i) outsourcing of these services to the private sector enhances performance rela-tive to in-house public provision, and (ii) whether private non-profit organisations (NPOs) are more effi-cient in this delivery than private for-profit organisations (FPOs).
Contractual incompleteness procures a strong case for privatisation. If not all contingencies with regards the provision of a good or a service can be stipulated in a contract, the costs and benefits of these contingencies accrue to the residual claimant (Grossman and Hart 1986; Hart and Moore 1990). In case of contracting out to an FPO, contractual incompleteness provides strong incentives to invest in cost reductions. By contrast, a public manager receives no returns to these investments; hence, the stimulus for such efficiency enhancing activities is considerably weaker. However, if quality is difficult to measure, or renegotiation is not possible, e.g., if rewards are ex ante fixed in performance contracts, these incen-tives may induce private overinvestment in cost saving technologies, leading to sub-standard quality (Hart, Schleifer and Vishny 1997). Nevertheless, even then public in-house production need not out-perform private provision (Schleifer 1998). First, if consumers are capable to assess quality, then com-petition between private providers could restore efficiency. Second, in case that goods and services are to be delivered repeatedly, and quality can be evaluated over a longer-term period, then reputation building with the aim of attracting future contracts may be sufficient to curb these adverse incentives. Third, in case of the provision of pro-social services, there may be NPOs in the market with an “intrinsic” motivation or a “mission” to deliver high quality (e.g., Besley and Ghatak 2005; Gregg, Grout, Ratcliffe, Smith and Windmeijer 2011). The presence of a profit motive would crowd out such pro-social motiva-tion (e.g., Frey 1997; Kreps 1997; Frey and Jegen 2001; Bénabou and Tirole 2006; Bowles and Polanía-Reyes 2012), implying that one may prefer to outsource to NPOs services for which it is difficult to assess quality. NPOs could still outperform public sector delivery, because even if they may not distrib-ute the residual returns (Hansmann 1980), they still have more incentives to reduce costs than a gov-ernment agency that cannot go bankrupt and is restricted by bureaucratic rules (Stiglitz 1994).
We evaluate the effectiveness of mandatory intensive counselling and training of long-term unemployed that the Public Employment Services (PES) in Flanders (Belgium) partly contracted out to private en-terprises, both to FPOs and to NPOs. The simultaneous delivery of such services by public, private for-profit and non-profit organisations provides a unique opportunity for testing theories about the relative efficiency of outsourcing of services traditionally provided for by the public sector. The quality of coun-selling services is difficult to measure because it depends on the value added in terms of employability and job quality (as measured, e.g., by the duration of the employment relationship or the associated wage) relative to an unobservable counterfactual of no provision or of the provision of these services
WSE REPORT / 21
by another organisation type. Such counterfactuals are difficult to measure because they typically de-pend partly on unobservable traits of the unemployed. Because consumers of counselling services have notably little informational advantage in gauging the quality of these services relative to external ob-servers, competition between private providers cannot therefore refrain from overinvestment in cost saving technologies. Nevertheless, because the public procurement of these employment services was a pilot project, announced to be followed by the tendering of similar services in the future, FPOs had incentives to deliver quality through reputation building. In addition, because counselling was targeted at the long-term unemployed to whom the PES did not offer any intensive employment service in the preceding two years, a pro-social mission is associated to the provision of these services, providing a case for the delivery of these services by NPOs.
Empirical studies confirm that the effectiveness of outsourcing is indeed in general closely linked to the ease by which the quality of the service provision can be measured. In their survey study, Andersson and Jordahl (2011) conclude that the outsourcing of easily contractible services (such as garbage col-lection) generally reduces costs without hurting quality. By contrast, for services that are more difficult to contract out (such as prisons and residential youth care), the evidence is more mixed. However, for employment services the evidence is more clear-cut.1 None of the available studies finds that outsourc-ing of employment services to the private sector enhances overall performance. Winterhager (2006) and Bernhart and Wolff (2008) employed propensity score matching methods to evaluate the effective-ness of outsourcing to the private sector of placement services for job seekers in Germany. They found that the private agencies were generally less effective than the PES. Recently, a number of researchers have conducted randomised trials to evaluate the effectiveness of contracting out employment services to the private sector. Bennmarker, Grönqvist and Öckert (2013) and Laun and Skogman Thoursie (2014) study the effectiveness of the contracting out of employment services to the unemployed and of the vocational rehabilitation for individuals on long-term sickness absence in Sweden relative to in-house production by the public sector. Overall, they do not find a differential effect of these service providers. Similarly, Krug and Stephan (2013) report that the public provision of intensive placement services to the hard-to-place unemployed in Germany are at least as effective as those of private pro-viders. Very recently, Rehwald, Rosholm and Svarer (2015) reported the results of a randomized ex-periment conducted to determine the relative effectiveness of private and public providers of employ-ment services for unemployed university graduates in Denmark. They conclude that private and public providers realized similar labour market outcomes at comparable costs. Finally, in an influential study, Behaghel, Crépon and Gurgand (2014) document that the public provision of counselling services to individuals at risk of long-term unemployment in France generates twice as large effects on the proba-bility of finding employment than in the private provision. The authors attribute this lower performance of private providers partly to contractual incompleteness, especially in the form of “parking” of the most employable job seekers, i.e., by serving more employable job seekers less intensively than other (Kon-
ing and Heinrich 2013).2 However, another part of the lower achievement was caused by the lack of experience of these private providers relative to the PES.
1 See Rehwald, Rosholm and Svarer (2015) for a recent review of the literature. This review also mentions an early experimental study of Carcagno, Cecil and Ohls (1982) that shows that the use of private contractors for hard-to-place welfare recipients in the U.S. is not cost effective. In addition, it summarizes a Danish study of Skipper and Sørensen (2013). Based on statistical matching methods these researchers find that other actors (principally private firms) realize a lower employment rate six months after assignment than municipal job centres for placement services provided to unemployed workers. A cost-benefit analysis revealed that the lower cost of service provision by other providers could not compensate for this lower performance.
2 By contrast, the authors do not find much evidence of “cream-skimming” or “cherry picking”, which consists in selecting the most employable job seekers.
WSE REPORT / 22
In the aforementioned studies evaluating the effectiveness of the contracting out of employment ser-vices, either no mention was made of whether the private provider had a profit motive, or the majority were FPOs.3 Evidence on the performance of NPOs relative to FPOs is therefore sparse. Koning, Noailly and Visser (2007), reviewing this literature with regards to social services (hospitals, childcare and employment services), conclude that the performance of NPOs does not clearly differ from FPOs. The three studies focusing on employment services report mixed evidence, but Koning et al. alert the reader that these results should be interpreted cautiously because even if many conditioning variables are employed to control for the observed differences in the client composition between the two types of organisations, clients could still differ in unobservable characteristics, such as motivation and health. Heinrich (2000) finds no differential selection or placement rate between service providers under the U.S. Job training Partnership Act of 1982 (JPTA). By contrast, Stoll, Melendez and de Montrichard (2003), studying training provision under the Workforce Investment Act (WIA) in the U.S., and Koning (2008), evaluating the relative effectiveness of training providers to welfare recipients in the Nether-lands, conclude that FPOs “cherry pick” the best clients. These authors find some evidence that FPOs realise lower (long-run) placement rates than NPOs.
We contribute to this literature in the following ways. To the best of our knowledge, we are the first to evaluate simultaneously the relative performance of the three types of providers of employment ser-vices: public, private for-profit and private non-profit. Second, we not only study the effects on the job finding rate and the probability of withdrawal from the labour force in a competing risks framework but also examine the effect on the employment stability. Third, in our analysis, we explicitly consider unob-served differences in the client composition of the three service providers. To this end, we base our analysis on the “timing-of-events” method (Abbring and Van den Berg 2003). This method exploits that the timing of treatment by one of the three providers is partly random, and not anticipated. If the transi-tion intensities to the various labour market and treatment states are of the mixed proportional form (MPH), the treatment effects can be identified. However, in our timing-of-events model, identification does not crucially hinge on the MPH assumption. The way in which the programme is implemented delivers a number of novel exclusion restrictions that help identifying the causal treatment effects.
The remainder of this paper is organised as follows. In Section 2, we describe the institutional setting, and in Section 3, we present the data employed in the empirical analysis. Section 4 presents the em-pirical strategy. Section 5 reports the empirical findings, and Section 6 the conclusions.
2. INSTITUTIONAL SETTING
In Belgium, a worker is entitled to Unemployment Insurance (UI) in two instances: (i) after graduation from school conditional on a waiting period of nine months;4 (ii) after involuntary dismissal in case of a minimum contribution record to qualify. In contrast to many other countries, there is no time limit on the
3 Laun and Skogman Thoursie (2014) mention in footnote 7: “Since almost 90 per cent of the participants received rehabilitation by a for-profit actor, profit maximisation seems like a valid benchmark for the private providers under study.” Behaghel, Crépon and Gurgand (2014, p. 146) report that the private providers are one of the following: temporary agencies, specialised consultan-cies or international placement firms. This suggests that these providers are FPOs.
4 Since January 2012, this waiting period has been increased to 12 months.

WSE REPORT / 23
payment of Unemployment Benefits (UB).5 School-leavers are entitled to flat rate benefits while dis-missed workers earn a gross replacement rate ranging between 40% and 60% of past earnings, which is bracketed by a floor and a cap. The benefit level depends on the household type (head of household, cohabitant or single) and on unemployment duration for dismissed singles and cohabitants.
UI is organised at the federal level, while the PES are decentralised to the three Regions: Flanders, Wallonia and Brussels. UI pays out the unemployment benefits, verifies compliance to the eligibility requirements and issues sanctions in case of non-compliance. The PES organise counselling, job search assistance, intermediation services and training of unemployed and employed workers. The Regional PES transmit information to the federal UI with respect to the requirement to be “available for the labour market”, i.e., registration as a job searcher, turning down a suitable job offer or refusing job search assistance. In the sequel, we will focus our discussion on the functioning of the PES in Flanders because our analysis is restricted to this region.
2.1 The Context of the Public Tender
The PES traditionally provided its services in-house. To increase capacity, since 1992, the PES started outsourcing specific services, such as counselling and training, to private NPOs. The interest of policy makers in the growing contracting out of these services in countries, such as Australia, the Netherlands, Sweden and the United Kingdom, made the contracting out of employment services to the private sector one of the policy objectives of the Flemish government at its formation in 2004. This led to the launch in 2005 of a first call for tenders to procure these services to the private sector.6 This first public tender is the one that we evaluate in this study. It procured the provision of employment services to the long-term unemployed to whom the PES did not propose any employment services in the preceding two years, the so called curative group. The interest in this target group must be observed within the context of an important reform of UI in 2004. By this reform, the federal government introduced in UI the moni-toring of job search effort of the long-term unemployed benefit recipients combined with sanctions in case of non-compliance (Cockx, Defourny, Dejemeppe and Van der Linden 2007; Cockx, Dejemeppe, Launov and Van der Linden 2011; Cockx and Dejemeppe 2012). This introduction of more coercion was heavily debated in the press and by pressure groups. To accommodate the concerns of critics and to align with the European guidelines for employment that all unemployed should be counselled or activated as soon as possible, the federal government decided to stimulate by means of subsidies, among other, the supply of the regional employment services. The Flemish government determined that its PES would primarily allocate this subsidy to placement and training services for the aforemen-tioned curative group, which the mentioned monitoring scheme would subsequently target. As such, the regional government aimed at providing opportunities to this target group to comply with the new federally imposed job search requirements and hence, to avoid sanctions. Initially, from 2004 until 2006, the regional PES delivered these services only in-house, but to enhance capacity, subsequently (until 2008), it contracted out, by means of the aforementioned public call for tenders, part of these services to private providers.
5 Since January 2012, a time limit of three years has been imposed on some categories entitled to UI after graduation.
6 A detailed description of this tendering process and its outcome can be found in Devisscher, Sanders and Van Pelt (2009).

WSE REPORT / 24
2.2 The Treatment for the Curative Group
Irrespectively of whether the employment services to the curative group were provided in-house or externally, their allocation and implementation occurred according to the following stages.
(i) Labelling
Starting in February 2004, on the 15th of each month, the computer system of the central administration of the PES identified and labelled all individuals belonging to the curative group, i.e., individuals who (a) were UI recipient at that moment, (b) registered in the PES as a job seeker for at least 15 or 21 months, for those younger, or older than 25, respectively, and (c) were not offered any counselling or training in the past two years. In the first year, the labelling was restricted to individuals younger than 30. From March 2005 onwards, those aged between 30 and 40 were included in the target group. Finally, starting in January 2006, individuals aged between 40 and 50 have also been considered. Job seekers older than 50 have never participated in the programme. The last labels were set in December 2007. In February 2004, March 2005 and January 2006, many more individuals were labelled than in the other months. This is because at those dates eligible individuals comprised the stock of job seekers who had been unemployed for more than 15 or 21 months on those dates, while in the other (subse-quent) months only those flowing into the 21st month of unemployment were labelled.7 We will incorpo-rate individuals in the stock in the empirical analysis and argue in Section 4.2 that these individuals will provide a valuable additional source for the identification of the treatment effects.
(ii) Orientation and “qualifying intake”
The list of labelled individuals was sent to the 13 local offices of the PES. These offices subsequently invited the job seekers to a sequence of partly collective (groups of approximately 10 individuals) and partly individual meetings and training sessions. This orientation stage was usually organised during five full days. Participants were informed about the available services offered by the PES and the em-ployment perspectives and supported in improving work attitudes and in identifying realistic job targets given their acquired competencies. At the end of this orientation stage, a “qualifying intake” took place. At this intake, the job seeker met a caseworker to evaluate whether and, if so, which additional training was required for the identified job targets, and a theoretical pathway to the identified job targets was drawn up. Note that not all members of the curative target group were invited to participate in the ori-entation stage,8 but all of them were invited to the qualifying intake meeting.
(iii) Assignment to the provider (internal or exter nal)
Shortly after the orientation stage, the job seeker was assigned to the treatment, offered either in-house or, from January 2006 onwards, by an external provider to which the placement services were tendered. The external providers could not refuse any assigned client, but not all labelled individuals were eligible for outsourcing: Those unemployed with problems unrelated to the labour market (e.g., addiction or
7 In Section 3.2, we explain that aforementioned conditions (a) and (c) complicate the analyses, since they imply that part of the stock could also be labelled beyond the starting date of labelling for the corresponding age class.
8 E.g., those who are insufficiently proficient in Dutch are not invited to participate in the orientation stage

WSE REPORT / 25
psychological problems) or those facing unemployment traps (e.g., because of disability or wage con-fiscation) could only receive an in-house treatment.9 This finding means that those eligible for outsourc-ing were positively selected among the curative group. Because the data did not allow us to identify this eligible group, it is essential to base the empirical analysis on a method that can control for this selection on unobservables.
(iv)-(v) Action plan and phase
At the start of the treatment, the internal or external caseworker should take the theoretical pathway determined at the end of the orientation stage as given and convert it into a concrete action plan to be signed by both parties. Subsequently, the training, if required, and employment services comprising intensive counselling were delivered. Various types of training could be provided such as training in job search, vocational competencies, social competencies, communication, work attitudes, language and ICT. Counselling consisted essentially in the provision of intensive advice and follow-up in job search activities, but could also comprise using the counsellor’s network to search jobs on behalf of the client and in coaching for job interviews.
(vi) End of the treatment and possible follow-up
Six months after the end of the last training programme, or after the assignment if no training was provided, the treatment, irrespectively of its outcome, was formally ended. The follow-up after the treat-ment was predominantly limited to the administrative registration of the labour market status.
Participation in the treatment was mandatory. If the unemployed did not show up at the orientation sessions or did not collaborate in the realisation of the action plan, this information was to be transmitted to the federal UI agency that could initiate sanctions. Private providers had to report violations with these requirements through the Regional PES. In this respect, the providers had the same type of leverage toward the unemployed as had the PES.
2.3 The Features of the Public Tender
As mentioned, the PES launched a public call for tenders on July 15, 2005 as to increase capacity of the programme targeted to the curative group. The call aimed at the delivery of 6,000 counselling and training pathways between January 1, 2006 and December 31, 2009 and was divided up into 14 lots (two per sub-region).10 The number of tendered pathways in each sub-region varied between 650 and 1,210. The tenders were procured in one stage. Providers were only retained if they satisfied a number of formal criteria, such as being legally authorised and possessing certain quality labels for the provision of employment services, and if they could demonstrate experience with the counselling of job seekers. In each sub-region, the tender was then awarded to the two of the overall best performing providers on the following four selection criteria: description of the implementation methods (50%); expertise, as
9 “Job ready” individuals do not receive any treatment, but the share of these among the eligible long-term unemployed is likely to be negligible.
10 The operation of the PES is decentralized into 13 districts. Because the scale of some of these districts was too small, some of these districts were required to cooperate in the context of this tender and hence, grouped into 7 sub-regions.

WSE REPORT / 26
apparent from past experience and from the competence of case workers (20%); the location of service provision (accessibility by public transport) (10%); and the price (20%).
Ninety-two bids were submitted by 24 private FPOs and NPOs. Most NPOs formed consortia because individual organisations did not have the capacity to supply the required number of tendered pathways in each lot, while FPOs usually operated as single providers. Eventually, the 14 tenders were awarded to 10 bidders: 4 to FPOs, 5 to NPOs and 1 to a consortium in which an FPO subcontracted partly to an NPO.11 The NPOs were organisations that had expertise in the provision of counselling and other em-ployment services for socially disadvantaged as well as for other groups typically, but not exclusively, commissioned by the public sector. FPOs were quite large companies, also active in neighbouring countries, offering various types of human resources services, such as recruitment, selection, outplace-ment and temporary work. Among the tendered organisations, the NPOs generally outperformed the FPOs with regards to the selection criteria concerning expertise and location, while the FPOs obtained better average scores on implementation methods and on the price.
Based on costs calculated for comparable pathways of employment services in the PES, the call posted a reference unit price of 2,757.5 € (excluding VAT), but the bid prices could deviate from this reference price. This bid price did not depend on the nature of treatment (e.g., whether training was included or
whether counselling was provided individually or in group).12 The major share (70%) of this price was fixed. This means that the incentive scheme was very low-powered. For instance, in the studies that evaluated the outsourcing of employment services and that were reviewed in the Introduction, this fixed share varied between 0% and at most 45%, for the outsourcing of vocational rehabilitation for individuals on long-term sickness absences (Laun and Skogman Thoursie 2014). The remaining 30% of the pay-ment was proportional to a sub-regional specific target exit rate from registered unemployment to be attained in each of following three moments: at the end of the treatment (as defined above) and in the two subsequent months. The target exit rate was calculated by the PES on a comparable in-house treatment in the preceding years. This rate was set to 50%, on average, ranging between 45% in Lim-burg and 56% in Antwerp. In case the provider managed to attain a placement rate of 3 percentage points above the target, a bonus of 500€ was paid per placement above the target. Note that the target specified an exit rate from registered unemployment and not a transition to employment. Labour force exits, therefore, also contribute positively to the outcome indicator. In view of the aforementioned par-allel introduction of the job search-monitoring scheme, this is not innocuous. We will return to this issue when we interpret our findings.
The target rates seemed to be set at relatively high levels. Ex post, the average exit rate over external providers turned out to be only 43.1%. In only 4 of the 14 lots, the target was attained, and the bonus was only paid to one provider in the sub-region with the lowest target rate. Despite this low level of performance, no provider was paid less than 88% of the unit price.13 This is the consequence of the low-powered incentive payment. This induces private providers to just offer a minimum of services to the job seeker, referred to as “parking” (e.g., Koning and Heinrich 2013), that is, to collect the fixed payment per enrolled individual.14 Even if we find some evidence of such behaviour (see Section 5.1),
11 The data allow distinguishing between the FPOs and NPOs within this consortium, which is what we do in the analysis.
12 The call mentioned that one should aim at including training in 69% of the treatments, but there was no sanction if this objective was not attained. In Table 1 below, we report that only between 38% and 48% of the treatments included training.
13 This lowest performing provider obtained an exit rate that was only 60.2% of the target. The payment is then (0.602*0.30+0.70)*100% = 88.1% of the unit price.
14 The selection of job seekers with the most favourable labour market perspectives, the so-called “creaming” or “cherry picking”

WSE REPORT / 27
our evaluation reveals that the private providers did not perform worse than the public one, and the FPOs performed even better, so contractual incompleteness does not appear to have a major impact on the effectiveness of service provision. One reason is that private contractors had an interest in build-ing a good reputation because the public tender was announced to be the first in a series; therefore, the awarding of future contracts was at stake. Further explanations are discussed in Section 5.1.
An important issue in this tendering was that the call did not clearly state that the price including the VAT rate of 21% mattered at selection. This mattered because all but one of the NPOs were exempted from VAT. Eventually, four of ten non-profit providers would not have been awarded the lot if VAT had have been included in the evaluation of the price (Devisscher, Sanders and Van Pelt 2009, p. 64). However, the appeals lodged by the losing bidders were dismissed (Ibid, p. 52). As a consequence, the dispersion of the prices excluding VAT of the winning bids was substantial: between 2,350€ and 3,300€. Moreover, the NPOs that were exempted from VAT all offered a price excluding VAT that was strictly (on average 17.2%) higher than the price of any of the FPOs: on average, 3,058€ compared to 2,595€.15 The NPOs without VAT exemption offered the same price as the highest one among the FPOs, which was equal to the reference unit price of 2,757.5€. Overall, the average unit price of NPOs was 2,936€, 13.1% and 6.5% higher than, respectively, that of the FPOs and the reference price of the PES.16 The unit prices that were actually paid after performance measurement were, however, on average lower than the aforementioned bid unit prices, because the majority of the external organisations did not attain the target placement rates. Because NPOs performed better with respect to this target, the divergence between the FPOs and NPOs is even larger if we consider the ex-post unit remuneration per client (excl. VAT). For NPOs this price was on average 2,860€, while for FPO it attained only 2,448€. Based on the actual remuneration the NPOs were therefore even 16.8% more expensive than the FPOs.
We must be cautious when making cost comparisons between the private providers and the PES. Be-cause the PES could not provide us with the true cost of their service provision, we use the reference price that the PES mentioned in the call for tender as an estimate of the true unit cost. This reference price was calculated on the estimated costs that the PES incurred on 5,000 pathways on a similar population in 2003 and 2004 and, hence seems a reasonable approximation. Based on the eventual ex-post remuneration and this reference price, NPOs were 3.7% more expensive than the PES and the FPOs were 11.2% cheaper. We will show below that FPOs are significantly more effective than the PES, while NPOs do not significantly improve upon the PES. Based on these results we will conclude that the FPOs are the most efficient providers. This conclusion is robust for the true cost of public service provision not being more than 11.2% below the reference price.
is not an issue here, because the incentive scheme is relatively low powered and more importantly, because the private providers could not refuse job seekers that the PES assigned to them.
15 These are weighted averages: Each provider is weighted according to the fraction of pathways it has been commissioned.
16 Because we lack information on the effective cost of the in-house service provision, we assume that the average unit price of the PES is equal to the historically determined reference unit price of 2,757.5€.

WSE REPORT / 28
3. DATA
3.1 Informational Content of the Data
We base our analysis on administrative data that we obtained from the PES regarding the curative group labelled between March 1, 2004 and December 31, 2007. These data inform about the exact dates at which the unemployed (i) were (re-)enrolled as job seekers, (ii) were labelled as members of the curative group, (iii) entered the orientation stage,17 and (iv) were assigned to a commissioned ex-ternal provider. However, in case employment services were decided to be offered in-house, it is un-known when this decision was taken. Consequently, in the analysis, we must assume that the in-house treatment by the PES begins for all unemployed at the start of the orientation stage. This approach means that we ignore potential differential effects of the in-house treatment within and after the orien-tation stage. We believe that this simplifying assumption is not so strong because the treatment in the orientation stage only lasted 5 days and we know from informal contacts with PES employees that both the in-house and outsourced treatments started very shortly afterwards. In fact, for outsourced treat-ments, we do observe the moment of assignment to the external provider: more than 56% of the unem-ployed assigned to an external provider start their treatment within a month of the start of the orientation stage, and 90% within three months. The data also allow identifying the type of external providers, i.e., NPO or FPO. In addition, we know whether the treatment of the curative group involved participation in training, and, only for the external providers, whether counselling was provided individually, in group, or both. In the causal analysis, we distinguish between treatments only according to the type of provider (public, NPO or FPO), but the further qualifying information of the treatments is employed in the inter-pretation of the causal analysis.
The data report whether the unemployed is still registered at the end of each month as an unemployed job seeker at the PES and, if not, whether exit was to employment (possibly part-time) or to another destination, i.e., “out of labour force”. These exits are registered up to six years after labelling. All data are right censored on May 31, 2011. In our analysis, participants in training programmes are assimilated to unemployed (treated) job seekers and hence, not considered to have left the labour force. In addition, we ignore any exit from unemployment lasting less than three months. We do so because (i) the PES registers re-enrolments only if the previous enrolment did not take place within the three preceding months, (ii) the unemployment duration thresholds of 15 and 21 months utilized in the determination of the curative group (see Section 2.2) are also measured disregarding these temporary exits, and (iii) the target outcome on which the performance payment was based on such a definition of exit (see Section 2.3). Consequently, an “unemployment spell” in the analysis may consist of a sequence of brief unem-ployment and employment spells, and employment and inactivity spells always last at least three months.
The local office in which the unemployed is registered at the moment of labelling is known and condi-tioned upon in the analysis below. This conditioning may matter because the 13 local offices have a certain degree of autonomy with respect to operational decisions regarding service provision. The data contain, furthermore, information on individual characteristics, such as gender, age, having a migrant background, being disabled, level of education, fluency in Dutch, knowledge of foreign languages and possessing a driver’s licence. We also include monthly information on the provincial unemployment
17 In case the orientation stage did not take place, the date at which the intake took place is retained.
WSE REPORT / 29
rates since January 1, 1986.
We can only rely on the administrative data of the PES. This means that we are neither informed about the monitoring of job search effort nor about the level of unemployment benefits because this infor-mation is only available at the federal UI agency. Moreover, we cannot reconstruct the labour market histories for individuals who are no longer registered at the regional PES. We cannot, therefore, meas-ure the effect of the employment services on wages or on other features determining the quality of employment. However, this quality can be proxied by the time that elapses between the transition to employment and the moment of re-enrolment in registered unemployment, i.e., by what we call “em-ployment stability”.
3.2 Sample Selection
Between March 1, 2004 and December 31, 2007, 61,137 labels were set to the curative group, and 5,986 individuals were assigned to treatment by external private providers. However, for a number of reasons, we do not retain all these labelled individuals for analysis. We explain these reasons in this section.
First, because individuals could temporarily leave unemployment after being labelled, but before being treated, they could be labelled more than once. We chose to right censor data once an individual was labelled for a second time. This reduces the sample to 58,391 individuals, among whom 5,707 were contracted out. Second, among this group, 5,079 (among whom 913 were contracted out) were labelled because they did not meet the search requirements in the job search-monitoring scheme of the federal UI (Section 2.2). We do not retain these individuals in our analysis because it is difficult to separately identify the effect of the employment services from the impact of the monitoring scheme. Third, because hardly no (50) individuals were outsourced if the labelling occurred before March 2005 and after March 2007, we disregard the 18,519 individuals who were labelled in this period. Fourth, unemployed younger than (older than) 25 were labelled after an unemployment duration of 15 (21) months. As only relatively few (410) unemployed aged less than 25 were outsourced, we disregard these individuals because this complicates the selection rule to be modelled. Additional complications in the selection rule have forced us to narrow the sample size further down. This is explained in the following paragraphs.
The data retained for the analysis concern individuals older than 25 who were labelled between March 2005 and March 2007. In Section 2.2, we explained that selection requires at the instant of labelling individuals to be (a) UI recipient, (b) unemployed for at least 21 months, and (c) not having been offered any counselling pathway or training programme in the past two years. Let us first focus on condition (b) and disregard conditions (a) and (c). Because for those aged between 30 and 40 (40 and 50) labelling started in March 15, 2005 (January 15, 2006), the data should consist of the stock of individuals for whom the unemployment duration strictly exceeds 21 months at these two starting dates and the flow
of individuals entering the 22nd month of unemployment during the remaining labelling period.18 Stock sampling induces a length and interruption bias (Salant 1977). It is well known how to consider this in duration analysis (Lancaster 1979; Nickell 1979, Ridder 1984). However, the selection rule is compli-cated by two matters.
18 As aforementioned, to be labelled, unemployment duration must exceed 21 months.
WSE REPORT / 30
First, as mentioned in Section 3.1, the PES employs a definition of unemployment duration that allows temporary interruptions of less than three months. Consequently, an individual could be unemployed for more than 21 months, but not labelled because the individual is not unemployed at the moment at which the labelling occurs and hence, does not satisfy condition (a). Someone who is unemployed for more than 21 months may not be labelled for a second reason. She may have been offered a counsel-ling or training pathway within the preceding two years, i.e., condition (c) is not satisfied. Both conditions, (a) and (c), can, however, be satisfied at a later point in time. This explains why we observe beyond the start of the labelling period in March 2005 and January 2006 individuals who are labelled at unemploy-ment durations strictly larger than 21 months. Because conditions (a) and (c) induce complicated se-lection rules that are difficult to model, we exclude from the sample of analysis individuals who are labelled at an unemployment duration strictly larger than 22 months after March 15, 2005 (January 15, 2006) for those aged between 30 and 40 (40 and 50). This further reduces the sample size by 11,790 individuals among whom 1,876 were outsourced.
Finally, we drop 2,438 (of whom 411 are outsourced) for which some information is missing or incon-sistent. This step leads to a final sample of 16,157 unemployed individuals, among whom 5,336 are not treated, because they left unemployment or they entered a training programme between labelling and the orientation stage,19 1,981 are contracted out to private providers (1,167 to FPOs and 814 to NPOs), and 8,840 are offered in-house employment services.
Sample Selectivity?
A concern is that by this sample selection our analysis would no longer be representative of the pro-gramme. We therefore include in Table A.2 in the Appendix the same descriptive summary statistics for the population of interest as those reported in Table 1 in Section 3.3 for the sample of analysis. The population of interest is the unemployed who have been labelled between March 1, 2005 and March 31, 2007, were older than 25 at labelling and were not labelled because they did not meet the search requirements in the job search-monitoring scheme of the federal UI (Section 2.2). This population com-prises 31,938 individuals of whom 4,610 were outsourced to private providers (2,784 to FPOs and 1,826 to NPOs), 17,522 were allocated in-house services and 9,806 did not receive a treatment. A comparison of Tables 1 and A.2 reveals that the composition is broadly quite similar for the population of interest and our sample. Nevertheless, the sample of analysis is somewhat older, contains a notably lower fraction of individuals with migrant background and of individuals with the lowest level of education, especially among the treated groups. The fraction of the pathways including training is somewhat lower in the sample of analysis, but the relative position of the three providers is not affected. In addition, the counselling technology hardly differs. Finally, the distribution of the unemployed over the districts is very similar.20
19 A limited number of individuals participate in training before the orientation stage or after completing the pathway for the curative group. This usually happens if participation is initiated by the unemployed rather than by the case-worker. To avoid that the effect of this training contaminates the treatment effect of interest, we right censor the unemployment spells of these individ-uals at the start of the training programme.
20 The distribution over the districts is not reported in the Appendix, but can be obtained from the authors on request.
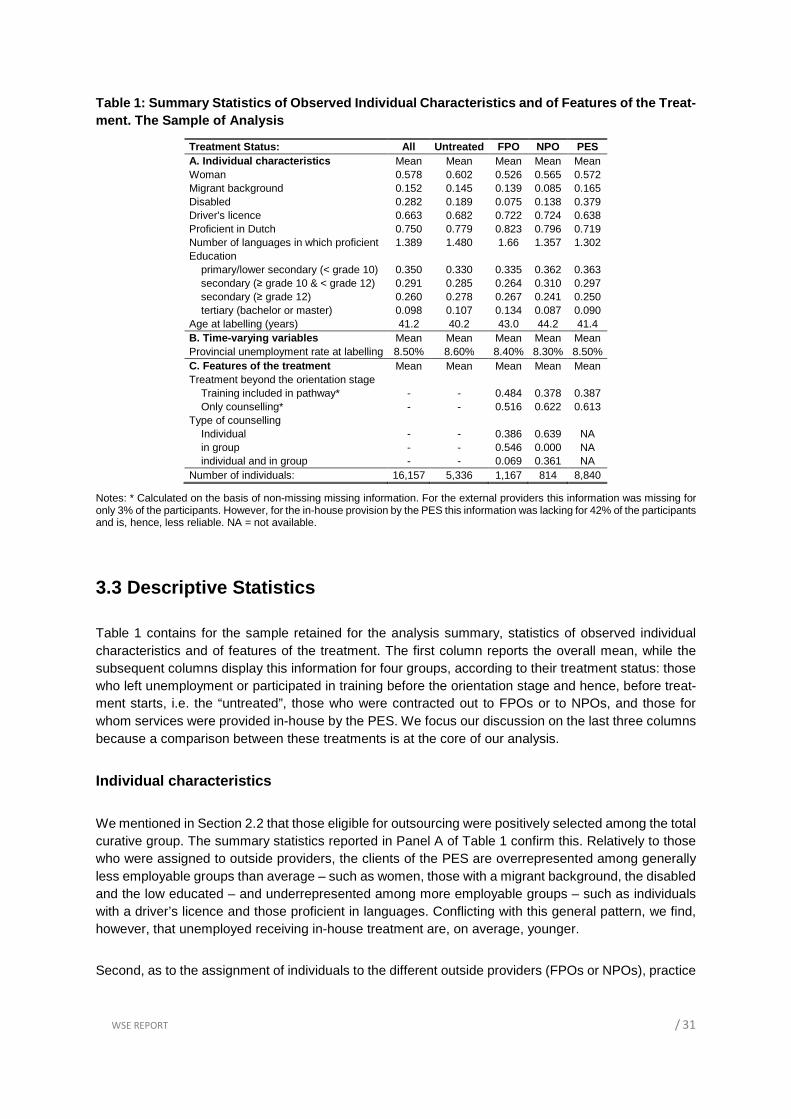
WSE REPORT / 31
Table 1: Summary Statistics of Observed Individual Characteristics and of Features of the Treat-ment. The Sample of Analysis
Treatment Status: All Untreated FPO NPO PES A. Individual characteristics Mean Mean Mean Mean Mean Woman 0.578 0.602 0.526 0.565 0.572 Migrant background 0.152 0.145 0.139 0.085 0.165 Disabled 0.282 0.189 0.075 0.138 0.379 Driver's licence 0.663 0.682 0.722 0.724 0.638 Proficient in Dutch 0.750 0.779 0.823 0.796 0.719 Number of languages in which proficient 1.389 1.480 1.66 1.357 1.302 Education primary/lower secondary (< grade 10) 0.350 0.330 0.335 0.362 0.363 secondary (≥ grade 10 & < grade 12) 0.291 0.285 0.264 0.310 0.297 secondary (≥ grade 12) 0.260 0.278 0.267 0.241 0.250 tertiary (bachelor or master) 0.098 0.107 0.134 0.087 0.090 Age at labelling (years) 41.2 40.2 43.0 44.2 41.4 B. Time-varying variables Mean Mean Mean Mean Mean Provincial unemployment rate at labelling 8.50% 8.60% 8.40% 8.30% 8.50% C. Features of the treatment Mean Mean Mean Mean Mean Treatment beyond the orientation stage Training included in pathway* - - 0.484 0.378 0.387 Only counselling* - - 0.516 0.622 0.613 Type of counselling Individual - - 0.386 0.639 NA in group - - 0.546 0.000 NA individual and in group - - 0.069 0.361 NA Number of individuals: 16,157 5,336 1,167 814 8,840
Notes: * Calculated on the basis of non-missing missing information. For the external providers this information was missing for only 3% of the participants. However, for the in-house provision by the PES this information was lacking for 42% of the participants and is, hence, less reliable. NA = not available.
3.3 Descriptive Statistics
Table 1 contains for the sample retained for the analysis summary, statistics of observed individual characteristics and of features of the treatment. The first column reports the overall mean, while the subsequent columns display this information for four groups, according to their treatment status: those who left unemployment or participated in training before the orientation stage and hence, before treat-ment starts, i.e. the “untreated”, those who were contracted out to FPOs or to NPOs, and those for whom services were provided in-house by the PES. We focus our discussion on the last three columns because a comparison between these treatments is at the core of our analysis.
Individual characteristics
We mentioned in Section 2.2 that those eligible for outsourcing were positively selected among the total curative group. The summary statistics reported in Panel A of Table 1 confirm this. Relatively to those who were assigned to outside providers, the clients of the PES are overrepresented among generally less employable groups than average – such as women, those with a migrant background, the disabled and the low educated – and underrepresented among more employable groups – such as individuals with a driver’s licence and those proficient in languages. Conflicting with this general pattern, we find, however, that unemployed receiving in-house treatment are, on average, younger.
Second, as to the assignment of individuals to the different outside providers (FPOs or NPOs), practice
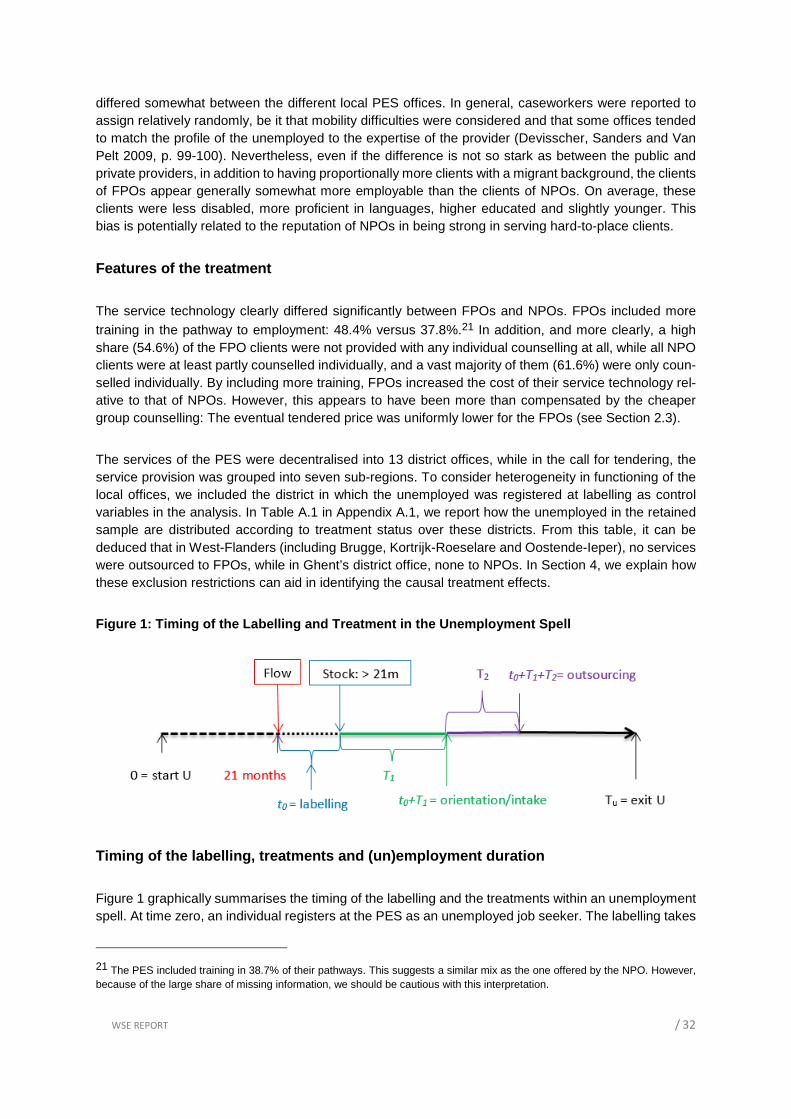
WSE REPORT / 32
differed somewhat between the different local PES offices. In general, caseworkers were reported to assign relatively randomly, be it that mobility difficulties were considered and that some offices tended to match the profile of the unemployed to the expertise of the provider (Devisscher, Sanders and Van Pelt 2009, p. 99-100). Nevertheless, even if the difference is not so stark as between the public and private providers, in addition to having proportionally more clients with a migrant background, the clients of FPOs appear generally somewhat more employable than the clients of NPOs. On average, these clients were less disabled, more proficient in languages, higher educated and slightly younger. This bias is potentially related to the reputation of NPOs in being strong in serving hard-to-place clients.
Features of the treatment
The service technology clearly differed significantly between FPOs and NPOs. FPOs included more training in the pathway to employment: 48.4% versus 37.8%.21 In addition, and more clearly, a high share (54.6%) of the FPO clients were not provided with any individual counselling at all, while all NPO clients were at least partly counselled individually, and a vast majority of them (61.6%) were only coun-selled individually. By including more training, FPOs increased the cost of their service technology rel-ative to that of NPOs. However, this appears to have been more than compensated by the cheaper group counselling: The eventual tendered price was uniformly lower for the FPOs (see Section 2.3).
The services of the PES were decentralised into 13 district offices, while in the call for tendering, the service provision was grouped into seven sub-regions. To consider heterogeneity in functioning of the local offices, we included the district in which the unemployed was registered at labelling as control variables in the analysis. In Table A.1 in Appendix A.1, we report how the unemployed in the retained sample are distributed according to treatment status over these districts. From this table, it can be deduced that in West-Flanders (including Brugge, Kortrijk-Roeselare and Oostende-Ieper), no services were outsourced to FPOs, while in Ghent’s district office, none to NPOs. In Section 4, we explain how these exclusion restrictions can aid in identifying the causal treatment effects.
Figure 1: Timing of the Labelling and Treatment in the Unemployment Spell
Timing of the labelling, treatments and (un)employm ent duration
Figure 1 graphically summarises the timing of the labelling and the treatments within an unemployment spell. At time zero, an individual registers at the PES as an unemployed job seeker. The labelling takes
21 The PES included training in 38.7% of their pathways. This suggests a similar mix as the one offered by the NPO. However, because of the large share of missing information, we should be cautious with this interpretation.
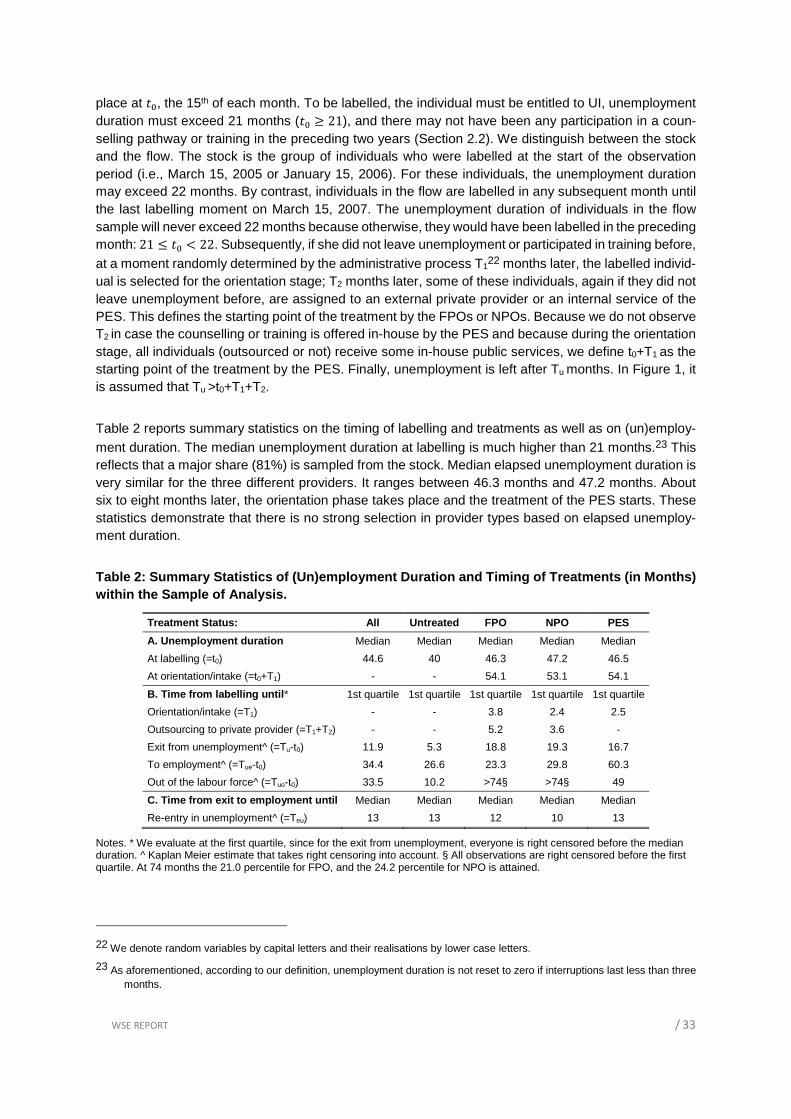
WSE REPORT / 33
place at ��, the 15th of each month. To be labelled, the individual must be entitled to UI, unemployment duration must exceed 21 months (�� ≥ 21), and there may not have been any participation in a coun-selling pathway or training in the preceding two years (Section 2.2). We distinguish between the stock and the flow. The stock is the group of individuals who were labelled at the start of the observation period (i.e., March 15, 2005 or January 15, 2006). For these individuals, the unemployment duration may exceed 22 months. By contrast, individuals in the flow are labelled in any subsequent month until the last labelling moment on March 15, 2007. The unemployment duration of individuals in the flow sample will never exceed 22 months because otherwise, they would have been labelled in the preceding month: 21 ≤ �� < 22. Subsequently, if she did not leave unemployment or participated in training before,
at a moment randomly determined by the administrative process T122 months later, the labelled individ-
ual is selected for the orientation stage; T2 months later, some of these individuals, again if they did not leave unemployment before, are assigned to an external private provider or an internal service of the PES. This defines the starting point of the treatment by the FPOs or NPOs. Because we do not observe T2 in case the counselling or training is offered in-house by the PES and because during the orientation stage, all individuals (outsourced or not) receive some in-house public services, we define t0+T1 as the starting point of the treatment by the PES. Finally, unemployment is left after Tu months. In Figure 1, it is assumed that Tu >t0+T1+T2.
Table 2 reports summary statistics on the timing of labelling and treatments as well as on (un)employ-ment duration. The median unemployment duration at labelling is much higher than 21 months.23 This reflects that a major share (81%) is sampled from the stock. Median elapsed unemployment duration is very similar for the three different providers. It ranges between 46.3 months and 47.2 months. About six to eight months later, the orientation phase takes place and the treatment of the PES starts. These statistics demonstrate that there is no strong selection in provider types based on elapsed unemploy-ment duration.
Table 2: Summary Statistics of (Un)employment Duration and Timing of Treatments (in Months) within the Sample of Analysis.
Treatment Status: All Untreated FPO NPO PES
A. Unemployment duration Median Median Median Median Median
At labelling (=t0) 44.6 40 46.3 47.2 46.5
At orientation/intake (=t0+T1) - - 54.1 53.1 54.1
B. Time from labelling until* 1st quartile 1st quartile 1st quartile 1st quartile 1st quartile
Orientation/intake (=T1) - - 3.8 2.4 2.5
Outsourcing to private provider (=T1+T2) - - 5.2 3.6 -
Exit from unemployment^ (=Tu-t0) 11.9 5.3 18.8 19.3 16.7
To employment^ (=Tue-t0) 34.4 26.6 23.3 29.8 60.3
Out of the labour force^ (=Tuo-t0) 33.5 10.2 >74§ >74§ 49
C. Time from exit to employment until Median Median Median Median Median
Re-entry in unemployment^ (=Teu) 13 13 12 10 13
Notes. * We evaluate at the first quartile, since for the exit from unemployment, everyone is right censored before the median duration. ^ Kaplan Meier estimate that takes right censoring into account. § All observations are right censored before the first quartile. At 74 months the 21.0 percentile for FPO, and the 24.2 percentile for NPO is attained.
22 We denote random variables by capital letters and their realisations by lower case letters.
23 As aforementioned, according to our definition, unemployment duration is not reset to zero if interruptions last less than three months.
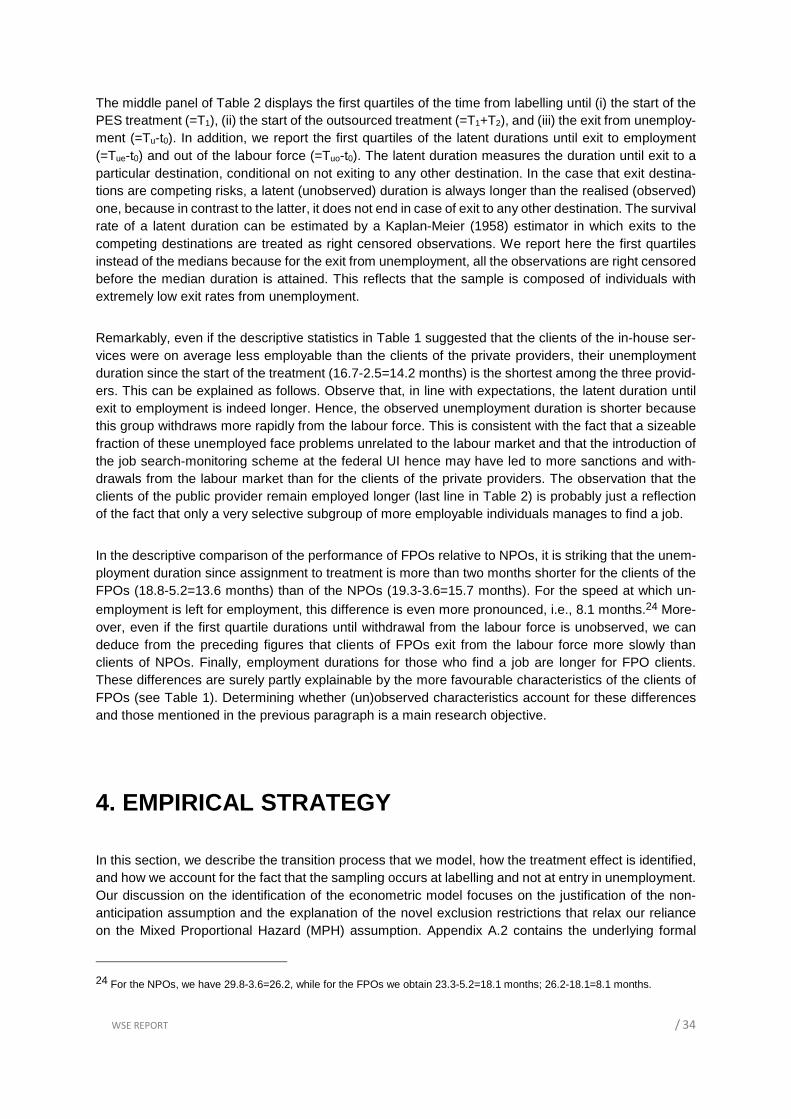
WSE REPORT / 34
The middle panel of Table 2 displays the first quartiles of the time from labelling until (i) the start of the PES treatment (=T1), (ii) the start of the outsourced treatment (=T1+T2), and (iii) the exit from unemploy-ment (=Tu-t0). In addition, we report the first quartiles of the latent durations until exit to employment (=Tue-t0) and out of the labour force (=Tuo-t0). The latent duration measures the duration until exit to a particular destination, conditional on not exiting to any other destination. In the case that exit destina-tions are competing risks, a latent (unobserved) duration is always longer than the realised (observed) one, because in contrast to the latter, it does not end in case of exit to any other destination. The survival rate of a latent duration can be estimated by a Kaplan-Meier (1958) estimator in which exits to the competing destinations are treated as right censored observations. We report here the first quartiles instead of the medians because for the exit from unemployment, all the observations are right censored before the median duration is attained. This reflects that the sample is composed of individuals with extremely low exit rates from unemployment.
Remarkably, even if the descriptive statistics in Table 1 suggested that the clients of the in-house ser-vices were on average less employable than the clients of the private providers, their unemployment duration since the start of the treatment (16.7-2.5=14.2 months) is the shortest among the three provid-ers. This can be explained as follows. Observe that, in line with expectations, the latent duration until exit to employment is indeed longer. Hence, the observed unemployment duration is shorter because this group withdraws more rapidly from the labour force. This is consistent with the fact that a sizeable fraction of these unemployed face problems unrelated to the labour market and that the introduction of the job search-monitoring scheme at the federal UI hence may have led to more sanctions and with-drawals from the labour market than for the clients of the private providers. The observation that the clients of the public provider remain employed longer (last line in Table 2) is probably just a reflection of the fact that only a very selective subgroup of more employable individuals manages to find a job.
In the descriptive comparison of the performance of FPOs relative to NPOs, it is striking that the unem-ployment duration since assignment to treatment is more than two months shorter for the clients of the FPOs (18.8-5.2=13.6 months) than of the NPOs (19.3-3.6=15.7 months). For the speed at which un-employment is left for employment, this difference is even more pronounced, i.e., 8.1 months.24 More-over, even if the first quartile durations until withdrawal from the labour force is unobserved, we can deduce from the preceding figures that clients of FPOs exit from the labour force more slowly than clients of NPOs. Finally, employment durations for those who find a job are longer for FPO clients. These differences are surely partly explainable by the more favourable characteristics of the clients of FPOs (see Table 1). Determining whether (un)observed characteristics account for these differences and those mentioned in the previous paragraph is a main research objective.
4. EMPIRICAL STRATEGY
In this section, we describe the transition process that we model, how the treatment effect is identified, and how we account for the fact that the sampling occurs at labelling and not at entry in unemployment. Our discussion on the identification of the econometric model focuses on the justification of the non-anticipation assumption and the explanation of the novel exclusion restrictions that relax our reliance on the Mixed Proportional Hazard (MPH) assumption. Appendix A.2 contains the underlying formal
24 For the NPOs, we have 29.8-3.6=26.2, while for the FPOs we obtain 23.3-5.2=18.1 months; 26.2-18.1=8.1 months.
WSE REPORT / 35
econometric model and assumptions, some complementary discussion of the identification and the der-ivation of the log-likelihood function. Furthermore, in Appendix A.3, we explain how we simulate the model. These simulations are employed to generate some goodness-of-fit statistics (reported in Appen-dix A.5) and a number of summary measures of counterfactual treatment effects that facilitate their interpretation (reported in Section 5).
4.1 Description of the Modelled Transition Process
The econometric model describes the transition process by means of a sequence of partly competing risks duration models. Figure 2 represents this transition process. At labelling, all individuals are unem-ployed. From that moment, an individual is subject to three competing risks: she can exit unemployment (�) by (i) finding employment lasting three months or more () or (ii) leaving the labour force(�); or (iii) she can remain unemployed and start receiving the in-house treatment by the PES ( ). Out of the labour force is modelled as an absorbing state. By contrast, if an individual finds a job, the transition back to unemployment is modelled. In case the individual starts the in-house treatment, the additional exit des-tinations open up: treatment by a FPO (�) or by a NPO (�). Finally, once treated by the external provid-ers, the number of exit destinations drops back to the two initial ones, i.e., to � and .
This competing risks duration model is assumed to be of the Mixed Proportional Hazard (MPH) form. This means that observed and unobserved explanatory variables and the lagged durations until treat-ment (t1, t2) and until exit from unemployment (tu) proportionally shift the transition intensities to the various destinations. The time-constant observed explanatory variables retained for the analysis are the individual characteristics reported in Panel A of Table 1 to which the square of age and the unem-ployment rate in the province of living at the start of the unemployment spell (Panel B of Table 1) are added. In addition, the provincial unemployment rate is included as a time-varying explanatory variable. The unobserved explanatory variables are assumed to be independent of the observed ones, time-constant and destination-specific. We allow the joint distribution of the unobserved heterogeneity to be arbitrarily correlated amongst each other and specify it as a discrete distribution with an a priori unknown number of points of support (Heckman and Singer 1984). Because there are six possible destinations (, �, , �, �, �), each point of support is a six-dimensional vector. Based on the recommendation of Gaure, Røed and Zhang (2007), we choose the number of points of support by minimizing the Akaike Information Criterion (AIC). Finally, treatments (PES, FPO or NPO) are allowed to affect the transition rates from unemployment to employment and out of the labour force as well as the transition rate from employment back to unemployment. In the most flexible specification, we interact these treatment indi-cators with the linear index of the time-constant observed explanatory variables reported in Table 1 (including the square of age). As we will explain in Section 5, these interactions aim at allowing for heterogeneous treatment effects as well as at testing for the presence of parking behaviour by the private providers.
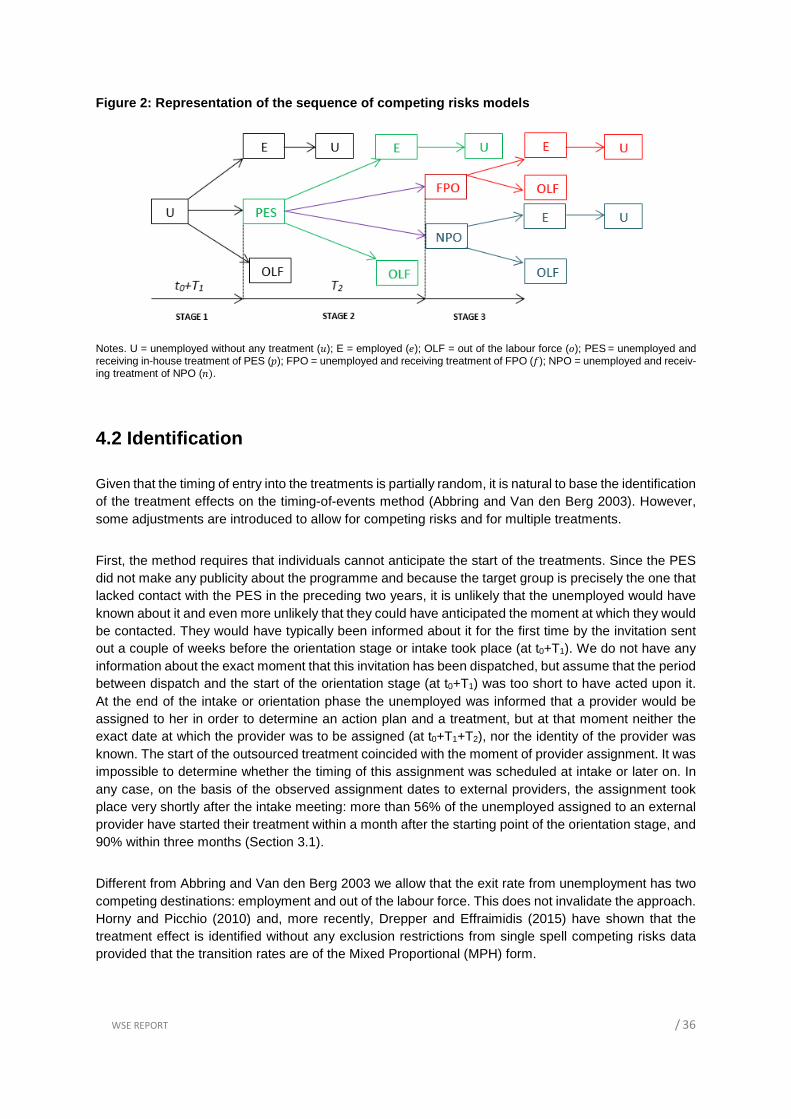
WSE REPORT / 36
Figure 2: Representation of the sequence of competing risks models
Notes. U = unemployed without any treatment (�); E = employed (); OLF = out of the labour force (�); PES = unemployed and receiving in-house treatment of PES ( ); FPO = unemployed and receiving treatment of FPO (�); NPO = unemployed and receiv-ing treatment of NPO (�).
4.2 Identification
Given that the timing of entry into the treatments is partially random, it is natural to base the identification of the treatment effects on the timing-of-events method (Abbring and Van den Berg 2003). However, some adjustments are introduced to allow for competing risks and for multiple treatments.
First, the method requires that individuals cannot anticipate the start of the treatments. Since the PES did not make any publicity about the programme and because the target group is precisely the one that lacked contact with the PES in the preceding two years, it is unlikely that the unemployed would have known about it and even more unlikely that they could have anticipated the moment at which they would be contacted. They would have typically been informed about it for the first time by the invitation sent out a couple of weeks before the orientation stage or intake took place (at t0+T1). We do not have any information about the exact moment that this invitation has been dispatched, but assume that the period between dispatch and the start of the orientation stage (at t0+T1) was too short to have acted upon it. At the end of the intake or orientation phase the unemployed was informed that a provider would be assigned to her in order to determine an action plan and a treatment, but at that moment neither the exact date at which the provider was to be assigned (at t0+T1+T2), nor the identity of the provider was known. The start of the outsourced treatment coincided with the moment of provider assignment. It was impossible to determine whether the timing of this assignment was scheduled at intake or later on. In any case, on the basis of the observed assignment dates to external providers, the assignment took place very shortly after the intake meeting: more than 56% of the unemployed assigned to an external provider have started their treatment within a month after the starting point of the orientation stage, and 90% within three months (Section 3.1).
Different from Abbring and Van den Berg 2003 we allow that the exit rate from unemployment has two competing destinations: employment and out of the labour force. This does not invalidate the approach. Horny and Picchio (2010) and, more recently, Drepper and Effraimidis (2015) have shown that the treatment effect is identified without any exclusion restrictions from single spell competing risks data provided that the transition rates are of the Mixed Proportional (MPH) form.
WSE REPORT / 37
A distinguishing feature with the standard timing-of-events approach is that the treatment cannot start before the t0>21 first months of the unemployment spell, i.e. not before the labelling. The variation in t0
in the stock sample makes it possible to distinguish between the duration T1 between the labelling at t0
and the start of the (first) treatment by the PES, and the unemployment duration Tu>t0.25 There is no reason why, conditional on the elapsed unemployment duration tu<Tu, the elapsed duration since label-ling t1≤T1 would be related to the transition rates from unemployment to employment or out of the labour force apart from its effect through the treatment. We therefore exclude t1 from the set of determinants of these transition rates from unemployment, while we maintain it in the specification of the transition to the treatment. Even if the standard timing-of-events approach does not require it, this exclusion re-striction clearly provides an additional source to disentangle the treatment effect from selection on un-observables.
A second distinguishing feature is that we consider the effect of multiple treatments. Nevertheless, the identification problem is simplified, because (i) the outsourcing to external providers began only for the cohorts labelled after November 2005, and (ii) since then the treatment choice is partly sequential: All treatments by private providers, be it by FPO or by NPO, are preceded by an in-house treatment by the PES starting at t0+T1. The in-house by the PES can be analysed as in the standard framework apart from the fact that, as discussed, the assignment to the treatment cannot occur before 21 months. If we assume that the unobserved composition of the curative target population is stable over time,26 the analysis of the cohorts labelled before December 2005 allow to separately identify the selection on unobservables into treatment by the public provider from that by external providers. From 2006 on-wards, treatments by external private provider may substitute the in-house treatment. Because the tim-ing of entry in this treatment, t0+T1+T2, is, as already mentioned, neither predetermined, nor anticipated, this random timing can be exploited to separately identify the causal effect of treatment by these exter-nal providers. Moreover, also in this situation we have additional exclusion restrictions that aid in iden-tifying the treatment effects: (i) there is no reason why the elapsed durations t1<T1 and t2<T2 would be related to the transition rates from unemployment apart from their effect through the treatments; (ii) in some districts the unemployed can only be assigned to one type of external provider, either NPO or FPO (Section 3.3 and Table A.1 in Appendix A.1), which is helpful for separating out the treatment effect of each private provider from the other.
4.3 Accounting for the Sampling at Labelling
The data for analysis are informative on the entry date in unemployment, but the sampling occurred at labelling. Consequently, in the sample of analysis, all individuals have been unemployed for at least 21 months, and no information is available on the transition rates during the first 21 months. Hence, in the analysis we shift the origin of the unemployment spell by 21 months. Given this new origin, we consider that individuals may only be sampled (= labelled) beyond the shifted origin: t0-21>0. For this, we follow the conventional approach for stock samples (Lancaster, 1979; Nickel 1979; Ridder 1984). We form our log-likelihood function by explicitly conditioning on the elapsed duration t0-21 (instead of on t0).
25 If individuals would have been labelled at a fixed unemployment duration, then T1 and Tu would have differed only by a fixed constant.
26 By conditioning the hazard rate on the age and the provincial unemployment rate at entry in unemployment, we allow for unobserved compositional changes that are proportional to these variables.
WSE REPORT / 38
5. RESULTS
We report the key findings of three estimated models: (i) the model accounting for selection on observ-ables only; (ii) the model accounting for selection on both observables and unobservables; (iii) the model corresponding to (ii) apart from additionally included interactions for the exit destinations employ-ment () and out of the labour force (�) of the treatment indicators with a linear index of the observed
individual characteristics listed in Table 1.27 According to the AIC, the multivariate distribution of unob-served heterogeneity can be described by 11x6 points of support. Some of these points of support approach minus infinity, which means that the exit rate to that specific destination approaches zero, i.e., the distribution is defective. In these cases, the points of support of these destinations are not estimated, but fixed to a very large negative value. For transitions following destinations that cannot be attained, we fix the points of support arbitrarily to zero. For instance, if the point of support of the transition to employment is set to minus infinity, the corresponding point of the transition from employment back to unemployment is set to zero.
We focus the discussion on the parameters of interest: the proportional effect of the treatment on the transition rate to employment (), on the transition out of the labour force (�) and for those who found a job, on the transition back to unemployment (�). For each of these effects, we consider first the impact of being treated by the PES relative to no treatment and then, the impact of treatment by FPOs and NPOs relative to treatment by the PES. The interested reader can find the complete estimation results in Appendix A.4. To obtain some goodness-of-fit measures and to facilitate the interpretation of these treatment effects, we also perform some (counterfactual) simulations that we report in Section 5.2.
5.1 The Impact of the Treatments on the Transition Rates
The overall effect of the programme
Table 3 reports for the three aforementioned models, the estimated proportional effects of the different provider types on the hazard to employment, out of the labour force and from employment back to unemployment. Let us first consider the overall effect of programme participation, irrespective of the provider type. For all three models, participation results in notably statistically significant higher exit rates (1) to employment, (2) out of the labour force and (3) back to unemployment for those who found a job.
27 We also tried these interaction in the transition back to unemployment (�), but because these were not statistically significantly different from zero, we do not report this model.
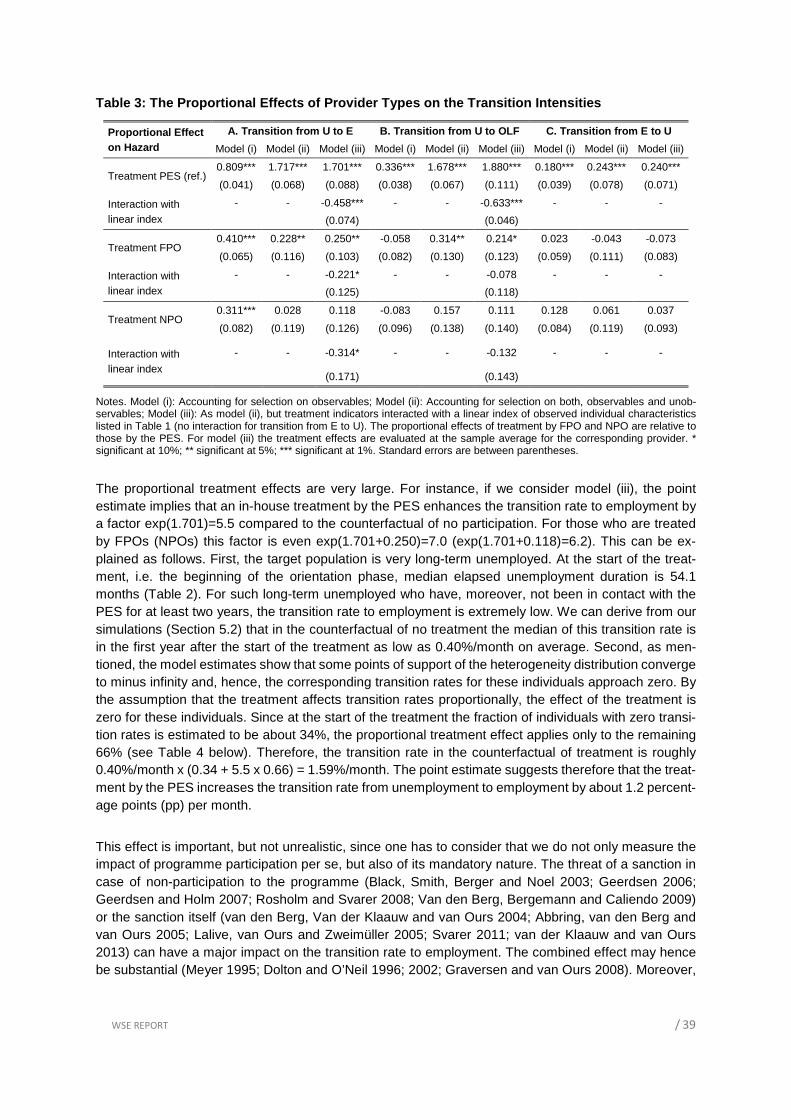
WSE REPORT / 39
Table 3: The Proportional Effects of Provider Types on the Transition Intensities
Proportional Effect on Hazard
A. Transition from U to E B. Transition from U to OLF C. Transition from E to U
Model (i) Model (ii) Model (iii) Model (i) Model (ii) Model (iii) Model (i) Model (ii) Model (iii)
Treatment PES (ref.) 0.809*** 1.717*** 1.701*** 0.336*** 1.678*** 1.880*** 0.180*** 0.243*** 0.240***
(0.041) (0.068) (0.088) (0.038) (0.067) (0.111) (0.039) (0.078) (0.071)
Interaction with linear index
- - -0.458*** - - -0.633*** - - -
(0.074) (0.046)
Treatment FPO 0.410*** 0.228** 0.250** -0.058 0.314** 0.214* 0.023 -0.043 -0.073
(0.065) (0.116) (0.103) (0.082) (0.130) (0.123) (0.059) (0.111) (0.083)
Interaction with linear index
- - -0.221* - - -0.078 - - -
(0.125) (0.118)
Treatment NPO 0.311*** 0.028 0.118 -0.083 0.157 0.111 0.128 0.061 0.037
(0.082) (0.119) (0.126) (0.096) (0.138) (0.140) (0.084) (0.119) (0.093)
Interaction with linear index
- - -0.314* - - -0.132 - - -
(0.171) (0.143)
Notes. Model (i): Accounting for selection on observables; Model (ii): Accounting for selection on both, observables and unob-servables; Model (iii): As model (ii), but treatment indicators interacted with a linear index of observed individual characteristics listed in Table 1 (no interaction for transition from E to U). The proportional effects of treatment by FPO and NPO are relative to those by the PES. For model (iii) the treatment effects are evaluated at the sample average for the corresponding provider. * significant at 10%; ** significant at 5%; *** significant at 1%. Standard errors are between parentheses.
The proportional treatment effects are very large. For instance, if we consider model (iii), the point estimate implies that an in-house treatment by the PES enhances the transition rate to employment by a factor exp(1.701)=5.5 compared to the counterfactual of no participation. For those who are treated by FPOs (NPOs) this factor is even exp(1.701+0.250)=7.0 (exp(1.701+0.118)=6.2). This can be ex-plained as follows. First, the target population is very long-term unemployed. At the start of the treat-ment, i.e. the beginning of the orientation phase, median elapsed unemployment duration is 54.1 months (Table 2). For such long-term unemployed who have, moreover, not been in contact with the PES for at least two years, the transition rate to employment is extremely low. We can derive from our simulations (Section 5.2) that in the counterfactual of no treatment the median of this transition rate is in the first year after the start of the treatment as low as 0.40%/month on average. Second, as men-tioned, the model estimates show that some points of support of the heterogeneity distribution converge to minus infinity and, hence, the corresponding transition rates for these individuals approach zero. By the assumption that the treatment affects transition rates proportionally, the effect of the treatment is zero for these individuals. Since at the start of the treatment the fraction of individuals with zero transi-tion rates is estimated to be about 34%, the proportional treatment effect applies only to the remaining 66% (see Table 4 below). Therefore, the transition rate in the counterfactual of treatment is roughly 0.40%/month x (0.34 + 5.5 x 0.66) = 1.59%/month. The point estimate suggests therefore that the treat-ment by the PES increases the transition rate from unemployment to employment by about 1.2 percent-age points (pp) per month.
This effect is important, but not unrealistic, since one has to consider that we do not only measure the impact of programme participation per se, but also of its mandatory nature. The threat of a sanction in case of non-participation to the programme (Black, Smith, Berger and Noel 2003; Geerdsen 2006; Geerdsen and Holm 2007; Rosholm and Svarer 2008; Van den Berg, Bergemann and Caliendo 2009) or the sanction itself (van den Berg, Van der Klaauw and van Ours 2004; Abbring, van den Berg and van Ours 2005; Lalive, van Ours and Zweimüller 2005; Svarer 2011; van der Klaauw and van Ours 2013) can have a major impact on the transition rate to employment. The combined effect may hence be substantial (Meyer 1995; Dolton and O’Neil 1996; 2002; Graversen and van Ours 2008). Moreover,
WSE REPORT / 40
in a recent meta-analysis Card, Kluve and Weber (2015) show that job search assistance and sanction programmes appear to be relatively more successful for disadvantaged participants, such as the target group of the programme that is evaluated in this research.
A similar reasoning with respect to the size of the treatment effects applies for the transition out of the labour force. Because in the counterfactual of no treatment the transition rate out of the labour force is about 0.34%/month, the transition rate in the counterfactual of treatment by the PES is approximately 0.34%/month x (0.34 + exp(1.880) x 0.66) = 1.59%/month and, therefore, the treatment effect is roughly 1.25 pp/month. The finding that the programme enhances the transition out of the labour force is con-sistent with its mandatory nature. Petrongolo (2009) and Manning (2009) show that imposing stricter requirements on unemployed benefit recipients can indeed induce them to stop claiming benefits and leave the labour force.
For the transition from employment back to unemployment, there are no individuals with a zero treat-ment effect, because conditional on having made a transition to employment, no point of support of this transition approaches minus infinity. Hence, given a transition rate of 2.2%/month in the counterfactual of no treatment, the treatment enhances this rate to 2.2%/month x exp(0.240) = 2.8%/month, an in-crease of 0.6 pp/month. A higher exit rate from employment is in line with the explanation that manda-tory programme participation lowers the quality of the job match (Petrongolo 2009; Arni, Lalive and Van Ours 2013; van den Berg and Vikström 2014). Together with the finding that programme participation speeds up the transition to employment, this result means that the programme involves a trade-off. In Section 5.2, we propose a quantification of this trade-off based on counterfactual simulations.
The relative effectiveness and efficiency of the di fferent provider types
The focus of this study is on measuring the relative effectiveness of the three different provider types. Based on model (iii), we conclude that the FPOs are more effective than the PES in enhancing the transition rate from unemployment to employment: it is 28% (= (exp(0.25)-1)*100) higher than the in-house treatment by the PES. The effect is statistically significant at the 5% level. Nevertheless, in com-parison to the treatment effect of the PES, this additional effect is relatively small, more so, if one takes into account that among those assigned to an external provider the fraction never exiting unemployment rises to 49% (Table 4). This means that the effective multiplier falls from 1.28 to (0.49 + 0.51 x 1.28) = 1.14.
The point estimate of the effect of the NPOs lies between that of the PES and the FPOs, but neither difference is statistically significant. Similar point estimates of the effects on the withdrawal rate from the labour force are found, although the differential effect between that of the FPOs and the PES is slightly lower and only significantly different at the 10% level. This suggests that the private providers may have been more likely than the PES to report non-cooperative behaviour to the federal UI agency which could have led to sanctions and, hence, withdrawals from the labour force. Unfortunately, our data do not allow to test this hypothesis, since they do not contain any information about these sanc-tions.
Finally, the provider type does not have any significantly different effect on job quality as measured by the transition rate from employment back to unemployment, although the point estimates suggest that treatment by FPOs lengthens the employment spell slightly relative to the in-house treatment, while treatment by NPOs shortens this spell slightly.

WSE REPORT / 41
So, in contrast to the existing evidence, we find that private providers, and FPOs in particular, can be more effective than the public provider in bringing long-term unemployed job seekers back to work, be it at a cost of a slightly higher withdrawal rate from the labour force. FPOs also provide the treatment at a significantly lower cost (on average 5.4% cheaper than the PES; see Section 2.3). This means that FPOs provide overall more value for money. In contrast, NPOs were on average 7.6% more expensive than the PES and their impact on employment was not significantly higher than that of the PES. To-gether with the observation that the enhancement of the impact of both private providers was small relative to that of the PES, our findings do actually not diverge much from recent studies that did not find any significant differences between provider types (Bennmarker, Grönqvist and Öckert 2013; Laun and Skogman Thoursie 2014; Krug and Stephan 2013; Rehwald, Rosholm and Svarer 2015).
A comparison between the results of model (iii) and those of model (ii) indicates that controlling for selection on unobservables matters. In particular, in the absence of such a control, the treatment effect of the in-house services on both exit destinations is dramatically underestimated, while for the out-sourced ones, the exit to employment is overestimated and the exit from the labour force underesti-mated. The latter biases are more important for the FPOs than for the NPOs. The effect on the return from employment to unemployment is not as strongly affected by this selection on unobservables. When we in addition allow for heterogeneity in the treatment effect (model (iii)), there is no major change in these findings, except that the difference between the treatment effect of FPOs and NPOs diminishes.
Explaining the differential performance of the diff erent provider types
Overall, we find that FPOs are more efficient than the other providers in bringing the programme par-ticipants back to work. Relative to the public in-house treatment they are both more effective and cheaper;28 relative to the NPOs better performance is essentially a matter of lower costs. In this section we discuss some factors that may drive this differential performance, and, hence, calls for further re-search to determine to what extent these factors are intrinsically linked to the provider type (profit, non-profit or public) or, rather, are factors that may confound the causal relationship, or make it dependent on the some features of the programme that was studied, such as the particular form of the incentive
contract, or the fact that it was the first public procurement of employment services in a series.29
In the Introduction, we mentioned that economic theory predicts that private for-profit providers have incentives to overinvest in cost saving technologies, leading to low value added (Hart, Shleifer and Vishny 1997). However, in the case of a pro-social mission, such as the provision of services to the long-term unemployed considered here, there is an intrinsic motivation to deliver high quality.30 Most of the existing literature argues that the presence of a profit motive would crowd out such a pro-social motivation, suggesting thereby that NPOs would outperform FPOs in the delivery of such services (e.g., Frey 1997; Kreps 1997; Frey and Jegen 2001; Bénabou and Tirole 2006; Bowles and Polanía-Reyes 2012). Nevertheless, recent research (Ashraf, Bandiera and Kelsey 2014; Ashraf, Bandiera and Lee 2015) finds that material incentives (i) need not crowd out intrinsic motivation and (ii) may attract agents
28 Because, as mentioned in Section 2.3, the cost of provision by the PES was based on an estimation, we cannot claim with certainty that the FPOs were cheaper than the PES. However, this statement is robust as long as the true cost is not more than 11% below the reference price. 29 Note that these doubts on causal interpretation apply equally to the existing studies that compare public to private provision.
30 We assume that delivery of high quality means that services enhance the employment of participants as much as possible. However, alternatively, prosocial behaviour could mean that counsellors rather aim at improving the “quality of life” of the disad-vantaged group. With the available data, we cannot test this hypothesis. However, arguably, the delivered counselling and em-ployment services should in priority aim at increasing the employability of participants.
WSE REPORT / 42
valuing more material benefits without necessarily displacing pro-social preferences. This research finds evidence that in case of a pro-social mission, utilizing material incentives can in fact (i) motivate agents to perform better and (ii) attract talented agents who also perform well in the non-incentivised dimension. Our finding that FPOs are more efficient relative to the non-profit public or private providers in bringing the long-term unemployed back to work is consistent with these recent findings.
A second potential explanation of the better performance of the FPOs is that, in contrast to the NPOs, the FPOs were new in the market and hence, had more incentives to build up a good reputation because the procurement of these employment services were announced to be the first of a series. In addition, as FPOs were larger than NPOs, they could have benefited from economies of scale relative to NPOs. Finally, the FPOs employed a cheaper counselling technology by privileging group to individual coun-selling (Section 3.3), which apparently did not negatively affect the quality of the service provision. These elements may have more than compensated for the lack of experience of FPOs relative to NPOs in the Flemish market of employment services (Section 2.3). This lack of experience and incomplete mastery of the counselling technology was a major explanation for the lower performance of the private service providers in France (Behaghel, Crépon and Gurgand 2014).
Another potential explanation of the differential performance of the private providers relative to the pub-lic providers is related to selection and contract incentives. First, as mentioned above, the private pro-viders could not select clients because they were not allowed to refuse trainees proposed by the PES. Nevertheless, in the descriptive analysis in Section 3.3, we already have documented that based on observed characteristics, the clients of FPOs appeared to be more employable than those of NPOs, who in turn were more employable than those of the PES. By comparing the treatment effects of models (i) and (ii), we can deduce that the clients of the private providers are, relative to those of the PES, also a positive selection in terms of unobserved employability. In contrast to the selection on observables, NPOs have a more positively selected clientele in terms of unobservables than FPOs: The treatment effect for the transition to employment decreases more between model (ii) and (i) than the one for the FPOs. For the transition out of the labour force, the trainees of the private providers are, however, negatively selected in terms of unobservables, and more so for the FPOs. To conclude, even if the providers could not influence the selection process, the composition of their clientele clearly differed. Because the payment scheme did not take this differential composition into account, this must have induced rewards to be unrelated to effective performance of the providers. This contrasts to the findings of Behaghel, Crépon and Gurgand (2014), who did not find significant differential selection between the private and public providers in France.
Because the payment for the service delivery was for 70% fixed, the private providers had an incentive to “park” their clients, i.e., to just offer a minimum of services (Section 2.3). Nevertheless, the fact that the remaining 30% of the payment is conditional on exit from unemployment provides some incentives to the private providers to concentrate service delivery on those with the lowest chances of exit and to rely on those with the highest chances to leave unemployment without any intervention. Model (iii) aims at testing this hypothesis. The linear indices interacting the treatment indicators are measures of the
individual propensity to exit to work or out of the labour force.31 The hypothesis that private providers act upon the contract incentives is, therefore, not rejected if the coefficient of this interaction, in deviation from that of the PES, is negative. We indeed cannot reject this hypothesis for the transition to employ-ment, at the 7.7% level for FPOs and at the 6.7% level for NPOs. This finding is in agreement with that of Behaghel, Crépon and Gurgand (2014) who also find evidence that private providers in France park
31 In principle, we could allow the treatment effect depend on unobservables (Richardson and van den Berg 2013). However, because model complexity makes estimation already extremely time-consuming, we did not consider this complication.

WSE REPORT / 43
more clients than the public provider. However, concentrating resources on the least employable un-employed may for the programme that we evaluate actually have enhanced the effectiveness because the intervention also works better for this group: The interactions of the linear index with the treatment indicators of the PES (i.e., the reference) are indeed negative and highly statistically significant (see Table 3). Moreover, since FPOs had, in terms of observables, the most employable clients and the NPOs the least employable, this means that the differential composition actually favoured the NPOs and disadvantaged the FPOs. Despite this, FPOs performed best. Behaghel, Crépon and Gurgand (2014) found that French job seekers enrolled in the private programme were less likely to be sanctioned than those enrolled in the public programme. A possible interpretation was that, in contrast to caseworkers in the public programme, caseworkers in the private programme did not apply sanctions because they neither had the incentives nor the terms of reference to do so. In this study, we are not capable of distinguishing between exits from the labour force and sanctions, but we do find some weak evidence that private providers, especially FPOs, enhance withdrawals (com-prising sanctions) relative to the PES. This is probably related to the explicit instruction of private pro-viders to report (as in-house caseworkers) non-cooperative behaviour of clients. This information is then transmitted to the federal UI, which decides whether sanctions are imposed. A second reason is that the incentive contract provides monetary rewards irrespectively of whether unemployment is left for a job or for inactivity.
5.2 Counterfactual Analysis Based on Simulations
By simulating model (iii) 999 times, we aim at evaluating the goodness-of-fit of our model and at facili-tating the interpretation of our counterfactual evaluations. To allow for the precision of the estimators, we draw each time an entire new vector of parameters assuming that these are normally distributed around the point estimates with a variance-covariance matrix equal to the estimated one. Appendix A.3 provides details on the simulation method, while Appendix A.5 reports the goodness-of-fit statistics. The goodness-of-fit statistics consist in the realised cumulative fractions of individuals leaving to each of the six destinations together with the corresponding simulated 95% Confidence Intervals (CI). These sta-tistics are reported from the start of the orientation phase for the duration until treatment by a private provider, from the fourth month after entry in employment in the case of a return back to unemployment, because by definition, exit from unemployment requires this exit to last a minimum of three months, and from labelling in all other cases, until a maximum of 72 months later. For all destinations, the realised fractions are for most elapsed durations contained in the 95% CI. The major exception is that the fraction leaving the labour force is slightly overestimated during the first six months since labelling. If we con-sider the 99% CI (not reported), this overestimation is only present during the first two months.
In Table 3, we reported the effects of the overall programme and of the provider types on the different transition rates. To facilitate the interpretation, we provide some complementary statistics of these treat-ment effects that are based on counterfactual simulations of the estimated model. The simulations gen-erate for each treated individual from the orientation stage/intake the following outcomes, once in case of treatment and once in the counterfactual of no treatment: the unemployment duration, in case of exit, its destination, and in case of exit to employment, the employment duration (see Appendix A.3 for tech-nical details). In Table 4, we report a selection of median treatment effects on the aforementioned out-comes. We report the median treatment effects32 rather than the average treatment effects because
32 The “median treatment effect” is not the same as the difference between the medians in the counterfactual of treatment and
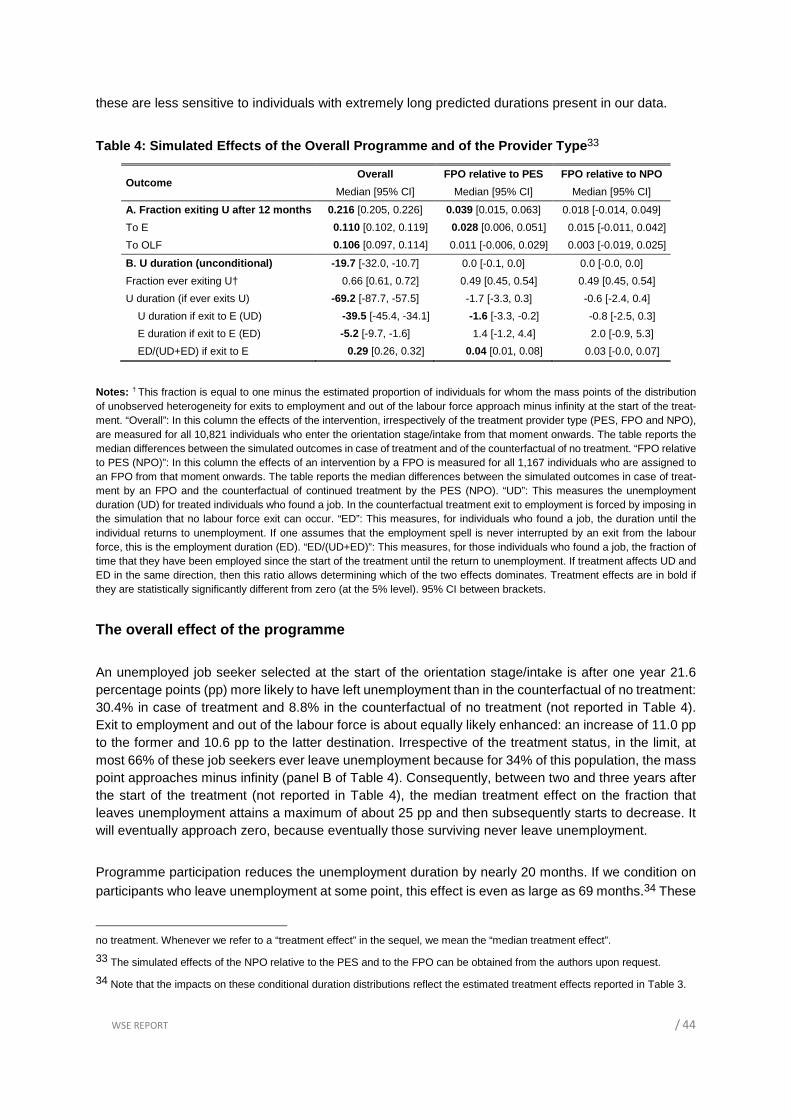
WSE REPORT / 44
these are less sensitive to individuals with extremely long predicted durations present in our data.
Table 4: Simulated Effects of the Overall Programme and of the Provider Type33
Outcome Overall FPO relative to PES FPO relative to NPO
Median [95% CI] Median [95% CI] Median [95% CI]
A. Fraction exiting U after 12 months 0.216 [0.205, 0.226] 0.039 [0.015, 0.063] 0.018 [-0.014, 0.049]
To E 0.110 [0.102, 0.119] 0.028 [0.006, 0.051] 0.015 [-0.011, 0.042]
To OLF 0.106 [0.097, 0.114] 0.011 [-0.006, 0.029] 0.003 [-0.019, 0.025]
B. U duration (unconditional) -19.7 [-32.0, -10.7] 0.0 [-0.1, 0.0] 0.0 [-0.0, 0.0]
Fraction ever exiting U† 0.66 [0.61, 0.72] 0.49 [0.45, 0.54] 0.49 [0.45, 0.54]
U duration (if ever exits U) -69.2 [-87.7, -57.5] -1.7 [-3.3, 0.3] -0.6 [-2.4, 0.4]
U duration if exit to E (UD) -39.5 [-45.4, -34.1] -1.6 [-3.3, -0.2] -0.8 [-2.5, 0.3]
E duration if exit to E (ED) -5.2 [-9.7, -1.6] 1.4 [-1.2, 4.4] 2.0 [-0.9, 5.3]
ED/(UD+ED) if exit to E 0.29 [0.26, 0.32] 0.04 [0.01, 0.08] 0.03 [-0.0, 0.07]
Notes: † This fraction is equal to one minus the estimated proportion of individuals for whom the mass points of the distribution of unobserved heterogeneity for exits to employment and out of the labour force approach minus infinity at the start of the treat-ment. “Overall”: In this column the effects of the intervention, irrespectively of the treatment provider type (PES, FPO and NPO), are measured for all 10,821 individuals who enter the orientation stage/intake from that moment onwards. The table reports the median differences between the simulated outcomes in case of treatment and of the counterfactual of no treatment. “FPO relative to PES (NPO)”: In this column the effects of an intervention by a FPO is measured for all 1,167 individuals who are assigned to an FPO from that moment onwards. The table reports the median differences between the simulated outcomes in case of treat-ment by an FPO and the counterfactual of continued treatment by the PES (NPO). “UD”: This measures the unemployment duration (UD) for treated individuals who found a job. In the counterfactual treatment exit to employment is forced by imposing in the simulation that no labour force exit can occur. “ED”: This measures, for individuals who found a job, the duration until the individual returns to unemployment. If one assumes that the employment spell is never interrupted by an exit from the labour force, this is the employment duration (ED). “ED/(UD+ED)”: This measures, for those individuals who found a job, the fraction of time that they have been employed since the start of the treatment until the return to unemployment. If treatment affects UD and ED in the same direction, then this ratio allows determining which of the two effects dominates. Treatment effects are in bold if they are statistically significantly different from zero (at the 5% level). 95% CI between brackets.
The overall effect of the programme
An unemployed job seeker selected at the start of the orientation stage/intake is after one year 21.6 percentage points (pp) more likely to have left unemployment than in the counterfactual of no treatment: 30.4% in case of treatment and 8.8% in the counterfactual of no treatment (not reported in Table 4). Exit to employment and out of the labour force is about equally likely enhanced: an increase of 11.0 pp to the former and 10.6 pp to the latter destination. Irrespective of the treatment status, in the limit, at most 66% of these job seekers ever leave unemployment because for 34% of this population, the mass point approaches minus infinity (panel B of Table 4). Consequently, between two and three years after the start of the treatment (not reported in Table 4), the median treatment effect on the fraction that leaves unemployment attains a maximum of about 25 pp and then subsequently starts to decrease. It will eventually approach zero, because eventually those surviving never leave unemployment.
Programme participation reduces the unemployment duration by nearly 20 months. If we condition on participants who leave unemployment at some point, this effect is even as large as 69 months.34 These
no treatment. Whenever we refer to a “treatment effect” in the sequel, we mean the “median treatment effect”.
33 The simulated effects of the NPO relative to the PES and to the FPO can be obtained from the authors upon request.
34 Note that the impacts on these conditional duration distributions reflect the estimated treatment effects reported in Table 3.

WSE REPORT / 45
are very large effects. As already mentioned in Section 5.1, this is because the target group of very long-term unemployed has extremely low chances to leave unemployment. The median (not reported in Table 4) of the (un)conditional duration distribution in the counterfactual of treatment and no treatment is extrapolated to be, respectively, 14 (154) months and 85 (722) months. Expressing the treatment effect in terms of unemployment duration underlines that a programme that targets at individuals who are very unlikely to leave unemployment in the counterfactual of no participation can generate substan-tial savings in terms of UB payments, even if the effect as measured in terms of pp on the probability of leaving is relatively modest.
For treated job seekers who have found a job (and impose that a job is found in the counterfactual of no treatment), unemployment duration falls by 39.5 months and employment duration by 5.2 months. This demonstrates that treatment induces a trade-off between accelerating the job finding rate and the rate of return to unemployment. In order to quantify which effect dominates, we simulated for those individuals who found a job after treatment the fraction of time that they are employed between the start of the treatment and their eventual re-entry in unemployment for both treatment counterfactuals. The median difference of those counterfactual is reported in the last line of Table 4. The treatment effect on unemployment duration clearly dominates that on employment duration: the fraction of time in employ-ment increases by 29 pp. In the absence of treatment the median fraction of time in employment of this sub-sample was 37 pp (not reported in Table 4).
The effect of treatment by FPOs relative to treatme nt by the PES or by NPOs
In Table 4, we also report the median treatment effects for the job seekers who have been counselled or trained by an FPO from the moment of assignment to this provider. In the simulation, we consider two counterfactuals from this moment onwards: treatment by the PES (column 3) or treatment by NPOs (column 4). One year after being assigned to an FPO, an unemployed job seeker is 3.9 pp (1.8 pp) more likely to have left unemployment than in the counterfactual of treatment by the PES (an NPO). Only the effect relative to that of the PES is statistically significantly different from zero at the 5% level. This significant effect is for more than two thirds (2.8 pp) to employment. Exits from the labour force increase by 1.1 pp, but not statistically significantly. Relative to NPOs, virtually all the increase in the exit rate is to employment, but neither effect is significant at the 5% level.
More than half of the individuals treated by FPOs never leave unemployment.35 This explains why the unconditional median effect of treatment by an FPO is zero: The fraction never leaving unemployment is not affected by programme participation. This means that FPOs only succeed in affecting the unem-ployment duration of 49% of their clients and that, only for those who found a job the unemployment spell is statistically significantly shorter (1.6 months) than in in the counterfactual treatment by the PES. The employment spell is 1.4 months, but statistically insignificantly longer. Together this implies that overall the fraction of time in employment increases significantly by 4 pp.
The FPOs are also slightly more effective than NPOs in reducing the unemployment duration of those clients who found a job and in increasing the length of their employment spell. The combined effect raises the fraction of time spent in employment by 3 pp, close to significantly at the 5% level.
35 For the clients of NPOs, the fraction leaving unemployment is 51%, and the 95% CI is [46%, 57%].

WSE REPORT / 46
6. CONCLUSIONS
This paper has evaluated the contracting out of part of a public mandatory counselling and training programme for long-term unemployed in Flanders (Belgium) to private for-profit and non-profit organi-sations (FPO and NPO). The programme aimed at providing employment services to unemployment benefit recipients who were at least 21 months unemployed (15, if younger than 25) and to whom the regional Public Employment Services (PES) did not offer any counselling pathway or training in the preceding two years. Participation in the programme was mandatory.
In 2005, the PES launched a first call for tenders to procure these services to the private sector. This call aimed at increasing capacity and at enhancing the efficiency in the delivery of these employment services. In this way, 6,000 counselling and training pathways were contracted out to private providers, FPOs and NPOs, between January 1, 2006 and December 31, 2009. Based on a sample of 1,981 of these pathways assigned to the private sector (1,167 to FPOs and 814 to NPOs), 8,840 pathways provided in-house by the PES and 5,336 unemployment spells that ended before the treatment started, we evaluated the effectiveness of the overall programme as well as the relative effectiveness of the programme between the three providers.
At the start of the treatment median elapsed unemployment durations was as high as 46.5 months. This very disadvantaged target group hardly left unemployment in the counterfactual of no treatment: One year later 91.2% would still have been unemployed. One year after the start of programme participation (unconditional on the provider type) the exit rate of these individuals was raised by 21.6 percentage points (pp). About half of the enhanced exits from unemployment were withdrawals from the labour force, presumably36 induced by a (threat of) a sanction in case of noncompliance. Qualitatively, this effect is in line with the existing literature, but the size of the effect seems higher than that found in other studies. We believe that the large magnitude is related to the fact that we measure the combined effect of programme participation and the impact induced by its mandatory nature. We argued that it may be also related to the fact that the target group was particularly disadvantaged. For, in recent meta-analysis Card, Kluve and Weber (2015) show that job search assistance and sanction programmes appear to be relatively more successful for disadvantaged participants.
We also find that the programme overall speeds up, for those who found a job, the return back to unemployment by 5 months. However, the effect on unemployment duration dominates this effect. Rel-ative to the counterfactual of no treatment, the programme increased the share of time spent in employ-ment during the first unemployment-work cycle by 29 percentage points (pp).
In contrast to the existing literature, which finds either no significant differential effect of private providers or a negative impact on the job finding rate, our analysis does find that relative to the PES, FPOs are more effective in bringing the unemployed back to work, but the improvement is relatively small. One year after assignment to FPOs the job finding rate of unemployed significantly increases by 2.8 pp. In addition, for those who found a job, the rate of return to unemployment is postponed by 1.4 months. This significantly increases the share of time spent in employment during the first unemployment-work cycle by 4 pp. Treatment by FPOs also slightly increases withdrawals from the labour force, but this effect is not significant at the 5% level. By contrast, in line with the existing evidence on private providers
36 With the available data it was not possible to identify the degree of noncompliance and extent to which sanctions were im-posed.

WSE REPORT / 47
in general, NPOs do not perform significantly better (or worse) than the PES.
FPOs are also found to outperform NPOs slightly, but this differential effect is never statistically signifi-cant at the 5% level. The job finding rate increases by 1.5 pp, and the return to employment is delayed by 2.0 months. Together, this increases the share of time spent in employment by 3 pp and this effect is only marginally above the threshold of 5% statistical significance. There is no difference in the with-drawal rate from the labour force between FPOs and NPOs.
Even if these differential effects are not large, they matter if one considers that the average ex-post (taking the performance payment into account) unit price of a counselling or training pathway of an FPO was 14.4% and 11.2% lower than, respectively, that of an NPO or of the reference price of the PES. NPOs could actually charge a higher price than FPOs because they were exempted from the 21% VAT while the FPOs were not. We advanced a number of explanations why the FPOs could be more efficient than the non-profit (private or public) providers. First, these results are in line with recent research (Ashraf, Bandiera and Kelsey 2014; Ashraf, Bandiera and Lee 2015), which finds that in case of a pro-social mission (such as the provision of employment services to the long-term unemployed), employing material incentives could, in fact, (i) motivate agents to perform better and (ii) attract talented agents who also perform well in the non-incentivised dimension. This means that the profit motive need not crowd out pro-social motivation. Second, in contrast to the NPOs, the FPOs were new in the market and hence had more incentives to build a good reputation. Third, because the FPOs were larger than the NPOs, they could have benefited from economies of scale. Fourth, the FPOs systematically made use of a cheaper counselling technology than did NPOs, which privileged group to individual meetings and which was apparently more cost effective in the quality dimensions of the service provision that we measured in this study. Further research is required to determine whether these factors are intrinsically linked to the provider type (profit, non-profit or public) or, rather, are factors that may confound the causal relationship.
In spite of the low powered payment scheme (70% of the unit price was fixed), we found some evidence of opportunistic behaviour of the private providers (both FPOs and NPOs) in that they appeared to have maximised the performance pay by concentrating the treatment on the least employable clients and to park the most employable clients. However, this opportunistic behaviour has reinforced the effective-ness of the private providers rather than reducing it, because the treatment was found to be most ef-fective for the least employable group.
The finding that the payment scheme has reinforced effectiveness may, however, be a coincidence. One of the primary difficulties in the designing of performance payment schemes is finding a good measure of performance on which to base the payment. For the provision of employment services payment schemes based on relative performance may work better than on absolute performance to the extent that the composition of the clientele and the state of the labour market does not differ between providers. This could be realised by randomly assigning the clientele to different providers in the same region and then, basing the payment on the relative performance of these providers within a region. This is an avenue for further research.
This study is, to the best of our knowledge, the first to show that the contracting out of employment services can improve the performance of the PES and, in particular, that FPOs can perform – be it moderately – better than both the PES and NPOs, even if the quality of the service provision is difficult to measure. Nevertheless, in this comparison we did not take into account the organisational cost of the public tender. These amount about 14% of the expenditures made to the external providers (De-visscher et al. 2009, p.232) and, hence, eliminate roughly the cost advantage of the FPOs relative to

WSE REPORT / 48
the estimated costs of in-house provision. This clarifies that large efficiency gains cannot be made by the contracting-out of employment services.
Acknowledgements
We thank Céline Urbain for her excellent research assistance, and Muriel Dejemeppe, Pierre Koning and the participants of the research seminar at IRES (Université catholique de Louvain) for their valua-ble comments. We are also grateful to Corry Verhaest and Debbie Sanders for the numerous questions they answered about the institutional context and the data registrations. We are obliged to the Flemish PES (“VDAB”) and Geert Degraeve for the delivery of the data. We gratefully acknowledge financial support from the Flemish government through the “Policy Research Centre Work and Social Economy”. The views expressed are those of the authors and not of the Flemish government. The authors are fully responsible for all remaining errors in this research.
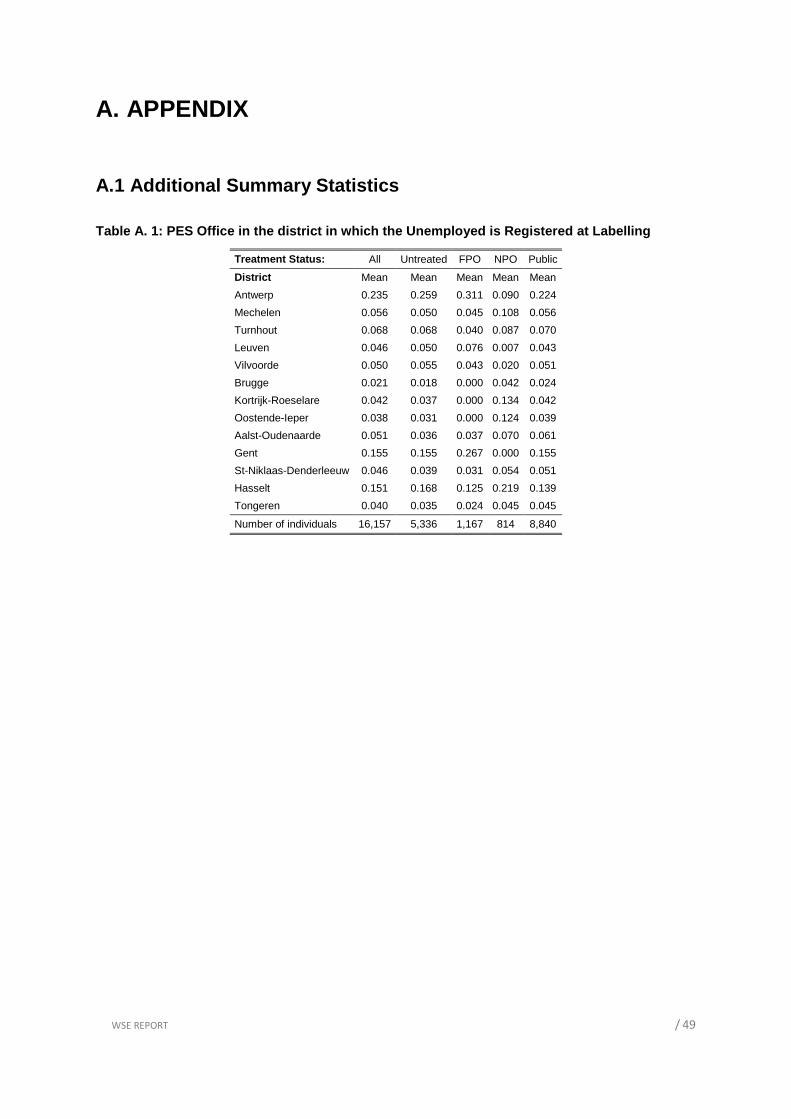
WSE REPORT / 49
A. APPENDIX
A.1 Additional Summary Statistics
Table A. 1: PES Office in the district in which the Unemployed is Registered at Labelling
Treatment Status: All Untreated FPO NPO Public
District Mean Mean Mean Mean Mean
Antwerp 0.235 0.259 0.311 0.090 0.224
Mechelen 0.056 0.050 0.045 0.108 0.056
Turnhout 0.068 0.068 0.040 0.087 0.070
Leuven 0.046 0.050 0.076 0.007 0.043
Vilvoorde 0.050 0.055 0.043 0.020 0.051
Brugge 0.021 0.018 0.000 0.042 0.024
Kortrijk-Roeselare 0.042 0.037 0.000 0.134 0.042
Oostende-Ieper 0.038 0.031 0.000 0.124 0.039
Aalst-Oudenaarde 0.051 0.036 0.037 0.070 0.061
Gent 0.155 0.155 0.267 0.000 0.155
St-Niklaas-Denderleeuw 0.046 0.039 0.031 0.054 0.051
Hasselt 0.151 0.168 0.125 0.219 0.139
Tongeren 0.040 0.035 0.024 0.045 0.045
Number of individuals 16,157 5,336 1,167 814 8,840
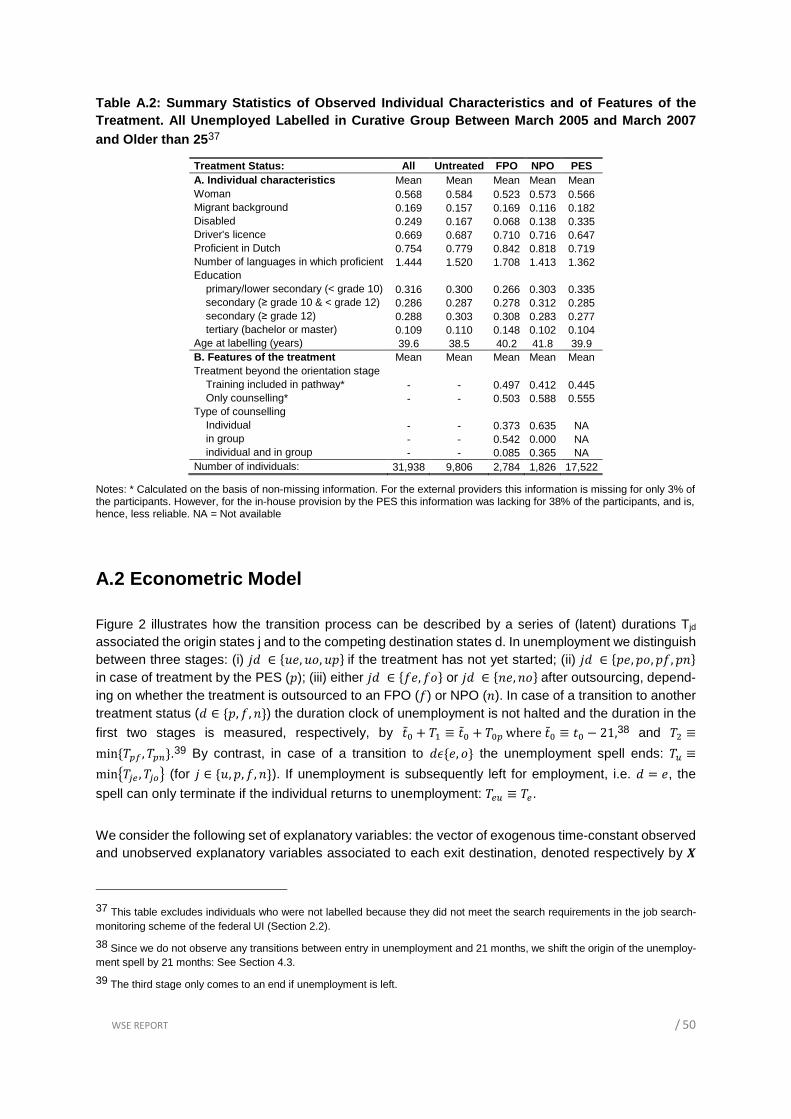
WSE REPORT / 50
Table A.2: Summary Statistics of Observed Individual Characteristics and of Features of the Treatment. All Unemployed Labelled in Curative Group Between March 2005 and March 2007 and Older than 2537
Treatment Status: All Untreated FPO NPO PES A. Individual characteristics Mean Mean Mean Mean Mean Woman 0.568 0.584 0.523 0.573 0.566 Migrant background 0.169 0.157 0.169 0.116 0.182 Disabled 0.249 0.167 0.068 0.138 0.335 Driver's licence 0.669 0.687 0.710 0.716 0.647 Proficient in Dutch 0.754 0.779 0.842 0.818 0.719 Number of languages in which proficient 1.444 1.520 1.708 1.413 1.362 Education primary/lower secondary (< grade 10) 0.316 0.300 0.266 0.303 0.335 secondary (≥ grade 10 & < grade 12) 0.286 0.287 0.278 0.312 0.285 secondary (≥ grade 12) 0.288 0.303 0.308 0.283 0.277 tertiary (bachelor or master) 0.109 0.110 0.148 0.102 0.104 Age at labelling (years) 39.6 38.5 40.2 41.8 39.9 B. Features of the treatment Mean Mean Mean Mean Mean Treatment beyond the orientation stage Training included in pathway* - - 0.497 0.412 0.445 Only counselling* - - 0.503 0.588 0.555 Type of counselling Individual - - 0.373 0.635 NA in group - - 0.542 0.000 NA individual and in group - - 0.085 0.365 NA Number of individuals: 31,938 9,806 2,784 1,826 17,522
Notes: * Calculated on the basis of non-missing information. For the external providers this information is missing for only 3% of the participants. However, for the in-house provision by the PES this information was lacking for 38% of the participants, and is, hence, less reliable. NA = Not available
A.2 Econometric Model
Figure 2 illustrates how the transition process can be described by a series of (latent) durations Tjd associated the origin states j and to the competing destination states d. In unemployment we distinguish between three stages: (i) �� ∈ ��, ��, � �if the treatment has not yet started; (ii) �� ∈ � , �, �, �� in case of treatment by the PES ( ); (iii) either �� ∈ ��, ��� or �� ∈ ��, ���after outsourcing, depend-ing on whether the treatment is outsourced to an FPO (�) or NPO (�). In case of a transition to another treatment status (� ∈ � , �, ��) the duration clock of unemployment is not halted and the duration in the
first two stages is measured, respectively, by �̃� + �� ≡ �̃� + ���where�̃� ≡ �� − 21,38 and �" ≡min���& , ��'�.39 By contrast, in case of a transition to �(�, �� the unemployment spell ends: �) ≡min*�+, , �+-. (for � ∈ ��, , �, ��). If unemployment is subsequently left for employment, i.e. � = , the
spell can only terminate if the individual returns to unemployment: �,) ≡ �,.
We consider the following set of explanatory variables: the vector of exogenous time-constant observed and unobserved explanatory variables associated to each exit destination, denoted respectively by 0
37 This table excludes individuals who were not labelled because they did not meet the search requirements in the job search-monitoring scheme of the federal UI (Section 2.2).
38 Since we do not observe any transitions between entry in unemployment and 21 months, we shift the origin of the unemploy-ment spell by 21 months: See Section 4.3.
39 The third stage only comes to an end if unemployment is left.

WSE REPORT / 51
and 1 ≡ 23, , 3-, 3� , 3& , 3' , 3)4, and a strictly exogenous (or “external”) time-varying explanatory variable
observed from the calendar time of entry in unemployment 5� until the end of the observation period 5�,
denoted by �6(5)�78797: .40 The time-constant observed variables retained for the analysis are the individ-
ual characteristics reported in Table 1 to which the square of age and the unemployment rate in the province of living at the start of the unemployment spell are added. The time-varying explanatory vari-able is the provincial unemployment rate.
Assumptions
We assume that, for a given origin state and conditional on observed and unobserved explanatory variables, and on the duration and exit destination in the previous stages of unemployment, all latent unemployment durations are independent of each other within each stage:
A1.1: ∀� ≠ = ∈ �, �, �:�)? ⫫ �)A|����6((((5)))) = B((((5))))����78797: , X=x, V
A1.2: ∀� ≠ = ∈ �, �, �, ��:��? ⫫ ��A|����6((((5)))) = B((((5))))����78797: , X=x, V, �� = ��
AC.3: ∀� ∈ ��, �� ∧ � ≠ = ∈ �, ��:�+? ⫫ �+A |�6(5) = B(5)�78797: , X=x, V, �� = ��, �" = ��+ = �"
These assumptions together with the assumption of sequential exogeneity, which is equivalent to as-suming “no anticipation”, and the assumption that all selection effects can be captured by the observed and unobserved explanatory variables, the joint conditional distribution �� ≡ ���, �" = ��+ , �) =�+, , �,)|�) > �̃�, �6(5) = B(5)�78797: , X=x, V for � ∈ ��, ��can be expressed as the product of the following
conditional distributions:2��|�) > �̃�, �6(5) = B(5)�78797: , X=x, V4, 2�" = ��+|�) > �̃�, �� = ��, �6(5) =B(5)�78797: , X=x, V4,2�) = �+,|�) > �̃�, �" = ��+ = �", �� = ��, �6(5) = B(5)�78797: , X=x, V4, and 2�,)|�) =�+, = �) > �̃�, �" = ��+ = �", �� = ��, �6(5) = B(5)�78797: , 0 = H, 14 for � ∈ ��, ��. Similar, but shorter, ex-
pressions are obtained in case of right censoring in unemployment, of exits from the labour force, no outsourcing, or no participation in any treatment.
We further assume that the destination-specific unobserved explanatory variables capture all unob-served determinants for all latent durations with a particular destination:
IJ.1: ∀� ∈ �, �, �:��? ⫫ 1K?|�) > �̃�, �6(5) = B(5)�78797: , X=x, 3?
A2.2: ∀� ∈ �, �, �, ��:��? ⫫ 1K?|�) > �̃̃ ̃�̃, �� = ��, ����6((((5)))) = B((((5))))����78797: , X=x, 3?
IJ.3: ∀� ∈ ��, �� ∧ � ∈ �, ��:�+? ⫫ 1K? |�) > �̃�,�� = ��, �" = ��+ = �", �6(5) = B(5)�78797: ,X=x, 3?
IJ. L: ∀� ∈ ��, ��:�,) ⫫ 1K? |�) > �̃�,(�� = ��)M(�) > �̃� + ��), (�" = ��+ = �")M(�) > �̃� + �� +�"), �6(5) = B(5)�78797: , X=x, 3?
40 The presence of these strictly exogenous time-varying explanatory variables facilitates identification. In a single-risk framework Brinch (2007) shows that then the Mixed Proportional Hazard (MPH) assumption is no longer necessary for identification.

WSE REPORT / 52
where 1K? ≡ (3�, …3?K�, 3?O�, … , 3P), i.e. all the unobserved variables except for destination �, and where M(. ) denotes the indicator function.
The aforementioned conditional distributions of the (latent) durations can be characterised by the cor-responding conditional transition rates ℎ+?(�R|�̃�, ��M(� ≠ �), �"M(� ∈ ��, �, �), �)M(� = ), B(5̃� + �R +��M(� ∈ � , �, �� + ��M(� ∈ ��, ��)) + �)M(� = )), H, S?) for T ∈ �1,2, �, �, where 5̃� = 5� + 21, T = 1if � = and T = 2if � ∈ ��, ��, and where the provincial unemployment rate B(5) is only contemporaneously related to the hazard rate. We assume that the lagged realised durations (��, �", �)) enter the specifica-tion linearly, and that the hazard rates are of the Mixed Proportional Hazard (MPH) form except for the terms capturing the treatment effects:
IU. C:V�ℎ��2��W�̃�, B(5̃� + �� + ��), H, S�4 = X��(��) + �̃�Y�� + B(5̃� + �� + ��)Z�� + H[\�� + S�
IU. J:V�ℎ�?(�"|�̃�, ��, B(5̃� + �� + �� + �"), H, SA) = X�?(�") + (�̃� + ��)Y�? + ��]�?+ B(5̃�+�� + �� + �")Z�? + H[\�? + S? , ��^� ∈ ��, �� IU. U: V� ℎ+?(�)|�̃�, ��, �", B(5̃� + �)), H, S?) =X)?(�)) + B(5̃� + �))Z)? + H[\)? +M(�) > �̃� + ��)_)?� + M(�) > �̃� + �� + �")_)?+ + S? ��^ � ∈ ��, , �, �� ∧ � ∈�, ��
IU. L: V� ℎ,)(�,|�), �̃�, ��, �", =, B(5̃� + �) + �,), H, S))=X,)(�,) + �)Y,) + B(5̃� + �) + �,)Z,) +H[\,) + M(�) > �̃� + ��)_,)� + M(�) > �̃� + �� + �")_,)A + S)��^ = ∈ ��, �� where X+?(�R) for T ∈ �1,2, �, � is the logarithm of the baseline hazard, and where we impose for � ∈��, , �, �� that X+?(�)) = X)?(�)), Z+? = Z)?, and +̀? = `)?. _+?� measures the treatment effect of the PES
( ) when the origin state is unemployment (� = �) or employment (� = ) and the destination state is either employment or out of the labour force (� ∈ �, ��) if � = �, or unemployment (� = �) if � = . _+?A
is the corresponding treatment effect of FPO (= = �) or of NPO (= = �) in deviation from _+?� . We allow
also for a more general model in which the treatment effects depend on the linear index of a subset HC ⊂ H of the observed covariates (HC[ \+?), although not for the transition � (see Section 5):
(A.1) _+?� 2HC[ \+?4 = 2HC[ \+?4_+?b� + _+?�� , (A.2) _+?A2HC[ \+?4 = 2HC[ \+?4_+?�A +_+?RA , = ∈ ��, �� for �� ∈ ��, ���. Finally, we assume that the unobserved and observed covariates are independent
A4: 1 ⫫ 0, and that the baseline hazards and time-varying covariates are piecewise constant:
WSE REPORT / 53
A5.1: X+?(�) = X+?R , cRdeK� ≤ � < cRde
If. J:B25̃� + �+�̃�M(� ∈ � , �, ��)+��M(� ∈ ��, ��) + �)M(� = )4 = BRde , cRdeK� ≤ � < cRde
for �� ∈ �� , �, �, �, ��, ��, and where g0, c�dei , … gcRdeK�, cRdei , … g�jdeK�, ∞i define l+? duration in-
tervals and BRde measures the median provincial unemployment rate in the interval, or between the start
of the interval and the month of exit, if exit occurs before the end of the interval. Recall that by the aforementioned normalization zero in the first duration interval corresponds with an unemployment du-ration of 21 months, since this is the shortest unemployment duration that we observe in the data. In addition, since by definition employment spells last minimum 3 months, zero for the employment dura-tion intervals corresponds with 3 months, because employment durations can by definition never be less than 3 months.
Identification
Horny and Picchio (2010) show that under the aforementioned assumptions without time-varying ex-planatory variables, but with sufficient variation in the continuous observed regressors and the auxiliary assumption that the first moment of the mixing distribution is finite, a competing risks model with lagged duration dependence is non-parametrically identified without any exclusion restrictions. Similar results are found more recently by Drepper and Effraimidis (2015). In view of the presence of a time-varying covariate (Brinch 2007) and the novel exclusion restrictions mentioned in Section 4.2, we therefore argue that identification does not crucially hinge on the MPH assumption.
The aforementioned identification results of duration models are derived in a continuous time frame-
work. By contrast, in our data the information on (un)employment duration41 is grouped on a monthly basis. As shown in Ridder (1990), non-parametric identification with discrete duration data requires more structure on the systematic parts of the unemployment and employment hazards. The assumption that the linear index in the explanatory variables takes on every value in ℝ, is sufficient to identify the grouped baseline hazards from the observed and unobserved heterogeneity. Based on an extensive Monte Carlo analysis, Gaure, Røed, and Zhang (2007) report that, despite the time grouping of duration, the true structural parameters can still be robustly recovered from the observed data, to the extent that the discreteness of data measurement is explicitly taken into account when setting up the likelihood function.
Likelihood Function
We first derive the likelihood for a flow sample conditional on the unobserved explanatory variables 1. Recall, since the data are sampled at labelling when unemployment duration is at least 21 months, we shift the origin of the unemployment spell by 21 months (see Section 4.3). Subsequently, we integrate out the unobserved heterogeneity. Finally, we follow the conditional likelihood approach proposed by Lancaster (1979), Nickell (1979) and Ridder (1984) to derive the likelihood for the left truncated obser-vations at labelling, i.e. having an unemployment duration of strictly more than 21 months at labelling.
41 By contrast, the starts of treatments are measured on a daily precision.

WSE REPORT / 54
Since the latent durations Tjd are assumed to be sequentially exogenous conditional on the observed and unobserved covariates the likelihood contribution for an individual entering the 21st month of unem-ployment and observed with a sequence of completed durations (n+? = 1) is, by the chain rule, given by
the product of densities of these latent durations, similar to the product that we obtained above for the joint conditional distribution of �� ≡ ���, �" = ��+ , �) = �+, , �,)|�) > �̃�, �6(5) = B(5)�78797: , X=x, V for � ∈��, ��. If the observation is right censored at a particular duration (∑ n+?∀? = 0), then the last term in the
product is the survivor function p+(. |. )in the origin state �. Making use of assumptions A5.1 and A5.2,
and ignoring for simplicity in the notation the dependence on explanatory variables and lagged dura-tions, i.e. denoting this dependence by “.”, then the survivor function can be expressed as
(A.3) p+(�|. ) = q g−M r� ≥ ��di∑ ∑ ℎ+?(cs|. )(csO� − cs)∀?RdeK"s8� − ℎ+? rcRdeK�t. i r� − cRdeK�iu for cRdeK� ≤ � < cRde and �� ∈ �� , �, �, �, ��, ��. Since the density function of a latent duration Tjd is given by the product of the hazard function ℎ+?(.|.)
and the survivor function p+(. |. ), the likelihood contribution of an individual sampled in the flow can thus
be expressed as follows:
(A.4) v&(w, x|. ; z) = {ℎ)�(��|. )|ℎ�&(�"|. )}~�ℎ�'(�"|. )}~�p�(�"|. )��(79O�9�7∗)�}�~ p)�(��|. ) ∙ � gℎ),(=) − ∆)|. ) � ℎ,)(=, − ∆,|. )}�� p,(=, − ∆,|. )�∆,�� u}��∆�∗� ∙ ℎ)-(=) − ∆)|. )}��p) . (=) − ∆)|. )�∆)
where p)�(��|. ) is the survivor function of latent duration �)� = ��, p) . (=) − ∆)|. ) ≡p),(=) − ∆)|. ). p)-(=) − ∆)|. ), =) (=,) denotes the upper bound of the month in which unemployment (employment) is left and ∆)∗= =���1,=) − �̃�, =) − �̃� − ��, =) − �̃� − �� − �"� is the width of the interval
in which unemployment is left,42 so that �) ∈ [=) − ∆)∗ , =)) and �, ∈ [=, − 1, =,); w = (��, �", =) , =,),x = 2n��, n�& , n�', n), , n)- , n,)4, 5∗ is December 1, 2005, the date from which labelled individuals are for
the first time at risk of being outsourced to an external provider, and z is the vector of unknown param-eters.
Making use of assumptions A.5.1-A.5.2, we can find a closed form solution for the integrals in (A.4):
(A.5) v&(w, x|. ; z) = {ℎ)�(��|. )|ℎ�&(�"|. )}~�ℎ�'(�"|. )}~�p�(�"|. )��(79O�9�7∗)�}9~ p)�(��|. ).
42 The width of a duration interval is equal to one month, except if the individual is labelled (=) − �̃� < 1), starts a treatment of the PES (=) − �̃� − �� < 1) or an external provider (=) − �̃� − �� − �" < 1) in the month of exit. Notice, in contrast to the unem-ployment and employment duration, we know the exact duration at which an individual is labelled or treated.

WSE REPORT / 55
�����2=) − ∆)∗ W.4|��2=, − 1W.4K��2=,W.4������2=, − 1W.4(:����)�������2=) − ∆)∗ W.4������2=) − ∆)∗ W.4O���2=) − ∆)∗ W.4 [p).(=) − ∆)∗ |. � −
p).�=)|. ����}��O}��� ∙
p).�=) − ∆)∗ |. ��K�}��O}��� The likelihood function in (A.5) is conditional on the unobserved explanatory variables 1. Given that the model is non-parametrically identified, we follow Heckman and Singer (1984) by integrating out the unobservables based on the assumption that the heterogeneity distribution is discrete with a finite and, a priori, unknown M number of points of support. On the basis of Monte Carlo simulations Gaure, Røed, and Zhang (2007) found that the number of points of support is most reliably chosen by minimizing the Akaike information criterion. We follow this recommendation. The probabilities that are associated with the points of support sum to 1 and, ∀= = 1,… ,� are denoted by
(A.6) A = Pr23, = S,A , 3- = S-A , 3� = S�A , 3& = S&A , 3' = S'A , 3) = S)A4 ≡ �^�1 = �A� and specified as logistic transforms:
(A.7) A = ,b�����∑ ,b������� : , = = 1,…�, ¡¢ = 0
Consequently, the likelihood contribution of an individual sampled in the flow is then
(A.8) v&�w, x|. ; z, £� = ∑ Av&�w, x|. , 1 = �A; z�¢A8�
where ¤ = �¡�, … , ¡¢�. For an individual in the stock sample, i.e. for whom the unemployment duration exceeds 21 months at labelling, the conditional likelihood contribution is obtained by dividing the likelihood contribution of the flow sample by the probability of surviving �̃� ≡ �� − 21 > 0 months at labelling:
(A.9) v¥2w, xW�̃�,. ; z, £4 = ∑ ��¦�2w, xW., 1 = �A; z4�� :∑ ���� : ����§9|.,18���
The log-likelihood function sums the logarithms of the likelihood contributions (A.5) and (A.9) of the individuals in the flow and in the stock samples.
A.3 Simulation Method
The simulation methodology is similar to the one proposed by Crépon, Dejemeppe and Gurgand (2005). The aims of the simulations are to obtain (i) goodness-of-fit of statistics of the estimated model and (ii) summary statistics of various counterfactual evaluations. For the goodness-of-fit we simulate the model

WSE REPORT / 56
for the complete sample that was used in the estimations, while for the counterfactual evaluations we do this for the various sub-samples that have undergone the treatment under consideration: the overall treatment, which always starts with the orientation phase or intake by the PES, or the treatment provided by a FPO or a NPO, which starts at the assignment to the external provider. For the counterfactual analysis we contrast the simulated outcomes obtained by setting the corresponding treatment indicator to one to those resulting when all treatment indicators are zero (when evaluating the overall treatment effect relative to the counterfactual of no treatment), or when an alternative treatment indicator is one (that of the PES or the NPO (FPO) in case of treatment by the FPO (NPO)). As such we obtain “treat-ment effects on the treated”. Because the simulated durations may take on very large values, we report the median treatment effects on the treated (MTT) rather than the average treated effects on the treated (ATT). In addition, since a number of points of support of the unobserved heterogeneity distribution approach minus infinity, in the simulations some durations approach plus infinity. For cases in which we include these durations in the statistics (the unconditional distributions), we set these to the same very large value. Otherwise, they are ignored.
For each of the aforementioned objectives the simulation is repeated 999 times on the retained (sub-) sample. By calculating summary statistics (e.g., the median duration, or the fraction left to a particular destination over a fixed period of time) for each of these 999 simulations we can construct 95% CI intervals of these statistics by selecting the 5th and 95th percentiles of these 999 simulated statistics. These then can be compared to the corresponding statistic for the observed data in the case of the goodness-of-fit analysis, or to the median treatment effect in case of the counterfactual treatment anal-ysis.
The simulations proceed by the following steps:
1. Draw a vector of parameters under the assumption that the true vector is jointly Normally dis-tributed with the mean equal to the point estimates and variance to the estimated variance-covariance matrix of these parameters. By doing so, the 95% CI takes the precision of the estimation into account.
2. Based on this vector of parameters, randomly draw for each individual in the retained sample a six-dimensional vector of points of support from the distribution of unobserved heterogeneity at sample selection. Notice that this distribution is different for each of these (sub-)samples, since, as a consequence of the dynamic sorting process, it depends on the elapsed unemploy-ment duration. This is even the case when we consider the complete sample, because of the presence of stock sampling. We will explain this further below.
3. Based on this information calculate for each individual in the sample the value of the transition
intensity to all destinations at each (un)employment duration.43 These values allow randomly drawing for each sampled individual a latent duration to any of the destinations at risk at that moment. Initially, at the moment of labelling, 3 latent durations are drawn: to employment (), out of the labour force (�) or to treatment by the PES ( ). If treated by the PES, 4 latent durations
43 In the goodness-of-fit analysis of exits during the unemployment spell we take the effect of the time-varying unemployment rate into account, except for cases in which the simulated duration exceeds the realised one. In these cases we fix the unem-ployment rate to the one observed at the end of the realised spell. For the goodness-of-fit of the cumulative exit rate from em-ployment back to unemployment, we fix for simplicity the unemployment rate to the average in the corresponding duration inter-vals. For the counterfactual analysis we fix the unemployment rate to its value at the start of the treatment both for in case of treatment and in the counterfactual of no treatment.

WSE REPORT / 57
are drawn: to employment (), out of the labour force (�), to treatment by an FPO (�) or by an NPO (�). Finally, if treated by either an FPO or an NPO two latent durations are drawn: either to employment (), out of the labour force (�). A draw of a latent duration is obtained by ran-domly drawing a value for the conditional probability of survival. The survival probability is con-ditioned upon surviving at least �+K months in the origin state � ∈ �0, , �, �, �, because we at the
start of each simulation the individual has always already been in that state for some period. Indeed, individuals are sampled at labelling, moment at which the individual has already been unemployed for at least 21 months. Moreover, since each different treatment state (PES, FPO or NPO) affects the transition intensities while participants are assumed to remain unemployed, each time an individual enters a treatment a new unemployment duration must be drawn con-ditional on the elapsed unemployment duration at the start of this treatment. Since the condi-tional survivor function is always bracketed by the zero-one interval, a random value is obtained by randomly drawing a number ̂ from the uniform [0,1] distribution. The corresponding duration is then found by solving the equality of the conditional survivor function to ^ for the unknown latent duration �¨© for origin state � and destination state �. To illustrate how this works, we
ignore for notational simplicity the dependence of the transition intensities on the time-varying unemployment rate, the lagged dependent variables and the treatment indicators. In that case the aforementioned equality takes the following form:
^ = q ª− exp2q[ +̀? + S?4 exp rX+?sdei r�sde − �+?K i + ® exp2X+?¯4 2�¯ − �(¯K�)4RdeK�¯8sdeO�
+ exp rX+?Rdei r�+? − �(RdeK�)i°± where �+?K ∈ [�2sdeK�4, �sde) and �+? ∈ [�2RdeK�4, �Rde). By inverting this relation, one obtains:
exp rX+?sdei r�sde − �+?K i + ® exp2X+?¯4 2�¯ − �(¯K�)4RdeK�
¯8sdeO� + exp rX+?Rdei r�+? − �(RdeK�)i= −log(^)exp2−q[ +̀? − S?4
This equation can be solved for �+? by progressively increasing T¨© from V¨© to l¨© until the
equality is satisfied.
4. Once latent durations for all possible destinations in the considered origin state have been drawn, the minimum of these latent durations defines the realised duration and destination state. The other latent durations are right censored. Subsequently, the destination state be-comes origin state and we progress as described in point 3. Continue until an absorbing state is entered, i.e. out of the labour force or re-entry in unemployment after an employment spell. We do not right censor observations at the end of the observation period. This requires assum-ing that the baseline hazard remains constant in the last duration interval and that the provincial unemployment rate remains fixed at the last known value for the considered individual (see footnote 38). In this way the issue of right censoring is avoided when producing summary sta-tistics of the simulated duration distributions. Nevertheless, one still need to take into account that the duration is infinite for those individuals for whom a point of support of the unobserved heterogeneity distribution has been drawn that tends to minus infinity.

WSE REPORT / 58
5. Based on the simulated durations the summary statistics of interest can be calculated for the retained sample.
6. Go back to the first step until 999 simulations have been performed.
7. Based on the 999 summary statistics one can easily calculate the median of these statistics and construct empirical 95% CI’s.
In point 2 we mentioned that the distribution of unobserved heterogeneity depends on the elapsed duration in the origin state of interest at sample selection. For instance, consider the sample selected at labelling, i.e. when the elapsed unemployment duration is �� ≥ 21. The estimated distribution of un-observed heterogeneity applies to an individual who has been 21 months unemployed, since exits be-fore these 21 months are not observed in the data. The unobserved heterogeneity distribution for an individual for whom the elapsed unemployment duration strictly exceeds 21 months at labelling differs, because it is affected by dynamic sorting, i.e. individuals with a low (unobserved) likelihood of leaving unemployment are more likely to remain unemployed for more than 21 months. Hence, the distribution of unobserved heterogeneity for an individual with an elapsed duration equal to �� > 21 is characterised by the following probabilities µA for = = 1,… ,� = 11:
µA = ����(�9K"�|.,18��)∑ ���� : ��(�9K"�|.,18��) .
Hence, we first calculate these modified probabilities before assigning unobserved mass points to indi-viduals. In case of the counterfactual evaluations we similarly modify these probabilities to take the elapsed duration at the start of the considered treatment into account.
A.4 Complete Estimation Results
Table A. 2: The Complete Estimation Results
Proportional Effect of Hazard Model (i) Model (ii) Model (iii)
A. Transition from U to E
Treatment PES (ref.) 0.809*** (0.041) 1.717*** (0.068) 1.639*** (0.077)
Treatment FPO 0.410*** (0.065) 0.228* (0.116) 0.294*** (0.105)
Treatment NPO 0.311*** (0.082) 0.028 (0.119) 0.187 (0.127)
Treatment PES * Linear index -0.458*** (0.074)
Treatment FPO * Linear index -0.222* (0.125)
Treatment NPO * Linear index -0.314* (0.171)
District: Mechelen -0.269*** (0.082) -0.106 (0.103) -0.040 (0.099)
District: Turnhout -0.085 (0.082) -0.124 (0.095) -0.159* (0.097)
District: Leuven 0.480*** (0.161) 0.354*** (0.130) 0.400*** (0.136)
District: Vilvoorde 0.614*** (0.156) 0.393*** (0.131) 0.441*** (0.137)
District: Brugge 0.428** (0.173) 0.135 (0.164) 0.213 (0.161)
District: Kortrijk-Roeselare 0.315** (0.148) 0.248* (0.132) 0.288** (0.135)
District: Oostende-Ieper 0.453*** (0.150) 0.410*** (0.132) 0.421*** (0.136)
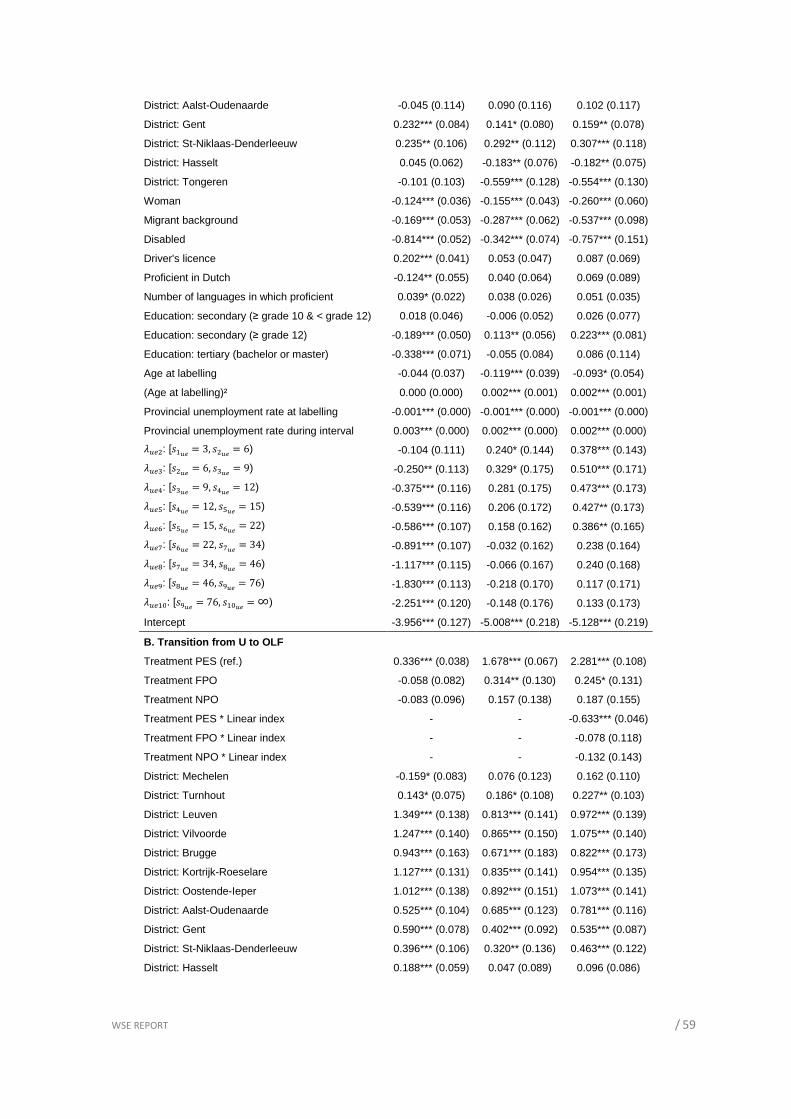
WSE REPORT / 59
District: Aalst-Oudenaarde -0.045 (0.114) 0.090 (0.116) 0.102 (0.117)
District: Gent 0.232*** (0.084) 0.141* (0.080) 0.159** (0.078)
District: St-Niklaas-Denderleeuw 0.235** (0.106) 0.292** (0.112) 0.307*** (0.118)
District: Hasselt 0.045 (0.062) -0.183** (0.076) -0.182** (0.075)
District: Tongeren -0.101 (0.103) -0.559*** (0.128) -0.554*** (0.130)
Woman -0.124*** (0.036) -0.155*** (0.043) -0.260*** (0.060)
Migrant background -0.169*** (0.053) -0.287*** (0.062) -0.537*** (0.098)
Disabled -0.814*** (0.052) -0.342*** (0.074) -0.757*** (0.151)
Driver's licence 0.202*** (0.041) 0.053 (0.047) 0.087 (0.069)
Proficient in Dutch -0.124** (0.055) 0.040 (0.064) 0.069 (0.089)
Number of languages in which proficient 0.039* (0.022) 0.038 (0.026) 0.051 (0.035)
Education: secondary (≥ grade 10 & < grade 12) 0.018 (0.046) -0.006 (0.052) 0.026 (0.077)
Education: secondary (≥ grade 12) -0.189*** (0.050) 0.113** (0.056) 0.223*** (0.081)
Education: tertiary (bachelor or master) -0.338*** (0.071) -0.055 (0.084) 0.086 (0.114)
Age at labelling -0.044 (0.037) -0.119*** (0.039) -0.093* (0.054)
(Age at labelling)² 0.000 (0.000) 0.002*** (0.001) 0.002*** (0.001)
Provincial unemployment rate at labelling -0.001*** (0.000) -0.001*** (0.000) -0.001*** (0.000)
Provincial unemployment rate during interval 0.003*** (0.000) 0.002*** (0.000) 0.002*** (0.000) X),": [c��� = 3, c"�� = 6) -0.104 (0.111) 0.240* (0.144) 0.378*** (0.143) X),¸: [c"�� = 6, c¸�� = 9) -0.250** (0.113) 0.329* (0.175) 0.510*** (0.171) X),º: [c¸�� = 9, cº�� = 12) -0.375*** (0.116) 0.281 (0.175) 0.473*** (0.173) X),»: [cº�� = 12, c»�� = 15) -0.539*** (0.116) 0.206 (0.172) 0.427** (0.173) X),½: [c»�� = 15, c½�� = 22) -0.586*** (0.107) 0.158 (0.162) 0.386** (0.165) X),¾: [c½�� = 22, c¾�� = 34) -0.891*** (0.107) -0.032 (0.162) 0.238 (0.164) X),À: [c¾�� = 34, cÀ�� = 46) -1.117*** (0.115) -0.066 (0.167) 0.240 (0.168) X),Á: [cÀ�� = 46, cÁ�� = 76) -1.830*** (0.113) -0.218 (0.170) 0.117 (0.171) X),��: [cÁ�� = 76, c���� = ∞) -2.251*** (0.120) -0.148 (0.176) 0.133 (0.173)
Intercept -3.956*** (0.127) -5.008*** (0.218) -5.128*** (0.219)
B. Transition from U to OLF
Treatment PES (ref.) 0.336*** (0.038) 1.678*** (0.067) 2.281*** (0.108)
Treatment FPO -0.058 (0.082) 0.314** (0.130) 0.245* (0.131)
Treatment NPO -0.083 (0.096) 0.157 (0.138) 0.187 (0.155)
Treatment PES * Linear index - - -0.633*** (0.046)
Treatment FPO * Linear index - - -0.078 (0.118)
Treatment NPO * Linear index - - -0.132 (0.143)
District: Mechelen -0.159* (0.083) 0.076 (0.123) 0.162 (0.110)
District: Turnhout 0.143* (0.075) 0.186* (0.108) 0.227** (0.103)
District: Leuven 1.349*** (0.138) 0.813*** (0.141) 0.972*** (0.139)
District: Vilvoorde 1.247*** (0.140) 0.865*** (0.150) 1.075*** (0.140)
District: Brugge 0.943*** (0.163) 0.671*** (0.183) 0.822*** (0.173)
District: Kortrijk-Roeselare 1.127*** (0.131) 0.835*** (0.141) 0.954*** (0.135)
District: Oostende-Ieper 1.012*** (0.138) 0.892*** (0.151) 1.073*** (0.141)
District: Aalst-Oudenaarde 0.525*** (0.104) 0.685*** (0.123) 0.781*** (0.116)
District: Gent 0.590*** (0.078) 0.402*** (0.092) 0.535*** (0.087)
District: St-Niklaas-Denderleeuw 0.396*** (0.106) 0.320** (0.136) 0.463*** (0.122)
District: Hasselt 0.188*** (0.059) 0.047 (0.089) 0.096 (0.086)
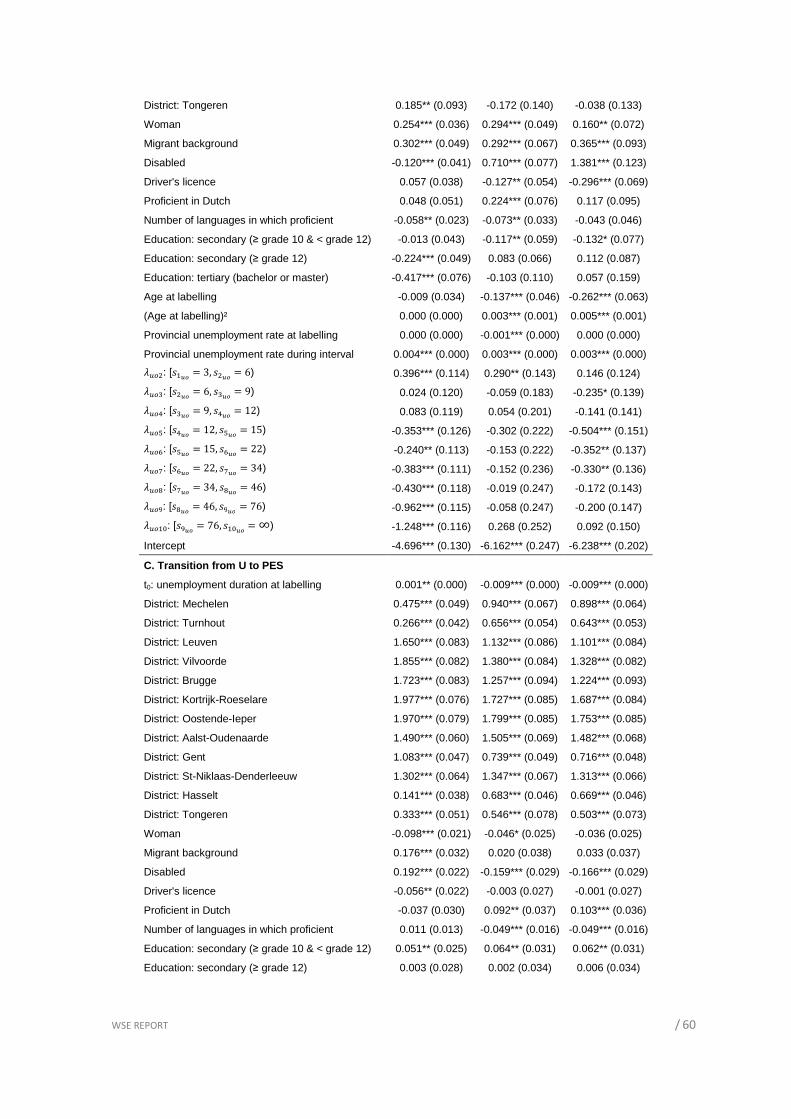
WSE REPORT / 60
District: Tongeren 0.185** (0.093) -0.172 (0.140) -0.038 (0.133)
Woman 0.254*** (0.036) 0.294*** (0.049) 0.160** (0.072)
Migrant background 0.302*** (0.049) 0.292*** (0.067) 0.365*** (0.093)
Disabled -0.120*** (0.041) 0.710*** (0.077) 1.381*** (0.123)
Driver's licence 0.057 (0.038) -0.127** (0.054) -0.296*** (0.069)
Proficient in Dutch 0.048 (0.051) 0.224*** (0.076) 0.117 (0.095)
Number of languages in which proficient -0.058** (0.023) -0.073** (0.033) -0.043 (0.046)
Education: secondary (≥ grade 10 & < grade 12) -0.013 (0.043) -0.117** (0.059) -0.132* (0.077)
Education: secondary (≥ grade 12) -0.224*** (0.049) 0.083 (0.066) 0.112 (0.087)
Education: tertiary (bachelor or master) -0.417*** (0.076) -0.103 (0.110) 0.057 (0.159)
Age at labelling -0.009 (0.034) -0.137*** (0.046) -0.262*** (0.063)
(Age at labelling)² 0.000 (0.000) 0.003*** (0.001) 0.005*** (0.001)
Provincial unemployment rate at labelling 0.000 (0.000) -0.001*** (0.000) 0.000 (0.000)
Provincial unemployment rate during interval 0.004*** (0.000) 0.003*** (0.000) 0.003*** (0.000) X)-": [c��� = 3, c"�� = 6) 0.396*** (0.114) 0.290** (0.143) 0.146 (0.124) X)-¸: [c"�� = 6, c¸�� = 9) 0.024 (0.120) -0.059 (0.183) -0.235* (0.139) X)-º: [c¸�� = 9, cº�� = 12) 0.083 (0.119) 0.054 (0.201) -0.141 (0.141) X)-»: [cº�� = 12, c»�� = 15) -0.353*** (0.126) -0.302 (0.222) -0.504*** (0.151) X)-½: [c»�� = 15, c½�� = 22) -0.240** (0.113) -0.153 (0.222) -0.352** (0.137) X)-¾: [c½�� = 22, c¾�� = 34) -0.383*** (0.111) -0.152 (0.236) -0.330** (0.136) X)-À: [c¾�� = 34, cÀ�� = 46) -0.430*** (0.118) -0.019 (0.247) -0.172 (0.143) X)-Á: [cÀ�� = 46, cÁ�� = 76) -0.962*** (0.115) -0.058 (0.247) -0.200 (0.147) X)-��: [cÁ�� = 76, c���� = ∞) -1.248*** (0.116) 0.268 (0.252) 0.092 (0.150)
Intercept -4.696*** (0.130) -6.162*** (0.247) -6.238*** (0.202)
C. Transition from U to PES
t0: unemployment duration at labelling 0.001** (0.000) -0.009*** (0.000) -0.009*** (0.000)
District: Mechelen 0.475*** (0.049) 0.940*** (0.067) 0.898*** (0.064)
District: Turnhout 0.266*** (0.042) 0.656*** (0.054) 0.643*** (0.053)
District: Leuven 1.650*** (0.083) 1.132*** (0.086) 1.101*** (0.084)
District: Vilvoorde 1.855*** (0.082) 1.380*** (0.084) 1.328*** (0.082)
District: Brugge 1.723*** (0.083) 1.257*** (0.094) 1.224*** (0.093)
District: Kortrijk-Roeselare 1.977*** (0.076) 1.727*** (0.085) 1.687*** (0.084)
District: Oostende-Ieper 1.970*** (0.079) 1.799*** (0.085) 1.753*** (0.085)
District: Aalst-Oudenaarde 1.490*** (0.060) 1.505*** (0.069) 1.482*** (0.068)
District: Gent 1.083*** (0.047) 0.739*** (0.049) 0.716*** (0.048)
District: St-Niklaas-Denderleeuw 1.302*** (0.064) 1.347*** (0.067) 1.313*** (0.066)
District: Hasselt 0.141*** (0.038) 0.683*** (0.046) 0.669*** (0.046)
District: Tongeren 0.333*** (0.051) 0.546*** (0.078) 0.503*** (0.073)
Woman -0.098*** (0.021) -0.046* (0.025) -0.036 (0.025)
Migrant background 0.176*** (0.032) 0.020 (0.038) 0.033 (0.037)
Disabled 0.192*** (0.022) -0.159*** (0.029) -0.166*** (0.029)
Driver's licence -0.056** (0.022) -0.003 (0.027) -0.001 (0.027)
Proficient in Dutch -0.037 (0.030) 0.092** (0.037) 0.103*** (0.036)
Number of languages in which proficient 0.011 (0.013) -0.049*** (0.016) -0.049*** (0.016)
Education: secondary (≥ grade 10 & < grade 12) 0.051** (0.025) 0.064** (0.031) 0.062** (0.031)
Education: secondary (≥ grade 12) 0.003 (0.028) 0.002 (0.034) 0.006 (0.034)
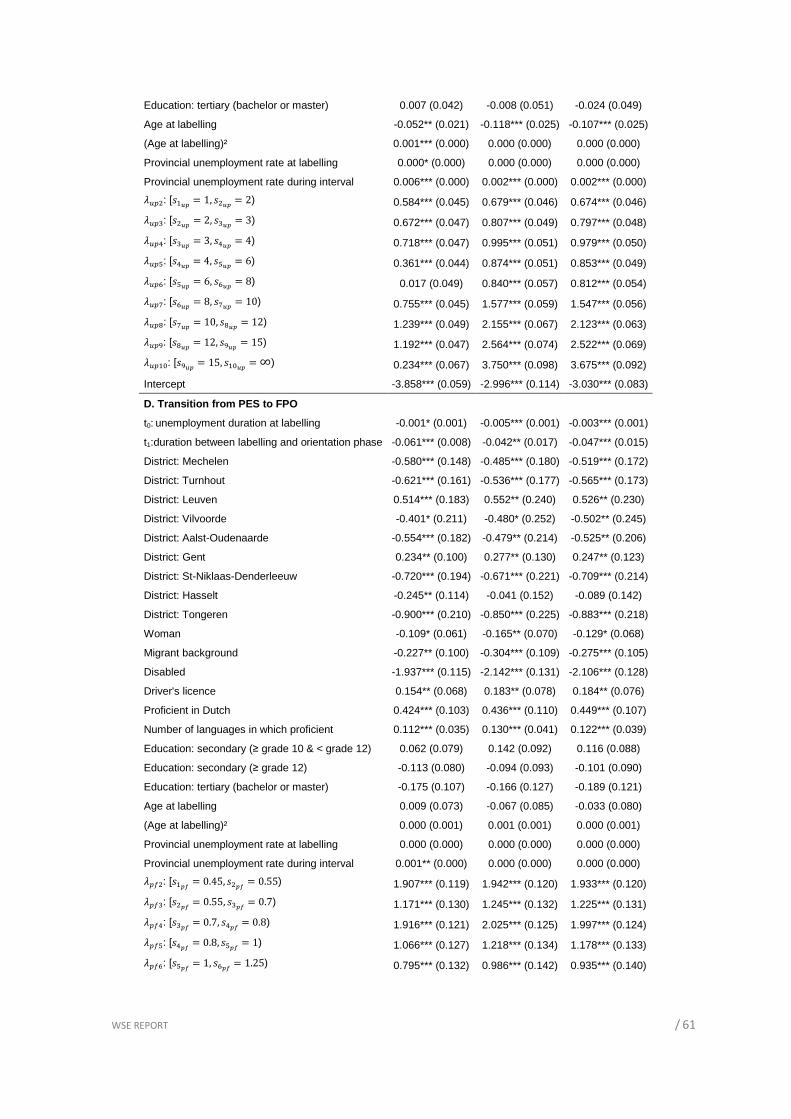
WSE REPORT / 61
Education: tertiary (bachelor or master) 0.007 (0.042) -0.008 (0.051) -0.024 (0.049)
Age at labelling -0.052** (0.021) -0.118*** (0.025) -0.107*** (0.025)
(Age at labelling)² 0.001*** (0.000) 0.000 (0.000) 0.000 (0.000)
Provincial unemployment rate at labelling 0.000* (0.000) 0.000 (0.000) 0.000 (0.000)
Provincial unemployment rate during interval 0.006*** (0.000) 0.002*** (0.000) 0.002*** (0.000) X)�": [c��~ = 1, c"�~ = 2) 0.584*** (0.045) 0.679*** (0.046) 0.674*** (0.046) X)�¸: [c"�~ = 2, c¸�~ = 3) 0.672*** (0.047) 0.807*** (0.049) 0.797*** (0.048) X)�º: [c¸�~ = 3, cº�~ = 4) 0.718*** (0.047) 0.995*** (0.051) 0.979*** (0.050) X)�»: [cº�~ = 4, c»�~ = 6) 0.361*** (0.044) 0.874*** (0.051) 0.853*** (0.049) X)�½: [c»�~ = 6, c½�~ = 8) 0.017 (0.049) 0.840*** (0.057) 0.812*** (0.054) X)�¾: [c½�~ = 8, c¾�~ = 10) 0.755*** (0.045) 1.577*** (0.059) 1.547*** (0.056) X)�À: [c¾�~ = 10, cÀ�~ = 12) 1.239*** (0.049) 2.155*** (0.067) 2.123*** (0.063) X)�Á: [cÀ�~ = 12, cÁ�~ = 15) 1.192*** (0.047) 2.564*** (0.074) 2.522*** (0.069) X)���: [cÁ�~ = 15, c���~ = ∞) 0.234*** (0.067) 3.750*** (0.098) 3.675*** (0.092)
Intercept -3.858*** (0.059) -2.996*** (0.114) -3.030*** (0.083)
D. Transition from PES to FPO
t0: unemployment duration at labelling -0.001* (0.001) -0.005*** (0.001) -0.003*** (0.001)
t1:duration between labelling and orientation phase -0.061*** (0.008) -0.042** (0.017) -0.047*** (0.015)
District: Mechelen -0.580*** (0.148) -0.485*** (0.180) -0.519*** (0.172)
District: Turnhout -0.621*** (0.161) -0.536*** (0.177) -0.565*** (0.173)
District: Leuven 0.514*** (0.183) 0.552** (0.240) 0.526** (0.230)
District: Vilvoorde -0.401* (0.211) -0.480* (0.252) -0.502** (0.245)
District: Aalst-Oudenaarde -0.554*** (0.182) -0.479** (0.214) -0.525** (0.206)
District: Gent 0.234** (0.100) 0.277** (0.130) 0.247** (0.123)
District: St-Niklaas-Denderleeuw -0.720*** (0.194) -0.671*** (0.221) -0.709*** (0.214)
District: Hasselt -0.245** (0.114) -0.041 (0.152) -0.089 (0.142)
District: Tongeren -0.900*** (0.210) -0.850*** (0.225) -0.883*** (0.218)
Woman -0.109* (0.061) -0.165** (0.070) -0.129* (0.068)
Migrant background -0.227** (0.100) -0.304*** (0.109) -0.275*** (0.105)
Disabled -1.937*** (0.115) -2.142*** (0.131) -2.106*** (0.128)
Driver's licence 0.154** (0.068) 0.183** (0.078) 0.184** (0.076)
Proficient in Dutch 0.424*** (0.103) 0.436*** (0.110) 0.449*** (0.107)
Number of languages in which proficient 0.112*** (0.035) 0.130*** (0.041) 0.122*** (0.039)
Education: secondary (≥ grade 10 & < grade 12) 0.062 (0.079) 0.142 (0.092) 0.116 (0.088)
Education: secondary (≥ grade 12) -0.113 (0.080) -0.094 (0.093) -0.101 (0.090)
Education: tertiary (bachelor or master) -0.175 (0.107) -0.166 (0.127) -0.189 (0.121)
Age at labelling 0.009 (0.073) -0.067 (0.085) -0.033 (0.080)
(Age at labelling)² 0.000 (0.001) 0.001 (0.001) 0.000 (0.001)
Provincial unemployment rate at labelling 0.000 (0.000) 0.000 (0.000) 0.000 (0.000)
Provincial unemployment rate during interval 0.001** (0.000) 0.000 (0.000) 0.000 (0.000) X�&": [c�~� = 0.45, c"~� = 0.55) 1.907*** (0.119) 1.942*** (0.120) 1.933*** (0.120) X�&¸: [c"~� = 0.55, c¸~� = 0.7) 1.171*** (0.130) 1.245*** (0.132) 1.225*** (0.131) X�&º: [c¸~� = 0.7, cº~� = 0.8) 1.916*** (0.121) 2.025*** (0.125) 1.997*** (0.124) X�&»: [cº~� = 0.8, c»~� = 1) 1.066*** (0.127) 1.218*** (0.134) 1.178*** (0.133) X�&½: [c»~� = 1, c½~� = 1.25) 0.795*** (0.132) 0.986*** (0.142) 0.935*** (0.140)
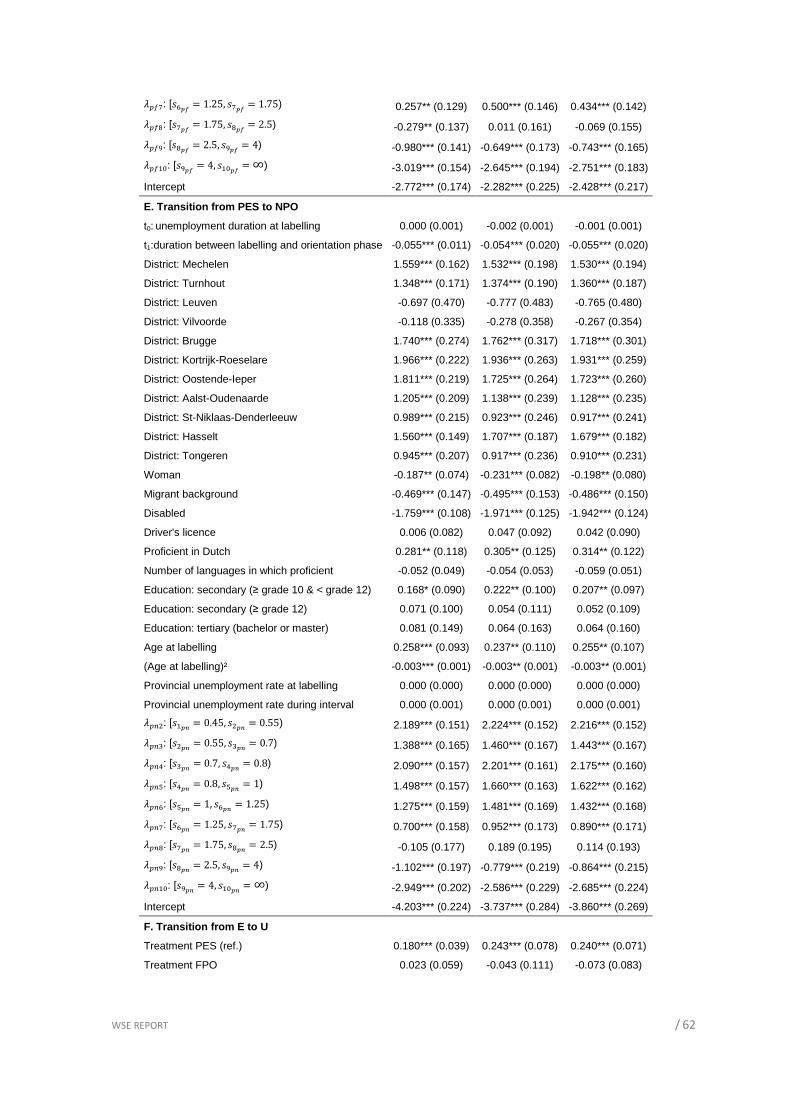
WSE REPORT / 62
X�&¾: [c½~� = 1.25, c¾~� = 1.75) 0.257** (0.129) 0.500*** (0.146) 0.434*** (0.142) X�&À: [c¾~� = 1.75, cÀ~� = 2.5) -0.279** (0.137) 0.011 (0.161) -0.069 (0.155) X�&Á: [cÀ~� = 2.5, cÁ~� = 4) -0.980*** (0.141) -0.649*** (0.173) -0.743*** (0.165) X�&��: [cÁ~� = 4, c��~� = ∞) -3.019*** (0.154) -2.645*** (0.194) -2.751*** (0.183)
Intercept -2.772*** (0.174) -2.282*** (0.225) -2.428*** (0.217)
E. Transition from PES to NPO
t0: unemployment duration at labelling 0.000 (0.001) -0.002 (0.001) -0.001 (0.001)
t1:duration between labelling and orientation phase -0.055*** (0.011) -0.054*** (0.020) -0.055*** (0.020)
District: Mechelen 1.559*** (0.162) 1.532*** (0.198) 1.530*** (0.194)
District: Turnhout 1.348*** (0.171) 1.374*** (0.190) 1.360*** (0.187)
District: Leuven -0.697 (0.470) -0.777 (0.483) -0.765 (0.480)
District: Vilvoorde -0.118 (0.335) -0.278 (0.358) -0.267 (0.354)
District: Brugge 1.740*** (0.274) 1.762*** (0.317) 1.718*** (0.301)
District: Kortrijk-Roeselare 1.966*** (0.222) 1.936*** (0.263) 1.931*** (0.259)
District: Oostende-Ieper 1.811*** (0.219) 1.725*** (0.264) 1.723*** (0.260)
District: Aalst-Oudenaarde 1.205*** (0.209) 1.138*** (0.239) 1.128*** (0.235)
District: St-Niklaas-Denderleeuw 0.989*** (0.215) 0.923*** (0.246) 0.917*** (0.241)
District: Hasselt 1.560*** (0.149) 1.707*** (0.187) 1.679*** (0.182)
District: Tongeren 0.945*** (0.207) 0.917*** (0.236) 0.910*** (0.231)
Woman -0.187** (0.074) -0.231*** (0.082) -0.198** (0.080)
Migrant background -0.469*** (0.147) -0.495*** (0.153) -0.486*** (0.150)
Disabled -1.759*** (0.108) -1.971*** (0.125) -1.942*** (0.124)
Driver's licence 0.006 (0.082) 0.047 (0.092) 0.042 (0.090)
Proficient in Dutch 0.281** (0.118) 0.305** (0.125) 0.314** (0.122)
Number of languages in which proficient -0.052 (0.049) -0.054 (0.053) -0.059 (0.051)
Education: secondary (≥ grade 10 & < grade 12) 0.168* (0.090) 0.222** (0.100) 0.207** (0.097)
Education: secondary (≥ grade 12) 0.071 (0.100) 0.054 (0.111) 0.052 (0.109)
Education: tertiary (bachelor or master) 0.081 (0.149) 0.064 (0.163) 0.064 (0.160)
Age at labelling 0.258*** (0.093) 0.237** (0.110) 0.255** (0.107)
(Age at labelling)² -0.003*** (0.001) -0.003** (0.001) -0.003** (0.001)
Provincial unemployment rate at labelling 0.000 (0.000) 0.000 (0.000) 0.000 (0.000)
Provincial unemployment rate during interval 0.000 (0.001) 0.000 (0.001) 0.000 (0.001) X�'": [c�~� = 0.45, c"~� = 0.55) 2.189*** (0.151) 2.224*** (0.152) 2.216*** (0.152) X�'¸: [c"~� = 0.55, c¸~� = 0.7) 1.388*** (0.165) 1.460*** (0.167) 1.443*** (0.167) X�'º: [c¸~� = 0.7, cº~� = 0.8) 2.090*** (0.157) 2.201*** (0.161) 2.175*** (0.160) X�'»: [cº~� = 0.8, c»~� = 1) 1.498*** (0.157) 1.660*** (0.163) 1.622*** (0.162) X�'½: [c»~� = 1, c½~� = 1.25) 1.275*** (0.159) 1.481*** (0.169) 1.432*** (0.168) X�'¾: [c½~� = 1.25, c¾~� = 1.75) 0.700*** (0.158) 0.952*** (0.173) 0.890*** (0.171) X�'À: [c¾~� = 1.75, cÀ~� = 2.5) -0.105 (0.177) 0.189 (0.195) 0.114 (0.193) X�'Á: [cÀ~� = 2.5, cÁ~� = 4) -1.102*** (0.197) -0.779*** (0.219) -0.864*** (0.215) X�'��: [cÁ~� = 4, c��~� = ∞) -2.949*** (0.202) -2.586*** (0.229) -2.685*** (0.224)
Intercept -4.203*** (0.224) -3.737*** (0.284) -3.860*** (0.269)
F. Transition from E to U
Treatment PES (ref.) 0.180*** (0.039) 0.243*** (0.078) 0.240*** (0.071)
Treatment FPO 0.023 (0.059) -0.043 (0.111) -0.073 (0.083)
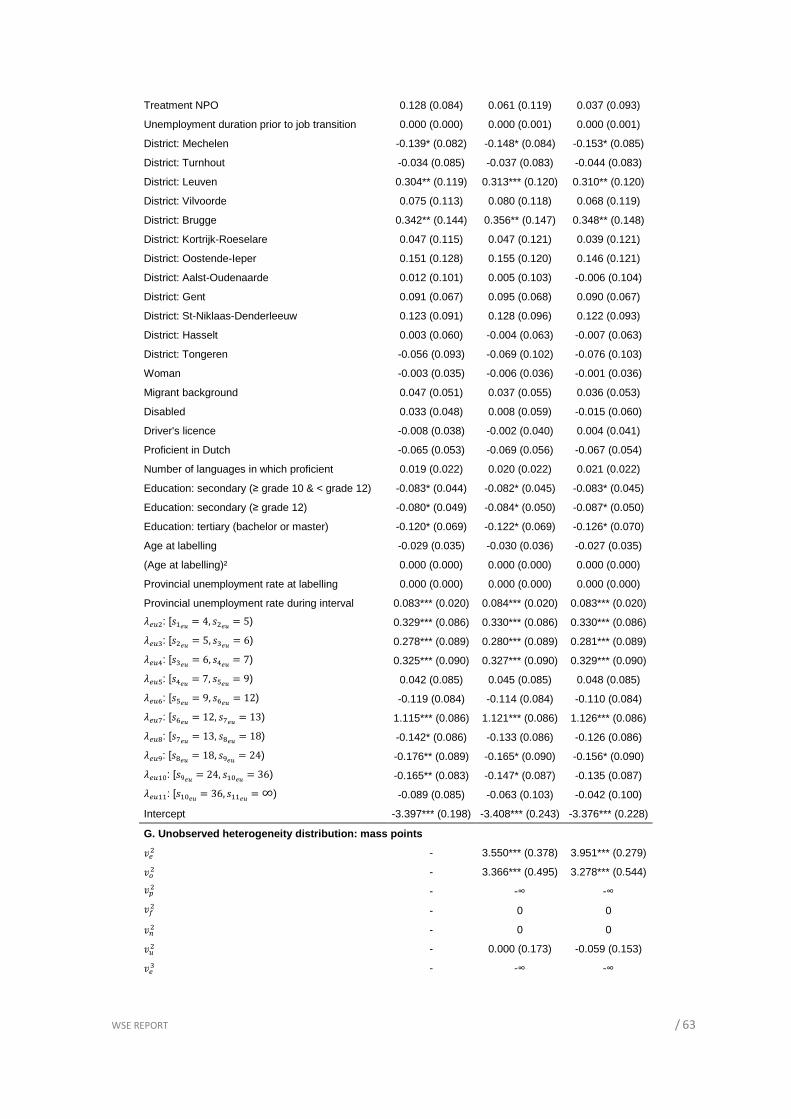
WSE REPORT / 63
Treatment NPO 0.128 (0.084) 0.061 (0.119) 0.037 (0.093)
Unemployment duration prior to job transition 0.000 (0.000) 0.000 (0.001) 0.000 (0.001)
District: Mechelen -0.139* (0.082) -0.148* (0.084) -0.153* (0.085)
District: Turnhout -0.034 (0.085) -0.037 (0.083) -0.044 (0.083)
District: Leuven 0.304** (0.119) 0.313*** (0.120) 0.310** (0.120)
District: Vilvoorde 0.075 (0.113) 0.080 (0.118) 0.068 (0.119)
District: Brugge 0.342** (0.144) 0.356** (0.147) 0.348** (0.148)
District: Kortrijk-Roeselare 0.047 (0.115) 0.047 (0.121) 0.039 (0.121)
District: Oostende-Ieper 0.151 (0.128) 0.155 (0.120) 0.146 (0.121)
District: Aalst-Oudenaarde 0.012 (0.101) 0.005 (0.103) -0.006 (0.104)
District: Gent 0.091 (0.067) 0.095 (0.068) 0.090 (0.067)
District: St-Niklaas-Denderleeuw 0.123 (0.091) 0.128 (0.096) 0.122 (0.093)
District: Hasselt 0.003 (0.060) -0.004 (0.063) -0.007 (0.063)
District: Tongeren -0.056 (0.093) -0.069 (0.102) -0.076 (0.103)
Woman -0.003 (0.035) -0.006 (0.036) -0.001 (0.036)
Migrant background 0.047 (0.051) 0.037 (0.055) 0.036 (0.053)
Disabled 0.033 (0.048) 0.008 (0.059) -0.015 (0.060)
Driver's licence -0.008 (0.038) -0.002 (0.040) 0.004 (0.041)
Proficient in Dutch -0.065 (0.053) -0.069 (0.056) -0.067 (0.054)
Number of languages in which proficient 0.019 (0.022) 0.020 (0.022) 0.021 (0.022)
Education: secondary (≥ grade 10 & < grade 12) -0.083* (0.044) -0.082* (0.045) -0.083* (0.045)
Education: secondary (≥ grade 12) -0.080* (0.049) -0.084* (0.050) -0.087* (0.050)
Education: tertiary (bachelor or master) -0.120* (0.069) -0.122* (0.069) -0.126* (0.070)
Age at labelling -0.029 (0.035) -0.030 (0.036) -0.027 (0.035)
(Age at labelling)² 0.000 (0.000) 0.000 (0.000) 0.000 (0.000)
Provincial unemployment rate at labelling 0.000 (0.000) 0.000 (0.000) 0.000 (0.000)
Provincial unemployment rate during interval 0.083*** (0.020) 0.084*** (0.020) 0.083*** (0.020) X,)": [c��� = 4, c"�� = 5) 0.329*** (0.086) 0.330*** (0.086) 0.330*** (0.086) X,)¸: [c"�� = 5, c¸�� = 6) 0.278*** (0.089) 0.280*** (0.089) 0.281*** (0.089) X,)º: [c¸�� = 6, cº�� = 7) 0.325*** (0.090) 0.327*** (0.090) 0.329*** (0.090) X,)»: [cº�� = 7, c»�� = 9) 0.042 (0.085) 0.045 (0.085) 0.048 (0.085) X,)½: [c»�� = 9, c½�� = 12) -0.119 (0.084) -0.114 (0.084) -0.110 (0.084) X,)¾: [c½�� = 12, c¾�� = 13) 1.115*** (0.086) 1.121*** (0.086) 1.126*** (0.086) X,)À: [c¾�� = 13, cÀ�� = 18) -0.142* (0.086) -0.133 (0.086) -0.126 (0.086) X,)Á: [cÀ�� = 18, cÁ�� = 24) -0.176** (0.089) -0.165* (0.090) -0.156* (0.090) X,)��: [cÁ�� = 24, c���� = 36) -0.165** (0.083) -0.147* (0.087) -0.135 (0.087) X,)��: [c���� = 36, c���� = ∞) -0.089 (0.085) -0.063 (0.103) -0.042 (0.100)
Intercept -3.397*** (0.198) -3.408*** (0.243) -3.376*** (0.228)
G. Unobserved heterogeneity distribution: mass poin ts S," - 3.550*** (0.378) 3.951*** (0.279) S-" - 3.366*** (0.495) 3.278*** (0.544) S�" - -∞ -∞ S&" - 0 0 S'" - 0 0 S)" - 0.000 (0.173) -0.059 (0.153) S,̧ - -∞ -∞

WSE REPORT / 64
S-̧ - -∞ -∞ S�̧ - -0.037 (0.108) -0.020 (0.078) S&̧ - -0.067 (0.157) 0.003 (0.159) S'̧ - 0.015 (0.194) 0.052 (0.175) S)̧ - 0 0 S,º - -0.176 (0.193) -0.895*** (0.227) S-º - 1.053*** (0.152) 1.090*** (0.145) S�º - -7.733*** (0.461) -7.967*** (0.554) S&º - -∞ -∞ S'º - -∞ -∞ S)º - 0.104 (0.162) 0.048 (0.174) S,» - 0.149 (0.239) 0.256 (0.199) S-» - 1.149*** (0.270) 1.231*** (0.171) S�» - -0.254 (0.215) -0.384*** (0.140) S&» - -∞ -∞ S'» - -∞ -∞ S)» - -0.162 (0.372) -0.316 (0.210) S,½ - 0.758*** (0.165) 0.625*** (0.132) S-½ - 0.604* (0.326) 0.448* (0.233) S�½ - -1.306*** (0.178) -1.358*** (0.141) S&½ - -0.511 (0.533) -0.232 (0.419) S'½ - 0.017 (0.764) 0.051 (0.607) S)½ - 0.072 (0.167) 0.085 (0.134) S,¾ - -∞ -∞ S-¾ - -3.479*** (0.634) -3.364*** (0.638) S�¾ - -1.584*** (0.192) -1.525*** (0.175) S&¾ - -1.386** (0.583) -1.108** (0.555) S'¾ - -0.231 (0.486) -0.036 (0.452) S)¾ - 0 0 S,À - 0.588 (0.804) -0.804 (0.942) S-À - 3.301*** (0.221) 3.620*** (0.176) S�À - -∞ -∞ S&À - 0 0 S'À - 0 0 S)À - 0.004 (0.497) -0.237 (0.601) S,Á - -∞ -∞ S-Á - -∞ -∞ S�Á - -8.314*** (0.607) -7.966*** (0.568) S&Á - -∞ -∞ S'Á - -∞ -∞ S)Á - 0 0 S,�� - 0.549 (0.871) 2.295*** (0.316) S-�� - 2.307*** (0.431) -0.646 (0.863) S��� - -1.377 (0.972) -5.758*** (0.893) S&�� - -∞ -∞ S'�� - -∞ -∞
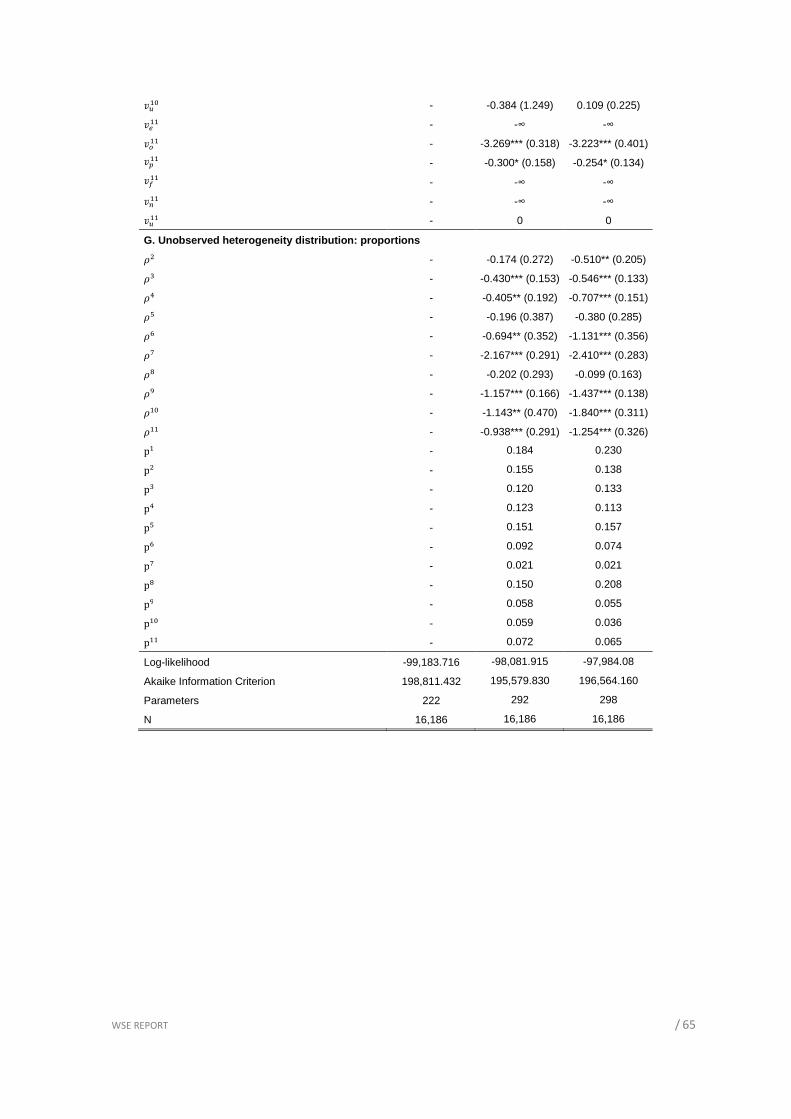
WSE REPORT / 65
S)�� - -0.384 (1.249) 0.109 (0.225) S,�� - -∞ -∞ S-�� - -3.269*** (0.318) -3.223*** (0.401) S��� - -0.300* (0.158) -0.254* (0.134) S&�� - -∞ -∞ S'�� - -∞ -∞ S)�� - 0 0
G. Unobserved heterogeneity distribution: proportio ns ¡" - -0.174 (0.272) -0.510** (0.205) ¡¸ - -0.430*** (0.153) -0.546*** (0.133) ¡º - -0.405** (0.192) -0.707*** (0.151) ¡» - -0.196 (0.387) -0.380 (0.285) ¡½ - -0.694** (0.352) -1.131*** (0.356) ¡¾ - -2.167*** (0.291) -2.410*** (0.283) ¡À - -0.202 (0.293) -0.099 (0.163) ¡Á - -1.157*** (0.166) -1.437*** (0.138) ¡�� - -1.143** (0.470) -1.840*** (0.311) ¡�� - -0.938*** (0.291) -1.254*** (0.326) p� - 0.184 0.230
p" - 0.155 0.138
p¸ - 0.120 0.133
pº - 0.123 0.113
p» - 0.151 0.157
p½ - 0.092 0.074
p¾ - 0.021 0.021
pÀ - 0.150 0.208
pÁ - 0.058 0.055
p�� - 0.059 0.036
p�� - 0.072 0.065
Log-likelihood -99,183.716 -98,081.915 -97,984.08
Akaike Information Criterion 198,811.432 195,579.830 196,564.160
Parameters 222 292 298
N 16,186 16,186 16,186
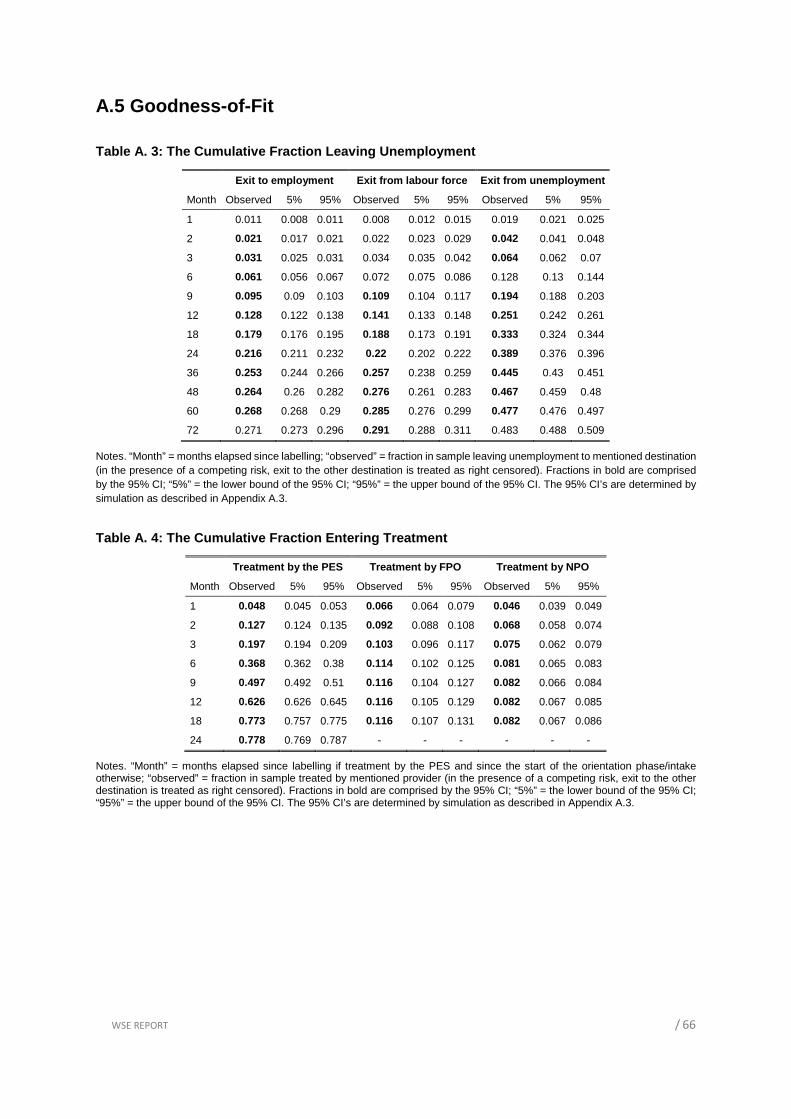
WSE REPORT / 66
A.5 Goodness-of-Fit
Table A. 3: The Cumulative Fraction Leaving Unemployment
Exit to employment Exit from labour force Exit from unemployment
Month Observed 5% 95% Observed 5% 95% Observed 5% 95%
1 0.011 0.008 0.011 0.008 0.012 0.015 0.019 0.021 0.025
2 0.021 0.017 0.021 0.022 0.023 0.029 0.042 0.041 0.048
3 0.031 0.025 0.031 0.034 0.035 0.042 0.064 0.062 0.07
6 0.061 0.056 0.067 0.072 0.075 0.086 0.128 0.13 0.144
9 0.095 0.09 0.103 0.109 0.104 0.117 0.194 0.188 0.203
12 0.128 0.122 0.138 0.141 0.133 0.148 0.251 0.242 0.261
18 0.179 0.176 0.195 0.188 0.173 0.191 0.333 0.324 0.344
24 0.216 0.211 0.232 0.22 0.202 0.222 0.389 0.376 0.396
36 0.253 0.244 0.266 0.257 0.238 0.259 0.445 0.43 0.451
48 0.264 0.26 0.282 0.276 0.261 0.283 0.467 0.459 0.48
60 0.268 0.268 0.29 0.285 0.276 0.299 0.477 0.476 0.497
72 0.271 0.273 0.296 0.291 0.288 0.311 0.483 0.488 0.509
Notes. “Month” = months elapsed since labelling; “observed” = fraction in sample leaving unemployment to mentioned destination (in the presence of a competing risk, exit to the other destination is treated as right censored). Fractions in bold are comprised by the 95% CI; “5%” = the lower bound of the 95% CI; “95%” = the upper bound of the 95% CI. The 95% CI’s are determined by simulation as described in Appendix A.3.
Table A. 4: The Cumulative Fraction Entering Treatment
Treatment by the PES Treatment by FPO Treatment by NPO
Month Observed 5% 95% Observed 5% 95% Observed 5% 95%
1 0.048 0.045 0.053 0.066 0.064 0.079 0.046 0.039 0.049
2 0.127 0.124 0.135 0.092 0.088 0.108 0.068 0.058 0.074
3 0.197 0.194 0.209 0.103 0.096 0.117 0.075 0.062 0.079
6 0.368 0.362 0.38 0.114 0.102 0.125 0.081 0.065 0.083
9 0.497 0.492 0.51 0.116 0.104 0.127 0.082 0.066 0.084
12 0.626 0.626 0.645 0.116 0.105 0.129 0.082 0.067 0.085
18 0.773 0.757 0.775 0.116 0.107 0.131 0.082 0.067 0.086
24 0.778 0.769 0.787 - - - - - -
Notes. “Month” = months elapsed since labelling if treatment by the PES and since the start of the orientation phase/intake otherwise; “observed” = fraction in sample treated by mentioned provider (in the presence of a competing risk, exit to the other destination is treated as right censored). Fractions in bold are comprised by the 95% CI; “5%” = the lower bound of the 95% CI; “95%” = the upper bound of the 95% CI. The 95% CI’s are determined by simulation as described in Appendix A.3.
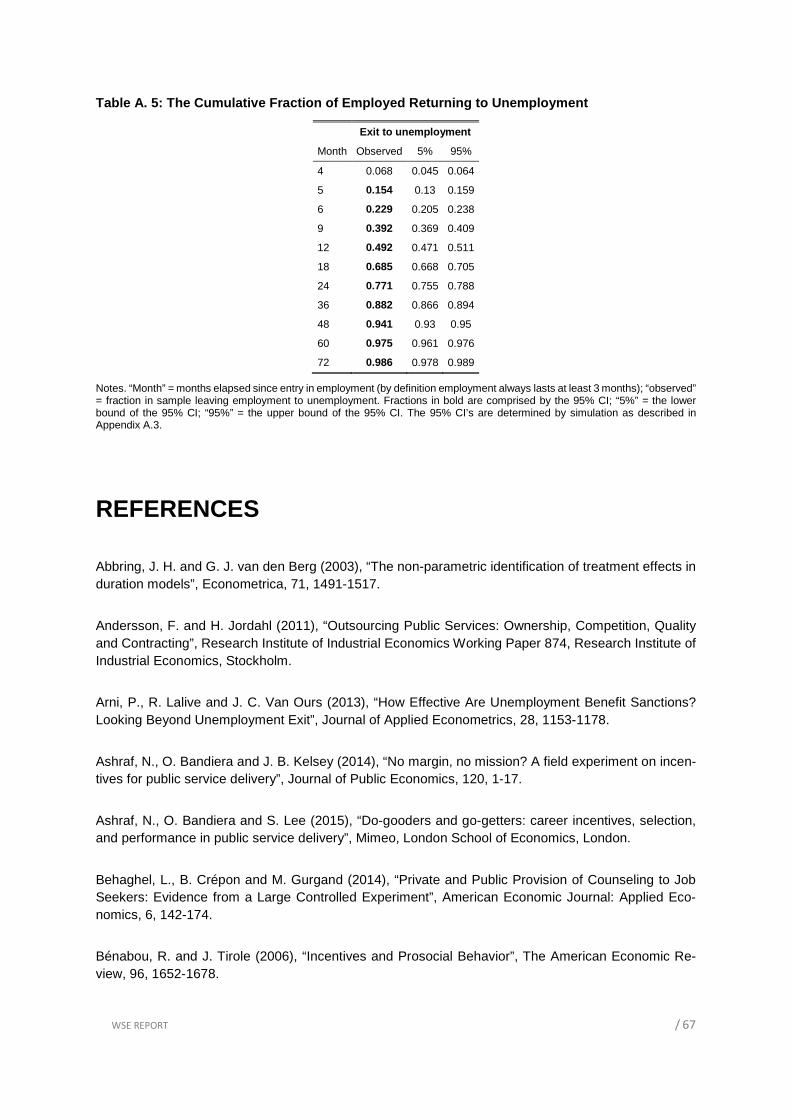
WSE REPORT / 67
Table A. 5: The Cumulative Fraction of Employed Returning to Unemployment
Exit to unemployment
Month Observed 5% 95%
4 0.068 0.045 0.064
5 0.154 0.13 0.159
6 0.229 0.205 0.238
9 0.392 0.369 0.409
12 0.492 0.471 0.511
18 0.685 0.668 0.705
24 0.771 0.755 0.788
36 0.882 0.866 0.894
48 0.941 0.93 0.95
60 0.975 0.961 0.976
72 0.986 0.978 0.989
Notes. “Month” = months elapsed since entry in employment (by definition employment always lasts at least 3 months); “observed” = fraction in sample leaving employment to unemployment. Fractions in bold are comprised by the 95% CI; “5%” = the lower bound of the 95% CI; “95%” = the upper bound of the 95% CI. The 95% CI’s are determined by simulation as described in Appendix A.3.
REFERENCES
Abbring, J. H. and G. J. van den Berg (2003), “The non-parametric identification of treatment effects in duration models”, Econometrica, 71, 1491-1517.
Andersson, F. and H. Jordahl (2011), “Outsourcing Public Services: Ownership, Competition, Quality and Contracting”, Research Institute of Industrial Economics Working Paper 874, Research Institute of Industrial Economics, Stockholm.
Arni, P., R. Lalive and J. C. Van Ours (2013), “How Effective Are Unemployment Benefit Sanctions? Looking Beyond Unemployment Exit”, Journal of Applied Econometrics, 28, 1153-1178.
Ashraf, N., O. Bandiera and J. B. Kelsey (2014), “No margin, no mission? A field experiment on incen-tives for public service delivery”, Journal of Public Economics, 120, 1-17.
Ashraf, N., O. Bandiera and S. Lee (2015), “Do-gooders and go-getters: career incentives, selection, and performance in public service delivery”, Mimeo, London School of Economics, London.
Behaghel, L., B. Crépon and M. Gurgand (2014), “Private and Public Provision of Counseling to Job Seekers: Evidence from a Large Controlled Experiment”, American Economic Journal: Applied Eco-nomics, 6, 142-174.
Bénabou, R. and J. Tirole (2006), “Incentives and Prosocial Behavior”, The American Economic Re-view, 96, 1652-1678.

WSE REPORT / 68
Bennmarker, H., E. Grönqvist and B. Öckert (2013), “Effects of contracting out employment services: Evidence from a randomized experiment”, Journal of Public Economics, 98, 68-84.
Bernhart, S. and J. Wolff (2008), “Contracting Out Placement Services in Germany: Is Assignment to Private Providers Effective for Needy Job-Seekers?”, Institute for Employment Research (IAB) Discus-sion Paper No. 5/2008, IAB, Nuremberg.
Besley, T. and M. Ghatak (2005), “Competition and incentives with motivated agents”, American Eco-nomic Review, 95, 616-636.
Black, D. A., J. A. Smith, M. C. Berger, and B. J. Noel. (2003), “Is the threat of reemployment services more effective than the services themselves? Evidence from random assignment in the UI system.” American Economic Review 93, 1313-1327.
Bowles, S. and S. Polanía-Reyes (2012), “Economic Incentives and Social Preferences: Substitutes or Complements?”, Journal of Economic Literature, 50, 368-425.
Brinch, C. (2007), “Nonparametric identification of the mixed hazards model with time-varying covari-ates”, Econometric Theory, 23, 349-354.
Carcagno, G., R. Cecil and J. Ohls (1982), “Using Private Employment Agencies to Place Public Assis-tance Clients in Jobs”, Journal of Human Resources, 17, 132-143.
Card, D., J. Kluve and A. Weber (2015), “What Works? A Meta Analysis of Recent Active Labor Market Program Evaluations”, IZA Discussion Paper No. 9236, IZA, Bonn.
Cockx, B., A. Defourny, M. Dejemeppe and B. Van der Linden (2007), “Le nouveau système de suivi de chômeurs : une évaluation", research report within the programme “Action de soutien aux priorités stratégiques de l’Autorité fédérale de la Politique scientifique", IRES, Université catholique de Lou-vain, Louvain-la-Neuve. https://www.uclouvain.be/cps/ucl/doc/econ/documents/rap-portwebPolFed.pdf.
Cockx B. and M. Dejemeppe (2012), “Monitoring job search effort: an evaluation based on a regression discontinuity design”, Labour Economics, 19, 729-737.
Cockx B., M. Dejemeppe, A. Launov and B. Van der Linden (2011), “Monitoring, Sanctions and Front-Loading of Job Search in a Non-Stationary Model”, IZA Discussion Paper No. 6181, IZA, Bonn.
Crépon, B., M. Dejemeppe and M. Gurgand (2005), “Counseling the Unemployed: Does it Lower Un-employment Duration and Recurrence?”, IZA Discussion Paper No. 1796, IZA, Bonn.
Devisscher, S., D. Sanders and A. Van Pelt (2009), Evaluatie van de proeftuin trajecttendering, Idea Consult commissioned by VDAB, Brussels. http://partners.vdab.be/trajecttendering/documen-ten/RVB090843evaluatie%20trajecttendering%20bijlage%202.pdf.
Dolton, P. and D. O'Neill, D. (1996), “Unemployment duration and the restart effect: some experimental

WSE REPORT / 69
evidence”, Economic Journal, 106, 387-400.
Dolton, P. and D. O'Neill (2002), “The long-run effects of unemployment monitoring and work-search programs: experimental evidence from the United Kingdom”, Journal of Labor Economics, 20, 381-403.
Drepper, B. and G. Effraimidis (2015), “Identification of the Timing of Events Model with Multiple Com-peting Exit Risks from Single Spell Data”, IZA Discussion Paper No. 8839, IZA, Bonn.
Finn, D. (2011), Sub-Contracting in Public Employment Services: Review of Research Findings and Literature on Recent Trends and Business Models, European Commission Mutual Learning Programme for Public Employment Services (PESs) and DG Employment, Social Affairs and Inclusion, Brussels. http://ec.europa.eu/social/BlobServlet?docId=6964&langId=en.
Frey, B. (1997), “A constitution for knaves crowds out public virtues”, Economic Journal, 107, 1043-1053.
Frey, B. and R. Jegen (2001), “Motivation crowding theory”, Journal of Economic Surveys, 15, 589-611.
Gaure, S., K. Røed and Zhang, T. (2007), “Time and causality: a monte carlo assessment of the timing-of-events approach”, Journal of Econometrics, 141, 1159-1195.
Geerdsen, L. P. (2006), “Is There a Threat Effect of Labour Market Programmes? A study of ALMP in the Danish UI system”, Economic Journal, 116, 738-750.
Geerdsen, L. P. and A. Holm (2007), “Duration of UI periods and the Perceived Threat Effect from Labour Market Programmes”, Labour Economics, 14, 639-652.
Graversen, B. K. and J. C. van Ours (2008), “How to Help Unemployed Find Jobs Quickly; Experimental Evidence from a Mandatory Activation Program”, Journal of Public Economics, 92, 2020-2035.
Gregg, P., P. Grout, A. Ratcliffe, S. Smith and F. Windmeijer (2011), “How important is pro-social be-haviour in the delivery of public services?”, Journal of Public Economics, 95, 758-766.
Grossman, S. J. and O. D. Hart (1986), “The Costs and Benefits of Ownership: A Theory of Vertical and Lateral Integration”, Journal of Political Economy, 94, 691-719.
Hansmann, H. (1980), “The Role of Nonprofit Enterprise”, Yale Law Journal, 89, 835-901.
Hart, O. and J. Moore (1990), “Property Rights and the Nature of the Firm”, Journal of Political Economy, 98, 1119-1158.
Hart, O., A. Shleifer and R. Vishny (1997), “The proper scope of government: theory and an application to prisons”, Quarterly Journal of Economics, 112, 1127-1161.
Heckman, J. and B. Singer (1984), “A method for minimizing the impact of distributional assumptions

WSE REPORT / 70
in econometric models for duration data”, Econometrica, 52, 271-320.
Heinrich, C. J. (2000), “Organisational Form and Performance: An Empirical Investigation of Nonprofit and For-Profit Job-Training Service Providers”, Journal of Policy Analysis and Management, 19, 233-261.
Horny, G. and M. Picchio (2010), “Identification of lagged duration dependence in multiple spell com-peting risks models”, Economic Letters, 106, 241-243.
Kaplan, E. L. and P. Meier (1958), “Nonparametric estimation from incomplete observations”, Journal of the American Statistical Association, 53, 457-481.
Koning, P. (2008), “Not-for-Profit Provision of Job Training and Mediation Services: An Empirical Anal-ysis Using Contract Data of Job Training Service Providers”, De Economist, 156, 221-239.
Koning, P. and C. J. Heinrich (2013), “Cream-Skimming, Parking and Other Intended and Unintended Effects of High Powered, Performance Based Contracts”, Journal of Policy Analysis and Management, 32, 461-483.
Koning, P., J. Noailly and S. Visser (2007), “Do Not-for-Profits Make a Difference in Social Services? A Survey Study”, De Economist, 155, 251-270.
Kreps, D. M. (1997), “Intrinsic motivation and extrinsic incentives”, American Economic Review, 87, 359-364.
Krug, G. and G. Stephan (2013), “Is the Contracting-Out of Intensive Placement Services More Effective than Provision by the PES? Evidence from a Randomized Field Experiment”, IZA Discussion Paper No. 7403, IZA, Bonn.
Lancaster, T. (1979), “Econometric Methods for the Duration of Unemployment”, Econometrica, 47, 939-956. Lalive, R., J. van Ours and J. Zweimüller (2005), “The Effect of Benefit Sanctions on the Duration of Unemployment”, Journal of the European Economic Association, 3, 1-32.
Laun, L. and P. Skogman Thoursie (2014), “Does privatisation of vocational rehabilitation improve la-bour market opportunities? Evidence from a field experiment in Sweden”, Journal of Health Economics, 34, 59-72.
Manning, A. (2009), “You Can’t Always Get What You Want: The Impact of the UK Jobseekers Allow-ance”, Labour Economics, 16, 239-250.
Meyer, B. D. (1995), “Lessons from the U.S. Unemployment Insurance Experiments”, Journal of Eco-nomic Literature, 33, 91-131.
Nickell, S. (1979), “Estimating the Probability of Leaving Unemployment”, Econometrica, 47, 1249-

WSE REPORT / 71
1266.
Petrongolo, B. (2009), “The Long-Term Effects of Job Search Requirements: Evidence from the UK JSA reform”, Journal of Public Economics, 93, 1234-1253.
Rehwald, K., M. Rosholm and M. Svarer (2015), “Are Public or Private Providers of Employment Ser-vices More Effective? Evidence from a Randomized Experiment.”, mimeo, Department of Economics and Business, Aarhus University.
Richardson, C. and G. J. van den Berg (2013), “Duration Dependence versus Unobserved Heteroge-neity in Treatment Effect: Swedish Labor Market Training and the Transition to Employment”, Journal of Applied Econometrics, 28, 325-351.
Ridder, G. (1984), “The distribution of single-spell duration data”, in Neumann G. and N. Westergård (eds.), Studies in Labor Market Dynamics, Springer, Darmstadt, 45-73.
Ridder, G. (1990), “The non-parametric identification of generalized accelerated failure-time models”, Review of Economic Studies, 57, 167-181.
Rosholm, M. and M. Svarer (2008), “The Threat Effect of Active Labour Market Programmes”, Scandi-navian Journal of Economics, 110, 385-401.
Salant, S. W. (1977), “Search Theory and Duration Data: A Theory of Sorts”, Quarterly Journal of Eco-nomics, 91, 39-57.
Schleifer, A. (1998), “State versus Private Ownership”, Journal of Economic Perspectives, 12, 133-150.
Skipper L. and K. Sørensen (2013), “Effekten af Andre Aktørers Beskæftigelsesindsats: Effektunders øgelse af Indsatsen for Ledige Henvist til Andre Aktører Under Serviceudbuddet 2009”, Det Nationale Institut for Kommuners og Regioners Analyse og Forskning (KORA), Projekt 10329.
Sørensen, P. B. (2014), “Reforming Public Sector Service Provision: What Have We Learned?”, Back-ground paper for keynote lecture presented at the CESifo Venice Summer Institute Workshop on Re-forming the Public Sector at Venice International University, 25-26 July 2014, Department of Econom-ics, University of Copenhagen, Copenhagen. http://www.econ.ku.dk/pbs/Dokumentfiler/Work-ing%20papers/Reforming%20public%20service%20provision.pdf.
Stiglitz, J. E. (1994), Whither Socialism?, MIT Press, Cambridge.
Stoll, M. A., E. Melendez and A. de Montrichard (2003), “Will Community-Based Employment and Train-ing Organizations be Disadvantages under WIA? Recent Evidence on Participant Characteristics and Outcomes in Boston”, Center for The Study of Urban Poverty Working Paper Series, University of Cal-ifornia, Los Angeles.
Svarer, M. (2011), “The Effect of Sanctions on Exit from Unemployment: Evidence from Denmark”, Economica, 78, 751-778.

WSE REPORT / 72
van den Berg, G. J., A. Bergemann and M. Caliendo (2009), “The Effect of Active Labor Market Pro-grams on Not-Yet Treated Unemployed Individuals”, Journal of the European Economic Association, 7, 606-616.
van den Berg G. J., B. van der Klaauw B, J.C. van Ours (2004), “Punitive sanctions and the transition rate from welfare to work”, Journal of Labor Economics, 22, 211-241.
van den Berg, G. and J. Vikström (2014), “Monitoring Job Offer Decisions, Punishments, Exit to Work, and Job Quality”, Scandinavian Journal of Economics, 116, 284-334.
van der Klaauw B. and J. C. van Ours (2013), “Carrot and Stick: How Re-Employment Bonuses and Benefit Sanctions Affect Exits Rates from Welfare”, Journal of Applied Econometrics, 28, 275-298.
Winterhager, H. (2006), “Private Job Placement Services – A Microeconometric Evaluation for Ger-many”, ZEW Discussion Paper No. 06-026, Centre for European.