Embed Size (px)
Citation preview
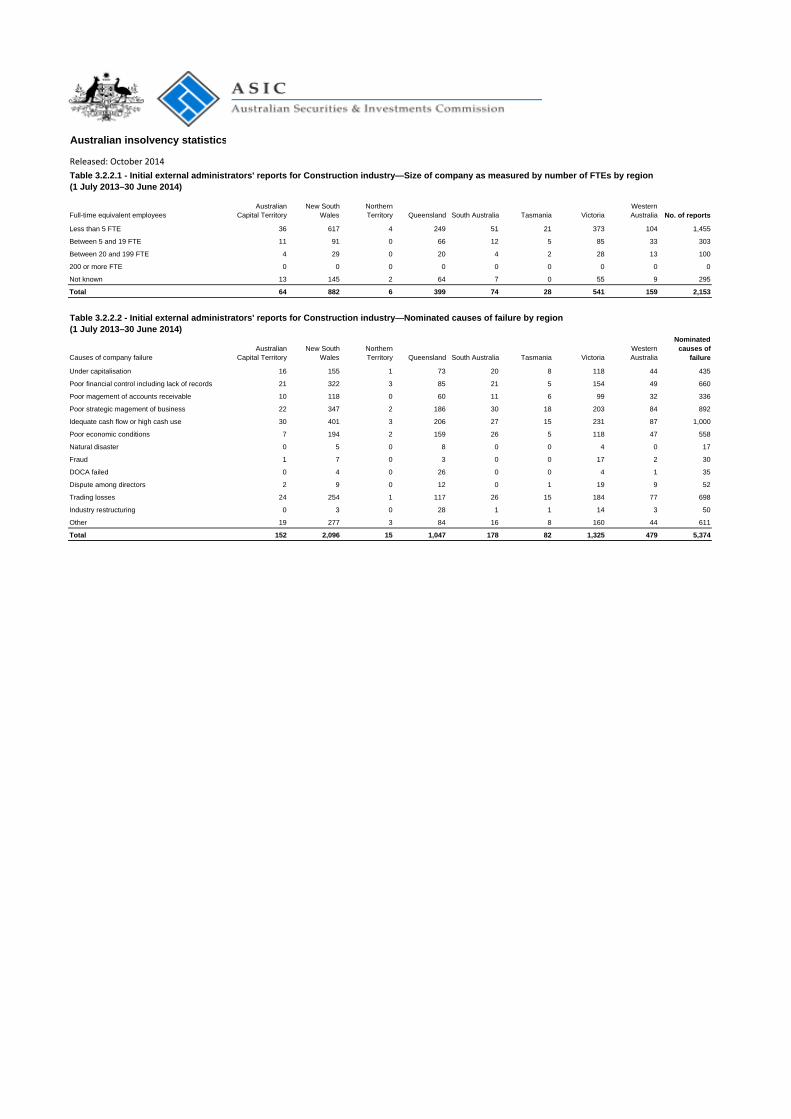
Australian insolvency statistics
Released: October 2014
Series 3: External administrators' reports
3.2 ‐ External administrators's reports for selected industries, 1 July 2013–30 June 2014
ContentsOther (business & personal) services industry tables
Table 3.2.1.1 - Initial external administrators' reports for Other (business & personal) services industry—Size of company as measured by number of FTEs by region
Table 3.2.1.2 - Initial external administrators' reports for Other (business & personal) services industry—Nominated causes of failure by region
Table 3.2.1.3 - Initial external administrators' reports for Other (business & personal) services industry—Possible misconduct by region
Table 3.2.1.4 - Initial external administrators' reports for Other (business & personal) services industry—Assets, liabilities and deficiency by region
Table 3.2.1.5 - Initial external administrators' reports for Other (business & personal) services industry—Unpaid employee entitlements by region
Table 3.2.1.6 - Initial external administrators' reports for Other (business & personal) services industry—Amount owed to secured creditors by region
Table 3.2.1.7 - Initial external administrators' reports for Other (business & personal) services industry—Unpaid taxes and charges by region
Table 3.2.1.8 - Initial external administrators' reports for Other (business & personal) services industry—Unsecured creditors by region
Table 3.2.1.9 - Initial external administrators' reports for Other (business & personal) services industry—External administrator's remuneration by region
Construction industry tables
Table 3.2.2.1 - Initial external administrators' reports for Construction industry—Size of company as measured by number of FTEs by region
Table 3.2.2.2 - Initial external administrators' reports for Construction industry—Nominated causes of failure by region
Table 3.2.2.3 - Initial external administrators' reports for Construction industry—Possible misconduct by region
Table 3.2.2.4 - Initial external administrators' reports for Construction industry—Assets, liabilities and deficiency by region
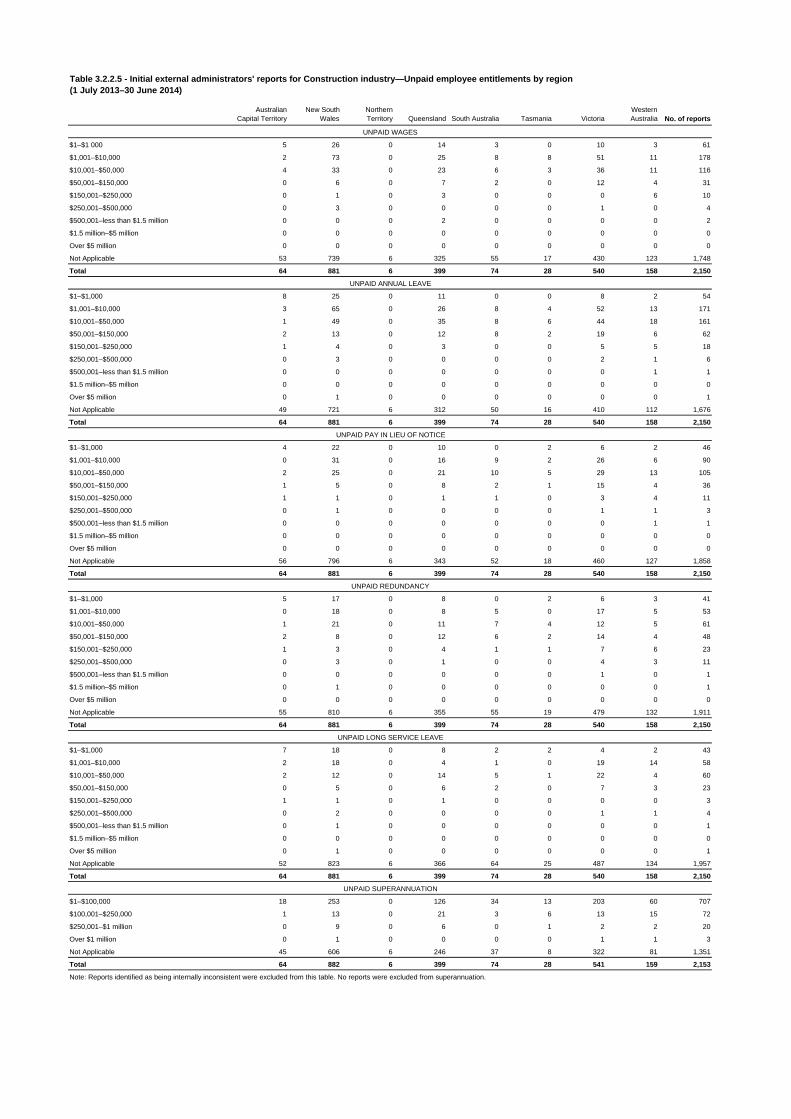
Table 3.2.2.5 - Initial external administrators' reports for Construction industry—Unpaid employee entitlements by region
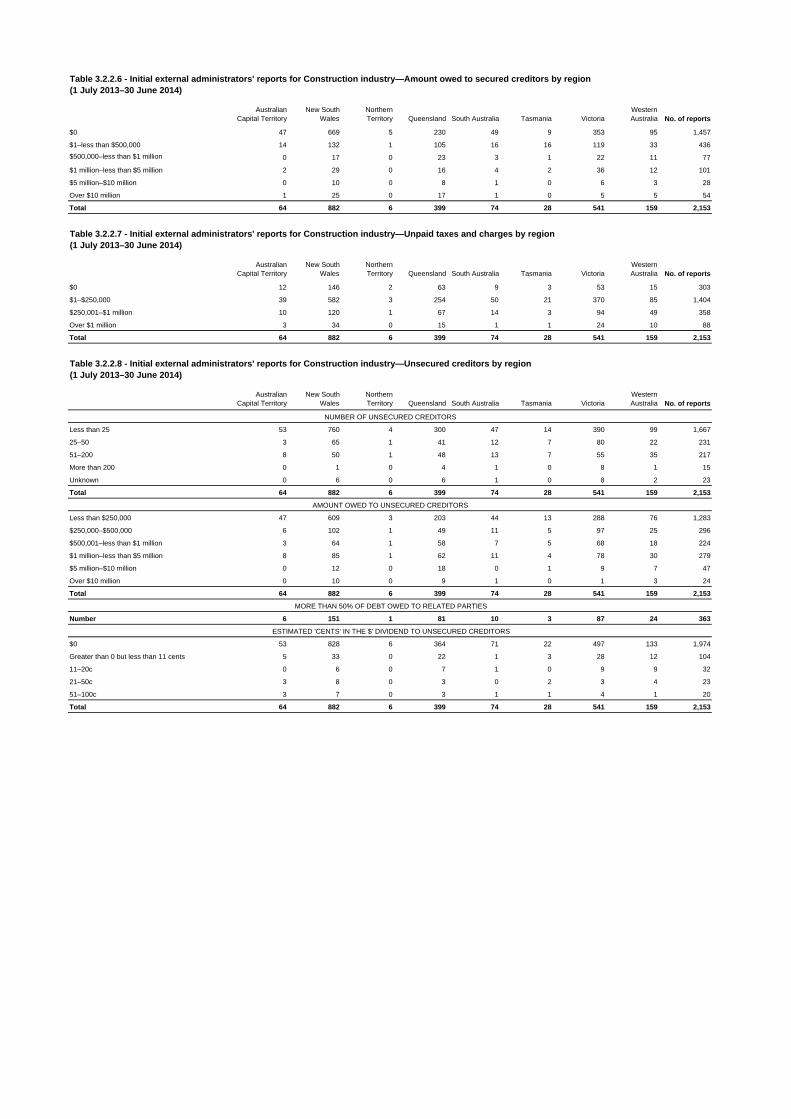
Table 3.2.2.6 - Initial external administrators' reports for Construction industry—Amount owed to secured creditors by region
Table 3.2.2.7 - Initial external administrators' reports for Construction industry—Unpaid taxes and charges by region
Table 3.2.2.8 - Initial external administrators' reports for Construction industry—Unsecured creditors by region
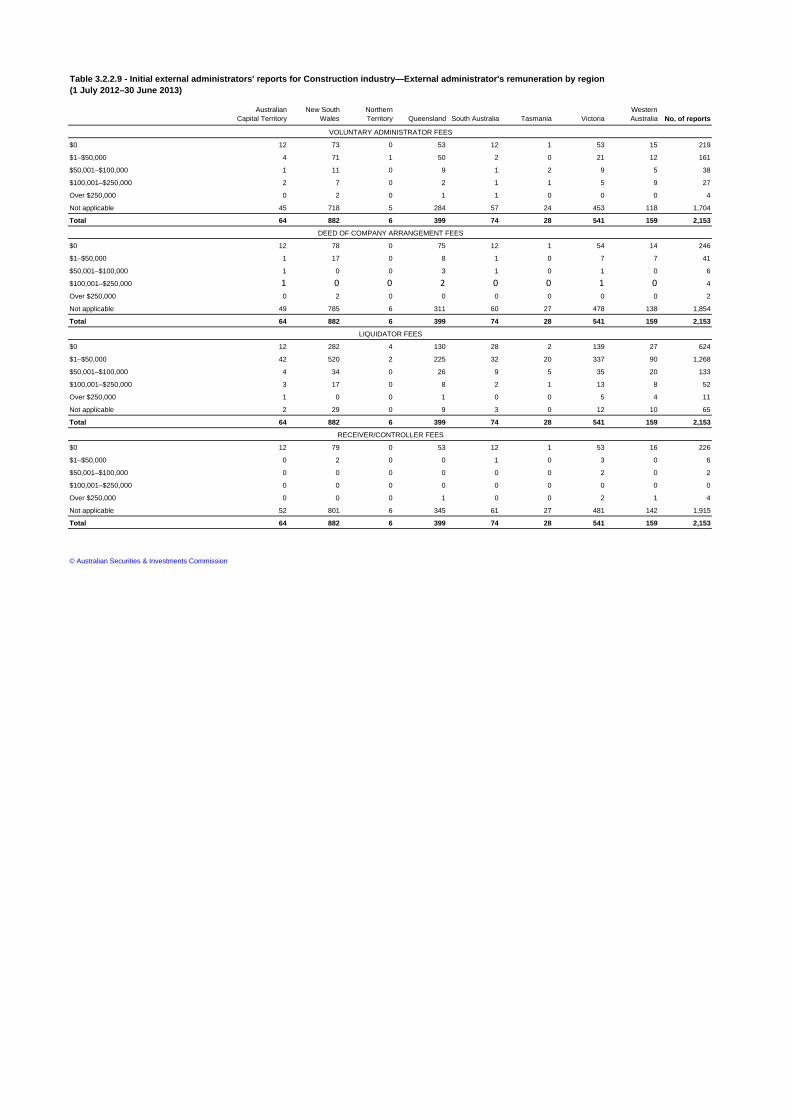
Table 3.2.2.9 - Initial external administrators' reports for Construction industry—External administrator's remuneration by region
Accommodation & food services industry tables
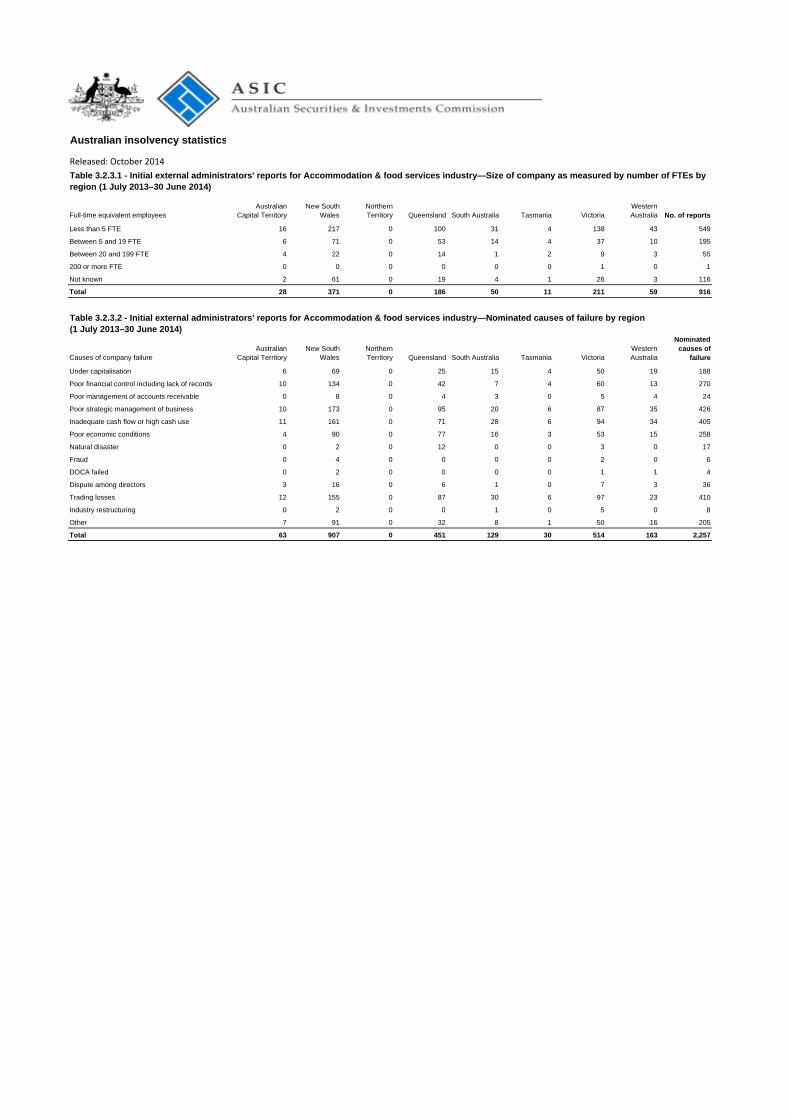
Table 3.2.3.1 - Initial external administrators' reports for Accommodation & food services industry—Size of company as measured by number of FTEs by region
Table 3.2.3.2 - Initial external administrators' reports for Accommodation & food services industry—Nominated causes of failure by region
Table 3.2.3.3 - Initial external administrators' reports for Accommodation & food services industry—Possible misconduct by region
Table 3.2.3.4 - Initial external administrators' reports for Accommodation & food services industry—Assets, liabilities and deficiency by region
Table 3.2.3.5 - Initial external administrators' reports for Accommodation & food services industry—Unpaid employee entitlements by region
Table 3.2.3.6 - Initial external administrators' reports for Accommodation & food services industry—Amount owed to secured creditors by region
Table 3.2.3.7 - Initial external administrators' reports for Accommodation & food services industry—Unpaid taxes and charges by region
Table 3.2.3.8 - Initial external administrators' reports for Accommodation & food services industry—Unsecured creditors by region
Table 3.2.3.9 - Initial external administrators' reports for Accommodation & food services industry—External administrator's remuneration by region
Retail trade industry tables
Table 3.2.4.1 - Initial external administrators' reports for Retail trade industry—Size of company as measured by number of FTEs by region
Table 3.2.4.2 - Initial external administrators' reports for Retail trade industry—Nominated causes of failure by region
Table 3.2.4.3 - Initial external administrators' reports for Retail trade industry—Possible misconduct by region
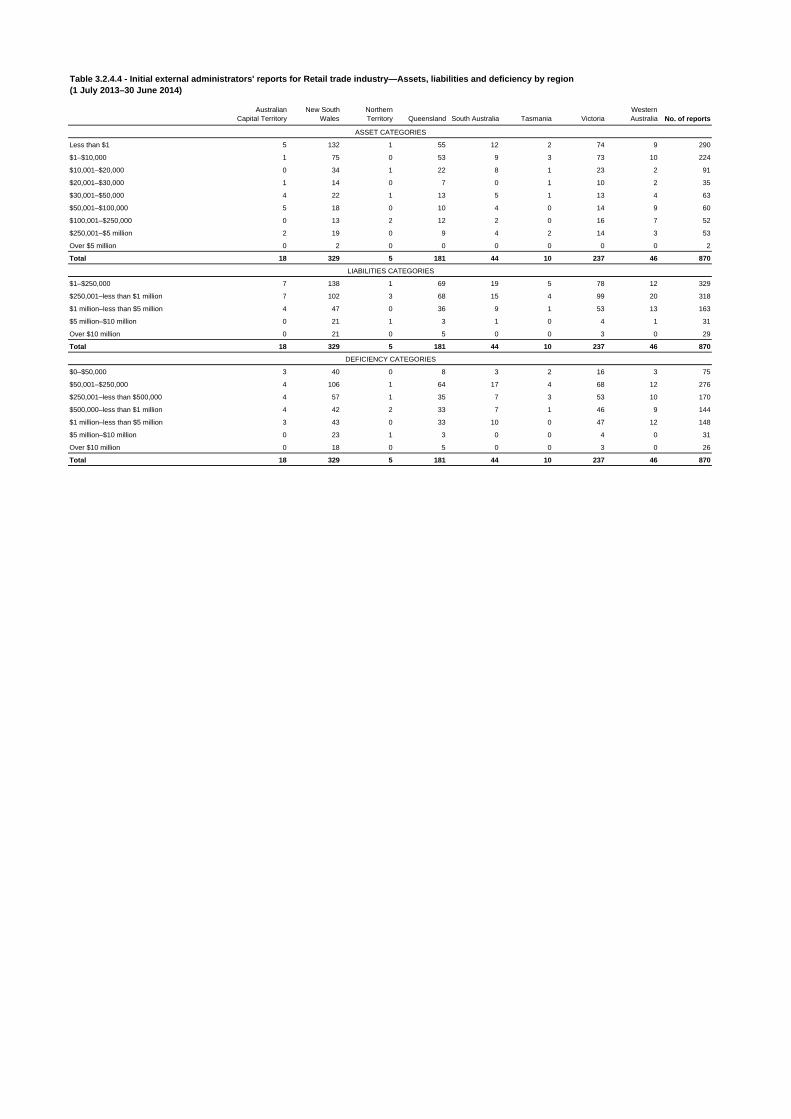
Table 3.2.4.4 - Initial external administrators' reports for Retail trade industry—Assets, liabilities and deficiency by region
Table 3.2.4.5 - Initial external administrators' reports for Retail trade industry—Unpaid employee entitlements by region
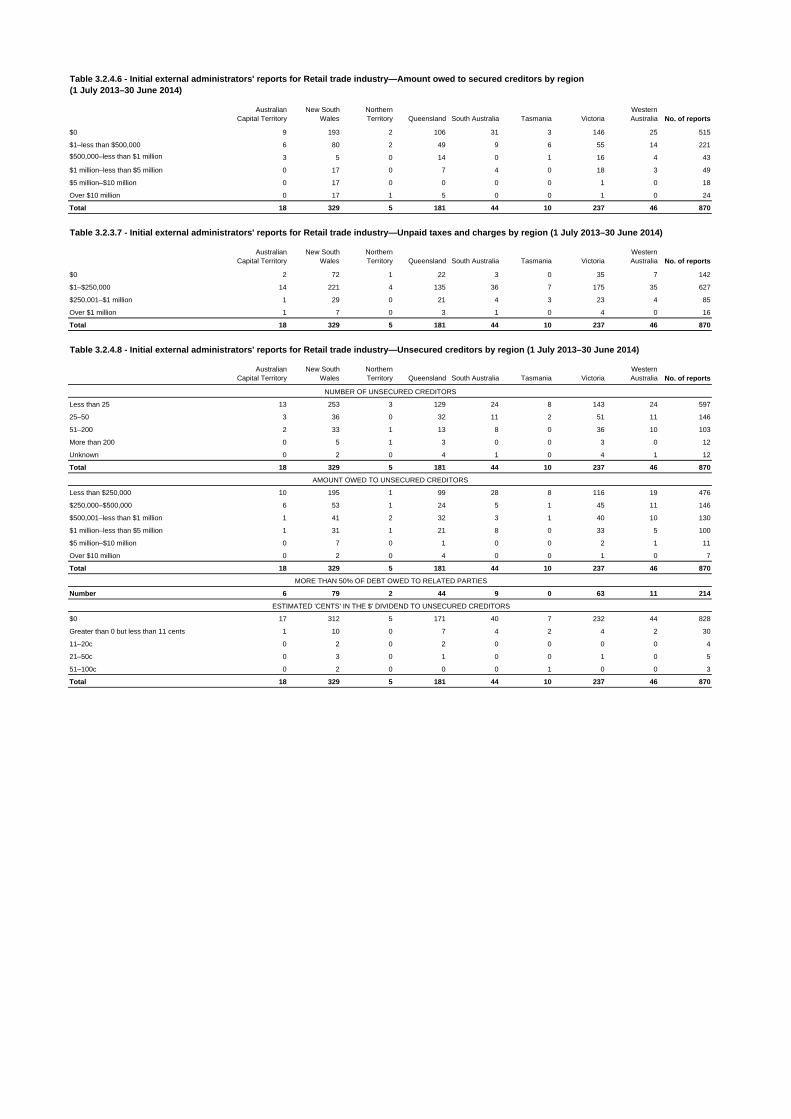
Table 3.2.4.6 - Initial external administrators' reports for Retail trade industry—Amount owed to secured creditors by region
Table 3.2.4.7 - Initial external administrators' reports for Retail trade industry—Unpaid taxes and charges by region
Table 3.2.4.8 - Initial external administrators' reports for Retail trade industry—Unsecured creditors by region
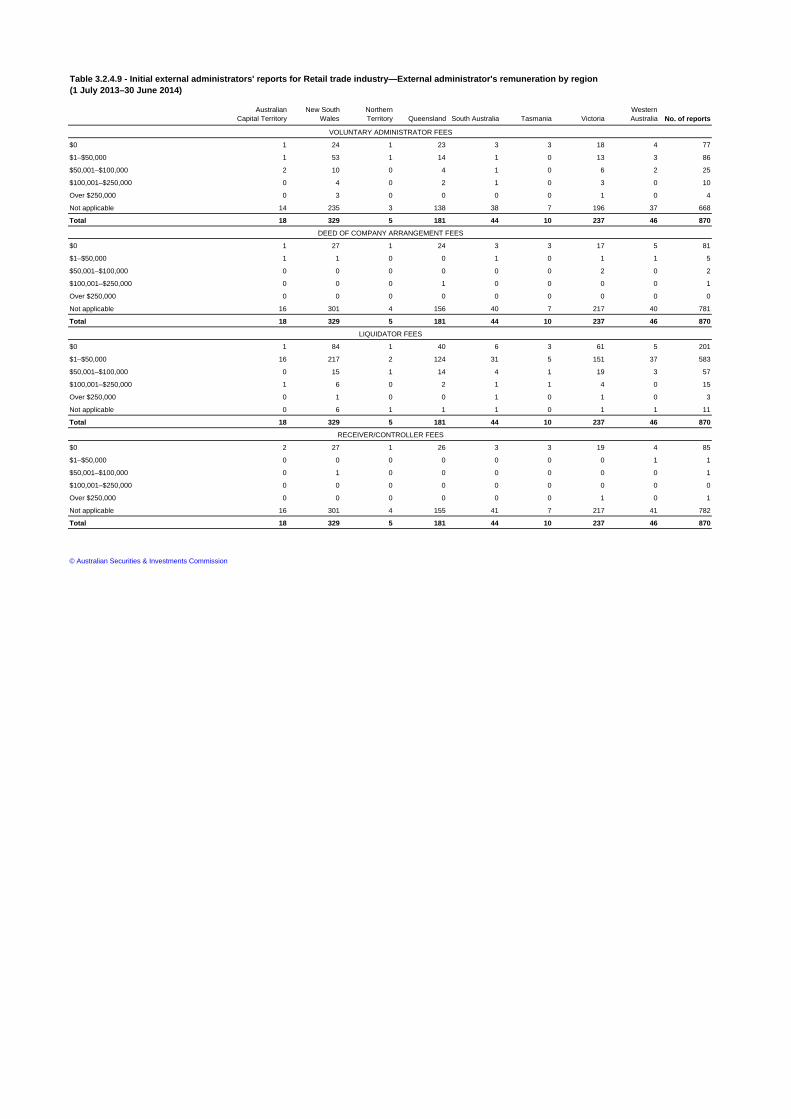
Table 3.2.4.9 - Initial external administrators' reports for Retail trade industry—External administrator's remuneration by region
Transport, postal & warehousing industry tables
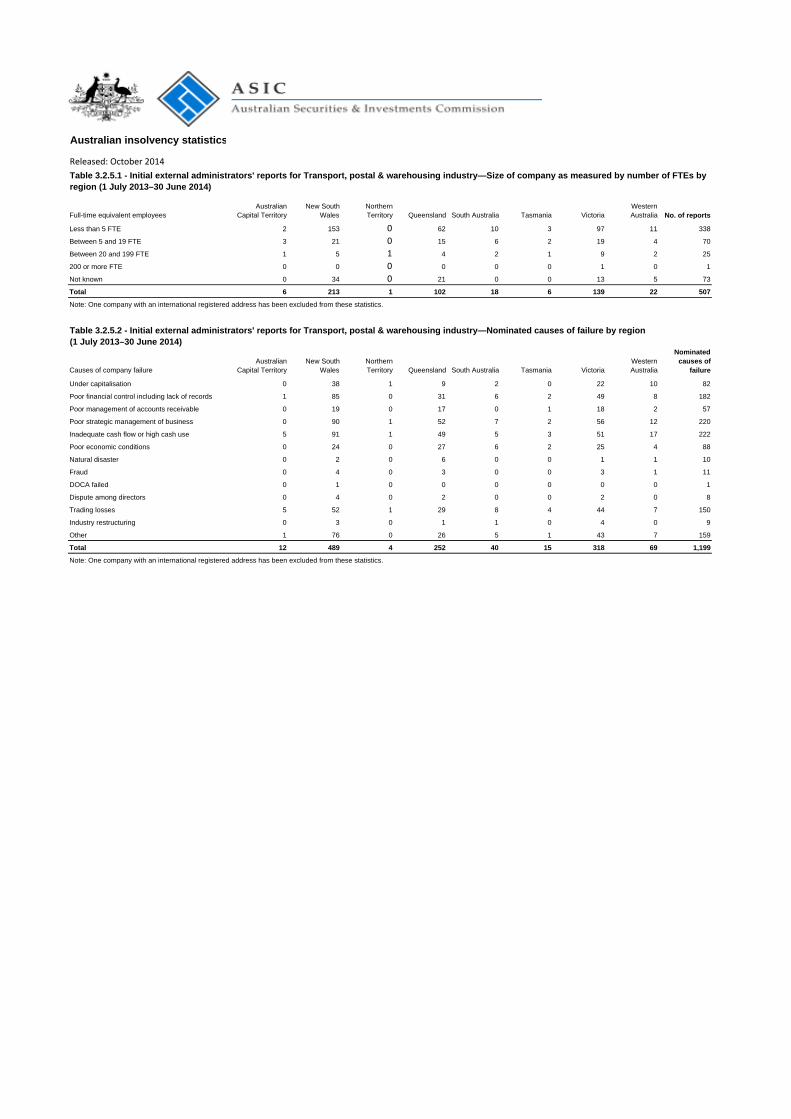
Table 3.2.5.1 - Initial external administrators' reports for Transport, postal & warehousing industry—Size of company as measured by number of FTEs by region
Table 3.2.5.2 - Initial external administrators' reports for Transport, postal & warehousing industry—Nominated causes of failure by region
Table 3.2.5.3 - Initial external administrators' reports for Transport, postal & warehousing industry—Possible misconduct by region
Table 3.2.5.4 - Initial external administrators' reports for Transport, postal & warehousing industry—Assets, liabilities and deficiency by region
Table 3.2.5.5 - Initial external administrators' reports for Transport, postal & warehousing industry—Unpaid employee entitlements by region
Table 3.2.5.6 - Initial external administrators' reports for Transport, postal & warehousing industry—Amount owed to secured creditors by region
Table 3.2.5.7 - Initial external administrators' reports for Transport, postal & warehousing industry—Unpaid taxes and charges by region
Table 3.2.5.8 - Initial external administrators' reports for Transport, postal & warehousing industry—Unsecured creditors by region
Table 3.2.5.9 - Initial external administrators' reports for Transport, postal & warehousing industry—External administrator's remuneration by region
More information available from the ASIC website
Australian insolvency statistics
INFORMATION SHEET 80: How to interpret ASIC insolvency statistics
SERIES 3.1: External administrators' reports for Australia
SERIES 3.3: External administrators' reports time series
REPORT 412: Insolvency statistics: External administrator's reports 1 July 2013–30 June 2014
REPORT 372: Insolvency statistics: External administrators' reports 1 July 2012–30 June 2013
REPORT 297: Insolvency statistics: External administrators' reports 1 July 2011–30 June 2012
REPORT 263: Insolvency statistics: External administrators' reports 1 July 2010–30 June 2011
REPORT 225: Insolvency statistics: External administrators' reports 1 July 2007–30 June 2010
REPORT 132: Insolvency statistics: External administrators' reports 1 July 2004–30 June 2007
REGULATORY GUIDE 16: External administrators: reporting and lodging
Inquiries
For further information about these and related statistics, email [email protected].
© Australian Securities & Investments Commission

Full-time equivalent employeesAustralian
Capital TerritoryNew South
WalesNorthern Territory Queensland South Australia Tasmania Victoria
Western Australia No. of reports
Less than 5 FTE 36 790 9 291 67 14 392 63 1,662
Between 5 and 19 FTE 7 107 2 41 6 3 42 16 224
Between 20 and 199 FTE 0 39 0 17 1 1 23 3 84
200 or more FTE 0 10 0 0 2 0 0 0 12
Not known 4 310 0 95 11 2 67 10 499
Total 47 1,256 11 444 87 20 524 92 2,481
Note: One company with an international registered address has been excluded from these statistics.
Causes of company failureAustralian
Capital TerritoryNew South
WalesNorthern Territory Queensland South Australia Tasmania Victoria
Western Australia
Nominated causes of
failure
Under capitalisation 12 143 1 66 19 1 88 19 349
Poor financial control including lack of records 17 555 0 105 24 4 159 30 894
Poor management of accounts receivable 1 97 1 46 8 1 51 16 221
Poor strategic management of business 12 508 3 217 32 7 176 44 999
Inadequate cash flow or high cash use 20 523 7 136 36 5 177 44 948
Poor economic conditions 11 201 3 99 15 4 97 14 444
Natural disaster 0 2 0 14 1 0 5 0 22
Fraud 1 9 0 8 5 0 6 3 32
DOCA failed 0 0 0 0 0 0 1 1 2
Dispute among directors 0 20 1 8 0 4 16 5 54
Trading losses 14 353 5 106 30 3 129 31 671
Industry restructuring 0 32 0 3 0 0 9 1 45
Other 15 359 3 133 24 8 174 23 739
Total 103 2,802 24 941 194 37 1,088 231 5,420
Note: One company with an international registered address has been excluded from these statistics.
Table 3.2.1.2 - Initial external administrators' reports for Other (business & personal) services industry—Nominated causes of failure by region (1 July 2013–30 June 2014)
Australian insolvency statistics
Released: October 2014
Table 3.2.1.1 - Initial external administrators' reports for Other (business & personal) services industry—Size of company as measured by number of FTEs by region (1 July 2013–30 June 2014)
Australian Capital Territory
New South Wales
Northern Territory Queensland South Australia Tasmania Victoria
Western Australia Total
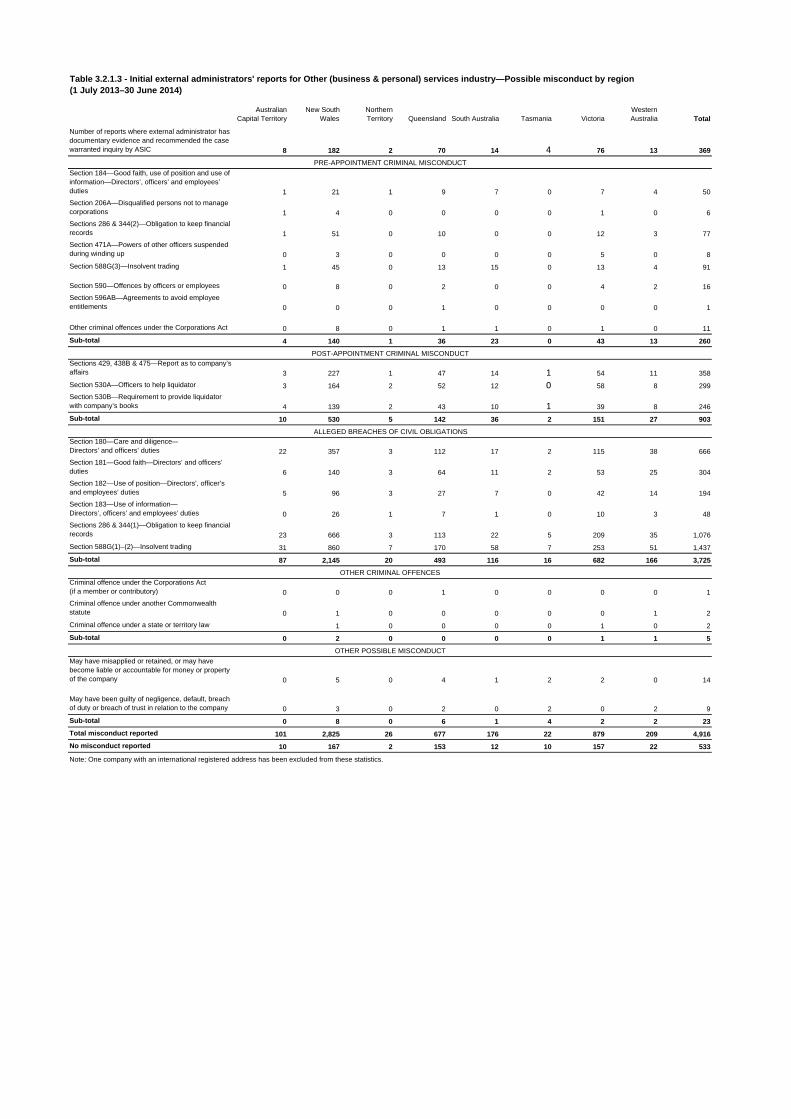
Number of reports where external administrator has documentary evidence and recommended the case warranted inquiry by ASIC 8 182 2 70 14 4 76 13 369
Section 184—Good faith, use of position and use of information—Directors’, officers’ and employees’ duties 1 21 1 9 7 0 7 4 50
Section 206A—Disqualified persons not to manage corporations 1 4 0 0 0 0 1 0 6
Sections 286 & 344(2)—Obligation to keep financial records 1 51 0 10 0 0 12 3 77
Section 471A—Powers of other officers suspended during winding up 0 3 0 0 0 0 5 0 8
Section 588G(3)—Insolvent trading 1 45 0 13 15 0 13 4 91
Section 590—Offences by officers or employees 0 8 0 2 0 0 4 2 16
Section 596AB—Agreements to avoid employee entitlements 0 0 0 1 0 0 0 0 1
Other criminal offences under the Corporations Act 0 8 0 1 1 0 1 0 11
Sub-total 4 140 1 36 23 0 43 13 260
Sections 429, 438B & 475—Report as to company’s affairs 3 227 1 47 14 1 54 11 358
Section 530A—Officers to help liquidator 3 164 2 52 12 0 58 8 299
Section 530B—Requirement to provide liquidator with company’s books 4 139 2 43 10 1 39 8 246
Sub-total 10 530 5 142 36 2 151 27 903
Section 180—Care and diligence—Directors’ and officers’ duties 22 357 3 112 17 2 115 38 666
Section 181—Good faith—Directors’ and officers’ duties 6 140 3 64 11 2 53 25 304
Section 182—Use of position—Directors’, officer’s and employees’ duties 5 96 3 27 7 0 42 14 194
Section 183—Use of information—Directors’, officers’ and employees’ duties 0 26 1 7 1 0 10 3 48
Sections 286 & 344(1)—Obligation to keep financial records 23 666 3 113 22 5 209 35 1,076
Section 588G(1)–(2)—Insolvent trading 31 860 7 170 58 7 253 51 1,437
Sub-total 87 2,145 20 493 116 16 682 166 3,725
Criminal offence under the Corporations Act (if a member or contributory) 0 0 0 1 0 0 0 0 1
Criminal offence under another Commonwealth statute 0 1 0 0 0 0 0 1 2
Criminal offence under a state or territory law 1 0 0 0 0 1 0 2
Sub-total 0 2 0 0 0 0 1 1 5
May have misapplied or retained, or may have become liable or accountable for money or property of the company 0 5 0 4 1 2 2 0 14
May have been guilty of negligence, default, breach of duty or breach of trust in relation to the company 0 3 0 2 0 2 0 2 9
Sub-total 0 8 0 6 1 4 2 2 23
Total misconduct reported 101 2,825 26 677 176 22 879 209 4,916
No misconduct reported 10 167 2 153 12 10 157 22 533
Note: One company with an international registered address has been excluded from these statistics.
PRE-APPOINTMENT CRIMINAL MISCONDUCT
POST-APPOINTMENT CRIMINAL MISCONDUCT
ALLEGED BREACHES OF CIVIL OBLIGATIONS
OTHER CRIMINAL OFFENCES
OTHER POSSIBLE MISCONDUCT
Table 3.2.1.3 - Initial external administrators' reports for Other (business & personal) services industry—Possible misconduct by region (1 July 2013–30 June 2014)

Australian Capital Territory
New South Wales
Northern Territory Queensland South Australia Tasmania Victoria
Western Australia No. of reports
Less than $1 16 708 5 204 39 11 217 42 1,242
$1–$10,000 13 247 3 96 22 0 126 13 520
$10,001–$20,000 5 77 0 31 7 0 48 6 174
$20,001–$30,000 5 46 1 22 1 1 31 4 111
$30,001–$50,000 3 35 0 19 6 2 22 7 94
$50,001–$100,000 2 40 0 25 4 1 29 7 108
$100,001–$250,000 2 41 1 16 6 1 19 4 90
$250,001–$5 million 1 57 1 31 2 4 32 9 137
Over $5 million 0 5 0 0 0 0 0 0 5
Total 47 1,256 11 444 87 20 524 92 2,481
$1–$250,000 28 745 2 202 43 10 250 35 1,315
$250,001–less than $1 million 16 329 9 163 23 7 182 37 766
$1 million–less than $5 million 3 122 0 60 16 3 70 19 293
$5 million–$10 million 0 22 0 8 2 0 15 1 48
Over $10 million 0 38 0 11 3 0 7 0 59
Total 47 1,256 11 444 87 20 524 92 2,481
$0–$50,000 12 330 1 51 17 8 64 9 492
$50,001–$250,000 18 436 2 168 28 5 201 31 889
$250,001–less than $500,000 7 192 7 91 13 3 102 20 435
$500,000–less than $1 million 7 130 1 63 8 1 74 14 298
$1 million–less than $5 million 3 116 0 51 16 3 63 16 268
$5 million–$10 million 0 19 0 10 3 0 14 1 47
Over $10 million 0 33 0 10 2 0 6 1 52
Total 47 1,256 11 444 87 20 524 92 2,481
Note: One company with an international registered address has been excluded from these statistics.
ASSET CATEGORIES
Table 3.2.1.4 - Initial external administrators' reports for Other (business & personal) services industry—Assets, liabilities and deficiency by region (1 July 2013–30 June 2014)
LIABILITIES CATEGORIES
DEFICIENCY CATEGORIES

Australian Capital Territory
New South Wales
Northern Territory Queensland South Australia Tasmania Victoria
Western Australia No. of reports
$1–$1 000 1 32 1 15 0 1 7 2 59
$1,001–$10,000 4 105 0 28 7 2 45 6 197
$10,001–$50,000 0 1 0 0 0 0 0 0 1
$50,001–$150,000 1 41 0 14 4 0 25 3 88
$150,001–$250,000 0 13 0 3 0 0 7 2 25
$250,001–$500,000 0 1 0 0 0 0 2 0 3
$500,001–less than $1.5 million 0 4 0 1 0 0 0 0 5
$1.5 million–$5 million 0 3 0 1 0 0 0 0 4
Over $5 million 0 0 0 0 0 0 0 0 0
Not Applicable 41 1,055 10 382 76 17 437 79 2,097
Total 47 1,255 11 444 87 20 523 92 2,479
$1–$1,000 2 22 0 15 0 2 4 1 46
$1,001–$10,000 5 93 0 29 14 2 48 8 199
$10,001–$50,000 2 58 1 19 4 1 26 4 115
$50,001–$150,000 0 18 0 11 0 1 10 3 43
$150,001–$250,000 0 5 0 1 0 0 2 0 8
$250,001–$500,000 0 4 0 0 0 0 2 0 6
$500,001–less than $1.5 million 0 2 0 0 0 0 0 0 2
$1.5 million–$5 million 0 2 0 0 0 0 0 0 2
Over $5 million 0 0 0 0 0 0 0 0 0
Not Applicable 38 1,051 10 369 69 14 431 76 2,058
Total 47 1,255 11 444 87 20 523 92 2,479
$1–$1,000 1 24 0 14 0 1 2 1 43
$1,001–$10,000 1 32 0 18 5 0 17 3 76
$10,001–$50,000 1 23 1 18 1 1 14 4 63
$50,001–$150,000 0 11 0 1 0 1 6 1 20
$150,001–$250,000 0 4 0 0 0 0 2 0 6
$250,001–$500,000 0 4 0 0 0 0 1 0 5
$500,001–less than $1.5 million 0 2 0 0 0 0 2 0 4
$1.5 million–$5 million 0 1 0 0 0 0 0 0 1
Over $5 million 0 1 0 0 0 0 0 0 1
Not Applicable 44 1,153 10 393 81 17 479 83 2,260
Total 47 1,255 11 444 87 20 523 92 2,479
$1–$1,000 1 18 0 13 0 1 1 0 34
$1,001–$10,000 0 10 0 4 3 0 4 2 23
$10,001–$50,000 0 15 1 11 2 0 6 0 35
$50,001–$150,000 1 10 0 5 1 2 7 3 29
$150,001–$250,000 0 4 0 0 0 0 0 0 4
$250,001–$500,000 0 3 0 1 0 0 4 0 8
$500,001–less than $1.5 million 0 4 0 0 0 0 2 0 6
$1.5 million–$5 million 0 1 0 0 0 0 0 0 1
Over $5 million 0 1 0 1 0 0 1 1 4
Not Applicable 45 1,189 10 409 81 17 498 86 2,335
Total 47 1,255 11 444 87 20 523 92 2,479
$1–$1,000 0 18 0 12 1 2 3 0 36
$1,001–$10,000 0 26 0 5 0 1 11 2 45
$10,001–$50,000 0 25 0 9 2 1 14 4 55
$50,001–$150,000 1 10 0 4 0 0 5 0 20
$150,001–$250,000 0 1 0 0 0 0 3 0 4
$250,001–$500,000 0 3 0 0 0 0 1 0 4
$500,001–less than $1.5 million 0 0 0 0 0 0 0 0 0
$1.5 million–$5 million 0 1 0 0 0 0 0 0 1
Over $5 million 0 2 0 0 0 0 0 0 2
Not Applicable 46 1,169 11 414 84 16 486 86 2,312
Total 47 1,255 11 444 87 20 523 92 2,479
$1–$100,000 15 316 3 143 26 9 188 34 734
$100,001–$250,000 2 31 1 14 5 0 23 6 82
$250,001–$1 million 0 9 1 5 1 0 11 1 28
Over $1 million 0 4 0 0 0 0 0 0 4
Not Applicable 30 896 6 282 55 11 302 51 1,633
Total 47 1,256 11 444 87 20 524 92 2,481
Note 1: One company with an international registered address has been excluded from these statistics.
UNPAID WAGES
UNPAID ANNUAL LEAVE
Note 2: Reports identified as being internally inconsistent were excluded from this table. No reports were excluded from superannuation.
UNPAID PAY IN LIEU OF NOTICE
UNPAID REDUNDANCY
UNPAID LONG SERVICE LEAVE
UNPAID SUPERANNUATION
Table 3.2.1.5 - Initial external administrators' reports for Other (business & personal) services industry—Unpaid employee entitlements by region (1 July 2013–30 June 2014)
Australian Capital Territory
New South Wales
Northern Territory Queensland South Australia Tasmania Victoria
Western Australia No. of reports
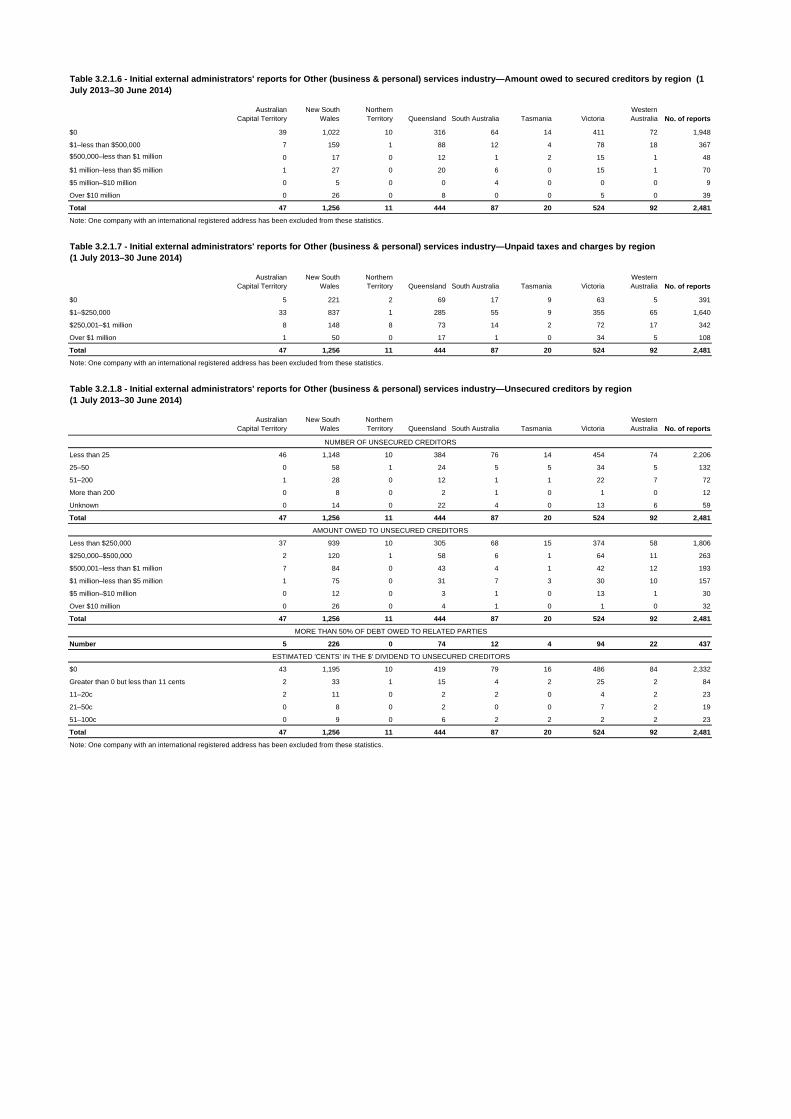
$0 39 1,022 10 316 64 14 411 72 1,948
$1–less than $500,000 7 159 1 88 12 4 78 18 367
$500,000–less than $1 million 0 17 0 12 1 2 15 1 48
$1 million–less than $5 million 1 27 0 20 6 0 15 1 70
$5 million–$10 million 0 5 0 0 4 0 0 0 9
Over $10 million 0 26 0 8 0 0 5 0 39
Total 47 1,256 11 444 87 20 524 92 2,481
Note: One company with an international registered address has been excluded from these statistics.
Australian Capital Territory
New South Wales
Northern Territory Queensland South Australia Tasmania Victoria
Western Australia No. of reports
$0 5 221 2 69 17 9 63 5 391
$1–$250,000 33 837 1 285 55 9 355 65 1,640
$250,001–$1 million 8 148 8 73 14 2 72 17 342
Over $1 million 1 50 0 17 1 0 34 5 108
Total 47 1,256 11 444 87 20 524 92 2,481
Note: One company with an international registered address has been excluded from these statistics.
Australian Capital Territory
New South Wales
Northern Territory Queensland South Australia Tasmania Victoria
Western Australia No. of reports
Less than 25 46 1,148 10 384 76 14 454 74 2,206
25–50 0 58 1 24 5 5 34 5 132
51–200 1 28 0 12 1 1 22 7 72
More than 200 0 8 0 2 1 0 1 0 12
Unknown 0 14 0 22 4 0 13 6 59
Total 47 1,256 11 444 87 20 524 92 2,481
Less than $250,000 37 939 10 305 68 15 374 58 1,806
$250,000–$500,000 2 120 1 58 6 1 64 11 263
$500,001–less than $1 million 7 84 0 43 4 1 42 12 193
$1 million–less than $5 million 1 75 0 31 7 3 30 10 157
$5 million–$10 million 0 12 0 3 1 0 13 1 30
Over $10 million 0 26 0 4 1 0 1 0 32
Total 47 1,256 11 444 87 20 524 92 2,481
Number 5 226 0 74 12 4 94 22 437
$0 43 1,195 10 419 79 16 486 84 2,332
Greater than 0 but less than 11 cents 2 33 1 15 4 2 25 2 84
11–20c 2 11 0 2 2 0 4 2 23
21–50c 0 8 0 2 0 0 7 2 19
51–100c 0 9 0 6 2 2 2 2 23
Total 47 1,256 11 444 87 20 524 92 2,481
Note: One company with an international registered address has been excluded from these statistics.
Table 3.2.1.6 - Initial external administrators' reports for Other (business & personal) services industry—Amount owed to secured creditors by region (1 July 2013–30 June 2014)
Table 3.2.1.7 - Initial external administrators' reports for Other (business & personal) services industry—Unpaid taxes and charges by region (1 July 2013–30 June 2014)
Table 3.2.1.8 - Initial external administrators' reports for Other (business & personal) services industry—Unsecured creditors by region (1 July 2013–30 June 2014)
NUMBER OF UNSECURED CREDITORS
AMOUNT OWED TO UNSECURED CREDITORS
ESTIMATED 'CENTS' IN THE $' DIVIDEND TO UNSECURED CREDITORS
MORE THAN 50% OF DEBT OWED TO RELATED PARTIES
Australian Capital Territory
New South Wales
Northern Territory Queensland South Australia Tasmania Victoria
Western Australia No. of reports
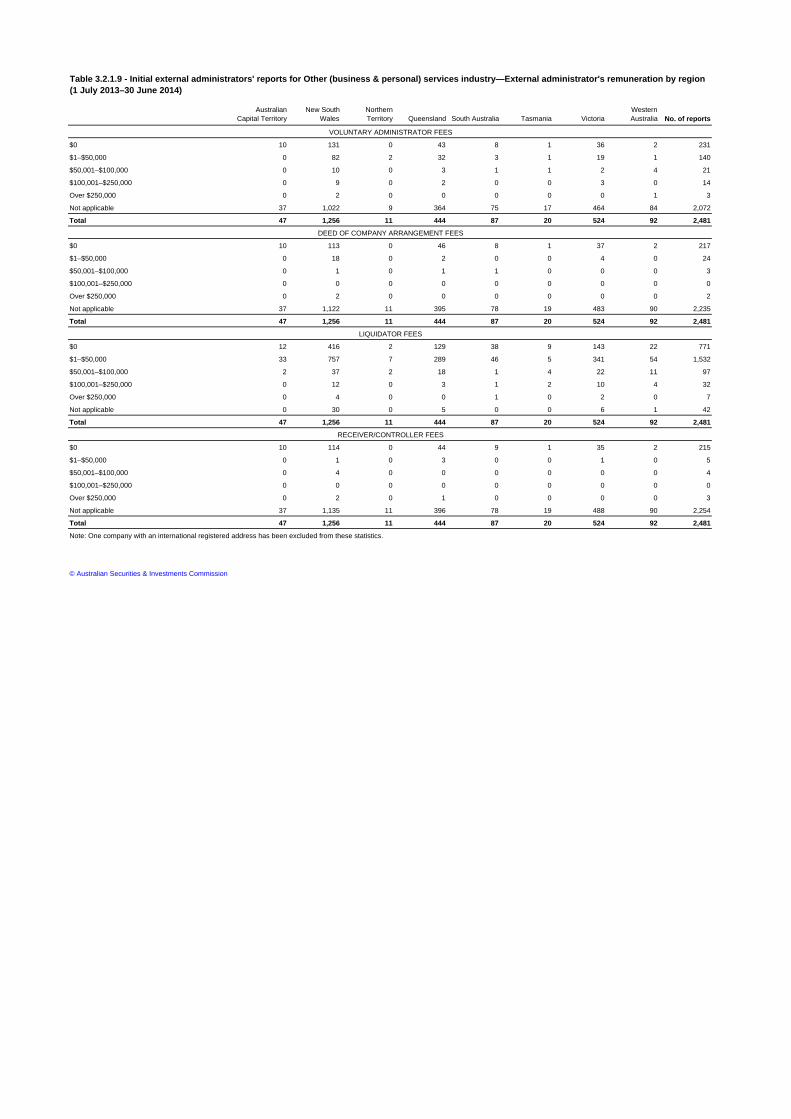
$0 10 131 0 43 8 1 36 2 231
$1–$50,000 0 82 2 32 3 1 19 1 140
$50,001–$100,000 0 10 0 3 1 1 2 4 21
$100,001–$250,000 0 9 0 2 0 0 3 0 14
Over $250,000 0 2 0 0 0 0 0 1 3
Not applicable 37 1,022 9 364 75 17 464 84 2,072
Total 47 1,256 11 444 87 20 524 92 2,481
$0 10 113 0 46 8 1 37 2 217
$1–$50,000 0 18 0 2 0 0 4 0 24
$50,001–$100,000 0 1 0 1 1 0 0 0 3
$100,001–$250,000 0 0 0 0 0 0 0 0 0
Over $250,000 0 2 0 0 0 0 0 0 2
Not applicable 37 1,122 11 395 78 19 483 90 2,235
Total 47 1,256 11 444 87 20 524 92 2,481
$0 12 416 2 129 38 9 143 22 771
$1–$50,000 33 757 7 289 46 5 341 54 1,532
$50,001–$100,000 2 37 2 18 1 4 22 11 97
$100,001–$250,000 0 12 0 3 1 2 10 4 32
Over $250,000 0 4 0 0 1 0 2 0 7
Not applicable 0 30 0 5 0 0 6 1 42
Total 47 1,256 11 444 87 20 524 92 2,481
$0 10 114 0 44 9 1 35 2 215
$1–$50,000 0 1 0 3 0 0 1 0 5
$50,001–$100,000 0 4 0 0 0 0 0 0 4
$100,001–$250,000 0 0 0 0 0 0 0 0 0
Over $250,000 0 2 0 1 0 0 0 0 3
Not applicable 37 1,135 11 396 78 19 488 90 2,254
Total 47 1,256 11 444 87 20 524 92 2,481
Note: One company with an international registered address has been excluded from these statistics.
© Australian Securities & Investments Commission
VOLUNTARY ADMINISTRATOR FEES
DEED OF COMPANY ARRANGEMENT FEES
LIQUIDATOR FEES
RECEIVER/CONTROLLER FEES
Table 3.2.1.9 - Initial external administrators' reports for Other (business & personal) services industry—External administrator's remuneration by region (1 July 2013–30 June 2014)
Full-time equivalent employeesAustralian
Capital TerritoryNew South
WalesNorthern Territory Queensland South Australia Tasmania Victoria
Western Australia No. of reports
Less than 5 FTE 36 617 4 249 51 21 373 104 1,455
Between 5 and 19 FTE 11 91 0 66 12 5 85 33 303
Between 20 and 199 FTE 4 29 0 20 4 2 28 13 100
200 or more FTE 0 0 0 0 0 0 0 0 0
Not known 13 145 2 64 7 0 55 9 295
Total 64 882 6 399 74 28 541 159 2,153
Causes of company failureAustralian
Capital TerritoryNew South
WalesNorthern Territory Queensland South Australia Tasmania Victoria
Western Australia
Nominated causes of
failure
Under capitalisation 16 155 1 73 20 8 118 44 435
Poor financial control including lack of records 21 322 3 85 21 5 154 49 660
Poor magement of accounts receivable 10 118 0 60 11 6 99 32 336
Poor strategic magement of business 22 347 2 186 30 18 203 84 892
Idequate cash flow or high cash use 30 401 3 206 27 15 231 87 1,000
Poor economic conditions 7 194 2 159 26 5 118 47 558
Natural disaster 0 5 0 8 0 0 4 0 17
Fraud 1 7 0 3 0 0 17 2 30
DOCA failed 0 4 0 26 0 0 4 1 35
Dispute among directors 2 9 0 12 0 1 19 9 52
Trading losses 24 254 1 117 26 15 184 77 698
Industry restructuring 0 3 0 28 1 1 14 3 50
Other 19 277 3 84 16 8 160 44 611
Total 152 2,096 15 1,047 178 82 1,325 479 5,374
Table 3.2.2.2 - Initial external administrators' reports for Construction industry—Nominated causes of failure by region (1 July 2013–30 June 2014)
Australian insolvency statistics
Released: October 2014
Table 3.2.2.1 - Initial external administrators' reports for Construction industry—Size of company as measured by number of FTEs by region (1 July 2013–30 June 2014)
Australian Capital Territory
New South Wales
Northern Territory Queensland South Australia Tasmania Victoria
Western Australia Total
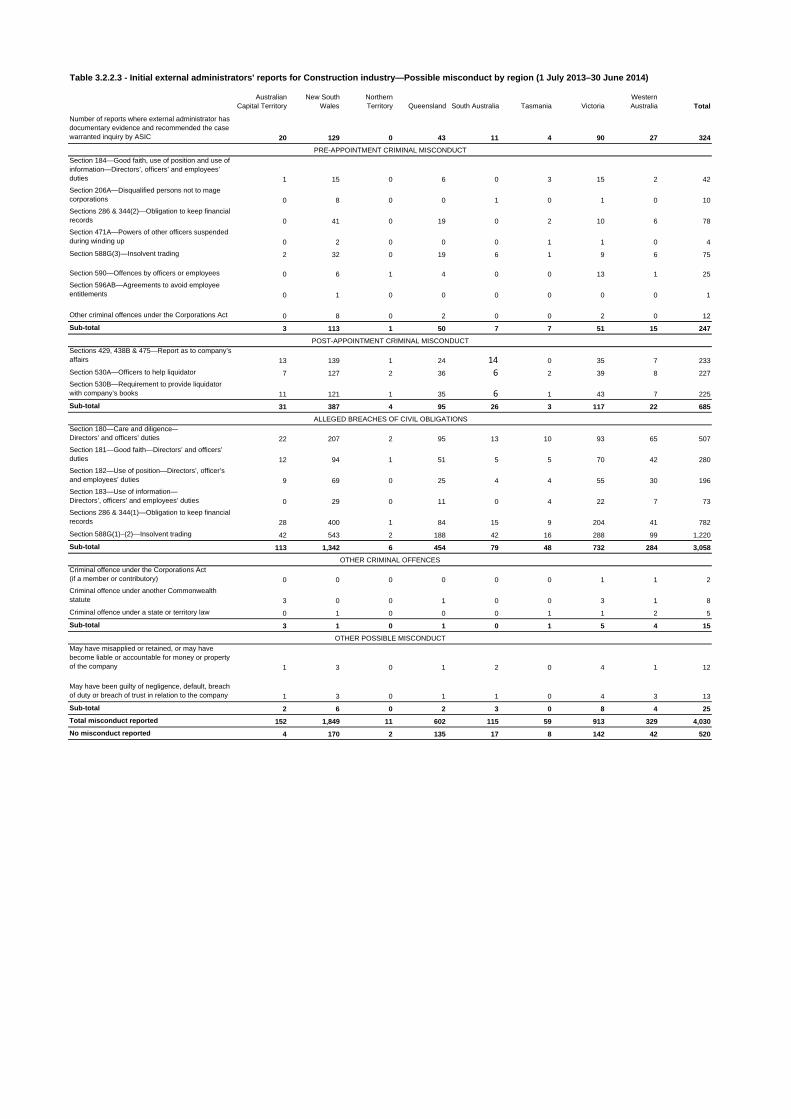
Number of reports where external administrator has documentary evidence and recommended the case warranted inquiry by ASIC 20 129 0 43 11 4 90 27 324
Section 184—Good faith, use of position and use of information—Directors’, officers’ and employees’ duties 1 15 0 6 0 3 15 2 42
Section 206A—Disqualified persons not to mage corporations 0 8 0 0 1 0 1 0 10
Sections 286 & 344(2)—Obligation to keep financial records 0 41 0 19 0 2 10 6 78
Section 471A—Powers of other officers suspended during winding up 0 2 0 0 0 1 1 0 4
Section 588G(3)—Insolvent trading 2 32 0 19 6 1 9 6 75
Section 590—Offences by officers or employees 0 6 1 4 0 0 13 1 25
Section 596AB—Agreements to avoid employee entitlements 0 1 0 0 0 0 0 0 1
Other criminal offences under the Corporations Act 0 8 0 2 0 0 2 0 12
Sub-total 3 113 1 50 7 7 51 15 247
Sections 429, 438B & 475—Report as to company’s affairs 13 139 1 24 14 0 35 7 233
Section 530A—Officers to help liquidator 7 127 2 36 6 2 39 8 227
Section 530B—Requirement to provide liquidator with company’s books 11 121 1 35 6 1 43 7 225
Sub-total 31 387 4 95 26 3 117 22 685
Section 180—Care and diligence—Directors’ and officers’ duties 22 207 2 95 13 10 93 65 507
Section 181—Good faith—Directors’ and officers’ duties 12 94 1 51 5 5 70 42 280
Section 182—Use of position—Directors’, officer’s and employees’ duties 9 69 0 25 4 4 55 30 196
Section 183—Use of information—Directors’, officers’ and employees’ duties 0 29 0 11 0 4 22 7 73
Sections 286 & 344(1)—Obligation to keep financial records 28 400 1 84 15 9 204 41 782
Section 588G(1)–(2)—Insolvent trading 42 543 2 188 42 16 288 99 1,220
Sub-total 113 1,342 6 454 79 48 732 284 3,058
Criminal offence under the Corporations Act (if a member or contributory) 0 0 0 0 0 0 1 1 2
Criminal offence under another Commonwealth statute 3 0 0 1 0 0 3 1 8
Criminal offence under a state or territory law 0 1 0 0 0 1 1 2 5
Sub-total 3 1 0 1 0 1 5 4 15
May have misapplied or retained, or may have become liable or accountable for money or property of the company 1 3 0 1 2 0 4 1 12
May have been guilty of negligence, default, breach of duty or breach of trust in relation to the company 1 3 0 1 1 0 4 3 13
Sub-total 2 6 0 2 3 0 8 4 25
Total misconduct reported 152 1,849 11 602 115 59 913 329 4,030
No misconduct reported 4 170 2 135 17 8 142 42 520
Table 3.2.2.3 - Initial external administrators' reports for Construction industry—Possible misconduct by region (1 July 2013–30 June 2014)
OTHER POSSIBLE MISCONDUCT
OTHER CRIMINAL OFFENCES
POST-APPOINTMENT CRIMINAL MISCONDUCT
ALLEGED BREACHES OF CIVIL OBLIGATIONS
PRE-APPOINTMENT CRIMINAL MISCONDUCT
Australian Capital Territory
New South Wales
Northern Territory Queensland South Australia Tasmania Victoria
Western Australia No. of reports
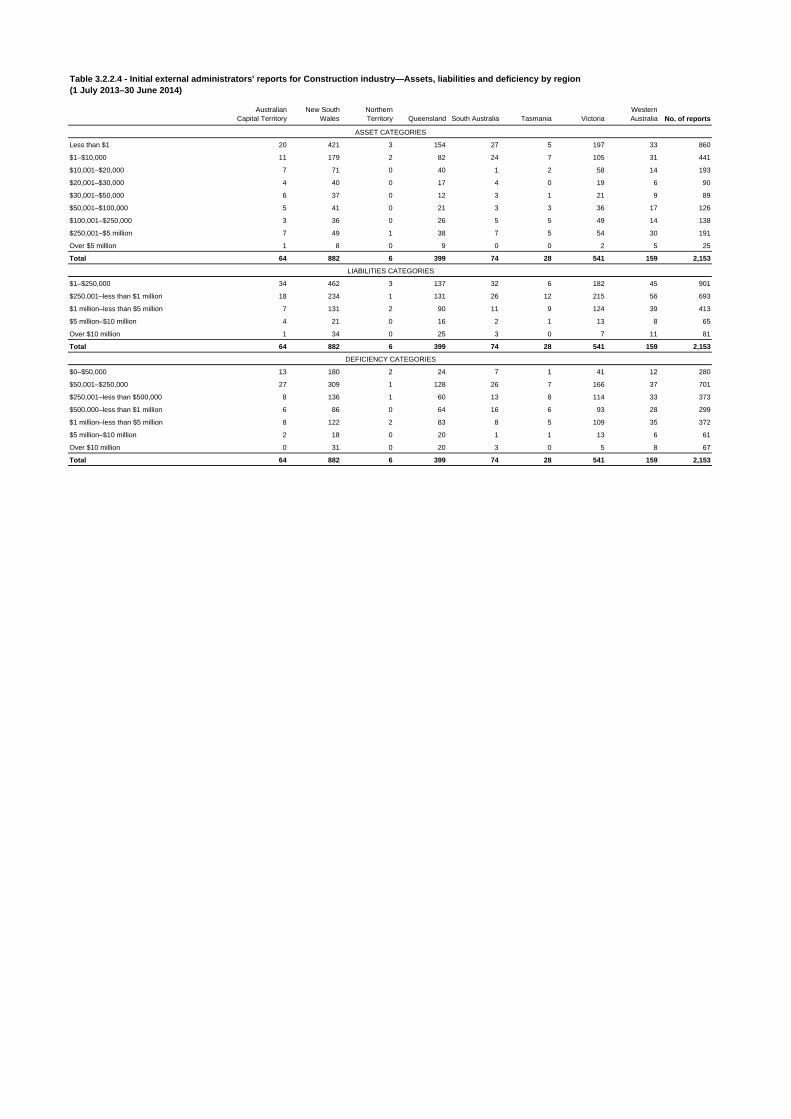
Less than $1 20 421 3 154 27 5 197 33 860
$1–$10,000 11 179 2 82 24 7 105 31 441
$10,001–$20,000 7 71 0 40 1 2 58 14 193
$20,001–$30,000 4 40 0 17 4 0 19 6 90
$30,001–$50,000 6 37 0 12 3 1 21 9 89
$50,001–$100,000 5 41 0 21 3 3 36 17 126
$100,001–$250,000 3 36 0 26 5 5 49 14 138
$250,001–$5 million 7 49 1 38 7 5 54 30 191
Over $5 million 1 8 0 9 0 0 2 5 25
Total 64 882 6 399 74 28 541 159 2,153
$1–$250,000 34 462 3 137 32 6 182 45 901
$250,001–less than $1 million 18 234 1 131 26 12 215 56 693
$1 million–less than $5 million 7 131 2 90 11 9 124 39 413
$5 million–$10 million 4 21 0 16 2 1 13 8 65
Over $10 million 1 34 0 25 3 0 7 11 81
Total 64 882 6 399 74 28 541 159 2,153
$0–$50,000 13 180 2 24 7 1 41 12 280
$50,001–$250,000 27 309 1 128 26 7 166 37 701
$250,001–less than $500,000 8 136 1 60 13 8 114 33 373
$500,000–less than $1 million 6 86 0 64 16 6 93 28 299
$1 million–less than $5 million 8 122 2 83 8 5 109 35 372
$5 million–$10 million 2 18 0 20 1 1 13 6 61
Over $10 million 0 31 0 20 3 0 5 8 67
Total 64 882 6 399 74 28 541 159 2,153
DEFICIENCY CATEGORIES
LIABILITIES CATEGORIES
Table 3.2.2.4 - Initial external administrators' reports for Construction industry—Assets, liabilities and deficiency by region (1 July 2013–30 June 2014)
ASSET CATEGORIES
Australian Capital Territory
New South Wales
Northern Territory Queensland South Australia Tasmania Victoria
Western Australia No. of reports
$1–$1 000 5 26 0 14 3 0 10 3 61
$1,001–$10,000 2 73 0 25 8 8 51 11 178
$10,001–$50,000 4 33 0 23 6 3 36 11 116
$50,001–$150,000 0 6 0 7 2 0 12 4 31
$150,001–$250,000 0 1 0 3 0 0 0 6 10
$250,001–$500,000 0 3 0 0 0 0 1 0 4
$500,001–less than $1.5 million 0 0 0 2 0 0 0 0 2
$1.5 million–$5 million 0 0 0 0 0 0 0 0 0
Over $5 million 0 0 0 0 0 0 0 0 0
Not Applicable 53 739 6 325 55 17 430 123 1,748
Total 64 881 6 399 74 28 540 158 2,150
$1–$1,000 8 25 0 11 0 0 8 2 54
$1,001–$10,000 3 65 0 26 8 4 52 13 171
$10,001–$50,000 1 49 0 35 8 6 44 18 161
$50,001–$150,000 2 13 0 12 8 2 19 6 62
$150,001–$250,000 1 4 0 3 0 0 5 5 18
$250,001–$500,000 0 3 0 0 0 0 2 1 6
$500,001–less than $1.5 million 0 0 0 0 0 0 0 1 1
$1.5 million–$5 million 0 0 0 0 0 0 0 0 0
Over $5 million 0 1 0 0 0 0 0 0 1
Not Applicable 49 721 6 312 50 16 410 112 1,676
Total 64 881 6 399 74 28 540 158 2,150
$1–$1,000 4 22 0 10 0 2 6 2 46
$1,001–$10,000 0 31 0 16 9 2 26 6 90
$10,001–$50,000 2 25 0 21 10 5 29 13 105
$50,001–$150,000 1 5 0 8 2 1 15 4 36
$150,001–$250,000 1 1 0 1 1 0 3 4 11
$250,001–$500,000 0 1 0 0 0 0 1 1 3
$500,001–less than $1.5 million 0 0 0 0 0 0 0 1 1
$1.5 million–$5 million 0 0 0 0 0 0 0 0 0
Over $5 million 0 0 0 0 0 0 0 0 0
Not Applicable 56 796 6 343 52 18 460 127 1,858
Total 64 881 6 399 74 28 540 158 2,150
$1–$1,000 5 17 0 8 0 2 6 3 41
$1,001–$10,000 0 18 0 8 5 0 17 5 53
$10,001–$50,000 1 21 0 11 7 4 12 5 61
$50,001–$150,000 2 8 0 12 6 2 14 4 48
$150,001–$250,000 1 3 0 4 1 1 7 6 23
$250,001–$500,000 0 3 0 1 0 0 4 3 11
$500,001–less than $1.5 million 0 0 0 0 0 0 1 0 1
$1.5 million–$5 million 0 1 0 0 0 0 0 0 1
Over $5 million 0 0 0 0 0 0 0 0 0
Not Applicable 55 810 6 355 55 19 479 132 1,911
Total 64 881 6 399 74 28 540 158 2,150
$1–$1,000 7 18 0 8 2 2 4 2 43
$1,001–$10,000 2 18 0 4 1 0 19 14 58
$10,001–$50,000 2 12 0 14 5 1 22 4 60
$50,001–$150,000 0 5 0 6 2 0 7 3 23
$150,001–$250,000 1 1 0 1 0 0 0 0 3
$250,001–$500,000 0 2 0 0 0 0 1 1 4
$500,001–less than $1.5 million 0 1 0 0 0 0 0 0 1
$1.5 million–$5 million 0 0 0 0 0 0 0 0 0
Over $5 million 0 1 0 0 0 0 0 0 1
Not Applicable 52 823 6 366 64 25 487 134 1,957
Total 64 881 6 399 74 28 540 158 2,150
$1–$100,000 18 253 0 126 34 13 203 60 707
$100,001–$250,000 1 13 0 21 3 6 13 15 72
$250,001–$1 million 0 9 0 6 0 1 2 2 20
Over $1 million 0 1 0 0 0 0 1 1 3
Not Applicable 45 606 6 246 37 8 322 81 1,351
Total 64 882 6 399 74 28 541 159 2,153
UNPAID PAY IN LIEU OF NOTICE
UNPAID ANNUAL LEAVE
Table 3.2.2.5 - Initial external administrators' reports for Construction industry—Unpaid employee entitlements by region (1 July 2013–30 June 2014)
UNPAID WAGES
UNPAID SUPERANNUATION
UNPAID LONG SERVICE LEAVE
UNPAID REDUNDANCY
Note: Reports identified as being internally inconsistent were excluded from this table. No reports were excluded from superannuation.
Australian Capital Territory
New South Wales
Northern Territory Queensland South Australia Tasmania Victoria
Western Australia No. of reports
$0 47 669 5 230 49 9 353 95 1,457
$1–less than $500,000 14 132 1 105 16 16 119 33 436
$500,000–less than $1 million 0 17 0 23 3 1 22 11 77
$1 million–less than $5 million 2 29 0 16 4 2 36 12 101
$5 million–$10 million 0 10 0 8 1 0 6 3 28
Over $10 million 1 25 0 17 1 0 5 5 54
Total 64 882 6 399 74 28 541 159 2,153
Australian Capital Territory
New South Wales
Northern Territory Queensland South Australia Tasmania Victoria
Western Australia No. of reports
$0 12 146 2 63 9 3 53 15 303
$1–$250,000 39 582 3 254 50 21 370 85 1,404
$250,001–$1 million 10 120 1 67 14 3 94 49 358
Over $1 million 3 34 0 15 1 1 24 10 88
Total 64 882 6 399 74 28 541 159 2,153
Australian Capital Territory
New South Wales
Northern Territory Queensland South Australia Tasmania Victoria
Western Australia No. of reports
Less than 25 53 760 4 300 47 14 390 99 1,667
25–50 3 65 1 41 12 7 80 22 231
51–200 8 50 1 48 13 7 55 35 217
More than 200 0 1 0 4 1 0 8 1 15
Unknown 0 6 0 6 1 0 8 2 23
Total 64 882 6 399 74 28 541 159 2,153
Less than $250,000 47 609 3 203 44 13 288 76 1,283
$250,000–$500,000 6 102 1 49 11 5 97 25 296
$500,001–less than $1 million 3 64 1 58 7 5 68 18 224
$1 million–less than $5 million 8 85 1 62 11 4 78 30 279
$5 million–$10 million 0 12 0 18 0 1 9 7 47
Over $10 million 0 10 0 9 1 0 1 3 24
Total 64 882 6 399 74 28 541 159 2,153
Number 6 151 1 81 10 3 87 24 363
$0 53 828 6 364 71 22 497 133 1,974
Greater than 0 but less than 11 cents 5 33 0 22 1 3 28 12 104
11–20c 0 6 0 7 1 0 9 9 32
21–50c 3 8 0 3 0 2 3 4 23
51–100c 3 7 0 3 1 1 4 1 20
Total 64 882 6 399 74 28 541 159 2,153
Table 3.2.2.6 - Initial external administrators' reports for Construction industry—Amount owed to secured creditors by region (1 July 2013–30 June 2014)
Table 3.2.2.7 - Initial external administrators' reports for Construction industry—Unpaid taxes and charges by region (1 July 2013–30 June 2014)
MORE THAN 50% OF DEBT OWED TO RELATED PARTIES
ESTIMATED 'CENTS' IN THE $' DIVIDEND TO UNSECURED CREDITORS
AMOUNT OWED TO UNSECURED CREDITORS
Table 3.2.2.8 - Initial external administrators' reports for Construction industry—Unsecured creditors by region (1 July 2013–30 June 2014)
NUMBER OF UNSECURED CREDITORS
Australian Capital Territory
New South Wales
Northern Territory Queensland South Australia Tasmania Victoria
Western Australia No. of reports
$0 12 73 0 53 12 1 53 15 219
$1–$50,000 4 71 1 50 2 0 21 12 161
$50,001–$100,000 1 11 0 9 1 2 9 5 38
$100,001–$250,000 2 7 0 2 1 1 5 9 27
Over $250,000 0 2 0 1 1 0 0 0 4
Not applicable 45 718 5 284 57 24 453 118 1,704
Total 64 882 6 399 74 28 541 159 2,153
$0 12 78 0 75 12 1 54 14 246
$1–$50,000 1 17 0 8 1 0 7 7 41
$50,001–$100,000 1 0 0 3 1 0 1 0 6
$100,001–$250,000 1 0 0 2 0 0 1 0 4
Over $250,000 0 2 0 0 0 0 0 0 2
Not applicable 49 785 6 311 60 27 478 138 1,854
Total 64 882 6 399 74 28 541 159 2,153
$0 12 282 4 130 28 2 139 27 624
$1–$50,000 42 520 2 225 32 20 337 90 1,268
$50,001–$100,000 4 34 0 26 9 5 35 20 133
$100,001–$250,000 3 17 0 8 2 1 13 8 52
Over $250,000 1 0 0 1 0 0 5 4 11
Not applicable 2 29 0 9 3 0 12 10 65
Total 64 882 6 399 74 28 541 159 2,153
$0 12 79 0 53 12 1 53 16 226
$1–$50,000 0 2 0 0 1 0 3 0 6
$50,001–$100,000 0 0 0 0 0 0 2 0 2
$100,001–$250,000 0 0 0 0 0 0 0 0 0
Over $250,000 0 0 0 1 0 0 2 1 4
Not applicable 52 801 6 345 61 27 481 142 1,915
Total 64 882 6 399 74 28 541 159 2,153
© Australian Securities & Investments Commission
RECEIVER/CONTROLLER FEES
LIQUIDATOR FEES
DEED OF COMPANY ARRANGEMENT FEES
VOLUNTARY ADMINISTRATOR FEES
Table 3.2.2.9 - Initial external administrators' reports for Construction industry—External administrator's remuneration by region (1 July 2012–30 June 2013)
Full-time equivalent employeesAustralian
Capital TerritoryNew South
WalesNorthern Territory Queensland South Australia Tasmania Victoria
Western Australia No. of reports
Less than 5 FTE 16 217 0 100 31 4 138 43 549
Between 5 and 19 FTE 6 71 0 53 14 4 37 10 195
Between 20 and 199 FTE 4 22 0 14 1 2 9 3 55
200 or more FTE 0 0 0 0 0 0 1 0 1
Not known 2 61 0 19 4 1 26 3 116
Total 28 371 0 186 50 11 211 59 916
Causes of company failureAustralian
Capital TerritoryNew South
WalesNorthern Territory Queensland South Australia Tasmania Victoria
Western Australia
Nominated causes of
failure
Under capitalisation 6 69 0 25 15 4 50 19 188
Poor financial control including lack of records 10 134 0 42 7 4 60 13 270
Poor management of accounts receivable 0 8 0 4 3 0 5 4 24
Poor strategic management of business 10 173 0 95 20 6 87 35 426
Inadequate cash flow or high cash use 11 161 0 71 28 6 94 34 405
Poor economic conditions 4 90 0 77 16 3 53 15 258
Natural disaster 0 2 0 12 0 0 3 0 17
Fraud 0 4 0 0 0 0 2 0 6
DOCA failed 0 2 0 0 0 0 1 1 4
Dispute among directors 3 16 0 6 1 0 7 3 36
Trading losses 12 155 0 87 30 6 97 23 410
Industry restructuring 0 2 0 0 1 0 5 0 8
Other 7 91 0 32 8 1 50 16 205
Total 63 907 0 451 129 30 514 163 2,257
Table 3.2.3.2 - Initial external administrators' reports for Accommodation & food services industry—Nominated causes of failure by region (1 July 2013–30 June 2014)
Australian insolvency statistics
Released: October 2014
Table 3.2.3.1 - Initial external administrators' reports for Accommodation & food services industry—Size of company as measured by number of FTEs by region (1 July 2013–30 June 2014)

Australian Capital Territory
New South Wales
Northern Territory Queensland South Australia Tasmania Victoria
Western Australia Total
Number of reports where external administrator has documentary evidence and recommended the case warranted inquiry by ASIC 7 55 0 16 4 2 31 12 127
Section 184—Good faith, use of position and use of information—Directors’, officers’ and employees’ duties 2 5 0 3 0 0 2 3 15
Section 206A—Disqualified persons not to manage corporations 1 0 0 0 0 0 2 1 4
Sections 286 & 344(2)—Obligation to keep financial records 1 16 0 7 0 0 4 2 30
Section 471A—Powers of other officers suspended during winding up 1 4 0 0 0 0 0 0 5
Section 588G(3)—Insolvent trading 1 13 0 11 5 0 3 5 38
Section 590—Offences by officers or employees 1 4 0 0 0 0 3 1 9
Section 596AB—Agreements to avoid employee entitlements 0 0 0 0 0 0 0 0 0
Other criminal offences under the Corporations Act 0 1 0 0 0 0 2 0 3
Sub-total 7 43 0 21 5 0 16 12 104
Sections 429, 438B & 475—Report as to company’s affairs 3 45 0 14 6 0 17 2 87
Section 530A—Officers to help liquidator 2 42 0 18 3 0 16 3 84
Section 530B—Requirement to provide liquidator with company’s books 1 33 0 13 2 0 14 2 65
Sub-total 6 120 0 45 11 0 47 7 236
Section 180—Care and diligence—Directors’ and officers’ duties 18 109 0 46 13 2 34 17 239
Section 181—Good faith—Directors’ and officers’ duties 11 43 0 26 0 0 12 12 104
Section 182—Use of position—Directors’, officer’s and employees’ duties 4 23 0 10 1 1 15 6 60
Section 183—Use of information—Directors’, officers’ and employees’ duties 1 7 0 3 0 0 2 2 15
Sections 286 & 344(1)—Obligation to keep financial records 17 152 0 52 14 2 81 18 336
Section 588G(1)–(2)—Insolvent trading 23 253 0 94 35 7 118 41 571
Sub-total 74 587 0 231 63 12 262 96 1,325
Criminal offence under the Corporations Act (if a member or contributory) 0 1 0 0 0 0 0 0 1
Criminal offence under another Commonwealth statute 0 1 0 1 0 0 3 0 5
Criminal offence under a state or territory law 0 0 0 0 0 0 0 0 0
Sub-total 0 2 0 1 0 0 3 0 6
May have misapplied or retained, or may have become liable or accountable for money or property of the company 0 2 0 1 0 0 1 1 5
May have been guilty of negligence, default, breach of duty or breach of trust in relation to the company 0 2 0 0 0 0 1 0 3
Sub-total 0 4 0 1 0 0 2 1 8
Total misconduct reported 87 756 0 299 79 12 330 116 1,679
No misconduct reported 2 52 0 57 8 3 57 16 195
Table 3.2.3.3 - Initial external administrators' reports for Accommodation & food services industry—Possible misconduct by region (1 July 2013–30 June 2014)
PRE-APPOINTMENT CRIMINAL MISCONDUCT
POST-APPOINTMENT CRIMINAL MISCONDUCT
ALLEGED BREACHES OF CIVIL OBLIGATIONS
OTHER CRIMINAL OFFENCES
OTHER POSSIBLE MISCONDUCT
Australian Capital Territory
New South Wales
Northern Territory Queensland South Australia Tasmania Victoria
Western Australia No. of reports
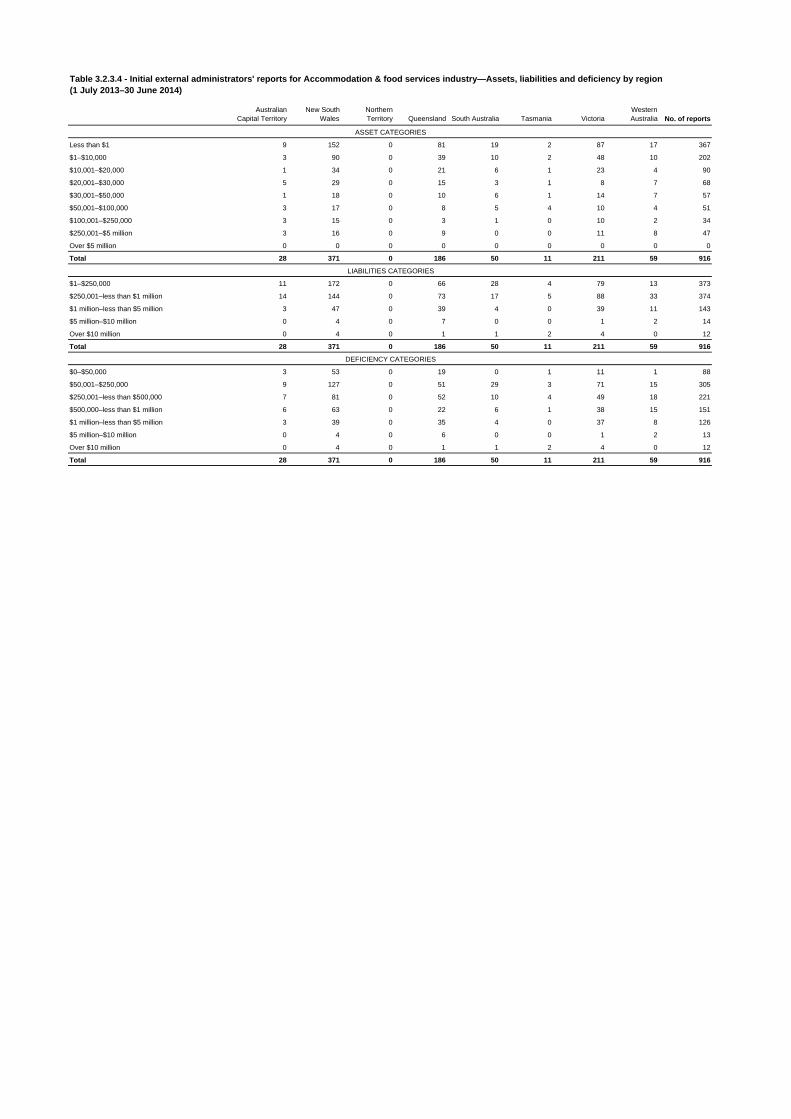
Less than $1 9 152 0 81 19 2 87 17 367
$1–$10,000 3 90 0 39 10 2 48 10 202
$10,001–$20,000 1 34 0 21 6 1 23 4 90
$20,001–$30,000 5 29 0 15 3 1 8 7 68
$30,001–$50,000 1 18 0 10 6 1 14 7 57
$50,001–$100,000 3 17 0 8 5 4 10 4 51
$100,001–$250,000 3 15 0 3 1 0 10 2 34
$250,001–$5 million 3 16 0 9 0 0 11 8 47
Over $5 million 0 0 0 0 0 0 0 0 0
Total 28 371 0 186 50 11 211 59 916
$1–$250,000 11 172 0 66 28 4 79 13 373
$250,001–less than $1 million 14 144 0 73 17 5 88 33 374
$1 million–less than $5 million 3 47 0 39 4 0 39 11 143
$5 million–$10 million 0 4 0 7 0 0 1 2 14
Over $10 million 0 4 0 1 1 2 4 0 12
Total 28 371 0 186 50 11 211 59 916
$0–$50,000 3 53 0 19 0 1 11 1 88
$50,001–$250,000 9 127 0 51 29 3 71 15 305
$250,001–less than $500,000 7 81 0 52 10 4 49 18 221
$500,000–less than $1 million 6 63 0 22 6 1 38 15 151
$1 million–less than $5 million 3 39 0 35 4 0 37 8 126
$5 million–$10 million 0 4 0 6 0 0 1 2 13
Over $10 million 0 4 0 1 1 2 4 0 12
Total 28 371 0 186 50 11 211 59 916
DEFICIENCY CATEGORIES
Table 3.2.3.4 - Initial external administrators' reports for Accommodation & food services industry—Assets, liabilities and deficiency by region (1 July 2013–30 June 2014)
ASSET CATEGORIES
LIABILITIES CATEGORIES
Australian Capital Territory
New South Wales
Northern Territory Queensland South Australia Tasmania Victoria
Western Australia No. of reports
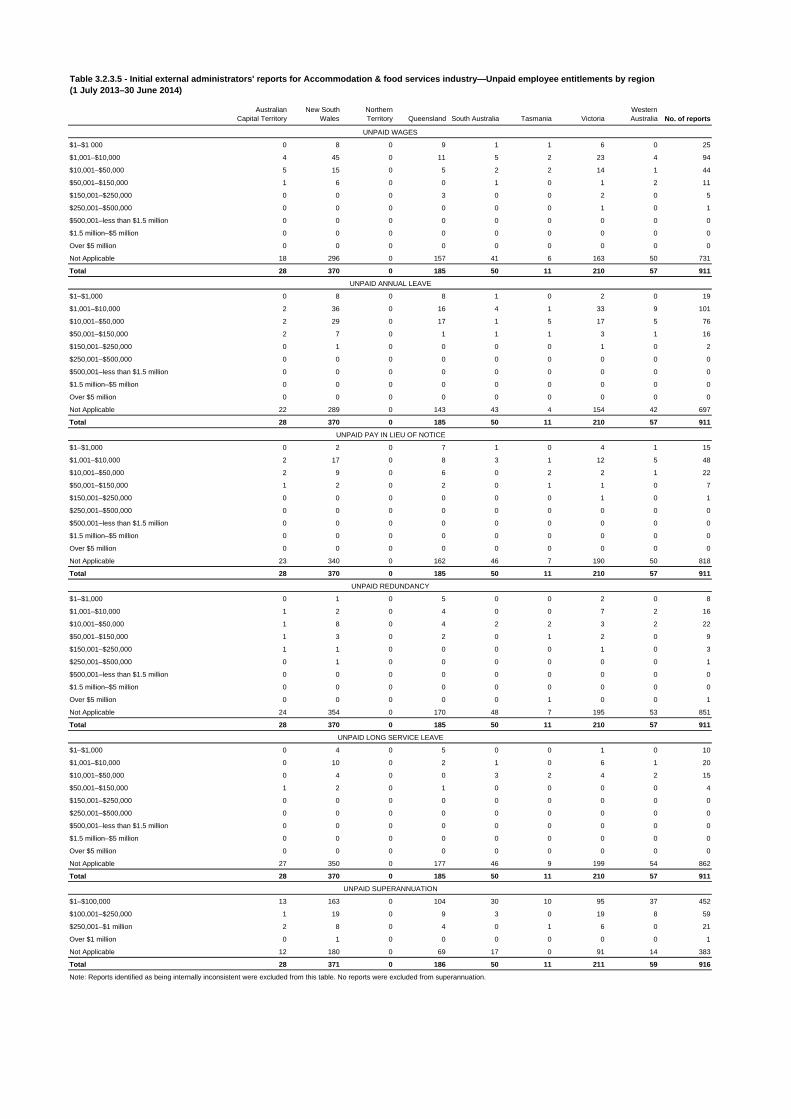
$1–$1 000 0 8 0 9 1 1 6 0 25
$1,001–$10,000 4 45 0 11 5 2 23 4 94
$10,001–$50,000 5 15 0 5 2 2 14 1 44
$50,001–$150,000 1 6 0 0 1 0 1 2 11
$150,001–$250,000 0 0 0 3 0 0 2 0 5
$250,001–$500,000 0 0 0 0 0 0 1 0 1
$500,001–less than $1.5 million 0 0 0 0 0 0 0 0 0
$1.5 million–$5 million 0 0 0 0 0 0 0 0 0
Over $5 million 0 0 0 0 0 0 0 0 0
Not Applicable 18 296 0 157 41 6 163 50 731
Total 28 370 0 185 50 11 210 57 911
$1–$1,000 0 8 0 8 1 0 2 0 19
$1,001–$10,000 2 36 0 16 4 1 33 9 101
$10,001–$50,000 2 29 0 17 1 5 17 5 76
$50,001–$150,000 2 7 0 1 1 1 3 1 16
$150,001–$250,000 0 1 0 0 0 0 1 0 2
$250,001–$500,000 0 0 0 0 0 0 0 0 0
$500,001–less than $1.5 million 0 0 0 0 0 0 0 0 0
$1.5 million–$5 million 0 0 0 0 0 0 0 0 0
Over $5 million 0 0 0 0 0 0 0 0 0
Not Applicable 22 289 0 143 43 4 154 42 697
Total 28 370 0 185 50 11 210 57 911
$1–$1,000 0 2 0 7 1 0 4 1 15
$1,001–$10,000 2 17 0 8 3 1 12 5 48
$10,001–$50,000 2 9 0 6 0 2 2 1 22
$50,001–$150,000 1 2 0 2 0 1 1 0 7
$150,001–$250,000 0 0 0 0 0 0 1 0 1
$250,001–$500,000 0 0 0 0 0 0 0 0 0
$500,001–less than $1.5 million 0 0 0 0 0 0 0 0 0
$1.5 million–$5 million 0 0 0 0 0 0 0 0 0
Over $5 million 0 0 0 0 0 0 0 0 0
Not Applicable 23 340 0 162 46 7 190 50 818
Total 28 370 0 185 50 11 210 57 911
$1–$1,000 0 1 0 5 0 0 2 0 8
$1,001–$10,000 1 2 0 4 0 0 7 2 16
$10,001–$50,000 1 8 0 4 2 2 3 2 22
$50,001–$150,000 1 3 0 2 0 1 2 0 9
$150,001–$250,000 1 1 0 0 0 0 1 0 3
$250,001–$500,000 0 1 0 0 0 0 0 0 1
$500,001–less than $1.5 million 0 0 0 0 0 0 0 0 0
$1.5 million–$5 million 0 0 0 0 0 0 0 0 0
Over $5 million 0 0 0 0 0 1 0 0 1
Not Applicable 24 354 0 170 48 7 195 53 851
Total 28 370 0 185 50 11 210 57 911
$1–$1,000 0 4 0 5 0 0 1 0 10
$1,001–$10,000 0 10 0 2 1 0 6 1 20
$10,001–$50,000 0 4 0 0 3 2 4 2 15
$50,001–$150,000 1 2 0 1 0 0 0 0 4
$150,001–$250,000 0 0 0 0 0 0 0 0 0
$250,001–$500,000 0 0 0 0 0 0 0 0 0
$500,001–less than $1.5 million 0 0 0 0 0 0 0 0 0
$1.5 million–$5 million 0 0 0 0 0 0 0 0 0
Over $5 million 0 0 0 0 0 0 0 0 0
Not Applicable 27 350 0 177 46 9 199 54 862
Total 28 370 0 185 50 11 210 57 911
$1–$100,000 13 163 0 104 30 10 95 37 452
$100,001–$250,000 1 19 0 9 3 0 19 8 59
$250,001–$1 million 2 8 0 4 0 1 6 0 21
Over $1 million 0 1 0 0 0 0 0 0 1
Not Applicable 12 180 0 69 17 0 91 14 383
Total 28 371 0 186 50 11 211 59 916
Note: Reports identified as being internally inconsistent were excluded from this table. No reports were excluded from superannuation.
Table 3.2.3.5 - Initial external administrators' reports for Accommodation & food services industry—Unpaid employee entitlements by region (1 July 2013–30 June 2014)
UNPAID WAGES
UNPAID ANNUAL LEAVE
UNPAID PAY IN LIEU OF NOTICE
UNPAID REDUNDANCY
UNPAID LONG SERVICE LEAVE
UNPAID SUPERANNUATION
Australian Capital Territory
New South Wales
Northern Territory Queensland South Australia Tasmania Victoria
Western Australia No. of reports
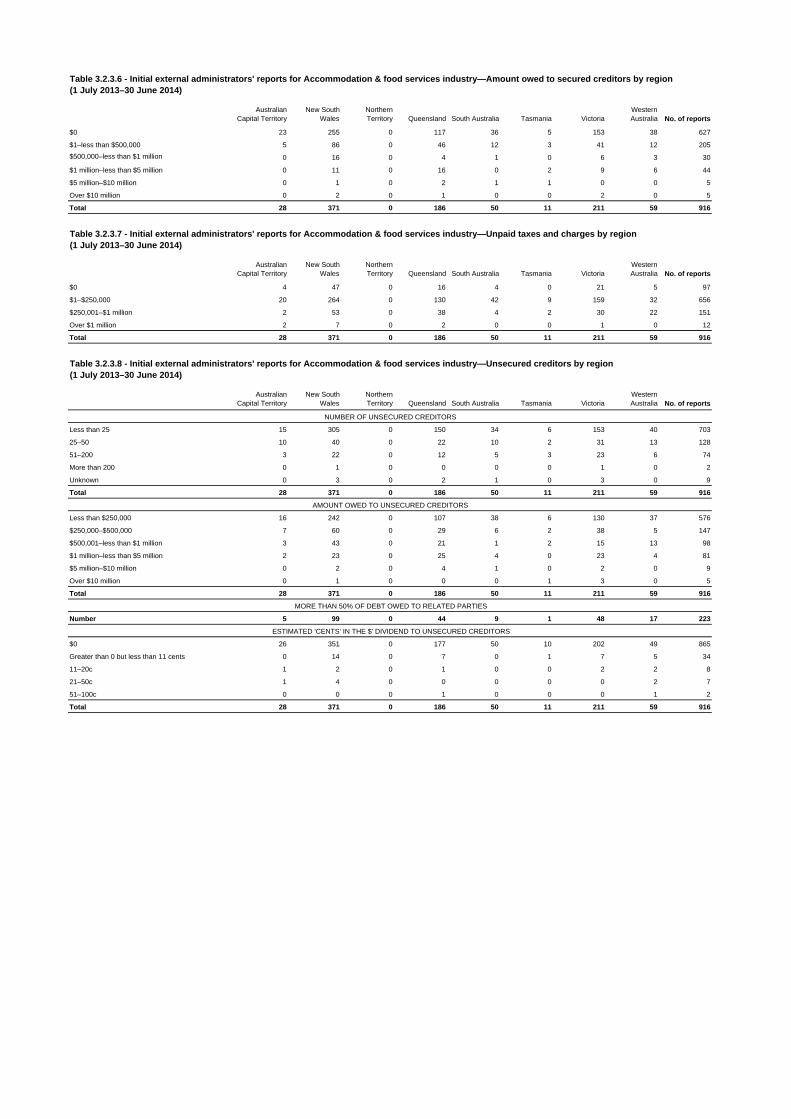
$0 23 255 0 117 36 5 153 38 627
$1–less than $500,000 5 86 0 46 12 3 41 12 205
$500,000–less than $1 million 0 16 0 4 1 0 6 3 30
$1 million–less than $5 million 0 11 0 16 0 2 9 6 44
$5 million–$10 million 0 1 0 2 1 1 0 0 5
Over $10 million 0 2 0 1 0 0 2 0 5
Total 28 371 0 186 50 11 211 59 916
Australian Capital Territory
New South Wales
Northern Territory Queensland South Australia Tasmania Victoria
Western Australia No. of reports
$0 4 47 0 16 4 0 21 5 97
$1–$250,000 20 264 0 130 42 9 159 32 656
$250,001–$1 million 2 53 0 38 4 2 30 22 151
Over $1 million 2 7 0 2 0 0 1 0 12
Total 28 371 0 186 50 11 211 59 916
Australian Capital Territory
New South Wales
Northern Territory Queensland South Australia Tasmania Victoria
Western Australia No. of reports
Less than 25 15 305 0 150 34 6 153 40 703
25–50 10 40 0 22 10 2 31 13 128
51–200 3 22 0 12 5 3 23 6 74
More than 200 0 1 0 0 0 0 1 0 2
Unknown 0 3 0 2 1 0 3 0 9
Total 28 371 0 186 50 11 211 59 916
Less than $250,000 16 242 0 107 38 6 130 37 576
$250,000–$500,000 7 60 0 29 6 2 38 5 147
$500,001–less than $1 million 3 43 0 21 1 2 15 13 98
$1 million–less than $5 million 2 23 0 25 4 0 23 4 81
$5 million–$10 million 0 2 0 4 1 0 2 0 9
Over $10 million 0 1 0 0 0 1 3 0 5
Total 28 371 0 186 50 11 211 59 916
Number 5 99 0 44 9 1 48 17 223
$0 26 351 0 177 50 10 202 49 865
Greater than 0 but less than 11 cents 0 14 0 7 0 1 7 5 34
11–20c 1 2 0 1 0 0 2 2 8
21–50c 1 4 0 0 0 0 0 2 7
51–100c 0 0 0 1 0 0 0 1 2
Total 28 371 0 186 50 11 211 59 916
Table 3.2.3.7 - Initial external administrators' reports for Accommodation & food services industry—Unpaid taxes and charges by region (1 July 2013–30 June 2014)
Table 3.2.3.6 - Initial external administrators' reports for Accommodation & food services industry—Amount owed to secured creditors by region (1 July 2013–30 June 2014)
Table 3.2.3.8 - Initial external administrators' reports for Accommodation & food services industry—Unsecured creditors by region (1 July 2013–30 June 2014)
NUMBER OF UNSECURED CREDITORS
AMOUNT OWED TO UNSECURED CREDITORS
MORE THAN 50% OF DEBT OWED TO RELATED PARTIES
ESTIMATED 'CENTS' IN THE $' DIVIDEND TO UNSECURED CREDITORS
Australian Capital Territory
New South Wales
Northern Territory Queensland South Australia Tasmania Victoria
Western Australia No. of reports
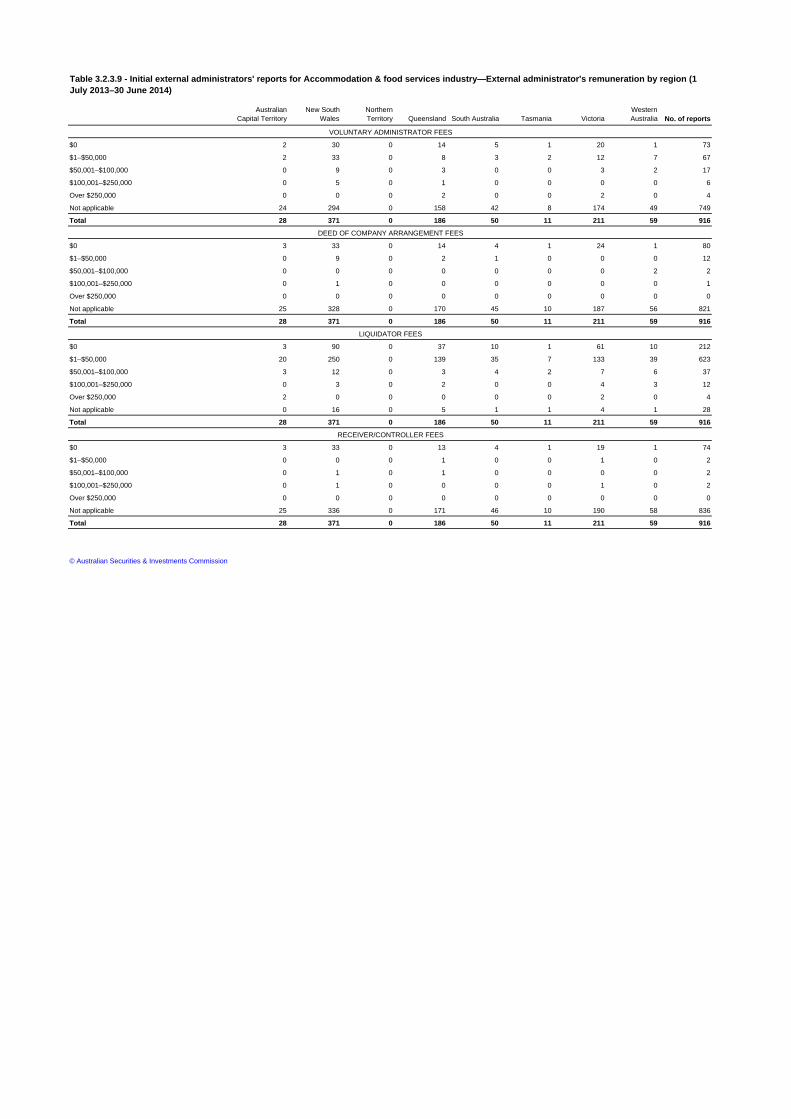
$0 2 30 0 14 5 1 20 1 73
$1–$50,000 2 33 0 8 3 2 12 7 67
$50,001–$100,000 0 9 0 3 0 0 3 2 17
$100,001–$250,000 0 5 0 1 0 0 0 0 6
Over $250,000 0 0 0 2 0 0 2 0 4
Not applicable 24 294 0 158 42 8 174 49 749
Total 28 371 0 186 50 11 211 59 916
$0 3 33 0 14 4 1 24 1 80
$1–$50,000 0 9 0 2 1 0 0 0 12
$50,001–$100,000 0 0 0 0 0 0 0 2 2
$100,001–$250,000 0 1 0 0 0 0 0 0 1
Over $250,000 0 0 0 0 0 0 0 0 0
Not applicable 25 328 0 170 45 10 187 56 821
Total 28 371 0 186 50 11 211 59 916
$0 3 90 0 37 10 1 61 10 212
$1–$50,000 20 250 0 139 35 7 133 39 623
$50,001–$100,000 3 12 0 3 4 2 7 6 37
$100,001–$250,000 0 3 0 2 0 0 4 3 12
Over $250,000 2 0 0 0 0 0 2 0 4
Not applicable 0 16 0 5 1 1 4 1 28
Total 28 371 0 186 50 11 211 59 916
$0 3 33 0 13 4 1 19 1 74
$1–$50,000 0 0 0 1 0 0 1 0 2
$50,001–$100,000 0 1 0 1 0 0 0 0 2
$100,001–$250,000 0 1 0 0 0 0 1 0 2
Over $250,000 0 0 0 0 0 0 0 0 0
Not applicable 25 336 0 171 46 10 190 58 836
Total 28 371 0 186 50 11 211 59 916
© Australian Securities & Investments Commission
RECEIVER/CONTROLLER FEES
Table 3.2.3.9 - Initial external administrators' reports for Accommodation & food services industry—External administrator's remuneration by region (1 July 2013–30 June 2014)
VOLUNTARY ADMINISTRATOR FEES
DEED OF COMPANY ARRANGEMENT FEES
LIQUIDATOR FEES

Full-time equivalent employeesAustralian
Capital TerritoryNew South
WalesNorthern Territory Queensland South Australia Tasmania Victoria
Western Australia No. of reports
Less than 5 FTE 11 234 3 119 32 9 158 32 598
Between 5 and 19 FTE 5 45 1 30 7 1 41 8 138
Between 20 and 199 FTE 1 16 1 4 4 0 12 2 40
200 or more FTE 0 4 0 1 0 0 0 0 5
Not known 1 30 0 27 1 0 26 4 89
Total 18 329 5 181 44 10 237 46 870
Causes of company failureAustralian
Capital TerritoryNew South
WalesNorthern Territory Queensland South Australia Tasmania Victoria
Western Australia
Nominated causes of
failure
Under capitalisation 6 62 0 31 7 1 50 8 165
Poor financial control including lack of records 5 112 2 29 7 2 72 11 240
Poor management of accounts receivable 2 22 0 10 2 0 14 3 53
Poor strategic management of business 3 137 2 83 21 4 87 26 363
Inadequate cash flow or high cash use 8 159 2 80 18 6 103 23 399
Poor economic conditions 4 74 1 84 14 6 83 17 283
Natural disaster 0 1 0 11 0 0 3 0 15
Fraud 0 2 0 4 0 0 4 0 10
DOCA failed 1 0 0 0 0 0 2 0 3
Dispute among directors 1 5 0 5 4 0 7 5 27
Trading losses 8 135 3 71 27 6 77 25 352
Industry restructuring 0 9 0 3 2 0 4 6 24
Other 5 101 1 26 9 2 65 11 220
Total 43 819 11 437 111 27 571 135 2,154
Table 3.2.4.2 - Initial external administrators' reports for Retail trade industry—Nominated causes of failure by region (1 July 2013–30 June 2014)
Australian insolvency statistics
Released: October 2014
Table 3.2.4.1 - Initial external administrators' reports for Retail trade industry—Size of company as measured by number of FTEs by region (1 July 2013–30 June 2014)

Australian Capital Territory
New South Wales
Northern Territory Queensland South Australia Tasmania Victoria
Western Australia Total
Number of reports where external administrator has documentary evidence and recommended the case warranted inquiry by ASIC 1 58 1 19 8 0 46 6 139
Section 184—Good faith, use of position and use of information—Directors’, officers’ and employees’ duties 0 6 0 5 0 0 3 1 15
Section 206A—Disqualified persons not to manage corporations 0 0 0 0 0 0 1 0 1
Sections 286 & 344(2)—Obligation to keep financial records 0 12 0 8 1 0 6 3 30
Section 471A—Powers of other officers suspended during winding up 0 0 0 0 0 0 1 0 1
Section 588G(3)—Insolvent trading 0 17 0 5 6 1 8 5 42
Section 590—Offences by officers or employees 0 3 0 3 0 0 5 1 12
Section 596AB—Agreements to avoid employee entitlements 0 0 0 0 0 0 0 1 1
Other criminal offences under the Corporations Act 0 0 0 0 0 0 2 0 2
Sub-total 0 38 0 21 7 1 26 11 104
Sections 429, 438B & 475—Report as to company’s affairs 1 33 0 9 4 0 10 3 60
Section 530A—Officers to help liquidator 1 30 0 7 4 0 16 5 63
Section 530B—Requirement to provide liquidator with company’s books 1 35 0 13 3 0 20 3 75
Sub-total 3 98 0 29 11 0 46 11 198
Section 180—Care and diligence—Directors’ and officers’ duties 6 113 0 35 10 1 47 21 233
Section 181—Good faith—Directors’ and officers’ duties 4 57 0 19 3 1 27 9 120
Section 182—Use of position—Directors’, officer’s and employees’ duties 1 42 0 10 2 1 14 3 73
Section 183—Use of information—Directors’, officers’ and employees’ duties 1 23 0 6 0 1 3 1 35
Sections 286 & 344(1)—Obligation to keep financial records 8 143 1 27 6 2 87 18 292
Section 588G(1)–(2)—Insolvent trading 13 219 2 76 32 8 121 32 503
Sub-total 33 597 3 173 53 14 299 84 1,256
Criminal offence under the Corporations Act (if a member or contributory) 0 0 0 0 0 0 0 0 0
Criminal offence under another Commonwealth statute 0 0 0 0 0 0 0 0 0
Criminal offence under a state or territory law 0 0 0 1 0 0 2 0 3
Sub-total 0 0 0 1 0 0 2 0 3
May have misapplied or retained, or may have become liable or accountable for money or property of the company 0 2 0 1 1 0 2 1 7
May have been guilty of negligence, default, breach of duty or breach of trust in relation to the company 0 1 1 3 0 0 3 0 8
Sub-total 0 3 1 4 1 0 5 1 15
Total misconduct reported 36 736 4 228 72 15 378 107 1,576
No misconduct reported 5 64 2 82 11 2 63 7 236
Table 3.2.4.3 - Initial external administrators' reports for Retail trade industry—Possible misconduct by region (1 July 2013–30 June 2014)
PRE-APPOINTMENT CRIMINAL MISCONDUCT
POST-APPOINTMENT CRIMINAL MISCONDUCT
ALLEGED BREACHES OF CIVIL OBLIGATIONS
OTHER CRIMINAL OFFENCES
OTHER POSSIBLE MISCONDUCT
Australian Capital Territory
New South Wales
Northern Territory Queensland South Australia Tasmania Victoria
Western Australia No. of reports
Less than $1 5 132 1 55 12 2 74 9 290
$1–$10,000 1 75 0 53 9 3 73 10 224
$10,001–$20,000 0 34 1 22 8 1 23 2 91
$20,001–$30,000 1 14 0 7 0 1 10 2 35
$30,001–$50,000 4 22 1 13 5 1 13 4 63
$50,001–$100,000 5 18 0 10 4 0 14 9 60
$100,001–$250,000 0 13 2 12 2 0 16 7 52
$250,001–$5 million 2 19 0 9 4 2 14 3 53
Over $5 million 0 2 0 0 0 0 0 0 2
Total 18 329 5 181 44 10 237 46 870
$1–$250,000 7 138 1 69 19 5 78 12 329
$250,001–less than $1 million 7 102 3 68 15 4 99 20 318
$1 million–less than $5 million 4 47 0 36 9 1 53 13 163
$5 million–$10 million 0 21 1 3 1 0 4 1 31
Over $10 million 0 21 0 5 0 0 3 0 29
Total 18 329 5 181 44 10 237 46 870
$0–$50,000 3 40 0 8 3 2 16 3 75
$50,001–$250,000 4 106 1 64 17 4 68 12 276
$250,001–less than $500,000 4 57 1 35 7 3 53 10 170
$500,000–less than $1 million 4 42 2 33 7 1 46 9 144
$1 million–less than $5 million 3 43 0 33 10 0 47 12 148
$5 million–$10 million 0 23 1 3 0 0 4 0 31
Over $10 million 0 18 0 5 0 0 3 0 26
Total 18 329 5 181 44 10 237 46 870
DEFICIENCY CATEGORIES
Table 3.2.4.4 - Initial external administrators' reports for Retail trade industry—Assets, liabilities and deficiency by region (1 July 2013–30 June 2014)
ASSET CATEGORIES
LIABILITIES CATEGORIES

Australian Capital Territory
New South Wales
Northern Territory Queensland South Australia Tasmania Victoria
Western Australia No. of reports
$1–$1 000 1 20 0 14 2 1 3 1 42
$1,001–$10,000 2 42 1 9 7 2 34 9 106
$10,001–$50,000 1 17 0 4 5 0 17 2 46
$50,001–$150,000 0 8 0 3 0 0 3 0 14
$150,001–$250,000 0 1 0 0 0 0 0 0 1
$250,001–$500,000 0 0 0 1 0 0 0 0 1
$500,001–less than $1.5 million 0 0 0 1 0 0 0 0 1
$1.5 million–$5 million 0 0 0 0 0 0 0 0 0
Over $5 million 0 0 0 0 0 0 0 0 0
Not Applicable 14 239 4 149 30 7 180 34 657
Total 18 327 5 181 44 10 237 46 868
$1–$1,000 2 11 0 11 0 0 3 0 27
$1,001–$10,000 3 42 0 16 2 0 40 6 109
$10,001–$50,000 1 29 1 12 7 3 22 5 80
$50,001–$150,000 1 10 1 3 3 0 9 4 31
$150,001–$250,000 0 3 0 0 1 0 1 0 5
$250,001–$500,000 0 1 0 2 0 0 1 0 4
$500,001–less than $1.5 million 0 2 0 1 0 0 0 0 3
$1.5 million–$5 million 0 0 0 1 0 0 0 0 1
Over $5 million 0 0 0 0 0 0 0 0
Not Applicable 11 229 3 135 31 7 161 31 608
Total 18 327 5 181 44 10 237 46 868
$1–$1,000 2 12 0 9 2 0 4 0 29
$1,001–$10,000 1 25 0 10 1 2 16 4 59
$10,001–$50,000 1 17 1 11 5 1 17 6 59
$50,001–$150,000 0 5 1 1 3 0 3 0 13
$150,001–$250,000 0 1 0 0 0 0 1 0 2
$250,001–$500,000 0 0 0 0 0 0 0 0
$500,001–less than $1.5 million 0 1 0 0 0 0 0 0 1
$1.5 million–$5 million 0 0 0 0 0 0 0 0 0
Over $5 million 0 0 0 0 0 0 0 0 0
Not Applicable 14 266 3 150 33 7 196 36 705
Total 18 327 5 181 44 10 237 46 868
$1–$1,000 1 7 0 8 2 0 1 0 19
$1,001–$10,000 3 5 0 3 0 0 2 2 15
$10,001–$50,000 0 12 0 6 1 1 14 3 37
$50,001–$150,000 0 8 1 2 3 0 6 4 24
$150,001–$250,000 0 1 0 1 1 0 1 0 4
$250,001–$500,000 0 3 0 0 0 0 1 0 4
$500,001–less than $1.5 million 0 2 0 1 0 0 0 0 3
$1.5 million–$5 million 0 0 0 0 0 0 0 0 0
Over $5 million 0 0 0 0 0 0 0 0 0
Not Applicable 14 289 4 160 37 9 212 37 762
Total 18 327 5 181 44 10 237 46 868
$1–$1,000 0 11 0 9 0 1 2 0 23
$1,001–$10,000 2 5 1 2 0 1 16 1 28
$10,001–$50,000 1 14 1 11 5 0 16 4 52
$50,001–$150,000 0 6 0 2 2 0 3 2 15
$150,001–$250,000 0 2 0 0 2 0 0 1 5
$250,001–$500,000 0 2 0 1 0 0 1 0 4
$500,001–less than $1.5 million 0 0 0 0 0 0 0 0 0
$1.5 million–$5 million 0 0 0 1 0 0 0 0 1
Over $5 million 0 0 0 0 0 0 0 0 0
Not Applicable 15 287 3 155 35 8 199 38 740
Total 18 327 5 181 44 10 237 46 868
$1–$100,000 10 128 1 72 28 8 104 26 377
$100,001–$250,000 1 8 0 12 1 1 10 0 33
$250,001–$1 million 1 8 0 4 1 0 2 0 16
Over $1 million 0 2 0 1 0 0 0 0 3
Not Applicable 6 183 4 92 14 1 121 20 441
Total 18 329 5 181 44 10 237 46 870
Table 3.2.4.5 - Initial external administrators' reports for Retail trade industry—Unpaid employee entitlements by region (1 July 2013–30 June 2014)
UNPAID WAGES
UNPAID ANNUAL LEAVE
UNPAID PAY IN LIEU OF NOTICE
UNPAID REDUNDANCY
UNPAID LONG SERVICE LEAVE
UNPAID SUPERANNUATION
Note: Reports identified as being internally inconsistent were excluded from this table. No reports were excluded from superannuation.
Australian Capital Territory
New South Wales
Northern Territory Queensland South Australia Tasmania Victoria
Western Australia No. of reports
$0 9 193 2 106 31 3 146 25 515
$1–less than $500,000 6 80 2 49 9 6 55 14 221
$500,000–less than $1 million 3 5 0 14 0 1 16 4 43
$1 million–less than $5 million 0 17 0 7 4 0 18 3 49
$5 million–$10 million 0 17 0 0 0 0 1 0 18
Over $10 million 0 17 1 5 0 0 1 0 24
Total 18 329 5 181 44 10 237 46 870
Australian Capital Territory
New South Wales
Northern Territory Queensland South Australia Tasmania Victoria
Western Australia No. of reports
$0 2 72 1 22 3 0 35 7 142
$1–$250,000 14 221 4 135 36 7 175 35 627
$250,001–$1 million 1 29 0 21 4 3 23 4 85
Over $1 million 1 7 0 3 1 0 4 0 16
Total 18 329 5 181 44 10 237 46 870
Australian Capital Territory
New South Wales
Northern Territory Queensland South Australia Tasmania Victoria
Western Australia No. of reports
Less than 25 13 253 3 129 24 8 143 24 597
25–50 3 36 0 32 11 2 51 11 146
51–200 2 33 1 13 8 0 36 10 103
More than 200 0 5 1 3 0 0 3 0 12
Unknown 0 2 0 4 1 0 4 1 12
Total 18 329 5 181 44 10 237 46 870
Less than $250,000 10 195 1 99 28 8 116 19 476
$250,000–$500,000 6 53 1 24 5 1 45 11 146
$500,001–less than $1 million 1 41 2 32 3 1 40 10 130
$1 million–less than $5 million 1 31 1 21 8 0 33 5 100
$5 million–$10 million 0 7 0 1 0 0 2 1 11
Over $10 million 0 2 0 4 0 0 1 0 7
Total 18 329 5 181 44 10 237 46 870
Number 6 79 2 44 9 0 63 11 214
$0 17 312 5 171 40 7 232 44 828
Greater than 0 but less than 11 cents 1 10 0 7 4 2 4 2 30
11–20c 0 2 0 2 0 0 0 0 4
21–50c 0 3 0 1 0 0 1 0 5
51–100c 0 2 0 0 0 1 0 0 3
Total 18 329 5 181 44 10 237 46 870
Table 3.2.3.7 - Initial external administrators' reports for Retail trade industry—Unpaid taxes and charges by region (1 July 2013–30 June 2014)
Table 3.2.4.6 - Initial external administrators' reports for Retail trade industry—Amount owed to secured creditors by region (1 July 2013–30 June 2014)
Table 3.2.4.8 - Initial external administrators' reports for Retail trade industry—Unsecured creditors by region (1 July 2013–30 June 2014)
NUMBER OF UNSECURED CREDITORS
AMOUNT OWED TO UNSECURED CREDITORS
MORE THAN 50% OF DEBT OWED TO RELATED PARTIES
ESTIMATED 'CENTS' IN THE $' DIVIDEND TO UNSECURED CREDITORS
Australian Capital Territory
New South Wales
Northern Territory Queensland South Australia Tasmania Victoria
Western Australia No. of reports
$0 1 24 1 23 3 3 18 4 77
$1–$50,000 1 53 1 14 1 0 13 3 86
$50,001–$100,000 2 10 0 4 1 0 6 2 25
$100,001–$250,000 0 4 0 2 1 0 3 0 10
Over $250,000 0 3 0 0 0 0 1 0 4
Not applicable 14 235 3 138 38 7 196 37 668
Total 18 329 5 181 44 10 237 46 870
$0 1 27 1 24 3 3 17 5 81
$1–$50,000 1 1 0 0 1 0 1 1 5
$50,001–$100,000 0 0 0 0 0 0 2 0 2
$100,001–$250,000 0 0 0 1 0 0 0 0 1
Over $250,000 0 0 0 0 0 0 0 0 0
Not applicable 16 301 4 156 40 7 217 40 781
Total 18 329 5 181 44 10 237 46 870
$0 1 84 1 40 6 3 61 5 201
$1–$50,000 16 217 2 124 31 5 151 37 583
$50,001–$100,000 0 15 1 14 4 1 19 3 57
$100,001–$250,000 1 6 0 2 1 1 4 0 15
Over $250,000 0 1 0 0 1 0 1 0 3
Not applicable 0 6 1 1 1 0 1 1 11
Total 18 329 5 181 44 10 237 46 870
$0 2 27 1 26 3 3 19 4 85
$1–$50,000 0 0 0 0 0 0 0 1 1
$50,001–$100,000 0 1 0 0 0 0 0 0 1
$100,001–$250,000 0 0 0 0 0 0 0 0 0
Over $250,000 0 0 0 0 0 0 1 0 1
Not applicable 16 301 4 155 41 7 217 41 782
Total 18 329 5 181 44 10 237 46 870
© Australian Securities & Investments Commission
RECEIVER/CONTROLLER FEES
Table 3.2.4.9 - Initial external administrators' reports for Retail trade industry—External administrator's remuneration by region (1 July 2013–30 June 2014)
VOLUNTARY ADMINISTRATOR FEES
DEED OF COMPANY ARRANGEMENT FEES
LIQUIDATOR FEES
Full-time equivalent employeesAustralian
Capital TerritoryNew South
WalesNorthern Territory Queensland South Australia Tasmania Victoria
Western Australia No. of reports
Less than 5 FTE 2 153 0 62 10 3 97 11 338
Between 5 and 19 FTE 3 21 0 15 6 2 19 4 70
Between 20 and 199 FTE 1 5 1 4 2 1 9 2 25
200 or more FTE 0 0 0 0 0 0 1 0 1
Not known 0 34 0 21 0 0 13 5 73
Total 6 213 1 102 18 6 139 22 507
Note: One company with an international registered address has been excluded from these statistics.
Causes of company failureAustralian
Capital TerritoryNew South
WalesNorthern Territory Queensland South Australia Tasmania Victoria
Western Australia
Nominated causes of
failure
Under capitalisation 0 38 1 9 2 0 22 10 82
Poor financial control including lack of records 1 85 0 31 6 2 49 8 182
Poor management of accounts receivable 0 19 0 17 0 1 18 2 57
Poor strategic management of business 0 90 1 52 7 2 56 12 220
Inadequate cash flow or high cash use 5 91 1 49 5 3 51 17 222
Poor economic conditions 0 24 0 27 6 2 25 4 88
Natural disaster 0 2 0 6 0 0 1 1 10
Fraud 0 4 0 3 0 0 3 1 11
DOCA failed 0 1 0 0 0 0 0 0 1
Dispute among directors 0 4 0 2 0 0 2 0 8
Trading losses 5 52 1 29 8 4 44 7 150
Industry restructuring 0 3 0 1 1 0 4 0 9
Other 1 76 0 26 5 1 43 7 159
Total 12 489 4 252 40 15 318 69 1,199
Note: One company with an international registered address has been excluded from these statistics.
Table 3.2.5.2 - Initial external administrators' reports for Transport, postal & warehousing industry—Nominated causes of failure by region (1 July 2013–30 June 2014)
Australian insolvency statistics
Released: October 2014
Table 3.2.5.1 - Initial external administrators' reports for Transport, postal & warehousing industry—Size of company as measured by number of FTEs by region (1 July 2013–30 June 2014)
Australian Capital Territory
New South Wales
Northern Territory Queensland South Australia Tasmania Victoria
Western Australia Total
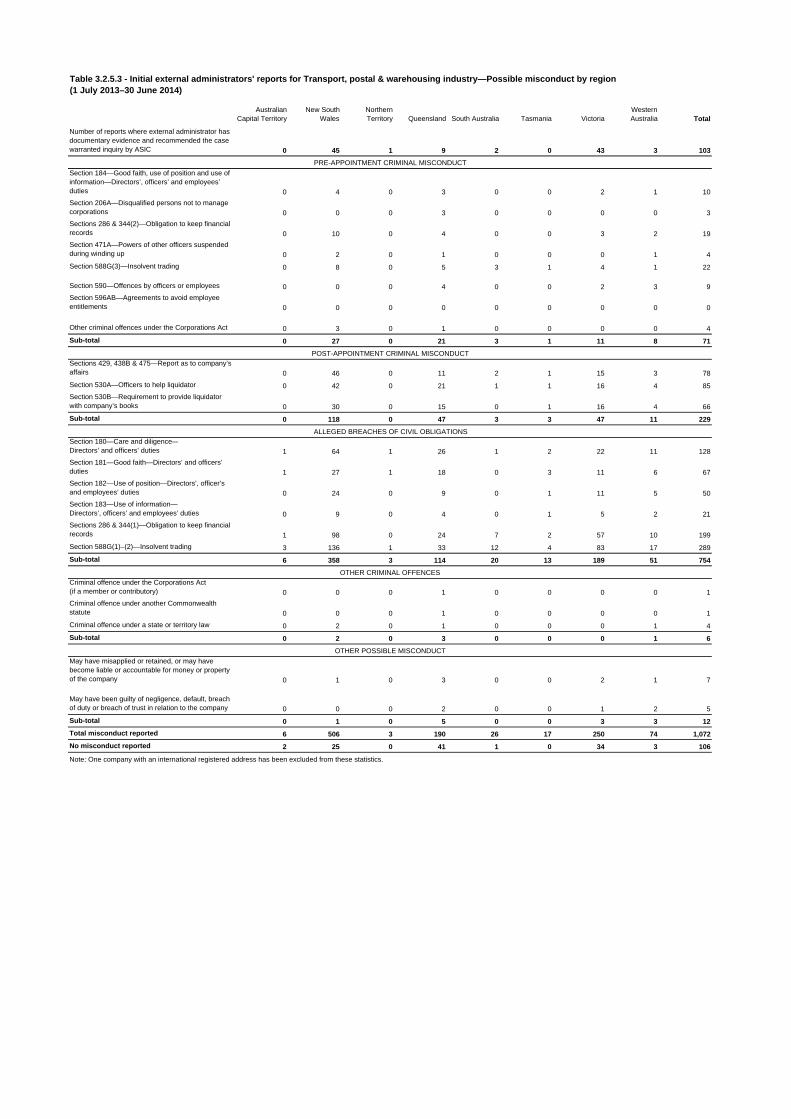
Number of reports where external administrator has documentary evidence and recommended the case warranted inquiry by ASIC 0 45 1 9 2 0 43 3 103
Section 184—Good faith, use of position and use of information—Directors’, officers’ and employees’ duties 0 4 0 3 0 0 2 1 10
Section 206A—Disqualified persons not to manage corporations 0 0 0 3 0 0 0 0 3
Sections 286 & 344(2)—Obligation to keep financial records 0 10 0 4 0 0 3 2 19
Section 471A—Powers of other officers suspended during winding up 0 2 0 1 0 0 0 1 4
Section 588G(3)—Insolvent trading 0 8 0 5 3 1 4 1 22
Section 590—Offences by officers or employees 0 0 0 4 0 0 2 3 9
Section 596AB—Agreements to avoid employee entitlements 0 0 0 0 0 0 0 0 0
Other criminal offences under the Corporations Act 0 3 0 1 0 0 0 0 4
Sub-total 0 27 0 21 3 1 11 8 71
Sections 429, 438B & 475—Report as to company’s affairs 0 46 0 11 2 1 15 3 78
Section 530A—Officers to help liquidator 0 42 0 21 1 1 16 4 85
Section 530B—Requirement to provide liquidator with company’s books 0 30 0 15 0 1 16 4 66
Sub-total 0 118 0 47 3 3 47 11 229
Section 180—Care and diligence—Directors’ and officers’ duties 1 64 1 26 1 2 22 11 128
Section 181—Good faith—Directors’ and officers’ duties 1 27 1 18 0 3 11 6 67
Section 182—Use of position—Directors’, officer’s and employees’ duties 0 24 0 9 0 1 11 5 50
Section 183—Use of information—Directors’, officers’ and employees’ duties 0 9 0 4 0 1 5 2 21
Sections 286 & 344(1)—Obligation to keep financial records 1 98 0 24 7 2 57 10 199
Section 588G(1)–(2)—Insolvent trading 3 136 1 33 12 4 83 17 289
Sub-total 6 358 3 114 20 13 189 51 754
Criminal offence under the Corporations Act (if a member or contributory) 0 0 0 1 0 0 0 0 1
Criminal offence under another Commonwealth statute 0 0 0 1 0 0 0 0 1
Criminal offence under a state or territory law 0 2 0 1 0 0 0 1 4
Sub-total 0 2 0 3 0 0 0 1 6
May have misapplied or retained, or may have become liable or accountable for money or property of the company 0 1 0 3 0 0 2 1 7
May have been guilty of negligence, default, breach of duty or breach of trust in relation to the company 0 0 0 2 0 0 1 2 5
Sub-total 0 1 0 5 0 0 3 3 12
Total misconduct reported 6 506 3 190 26 17 250 74 1,072
No misconduct reported 2 25 0 41 1 0 34 3 106
Note: One company with an international registered address has been excluded from these statistics.
Table 3.2.5.3 - Initial external administrators' reports for Transport, postal & warehousing industry—Possible misconduct by region (1 July 2013–30 June 2014)
PRE-APPOINTMENT CRIMINAL MISCONDUCT
POST-APPOINTMENT CRIMINAL MISCONDUCT
ALLEGED BREACHES OF CIVIL OBLIGATIONS
OTHER CRIMINAL OFFENCES
OTHER POSSIBLE MISCONDUCT
Australian Capital Territory
New South Wales
Northern Territory Queensland South Australia Tasmania Victoria
Western Australia No. of reports
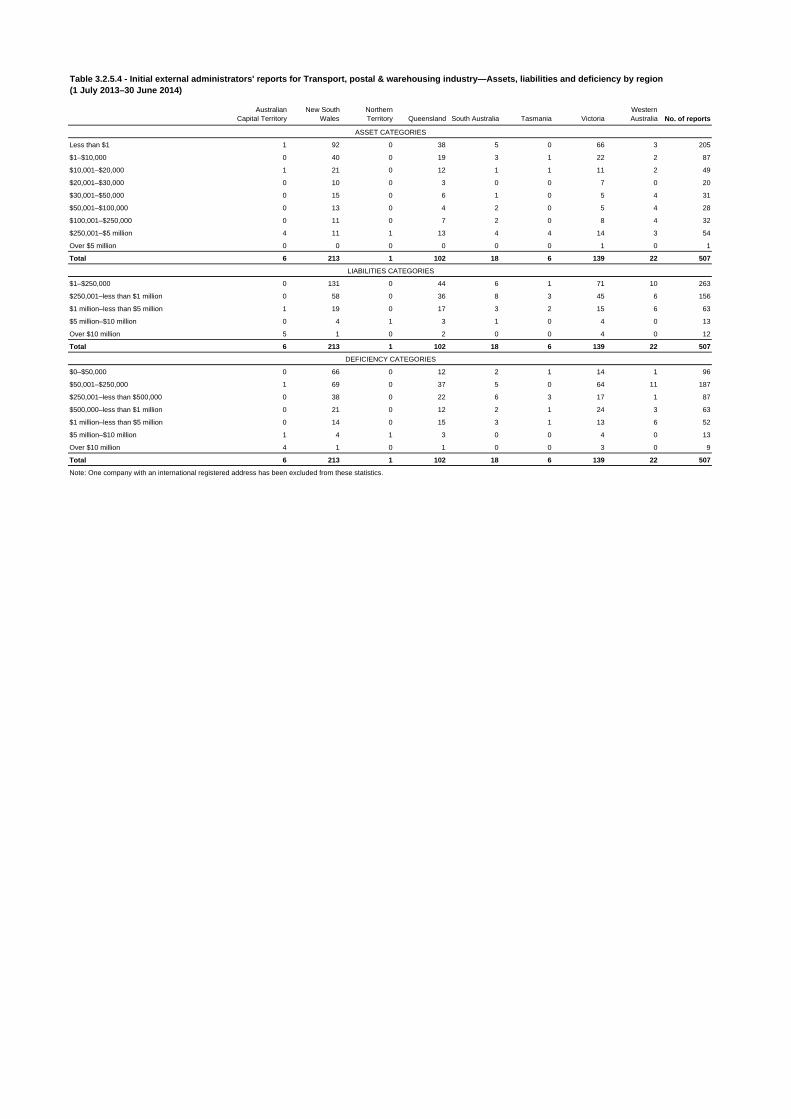
Less than $1 1 92 0 38 5 0 66 3 205
$1–$10,000 0 40 0 19 3 1 22 2 87
$10,001–$20,000 1 21 0 12 1 1 11 2 49
$20,001–$30,000 0 10 0 3 0 0 7 0 20
$30,001–$50,000 0 15 0 6 1 0 5 4 31
$50,001–$100,000 0 13 0 4 2 0 5 4 28
$100,001–$250,000 0 11 0 7 2 0 8 4 32
$250,001–$5 million 4 11 1 13 4 4 14 3 54
Over $5 million 0 0 0 0 0 0 1 0 1
Total 6 213 1 102 18 6 139 22 507
$1–$250,000 0 131 0 44 6 1 71 10 263
$250,001–less than $1 million 0 58 0 36 8 3 45 6 156
$1 million–less than $5 million 1 19 0 17 3 2 15 6 63
$5 million–$10 million 0 4 1 3 1 0 4 0 13
Over $10 million 5 1 0 2 0 0 4 0 12
Total 6 213 1 102 18 6 139 22 507
$0–$50,000 0 66 0 12 2 1 14 1 96
$50,001–$250,000 1 69 0 37 5 0 64 11 187
$250,001–less than $500,000 0 38 0 22 6 3 17 1 87
$500,000–less than $1 million 0 21 0 12 2 1 24 3 63
$1 million–less than $5 million 0 14 0 15 3 1 13 6 52
$5 million–$10 million 1 4 1 3 0 0 4 0 13
Over $10 million 4 1 0 1 0 0 3 0 9
Total 6 213 1 102 18 6 139 22 507
Note: One company with an international registered address has been excluded from these statistics.
DEFICIENCY CATEGORIES
Table 3.2.5.4 - Initial external administrators' reports for Transport, postal & warehousing industry—Assets, liabilities and deficiency by region (1 July 2013–30 June 2014)
ASSET CATEGORIES
LIABILITIES CATEGORIES
Australian Capital Territory
New South Wales
Northern Territory Queensland South Australia Tasmania Victoria
Western Australia No. of reports
$1–$1 000 0 5 0 4 0 0 4 1 14
$1,001–$10,000 0 23 0 5 3 0 14 2 47
$10,001–$50,000 2 10 0 6 1 2 3 1 25
$50,001–$150,000 0 3 0 0 0 0 4 0 7
$150,001–$250,000 1 1 0 0 0 0 0 0 2
$250,001–$500,000 0 0 0 0 0 0 1 0 1
$500,001–less than $1.5 million 0 0 0 0 0 0 0 0 0
$1.5 million–$5 million 0 0 0 0 0 0 0 0 0
Over $5 million 0 0 0 0 0 0 0 0 0
Not Applicable 3 169 1 86 14 4 112 18 407
Total 6 211 1 101 18 6 138 22 503
$1–$1,000 0 4 0 2 0 0 1 1 8
$1,001–$10,000 0 18 0 7 4 0 19 1 49
$10,001–$50,000 1 12 0 12 1 1 6 2 35
$50,001–$150,000 2 6 1 2 0 2 3 1 17
$150,001–$250,000 0 1 0 0 1 0 2 1 5
$250,001–$500,000 1 1 0 0 0 0 1 0 3
$500,001–less than $1.5 million 0 0 0 0 0 0 2 0 2
$1.5 million–$5 million 0 0 0 0 0 0 0 0 0
Over $5 million 0 0 0 0 0 0 0 0 0
Not Applicable 2 169 0 78 12 3 104 16 384
Total 6 211 1 101 18 6 138 22 503
$1–$1,000 0 4 0 2 0 0 2 0 8
$1,001–$10,000 0 4 0 6 1 0 6 1 18
$10,001–$50,000 1 10 0 7 1 1 4 4 28
$50,001–$150,000 2 2 1 0 0 0 2 0 7
$150,001–$250,000 0 0 0 0 1 1 2 0 4
$250,001–$500,000 1 0 0 0 0 0 1 0 2
$500,001–less than $1.5 million 0 0 0 0 0 0 0 0 0
$1.5 million–$5 million 0 0 0 0 0 0 0 0 0
Over $5 million 0 0 0 0 0 0 0 0 0
Not Applicable 2 191 0 86 15 4 121 17 436
Total 6 211 1 101 18 6 138 22 503
$1–$1,000 0 4 0 2 0 0 1 0 7
$1,001–$10,000 0 2 0 0 0 0 1 0 3
$10,001–$50,000 0 6 0 4 0 0 2 3 15
$50,001–$150,000 1 2 0 1 1 0 2 0 7
$150,001–$250,000 1 1 1 0 0 0 2 0 5
$250,001–$500,000 1 1 0 0 1 1 2 0 6
$500,001–less than $1.5 million 0 0 0 0 0 0 1 0 1
$1.5 million–$5 million 0 0 0 0 0 0 0 0 0
Over $5 million 0 0 0 0 0 0 0 0 0
Not Applicable 3 195 0 94 16 5 127 19 459
Total 6 211 1 101 18 6 138 22 503
$1–$1,000 0 3 0 2 0 0 0 0 5
$1,001–$10,000 0 5 0 0 0 0 2 2 9
$10,001–$50,000 3 7 0 6 0 1 1 1 19
$50,001–$150,000 1 2 1 0 1 1 5 0 11
$150,001–$250,000 0 1 0 0 1 0 1 0 3
$250,001–$500,000 0 0 0 0 0 0 0 0 0
$500,001–less than $1.5 million 0 0 0 0 0 0 0 0 0
$1.5 million–$5 million 0 0 0 0 0 0 0 0 0
Over $5 million 0 0 0 0 0 0 0 0 0
Not Applicable 2 193 0 93 16 4 129 19 456
Total 6 211 1 101 18 6 138 22 503
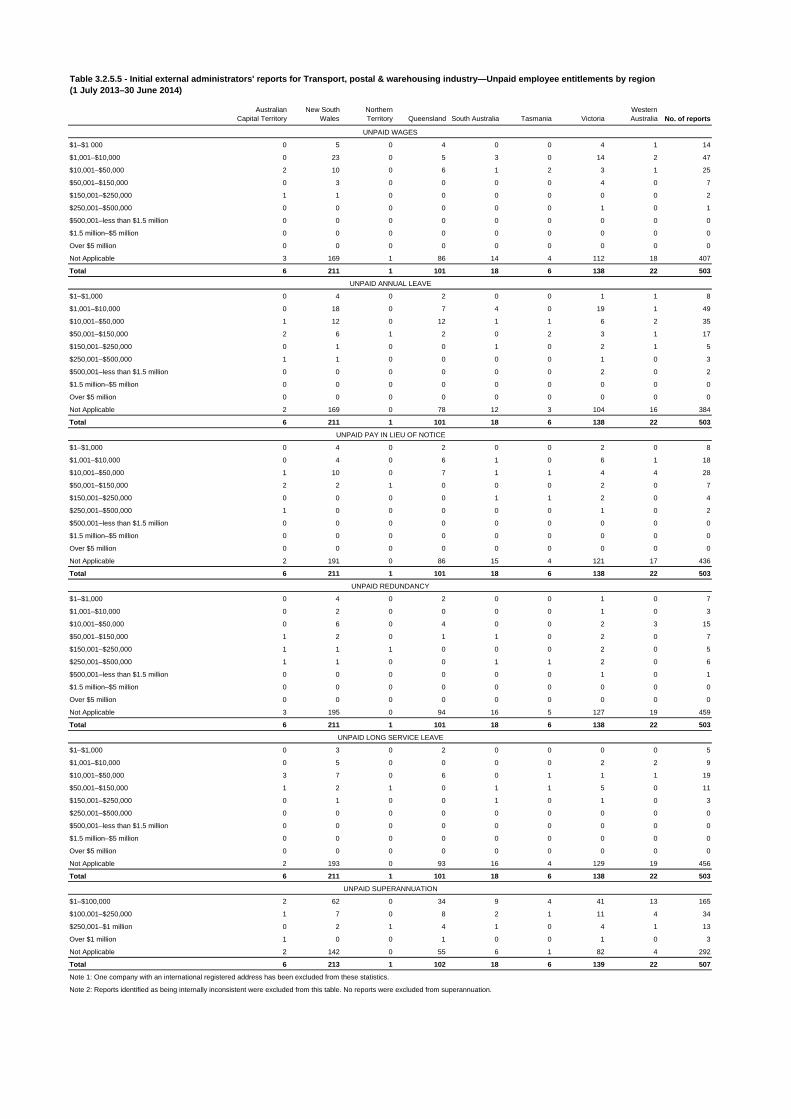
$1–$100,000 2 62 0 34 9 4 41 13 165
$100,001–$250,000 1 7 0 8 2 1 11 4 34
$250,001–$1 million 0 2 1 4 1 0 4 1 13
Over $1 million 1 0 0 1 0 0 1 0 3
Not Applicable 2 142 0 55 6 1 82 4 292
Total 6 213 1 102 18 6 139 22 507
Note 1: One company with an international registered address has been excluded from these statistics.
Note 2: Reports identified as being internally inconsistent were excluded from this table. No reports were excluded from superannuation.
Table 3.2.5.5 - Initial external administrators' reports for Transport, postal & warehousing industry—Unpaid employee entitlements by region (1 July 2013–30 June 2014)
UNPAID WAGES
UNPAID ANNUAL LEAVE
UNPAID PAY IN LIEU OF NOTICE
UNPAID REDUNDANCY
UNPAID LONG SERVICE LEAVE
UNPAID SUPERANNUATION
Australian Capital Territory
New South Wales
Northern Territory Queensland South Australia Tasmania Victoria
Western Australia No. of reports
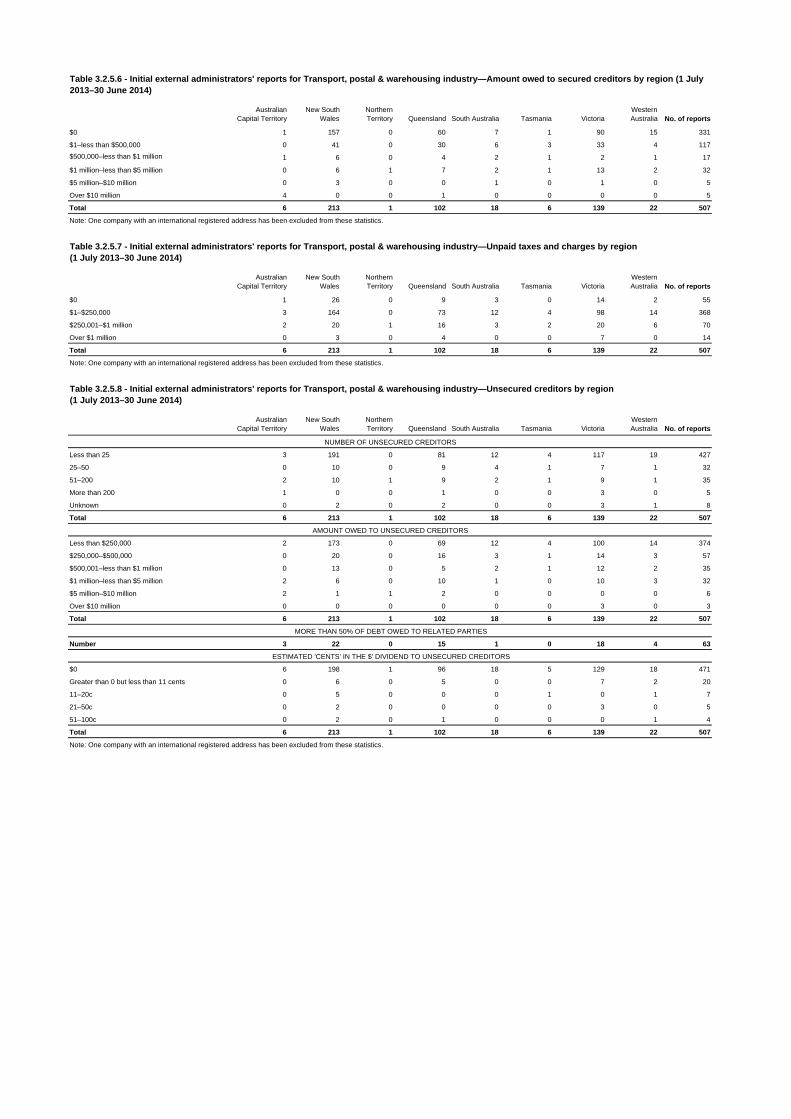
$0 1 157 0 60 7 1 90 15 331
$1–less than $500,000 0 41 0 30 6 3 33 4 117
$500,000–less than $1 million 1 6 0 4 2 1 2 1 17
$1 million–less than $5 million 0 6 1 7 2 1 13 2 32
$5 million–$10 million 0 3 0 0 1 0 1 0 5
Over $10 million 4 0 0 1 0 0 0 0 5
Total 6 213 1 102 18 6 139 22 507
Note: One company with an international registered address has been excluded from these statistics.
Australian Capital Territory
New South Wales
Northern Territory Queensland South Australia Tasmania Victoria
Western Australia No. of reports
$0 1 26 0 9 3 0 14 2 55
$1–$250,000 3 164 0 73 12 4 98 14 368
$250,001–$1 million 2 20 1 16 3 2 20 6 70
Over $1 million 0 3 0 4 0 0 7 0 14
Total 6 213 1 102 18 6 139 22 507
Note: One company with an international registered address has been excluded from these statistics.
Australian Capital Territory
New South Wales
Northern Territory Queensland South Australia Tasmania Victoria
Western Australia No. of reports
Less than 25 3 191 0 81 12 4 117 19 427
25–50 0 10 0 9 4 1 7 1 32
51–200 2 10 1 9 2 1 9 1 35
More than 200 1 0 0 1 0 0 3 0 5
Unknown 0 2 0 2 0 0 3 1 8
Total 6 213 1 102 18 6 139 22 507
Less than $250,000 2 173 0 69 12 4 100 14 374
$250,000–$500,000 0 20 0 16 3 1 14 3 57
$500,001–less than $1 million 0 13 0 5 2 1 12 2 35
$1 million–less than $5 million 2 6 0 10 1 0 10 3 32
$5 million–$10 million 2 1 1 2 0 0 0 0 6
Over $10 million 0 0 0 0 0 0 3 0 3
Total 6 213 1 102 18 6 139 22 507
Number 3 22 0 15 1 0 18 4 63
$0 6 198 1 96 18 5 129 18 471
Greater than 0 but less than 11 cents 0 6 0 5 0 0 7 2 20
11–20c 0 5 0 0 0 1 0 1 7
21–50c 0 2 0 0 0 0 3 0 5
51–100c 0 2 0 1 0 0 0 1 4
Total 6 213 1 102 18 6 139 22 507
Note: One company with an international registered address has been excluded from these statistics.
Table 3.2.5.7 - Initial external administrators' reports for Transport, postal & warehousing industry—Unpaid taxes and charges by region (1 July 2013–30 June 2014)
Table 3.2.5.6 - Initial external administrators' reports for Transport, postal & warehousing industry—Amount owed to secured creditors by region (1 July 2013–30 June 2014)
Table 3.2.5.8 - Initial external administrators' reports for Transport, postal & warehousing industry—Unsecured creditors by region (1 July 2013–30 June 2014)
NUMBER OF UNSECURED CREDITORS
AMOUNT OWED TO UNSECURED CREDITORS
MORE THAN 50% OF DEBT OWED TO RELATED PARTIES
ESTIMATED 'CENTS' IN THE $' DIVIDEND TO UNSECURED CREDITORS

Australian Capital Territory
New South Wales
Northern Territory Queensland South Australia Tasmania Victoria
Western Australia No. of reports
$0 0 20 0 7 3 1 9 1 41
$1–$50,000 5 7 0 4 1 0 11 2 30
$50,001–$100,000 1 7 0 3 2 0 2 2 17
$100,001–$250,000 0 3 1 1 1 1 0 0 7
Over $250,000 0 0 0 0 0 0 1 0 1
Not applicable 0 176 0 87 11 4 116 17 411
Total 6 213 1 102 18 6 139 22 507
$0 0 18 0 7 3 1 8 1 38
$1–$50,000 0 3 0 0 0 0 0 0 3
$50,001–$100,000 0 3 0 0 0 0 0 1 4
$100,001–$250,000 0 0 0 0 0 0 0 0 0
Over $250,000 0 0 0 0 0 0 0 0 0
Not applicable 6 189 1 95 15 5 131 20 462
Total 6 213 1 102 18 6 139 22 507
$0 0 82 0 32 8 1 35 4 162
$1–$50,000 0 109 0 61 6 2 82 14 274
$50,001–$100,000 0 8 0 6 2 3 6 3 28
$100,001–$250,000 0 5 0 1 1 0 8 0 15
Over $250,000 0 0 0 0 0 0 2 0 2
Not applicable 6 9 1 2 1 0 6 1 26
Total 6 213 1 102 18 6 139 22 507
$0 0 20 0 7 3 1 9 1 41
$1–$50,000 0 3 0 0 0 0 1 0 4
$50,001–$100,000 0 0 0 0 0 0 0 0 0
$100,001–$250,000 0 0 0 0 0 0 0 0 0
Over $250,000 0 1 0 0 0 0 0 0 1
Not applicable 6 189 1 95 15 5 129 21 461
Total 6 213 1 102 18 6 139 22 507
Note: One company with an international registered address has been excluded from these statistics.
© Australian Securities & Investments Commission
RECEIVER/CONTROLLER FEES
Table 3.2.5.9 - Initial external administrators' reports for Transport, postal & warehousing industry—External administrator's remuneration by region (1 July 2013–30 June 2014)
VOLUNTARY ADMINISTRATOR FEES
DEED OF COMPANY ARRANGEMENT FEES
LIQUIDATOR FEES


![Welcome [] · Web viewAnnual Reports by External Examiners, with responses, are published on Blackboard and made available to students. External Examiners are required to remain impartial](https://img.pdfslide.us/doc/110x75/5e28105c8232ff54656657a9/welcome-web-view-annual-reports-by-external-examiners-with-responses-are-published.jpg)


![External Credit Rating Reports [Company Update]](https://img.pdfslide.us/doc/110x75/577ca5b51a28abea748ba0cd/external-credit-rating-reports-company-update.jpg)