Embed Size (px)
Citation preview
RAPID REPORTS eurostat External trade and balance of payments
1993 D 2 ISSN 1017-5792
EUROPEAN COMMUNITY (EC) TRADE WrTH AFRICAN, CARIBBEAN AND PACIFIC COUNTRIES (ACP) -Results until September 1992-
PART I. EC TRADE BALANCE VIS-A-VIS THE ACP AND CLASS 2 COUNTRIES EC TRADE BALANCE WITH ACP
MIoEcus 1500
TOTAL ACP
1990 1991
NON OIL ACP
1. EC's trade deficit with the ACP countries was around 1.3 billion ecus in the first nine months of 1992; for the same period of 1991 this deficit was 2.7 billion ecus. This reduction (by more than a half) of the EC's trade deficit is due both to the rise of EC exports (7,1%) and the reduction of EC imports (4,5%) from these countries.
2. The EC experienced a surplus of 305 millions ecus during the third quarter of 1992.
3. EC's trade balance with CLASS 2 countries experienced a surplus of more than 3 billion ecus in the first three quarters of 1992, compared with a deficit of 10,4 billion ecus in the same period of 1991. While EC imports from this group went down 3,6%, EC exports increased by 9,3%. When considering non-oil trade, this EC surplus rose from 20 billion ecus in the first nine months of 1991 to 30 billion ecus in the same period of 1992.
4.The cover ratio for CLASS 2 countries was 103% in the first three quarters of 1992.
TABLE I. EC TRADE BALANCE VIS-A-VIS THE ACP AND CLASS 2 COUNTRIES <2> (Mio ECU/1)
EC importe from the ACP P' EC exporte to the ACP P) EC trade balance with the ACP P) Export/import ratio % EC imports from CLASS 2 EC exporte to CLASS 2 EC trade balance with CLASS 2 Export /import ratio %
TOTAL TRADE
1990
20 125,1 16 649,4 - 3 4 7 5 , 6
82,7 143 947,9 134424,9 - 9 5 2 3 , 0
93,4
1991
19 269,9 16 007,1 - 3 262,9
83,1 150318,1 142672,2 - 7 645,9
94,9
1991
01-09
14 291,8 11581,8 -2710 ,0
81,0 112 004,8 101 559,6 -10 445,2
90,7
1992
01-09
13 654,1 12 399,2 - 1 254,9
90,8 107 945,4 111 008,2
3 062,8 102,8
NON-OIL TRADE
1990
13543,7 16 307,3 2 763,6
120,4 99 453,8
132 405,2 32 951,9
133,1
1991
12 622,0 15 663,4 3041,3
124,1 105887,5 140454,9 34567,4
132,6
1991
01-09
9 409,9 11 307,4 1 897,4
120,2 79 493,6 99 886,3 20 392,7
125,7
1992
01-09
9424,2 12200,7 2776,5
129,5 79473,7
109535,5 30061,7
137,8
O External Trade Statietice (Imports CIF, Exporte FOB). Source EUROSTAT. SITC Rev.3 is in application from 1988. (2) Developing countries. P) Namibia from 1991.
This report was elaborated with the assistance of the DQ VIII.
Manuscript completed on = 26.02.93
For further information please contact: E. BARREDO Eurostat, L-2920 Luxembourg, tel. 4301-32149 Fax:4301-34762
Price (excl. VAT) in Luxembourg: Subscription ECU 206 Catalogue number: CA-NO-93-002-EN-C
PART II. EC IMPORTS FROM THE ACP AND CLASS 2 COUNTRIES
EC IMPORTS FROM ACP
Mo Ecus 3500
2500
20ÛO
r ^ j \
■VA"'
1 ! 1 1 1 I ! !
1986 1989
V
1 1 I I
1990
I I I I
1991
\
1 1 1
1992
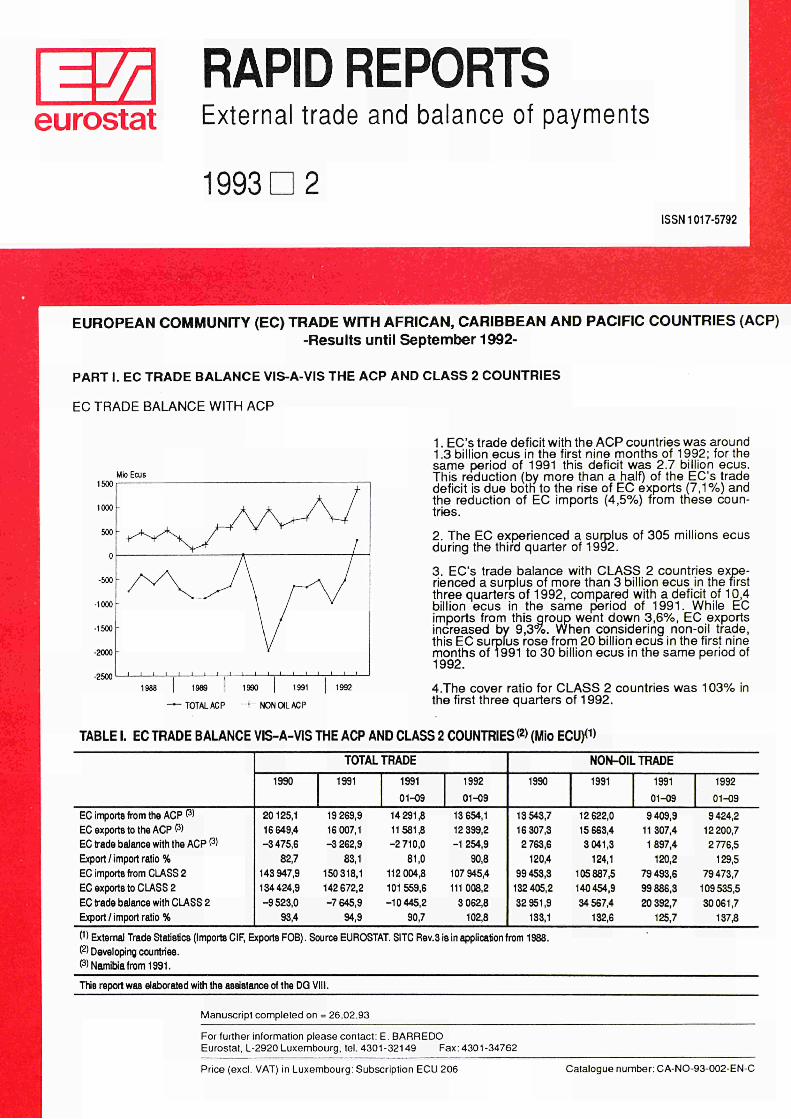
1. EC imports from ACP went down 11,8% in value and 9,9% in volume in the third quarter of 1992 compared to the same period of 1 9 9 1 With these figures, EC imports from these countries went down by 4,5% to 13,6 billion ecus in the first nine months of 1992.
2. EC imports of manufactured products (SITC 58) from ACPincreased by 12% in the first three quarters of 1992 when compared to the same period of 1991. EC imports of food, beverages and tobacco (SITC 0+1) and raw materials other than fuels (SITC 2+4) went down 2,7% and 8 , 1 % respectively in the first nine months of 1992. EC imports of fuel (SITC 3), which represented around 28% of total EC imports from ACP, experienced a decrease of 13,4% during the same period.
3. EC imports from CLASS 2 countries showed the same panem during the first nine months of 1992: imports of manufactured products (around 50% of total EC imports from these countries) increased by 1,1%, while the rest of the SITC sections (excluding "other products") experienced a decrease.
SiïC ^ (0+1+2+4) + ( 3 ) +(59)
TABLE I!. EC IMPORTS FROM THE ACP AND CLASS 2 COUNTRIES <1>
TRADE BY PRODUCTS (SlTC)
ACP (69) (3)
Total (value 09) (volume 08)
Fuel (3)
Food, beverages, tabacco (0+1)
Food and live animals (0)
Beverages and tobacco (1)
Raw materials non fuels (2+4)
Manufactured products (58)
Other products (9)
CLASS 2 COUNTRIES'2)
Total (value 09) (volume 08)
Fuel (3)
Food, beverages, tabacco (0+1)
Food and live animals (0)
Beverages and tobacco (1)
Raw materials non fuels (2+4)
Manufactured products (58)
Other products (9)
MEMORANDUM ITEM
EXTRAEC
ACP/ExtraEC (in%)
ACP/CLASS2 countries (in%)
CLASS 2 countries / ExtraEC (in %)
VALUE
1990
Mio ECU
20125,1
6581,4
4838,3
4468,6
369,8
3193,6
4 946,2
565,6
143 947,9
44494,6
20 744,7
19447,4
1 297,3
12735,3
62470,2
3503,1
462 720,1
4,3
14,0
31,1
1991
Mio ECU
19 269,9
6647,9
5004,3
4521,1
483,2
2 742,8
4 264,5
610,5
150318,1
44430,6
21 880,5
20199,6
1680,8
11 557,8
68987,8
3461,4
493 990,0
3,9
12,8
30,4
1992
0109
Mio ECU
13 654,1
4 229,9
3 556,4
3 203,4
353,0
1 909,9
3586,3
371,6
107 945,4
28 471,7
15 936,7
14 729,5
1 207,2
8 026,6
52 526,0
2 984,4
363 386,9
3,8
12,6
29,7
1992
0709
Mio ECU
4 058,7
1 121,9
1 117,7
1 023,4
94,3
566,7
1 152,8
99,6
35 065,4
9 301,3
4789,7
4361,5
428,2
2657,1
17387,5
929,8
114 798,6
3,5
11,6
30,5
91/90
0112
%var.
^1,2
1,0
3,4
1,2
30,7
14,1
13,8
7,9
4,4
0,1
5,5
3,9
29,6
9,2
10,4
1,2
6,8
92/91
0109
% var.
4,5
13,4
2,7
3,5
4,5
8,1
12,0
21,9
3,6
12,4
1,7
2,0
1,4
8,9
1,1
19,1
1,4
92/91
0709
%var.
11,8
23,1
-4,2
■4,2
4,1
17,5
2,1
37,8
8,7
17,0
8,4
9,4
4,0
16,6
3,0
8,9
6,5
VOLUME
91/90
%var.
4,8
16,6
1,0
2,7
23,3
17,5
23,2
7,1
10,7
2,9
2,2
14,8
7,0
8,3
92/91
0709
% var.
9,9
15,4
2,2
2,4
1,6
15,3
12,7
0,7
«,8
1,9
1,3
5,4
8,6
5,5
O External Trade Statistics (Imports CIF, Exports FOB). Source EUROSTAT. SITC Rev.3 isin application from 1988.
P) Developing countries.
P) Namibia from 1991.
PART III. EC EXPORTS TO THE ACP AND CLASS 2 COUNTRIES
EC EXPORTS TO ACP
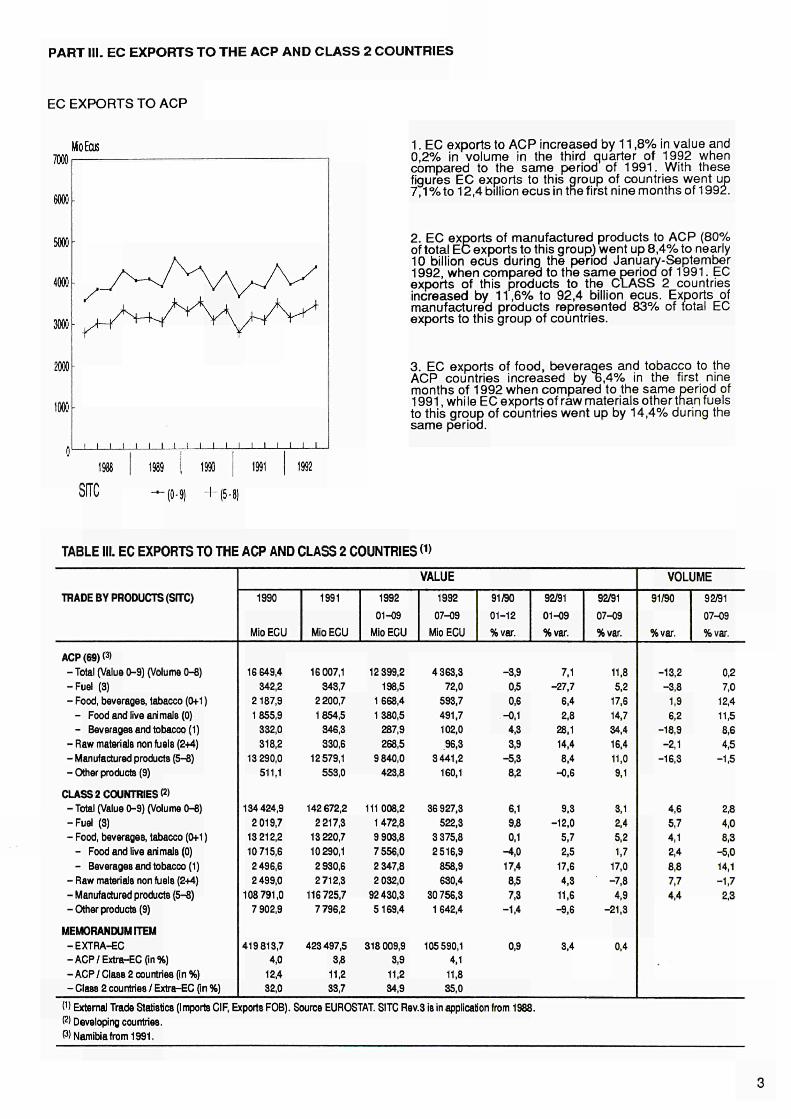
Mo Ecus 1. EC exports to ACP increased by 11,8% in value and 0,2% in volume in the third quarter of 1992 when compared to the same period of 1991. With these figures EC exports to this group of countries went up 7,1 % to 12,4 billion ecus in the first nine months of 1992.
2. EC exports of manufactured products to ACP (80% of total EC exports to this group) went up 8,4% to nearly 10 billion ecus during the period January-September 1992, when compared to the same period of 1991. EC exports of this products to the CLASS 2 countries increased by 11,6% to 92,4 billion ecus. Exports of manufactured products represented 83% of total EC exports to this group of countries.
3. EC exports of food, beverages and tobacco to the ACP countries increased by 6,4% in the first nine months of 1992 when compared to the same period of 1991, while EC exports of raw materials other than fuels to this group of countries went up by 14,4% during the same period.
TABLE III. EC EXPORTS TO THE ACP AND CLASS 2 COUNTRIES (1>
TRADE BY PRODUCTS (SITC)
ACP (69) CT - Total (Value 0-9) (Volume 0-8) -Fuel (3) - Food, beverages, tabacco (0+1 )
- Food and live animals (0) - Beverages and tobacco (1)
- Raw materials non fuels (2+4) - Manufactured products (5-8) -Other products (9)
CLASS 2 COUNTRIES P> - Total (Value 0-9) (Volume 0-«) -Fuel (3) - Food, beverages, tabacco (0+1 )
- Food and live animals (0) - Beverages and tobacco (1)
- Raw materials non fuels (2+4) - Manufactured products (5-8) -Other products (9)
MEMORANDUM ITEM -EXTRA-EC -ACP/Extra-EC (in%) - ACP/ Class 2 countries (in %) - Class 2 countries / Extra-EC (in %)
VALUE
1990
Mio ECU
16 649,4 342,2
2 187,9 1855,9
332,0 318,2
13 290,0 511,1
134424,9 2 019,7
13 212,2 10 715,6 2496,6 2499,0
108 791,0 7 902,9
419 813,7 4,0
12,4 32,0
1991
Mio ECU
16007,1 343,7
2200,7 1854,5
346,3 330,6
12579,1 553,0
142672,2 2217,3
13220,7 10290,1 2 930,6 2712,3
116725,7 7796,2
423497,5 3,8
11,2 33,7
1992 01-09
Mio ECU
12 399,2 198,5
1668,4 1380,5
287,9 268,5
9840,0 423,8
111008,2 1 472,8 9 903,8 7556,0 2 347,8 2 032,0
92430,3 5169,4
318009,9 3,9
11,2 34,9
1992 07-09
Mio ECU
4363,3 72,0
593,7 491,7 102,0 .96,3
3441,2 160,1
36 927.3 522,3
3375,8 2516,9
858,9 630,4
30756,3 1 642,4
105590,1 4,1
11,8 35,0
91/90 01-12 %var.
-3,9 0,5 0,6
-0,1 4,3 3,9
-5,3 8,2
6,1 9,8 0,1
"4,0 17,4 8,5 7,3
-1,4
0,9
92/91 01-09 %var.
7,1 -27,7
6,4 2,8
28,1 14,4 8,4
-0,6
9,3 -12,0
5,7 2,5
17,6 4,3
11,6 -9.6
3,4
92/91 07-09 %var.
11,8 5,2
17,6 14,7 34,4 16,4 11,0 9,1
3,1 2,4 5,2 1,7
17,0 -7,8 4,9
-21,3
0,4
VOLUME
91/90
%var.
-13,2 -3,8
1,9 6,2
-18,9 -2,1
-16,3
4,6 5,7 4,1 2,4 8,8 7,7 4,4
92/91 07-09 %var.
0,2 7,0
12,4 11,5 8,6 4,5
-1,5
2,8 4,0 8,3
-5,0 14,1 -1,7 2,3
O External Trade Statistics (Imports CIF, Exports FOB). Source EUROSTAT. SITC Rev.3 is in application from 1988. P) Developing countries. P) Namibia from 1991.
PART IV. EC-ACP TRADE BY PARTNER COUNTRIES
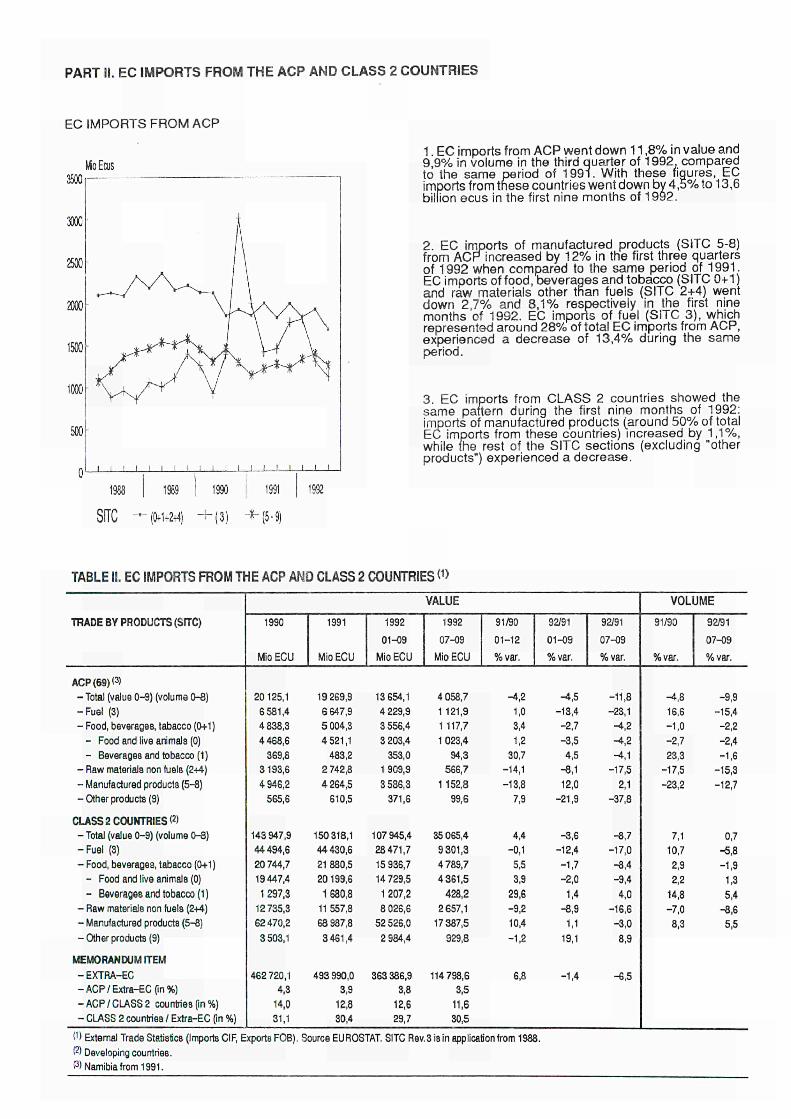
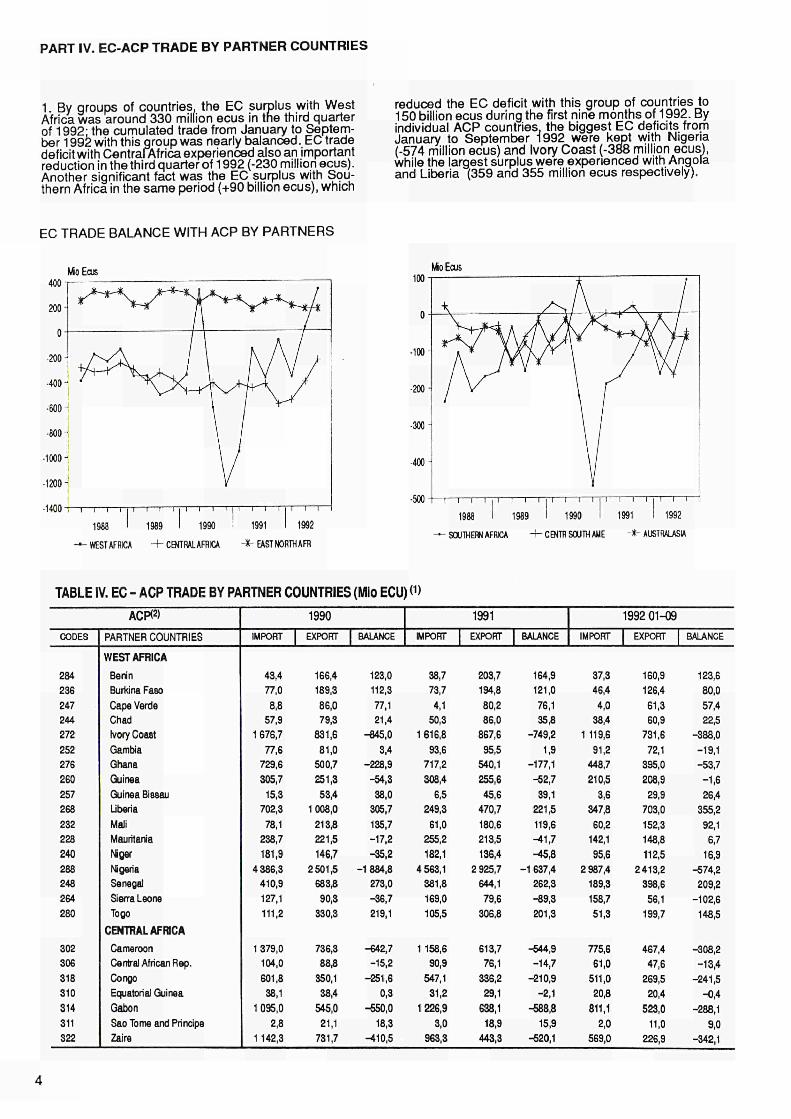
1. By groups of countries the EC surplus with West Africa was around 330 million ecus in the third quarter of 1992· the cumulated trade from January to September 1992 with this group was nearly balanced. EC trade deficit with CentraiAfrica experienced also an important reduction in the third quarter of 1992 (230 million ecus). Another significant fact was the EC surplus with Southern Africa in the same period (+90 billion ecus), which
reduced the EC deficit with this group of countries to 150 billion ecus during the first nine months of 1992. By individual ACP countries, the biggest EC deficits from January to September 1992 were kept with Nigeria (574 million ecus) and Ivory Coast (388 million ecus), while the largest surplus were experienced with Angola and Liberia (359 and 355 million ecus respectively).
EC TRADE BALANCE WITH ACP BY PARTNERS
Mo Ecus Mo Ecus
400
200
o
200
400
■600
•800
1000
1200
1400 1 1 1 I I I
1988
— WEST AFRICA
Ι Ι Ι ι 1 I I I
1989 i 1990
+ CENTRALAFRICA
1991 I 1992
+ EAST NORTH AFR
0
•100
•200
■300
400
•500 ι—ι—ryt—ι—ι—rri—ι—ι—τπ ι ι ryi ι τ
1988 1989 > 1990 1991 Ι 1992
■SOUTHERN AFRICA - 4 - CENTR SOUTH AUE Ht-AUSTRALASIA
TABLE IV. EC - ACP TRADE BY PARTNER COUNTRIES (Mio ECU) <1>
ACP<2>
CODES
284
236
247
244
272
252
276
260
257
268
232
228
240
288
248
264
280
302
306
318
310
314
311
322
PARTNER COUNTRIES
W E S T AFRICA
Benin
Burkina Faso
Cape Verde
Chad
Ivory Coast
Gambia
Ghana
Guinea
Guinea Bissau
Liberia
Mali
Mauritania
Niger
Nigeria
Senegal
Sierra Leone
Togo
C E N T R A L A F R I C A
Cameroon
Central African Rep.
Congo
Equatorial Guinea
Gabon
Sao Tome and Principe
Zaire
1990
IMPOFfT
43,4
77,0
8,8
57,9
1 676,7
77,6
729,6
305,7
15,3
702,3
78,1
238,7
181,9
4386,3
410,9
127,1
111,2
1 379,0
104,0
601,8
38,1
1095,0
2,8
1 142,3
EXPORT
166,4
189,3
86,0
79,3
831,6
81,0
500,7
251,3
53,4
1008,0
213,8
221,5
146,7
2501,5
6833
90,3
330,3
736,3
883
350,1
38,4
545,0
21,1
731,7
BALANCE
123,0
112,3
77,1
21,4
845,0
3,4
228,9
54,3
38,0
305,7
135,7
17,2
35,2
1884,8
273,0
36,7
219,1
642,7
15,2
251,6
0,3
550,0
18,3
410,5
1991
IMPOFfT
38,7
73,7
4,1
50,3
1 616,8
93,6
717,2
308,4
6,5
249,3
61,0
255,2
182,1
4563,1
381,8
169,0
105,5
1158,6
90,9
547,1
31,2
1226,9
3,0
963,3
EXPORT
203,7
194,8
80,2
86,0
867,6
95,5
540,1
255,6
45,6
470,7
180,6
213,5
136,4
2 925,7
644,1
79,6
306,8
613,7
76,1
336,2
29,1
638,1
18,9
443,3
BALANCE
164,9
121,0
76,1
35,8
749,2
1,9
177,1
52,7
39,1
221,5
119,6
41,7
45,8
1 637,4
262,3
89,3
201,3
544,9
14,7
210,9
2,1
688,8
15,9
520,1
1992 0109
IMPORT
37,3
46,4
4,0
38,4
1 119,6
91,2
448,7
210,5
3,6
347,8
60,2
142,1
95,6
2 987,4
189,3
158,7
51,3
775,6
61,0
511,0
20,8
811,1
2,0
569,0
EXPORT
160,9
126,4
61,3
60,9
731,6
72,1
395,0
208,9
29,9
703,0
152,3
148,8
112,5
2413,2
398,6
56,1
199,7
467,4
47,6
269,5
20,4
523,0
11,0
226,9
BALANCE
123,6
80,0
57,4
22,5
388,0
19,1
53,7
1,6
26,4
355,2
92,1
6,7
16,9
574,2
209,2
102,6
148,5
308,2
13,4
241,5
0,4
288,1
9,0
342,1
TABLE IV. EC - ACP TRADE BY PARTNER COUNTRIES (Mio ECU) <1>
ACPrø
CODES
328
338
334
346
324
342
224
352
350
378
330
391
375
395
370
386
373
366
389
355
393
382
459
453
469
421
460
456
473
488
452
464
449
465
467
492
472
815
812
801
806
817
807
816
819
PARTNER COUNTRIES
EAST AND NORTH AFRICA
Burundi
Djibouti
Ethiopia
Kenya
Rwanda
Somalia
Sudan
Tanzania
Uganda
Zambia
SOUTHERN AFRICA
Angola
Botswana
Comoros
Lesotho
Madagascar
Malawi
Mauritius
Mozambique
Namibia
Seychelles and dep.
Swaziland
Zimbabwe
CENTRAL AND SOUTH
AMERICA'3)
Antigua and Barbuda
Bahamas
Barbados
Belize
Dominica
Dominican Republic
Grenada
Guyana
Haiti
Jamaica
St Christophers Nevis
St Lucia
St Vincent
Surinam
Trinidad and Tobago
AUSTRALASIA,OCEANIA
AND OTHERS
Fiji
Kiribati
Papua New Guinea
Solomon Islands
Tonga
Tuvalu
Vanuatu
Western Samoa
1990
IMPORT
74,6
27,8
128,7
519,9
78,9
46,7
160,2
177,1
131,2
365,5
1 091,7
74,0
13,7
8,4
156,2
133,9
755,8
63,6
-
53,4
127,5
576,6
24,1
213,6
37,3
34,0
36,3
117,0
11,2
118,5
35,1
277,8
6,4
84,4
62,9
183,0
177,9
92,7
1,6
224,8
15,0
0,3
0,1
11,9
2,1
EXPORT
89,5
134,0
414,0
797,1
92,8
145,2
339,1
400,5
152,8
239,9
842,7
78,8
30,9
18,0
259,6
115,9
391,5
258,2
-
55,6
19,3
335,9
42,5
306,9
83,8
33,3
23,9
216,1
15,8
45,5
62,2
171,8
12,3
36,5
30,1
93,8
139,1
29,4
1,4
91,5
4,0
2,4
0,9
44,3
4,2
BALANCE
14,8
106,2
285,3
277,2
13,9
98,5
178,9
223,4
21,6
-125,6
-249,0
4,8
17,1
9,5
103,4
-17,9
-364,3
194,6
-
2,2
-108,2
-240,7
18,4
93,3
46,4
-0,8
-12,4
99,0
4,6
-73,0
27,2
-106,0
5,9
-48,0
-32,8
-89,2
-38,8
-63,3
-0,2
-133,3
-11,0
2,0
0,8
32,4
2,1
1991
IMPORT
70,7
37,4
119,6
565,1
106,9
16,7
103,4
179,7
130,8
255,4
832,3
82,2
13,1
20,1
167,8
183,0
780,2
66,6
135,4
52,3
126,3
643,6
12,8
215,8
32,7
33,3
39,8
119,8
10,3
119,3
27,5
285,9
9,3
72,3
48,6
130,9
174,5
120,0
1,2
198,5
19,0
Π 6
0,2
11,3
0,3
EXPORT
84,3
159,4
297,6
738,6
100,9
42,9
408,9
369,8
135,0
180,1
942,9
77,7
44,6
44,3
165,6
118,8
364,4
221,2
70,2
40,7
15,3
479,6
59,4
262,1
78,6
34,6
29,1
238,4
16,1
53,7
49,2
138,6
11,1
43,8
41,9
92,9
164,0
23,7
1,0
51,6
4,5
1,9
0,6
21,4
4,0
BALANCE
13,6
122,0
178,0
173,5
-6,0
26,1
305,5
190,1
4,2
-75,2
110,6
-4,4
31,5
24,2
-2,2
-64,2
-415,8
154,6
-65,3
-11,5
-111,0
-164,0
46,6
46,3
45,8
1,2
-10,6
118,6
5,7
-65,6
21,7
-147,3
1,8
-28,5
-6,7
-38,0
-10,5
-96,3
-0,3
-147,0
-14,5
1,3
0,5
10,0
3,7
1992 01-09
IMPORT
56,7
26,1
80,9
393,6
61,1
9,4
71,4
114,1
95,1
201,0
660,3
68,1
10,0
22,1
118,0
125,5
606,6
50,9
119,6
22,4
82,3
381,0
3,5
178,5
34,7
35,2
32,6
114,8
5,9
101,8
20,9
227,3
10,1
61,7
51,7
105,3
149,0
77,3
0,1
142,7
13,7
0,3
0,2
8,6
0,0
EXPORT
54,7
125,6
281,4
398,3
77,2
29,6
277,9
257,2
75,7
146,9
1019,6
44,4
18,2
22,1
130,4
86,7
277,9
151,1
62,7
29,3
11,3
265,5
24,9
103,5
39,4
19,3
18,0
163,1
9,5
30,6
34,6
91,3
7,4
30,4
23,0
69,7
132,8
18,9
2,9
52,8
4,5
0,8
0,4
15,2
3,1
BALANCE
-2,0
99,4
200,5
4,7
16,1
20,2
206,5
143,0
-19,4
-54,1
359,4
-23,7
8,2
0,0
12,4
-38,8
-328,7
100,2
-57,0
6,9
-71,0
-115,5
21,3
-75,0
4,7
-15,9
-14,6
48,4
3,6
-71,3
13,6
-136,0
-2,7
-31,4
-28,7
-35,6
-16,1
-58,4
2,7
-89,9
-9,3
0,5
0,2
6,5
3,1
(') External Trade Statistics (importe CIF, Exports FOB).
P) Geonomendature EUROSTAT.
Ρ) CARIBBEAN ACP.
(4) PACIFIC ACP.
PART V. EC-ACP TRADE BY MAIN PRODUCTS
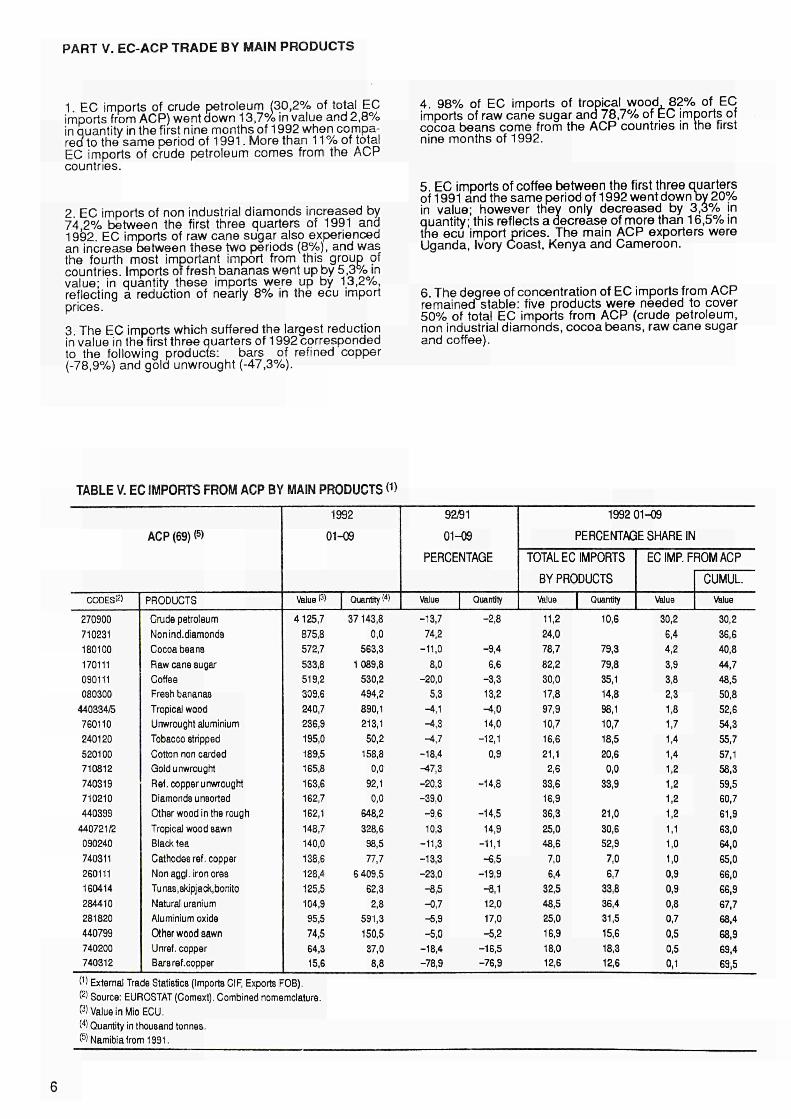
1 EC imports of crude petroleum (30,2% of total EC imports from ACP) went down 13,7% in value and 2,8% ¡n quantity in the first nine months of 1992 when compared to the same period of 1991. More than 11 % of total EC imports of crude petroleum comes from the ACP countries.
2 EC imports of non industrial diamonds increased by 74,2% between the first three quarters of 1991 and 1992. EC imports of raw cane sugar also experienced an increase between these two periods (8%), and was the fourth most important import from this group of countries. Imports of fresh bananas went up by 5,3% in value; in quantity these imports were up by 13,2%, reflecting a reduction of nearly 8% in the ecu import prices.
3. The EC imports which suffered the largest reduction in value in the first three quarters of 1992 corresponded to the following products: bars of refined copper -78,9%) and gold unwrought (-47,3%).
4. 98% of EC imports of tropical wood 82% of EC imports of raw cane sugar and 78,7% of EC imports of cocoa beans come from the ACP countries in the first nine months of 1992.
5. EC imports of coffee between the first three quarters of 1991 and the same period of 1992 went down by 20% in value; however they only decreased by 3,3% in quantity; this reflects a decrease of more than 16,5% in the ecu import prices. The main ACP exporters were Uganda, Ivory Coast, Kenya and Cameroon.
6. The degree of concentration of EC imports from ACP remained stable: five products were needed to cover 50% of total EC imports from ACP (crude petroleum, non industrial diamonds, cocoa beans, raw cane sugar and coffee).
TABLE V. EC IMPORTS FROM ACP BY MAIN PRODUCTS <1>
CODES!2)
270900 710231 180100 170111 090111 080300
440334/5 760110 240120 520100 710812 740319 710210 440399
440721/2 090240 740311 260111 160414 284410 281820 440799 740200 740312
ACP (69) <5)
PRODUCTS
Crude petroleum Non ind.diamonds Cocoa beans Raw cane sugar Coffee Fresh bananas Tropical wood Unwrought aluminium Tobacco stripped Cotton non carded Gold unwrought Ref. copper unwrought Diamonds unsorted Other wood in the rough
Tropical wood sawn Black tea Cathodes ref. copper Non aggi, iron ores Tunas,skipjack,bonito Natural uranium Aluminium oxide Other wood sawn Unref. copper Barsref.copper
1992
01-09
value (3¡
4125,7 875,8 572,7
533,8 519,2 309,6 240,7 236,9 195,0 189,5 165,8
163,6 162,7 162,1 148,7 140,0 138,6 128,4 125,5 104,9 95,5 74,5 64,3 15,6
Quantity I4)
37 143,8 0,0
563,3
1089,8 530,2 494,2 890,1 213,1 50,2
158,8 0,0
92,1 0,0
648,2 328,6 98,5 77,7
6 409,5 62,3 2,8
591,3 150,5 37,0 8,8
92/91
01-09
PERCENTAGE
Value
-13,7 74,2
-11,0 8,0
-20,0 5,3
-4,1 -4,3 -4,7
-18,4 -47,3 -20,3 -39,0
-9,6 10,3
-11,3 -13,3 -23,0 -8,5 -0,7 -5,9 -5,0
-18,4 -78,9
Quantity
-2,8
-9,4 6,6
-3,3 13,2 -4,0 14,0
-12,1 0,9
-14,8
-14,5 14,9
-11,1 -6,5
-19,9 -8,1 12,0 17,0 -5,2
-16,5 -76,9
1992 01-09
PERCENTAGE SHARE IN
TOTAL EC IMPORTS
BY PRODUCTS value
11,2 24,0 78,7
82,2 30,0 17,8 97,9 10,7 16,6
21,1 2,6
33,6 16,9 36,3 25,0 48,6 7,0 6,4
32,5 48,5 25,0 16,9 18,0 12,6
! Quantity
10,6
79,3 79,8 35,1 14,8 98,1 10,7 18,5 20,6 0,0
33,9
21,0 30,6 52,9 7,0 6,7
33,8 36,4 31,5 15,6 18,3 12,6
EC IMP. F
Value
30,2 6,4 4,2 3,9 3,8 2,3 1,3 1,7 1,4 1,4 1,2 1,2 1,2 1,2 1,1 1,0 1,0 0,9 0,9 0,8 0,7 0,5 0,5 0,1
ROM ACP
CUMUL value
30,2 36,6 40,8 44,7 48,5 50,8 52,6 54,3 55,7 57,1 58,3 59,5 60,7 61,9 63,0 64,0 65,0 66,0 66,9 67,7 68,4
68,9 69,4 69,5
Í1) External Trade Statistics (Imports CIF, Exports FOB). P) Source: EUROSTAT (Comext). Combined nomemclature. P) Value in Mio ECU. (4' Quantity in thousand tonnes. (5) Namibia from 1991,
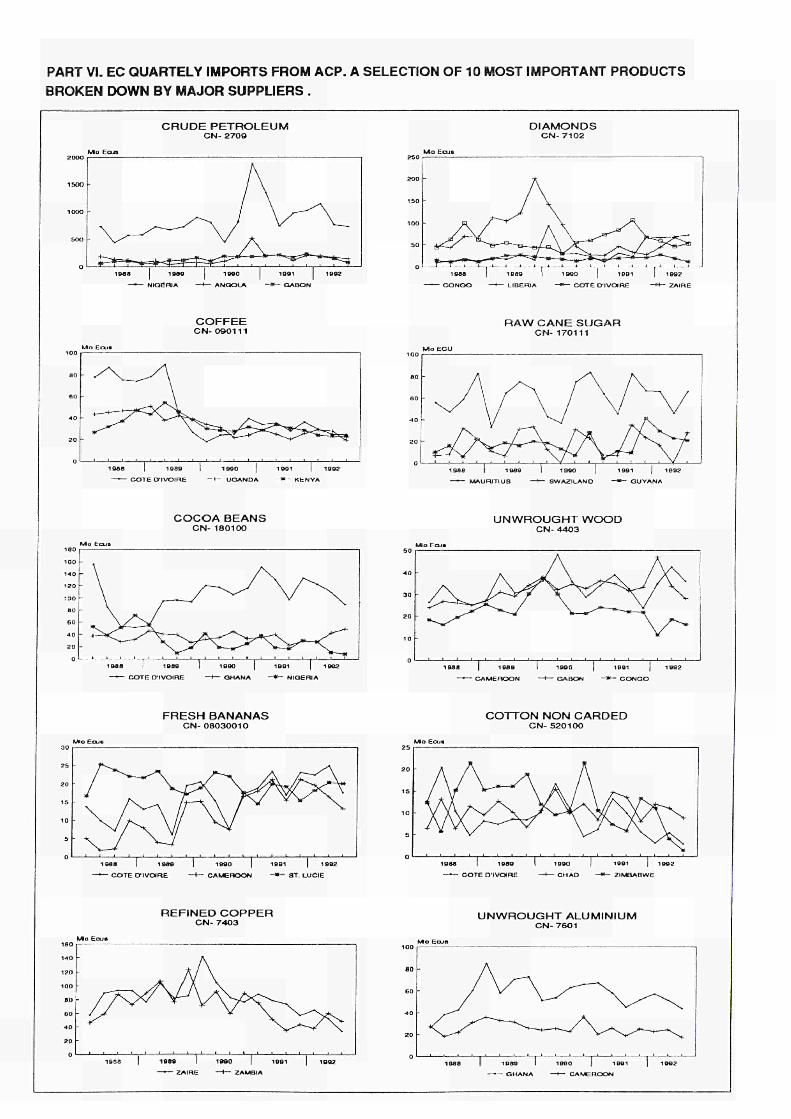
PART VI. EC QUARTELY IMPORTS FROM ACP A SELECTION OF 10 MOST IMPORTANT PRODUCTS
BROKEN DOWN BY MAJOR SUPPUERS .
CRUDE PETROLEUM CN-270Q
1 0 0 1 1 0 0 2
G A B O N
COFFEE CN- 0O0111
1 o e s i e e s
— C O T E C T I V O I R E
1 0 0 0 1 0 3 1 TOO?
U G A N D A — m - K E N Y A
DIAMONDS CN-7102
RAW CANE SUGAR CN- 170111
1 0 8 8 1ΒβΟ
— M A U R I T I U S
I M O
S W A Z I L A N D
e o i 1 0 0 2
— G U Y A N A
COCOA BEANS CN- 180100
1&SS 1 0 8 0
— C O T E D I V O t R E
1O00 11191 | 1 0 0 2
■ G H A N A — « — N I G E R I A
UNWROUGHT WOOD CN-4403
l O f l O 1Θ01
G A B O N * — C O N G O
FRESH BANANAS CN- 0Ö03OO1O
COTTON NON CARDED CN- 520100
1 0 8 8
— C O T E CTI V O I R E
10O0 1 0 0 1 1 9 0 2
C A M E R O O N * — S T . L U C I E
i o s a l ø a o
— — C O T E D ' l V O t R E
1 0 0 1 I 1 9 0 2
Z I M B A B W E
REFINED COPPER CN- 7403
UNWROUGHT ALUMINIUM CN- 7601
19QO 1 0 0 1
C A M E R O O N
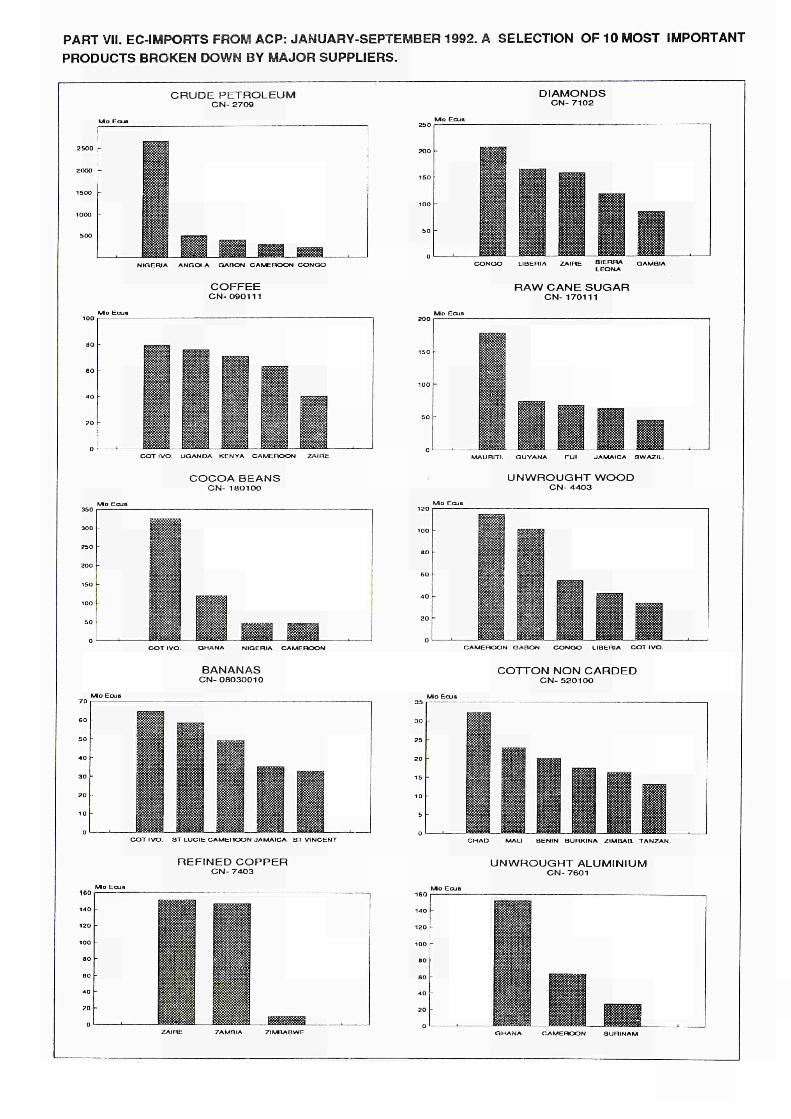
PART VII. EC-IMPORTS FROM ACP: JANUARY-SEPTEMBER 1992. A SELECTION OF 10 MOST IMPORTANT
PRODUCTS BROKEN DOWN BY MAJOR SUPPLIERS.
CRUDE PETROLEUM CN- 270Θ
NIGERIA ANGOLA GABON CAMEROON CONGO
COFFEE CN090111
COT IVO. UGANDA KENYA CAMEROON ZAIRE
COCOA BEANS CN- 180100
300
250
COT IVO. GHANA NIGERIA CAMEROON
BANANAS CNO8O3O010
COT IVO. aT LUCIE CAMEROON JAMAICA ST VINCENT
REFINED COPPER CN 7403
160
140
120
100
DIAMONDS CN7102
JBERIA ZAIRE SIERRA GAMBIA LEONA
RAW CANE SUGAR CN- 170111
MAURITI. GUYANA JAMAICA SWAZIL
UNWROUGHT WOOD CN 4403
CAMEROON GABON CONGO LIBERIA COT IVO.
COTTON NON CARDED CN 52010O
CHAD MALI BENIN BURKINA ZIMBAB. TANZAN.
UNWROUGHT ALUMINIUM CN 7601
110
120
100
Sow»««?;]
WÊÊÈ
'Må r.-r.;.-ss.:::-„
1 , 1
ZIMBABWE