Embed Size (px)
Citation preview
ENTERPRISE DATA WAREHOUSE PRODUCT PERFORMANCE
REPORTS USER GUIDE
EXTERNAL
Version: 1.0
September 2004
Table of Contents
1.0 OVERVIEW..................................................................................................1
1.1 Product Performance Overview ........................................................................................ 1
1.2 Enterprise Data Warehouse Overview.............................................................................. 1
1.3 MicroStrategy Overview..................................................................................................... 1
2.0 GETTING STARTED ...................................................................................2
2.1 Obtaining Access through Mail Tracking & Reporting................................................... 2 2.1.1 New Users: Request Access .................................................................................... 2 2.1.2 Existing Users: Logging into the Application .......................................................... 12
2.2 Logging out of the Application........................................................................................ 17
3.0 REVIEWING SYSTEM FOLDERS.............................................................18
3.1 Product Performance System Overview ........................................................................ 18
3.2 System Folders ................................................................................................................. 19 3.2.1 Home Folder ............................................................................................................ 19 3.2.2 Shared Reports Folder............................................................................................. 20 3.2.3 Shared Reports Descriptions................................................................................... 21 3.2.4 My Reports Folder ................................................................................................... 21 3.2.5 History Folder........................................................................................................... 22 3.2.6 Find Reports Folder ................................................................................................. 26 3.2.7 Help Folder .............................................................................................................. 27 3.2.8 FAQs Tab................................................................................................................. 29 3.2.9 Options Folder ......................................................................................................... 30 3.2.10 Business Areas Folder............................................................................................. 31 3.2.11 What’s New Folder................................................................................................... 31 3.2.12 Logout Folder........................................................................................................... 31
3.3 Changing Preferences...................................................................................................... 32 3.3.1 Changing the Folder View ....................................................................................... 32 3.3.2 Changing User Preferences .................................................................................... 33
4.0 PRODUCT PERFORMANCE DATA HIERARCHIES................................46
4.1 Product Performance Data Structure ............................................................................. 46 4.1.1 Product/Service Hierarchy ....................................................................................... 46 4.1.2 Location Hierarchy................................................................................................... 46 4.1.3 Time Hierarchy......................................................................................................... 47
5.0 GENERATING PRODUCT PERFORMANCE REPORTS .........................48
5.1 Understanding Auto-prompts.......................................................................................... 48
5.1.1 Parts of an Auto-prompt........................................................................................... 48 5.1.2 Product / Service Prompt......................................................................................... 50 5.1.3 Location Prompt....................................................................................................... 51 5.1.4 Time Prompt ............................................................................................................ 52 5.1.5 Qualify Prompt ......................................................................................................... 53 5.1.6 Shipper Prompt ........................................................................................................ 55 5.1.7 Customer Prompt..................................................................................................... 56 5.1.8 Selection Summary.................................................................................................. 57 5.1.9 Selecting Report Criteria.......................................................................................... 58 5.1.10 Selecting Report Criteria in Hierarchies................................................................... 59 5.1.11 Selecting Criteria Using the Drill Feature................................................................. 60 5.1.12 Drilling in Auto-prompts............................................................................................ 60 5.1.13 Using the “Search for” Field..................................................................................... 64
5.2 Report Format ................................................................................................................... 66 5.2.1 Parts of a Grid Report .............................................................................................. 66 5.2.2 Report Menu ............................................................................................................ 67 5.2.3 View Menu ............................................................................................................... 67 5.2.4 Data Menu ............................................................................................................... 68 5.2.5 Format Menu............................................................................................................ 69 5.2.6 Report Feature Information Buttons ........................................................................ 70 5.2.7 Report Buttons ......................................................................................................... 72
6.0 CUSTOMIZING PRODUCT PERFORMANCE REPORTS........................73
6.1 Customizing Report Format ............................................................................................ 73 6.1.1 Lock Report Headers ............................................................................................... 73 6.1.2 Merge Report Headers ............................................................................................ 75 6.1.3 Outline...................................................................................................................... 76
6.2 Customize Report Data .................................................................................................... 77 6.2.1 Data Pivoting............................................................................................................ 77 6.2.2 Totals ....................................................................................................................... 78 6.2.3 Page By ................................................................................................................... 79 6.2.4 Select Data to Display.............................................................................................. 81 6.2.5 Sorting...................................................................................................................... 82 6.2.6 Drilling ...................................................................................................................... 83
6.3 Using Report Tools........................................................................................................... 86 6.3.1 Print.......................................................................................................................... 86 6.3.2 Export....................................................................................................................... 87 6.3.3 PDF.......................................................................................................................... 88 6.3.4 Re-prompt ................................................................................................................ 89 6.3.5 Refresh .................................................................................................................... 89 6.3.6 Save......................................................................................................................... 90 6.3.7 Delete....................................................................................................................... 91 6.3.8 Report Details .......................................................................................................... 92
7.0 PRODUCT PERFORMANCE REPORTS..................................................93
7.1 Product Performance Reports Overview ....................................................................... 93
7.2 Delivery Success (Customer Data) ................................................................................. 93 7.2.1 Screenshot............................................................................................................... 93
7.2.2 Report Attributes ...................................................................................................... 94 7.2.3 Selection Prompts.................................................................................................... 94
7.3 Days to Deliver (Customer Data)..................................................................................... 95 7.3.1 Screenshot............................................................................................................... 95 7.3.2 Report Attributes ...................................................................................................... 96 7.3.3 Selection Prompts.................................................................................................... 96
7.4 Days to Deliver – Parcel Select (Customer Data) .......................................................... 97 7.4.1 Screenshot............................................................................................................... 97 7.4.2 Report Attributes ...................................................................................................... 97 7.4.3 Selection Prompts.................................................................................................... 97
8.0 GETTING HELP ........................................................................................98
8.1 Help Folder ........................................................................................................................ 98
8.2 Context Sensitive Help Buttons ...................................................................................... 99
8.3 Help Desk......................................................................................................................... 100
USPS PRODUCT PERFORMANCE REPORTS USER GUIDE
Version 1.0 1
1.0 Overview
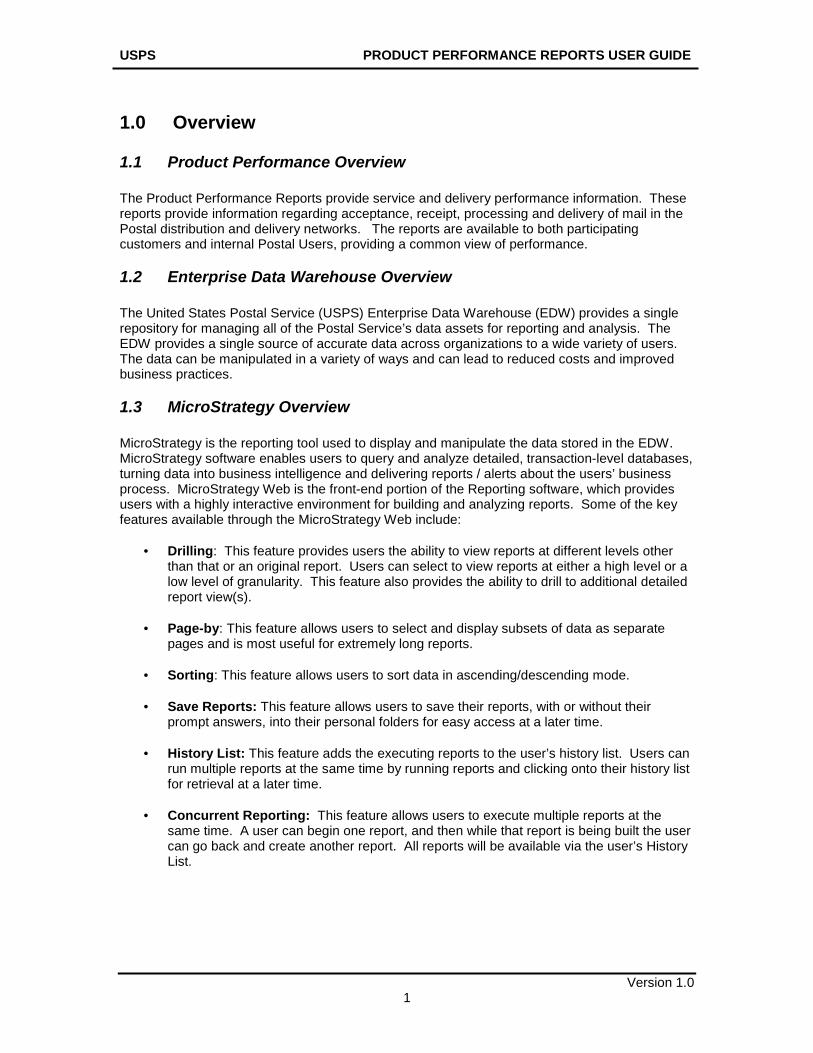
1.1 Product Performance Overview The Product Performance Reports provide service and delivery performance information. These reports provide information regarding acceptance, receipt, processing and delivery of mail in the Postal distribution and delivery networks. The reports are available to both participating customers and internal Postal Users, providing a common view of performance.
1.2 Enterprise Data Warehouse Overview The United States Postal Service (USPS) Enterprise Data Warehouse (EDW) provides a single repository for managing all of the Postal Service’s data assets for reporting and analysis. The EDW provides a single source of accurate data across organizations to a wide variety of users. The data can be manipulated in a variety of ways and can lead to reduced costs and improved business practices.
1.3 MicroStrategy Overview MicroStrategy is the reporting tool used to display and manipulate the data stored in the EDW. MicroStrategy software enables users to query and analyze detailed, transaction-level databases, turning data into business intelligence and delivering reports / alerts about the users’ business process. MicroStrategy Web is the front-end portion of the Reporting software, which provides users with a highly interactive environment for building and analyzing reports. Some of the key features available through the MicroStrategy Web include:
• Drilling: This feature provides users the ability to view reports at different levels other than that or an original report. Users can select to view reports at either a high level or a low level of granularity. This feature also provides the ability to drill to additional detailed report view(s).
• Page-by: This feature allows users to select and display subsets of data as separate
pages and is most useful for extremely long reports.
• Sorting: This feature allows users to sort data in ascending/descending mode. • Save Reports: This feature allows users to save their reports, with or without their
prompt answers, into their personal folders for easy access at a later time. • History List: This feature adds the executing reports to the user’s history list. Users can
run multiple reports at the same time by running reports and clicking onto their history list for retrieval at a later time.
• Concurrent Reporting: This feature allows users to execute multiple reports at the
same time. A user can begin one report, and then while that report is being built the user can go back and create another report. All reports will be available via the user’s History List.
USPS PRODUCT PERFORMANCE REPORTS USER GUIDE
Version 1.0 2
2.0 Getting Started
2.1 Obtaining Access through Mail Tracking & Reporting Customers will access Product Performance Reports through the Mail Tracking & Reporting (MT&R) website. Customers will be required to register as a new user on the MT&R website if they do not have a valid username and password.
2.1.1 New Users: Request Access Users: Request Access Online
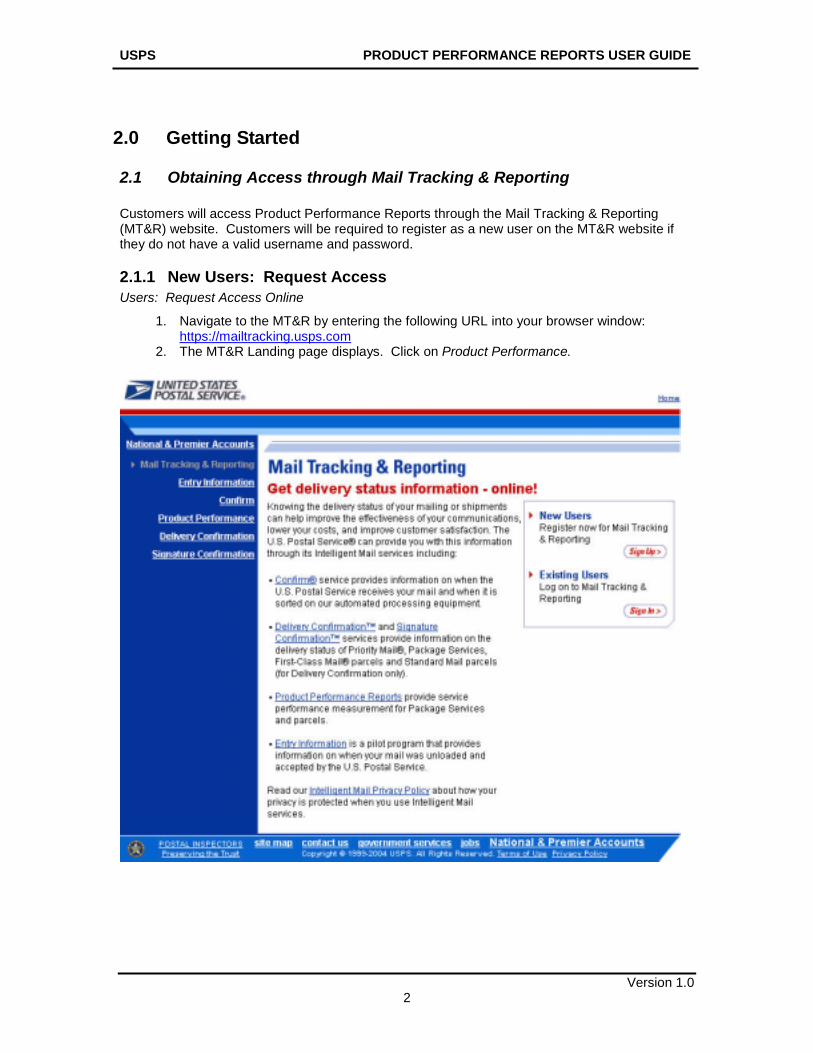
1. Navigate to the MT&R by entering the following URL into your browser window: https://mailtracking.usps.com
2. The MT&R Landing page displays. Click on Product Performance.
USPS PRODUCT PERFORMANCE REPORTS USER GUIDE
Version 1.0 3
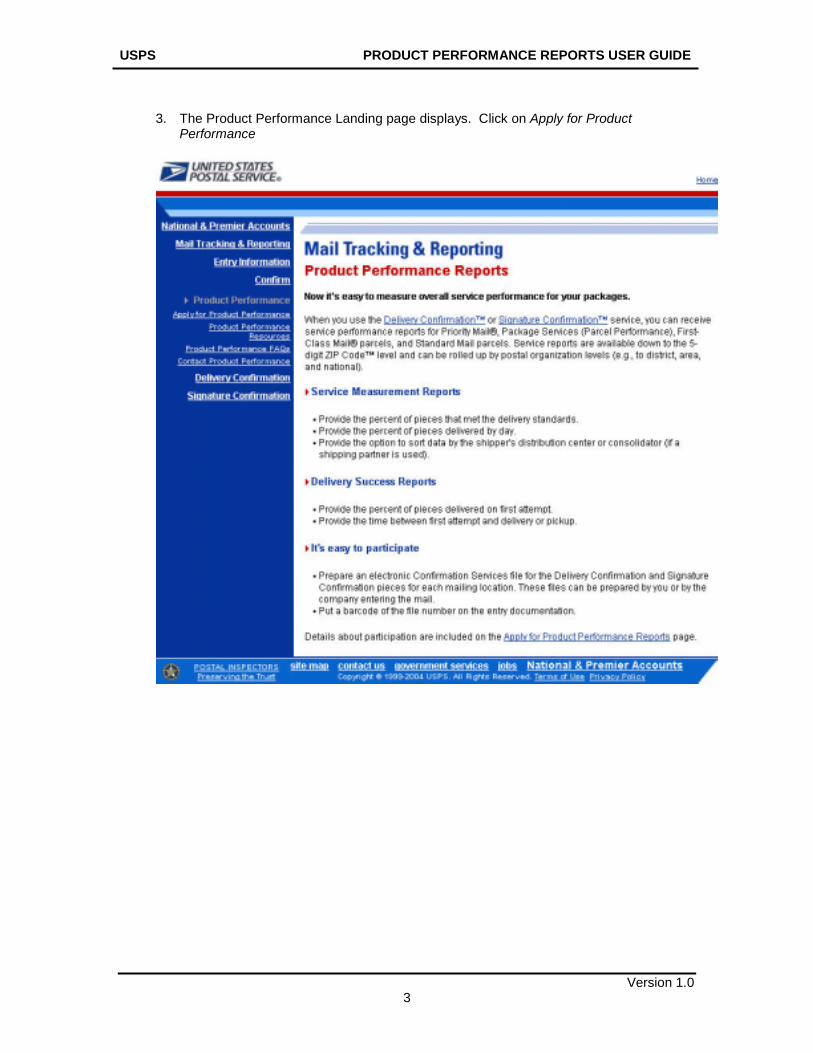
3. The Product Performance Landing page displays. Click on Apply for Product
Performance
USPS PRODUCT PERFORMANCE REPORTS USER GUIDE
Version 1.0 4
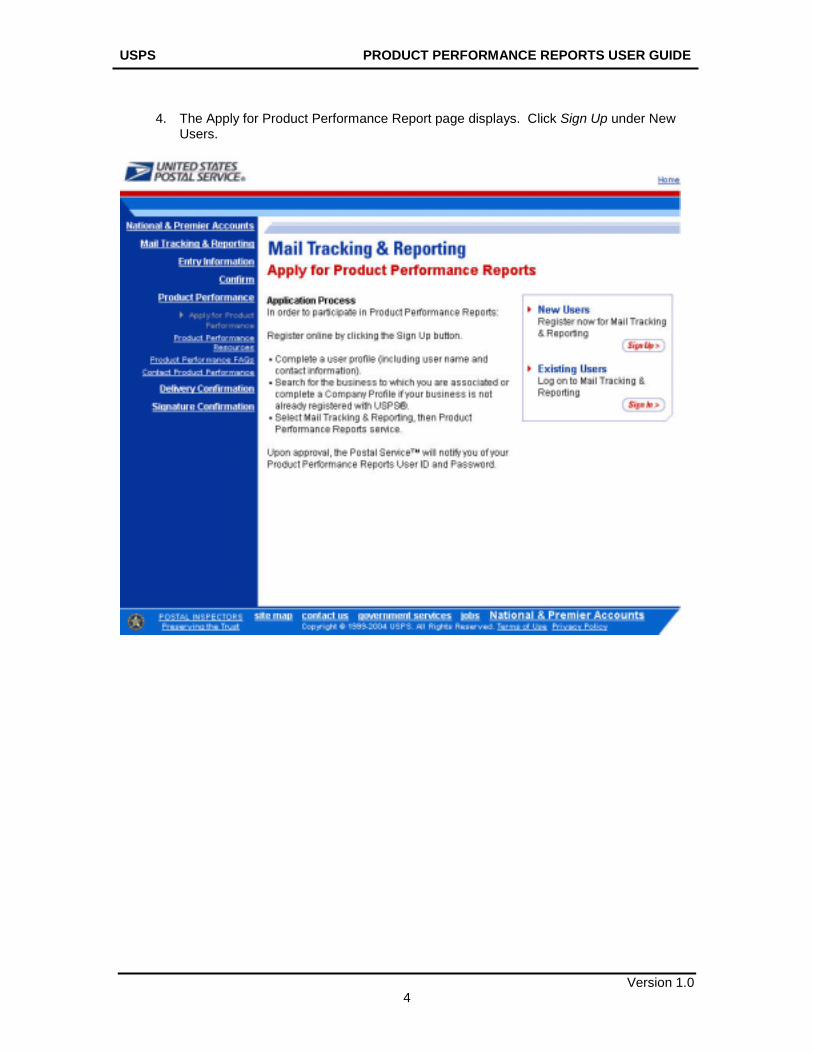
4. The Apply for Product Performance Report page displays. Click Sign Up under New
Users.
USPS PRODUCT PERFORMANCE REPORTS USER GUIDE
Version 1.0 5
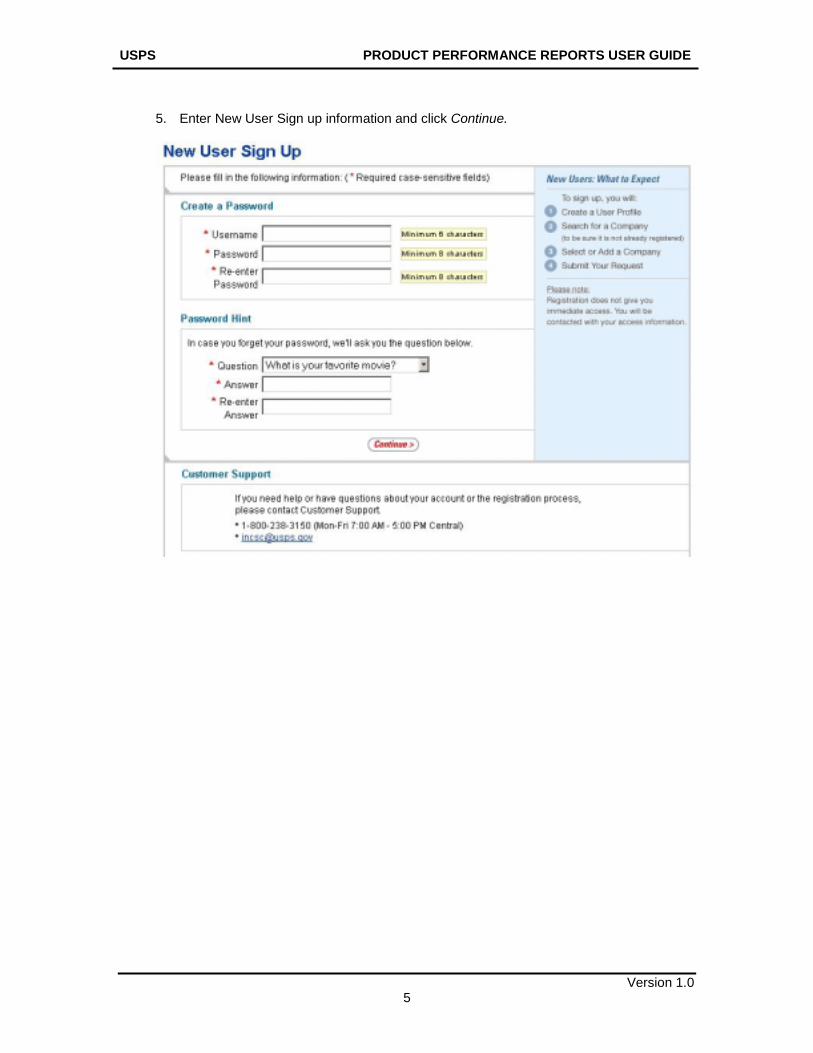
5. Enter New User Sign up information and click Continue.
USPS PRODUCT PERFORMANCE REPORTS USER GUIDE
Version 1.0 6
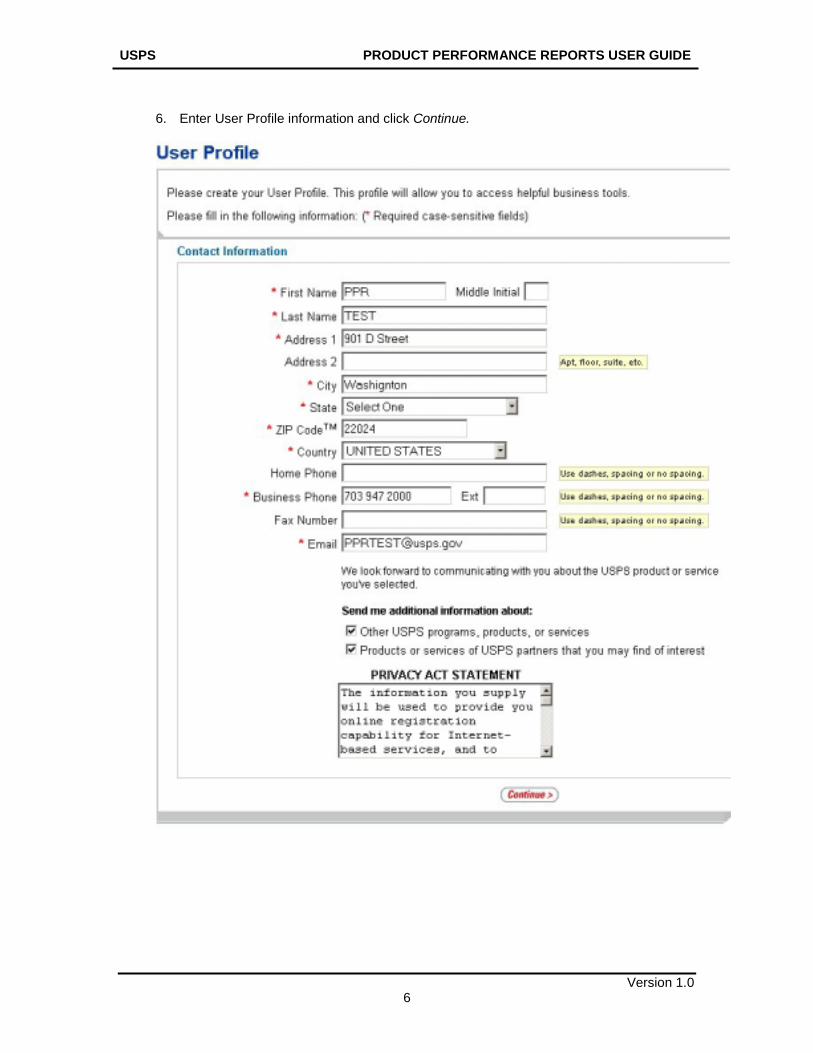
6. Enter User Profile information and click Continue.
USPS PRODUCT PERFORMANCE REPORTS USER GUIDE
Version 1.0 7
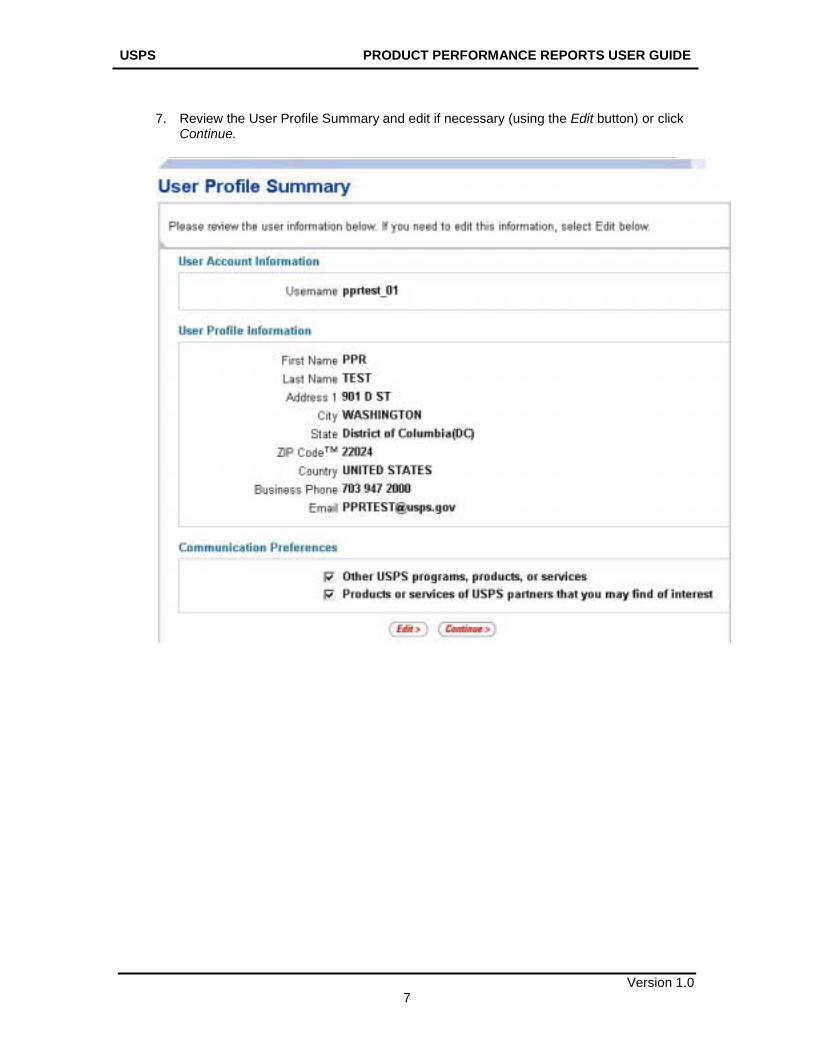
7. Review the User Profile Summary and edit if necessary (using the Edit button) or click
Continue.
USPS PRODUCT PERFORMANCE REPORTS USER GUIDE
Version 1.0 8
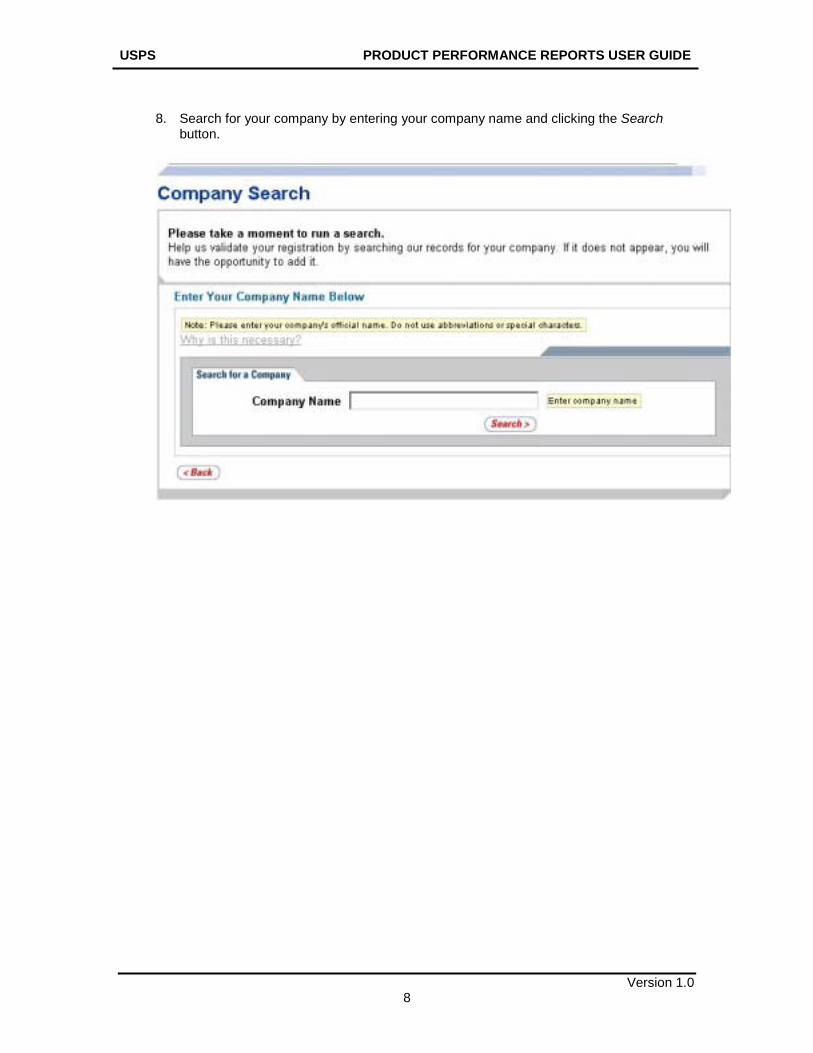
8. Search for your company by entering your company name and clicking the Search
button.
USPS PRODUCT PERFORMANCE REPORTS USER GUIDE
Version 1.0 9
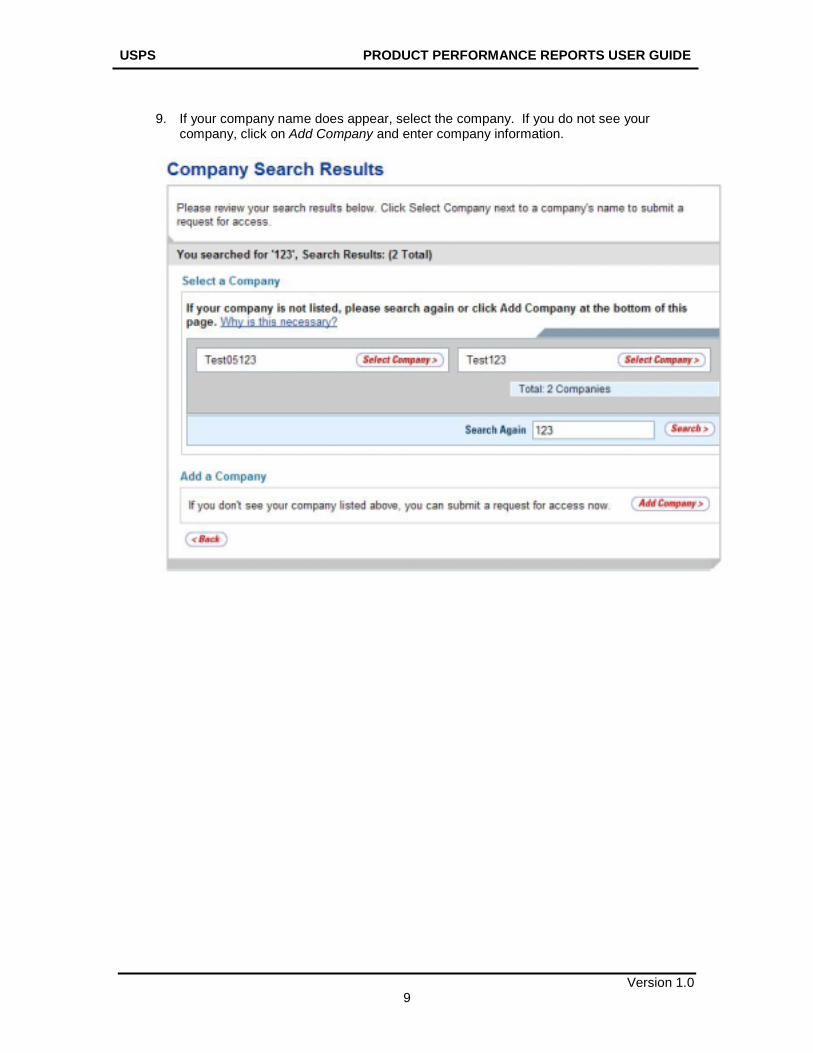
9. If your company name does appear, select the company. If you do not see your
company, click on Add Company and enter company information.
USPS PRODUCT PERFORMANCE REPORTS USER GUIDE
Version 1.0 10
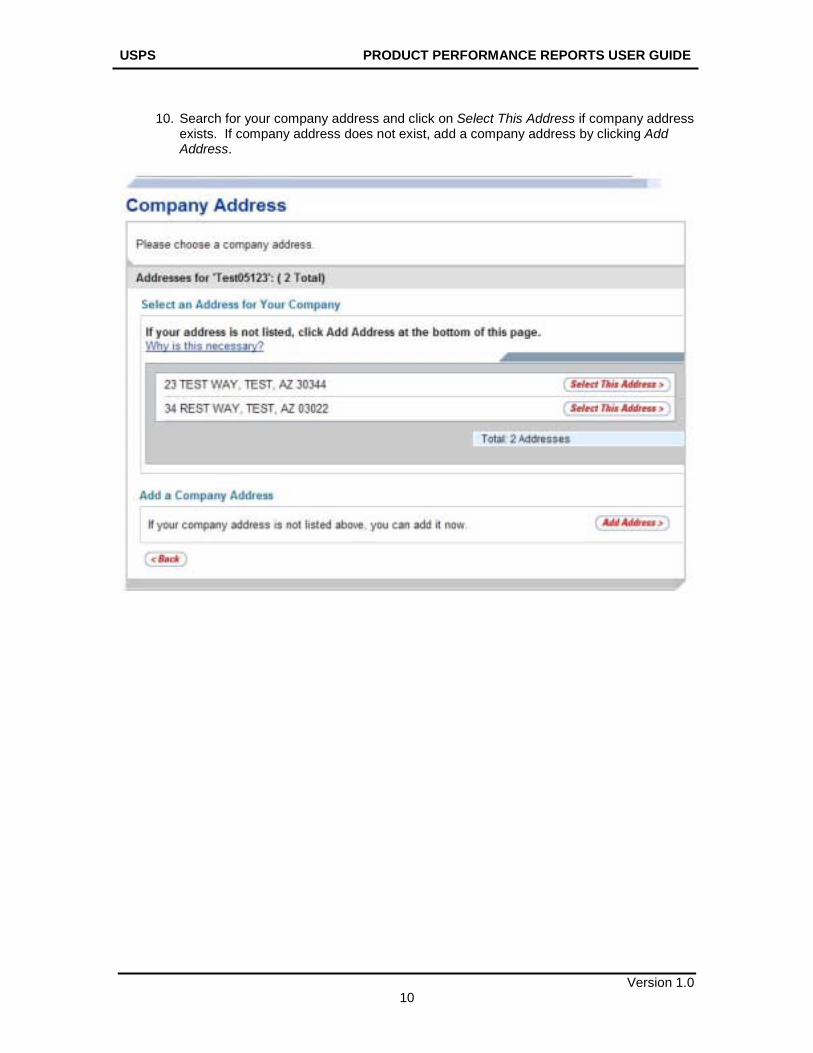
10. Search for your company address and click on Select This Address if company address
exists. If company address does not exist, add a company address by clicking Add Address.
USPS PRODUCT PERFORMANCE REPORTS USER GUIDE
Version 1.0 11
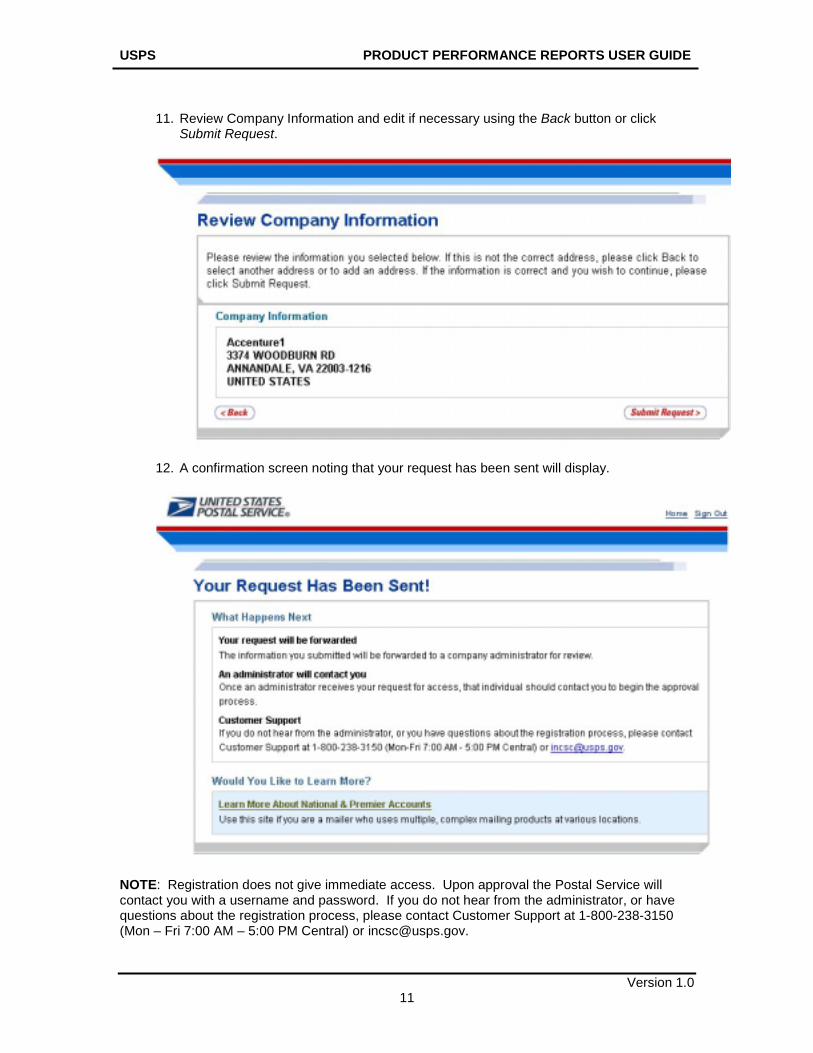
11. Review Company Information and edit if necessary using the Back button or click
Submit Request.
12. A confirmation screen noting that your request has been sent will display.
NOTE: Registration does not give immediate access. Upon approval the Postal Service will contact you with a username and password. If you do not hear from the administrator, or have questions about the registration process, please contact Customer Support at 1-800-238-3150 (Mon – Fri 7:00 AM – 5:00 PM Central) or [email protected].
USPS PRODUCT PERFORMANCE REPORTS USER GUIDE
Version 1.0 12
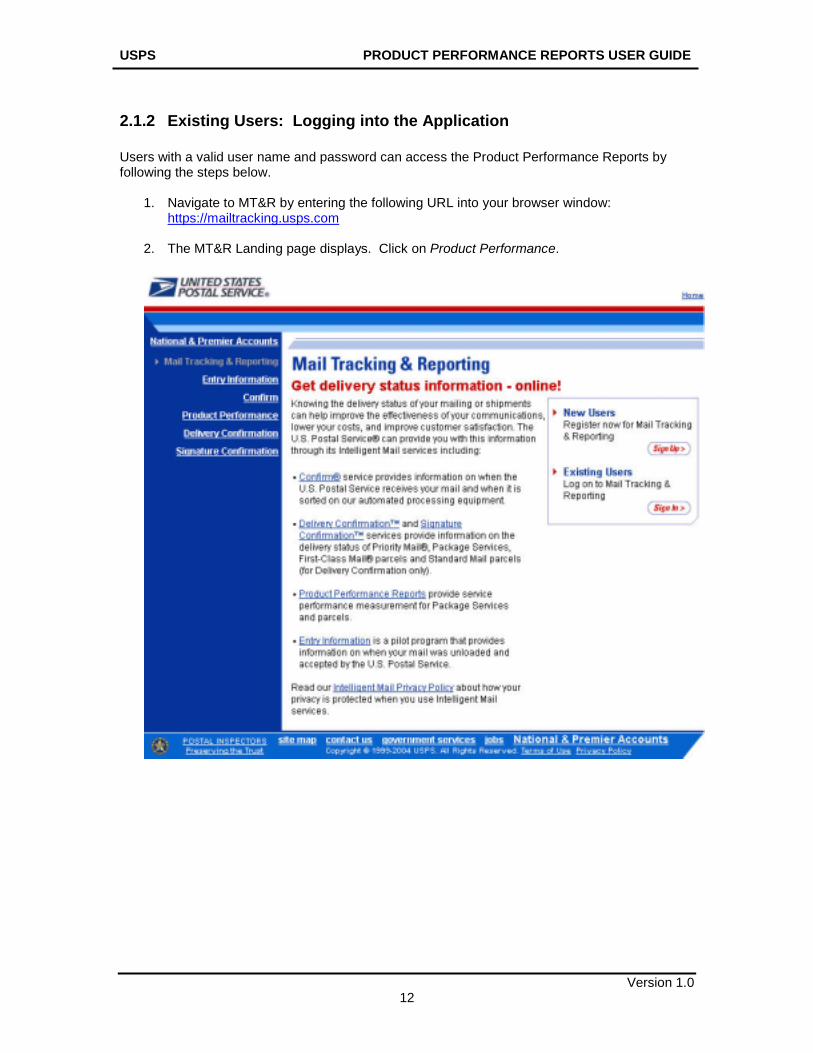
2.1.2 Existing Users: Logging into the Application Users with a valid user name and password can access the Product Performance Reports by following the steps below.
1. Navigate to MT&R by entering the following URL into your browser window: https://mailtracking.usps.com
2. The MT&R Landing page displays. Click on Product Performance.
USPS PRODUCT PERFORMANCE REPORTS USER GUIDE
Version 1.0 13
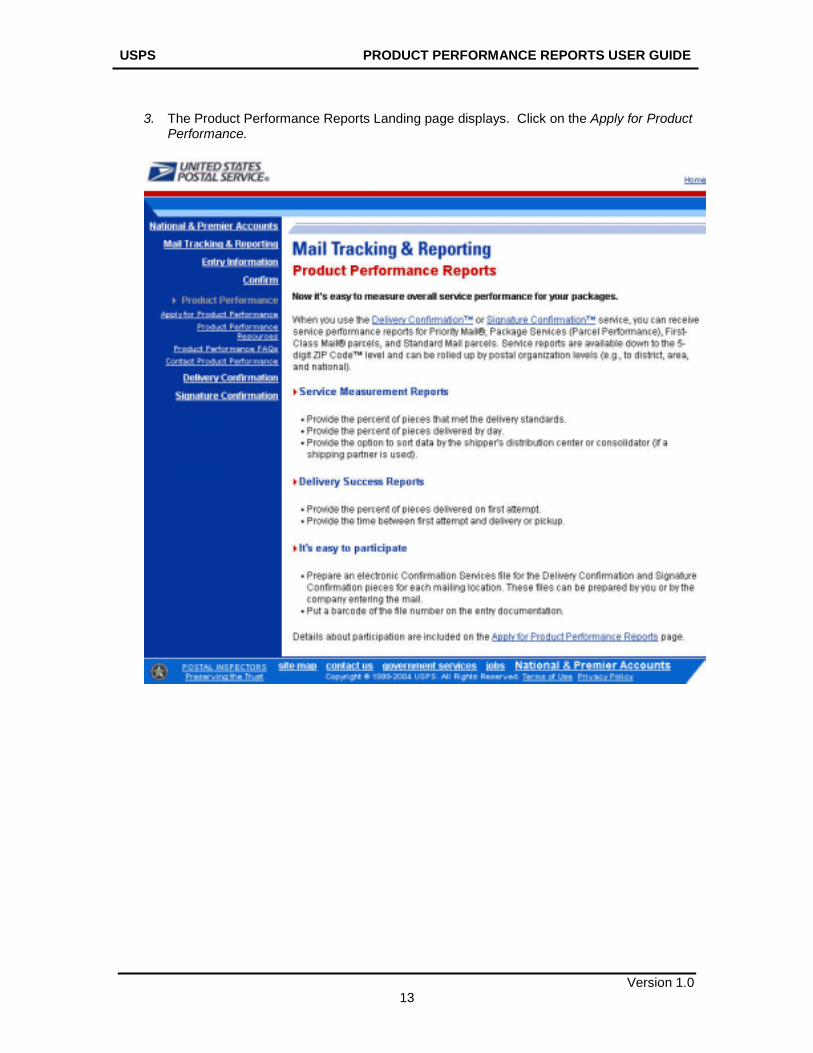
3. The Product Performance Reports Landing page displays. Click on the Apply for Product
Performance.
USPS PRODUCT PERFORMANCE REPORTS USER GUIDE
Version 1.0 14
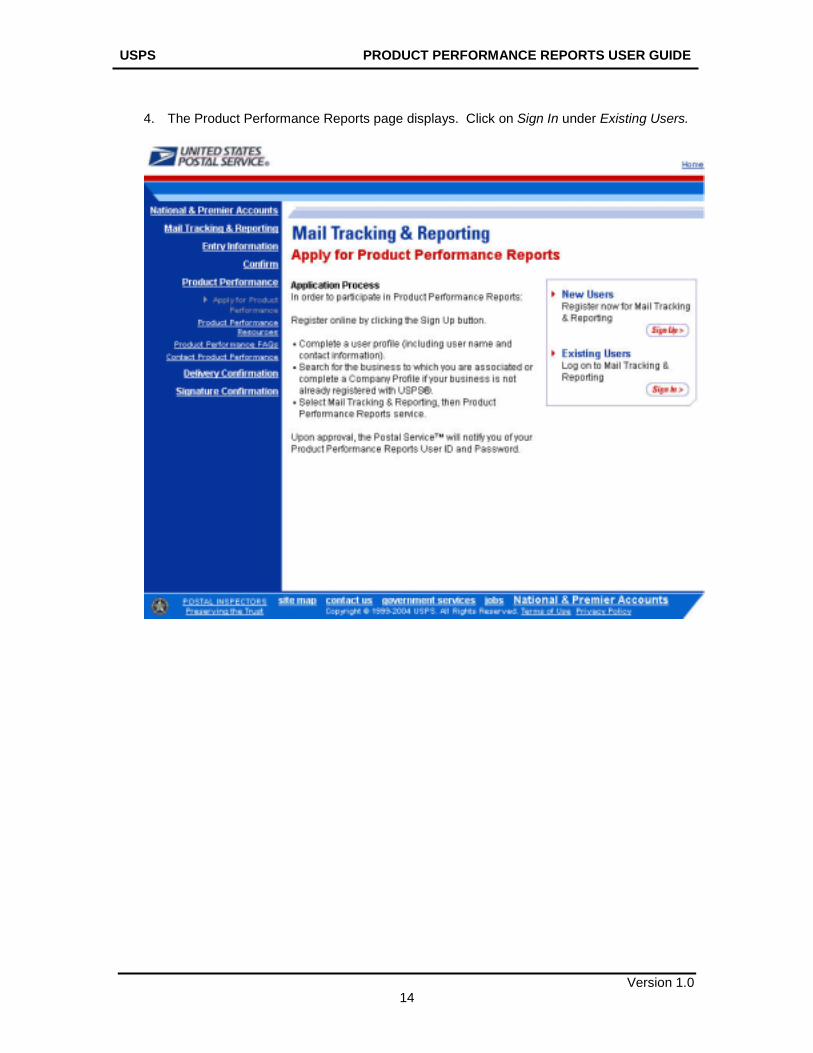
4. The Product Performance Reports page displays. Click on Sign In under Existing Users.
USPS PRODUCT PERFORMANCE REPORTS USER GUIDE
Version 1.0 15
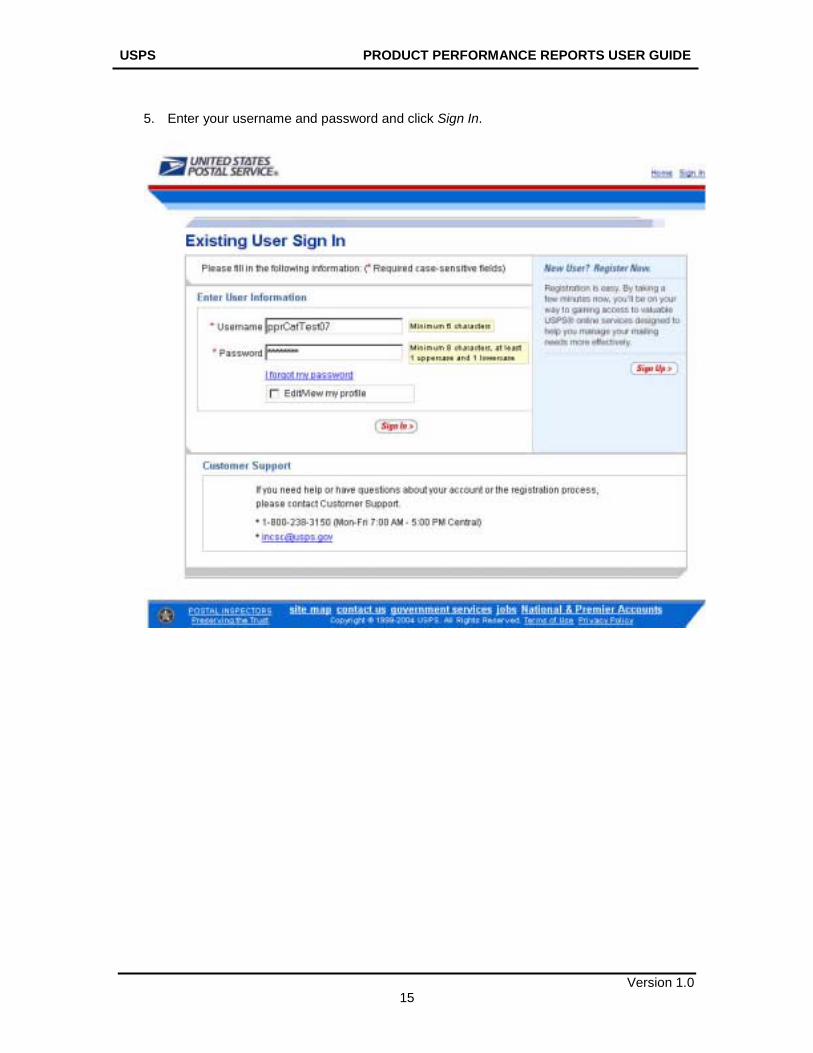
5. Enter your username and password and click Sign In.
USPS PRODUCT PERFORMANCE REPORTS USER GUIDE
Version 1.0 16
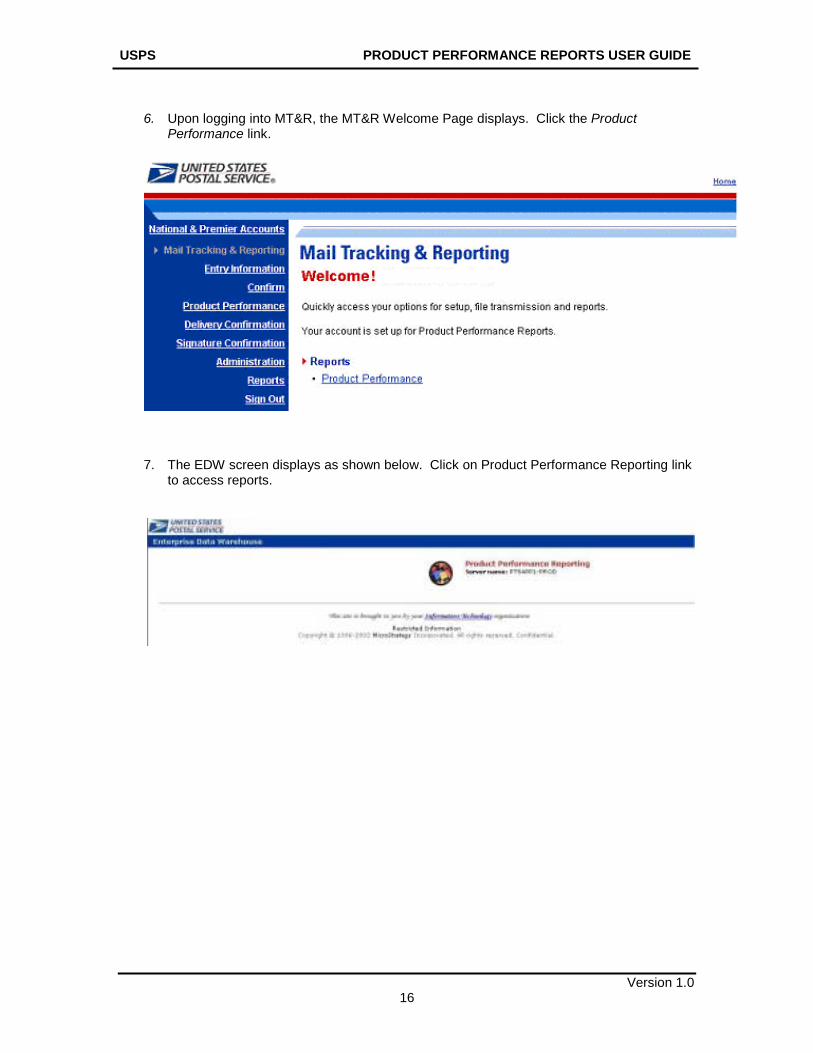
6. Upon logging into MT&R, the MT&R Welcome Page displays. Click the Product
Performance link.
7. The EDW screen displays as shown below. Click on Product Performance Reporting link
to access reports.
USPS PRODUCT PERFORMANCE REPORTS USER GUIDE
Version 1.0 17
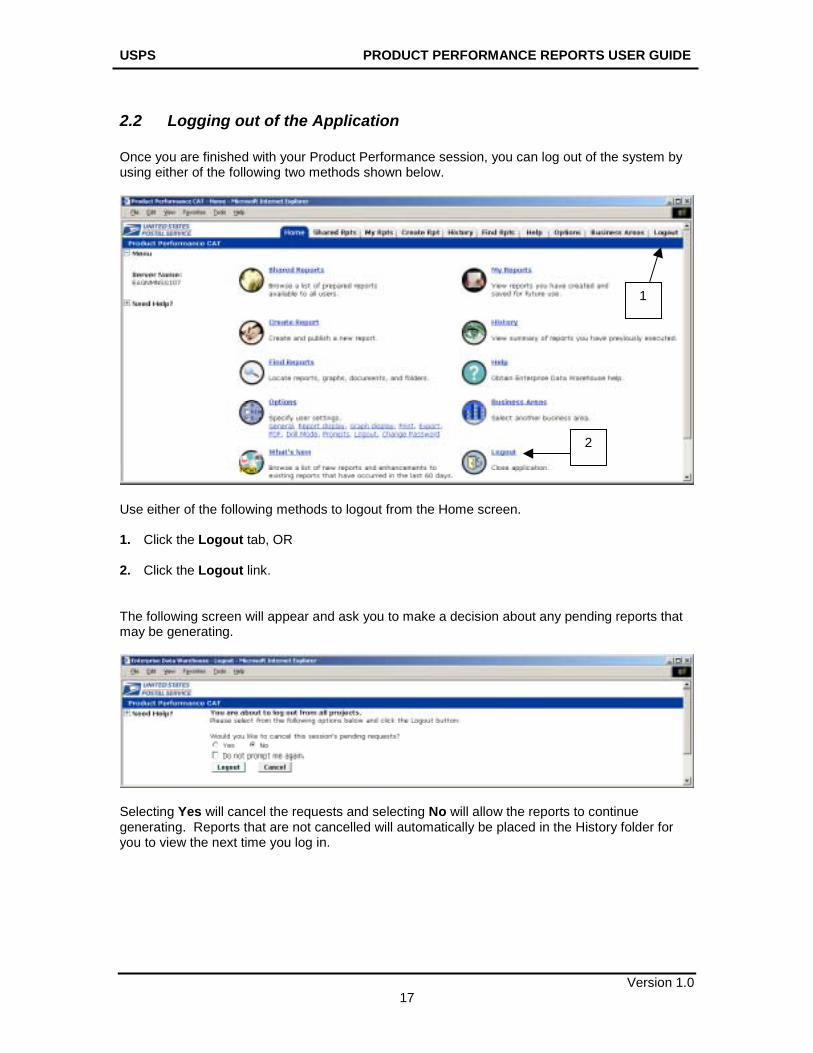
2.2 Logging out of the Application Once you are finished with your Product Performance session, you can log out of the system by using either of the following two methods shown below.
Use either of the following methods to logout from the Home screen. 1. Click the Logout tab, OR 2. Click the Logout link. The following screen will appear and ask you to make a decision about any pending reports that may be generating.
Selecting Yes will cancel the requests and selecting No will allow the reports to continue generating. Reports that are not cancelled will automatically be placed in the History folder for you to view the next time you log in.
1
2
USPS PRODUCT PERFORMANCE REPORTS USER GUIDE
Version 1.0 18
3.0 Reviewing System Folders
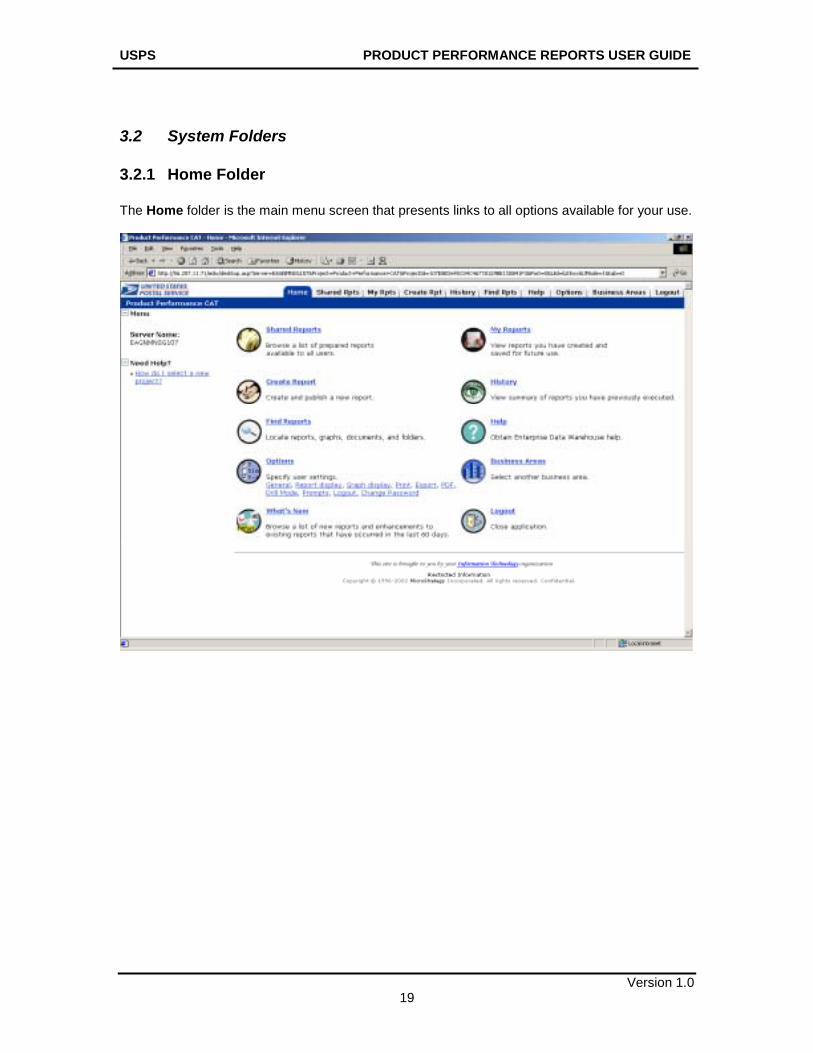
3.1 Product Performance System Overview After you access the Product Performance Business Area, the Home screen displays a variety of folders that you can access. The available folder options are:
• Shared Reports • My Reports • History • Find Reports • Help • Options • Business Areas • What’s New • Logout
All of these options can be accessed by clicking on the corresponding links. All (except What’s New) can also be accessed by the tabs at the top of the screen.
USPS PRODUCT PERFORMANCE REPORTS USER GUIDE
Version 1.0 19
3.2 System Folders
3.2.1 Home Folder The Home folder is the main menu screen that presents links to all options available for your use.
USPS PRODUCT PERFORMANCE REPORTS USER GUIDE
Version 1.0 20
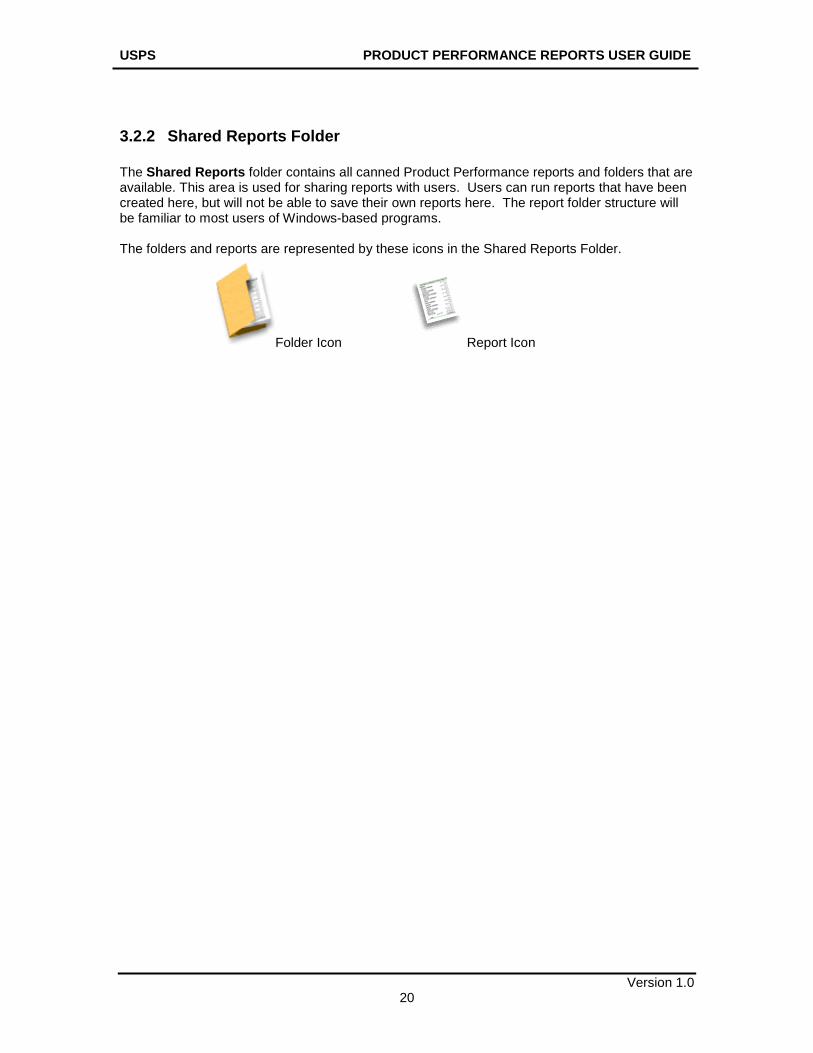
3.2.2 Shared Reports Folder The Shared Reports folder contains all canned Product Performance reports and folders that are available. This area is used for sharing reports with users. Users can run reports that have been created here, but will not be able to save their own reports here. The report folder structure will be familiar to most users of Windows-based programs. The folders and reports are represented by these icons in the Shared Reports Folder.
Folder Icon Report Icon
USPS PRODUCT PERFORMANCE REPORTS USER GUIDE
Version 1.0 21
3.2.3 Shared Reports Descriptions The following reports are available under the Shared Reports tab:
• Delivery Success (Customer Data) – This report provides information on how many days passed between the first attempted delivery of a mailpiece and when it was picked up.
• Cumulative Delivery Success (Customer Data) – The cumulative version of this report
includes attributes similar to the Delivery Success report, except that the data in each day’s column includes the pieces redelivered/picked up in the previous day.
• Days to Deliver (Customer Data) – This report provides service information from
originating locations by on time percentage and percentage delivered by day. This report provides details on volume, volume within standard and volume delivery from day one through 8 or more days.
• Cumulative Days to Deliver (Customer Data) – The cumulative version of this report
contains attributes similar to the Days to Deliver (Customer Data) except that the data in each day’s column includes the pieces delivered in the previous days.
• Days to Deliver – Parcel Select (Customer Data) – This report provides service
information from originating Bulk Mail Centers to Destination Delivery Units by on time percentage and percentage delivered by day.
• Cumulative Days to Deliver – Parcel Select (Customer Data) - The cumulative version of
this report contains attributes similar to the Days to Deliver – Parcel Select (Customer Data) report except that the data in each days’ column includes the pieces delivered in the previous day.
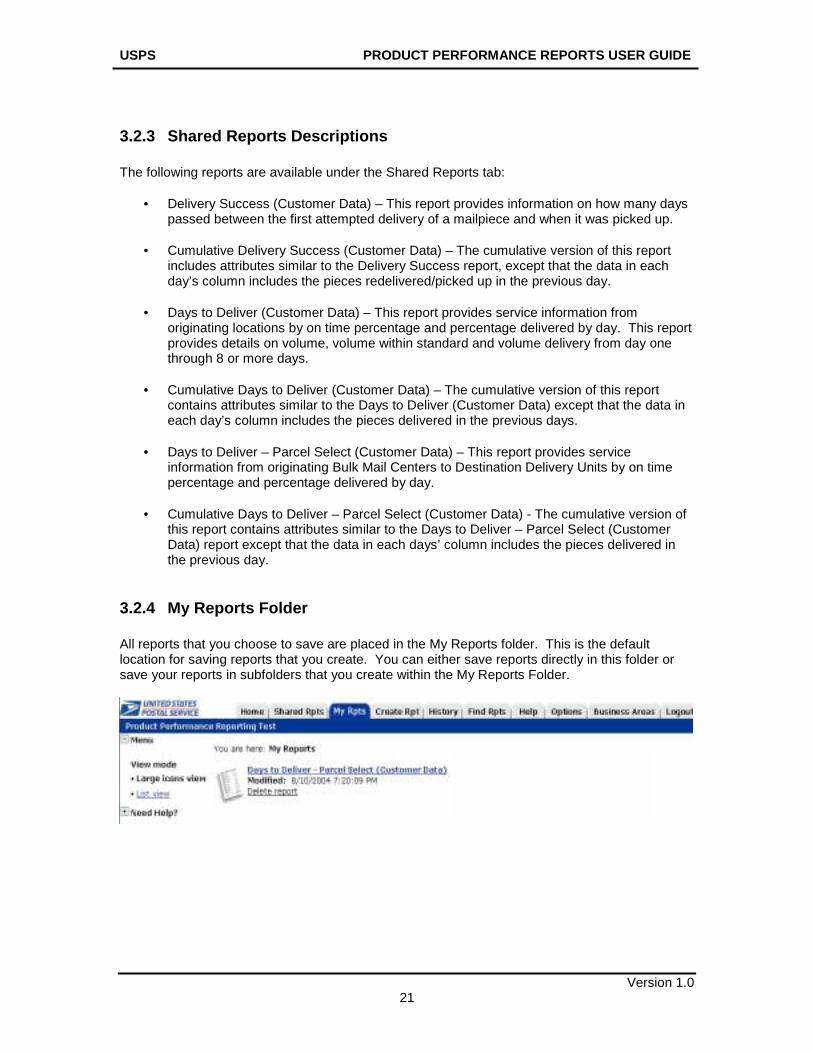
3.2.4 My Reports Folder All reports that you choose to save are placed in the My Reports folder. This is the default location for saving reports that you create. You can either save reports directly in this folder or save your reports in subfolders that you create within the My Reports Folder.
USPS PRODUCT PERFORMANCE REPORTS USER GUIDE
Version 1.0 22
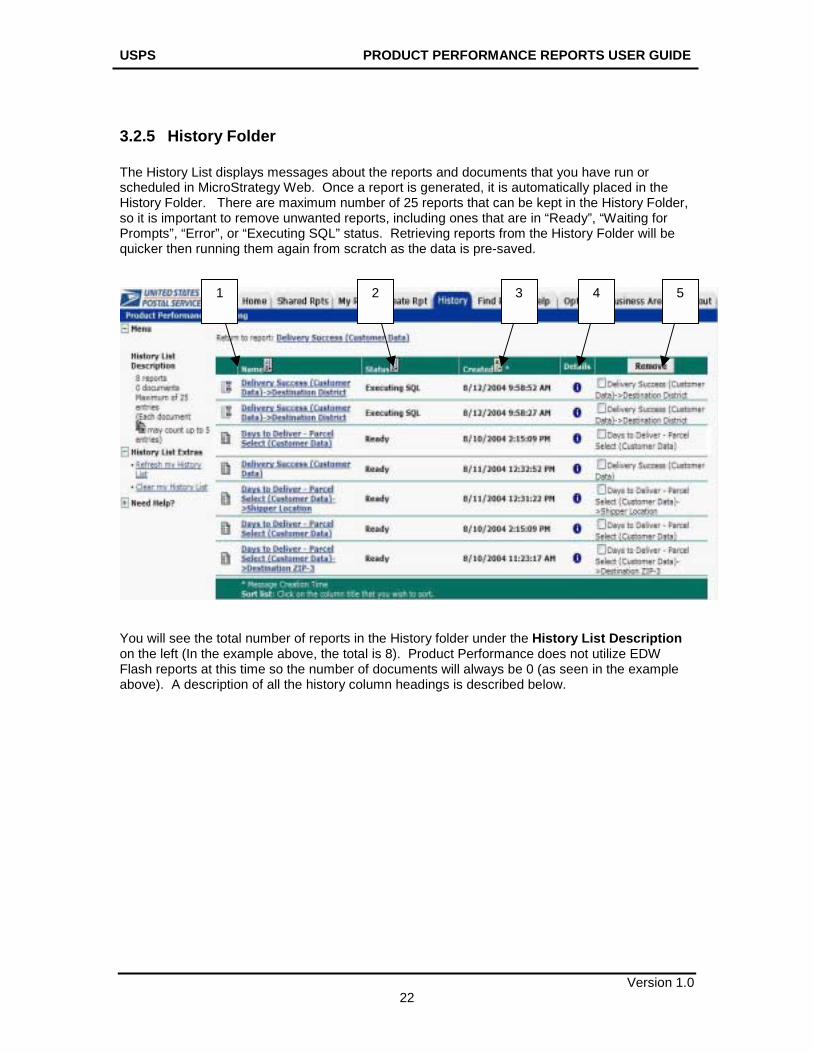
3.2.5 History Folder The History List displays messages about the reports and documents that you have run or scheduled in MicroStrategy Web. Once a report is generated, it is automatically placed in the History Folder. There are maximum number of 25 reports that can be kept in the History Folder, so it is important to remove unwanted reports, including ones that are in “Ready”, “Waiting for Prompts”, “Error”, or “Executing SQL” status. Retrieving reports from the History Folder will be quicker then running them again from scratch as the data is pre-saved.
You will see the total number of reports in the History folder under the History List Description on the left (In the example above, the total is 8). Product Performance does not utilize EDW Flash reports at this time so the number of documents will always be 0 (as seen in the example above). A description of all the history column headings is described below.
1 2 3 4 5
USPS PRODUCT PERFORMANCE REPORTS USER GUIDE
Version 1.0 23
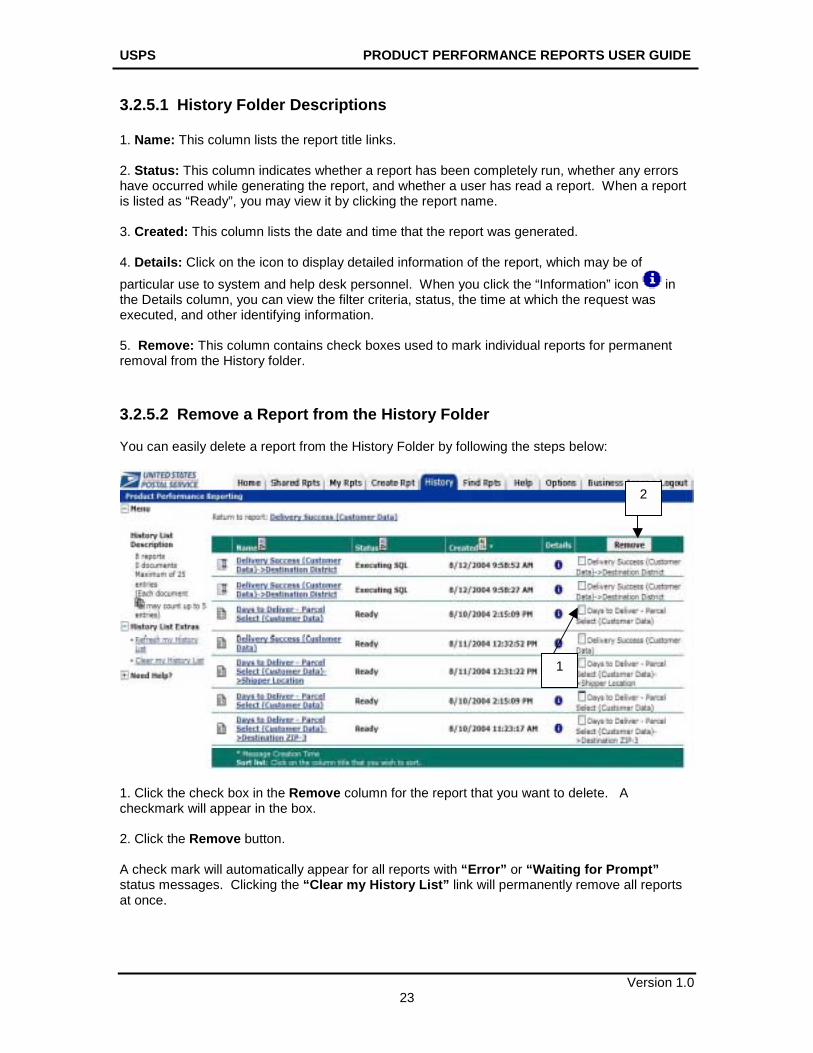
3.2.5.1 History Folder Descriptions 1. Name: This column lists the report title links. 2. Status: This column indicates whether a report has been completely run, whether any errors have occurred while generating the report, and whether a user has read a report. When a report is listed as “Ready”, you may view it by clicking the report name. 3. Created: This column lists the date and time that the report was generated. 4. Details: Click on the icon to display detailed information of the report, which may be of particular use to system and help desk personnel. When you click the “Information” icon in the Details column, you can view the filter criteria, status, the time at which the request was executed, and other identifying information. 5. Remove: This column contains check boxes used to mark individual reports for permanent removal from the History folder. 3.2.5.2 Remove a Report from the History Folder You can easily delete a report from the History Folder by following the steps below:
1. Click the check box in the Remove column for the report that you want to delete. A checkmark will appear in the box. 2. Click the Remove button. A check mark will automatically appear for all reports with “Error” or “Waiting for Prompt” status messages. Clicking the “Clear my History List” link will permanently remove all reports at once.
1
2
USPS PRODUCT PERFORMANCE REPORTS USER GUIDE
Version 1.0 24
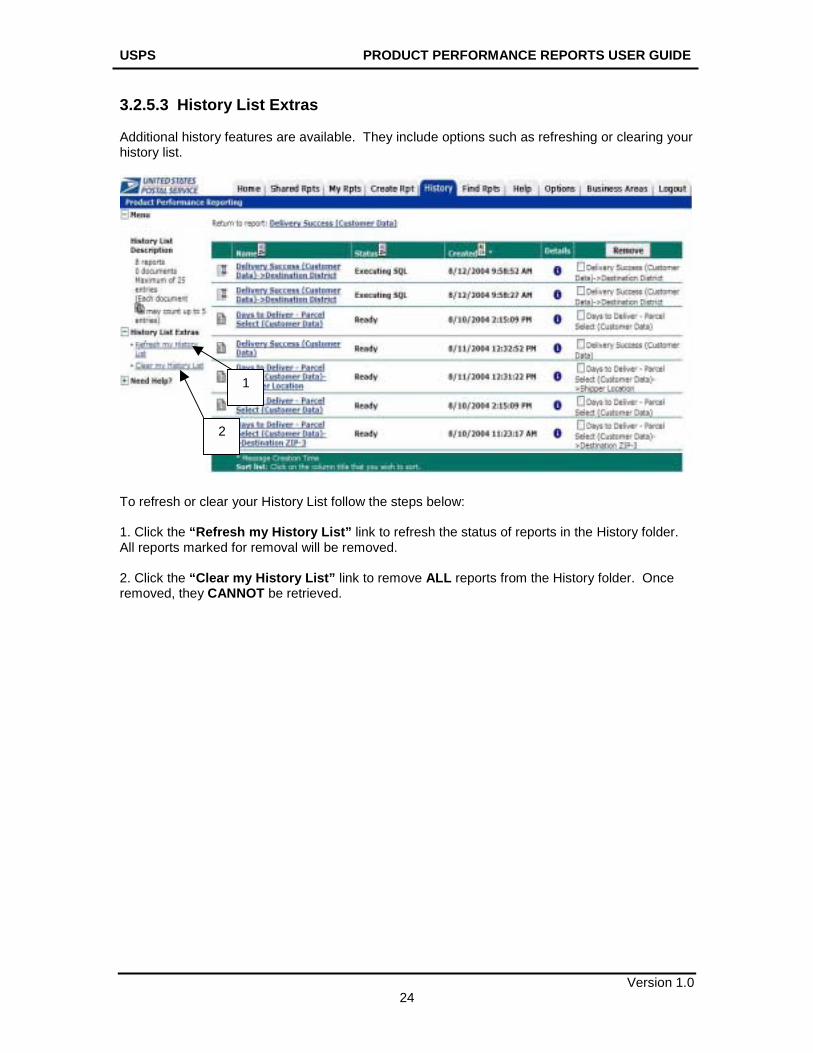
3.2.5.3 History List Extras Additional history features are available. They include options such as refreshing or clearing your history list.
To refresh or clear your History List follow the steps below: 1. Click the “Refresh my History List” link to refresh the status of reports in the History folder. All reports marked for removal will be removed. 2. Click the “Clear my History List” link to remove ALL reports from the History folder. Once removed, they CANNOT be retrieved.
1
2
USPS PRODUCT PERFORMANCE REPORTS USER GUIDE
Version 1.0 25
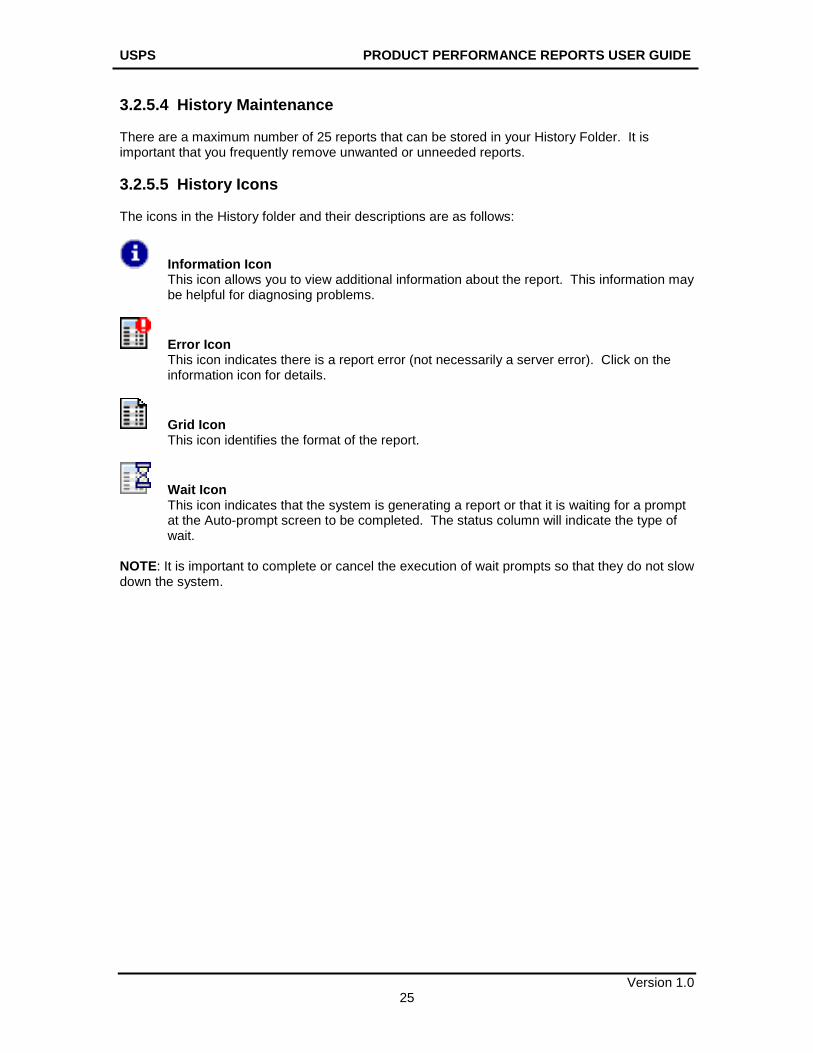
3.2.5.4 History Maintenance There are a maximum number of 25 reports that can be stored in your History Folder. It is important that you frequently remove unwanted or unneeded reports. 3.2.5.5 History Icons The icons in the History folder and their descriptions are as follows:
Information Icon This icon allows you to view additional information about the report. This information may be helpful for diagnosing problems.
Error Icon This icon indicates there is a report error (not necessarily a server error). Click on the information icon for details.
Grid Icon This icon identifies the format of the report.
Wait Icon This icon indicates that the system is generating a report or that it is waiting for a prompt at the Auto-prompt screen to be completed. The status column will indicate the type of wait.
NOTE: It is important to complete or cancel the execution of wait prompts so that they do not slow down the system.
USPS PRODUCT PERFORMANCE REPORTS USER GUIDE
Version 1.0 26
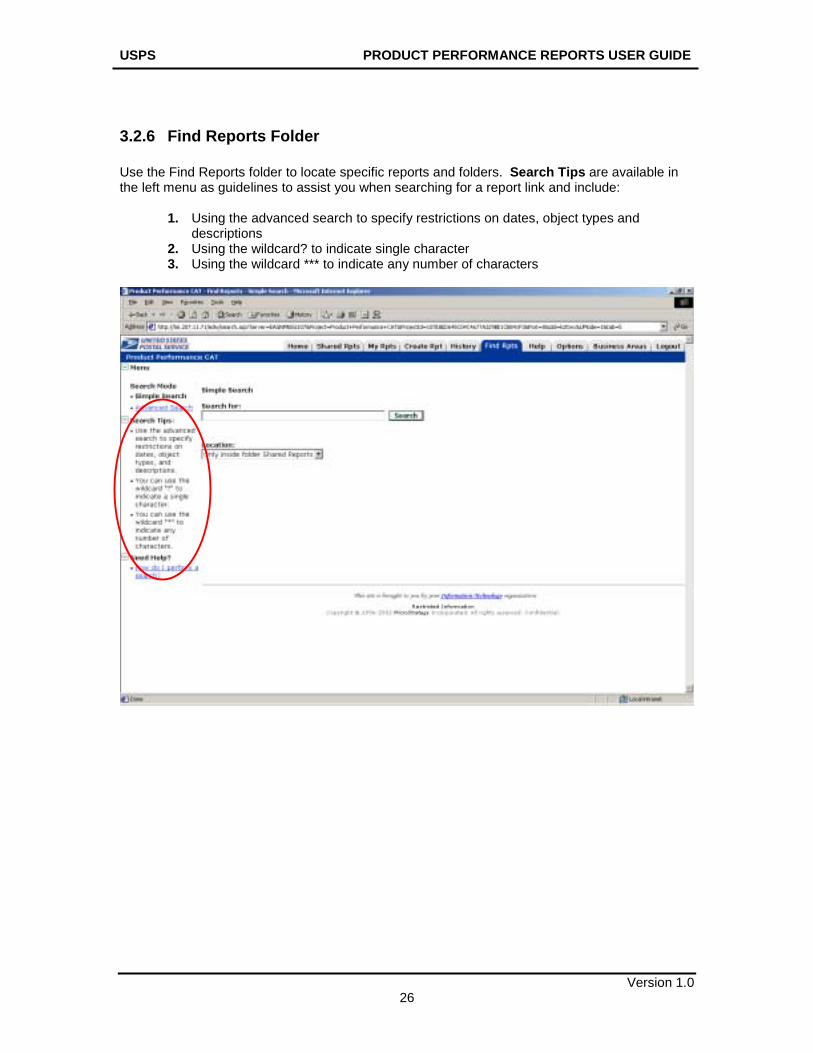
3.2.6 Find Reports Folder Use the Find Reports folder to locate specific reports and folders. Search Tips are available in the left menu as guidelines to assist you when searching for a report link and include:
1. Using the advanced search to specify restrictions on dates, object types and descriptions
2. Using the wildcard? to indicate single character 3. Using the wildcard *** to indicate any number of characters
USPS PRODUCT PERFORMANCE REPORTS USER GUIDE
Version 1.0 27
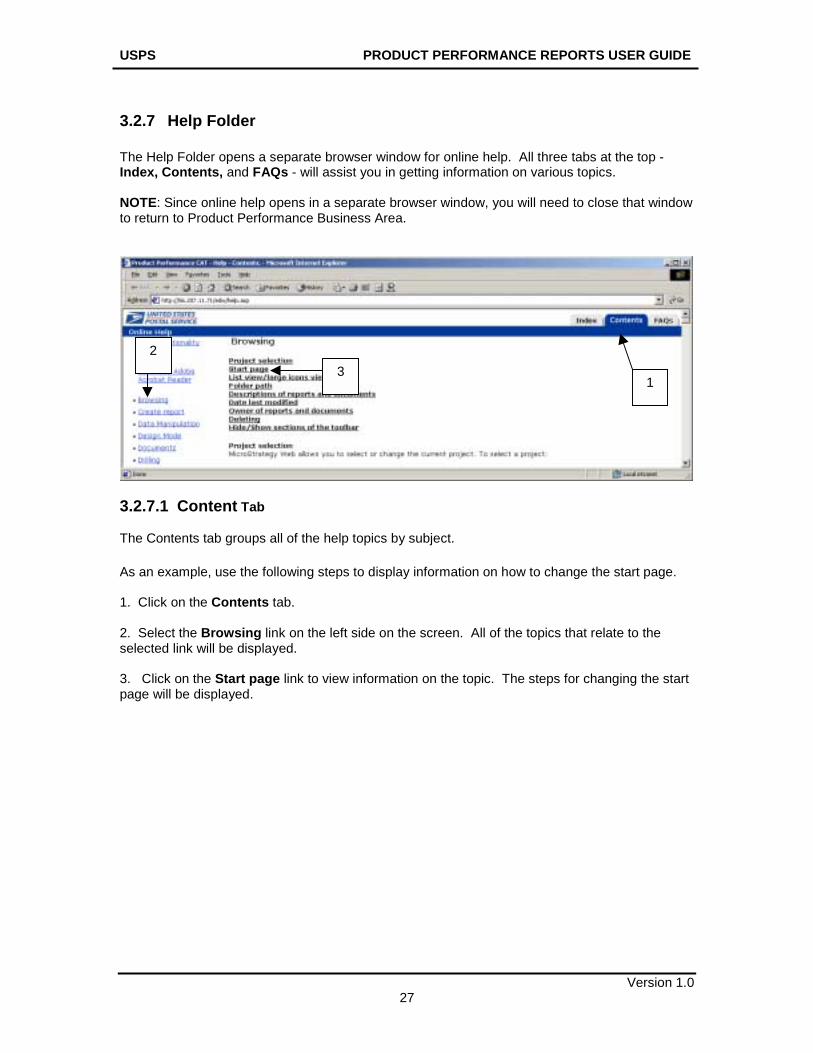
3.2.7 Help Folder The Help Folder opens a separate browser window for online help. All three tabs at the top - Index, Contents, and FAQs - will assist you in getting information on various topics. NOTE: Since online help opens in a separate browser window, you will need to close that window to return to Product Performance Business Area.
3.2.7.1 Content Tab The Contents tab groups all of the help topics by subject. As an example, use the following steps to display information on how to change the start page. 1. Click on the Contents tab. 2. Select the Browsing link on the left side on the screen. All of the topics that relate to the selected link will be displayed. 3. Click on the Start page link to view information on the topic. The steps for changing the start page will be displayed.
1
2 3
USPS PRODUCT PERFORMANCE REPORTS USER GUIDE
Version 1.0 28
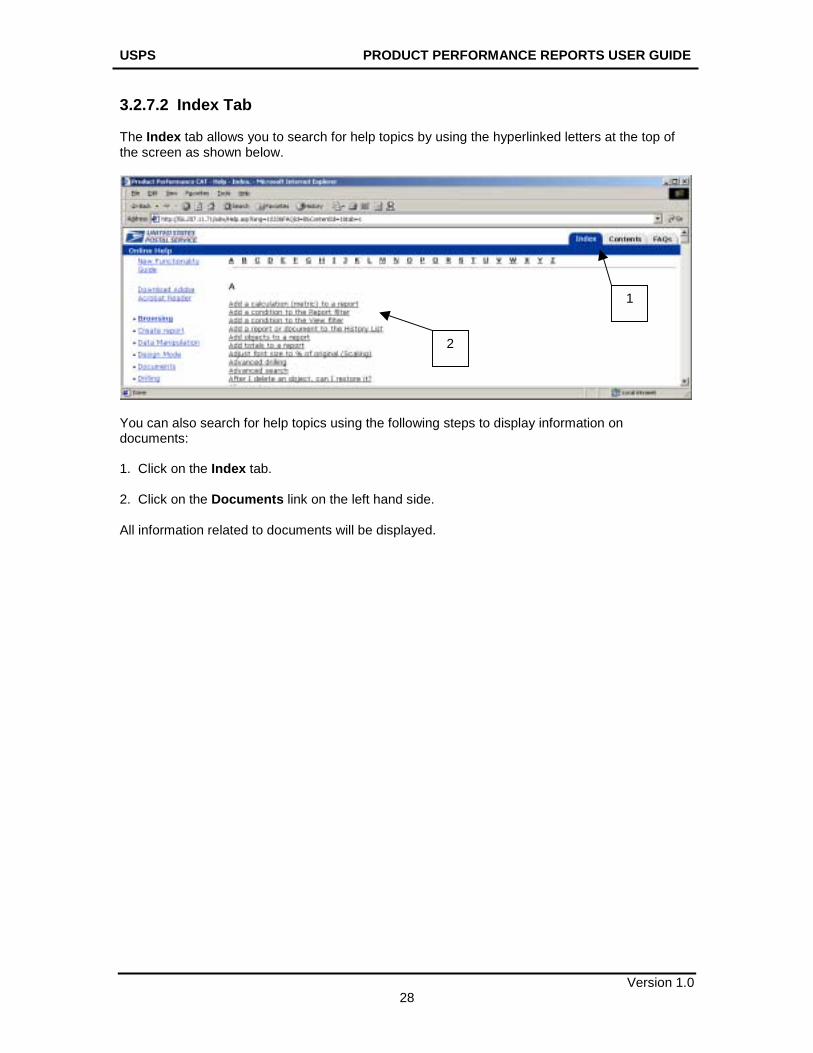
3.2.7.2 Index Tab The Index tab allows you to search for help topics by using the hyperlinked letters at the top of the screen as shown below.
You can also search for help topics using the following steps to display information on documents: 1. Click on the Index tab. 2. Click on the Documents link on the left hand side. All information related to documents will be displayed.
1
2
USPS PRODUCT PERFORMANCE REPORTS USER GUIDE
Version 1.0 29
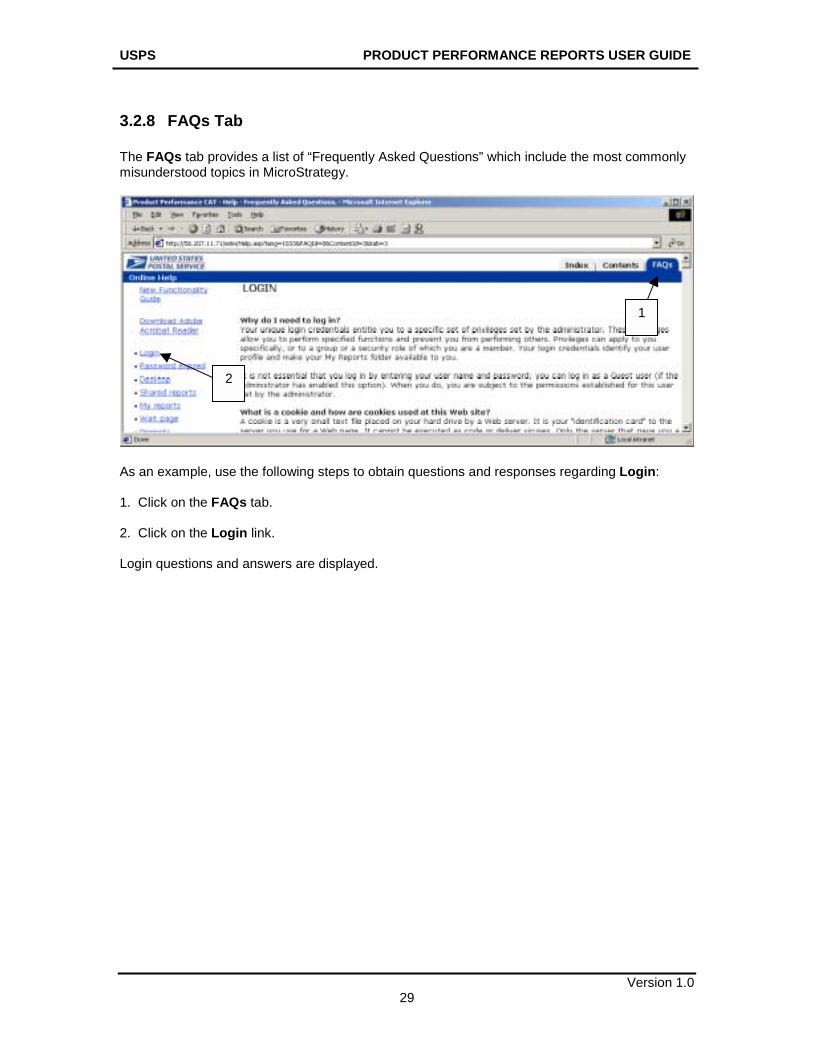
3.2.8 FAQs Tab The FAQs tab provides a list of “Frequently Asked Questions” which include the most commonly misunderstood topics in MicroStrategy.
As an example, use the following steps to obtain questions and responses regarding Login: 1. Click on the FAQs tab. 2. Click on the Login link. Login questions and answers are displayed.
1
2
USPS PRODUCT PERFORMANCE REPORTS USER GUIDE
Version 1.0 30
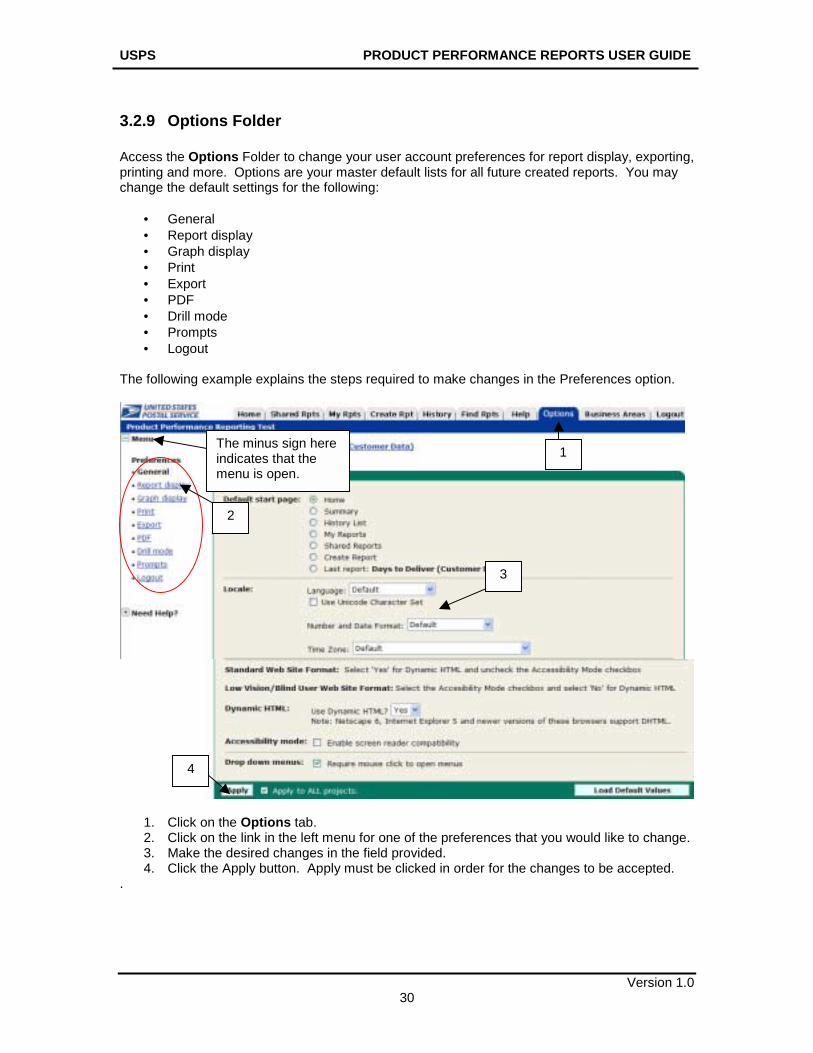
3.2.9 Options Folder Access the Options Folder to change your user account preferences for report display, exporting, printing and more. Options are your master default lists for all future created reports. You may change the default settings for the following:
• General • Report display • Graph display • Print • Export • PDF • Drill mode • Prompts • Logout
The following example explains the steps required to make changes in the Preferences option.
1. Click on the Options tab. 2. Click on the link in the left menu for one of the preferences that you would like to change. 3. Make the desired changes in the field provided. 4. Click the Apply button. Apply must be clicked in order for the changes to be accepted.
.
1The minus sign here indicates that the menu is open.
2
3
4
USPS PRODUCT PERFORMANCE REPORTS USER GUIDE
Version 1.0 31
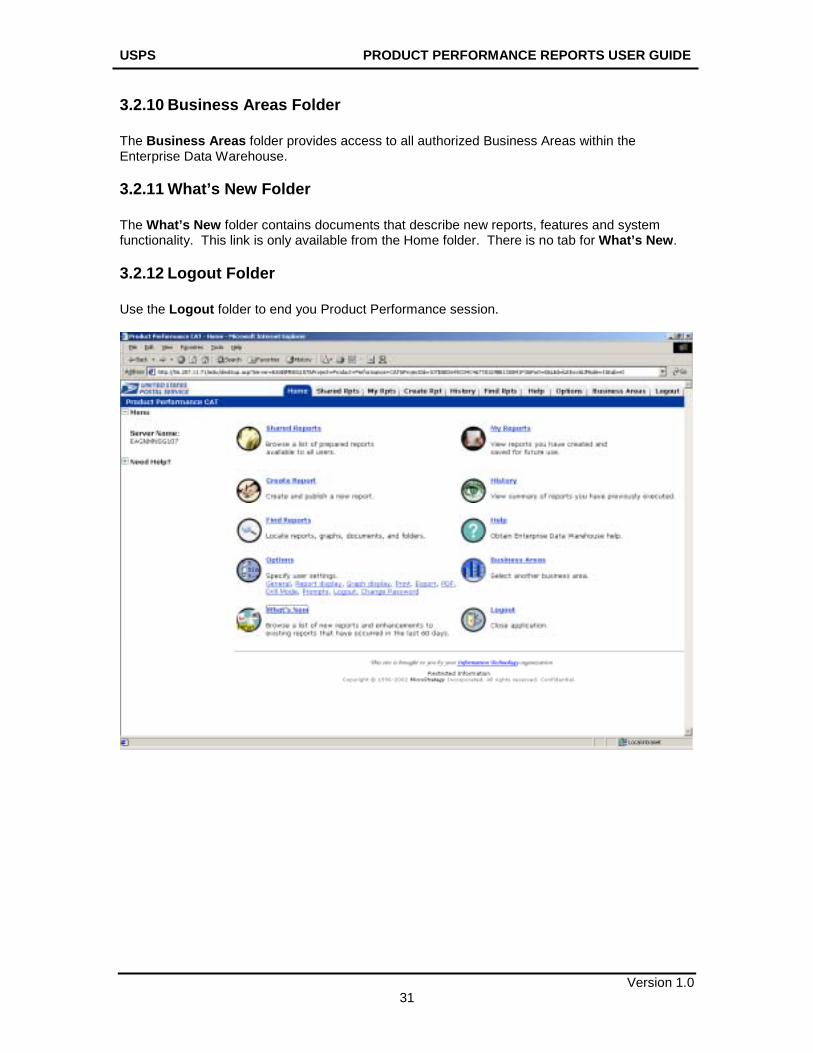
3.2.10 Business Areas Folder The Business Areas folder provides access to all authorized Business Areas within the Enterprise Data Warehouse.
3.2.11 What’s New Folder The What’s New folder contains documents that describe new reports, features and system functionality. This link is only available from the Home folder. There is no tab for What’s New.
3.2.12 Logout Folder Use the Logout folder to end you Product Performance session.
USPS PRODUCT PERFORMANCE REPORTS USER GUIDE
Version 1.0 32
3.3 Changing Preferences
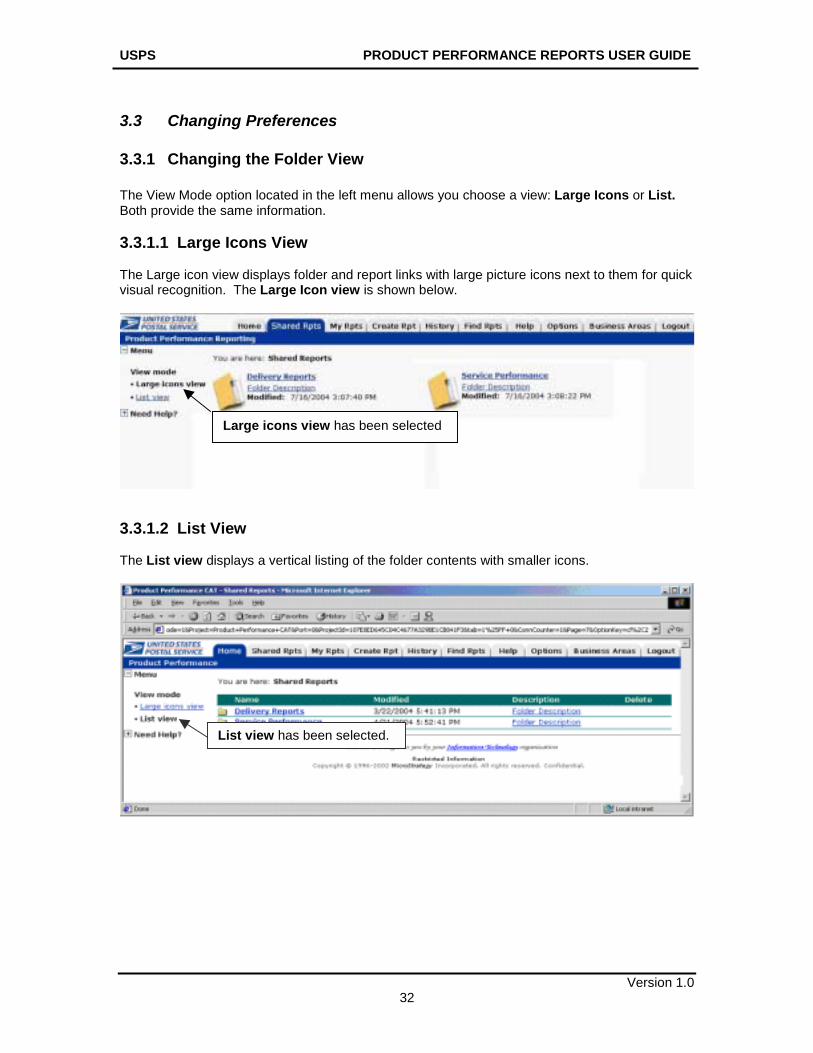
3.3.1 Changing the Folder View The View Mode option located in the left menu allows you choose a view: Large Icons or List. Both provide the same information. 3.3.1.1 Large Icons View The Large icon view displays folder and report links with large picture icons next to them for quick visual recognition. The Large Icon view is shown below.
3.3.1.2 List View The List view displays a vertical listing of the folder contents with smaller icons.
List view has been selected.
Large icons view has been selected
USPS PRODUCT PERFORMANCE REPORTS USER GUIDE
Version 1.0 33
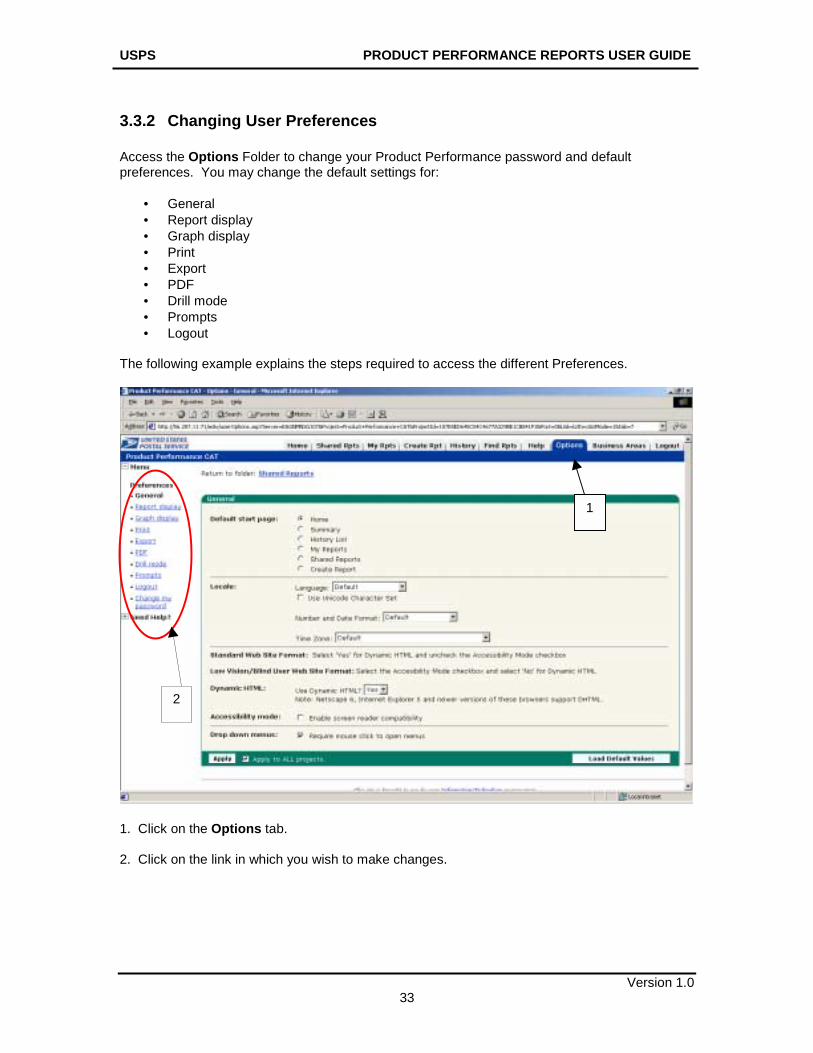
3.3.2 Changing User Preferences Access the Options Folder to change your Product Performance password and default preferences. You may change the default settings for:
• General • Report display • Graph display • Print • Export • PDF • Drill mode • Prompts • Logout
The following example explains the steps required to access the different Preferences.
1. Click on the Options tab. 2. Click on the link in which you wish to make changes.
1
2
USPS PRODUCT PERFORMANCE REPORTS USER GUIDE
Version 1.0 34
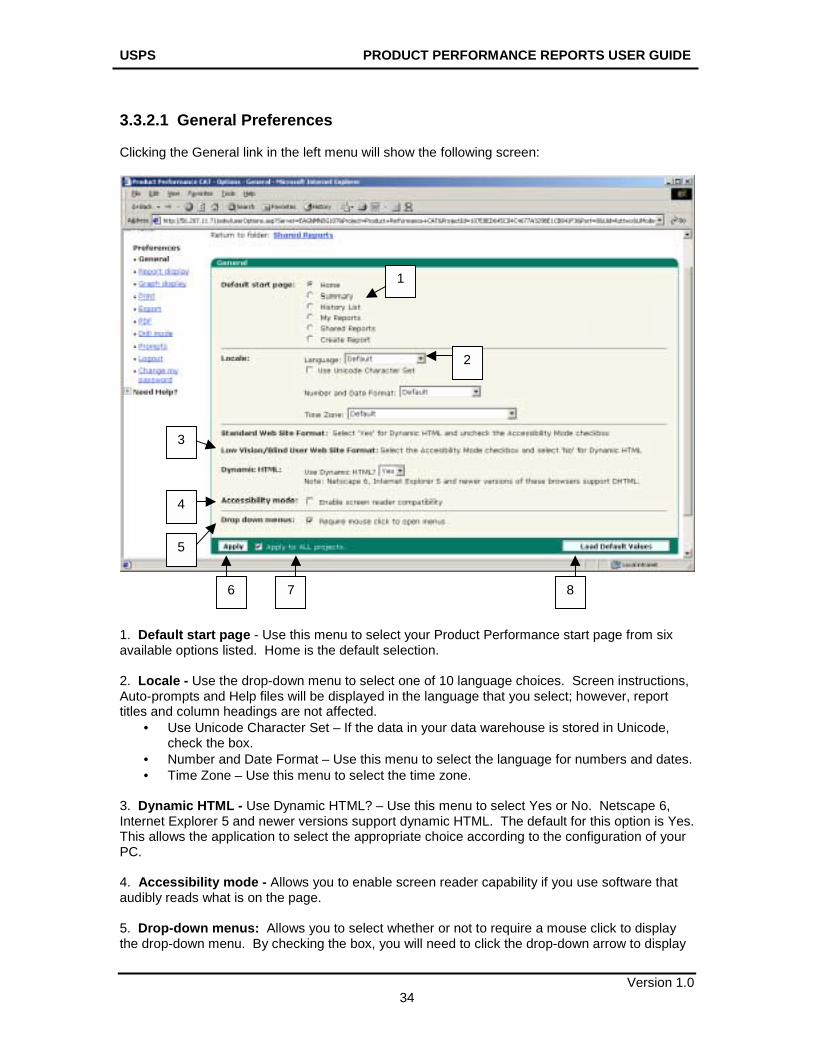
3.3.2.1 General Preferences Clicking the General link in the left menu will show the following screen:
1. Default start page - Use this menu to select your Product Performance start page from six available options listed. Home is the default selection. 2. Locale - Use the drop-down menu to select one of 10 language choices. Screen instructions, Auto-prompts and Help files will be displayed in the language that you select; however, report titles and column headings are not affected.
• Use Unicode Character Set – If the data in your data warehouse is stored in Unicode, check the box.
• Number and Date Format – Use this menu to select the language for numbers and dates. • Time Zone – Use this menu to select the time zone.
3. Dynamic HTML - Use Dynamic HTML? – Use this menu to select Yes or No. Netscape 6, Internet Explorer 5 and newer versions support dynamic HTML. The default for this option is Yes. This allows the application to select the appropriate choice according to the configuration of your PC. 4. Accessibility mode - Allows you to enable screen reader capability if you use software that audibly reads what is on the page. 5. Drop-down menus: Allows you to select whether or not to require a mouse click to display the drop-down menu. By checking the box, you will need to click the drop-down arrow to display
1
2
3
4
5
6 7 8
USPS PRODUCT PERFORMANCE REPORTS USER GUIDE
Version 1.0 35
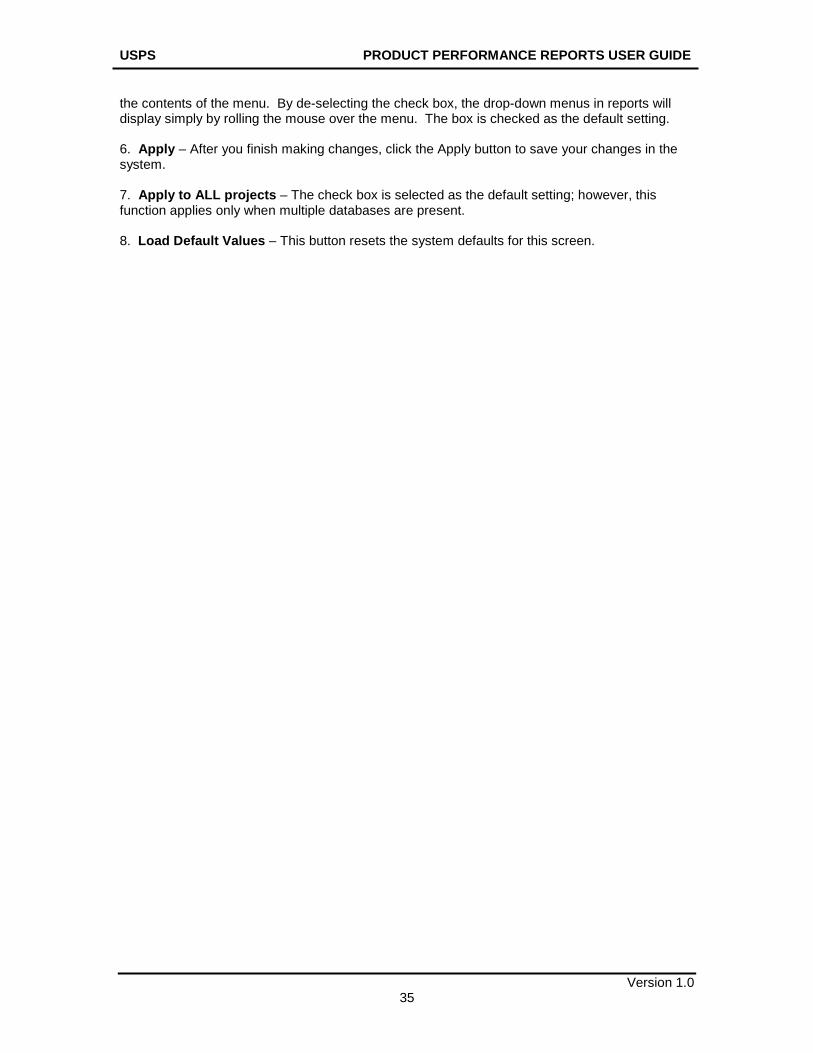
the contents of the menu. By de-selecting the check box, the drop-down menus in reports will display simply by rolling the mouse over the menu. The box is checked as the default setting. 6. Apply – After you finish making changes, click the Apply button to save your changes in the system. 7. Apply to ALL projects – The check box is selected as the default setting; however, this function applies only when multiple databases are present. 8. Load Default Values – This button resets the system defaults for this screen.
USPS PRODUCT PERFORMANCE REPORTS USER GUIDE
Version 1.0 36
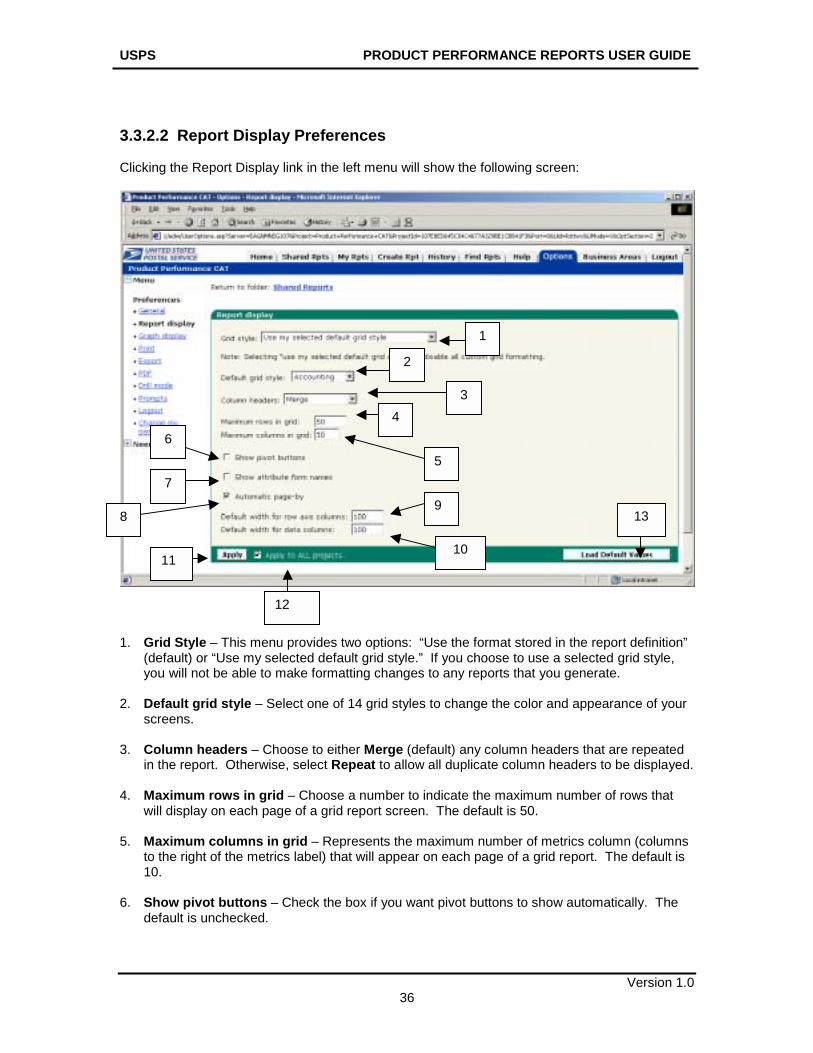
3.3.2.2 Report Display Preferences Clicking the Report Display link in the left menu will show the following screen:
1. Grid Style – This menu provides two options: “Use the format stored in the report definition”
(default) or “Use my selected default grid style.” If you choose to use a selected grid style, you will not be able to make formatting changes to any reports that you generate.
2. Default grid style – Select one of 14 grid styles to change the color and appearance of your screens.
3. Column headers – Choose to either Merge (default) any column headers that are repeated in the report. Otherwise, select Repeat to allow all duplicate column headers to be displayed.
4. Maximum rows in grid – Choose a number to indicate the maximum number of rows that will display on each page of a grid report screen. The default is 50.
5. Maximum columns in grid – Represents the maximum number of metrics column (columns to the right of the metrics label) that will appear on each page of a grid report. The default is 10.
6. Show pivot buttons – Check the box if you want pivot buttons to show automatically. The default is unchecked.
1
2
34
56
7
9
10 11
12
13 8
USPS PRODUCT PERFORMANCE REPORTS USER GUIDE
Version 1.0 37
7. Show attribute form names – Allows you to display the name of the attribute form associated with each attribute. The default is unchecked.
8. Automatic Page By – Uncheck the box if you want to select a “GO” button when using the Page By feature. Otherwise, once you make a selection from the drop-down menu from the Page By feature, the system will automatically display the data.
9. Default width for row axis columns – Allows you to set the default width to be used for any columns that are added to a report after the column widths have been set.
10. Default width for data columns – Allows you to set the default width to be used for any data columns that are added to a report after the column widths have been set using resize columns and rows feature.
11. Apply – When you have made your changes, click the Apply button to save them.
12. Apply to ALL projects – The check box is selected as the default setting.
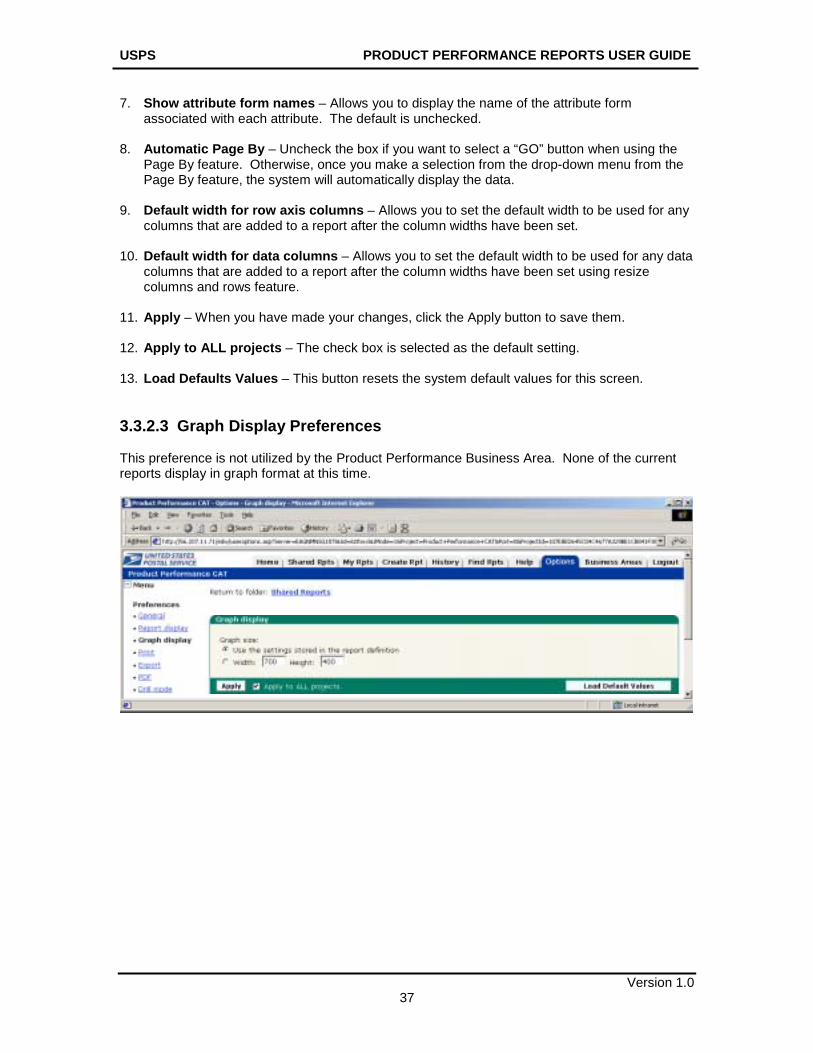
13. Load Defaults Values – This button resets the system default values for this screen. 3.3.2.3 Graph Display Preferences This preference is not utilized by the Product Performance Business Area. None of the current reports display in graph format at this time.
USPS PRODUCT PERFORMANCE REPORTS USER GUIDE
Version 1.0 38
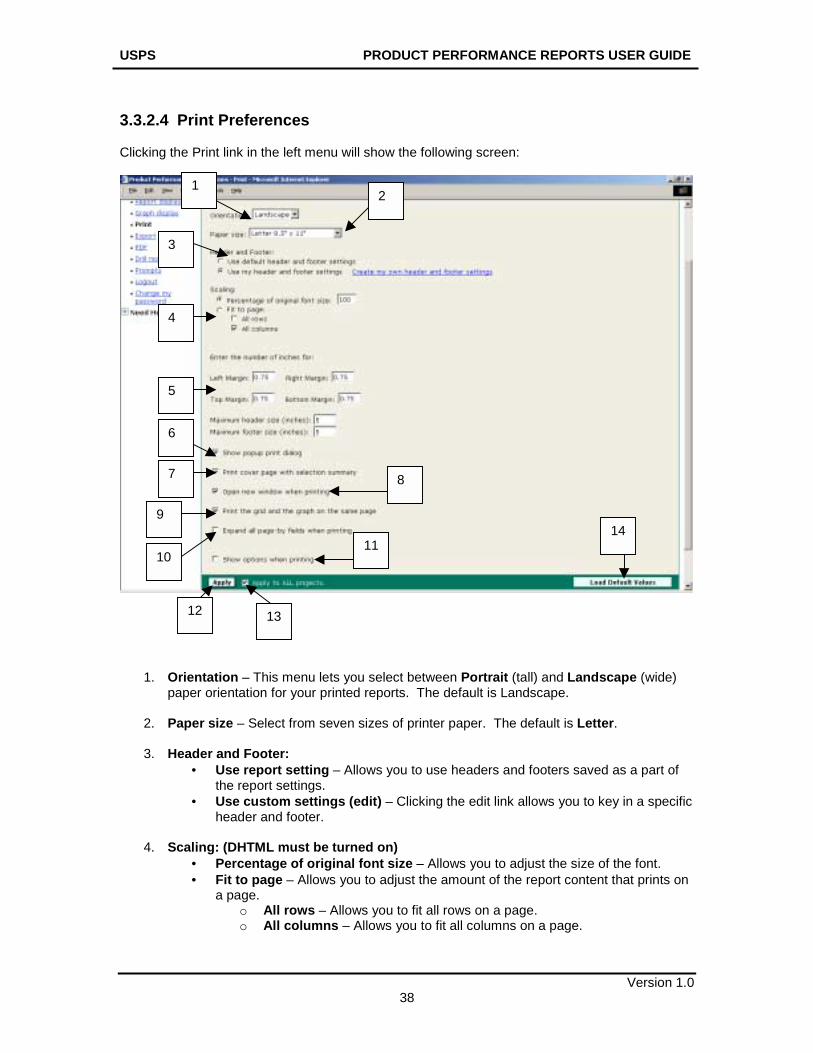
3.3.2.4 Print Preferences Clicking the Print link in the left menu will show the following screen:
1. Orientation – This menu lets you select between Portrait (tall) and Landscape (wide) paper orientation for your printed reports. The default is Landscape.
2. Paper size – Select from seven sizes of printer paper. The default is Letter.
3. Header and Footer:
• Use report setting – Allows you to use headers and footers saved as a part of the report settings.
• Use custom settings (edit) – Clicking the edit link allows you to key in a specific header and footer.
4. Scaling: (DHTML must be turned on)
• Percentage of original font size – Allows you to adjust the size of the font. • Fit to page – Allows you to adjust the amount of the report content that prints on
a page. o All rows – Allows you to fit all rows on a page. o All columns – Allows you to fit all columns on a page.
1 2
3
4
5
6
7 8
9
10 11
12
14
13
USPS PRODUCT PERFORMANCE REPORTS USER GUIDE
Version 1.0 39
5. Enter the number of inches for: (DHTML must be turned on) – Allows you to set the top, bottom, left and right margins. In order for reports to print properly, these margin settings and the margin settings in the browser’s Page Setup option must match.
6. Show popup print dialog – Automatically displays the browser’s Print dialogue box
when you show a printable version of a report. The default is checked.
7. Print cover page with selection summary – Allows you to print the filter details of the report on a separate page before the contents of the report. The default is checked.
8. Open new window when printing – Opens a new Internet Explorer browser window
when you choose print a report. If unchecked, the printing routine opens in the existing browser window. The default is checked.
9. Print the grid and the graph on the same page – Produces a report with data
presented as a grid or a graph. When the box is not checked, the report prints in grid format only. The box is checked by default.
10. Expand all Page By fields when printing – Allows you to print all combinations of items
in the Page By table when printing a report that has one or more items in the Page By table. Clear this box to print only the items currently displayed.
11. Show options when printing – Opens a window each time you print a report allowing
you to select printing options for the current.
12. Apply – Saves your changes in the system.
13. Apply to ALL projects – Saves all changes as defaults across multiple databases. The box is checked by default.
14. Load Default Values – Resets the system default values for this screen.
USPS PRODUCT PERFORMANCE REPORTS USER GUIDE
Version 1.0 40
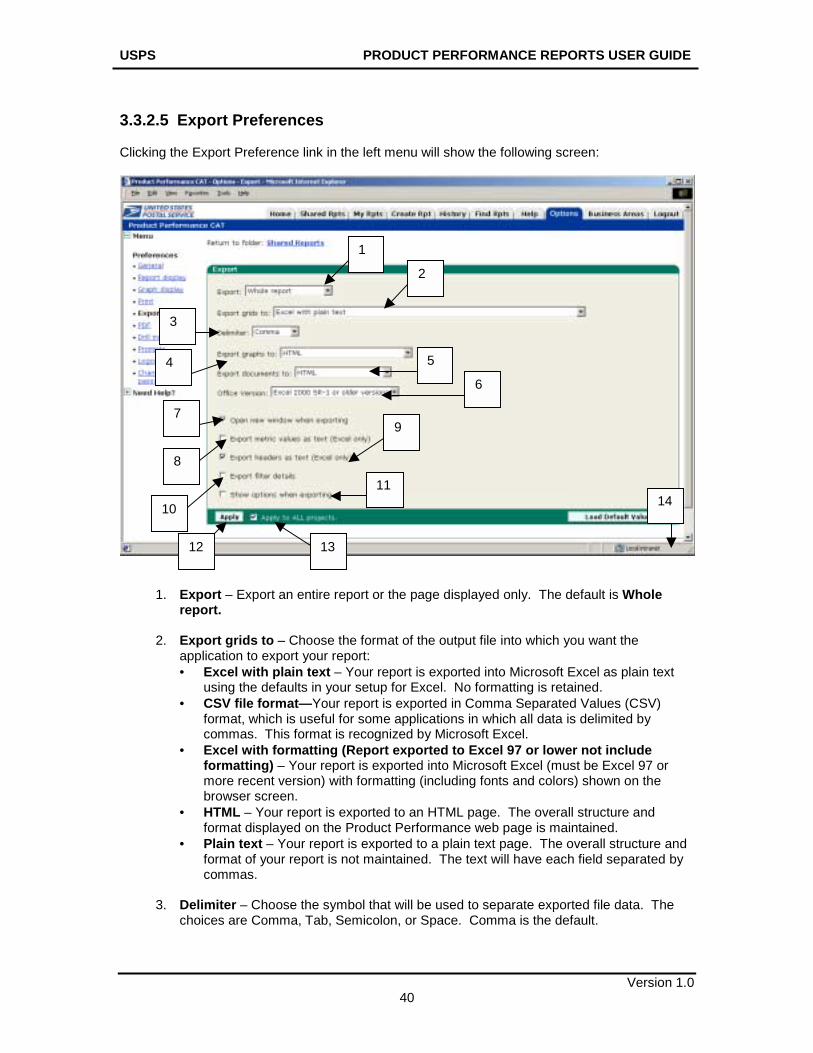
3.3.2.5 Export Preferences Clicking the Export Preference link in the left menu will show the following screen:
1. Export – Export an entire report or the page displayed only. The default is Whole report.
2. Export grids to – Choose the format of the output file into which you want the
application to export your report: • Excel with plain text – Your report is exported into Microsoft Excel as plain text
using the defaults in your setup for Excel. No formatting is retained. • CSV file format—Your report is exported in Comma Separated Values (CSV)
format, which is useful for some applications in which all data is delimited by commas. This format is recognized by Microsoft Excel.
• Excel with formatting (Report exported to Excel 97 or lower not include formatting) – Your report is exported into Microsoft Excel (must be Excel 97 or more recent version) with formatting (including fonts and colors) shown on the browser screen.
• HTML – Your report is exported to an HTML page. The overall structure and format displayed on the Product Performance web page is maintained.
• Plain text – Your report is exported to a plain text page. The overall structure and format of your report is not maintained. The text will have each field separated by commas.
3. Delimiter – Choose the symbol that will be used to separate exported file data. The
choices are Comma, Tab, Semicolon, or Space. Comma is the default.
1
2
3
4 5
6
7
8
9
10
11
12 13
14
USPS PRODUCT PERFORMANCE REPORTS USER GUIDE
Version 1.0 41
4. Export graphs to – Choose either the Excel 2000 SR-1 or newer versions, or the HTML format to determine how the graphs will be exported. HTML is the default.
NOTE: If you chose Excel 2000 in Step 4, you must choose “With formatting” or “Without formatting” to determine how the grid will be exported. “With formatting” is the default. Currently none of the Product Performance Reports use graphs.
5. Export documents to – Choose either HTML or Excel without formatting to determine
your document export format. HTML is the default.
6. Office Version – Choose either Excel 2000 SR-1 or older versions or Excel XP or newer versions.
7. Open a new window when exporting – Requires the application to open a new
Internet Explorer window for the exported file. The default is checked.
8. Export metric values as text (Excel only) – Check this box if you want the exported file to display metric values as text. The default is unchecked.
9. Export headers as text (Excel only) – Check this box if you want the exported file to
contain headers as editable text. The default is checked.
10. Export filter details – Exports the file with the filter details used to generate the report. The default is unchecked.
11. Show options when exporting – Opens a window each time you export a report
allowing you to select exporting options for the current report. The default is unchecked.
12. Apply button – Click the Apply button to save your changes.
13. Apply to ALL projects – Saves all changes as defaults across multiple databases.
14. Load Default Values Button – Resets the system default values for this screen.
USPS PRODUCT PERFORMANCE REPORTS USER GUIDE
Version 1.0 42
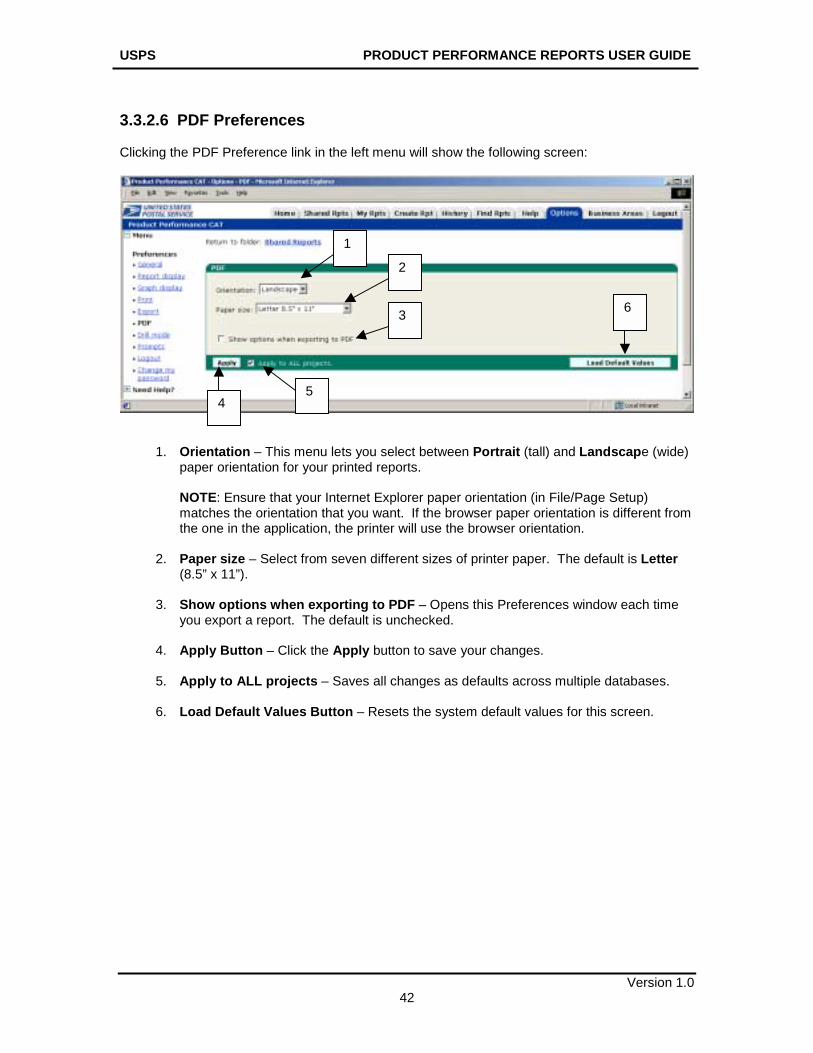
3.3.2.6 PDF Preferences Clicking the PDF Preference link in the left menu will show the following screen:
1. Orientation – This menu lets you select between Portrait (tall) and Landscape (wide) paper orientation for your printed reports.
NOTE: Ensure that your Internet Explorer paper orientation (in File/Page Setup) matches the orientation that you want. If the browser paper orientation is different from the one in the application, the printer will use the browser orientation.
2. Paper size – Select from seven different sizes of printer paper. The default is Letter
(8.5” x 11”).
3. Show options when exporting to PDF – Opens this Preferences window each time you export a report. The default is unchecked.
4. Apply Button – Click the Apply button to save your changes.
5. Apply to ALL projects – Saves all changes as defaults across multiple databases.
6. Load Default Values Button – Resets the system default values for this screen.
1
2
3
4 5
6
USPS PRODUCT PERFORMANCE REPORTS USER GUIDE
Version 1.0 43
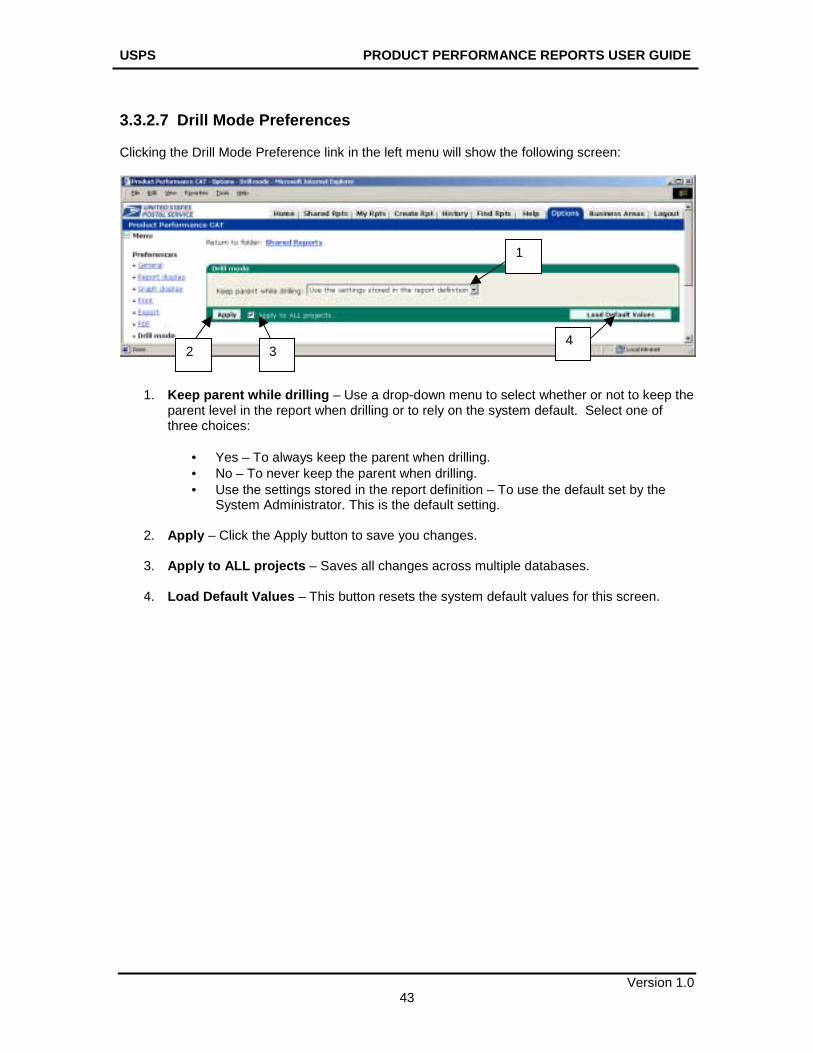
3.3.2.7 Drill Mode Preferences Clicking the Drill Mode Preference link in the left menu will show the following screen:
1. Keep parent while drilling – Use a drop-down menu to select whether or not to keep the parent level in the report when drilling or to rely on the system default. Select one of three choices:
• Yes – To always keep the parent when drilling. • No – To never keep the parent when drilling. • Use the settings stored in the report definition – To use the default set by the
System Administrator. This is the default setting.
2. Apply – Click the Apply button to save you changes.
3. Apply to ALL projects – Saves all changes across multiple databases.
4. Load Default Values – This button resets the system default values for this screen.
1
2 3 4
USPS PRODUCT PERFORMANCE REPORTS USER GUIDE
Version 1.0 44
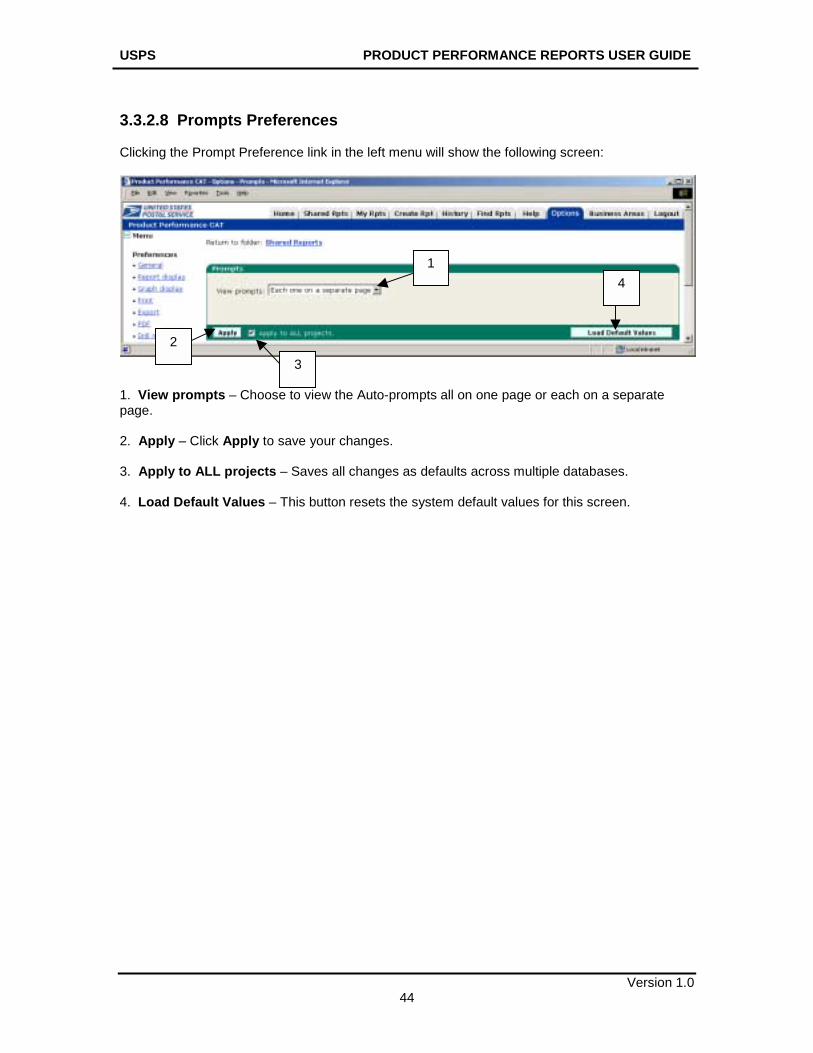
3.3.2.8 Prompts Preferences Clicking the Prompt Preference link in the left menu will show the following screen:
1. View prompts – Choose to view the Auto-prompts all on one page or each on a separate page. 2. Apply – Click Apply to save your changes. 3. Apply to ALL projects – Saves all changes as defaults across multiple databases. 4. Load Default Values – This button resets the system default values for this screen.
1
2
3
4
USPS PRODUCT PERFORMANCE REPORTS USER GUIDE
Version 1.0 45
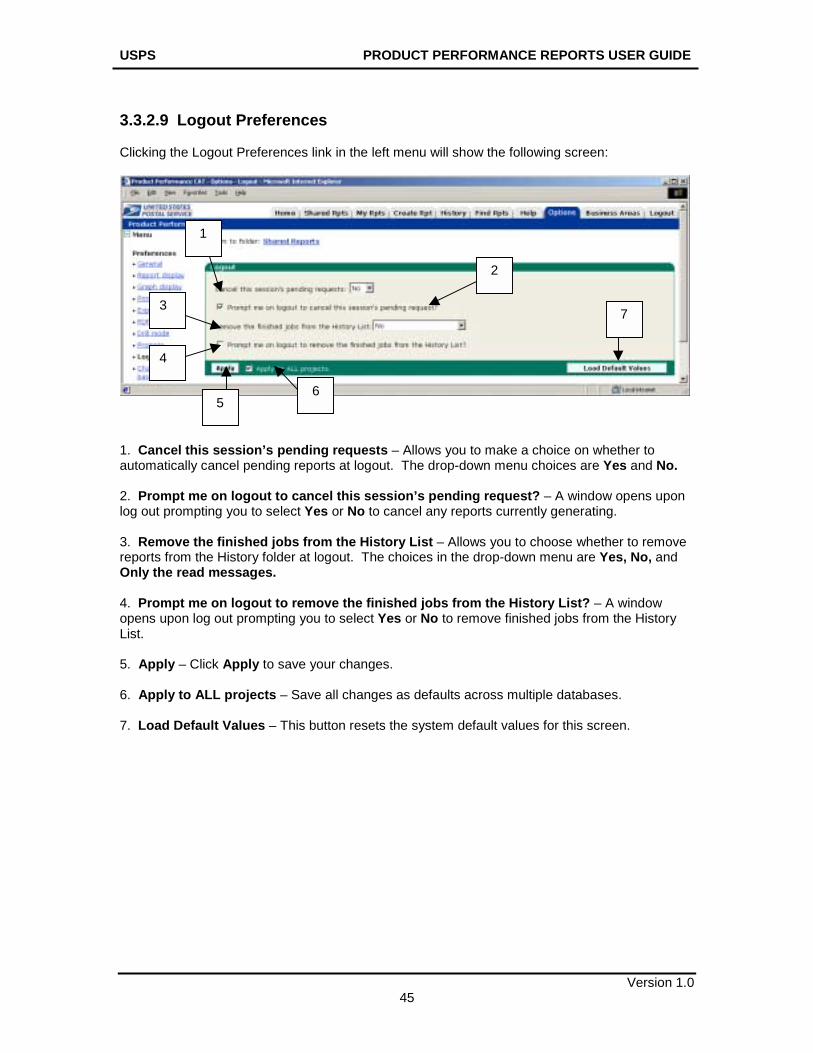
3.3.2.9 Logout Preferences Clicking the Logout Preferences link in the left menu will show the following screen:
1. Cancel this session’s pending requests – Allows you to make a choice on whether to automatically cancel pending reports at logout. The drop-down menu choices are Yes and No. 2. Prompt me on logout to cancel this session’s pending request? – A window opens upon log out prompting you to select Yes or No to cancel any reports currently generating. 3. Remove the finished jobs from the History List – Allows you to choose whether to remove reports from the History folder at logout. The choices in the drop-down menu are Yes, No, and Only the read messages. 4. Prompt me on logout to remove the finished jobs from the History List? – A window opens upon log out prompting you to select Yes or No to remove finished jobs from the History List. 5. Apply – Click Apply to save your changes. 6. Apply to ALL projects – Save all changes as defaults across multiple databases. 7. Load Default Values – This button resets the system default values for this screen.
1
2
3
4
5 6
7
USPS PRODUCT PERFORMANCE REPORTS USER GUIDE
Version 1.0 46
4.0 Product Performance Data Hierarchies
4.1 Product Performance Data Structure In order to create Product Performance Reports, the information must be carefully structured. In Product Performance, part of that structuring involves building hierarchies of data. A hierarchy is a group of entities arranged in a graded series. Terms that are important to understand with hierarchies are provided below: Attribute - An attribute is a level of data within a hierarchy. Essentially, an attribute is the level or subject by which you want to analyze facts. An attribute usually can not be aggregated because it does not lend itself to being summed or averaged. Also, an attribute is the means by which you define the data that you want to display on a report. For example, in the location hierarchy, Area is an attribute. Capitol Metro Area is an attribute. Element - An element is an actual piece of data within an attribute that is displayed on a report. For example, the Capital, Northern Virginia, Baltimore, and Richmond districts are elements within the Capitol Metro Area. The three main Product Performance hierarchies are:
• Product/Service • Location • Time
4.1.1 Product/Service Hierarchy Like the location information in the Product Performance, the product information is also arranged into a hierarchy. The order of the product/service hierarchy is:
• Product/Service • Product Type • Product Category • Service Standards
Product/Service includes Packages Services, Priority Mail, First Class and Standard Mail. Product/Service contains product types (i.e. Package Services – Commercial). Product Types contain product categories (i.e. Package Services – Commercial – Other). Product Categories contain services standards (i.e. Package Services – Commercial – Other – 1 Day, Package Services – Commercial – Other – 2 Day).
4.1.2 Location Hierarchy Product Performance groups location information into a hierarchy. This information is at several levels ranging from national information down to information from individual ZIP-5 area codes.
• National • Area • District
USPS PRODUCT PERFORMANCE REPORTS USER GUIDE
Version 1.0 47
• ZIP-3 • ZIP-5
The National level is the accumulation of the Areas beneath it. Data from all the Areas is gathered to make the National data. The Area level is made up of all the data from the Districts within the Area. The District is made up of ZIP-3 Areas. The ZIP-3 Area is made up of ZIP-5 Areas.
4.1.3 Time Hierarchy Like the location and product/service information in the Product Performance, the time information is also arranged into a hierarchy. The order of the time hierarchy is:
• Government Fiscal Year • Government Fiscal Quarter • Week • Day of Week
The Government Fiscal Year is made up of 4 quarterly accounting period quarters. Each Fiscal Quarter is made of 3 accounting monthly periods (except for the final quarter, which contains 4 accounting periods). A week is made up of 7 days. The Day of the Week is made up of a specific day (i.e. Monday, Tuesday, etc).
USPS PRODUCT PERFORMANCE REPORTS USER GUIDE
Version 1.0 48
5.0 Generating Product Performance Reports
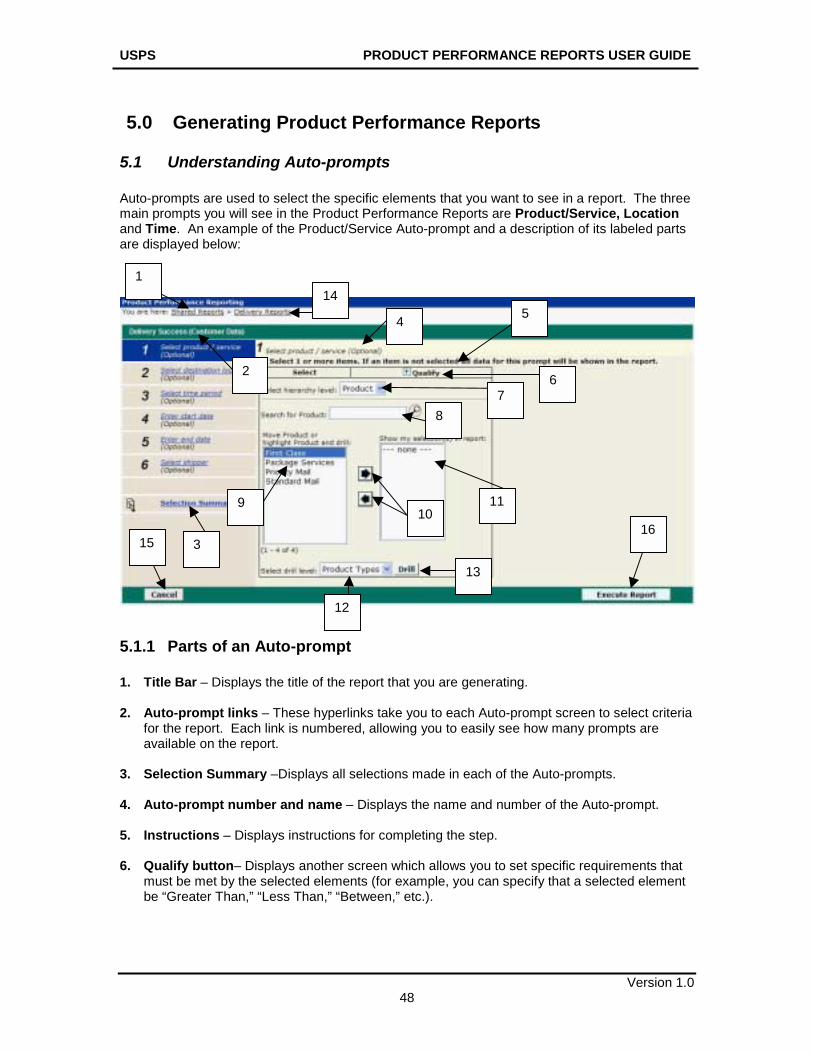
5.1 Understanding Auto-prompts Auto-prompts are used to select the specific elements that you want to see in a report. The three main prompts you will see in the Product Performance Reports are Product/Service, Location and Time. An example of the Product/Service Auto-prompt and a description of its labeled parts are displayed below:
5.1.1 Parts of an Auto-prompt 1. Title Bar – Displays the title of the report that you are generating. 2. Auto-prompt links – These hyperlinks take you to each Auto-prompt screen to select criteria
for the report. Each link is numbered, allowing you to easily see how many prompts are available on the report.
3. Selection Summary –Displays all selections made in each of the Auto-prompts. 4. Auto-prompt number and name – Displays the name and number of the Auto-prompt. 5. Instructions – Displays instructions for completing the step. 6. Qualify button– Displays another screen which allows you to set specific requirements that
must be met by the selected elements (for example, you can specify that a selected element be “Greater Than,” “Less Than,” “Between,” etc.).
1
2
3
4 5
6 7
8
9 10
11
12
13
14
15 16
USPS PRODUCT PERFORMANCE REPORTS USER GUIDE
Version 1.0 49
7. Hierarchy level – Displays the current level within the hierarchy. Allows you to move to other levels in the hierarchy by selecting the preferred level from the drop-down menu.
8. Search box – Allows you to search for attributes within the elements box. 9. Elements box – Contains all the attributes that pertain to the hierarchy level. 10. Right-facing and Left-facing Arrows – Moves the selected attributes into or out of the My
selections box. 11. My Selections – Displays the Auto-prompt criteria that you have selected to build your
report. 12. Drill to – Allows you to select a drill level from the drop-down menu. 13. Drill button – Allows you to drill to your selected level. 14. Navigation path – Displays the folder links on which you clicked in order to reach the current
screen. 15. Cancel – Cancel your Auto-prompt selections and return to the report folder. 16. Execute Report – Generate the report from the selected Auto-prompts.
USPS PRODUCT PERFORMANCE REPORTS USER GUIDE
Version 1.0 50
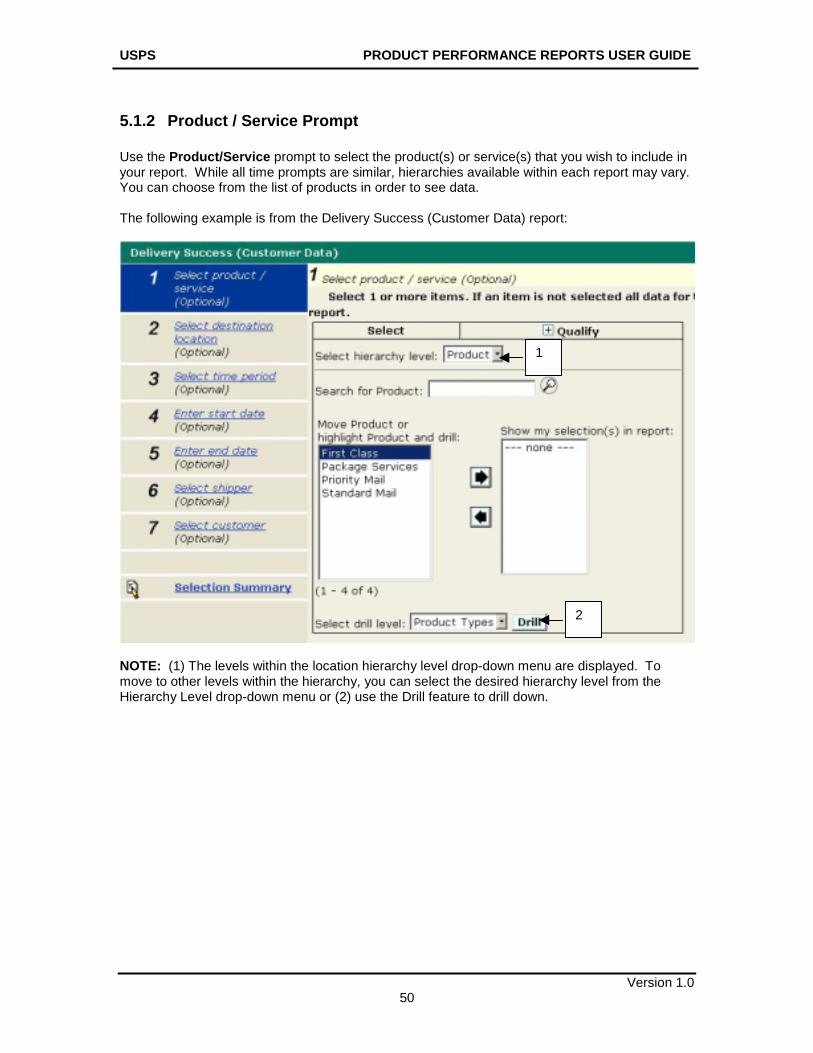
5.1.2 Product / Service Prompt Use the Product/Service prompt to select the product(s) or service(s) that you wish to include in your report. While all time prompts are similar, hierarchies available within each report may vary. You can choose from the list of products in order to see data. The following example is from the Delivery Success (Customer Data) report:
NOTE: (1) The levels within the location hierarchy level drop-down menu are displayed. To move to other levels within the hierarchy, you can select the desired hierarchy level from the Hierarchy Level drop-down menu or (2) use the Drill feature to drill down.
1
2
USPS PRODUCT PERFORMANCE REPORTS USER GUIDE
Version 1.0 51
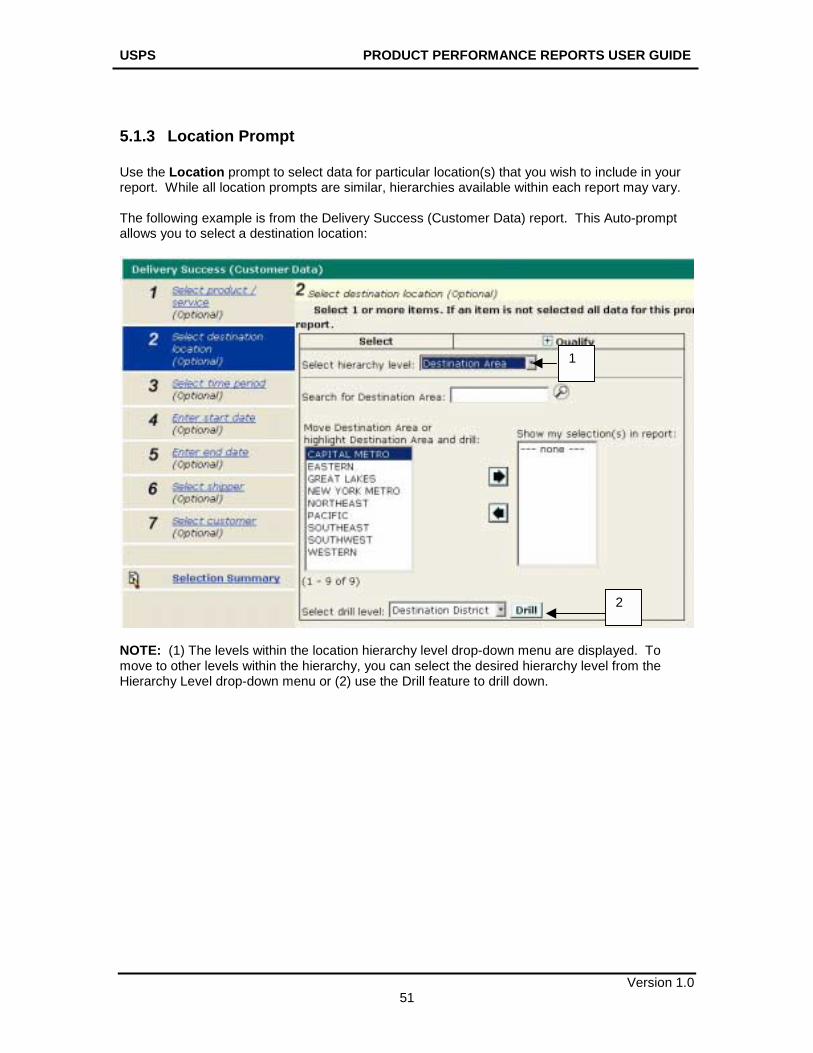
5.1.3 Location Prompt Use the Location prompt to select data for particular location(s) that you wish to include in your report. While all location prompts are similar, hierarchies available within each report may vary. The following example is from the Delivery Success (Customer Data) report. This Auto-prompt allows you to select a destination location:
NOTE: (1) The levels within the location hierarchy level drop-down menu are displayed. To move to other levels within the hierarchy, you can select the desired hierarchy level from the Hierarchy Level drop-down menu or (2) use the Drill feature to drill down.
2
1
USPS PRODUCT PERFORMANCE REPORTS USER GUIDE
Version 1.0 52
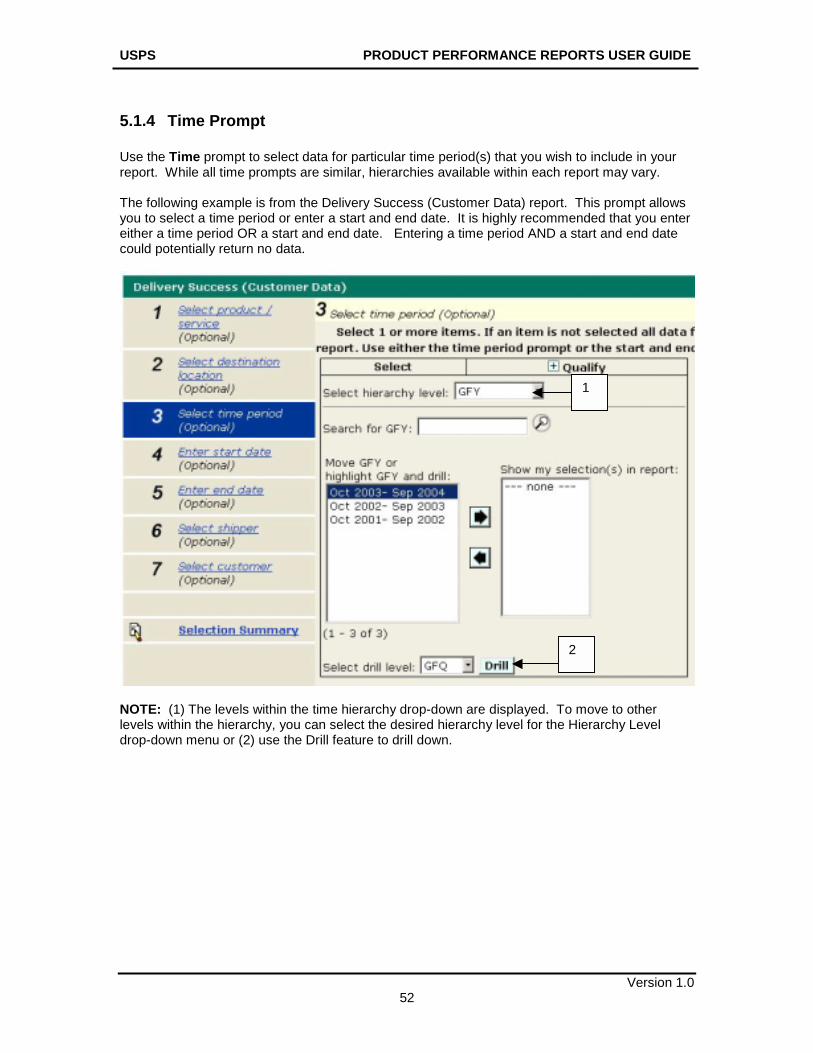
5.1.4 Time Prompt Use the Time prompt to select data for particular time period(s) that you wish to include in your report. While all time prompts are similar, hierarchies available within each report may vary. The following example is from the Delivery Success (Customer Data) report. This prompt allows you to select a time period or enter a start and end date. It is highly recommended that you enter either a time period OR a start and end date. Entering a time period AND a start and end date could potentially return no data.
NOTE: (1) The levels within the time hierarchy drop-down are displayed. To move to other levels within the hierarchy, you can select the desired hierarchy level for the Hierarchy Level drop-down menu or (2) use the Drill feature to drill down.
1
2
USPS PRODUCT PERFORMANCE REPORTS USER GUIDE
Version 1.0 53
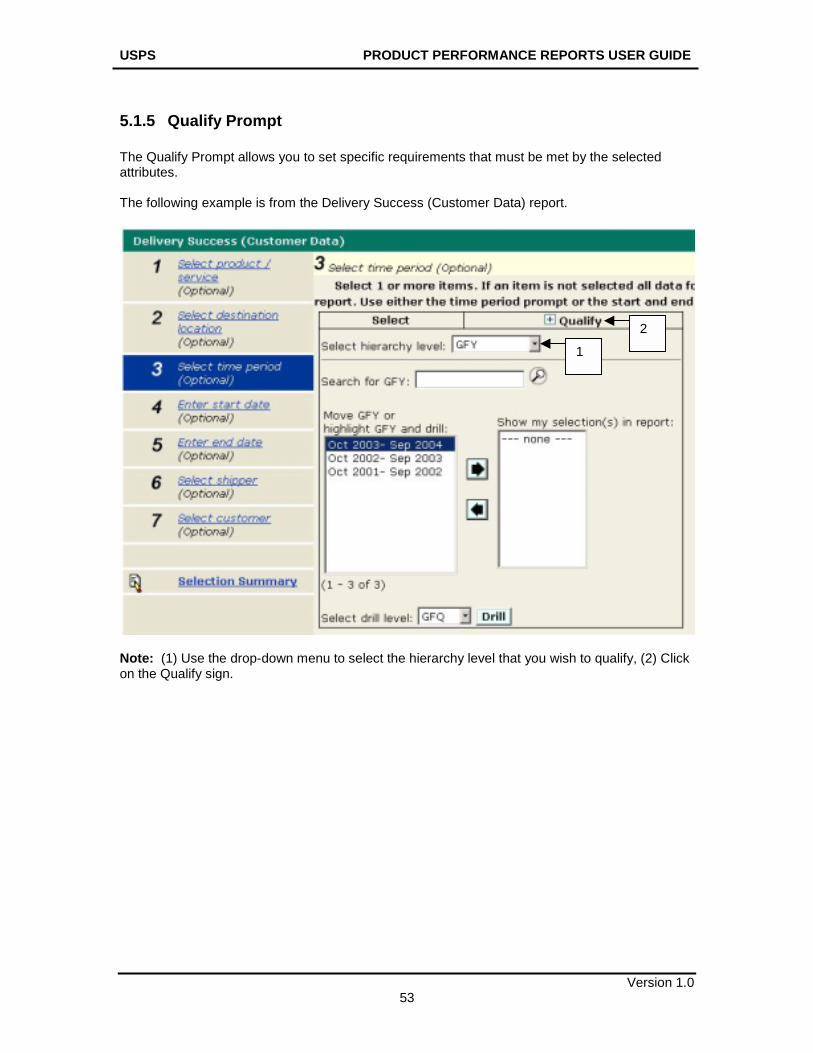
5.1.5 Qualify Prompt The Qualify Prompt allows you to set specific requirements that must be met by the selected attributes. The following example is from the Delivery Success (Customer Data) report.
Note: (1) Use the drop-down menu to select the hierarchy level that you wish to qualify, (2) Click on the Qualify sign.
1
2
USPS PRODUCT PERFORMANCE REPORTS USER GUIDE
Version 1.0 54
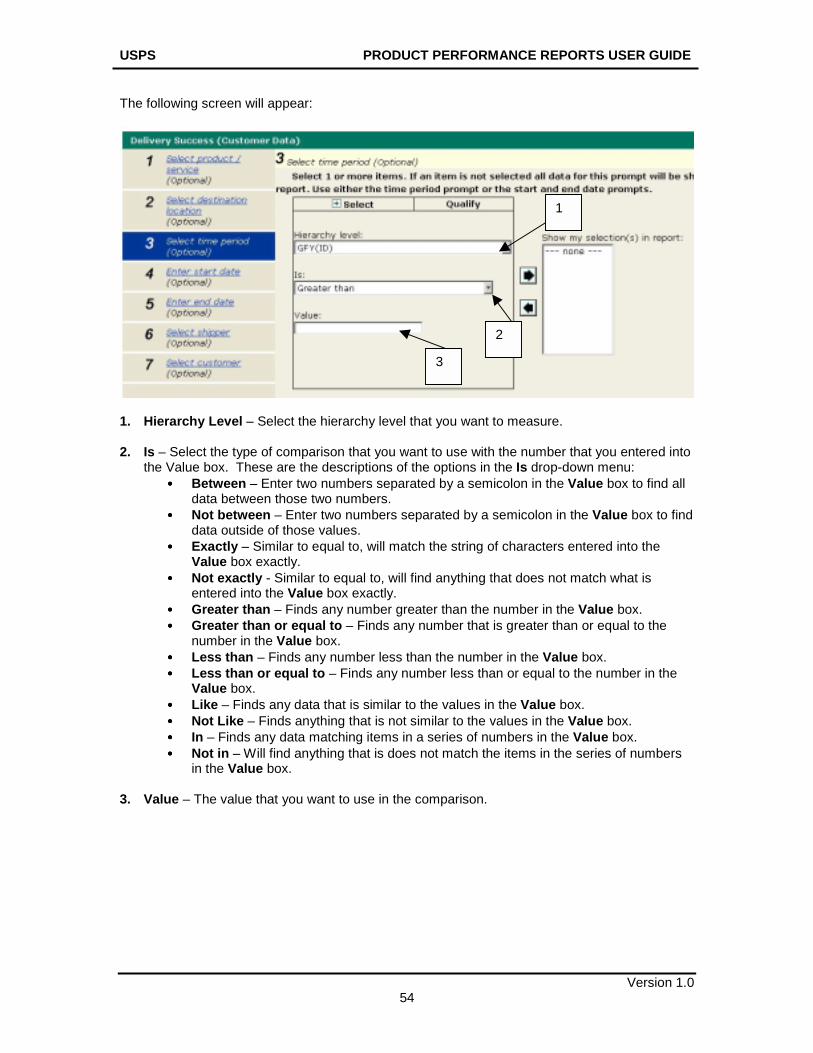
The following screen will appear:
1. Hierarchy Level – Select the hierarchy level that you want to measure. 2. Is – Select the type of comparison that you want to use with the number that you entered into
the Value box. These are the descriptions of the options in the Is drop-down menu: •••• Between – Enter two numbers separated by a semicolon in the Value box to find all
data between those two numbers. •••• Not between – Enter two numbers separated by a semicolon in the Value box to find
data outside of those values. •••• Exactly – Similar to equal to, will match the string of characters entered into the
Value box exactly. •••• Not exactly - Similar to equal to, will find anything that does not match what is
entered into the Value box exactly. •••• Greater than – Finds any number greater than the number in the Value box. •••• Greater than or equal to – Finds any number that is greater than or equal to the
number in the Value box. •••• Less than – Finds any number less than the number in the Value box. •••• Less than or equal to – Finds any number less than or equal to the number in the
Value box. •••• Like – Finds any data that is similar to the values in the Value box. •••• Not Like – Finds anything that is not similar to the values in the Value box. •••• In – Finds any data matching items in a series of numbers in the Value box. •••• Not in – Will find anything that is does not match the items in the series of numbers
in the Value box. 3. Value – The value that you want to use in the comparison.
2
1
3
USPS PRODUCT PERFORMANCE REPORTS USER GUIDE
Version 1.0 55
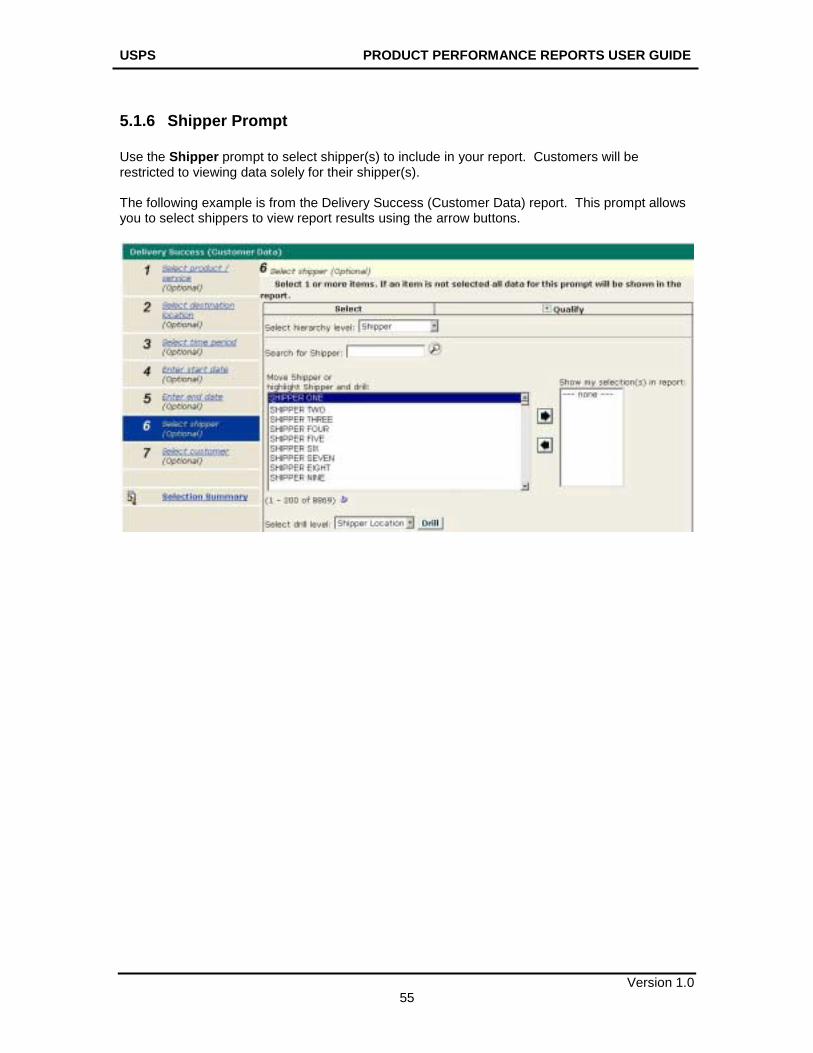
5.1.6 Shipper Prompt Use the Shipper prompt to select shipper(s) to include in your report. Customers will be restricted to viewing data solely for their shipper(s). The following example is from the Delivery Success (Customer Data) report. This prompt allows you to select shippers to view report results using the arrow buttons.
USPS PRODUCT PERFORMANCE REPORTS USER GUIDE
Version 1.0 56
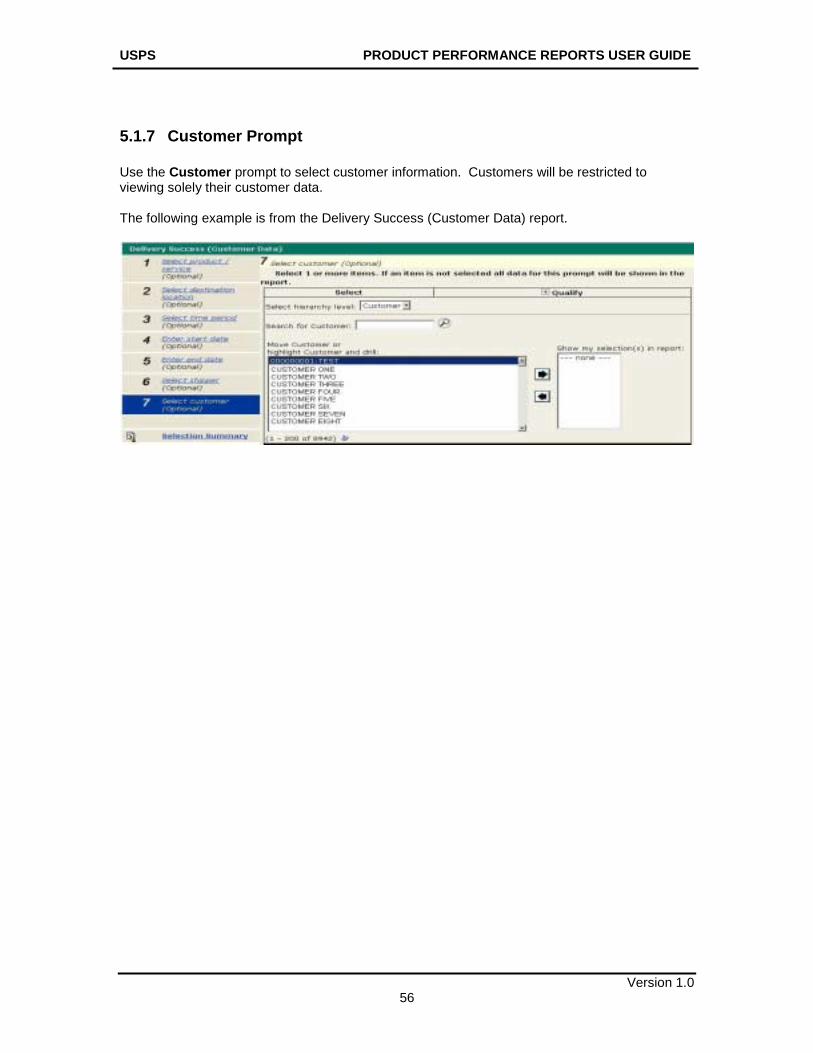
5.1.7 Customer Prompt Use the Customer prompt to select customer information. Customers will be restricted to viewing solely their customer data. The following example is from the Delivery Success (Customer Data) report.
USPS PRODUCT PERFORMANCE REPORTS USER GUIDE
Version 1.0 57
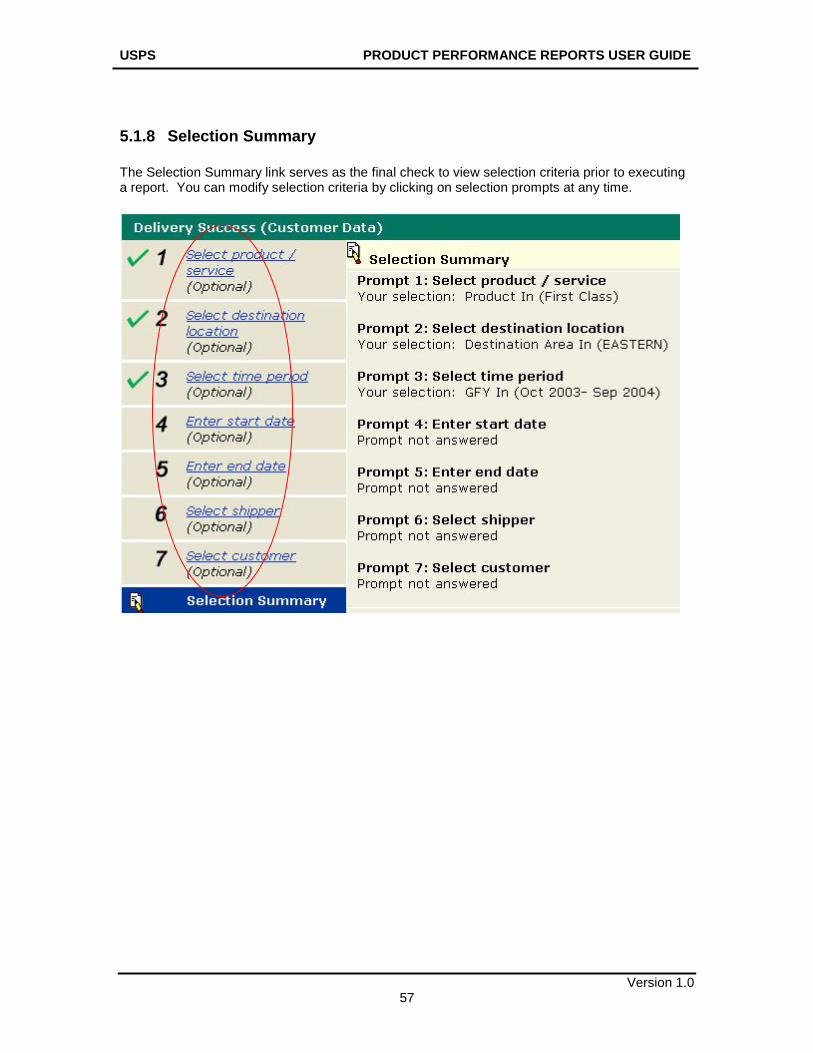
5.1.8 Selection Summary
The Selection Summary link serves as the final check to view selection criteria prior to executing a report. You can modify selection criteria by clicking on selection prompts at any time.
USPS PRODUCT PERFORMANCE REPORTS USER GUIDE
Version 1.0 58
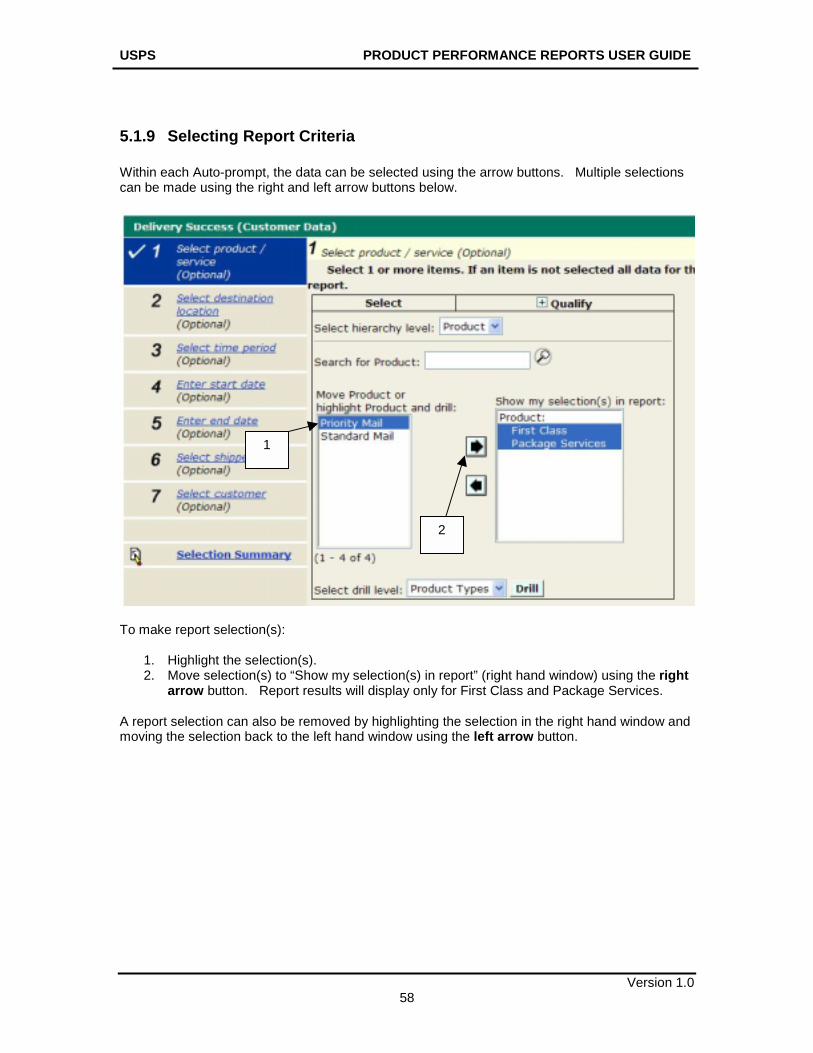
5.1.9 Selecting Report Criteria Within each Auto-prompt, the data can be selected using the arrow buttons. Multiple selections can be made using the right and left arrow buttons below.
To make report selection(s):
1. Highlight the selection(s). 2. Move selection(s) to “Show my selection(s) in report” (right hand window) using the right
arrow button. Report results will display only for First Class and Package Services. A report selection can also be removed by highlighting the selection in the right hand window and moving the selection back to the left hand window using the left arrow button.
1
2
USPS PRODUCT PERFORMANCE REPORTS USER GUIDE
Version 1.0 59
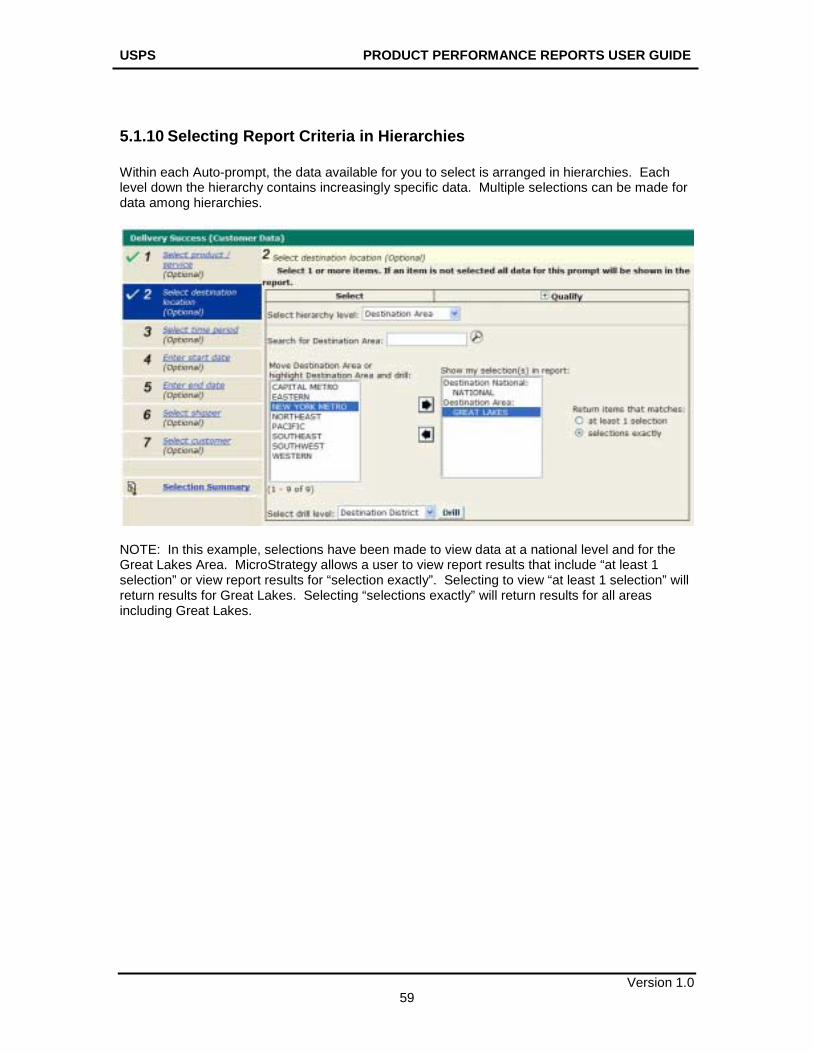
5.1.10 Selecting Report Criteria in Hierarchies Within each Auto-prompt, the data available for you to select is arranged in hierarchies. Each level down the hierarchy contains increasingly specific data. Multiple selections can be made for data among hierarchies.
NOTE: In this example, selections have been made to view data at a national level and for the Great Lakes Area. MicroStrategy allows a user to view report results that include “at least 1 selection” or view report results for “selection exactly”. Selecting to view “at least 1 selection” will return results for Great Lakes. Selecting “selections exactly” will return results for all areas including Great Lakes.
USPS PRODUCT PERFORMANCE REPORTS USER GUIDE
Version 1.0 60
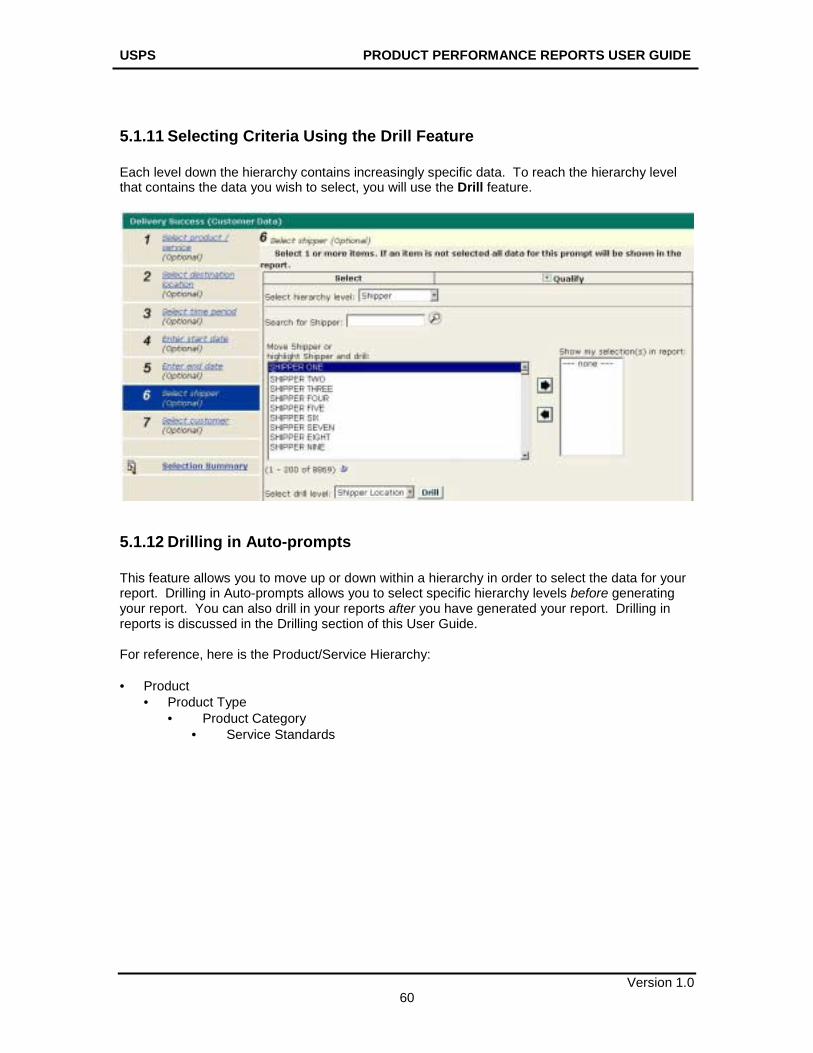
5.1.11 Selecting Criteria Using the Drill Feature Each level down the hierarchy contains increasingly specific data. To reach the hierarchy level that contains the data you wish to select, you will use the Drill feature.
5.1.12 Drilling in Auto-prompts This feature allows you to move up or down within a hierarchy in order to select the data for your report. Drilling in Auto-prompts allows you to select specific hierarchy levels before generating your report. You can also drill in your reports after you have generated your report. Drilling in reports is discussed in the Drilling section of this User Guide. For reference, here is the Product/Service Hierarchy: • Product
• Product Type • Product Category
• Service Standards
USPS PRODUCT PERFORMANCE REPORTS USER GUIDE
Version 1.0 61
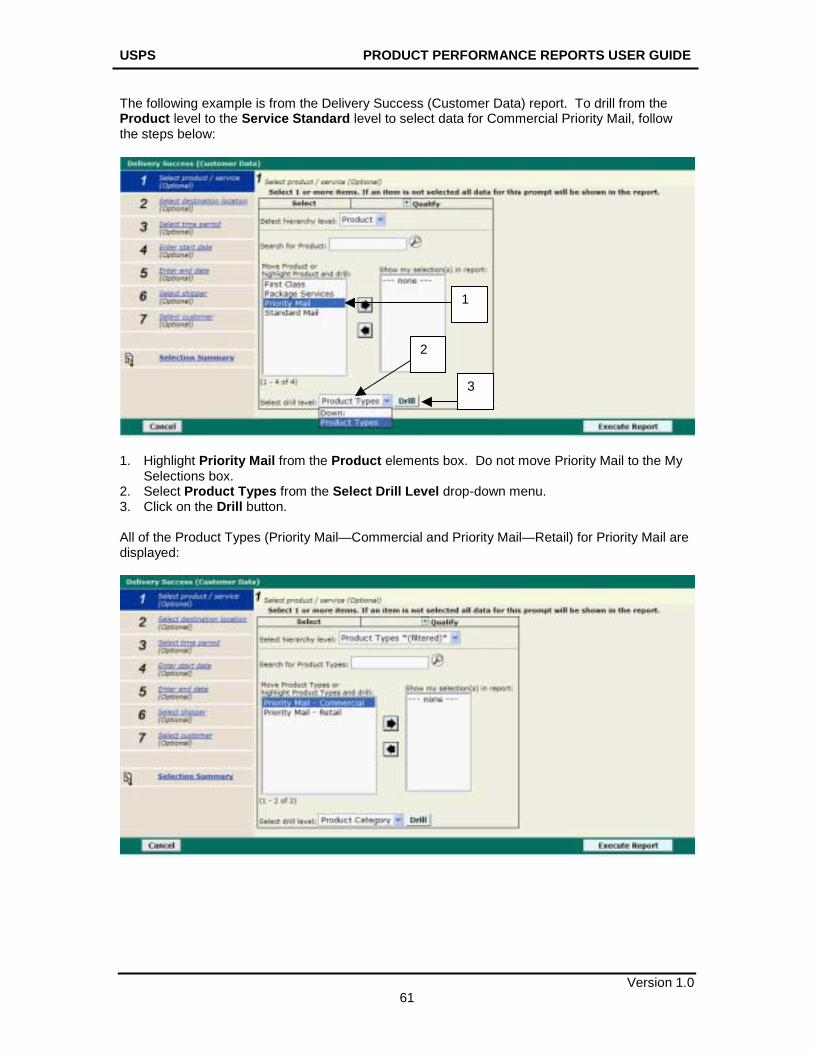
The following example is from the Delivery Success (Customer Data) report. To drill from the Product level to the Service Standard level to select data for Commercial Priority Mail, follow the steps below:
1. Highlight Priority Mail from the Product elements box. Do not move Priority Mail to the My
Selections box. 2. Select Product Types from the Select Drill Level drop-down menu. 3. Click on the Drill button. All of the Product Types (Priority Mail—Commercial and Priority Mail—Retail) for Priority Mail are displayed:
1
2
3
USPS PRODUCT PERFORMANCE REPORTS USER GUIDE
Version 1.0 62
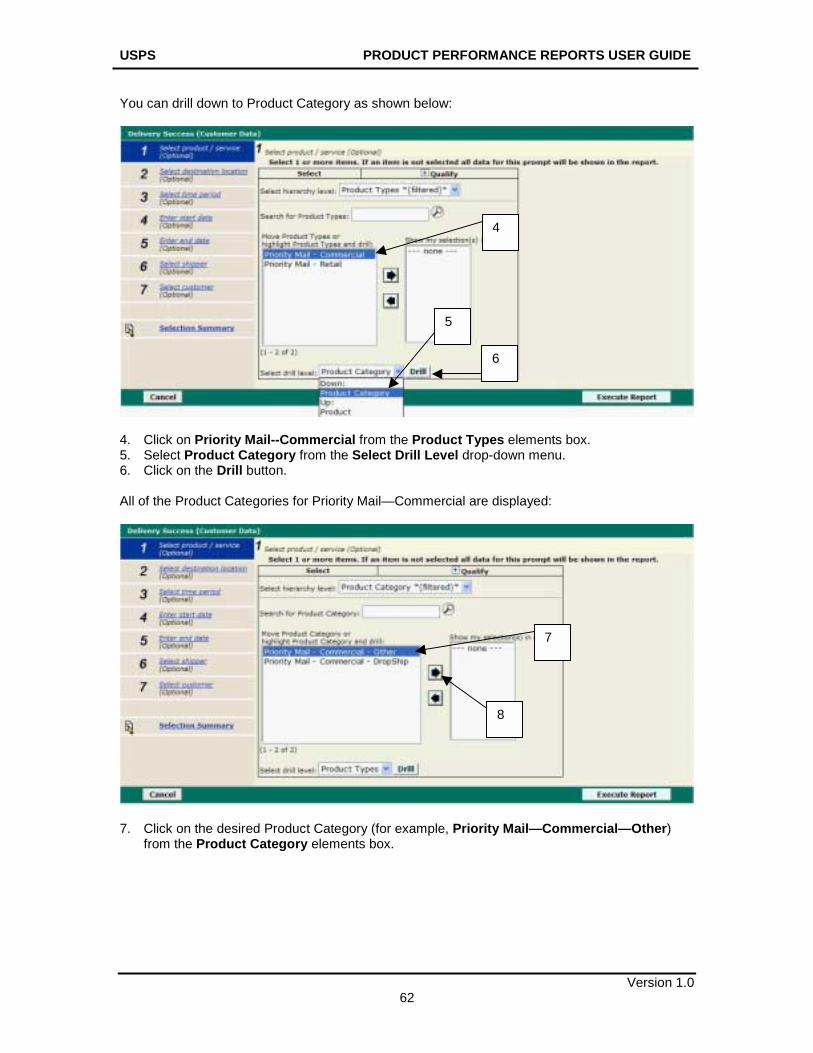
You can drill down to Product Category as shown below:
4. Click on Priority Mail--Commercial from the Product Types elements box. 5. Select Product Category from the Select Drill Level drop-down menu. 6. Click on the Drill button. All of the Product Categories for Priority Mail—Commercial are displayed:
7. Click on the desired Product Category (for example, Priority Mail—Commercial—Other)
from the Product Category elements box.
4
5
6
7
8
USPS PRODUCT PERFORMANCE REPORTS USER GUIDE
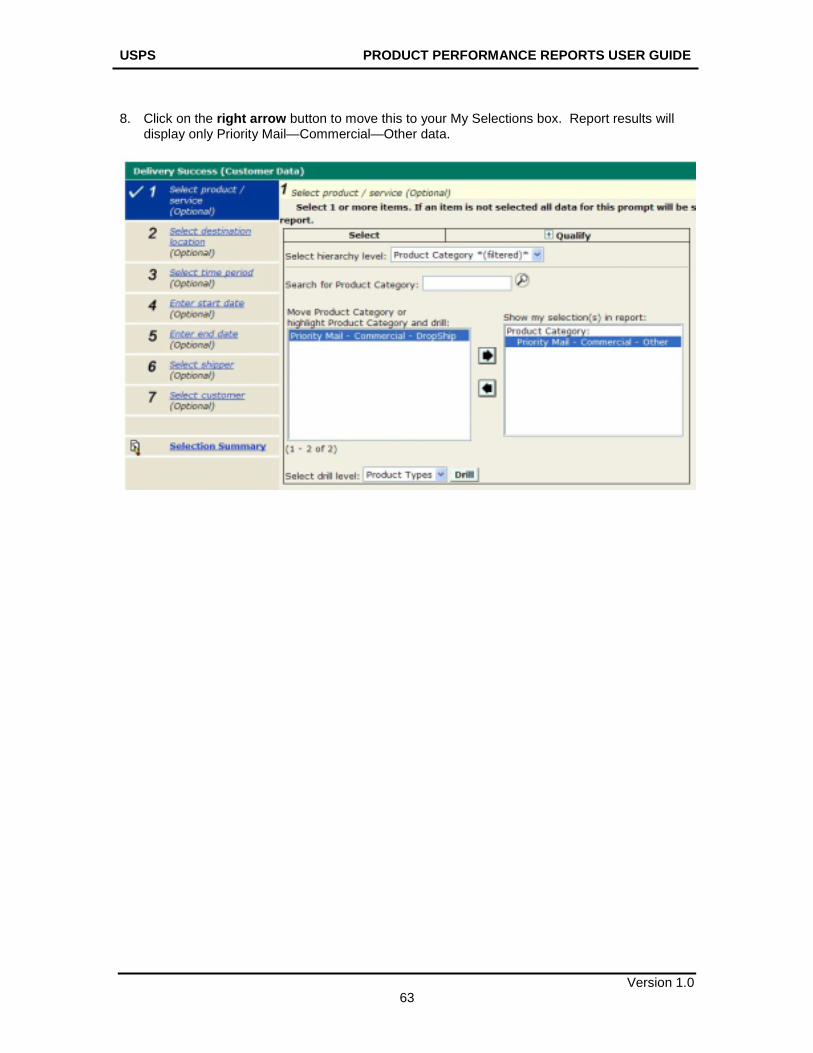
Version 1.0 63
8. Click on the right arrow button to move this to your My Selections box. Report results will
display only Priority Mail—Commercial—Other data.
USPS PRODUCT PERFORMANCE REPORTS USER GUIDE
Version 1.0 64
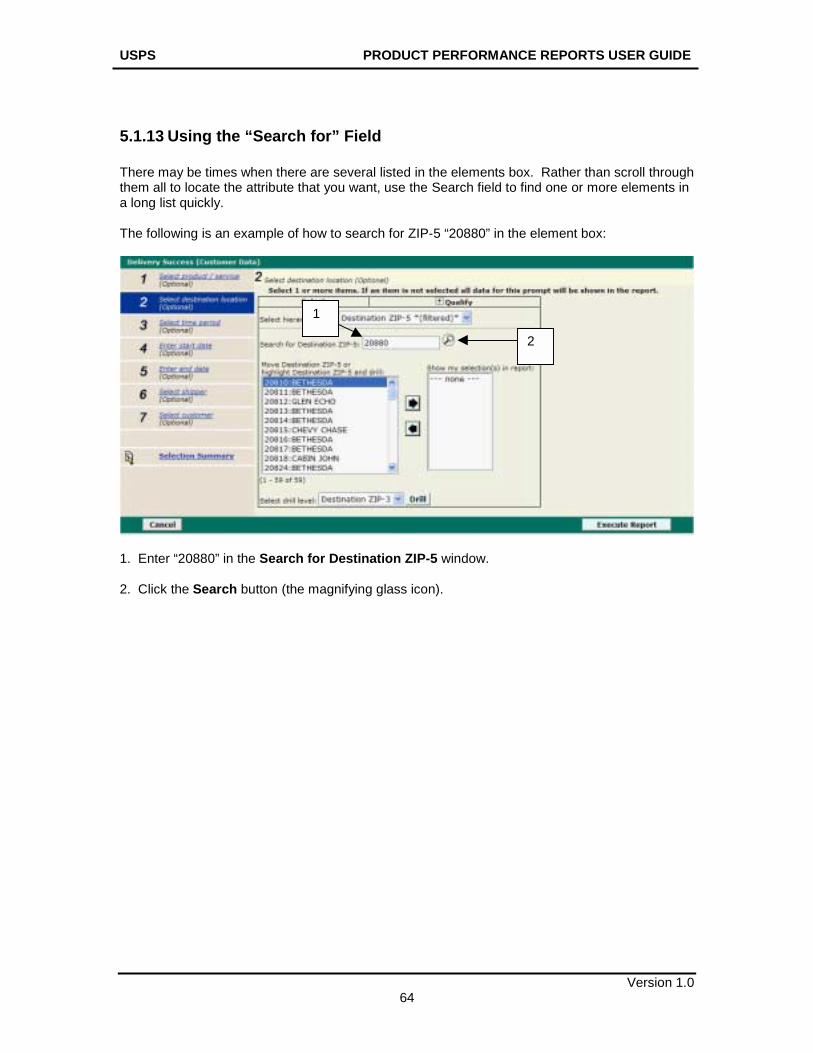
5.1.13 Using the “Search for” Field There may be times when there are several listed in the elements box. Rather than scroll through them all to locate the attribute that you want, use the Search field to find one or more elements in a long list quickly. The following is an example of how to search for ZIP-5 “20880” in the element box:
1. Enter “20880” in the Search for Destination ZIP-5 window. 2. Click the Search button (the magnifying glass icon).
1
2
USPS PRODUCT PERFORMANCE REPORTS USER GUIDE
Version 1.0 65
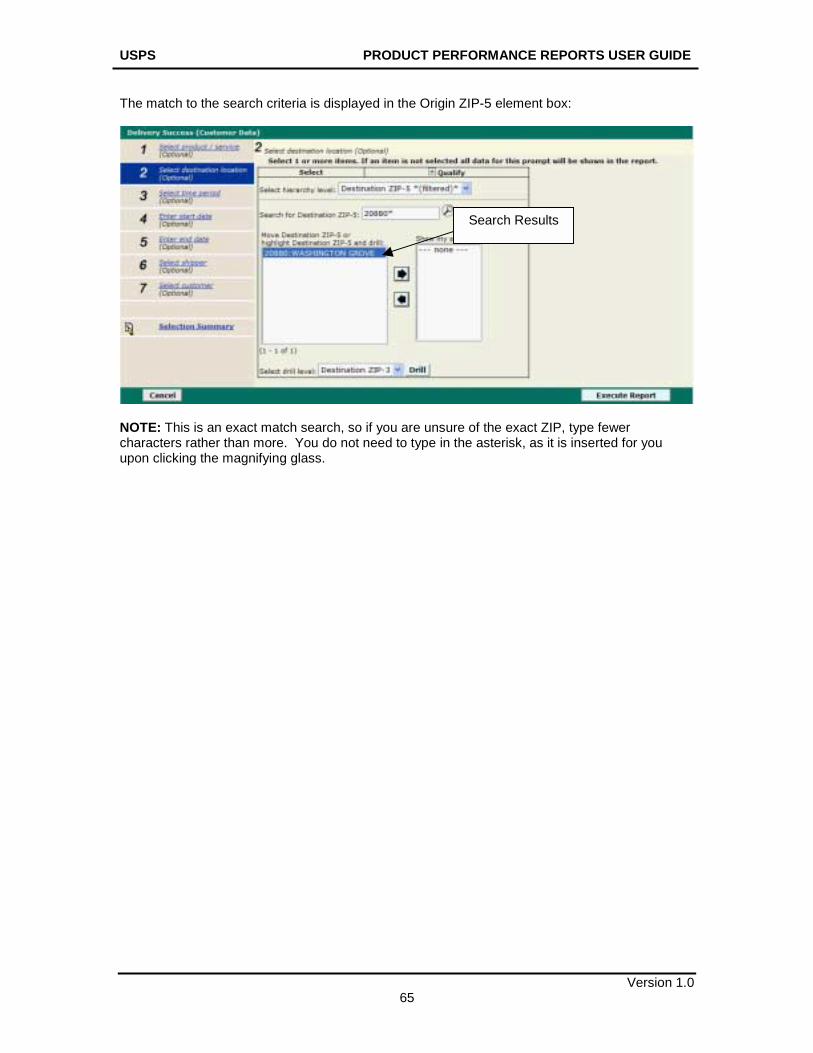
The match to the search criteria is displayed in the Origin ZIP-5 element box:
NOTE: This is an exact match search, so if you are unsure of the exact ZIP, type fewer characters rather than more. You do not need to type in the asterisk, as it is inserted for you upon clicking the magnifying glass.
Search Results
USPS PRODUCT PERFORMANCE REPORTS USER GUIDE
Version 1.0 66
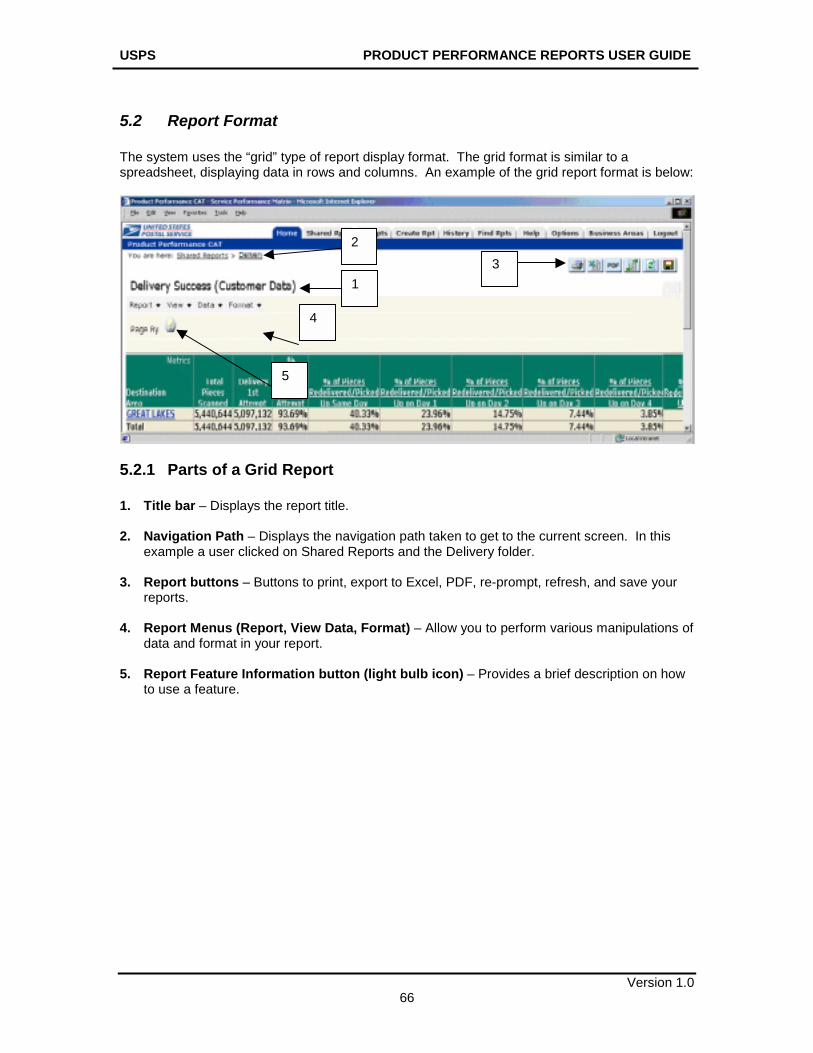
5.2 Report Format The system uses the “grid” type of report display format. The grid format is similar to a spreadsheet, displaying data in rows and columns. An example of the grid report format is below:
5.2.1 Parts of a Grid Report 1. Title bar – Displays the report title. 2. Navigation Path – Displays the navigation path taken to get to the current screen. In this
example a user clicked on Shared Reports and the Delivery folder. 3. Report buttons – Buttons to print, export to Excel, PDF, re-prompt, refresh, and save your
reports. 4. Report Menus (Report, View Data, Format) – Allow you to perform various manipulations of
data and format in your report. 5. Report Feature Information button (light bulb icon) – Provides a brief description on how
to use a feature.
1 3
4
5
2
USPS PRODUCT PERFORMANCE REPORTS USER GUIDE
Version 1.0 67
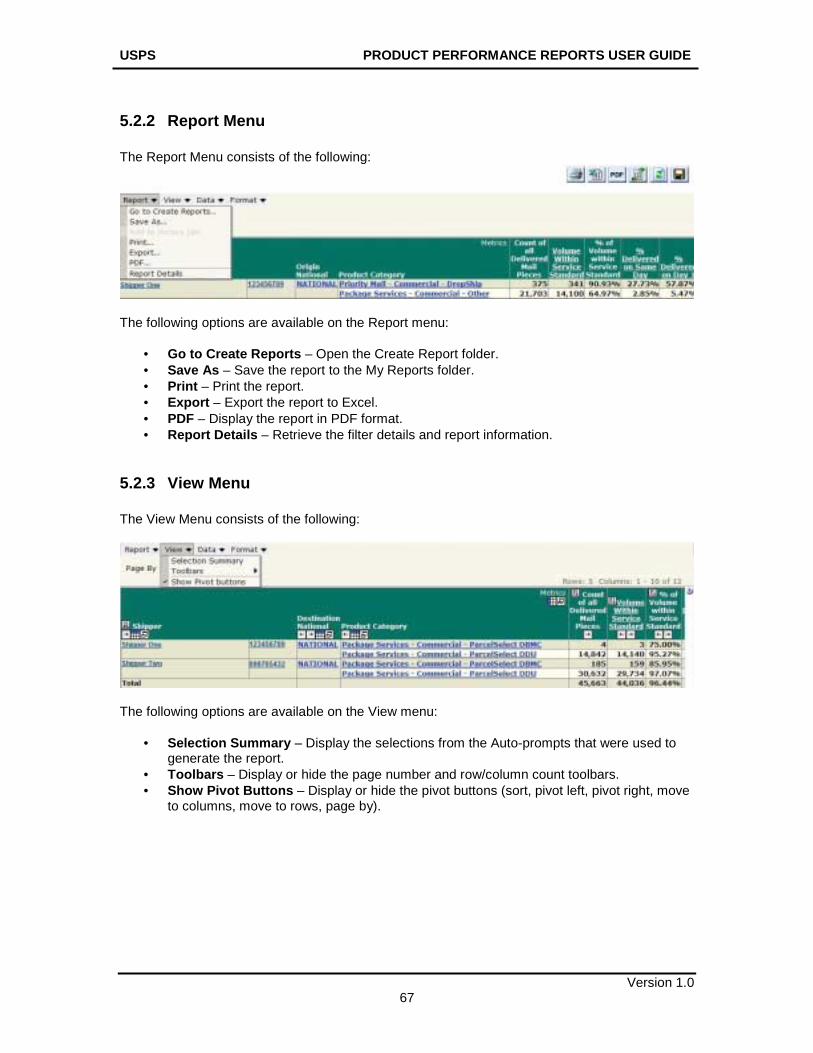
5.2.2 Report Menu The Report Menu consists of the following:
The following options are available on the Report menu:
• Go to Create Reports – Open the Create Report folder. • Save As – Save the report to the My Reports folder. • Print – Print the report. • Export – Export the report to Excel. • PDF – Display the report in PDF format. • Report Details – Retrieve the filter details and report information.
5.2.3 View Menu The View Menu consists of the following:
The following options are available on the View menu:
• Selection Summary – Display the selections from the Auto-prompts that were used to generate the report.
• Toolbars – Display or hide the page number and row/column count toolbars. • Show Pivot Buttons – Display or hide the pivot buttons (sort, pivot left, pivot right, move
to columns, move to rows, page by).
USPS PRODUCT PERFORMANCE REPORTS USER GUIDE
Version 1.0 68
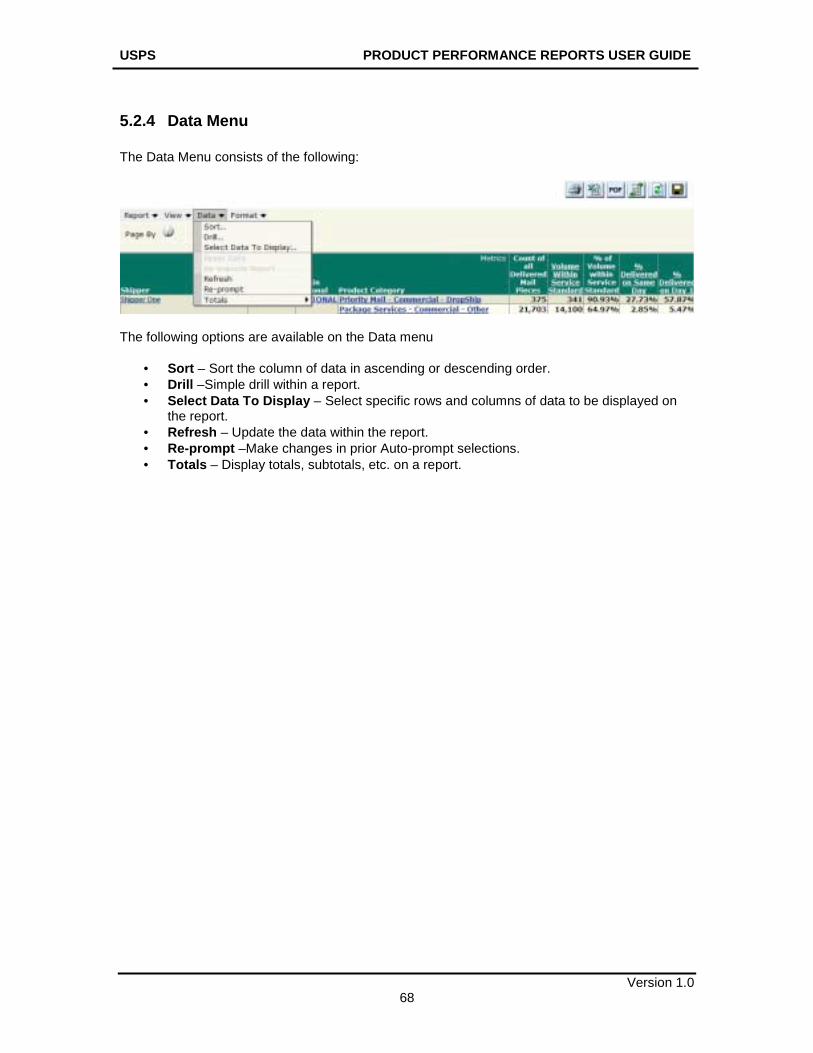
5.2.4 Data Menu The Data Menu consists of the following:
The following options are available on the Data menu
• Sort – Sort the column of data in ascending or descending order. • Drill –Simple drill within a report. • Select Data To Display – Select specific rows and columns of data to be displayed on
the report. • Refresh – Update the data within the report. • Re-prompt –Make changes in prior Auto-prompt selections. • Totals – Display totals, subtotals, etc. on a report.
USPS PRODUCT PERFORMANCE REPORTS USER GUIDE
Version 1.0 69
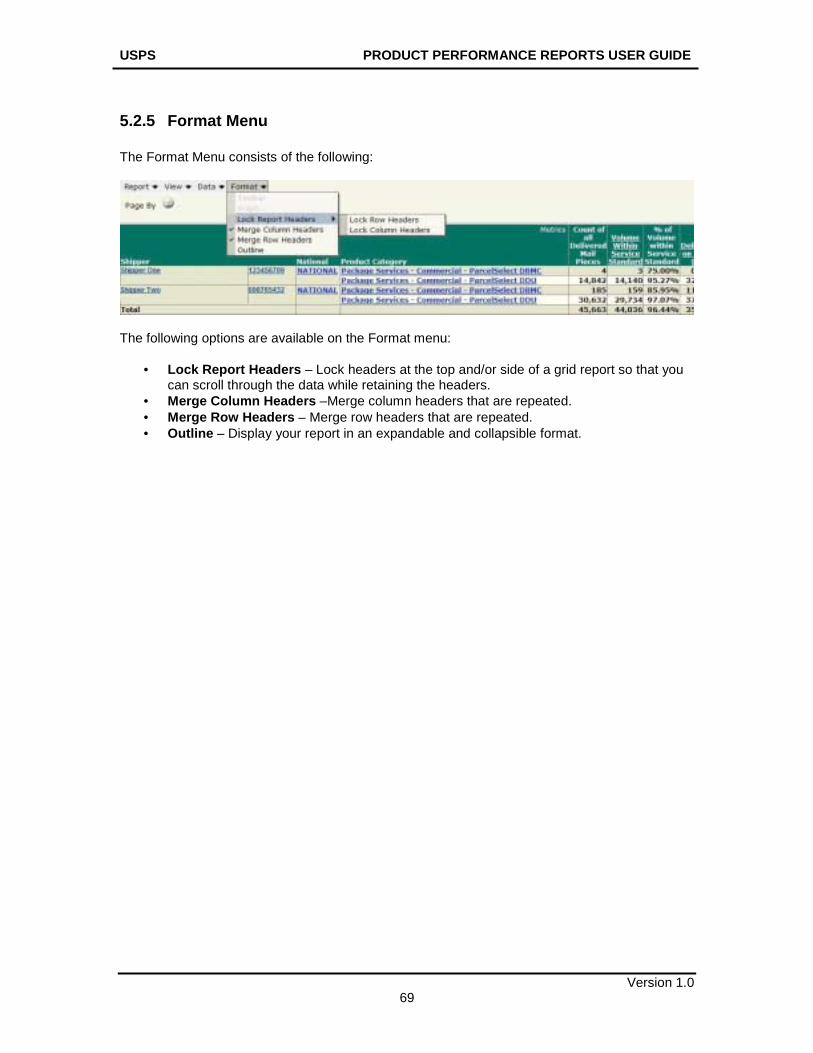
5.2.5 Format Menu The Format Menu consists of the following:
The following options are available on the Format menu:
• Lock Report Headers – Lock headers at the top and/or side of a grid report so that you can scroll through the data while retaining the headers.
• Merge Column Headers –Merge column headers that are repeated. • Merge Row Headers – Merge row headers that are repeated. • Outline – Display your report in an expandable and collapsible format.
USPS PRODUCT PERFORMANCE REPORTS USER GUIDE
Version 1.0 70
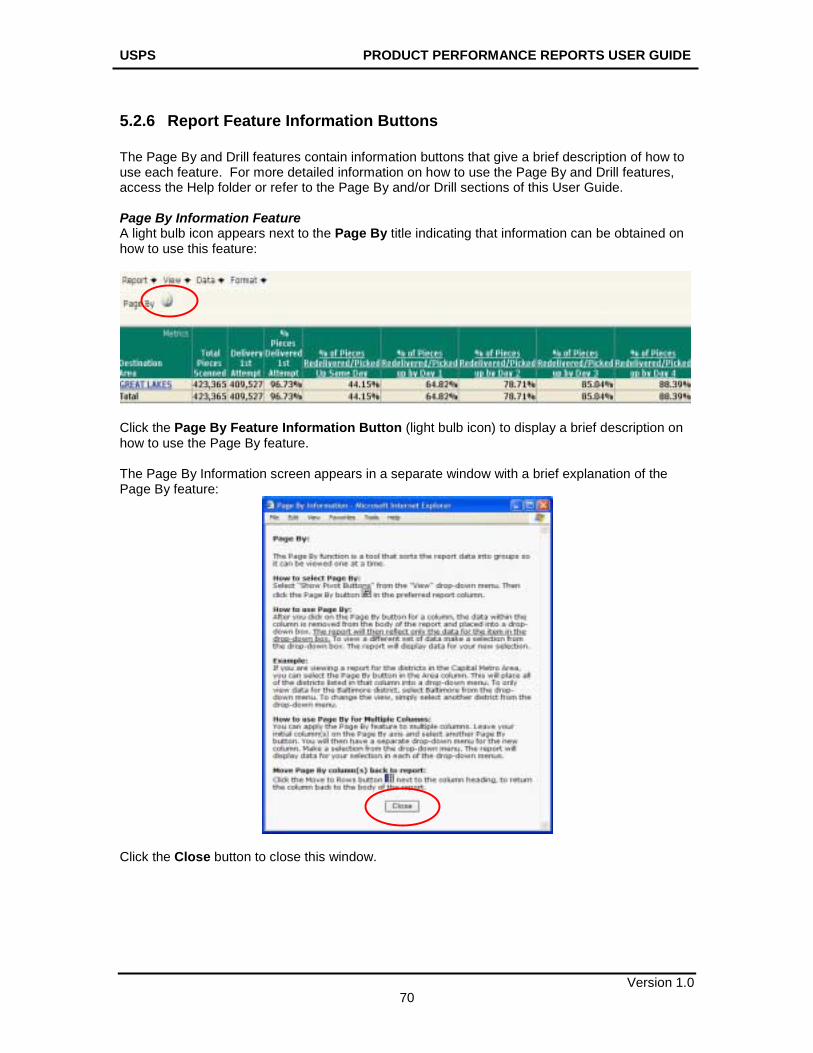
5.2.6 Report Feature Information Buttons The Page By and Drill features contain information buttons that give a brief description of how to use each feature. For more detailed information on how to use the Page By and Drill features, access the Help folder or refer to the Page By and/or Drill sections of this User Guide. Page By Information Feature A light bulb icon appears next to the Page By title indicating that information can be obtained on how to use this feature:
Click the Page By Feature Information Button (light bulb icon) to display a brief description on how to use the Page By feature. The Page By Information screen appears in a separate window with a brief explanation of the Page By feature:
Click the Close button to close this window.
USPS PRODUCT PERFORMANCE REPORTS USER GUIDE
Version 1.0 71
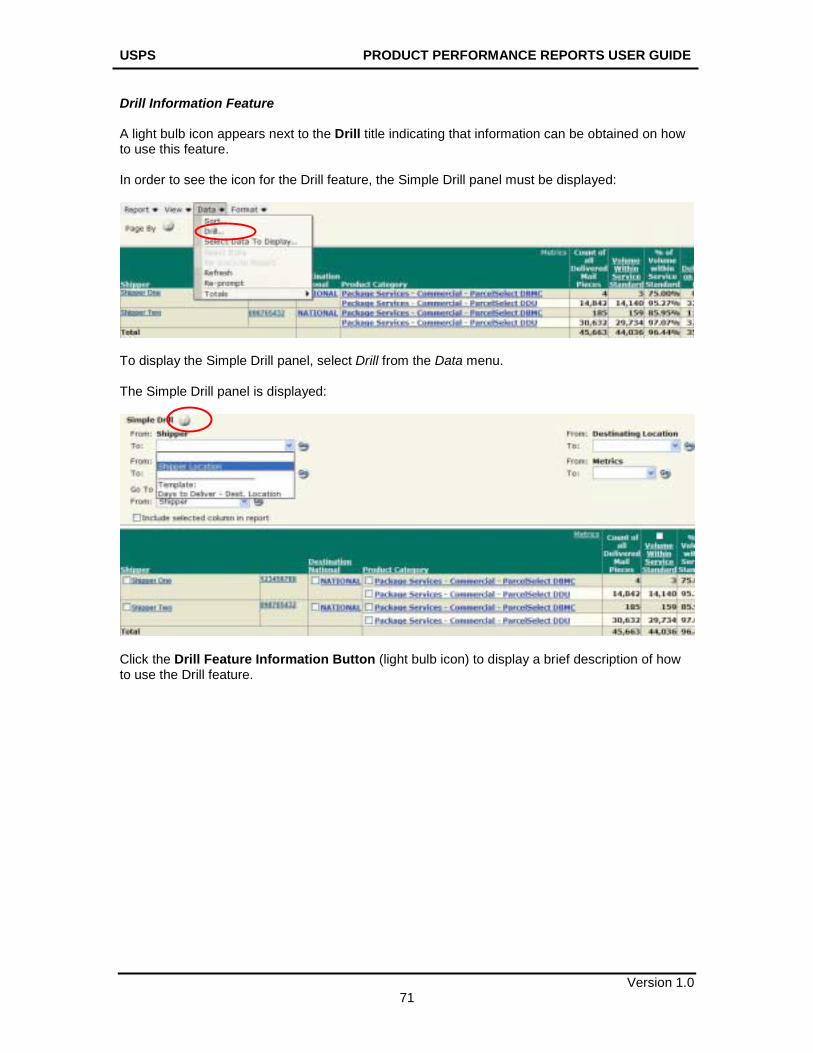
Drill Information Feature A light bulb icon appears next to the Drill title indicating that information can be obtained on how to use this feature. In order to see the icon for the Drill feature, the Simple Drill panel must be displayed:
To display the Simple Drill panel, select Drill from the Data menu. The Simple Drill panel is displayed:
Click the Drill Feature Information Button (light bulb icon) to display a brief description of how to use the Drill feature.
USPS PRODUCT PERFORMANCE REPORTS USER GUIDE
Version 1.0 72
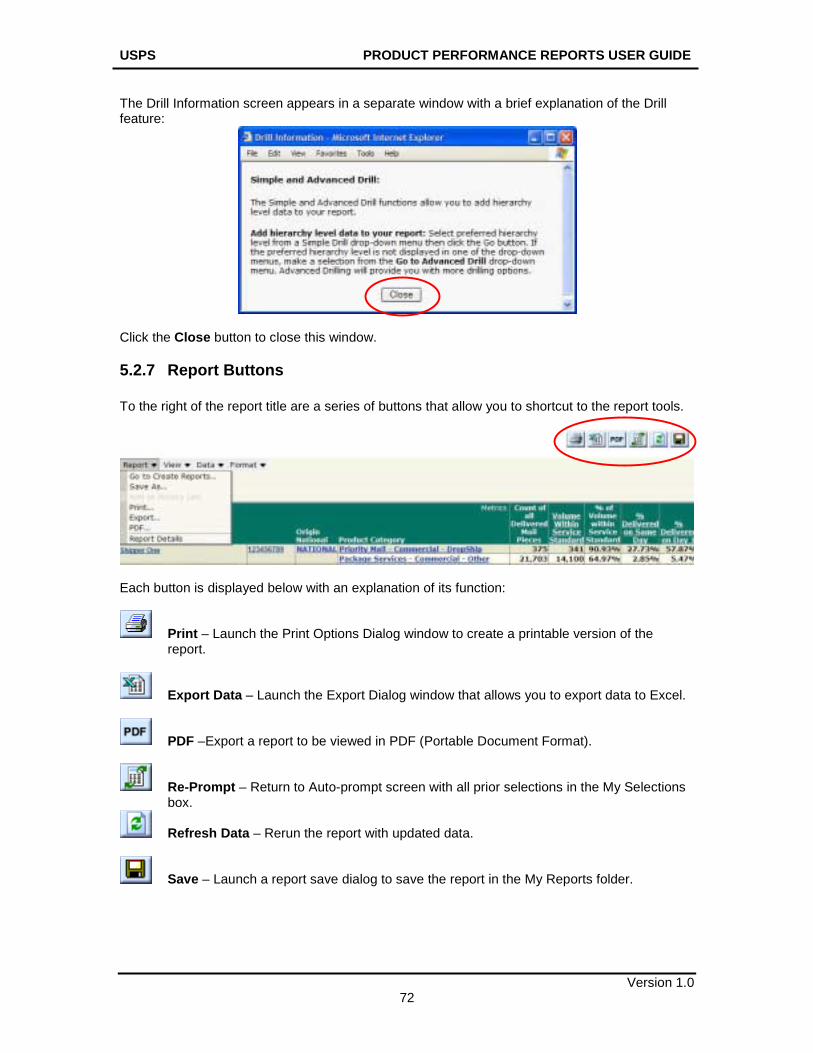
The Drill Information screen appears in a separate window with a brief explanation of the Drill feature:
Click the Close button to close this window.
5.2.7 Report Buttons To the right of the report title are a series of buttons that allow you to shortcut to the report tools.
Each button is displayed below with an explanation of its function:
Print – Launch the Print Options Dialog window to create a printable version of the report.
Export Data – Launch the Export Dialog window that allows you to export data to Excel.
PDF –Export a report to be viewed in PDF (Portable Document Format).
Re-Prompt – Return to Auto-prompt screen with all prior selections in the My Selections box.
Refresh Data – Rerun the report with updated data.
Save – Launch a report save dialog to save the report in the My Reports folder.
USPS PRODUCT PERFORMANCE REPORTS USER GUIDE
Version 1.0 73
6.0 Customizing Product Performance Reports
6.1 Customizing Report Format After generating your reports, you can use the following MicroStrategy reporting features to customize the layout of your Product Performance Reports.
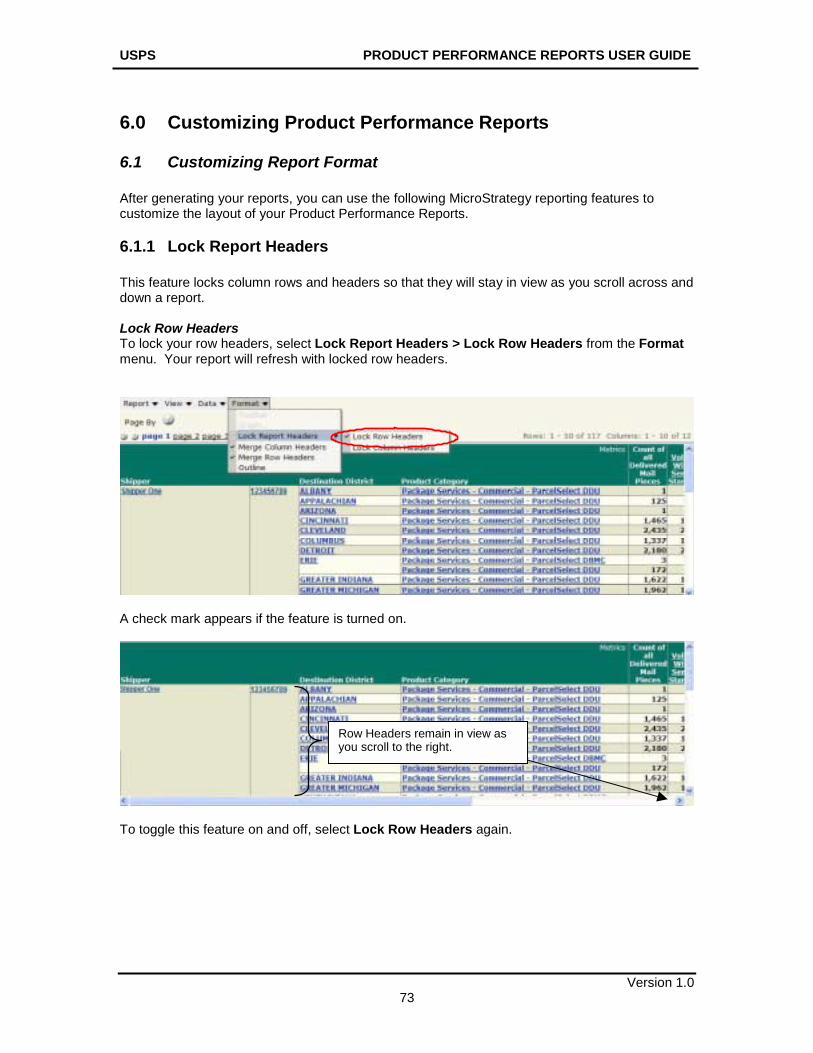
6.1.1 Lock Report Headers This feature locks column rows and headers so that they will stay in view as you scroll across and down a report. Lock Row Headers To lock your row headers, select Lock Report Headers > Lock Row Headers from the Format menu. Your report will refresh with locked row headers.
A check mark appears if the feature is turned on.
To toggle this feature on and off, select Lock Row Headers again.
Row Headers remain in view as you scroll to the right.
USPS PRODUCT PERFORMANCE REPORTS USER GUIDE
Version 1.0 74
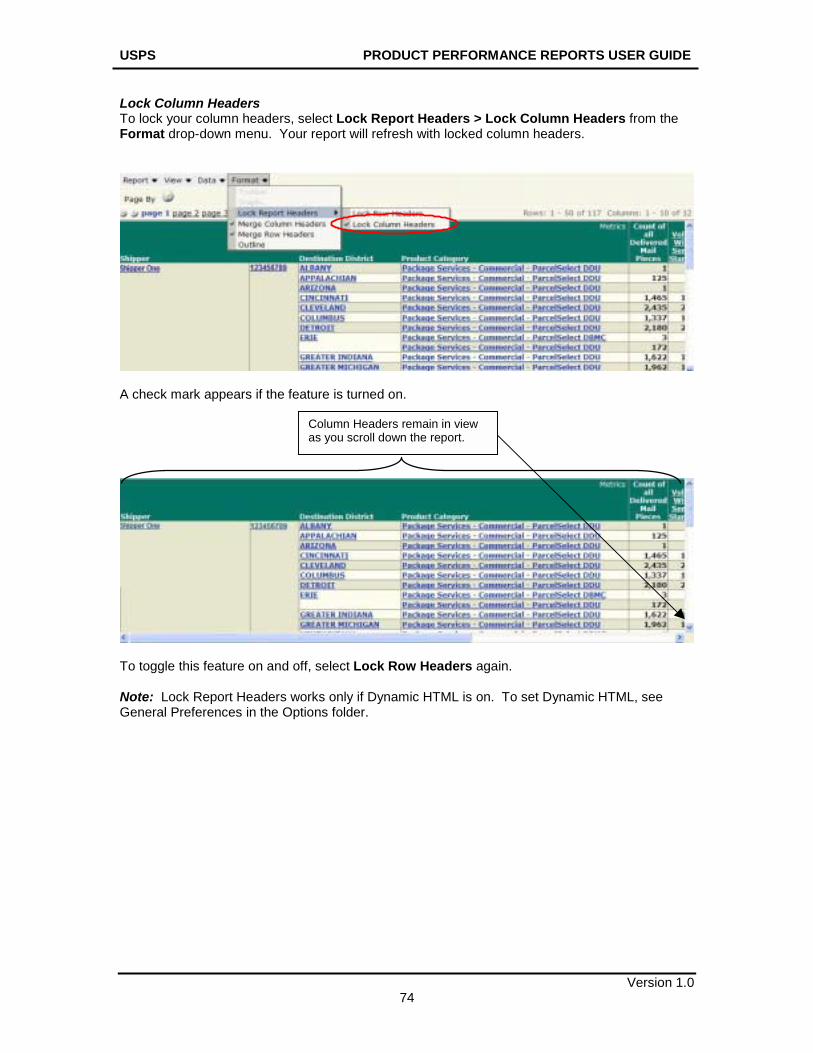
Lock Column Headers To lock your column headers, select Lock Report Headers > Lock Column Headers from the Format drop-down menu. Your report will refresh with locked column headers.
A check mark appears if the feature is turned on.
To toggle this feature on and off, select Lock Row Headers again. Note: Lock Report Headers works only if Dynamic HTML is on. To set Dynamic HTML, see General Preferences in the Options folder.
Column Headers remain in view as you scroll down the report.
USPS PRODUCT PERFORMANCE REPORTS USER GUIDE
Version 1.0 75
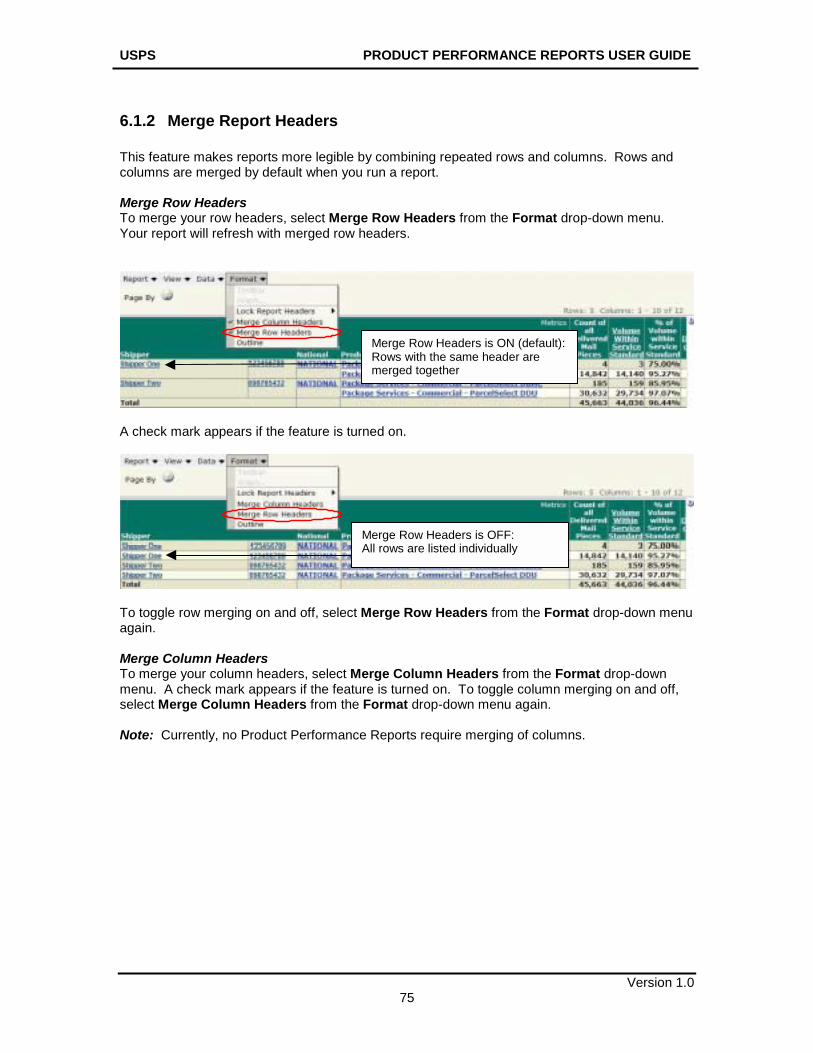
6.1.2 Merge Report Headers This feature makes reports more legible by combining repeated rows and columns. Rows and columns are merged by default when you run a report. Merge Row Headers To merge your row headers, select Merge Row Headers from the Format drop-down menu. Your report will refresh with merged row headers.
A check mark appears if the feature is turned on.
To toggle row merging on and off, select Merge Row Headers from the Format drop-down menu again. Merge Column Headers To merge your column headers, select Merge Column Headers from the Format drop-down menu. A check mark appears if the feature is turned on. To toggle column merging on and off, select Merge Column Headers from the Format drop-down menu again. Note: Currently, no Product Performance Reports require merging of columns.
Merge Row Headers is ON (default):Rows with the same header are merged together
Merge Row Headers is OFF: All rows are listed individually
USPS PRODUCT PERFORMANCE REPORTS USER GUIDE
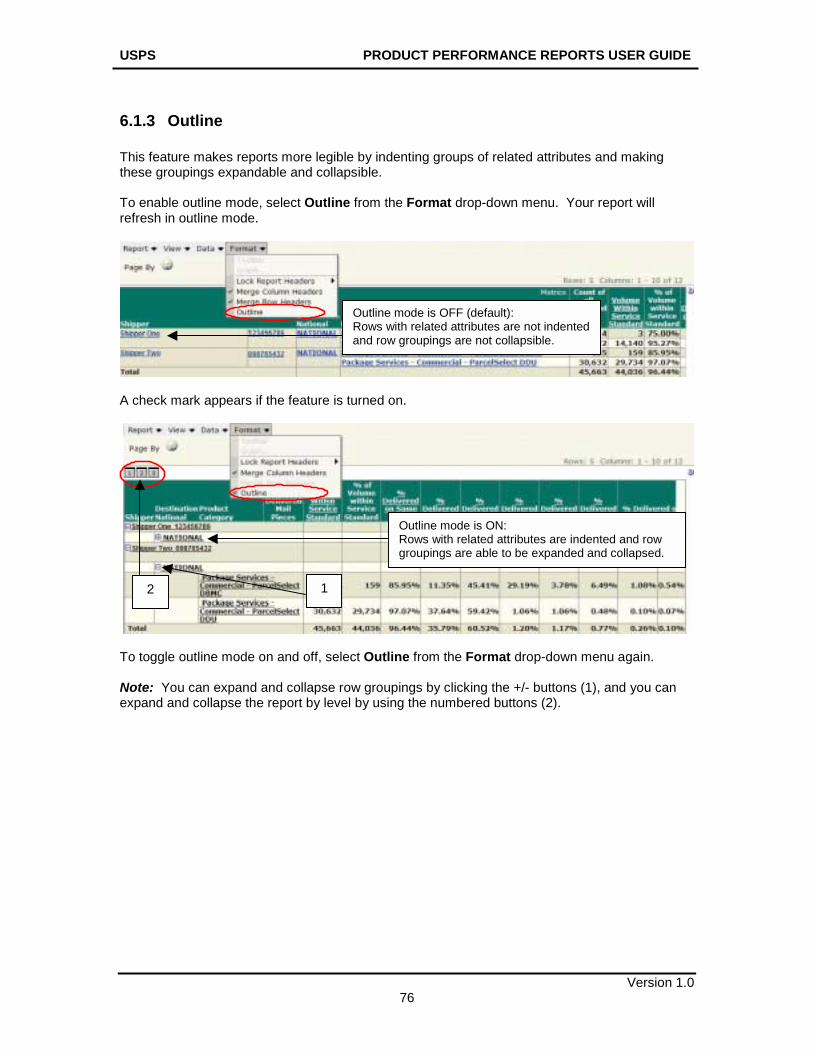
6.1.3 Outline This feature makes reports more legible by indenting groups of related attributes and making these groupings expandable and collapsible. To enable outline mode, select Outline from the Format drop-down menu. Your report will refresh in outline mode.
A check mark appears if the feature is
To toggle outline mode on and off, sele Note: You can expand and collapse roexpand and collapse the report by leve
12
Outline mode is OFF (default): Rows with related attributes are not indented and row groupings are not collapsible.
turned on.
ct Outli
w groupl by usin
Outline mode is ON: Rows with related attributes are indented and row groupings are able to be expanded and collapsed.
Version 1.0 76
ne from the Format drop-down menu again.
ings by clicking the +/- buttons (1), and you can g the numbered buttons (2).
USPS PRODUCT PERFORMANCE REPORTS USER GUIDE
Version 1.0 77
6.2 Customize Report Data In addition to using MicroStrategy features to customize your report format, you can also use them to customize your report data. Using the features described below, you can manipulate the data and tailor your report to your needs.
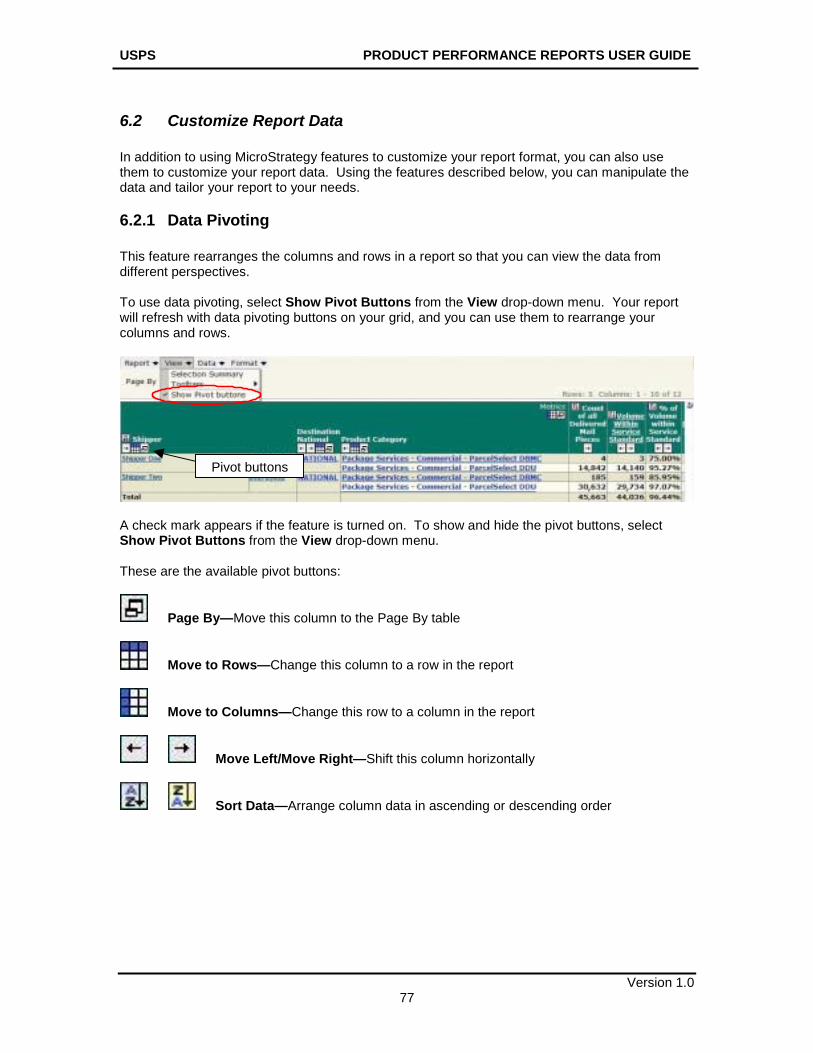
6.2.1 Data Pivoting This feature rearranges the columns and rows in a report so that you can view the data from different perspectives. To use data pivoting, select Show Pivot Buttons from the View drop-down menu. Your report will refresh with data pivoting buttons on your grid, and you can use them to rearrange your columns and rows.
A check mark appears if the feature is turned on. To show and hide the pivot buttons, select Show Pivot Buttons from the View drop-down menu. These are the available pivot buttons:
Page By—Move this column to the Page By table
Move to Rows—Change this column to a row in the report
Move to Columns—Change this row to a column in the report
Move Left/Move Right—Shift this column horizontally
Sort Data—Arrange column data in ascending or descending order
Pivot buttons
USPS PRODUCT PERFORMANCE REPORTS USER GUIDE
Version 1.0 78
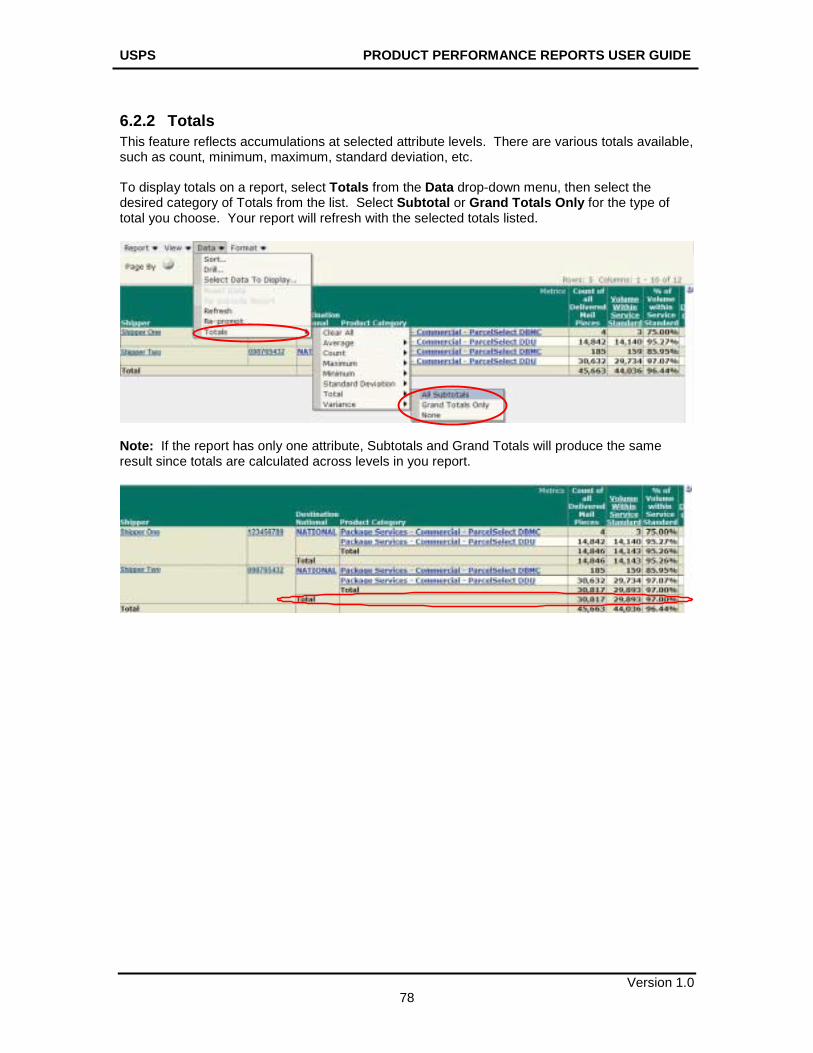
6.2.2 Totals This feature reflects accumulations at selected attribute levels. There are various totals available, such as count, minimum, maximum, standard deviation, etc. To display totals on a report, select Totals from the Data drop-down menu, then select the desired category of Totals from the list. Select Subtotal or Grand Totals Only for the type of total you choose. Your report will refresh with the selected totals listed.
Note: If the report has only one attribute, Subtotals and Grand Totals will produce the same result since totals are calculated across levels in you report.

USPS PRODUCT PERFORMANCE REPORTS USER GUIDE
Version 1.0 79
6.2.3 Page By This feature selects and displays subsets of your data as separate pages. This feature is most useful for extremely long reports. To create page-by fields on a report, drag and drop the header(s) of the column(s) by which you want to separate your pages into the Page By panel. The following example shows how to view only the metrics for which the Great Lakes Area was the destination on a Service Performance Matrix report:
1. Drag and drop the Metrics header into the Page By panel. The Metrics drop-down menu
appears in the Page by panel:
2. Select % of Volume within Service Standard from the Metrics drop-down menu. 3. Click Go. Your report will display only the % of Volume within Service Standard.
1
2
3
USPS PRODUCT PERFORMANCE REPORTS USER GUIDE
Version 1.0 80
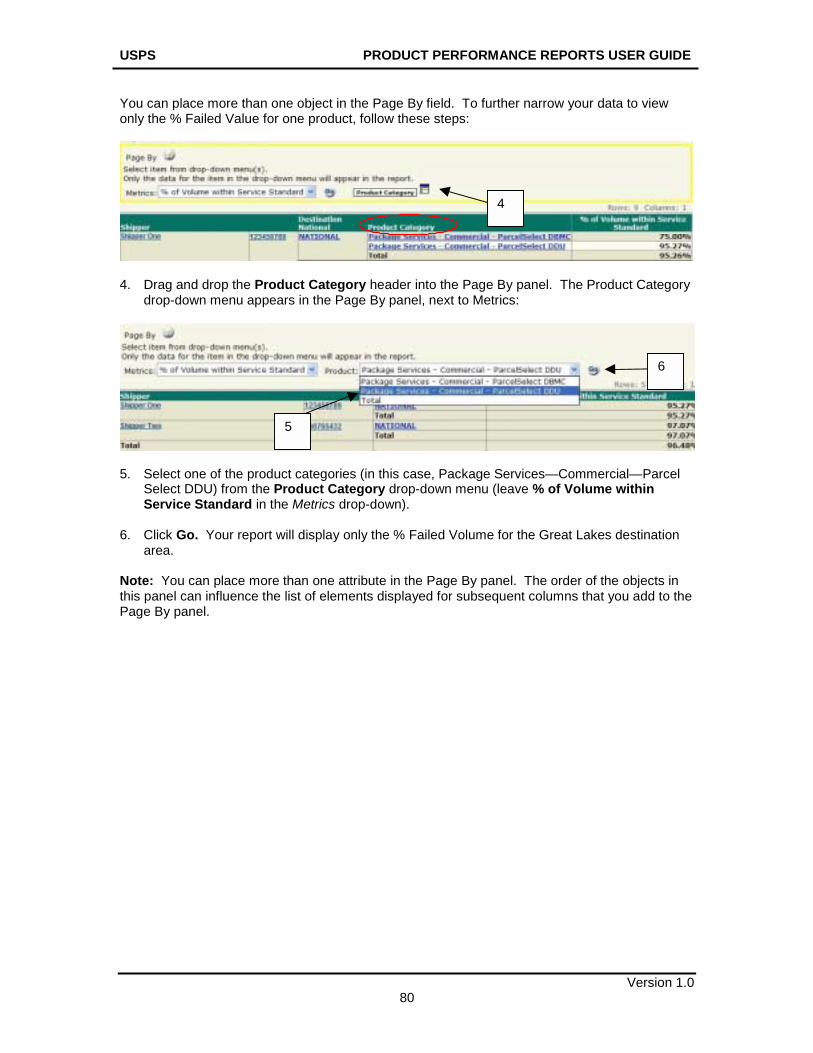
You can place more than one object in the Page By field. To further narrow your data to view only the % Failed Value for one product, follow these steps:
4. Drag and drop the Product Category header into the Page By panel. The Product Category
drop-down menu appears in the Page By panel, next to Metrics:
5. Select one of the product categories (in this case, Package Services—Commercial—Parcel
Select DDU) from the Product Category drop-down menu (leave % of Volume within Service Standard in the Metrics drop-down).
6. Click Go. Your report will display only the % Failed Volume for the Great Lakes destination
area. Note: You can place more than one attribute in the Page By panel. The order of the objects in this panel can influence the list of elements displayed for subsequent columns that you add to the Page By panel.
5
6
4
USPS PRODUCT PERFORMANCE REPORTS USER GUIDE
Version 1.0 81
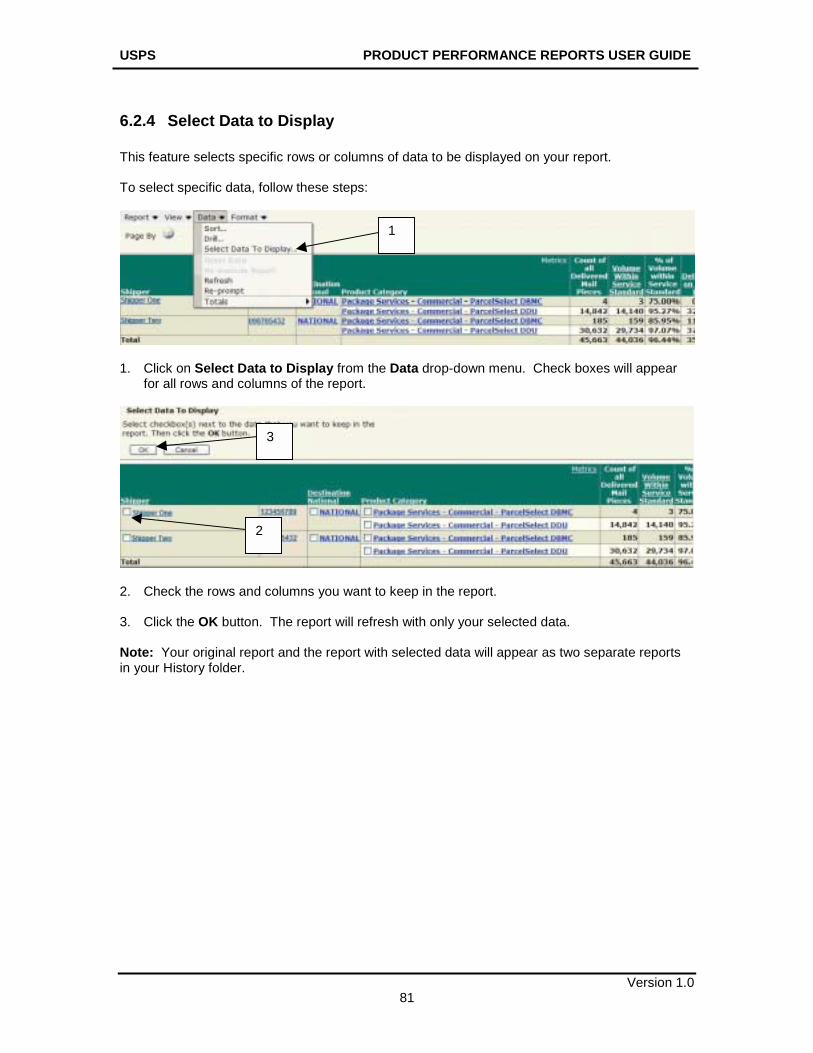
6.2.4 Select Data to Display This feature selects specific rows or columns of data to be displayed on your report. To select specific data, follow these steps:
1. Click on Select Data to Display from the Data drop-down menu. Check boxes will appear
for all rows and columns of the report.
2. Check the rows and columns you want to keep in the report. 3. Click the OK button. The report will refresh with only your selected data. Note: Your original report and the report with selected data will appear as two separate reports in your History folder.
2
3
1

USPS PRODUCT PERFORMANCE REPORTS USER GUIDE
Version 1.0 82
6.2.5 Sorting This feature sorts data in ascending or descending order. To sort your data, follow these steps:
1. Select Sort from the Data drop-down menu. The Sort panel will display.
2. In the Sort panel, select your desired sorting attributes from the Sort By drop-down menu. 3. Select the Ascending or Descending radio button for the given attribute. 4. If necessary, repeat this process for the Then By fields. 5. Click OK. Quick Sort Quick-sort columns by right-clicking on the header and selecting Sort > Ascending or Descending:
5
3
2
1
4
USPS PRODUCT PERFORMANCE REPORTS USER GUIDE
Version 1.0 83
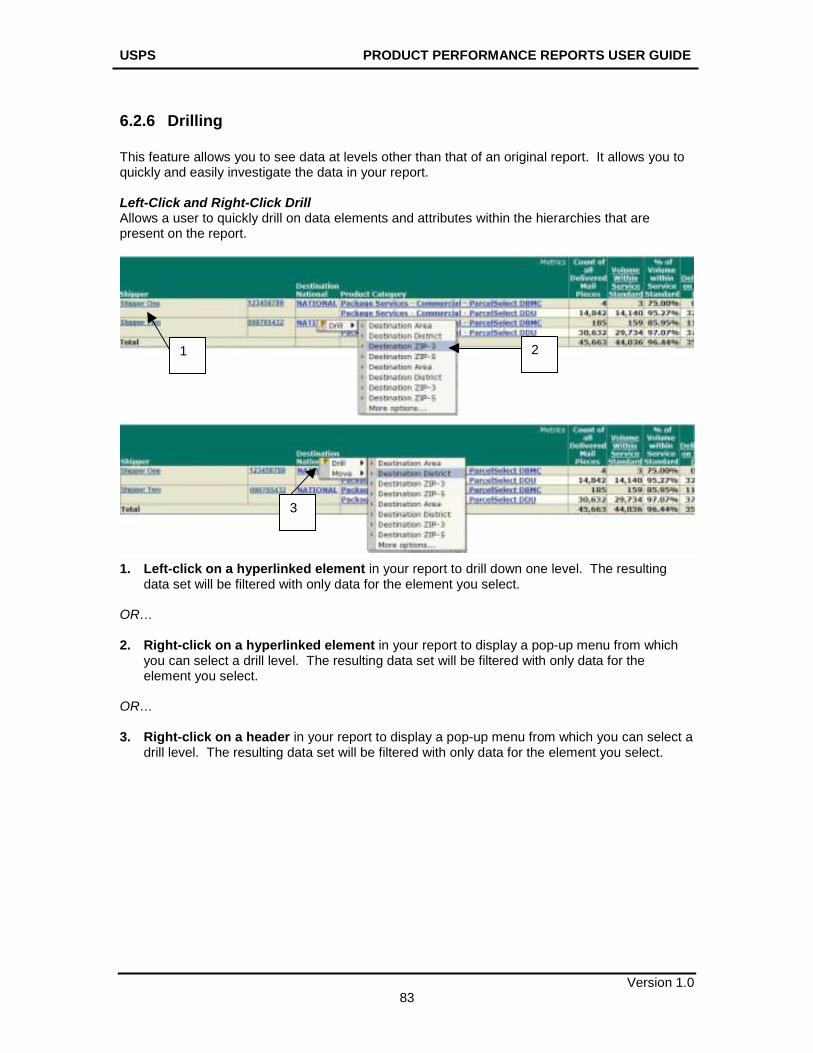
6.2.6 Drilling This feature allows you to see data at levels other than that of an original report. It allows you to quickly and easily investigate the data in your report. Left-Click and Right-Click Drill Allows a user to quickly drill on data elements and attributes within the hierarchies that are present on the report.
1. Left-click on a hyperlinked element in your report to drill down one level. The resulting
data set will be filtered with only data for the element you select. OR… 2. Right-click on a hyperlinked element in your report to display a pop-up menu from which
you can select a drill level. The resulting data set will be filtered with only data for the element you select.
OR… 3. Right-click on a header in your report to display a pop-up menu from which you can select a
drill level. The resulting data set will be filtered with only data for the element you select.
1 2
3
USPS PRODUCT PERFORMANCE REPORTS USER GUIDE
Version 1.0 84
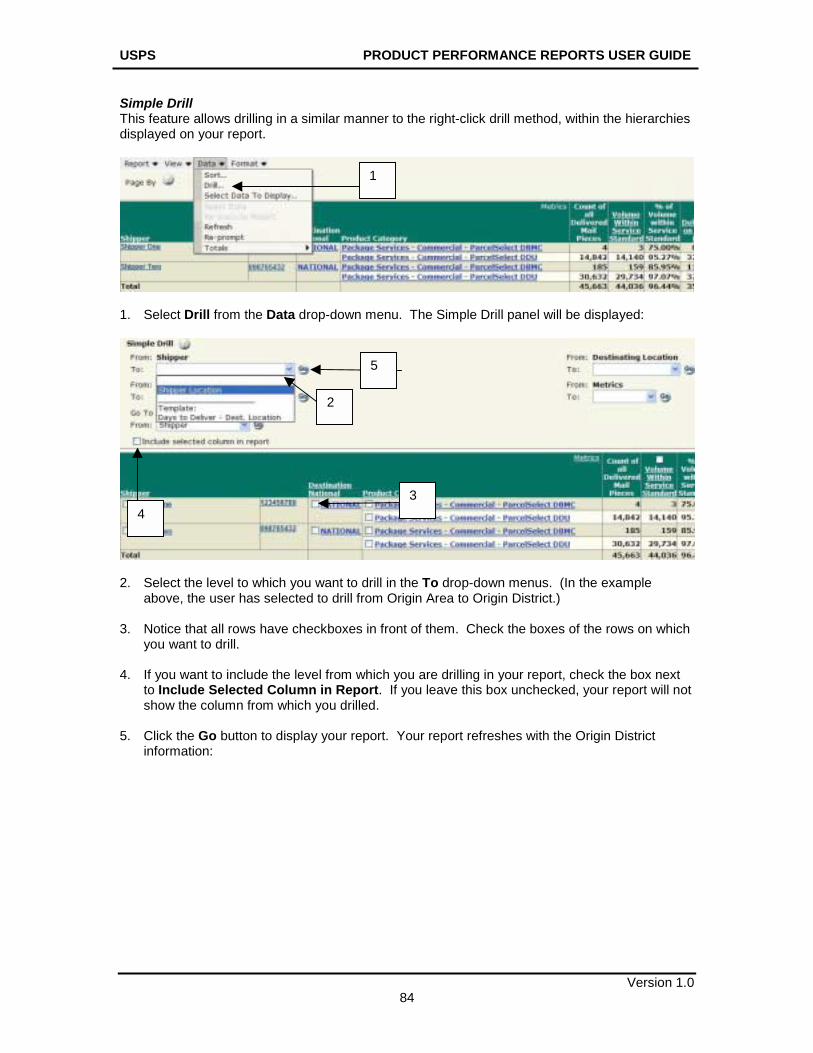
Simple Drill This feature allows drilling in a similar manner to the right-click drill method, within the hierarchies displayed on your report.
1. Select Drill from the Data drop-down menu. The Simple Drill panel will be displayed:
2. Select the level to which you want to drill in the To drop-down menus. (In the example
above, the user has selected to drill from Origin Area to Origin District.) 3. Notice that all rows have checkboxes in front of them. Check the boxes of the rows on which
you want to drill. 4. If you want to include the level from which you are drilling in your report, check the box next
to Include Selected Column in Report. If you leave this box unchecked, your report will not show the column from which you drilled.
5. Click the Go button to display your report. Your report refreshes with the Origin District
information:
1
3
2
4
5
USPS PRODUCT PERFORMANCE REPORTS USER GUIDE
Version 1.0 85
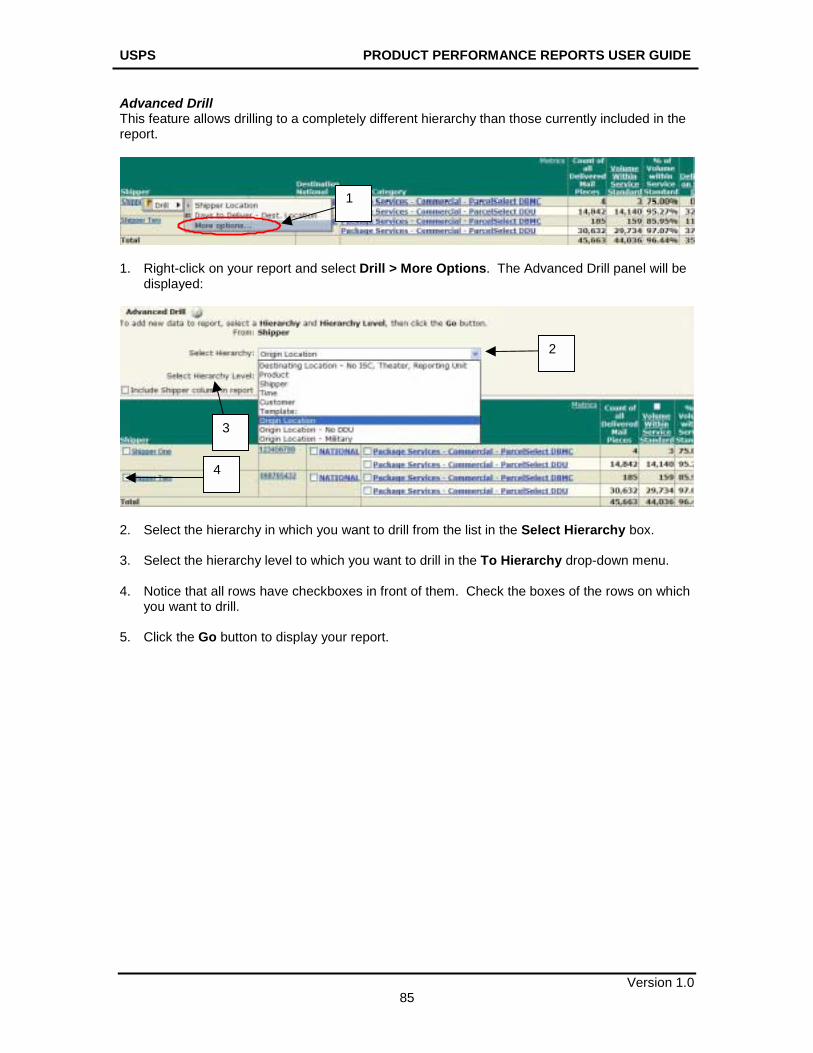
Advanced Drill This feature allows drilling to a completely different hierarchy than those currently included in the report.
1. Right-click on your report and select Drill > More Options. The Advanced Drill panel will be
displayed:
2. Select the hierarchy in which you want to drill from the list in the Select Hierarchy box. 3. Select the hierarchy level to which you want to drill in the To Hierarchy drop-down menu. 4. Notice that all rows have checkboxes in front of them. Check the boxes of the rows on which
you want to drill. 5. Click the Go button to display your report.
4
3
2
1
USPS PRODUCT PERFORMANCE REPORTS USER GUIDE
Version 1.0 86
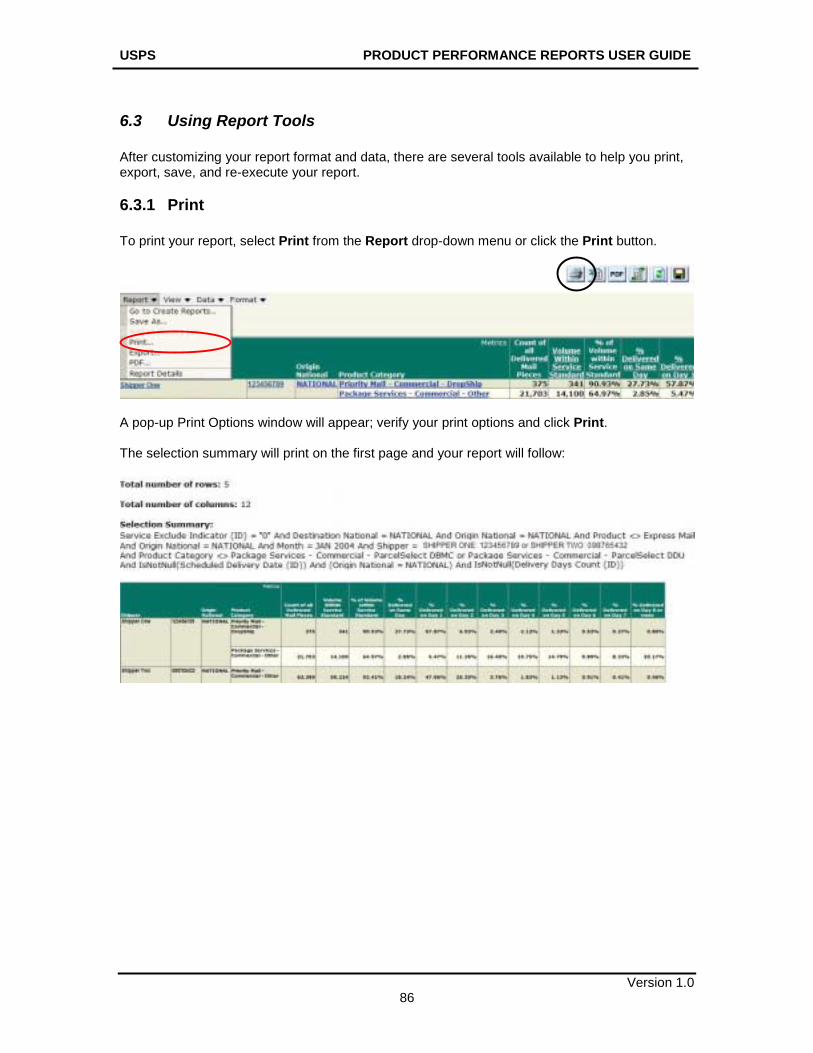
6.3 Using Report Tools After customizing your report format and data, there are several tools available to help you print, export, save, and re-execute your report.
6.3.1 Print To print your report, select Print from the Report drop-down menu or click the Print button.
A pop-up Print Options window will appear; verify your print options and click Print. The selection summary will print on the first page and your report will follow:
USPS PRODUCT PERFORMANCE REPORTS USER GUIDE
Version 1.0 87
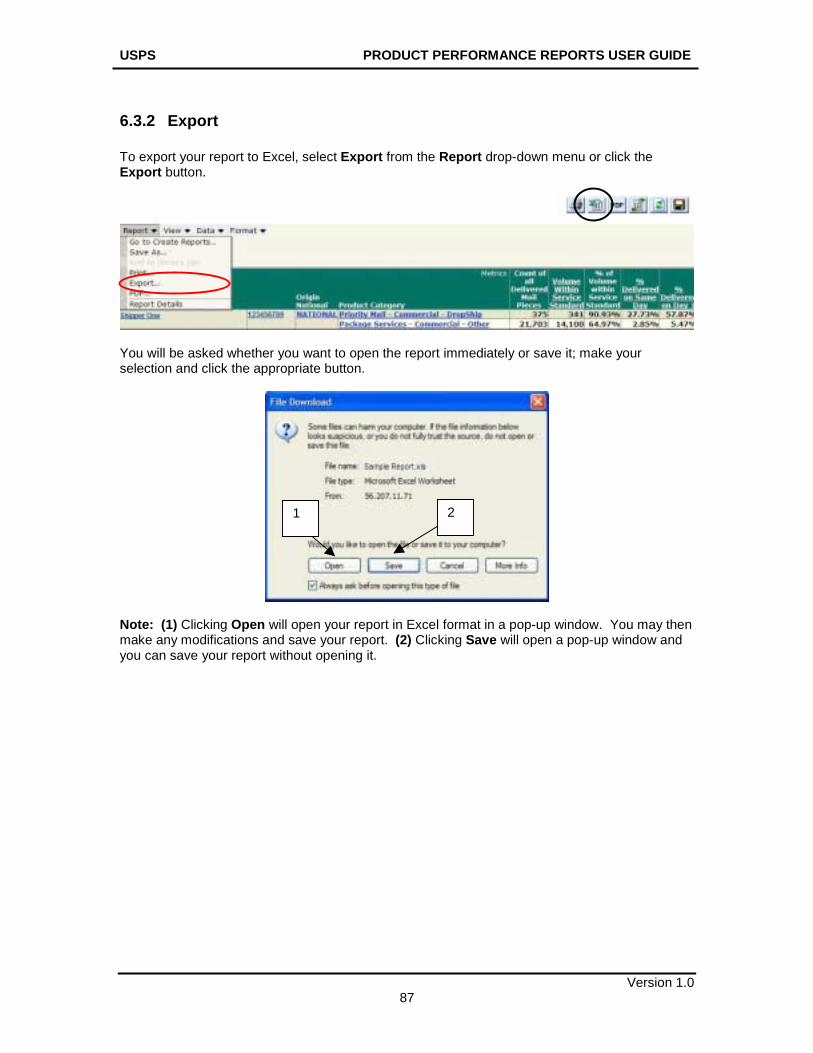
6.3.2 Export To export your report to Excel, select Export from the Report drop-down menu or click the Export button.
You will be asked whether you want to open the report immediately or save it; make your selection and click the appropriate button.
Note: (1) Clicking Open will open your report in Excel format in a pop-up window. You may then make any modifications and save your report. (2) Clicking Save will open a pop-up window and you can save your report without opening it.
2 1
USPS PRODUCT PERFORMANCE REPORTS USER GUIDE
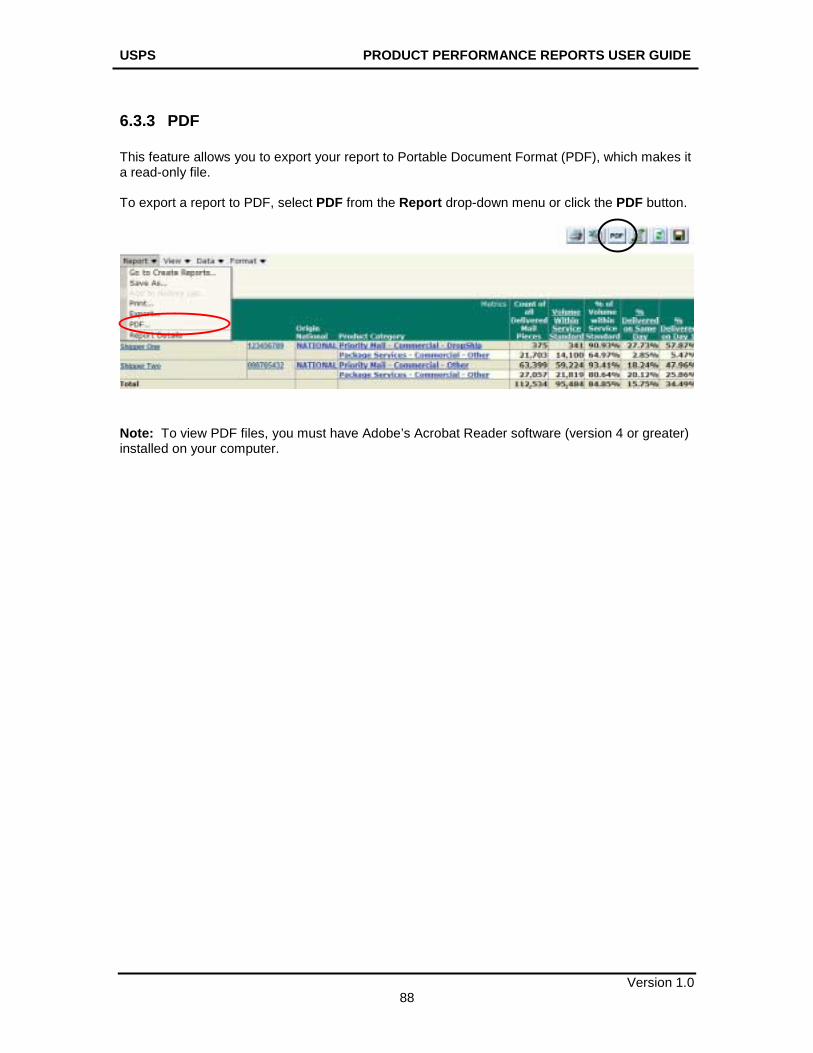
Version 1.0 88
6.3.3 PDF This feature allows you to export your report to Portable Document Format (PDF), which makes it a read-only file. To export a report to PDF, select PDF from the Report drop-down menu or click the PDF button.
Note: To view PDF files, you must have Adobe’s Acrobat Reader software (version 4 or greater) installed on your computer.
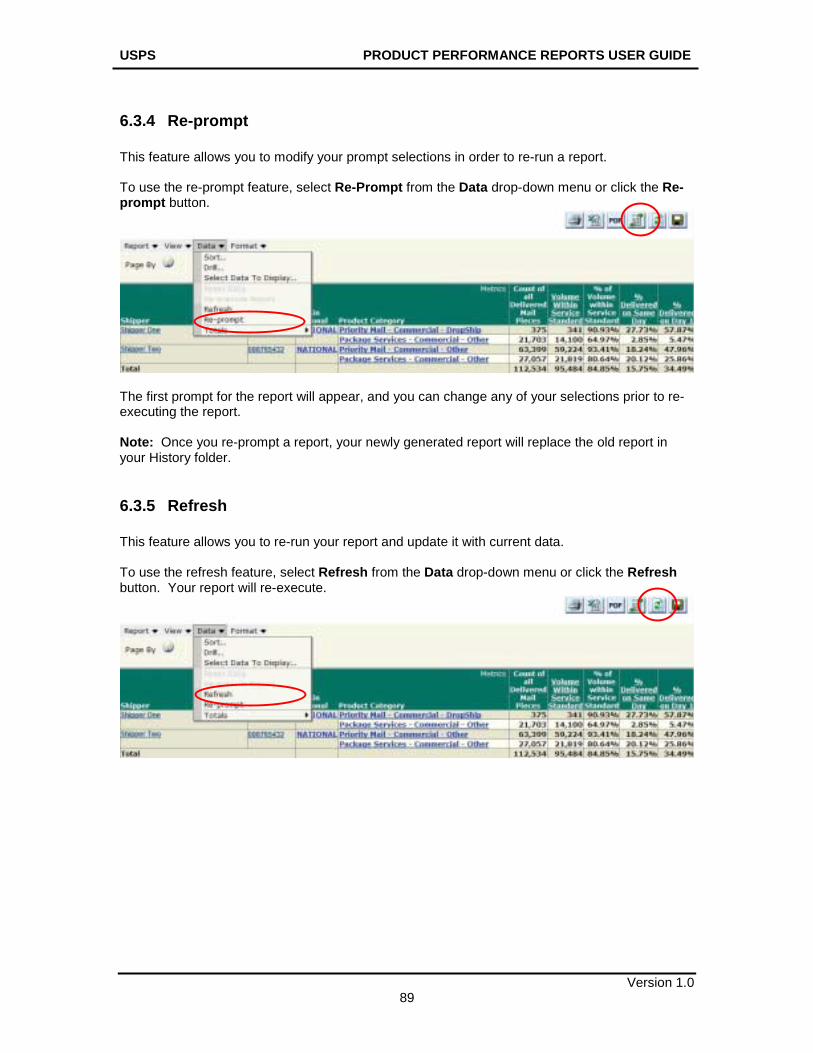
USPS PRODUCT PERFORMANCE REPORTS USER GUIDE
Version 1.0 89
6.3.4 Re-prompt This feature allows you to modify your prompt selections in order to re-run a report. To use the re-prompt feature, select Re-Prompt from the Data drop-down menu or click the Re-prompt button.
The first prompt for the report will appear, and you can change any of your selections prior to re-executing the report. Note: Once you re-prompt a report, your newly generated report will replace the old report in your History folder.
6.3.5 Refresh This feature allows you to re-run your report and update it with current data. To use the refresh feature, select Refresh from the Data drop-down menu or click the Refresh button. Your report will re-execute.
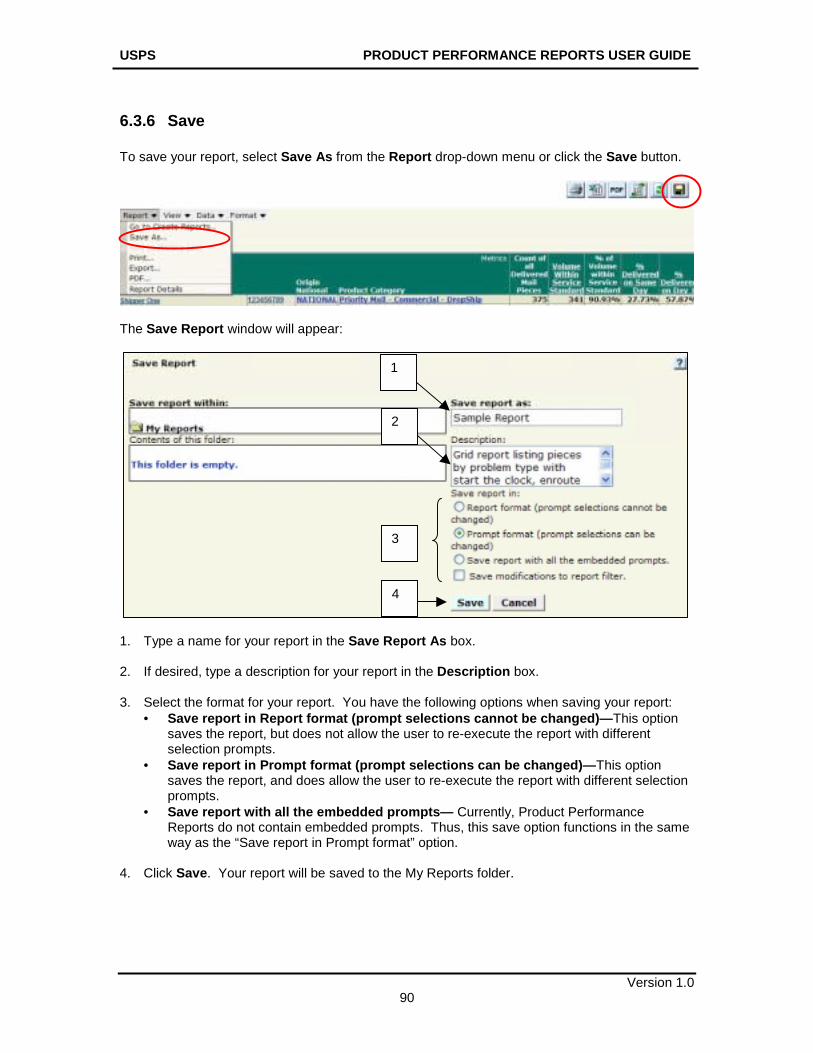
USPS PRODUCT PERFORMANCE REPORTS USER GUIDE
Version 1.0 90
6.3.6 Save To save your report, select Save As from the Report drop-down menu or click the Save button.
The Save Report window will appear:
1. Type a name for your report in the Save Report As box. 2. If desired, type a description for your report in the Description box. 3. Select the format for your report. You have the following options when saving your report:
• Save report in Report format (prompt selections cannot be changed)—This option saves the report, but does not allow the user to re-execute the report with different selection prompts.
• Save report in Prompt format (prompt selections can be changed)—This option saves the report, and does allow the user to re-execute the report with different selection prompts.
• Save report with all the embedded prompts— Currently, Product Performance Reports do not contain embedded prompts. Thus, this save option functions in the same way as the “Save report in Prompt format” option.
4. Click Save. Your report will be saved to the My Reports folder.
1
2
4
3
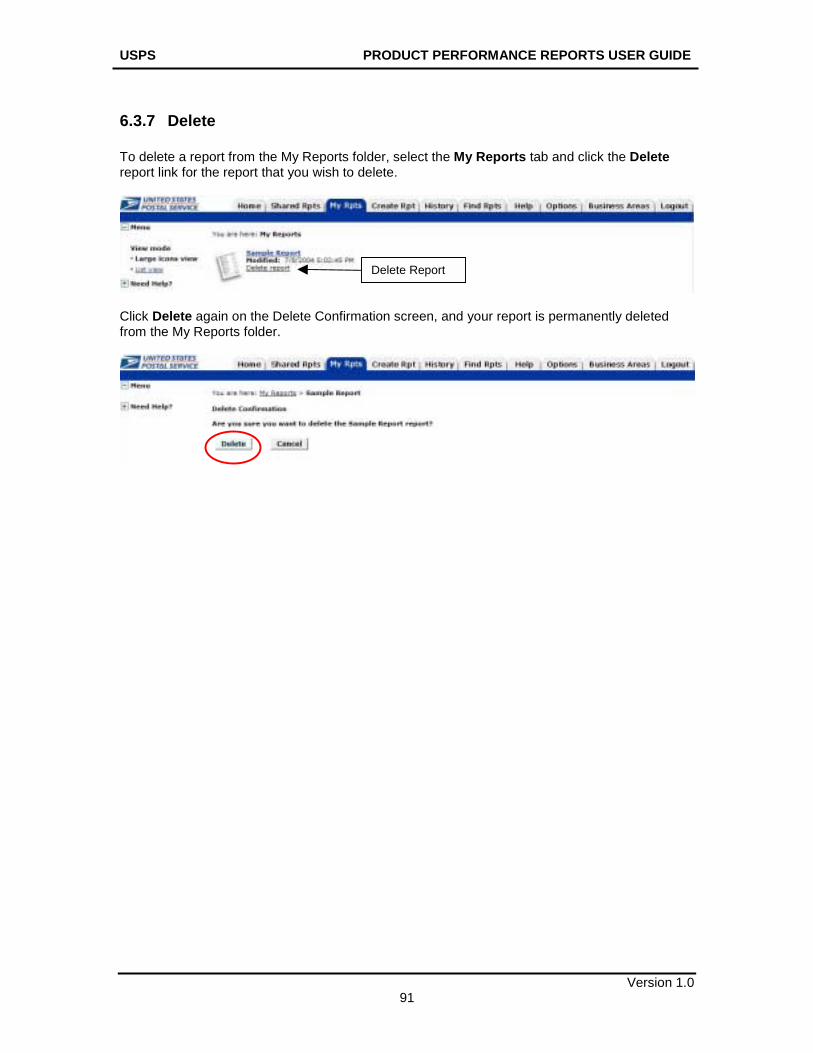
USPS PRODUCT PERFORMANCE REPORTS USER GUIDE
Version 1.0 91
6.3.7 Delete To delete a report from the My Reports folder, select the My Reports tab and click the Delete report link for the report that you wish to delete.
Click Delete again on the Delete Confirmation screen, and your report is permanently deleted from the My Reports folder.
Delete Report
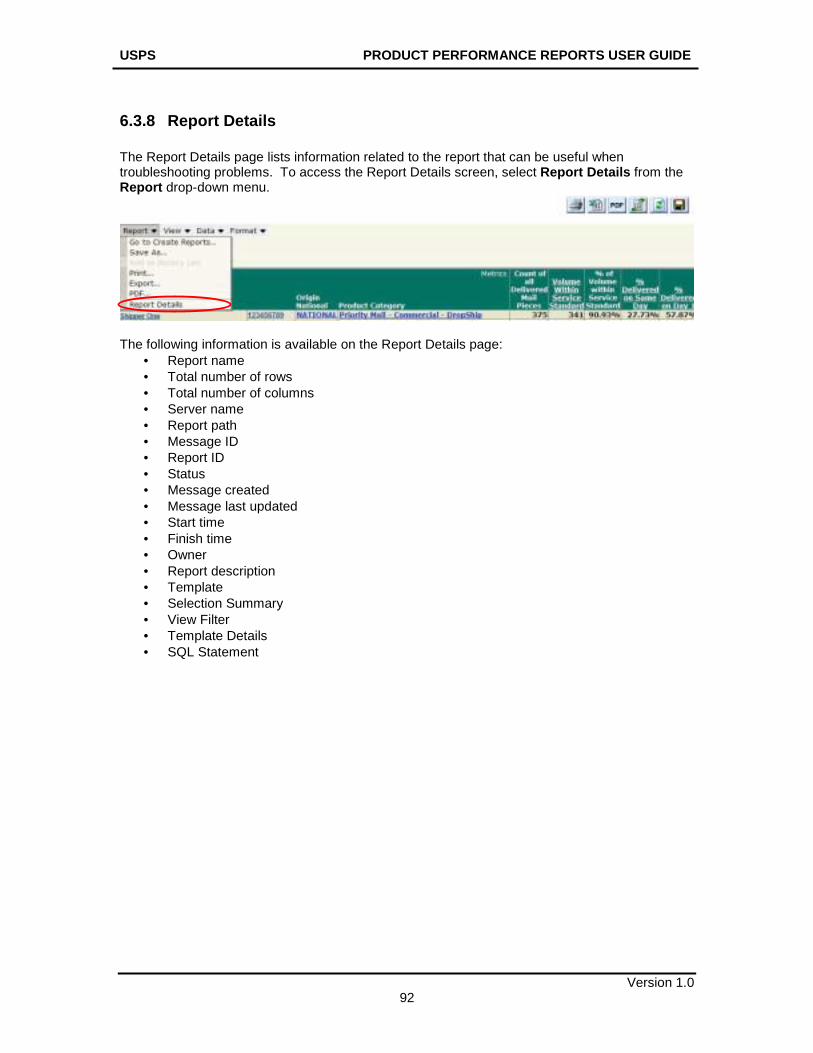
USPS PRODUCT PERFORMANCE REPORTS USER GUIDE
Version 1.0 92
6.3.8 Report Details The Report Details page lists information related to the report that can be useful when troubleshooting problems. To access the Report Details screen, select Report Details from the Report drop-down menu.
The following information is available on the Report Details page:
• Report name • Total number of rows • Total number of columns • Server name • Report path • Message ID • Report ID • Status • Message created • Message last updated • Start time • Finish time • Owner • Report description • Template • Selection Summary • View Filter • Template Details • SQL Statement
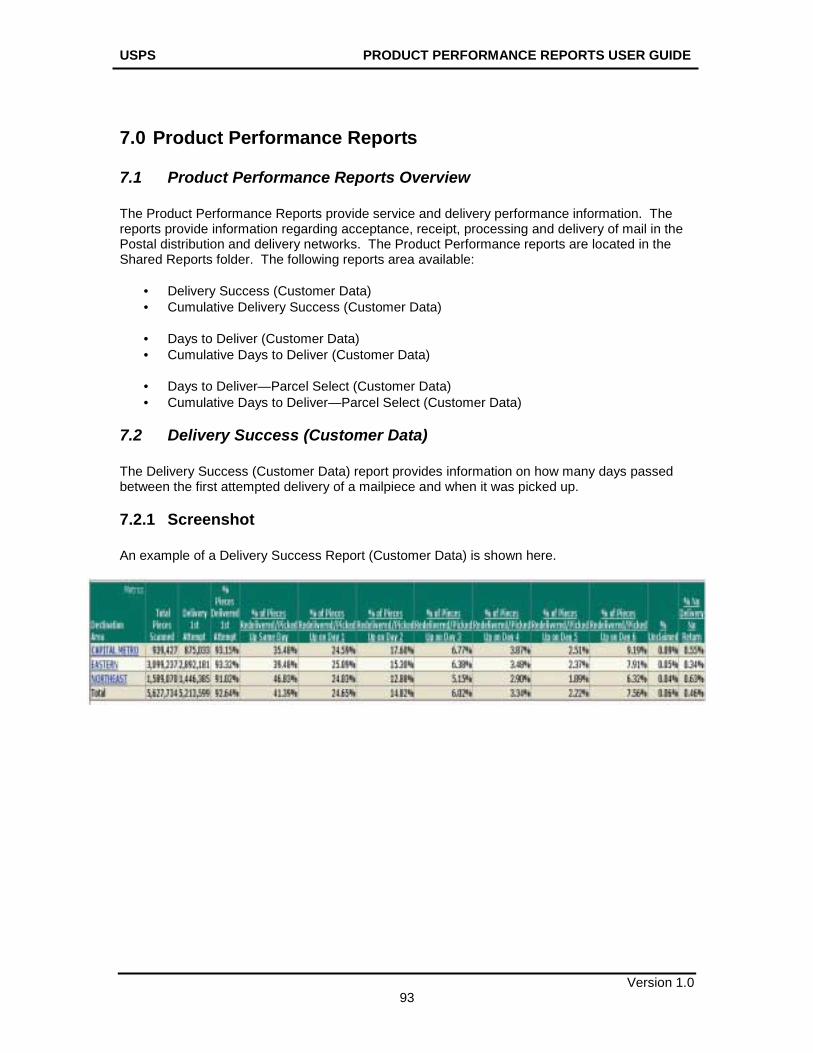
USPS PRODUCT PERFORMANCE REPORTS USER GUIDE
Version 1.0 93
7.0 Product Performance Reports
7.1 Product Performance Reports Overview The Product Performance Reports provide service and delivery performance information. The reports provide information regarding acceptance, receipt, processing and delivery of mail in the Postal distribution and delivery networks. The Product Performance reports are located in the Shared Reports folder. The following reports area available:
• Delivery Success (Customer Data) • Cumulative Delivery Success (Customer Data) • Days to Deliver (Customer Data) • Cumulative Days to Deliver (Customer Data)
• Days to Deliver—Parcel Select (Customer Data) • Cumulative Days to Deliver—Parcel Select (Customer Data)
7.2 Delivery Success (Customer Data) The Delivery Success (Customer Data) report provides information on how many days passed between the first attempted delivery of a mailpiece and when it was picked up.
7.2.1 Screenshot An example of a Delivery Success Report (Customer Data) is shown here.
USPS PRODUCT PERFORMANCE REPORTS USER GUIDE
Version 1.0 94
7.2.2 Report Attributes The attributes on the Delivery Success (Customer Data) report are as follows: Column Heading Description Total pieces scanned Count of mailpieces with an attempted or delivered or arrival at
pick up scan. Total pieces delivered 1st attempt
Count of mailpieces with only a delivered event scan
% of pieces delivered 1st attempt
Total pieces delivered 1st attempt / total pieces scanned
% of pieces redelivered / picked up on same day
% of pieces with an arrival at pick up point or attempted scan and a delivered scan and the difference between the arrival at pick up point or attempted and the delivered scan for 0 days
% of pieces redelivered / picked up on day 1
% of pieces with an arrival at pick up point or attempted scan and a delivered scan and the difference between the arrival at pick up point or attempted and the delivered scan for 1 days
% of pieces redelivered / picked up on day 2
% of pieces with an arrival at pick up point or attempted scan and a delivered scan and the difference between the arrival at pick up point or attempted and the delivered scan for 2 days
% of pieces redelivered / picked up on day 3
% of pieces with an arrival at pick up point or attempted scan and a delivered scan and the difference between the arrival at pick up point or attempted and the delivered scan for 3 days
% of pieces redelivered / picked up on day 4
% of pieces with an arrival at pick up point or attempted scan and a delivered scan and the difference between the arrival at pick up point or attempted and the delivered scan for 4 days
% of pieces redelivered / picked up on day 5
% of pieces with an arrival at pick up point or attempted scan and a delivered scan and the difference between the arrival at pick up point or attempted and the delivered scan for 5 days
% of pieces redelivered / picked up on day 6+
% of pieces with an arrival at pick up point or attempted scan and a delivered scan and the difference between the arrival at pick up point or attempted and the delivered scan for 6 or more days
% unclaimed % of pieces with an arrival at pickup point or attempted scan and a delivered scan and an unclaimed scan code.
% with no delivery of return scan
% of pieces with an arrival at pickup point or attempted scan and no refused scan and no such number, insufficient address, moved, left no address, forward expired, addresses unknown, vacant, unclaimed, deceased or other scan.
7.2.3 Selection Prompts The Delivery Success (Customer Data) report includes the following selection prompts:
1. Product / Service 2. Destination Location 3. Time Period 4. Start Date 5. End Date 6. Shipper 7. Customer
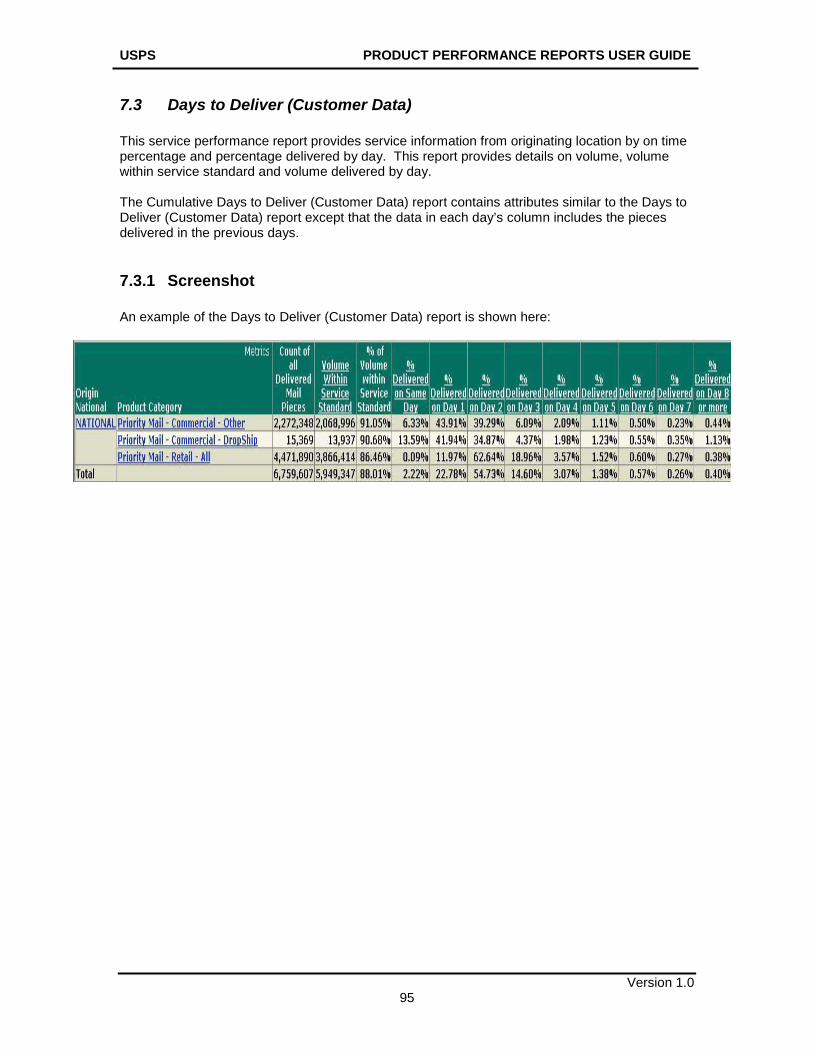
USPS PRODUCT PERFORMANCE REPORTS USER GUIDE
Version 1.0 95
7.3 Days to Deliver (Customer Data) This service performance report provides service information from originating location by on time percentage and percentage delivered by day. This report provides details on volume, volume within service standard and volume delivered by day. The Cumulative Days to Deliver (Customer Data) report contains attributes similar to the Days to Deliver (Customer Data) report except that the data in each day’s column includes the pieces delivered in the previous days.
7.3.1 Screenshot An example of the Days to Deliver (Customer Data) report is shown here:
USPS PRODUCT PERFORMANCE REPORTS USER GUIDE
Version 1.0 96
7.3.2 Report Attributes The attributes on the Days to Deliver (Customer Data) report are as follows: Column Heading Description Count of all Delivered Mailpieces
Total number of mailpieces delivered
Volume within Service Standard
Count of mailpieces with earliest stop the clock event on or before the scheduled delivery date/time
% of Volume within Service Standard
Percentage of mailpieces with earliest stop the clock event on or before the scheduled delivery date. (Total volume – failed volume / total volume).
% Delivered on Same Day % of mailpieces that were delivered on same day. % Delivered on Day 1 % of mailpieces that were delivered on day 1 % Delivered on Day 2 % of mailpieces that were delivered on day 2 % Delivered on Day 3 % of mailpieces that were delivered on day 3 % Delivered on Day 4 % of mailpieces that were delivered on day 4 % Delivered on Day 5 % of mailpieces that were delivered on day 5 % Delivered on Day 6 % of mailpieces that were delivered on day 6 % Delivered on Day 7 % of mailpieces that were delivered on day 7 % Delivered on Day 8 + % of mailpieces that were delivered on days 8 or more
7.3.3 Selection Prompts The Days to Deliver (Customer Data) includes the following selection prompts.
1. Origin Location 2. Product / Service 3. Time Period 4. Start Date 5. End Date 6. Shipper 7. Customer 8. Group Results By
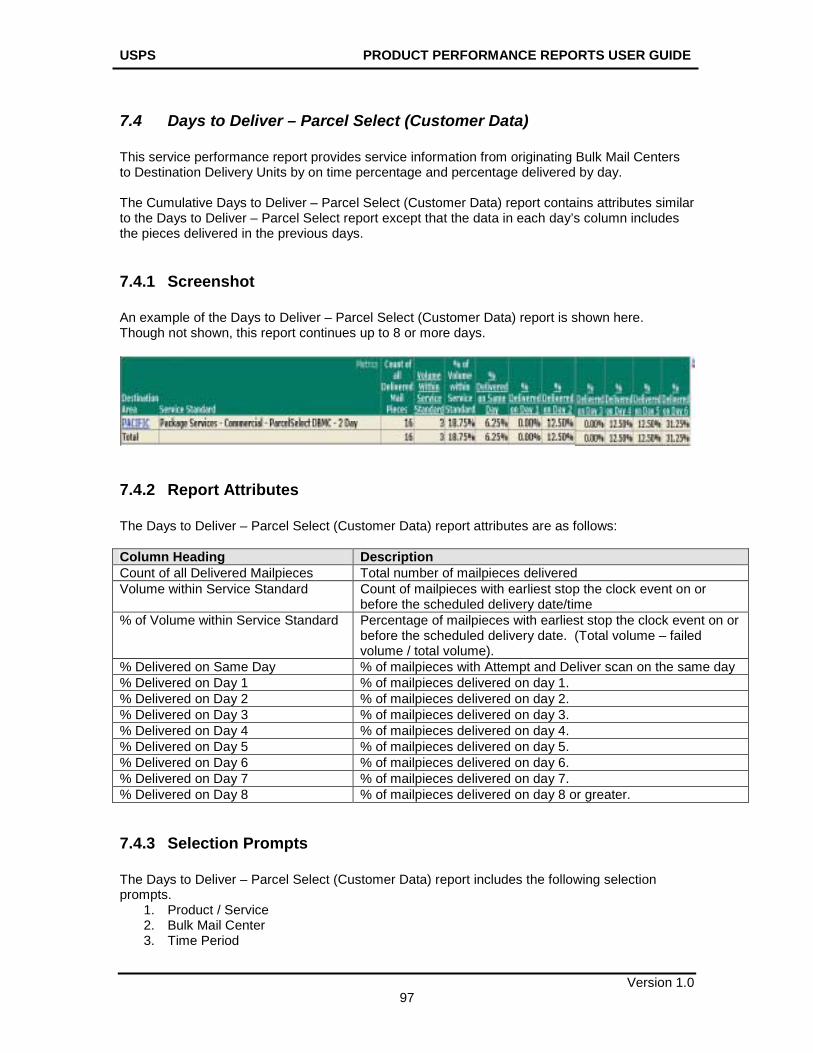
USPS PRODUCT PERFORMANCE REPORTS USER GUIDE
Version 1.0 97
7.4 Days to Deliver – Parcel Select (Customer Data) This service performance report provides service information from originating Bulk Mail Centers to Destination Delivery Units by on time percentage and percentage delivered by day. The Cumulative Days to Deliver – Parcel Select (Customer Data) report contains attributes similar to the Days to Deliver – Parcel Select report except that the data in each day’s column includes the pieces delivered in the previous days.
7.4.1 Screenshot An example of the Days to Deliver – Parcel Select (Customer Data) report is shown here. Though not shown, this report continues up to 8 or more days.
7.4.2 Report Attributes The Days to Deliver – Parcel Select (Customer Data) report attributes are as follows: Column Heading Description Count of all Delivered Mailpieces Total number of mailpieces delivered Volume within Service Standard Count of mailpieces with earliest stop the clock event on or
before the scheduled delivery date/time % of Volume within Service Standard Percentage of mailpieces with earliest stop the clock event on or
before the scheduled delivery date. (Total volume – failed volume / total volume).
% Delivered on Same Day % of mailpieces with Attempt and Deliver scan on the same day % Delivered on Day 1 % of mailpieces delivered on day 1. % Delivered on Day 2 % of mailpieces delivered on day 2. % Delivered on Day 3 % of mailpieces delivered on day 3. % Delivered on Day 4 % of mailpieces delivered on day 4. % Delivered on Day 5 % of mailpieces delivered on day 5. % Delivered on Day 6 % of mailpieces delivered on day 6. % Delivered on Day 7 % of mailpieces delivered on day 7. % Delivered on Day 8 % of mailpieces delivered on day 8 or greater.
7.4.3 Selection Prompts The Days to Deliver – Parcel Select (Customer Data) report includes the following selection prompts.
1. Product / Service 2. Bulk Mail Center 3. Time Period
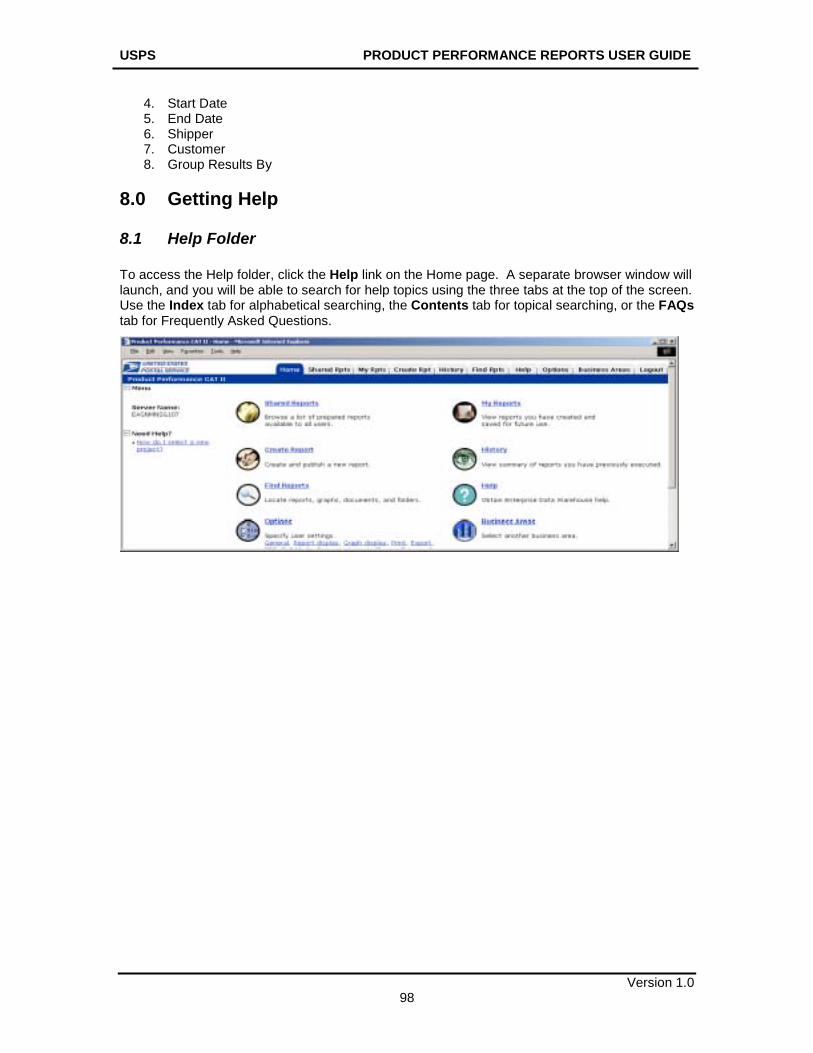
USPS PRODUCT PERFORMANCE REPORTS USER GUIDE
Version 1.0 98
4. Start Date 5. End Date 6. Shipper 7. Customer 8. Group Results By
8.0 Getting Help
8.1 Help Folder To access the Help folder, click the Help link on the Home page. A separate browser window will launch, and you will be able to search for help topics using the three tabs at the top of the screen. Use the Index tab for alphabetical searching, the Contents tab for topical searching, or the FAQs tab for Frequently Asked Questions.
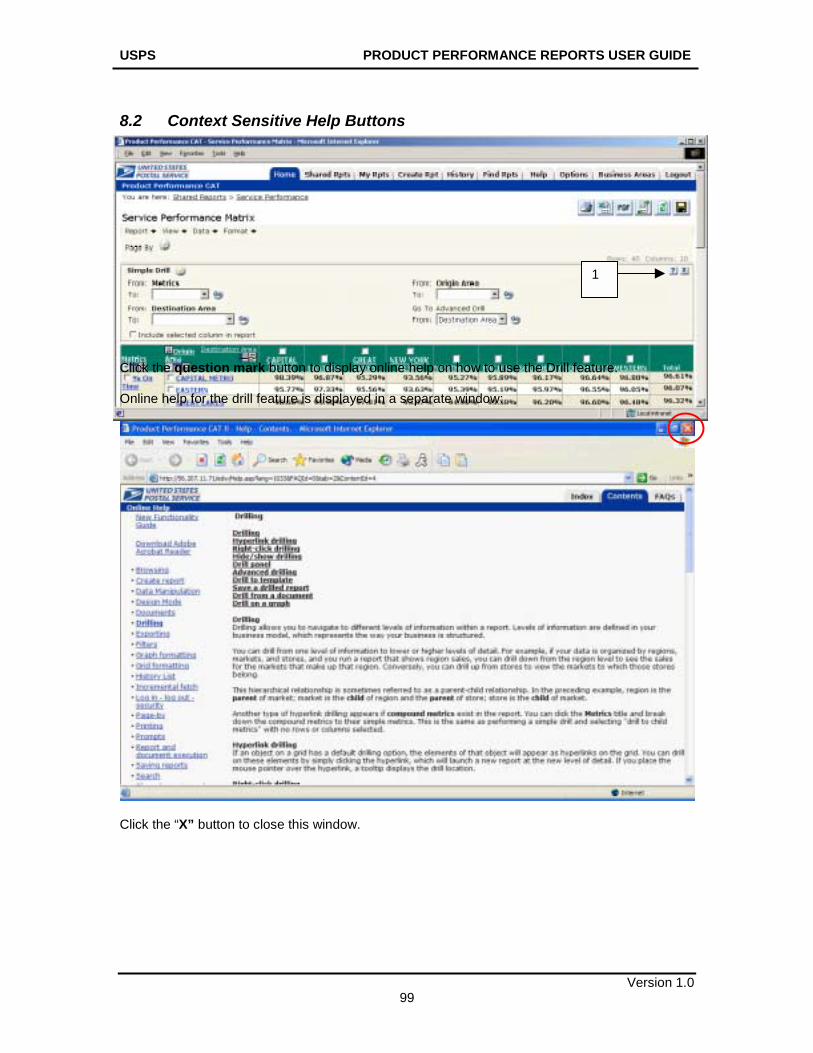
USPS PRODUCT PERFORMANCE REPORTS USER GUIDE
Version 1.0 99
8.2 Context Sensitive Help Buttons The Context Sensitive Help Buttons allow direct access to the section of the Online Help menu that is related to the function being used. The following example shows how to obtain information on Drilling through Online Help:
Click the question mark button to display online help on how to use the Drill feature. Online help for the drill feature is displayed in a separate window:
Click the “X” button to close this window.
1
USPS PRODUCT PERFORMANCE REPORTS USER GUIDE
Version 1.0 100
8.3 Help Desk If you need help or have questions about your account or registration process, please contact Customer Support at 1-800-238-3150 (Mon-Fri 7:00 AM – 5:00 PM Central) or forward an email to: [email protected]. If you have questions or comments about the Product Performance reports forward an email to: [email protected].