Embed Size (px)
Citation preview

Construction of a Decision Analysis Tool for Choosing Corporate Environmental Management Systems
By: Mary Pat Bomher
April 30, 2010 Advisor: Dr. Lynn Maguire
Masters project submitted in partial fulfillment of the requirements for the Master of Environmental Management Degree in the Nicholas
School of the Environment at Duke University

ii
ABSTRACT Environmental managers are continually faced with new challenges to improve stakeholder
relationships, save money and reduce the organization’s environmental footprint. Many of these
challenges can be efficiently addressed by implementation of an environmental management system
(EMS). However, there are a number of different environmental management systems which are
available, from industry specific standards such as the Recycling Industry Operating Standard (RIOS)
to international standards such as ISO14001. Selecting the system that is the best fit for an
organization is a challenge, especially for smaller organizations with limited resources.
Fortunately, multicriteria decision analysis is well-suited to this type of decision problem.
The objective of this project was to construct a decision analysis tool to differentiate among various
environmental management systems based on organizations’ preferences. The project focused on
three environmental management systems: ISO14001, Eco-Management and Audit Scheme (EMAS)
and The Natural Step (TNS). The tool was built using the expertise of environmental management
system practitioners to evaluate the systems on criteria representing financial, logistical and
environmental goals. I tested the tool using the preferences of environmental managers at four
facilities: one small chemical facility, one large chemical facility, one small manufacturing facility
and one large manufacturing facility, to show that the tool is useful. I then improved the tool’s
accuracy and user-friendliness based on comments from a typical user.
The results showed that the Eco-Management and Audit Scheme system scored best on the
majority of attributes, and thus was the preferred alternative for three out of four sample cases.
Additionally, the most important attributes amongst all respondents in the overall evaluation were
verification reliability and environmental stewardship. Organizations want to know that their system
is verifiable and that it will help prepare them for future environmental challenges. Slight similarities
in the importance rating of attributes were seen between the facilities of equivalent size, especially
with respect to those attributes which helped to improve shareholder return.

iii
Overall, the process demonstrated that how an EMS is implemented at an organization will be
based on the preferences of the organization and what they are hoping to accomplish with their
system. While some organizations want to focus on saving money, others choose to focus on a
reduction in emissions. The decision analysis tool I developed is flexible enough to accommodate
such differences in priorities.
Finally, this research showed that none of these three systems scored perfectly on all
company objectives. It is possible to identify the single system that best matches a facility’s
preferences, but the best environmental management system may be a hybrid among the three.

iv
Table of Contents
ABSTRACT ii
Table of Contents iv
List of Tables vi List of Figures vii INTRODUCTION 1
Environmental Management Systems 4 ISO14001 6 Eco-Management and Audit Scheme (EMAS) 7 The Natural Step 8
OBJECTIVES 11 METHODS 11
Multicriteria Decision Analysis 11 Research Design 14 Surveys and Interviews 15 Sensitivity Analysis 18
APPLICATION OF METHODS 18 Determination of Decision Objective 19 Determination of Subobjectives and Attributes 19 Scoring of Attributes 21 Utility Determination 24 Determination of Weights 32 Calculation of Overall Utility 35 Sensitivity Analysis 36
Sensitivity to Changes in Attribute Weights 37 Performance Assessments 41
Final Interview with Decision System Reviewer 42 DISCUSSION 47 CONCLUSIONS AND RECOMMENDATIONS 51

v
ACKNOWLEDGMENTS 52 LITERATURE CITED 54 APPENDICES 56 Appendix A: Recruitment letter for project participants 57 Appendix B: Performance assessment survey 58 Appendix C: Utility assessment survey 63 Appendix D: Weight assessment survey 68

vi
List of Tables
Table 1. A summary of the differences among ISO14001, EMAS and The Natural Step. ............................... 12 Table 2. Research instruments used for groups of research subjects. ............................................................... 16 Table 3. Attribute measurement scales for attributes related to increasing shareholder return......................... 22 Table 4. Attribute measurement scales for attributes related to reducing environmental impact...................... 23 Table 5. Attribute measurement scales for attributes related to improving stakeholder ................................... 24 Table 6. Performance ratings for ISO14001, EMAS and The Natural Step from three experts in
consulting, industry and regulatory compliance for maximizing shareholder return. Boldface type denotes performance ratings which were used in the decision analysis. .................................................... 25
Table 7. Performance ratings for ISO14001, EMAS and The Natural Step from three experts in consulting, industry and regulatory compliance for reducing environmental impact. Boldface type denotes performance ratings used in the decision analysis. ........................................................................ 26
Table 8. Performance ratings for ISO14001, EMAS and The Natural Step from three experts in consulting, industry and regulatory compliance for improving stakeholder relationships. Boldface type denotes performance assessments used in the decision analysis......................................................... 27
Table 9. Normalized weighting of attributes determined through surveys from two manufacturing industry environmental managers and two chemical industry managers.. Italicized numbers in parentheses are totals of associated attribute weights. ......................................................................................................... 34
Table 10. Weight assigned to three objectives and 11 attribute measures by environmental managers from five industry sectors. Italicized numbers in parentheses represent the total of associated attribute weights. ....................................................................................................................................................... 35
Table 11. Overall utility of the three EMSs based on expert ratings of performance (Tables 6 through 8) and preferences of four industry representatives (Fig. 4-14 and Table 9). ................................................. 36
Table 12. Sensitivity of overall utilities of EMSs to changes in performance ratings (i.e., using the lower scores assigned by the experts, where high and low scores are those denoted in Tables 6-8) for the preferences of environmental managers from four types of facilities. Boldface font indicates the most preferred alternative for each scenario. Large boldface font indicates the preferred alternative is different than the base case. ........................................................................................................................ 43
Table 13. Sensitivity of overall utilities of EMSs to changes in performance ratings (i.e., using the lower scores assigned by the experts, where high and low scores are those denoted in Tables 6-8) for the preferences of the decision system reviewer. Boldface font indicates the most preferred alternative for each scenario. Large boldface font indicates the preferred alternative is different than the base case. ...... 48

vii
List of Figures
Figure 1. Plan-Do-Check-Act cycle for environmental management systems (adapted from Environmental Management Systems, Gallagher 2008). ...................................................................................................... 5
Figure 2. The Natural Step sustainability funnel. . ............................................................................................ 10 Figure 3. Environmental management system decision objective hierarchy..................................................... 20 Figure 4. Utilities for competitive advantage from each of the four respondents. ............................................ 28 Figure 5. Utilities for risk reduction from each of the four respondents. .......................................................... 28 Figure 6. Utilities for cost savings from each of the four respondents.............................................................. 28 Figure 7. Utilities for verification reliability from each of the four respondents. ............................................. 29 Figure 8. Utilities for reduced consumption from each of the four respondents. .............................................. 29 Figure 9. Utilities for reduced emissions from each of the four respondents. ................................................... 29 Figure 10. Utilities for environmental stewardship from each of the four respondents. ................................... 30 Figure 11. Utilities for agency relationship from each of the four respondents. ............................................... 30 Figure 12. Utilities for employee satisfaction from each of the four respondents............................................. 30 Figure 13. Utilities for community reputation from each of the four respondents. ........................................... 31 Figure 14. Utilities for customer reputation from each of the four respondents. .............................................. 31 Figure 15. Sensitivity of overall utility to changes in the weight on verification reliability for the
preferences of the large chemical facility. .................................................................................................. 38 Figure 16. Sensitivity of overall utility to changes in the weight on reduced outputs for the preferences of
the large chemical facility. .......................................................................................................................... 38 Figure 17 Sensitivity of overall utility to changes in the weight on cost savings for the preferences of the
large manufacturing facility. ....................................................................................................................... 39 Figure 18. Sensitivity of overall utility to changes in the weight on competitive advantage for the
preferences of the small manufacturing facility.......................................................................................... 40 Figure 19. Sensitivity of overall utility to changes in the weight on environmental stewardship for the
preferences of the small chemical facility................................................................................................... 41 Figure 20. Sensitivity of overall utility to changes in the weight on competitive advantage for the
preferences of the decision system reviewer............................................................................................... 45 Figure 21. Sensitivity of overall utility to changes in the weight on environmental stewardship for the
preferences of the decision system reviewer............................................................................................... 46 Figure 22. Sensitivity of overall utility to changes in the weight on reduced outputs for the preferences of
the decision system reviewer. ..................................................................................................................... 46

viii

1
INTRODUCTION
Ever since the industrial revolution, humans have been consuming the earth’s resources and
discharging wastes at a rate faster than they can be renewed. They have been living under the
impression that hopes and dreams can only be reached with unlimited economic growth. Increased
production and consumption are viewed as “good,” with little regard for the effects in the
environmental and social sphere. If this trend continues, the world that humans leave to future
generations will likely be one with a reduced quality of life. To prevent the detriment of environment
and people, humans need to set a new paradigm based on an interconnected world functioning in
harmony with one another and with nature (Stead et al. 2004, 9).
While all people in some way contribute to environmental degradation, corporations, by their
nature, also create a significant environmental footprint. In alignment with humanity’s natural
tendency toward progress, many of these types of organizations pursue profit without regard to their
effects on their external environment or community. With large market chains which include
manufacturing, shipping, distribution and sales, corporations greatly impact the environment and
communities worldwide. By setting a new paradigm in how they operate, these organizations can
“prevent the detriment of environment and people” (Stead et al. 2004, 9).
There are some corporations that have already begun to change their thinking, values and thus
their operations, such that they are more environmentally and socially benign. However, the majority of
corporations still have significant progress to make. As public awareness of highly publicized topics such
as global warming, water shortages and oil shortages increases, corporations are and will be held to a
higher standard in how they operate. They will face increased scrutiny into the transparency of their
operations and pressures to adopt sustainable practices. According to Renato Orsato, “Consumers are
increasingly expressing the value they attribute to environmental protection through shopping behavior.
As ecological and social responsibility become increasingly important issues for society, consumers value

2
the way organizations manage their production processes and supporting activities” (Orsato 2006, 130).
Thus, consumer demand will likely dictate a behavior change for corporations with regard to
environmental management. To remain competitive amidst this increased scrutiny, corporations will have
to adjust their values, paradigms and practices.
Many managers are beginning to see the importance of transparency in their operations and
reporting. However, they are overwhelmed by the possibilities for creating transparent data. Orsato said,
“Managers are increasingly being requested to base corporate environmental strategies on more solid
justifications. In the past few years, they have also been bombarded with ‘stage models,’ tools,
techniques, schemes, standards and demonstration cases of best environmental practices. Although
awareness of environmental issues in business has certainly risen, managers have been left wondering
what they should do first and why” (Orsato 2006, 140). Without specific knowledge of what solutions are
available and whether they are the best fit for their corporations, managers can spin their wheels trying to
do a little bit of everything (Orsato 2006, 140).
One of the most efficient ways for corporations to transform their operations to include
sustainable practices is the implementation of an environmental and/or sustainability management
system. Environmental/sustainability management systems provide a framework from which an
organization can structure its business practices in a sustainable manner with regard to economics,
social welfare and the environment (United States Environmental Protection Agency 2008).
An environmental management system (EMS) focuses on environmental impacts. It integrates
environmental management with normal operation and overall management practices. According to
the Environmental Protection Agency (USEPA 2001, 18), the significant parts of an EMS include:
• environmental policy defined by upper management;
• assessment of operations environmental impact;
• assignment of authorities, responsibilities and resources;
• framework for regular review of environmental performance and other results; and,

3
• guidelines for continual improvement, including timelines, monitoring systems and corrective
action tracking.
For consideration as an EMS, all of the listed elements must be present; however, they do not
have to fit into a specific structure, although most systems do have specific rules and strategies. The
variations in these rules and strategies among EMSs are what determine the “fitness” of an
environmental management system for a given corporation.
Management systems vary greatly in approach, requirements and goals, so choosing the right
system for an organization can be difficult. For example, the ISO14001 management system focuses
primarily on evaluating current environmental impacts, finding ways to reduce them and setting
targets for improving performance (International Organization for Standardization 2008). The Natural
Step focuses on predicting a desired future state and then “backcasting,” plotting a path to get from
the present state to the future state (The Natural Step 2008). The variety in the nature and framework
of environmental management systems parallels the variety of needs of various corporations.
Corporations vary widely in their missions, cultures, resources and views of the environment and of
sustainability, all of which affect the choice of an environmental management system. The success of
the environmental management system will depend on how well it fits the needs, operations and
culture of an organization.
Since there are significant differences among management systems and significant
differences among corporations that are using these systems, managers need a tool that will help them
differentiate among various systems. The ideal tool would incorporate the values of the corporation
and match them to the characteristics of management systems to find the best fit.
In this masters project, I constructed a decision analysis tool for choosing among
environmental management systems. I developed it using a combination of literature reviews, surveys
and interviews. The management systems I compared are: ISO14001(International Organization for
Standardization 2008), the Natural Step (The Natural Step 2008), and Eco-Management and Audit
Scheme (EMAS) (European Commission on Environment 2008).
4
Environmental Management Systems
Environmental management systems differ widely on the elements included and the relative
significance of each element. However, there is a general consensus on the basic elements which are
required (Stead et al. 2004):
• strong commitment to improved environmental/sustainability performance from management;
• development of clear goals with related objectives and targets;
• development of core competencies required for implementation of strategies for achievement of
goals and objectives;
• assessments of performance toward meeting environmental/sustainability goals and against
previous performance and regulatory requirements;
• establishment of information and reporting systems; and,
• alignment of human resource processes with environmental/sustainability performance goals.
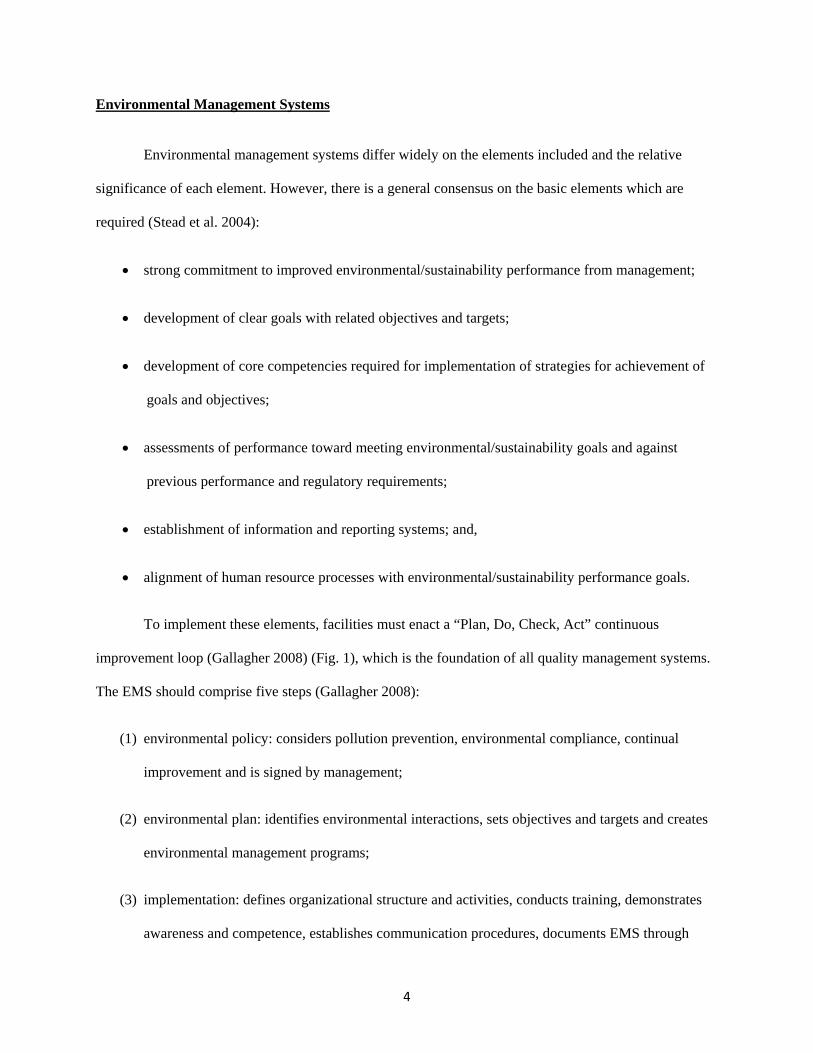
To implement these elements, facilities must enact a “Plan, Do, Check, Act” continuous
improvement loop (Gallagher 2008) (Fig. 1), which is the foundation of all quality management systems.
The EMS should comprise five steps (Gallagher 2008):
(1) environmental policy: considers pollution prevention, environmental compliance, continual
improvement and is signed by management;
(2) environmental plan: identifies environmental interactions, sets objectives and targets and creates
environmental management programs;
(3) implementation: defines organizational structure and activities, conducts training, demonstrates
awareness and competence, establishes communication procedures, documents EMS through

5
policies, plans and procedures, establishes document control, establishes operational control,
implements emergency preparedness and response;
(4) monitoring and corrective action system: monitors and measures environmental interactions,
establishes a non-conformance and corrective and preventive action system, keeps appropriate
records, performs periodic internal and external audits of the EMS; and
(5) management review: reviews environmental performance, reviews EMS performance, reviews
priorities and objectives, allocates appropriate resources.
Figure 1. Plan-Do-Check-Act cycle for environmental management systems (adapted from Environmental Management Systems, Gallagher 2008).
The way in which organizations incorporate these elements into their operations will be
determined by the management system selected and the operations, processes and structure of the
M anagement Review•Review environm ental perform ance•Review EM S perform ance•Review priorities andobjectives•Allocate appropriate resources
Environmental Com pliance•Regulatory com pliance•Pollution prevention•Continuous im provem ent•Signed by top m anagem ent
Planning•Identify environm ental interactions•Set objectives and targets•Create environm entalm anagem ent program s
Implementation and O peration•Define organizational structureand responsibilities•Conduct training•Dem onstrate awareness andcom petence•Establish com m unication procedures•Docum ent EM S through policies,plans and procedures•Establish docum ent control•Establish operational control•Im plem ent em ergency preparedness and response
Checking and Corrective Action•M onitor and m easure environm ental interactions•Establish a non-conform ance andpreventive and corrective actionsystem•Keep appropriate records•Perform periodic internal and external audits of the EM S
EM S Continual Improvement Process

6
organization. Factors such as organization size, location, profitability, and financial structure can all drive
an organization’s desire to become environmentally proactive with implementation of a management
system (Bracke et al. 2008). Other incentives for EMS implementation include economic benefits, public
recognition, market pressure, and risk reduction (Esquer-Paralta 2008). Those criteria which are most
important to an organization should determine which management system they choose to implement.
Each of the systems is briefly described below.
ISO14001
ISO14001 is one of the most recognized environmental management system frameworks in the
world (Gavronski et al. 2008). It was developed in 1996 and updated in 2004 by the International
Organization for Standardization in response to the development of the Eco-Management and Audit
System developed by the European Union in 1992. The standard was created as framework to help
organizations more effectively manage their environmental footprints and demonstrate their standing as
environmentally proactive organizations (Gavronski et al. 2008).
ISO14001 is a voluntary certification program; there is no legal obligation that mandates
certification. It is structured around the Plan-Do-Check-Act cycle (Martin 1998). There are 16 basic
requirements for certification; highlights include (Martin 1998):
• definition of environmental policy;
• identification of environmental aspects;
• setting of objectives and targets;
• development of program/procedures for auditing;
• development of procedures for non-conformances and corrective action; and,
• conduct of management review of performance.
Organizations seeking to verify conformity with the standard can pursue one of four courses
(International Organization for Standardization 2008):

7
• make a self-determination;
• seek confirmation of conformance by stakeholders in the organization;
• seek confirmation by a party outside the organization; or,
• seek certification by an external organization.
ISO14001 does not specify required levels of environmental performance. This flexibility allows
for ISO14001 to be implemented at a wide variety of organizations, no matter what the level of
environmental activity. The focus is then on a commitment to compliance with local, state and federal
regulations and a commitment to continual improvement in environmental performance (International
Organization for Standardization 2008).
Although ISO does not advertise that 14001 will improve environmental performance or increase
competitive advantage, empirical studies have shown that both of these are confirmed results of 14001
implementation (Gonzalez-Benito 2005). ISO does state that implementation will provide assurance to
employees and management that the organization is in control of its operations and processes and that it is
an environmentally progressive organization. ISO also states that implementation will improve the
confidence of external stakeholders, ensure compliance with regulations and demonstrate that the
organization’s claims about its environmental performance are accurate (International Organization for
Standardization 2008).
Eco-Management and Audit Scheme (EMAS) EMAS was made available to organizations in the industrial sector starting in 1995, and updated
in 2001 so that it could be applied to a wider variety of organizations. EMAS was developed with the aim
of recognizing and rewarding organizations whose actions go beyond minimum compliance and who
commit to continuous improvement (Institute of Environmental Management & Assessment 2009). By
requiring verification of environmental performance results by an approved, independent party, EMAS
8
provides enhanced credibility to organizations for their environmental efforts (Institute of Environmental
Management and Assessment 2009).
EMAS is governed and enforced by the European Union Commission on Environment, a public
entity (Bracke et al. 2008). The system defines environmental performance in terms of best available
technology with specific performance requirements. It also requires the publishing of environmental
performance results on an annual basis to demonstrate compliance (Gonzalez et al. 2008).
EMAS can be considered a standard of environmental excellence (Bracke et al. 2007). EMAS
requires continuous evaluation of performance, objectives and targets for improvement. As a standard of
excellence, it focuses on legal compliance, environmental performance, external communication and
employee involvement (Bracke et al. 2008). Because the certification is more stringent than ISO14001,
the process tends to be more costly. Therefore, there are significantly fewer EMAS-certified organizations
than ISO14001 organizations. Because of the significant cost and level of effort required for initial
implementation and annual recertification, EMAS certification must be approached with more
forethought (Bracket et al. 2008).
While EMAS implementation requires a significant investment of both time and money, it also
reaps significant benefits for organizations which make the investment. These benefits include: reduced
costs on inputs due to efficiency improvements, risk minimization, continuous efficiency improvements,
competitive advantage, enhanced business management, improved compliance, improved external
relationships and increased employee involvement (European Commission on Environment 2008).
Bracke et al. (2008) also cite regulatory relief, easier access to funds, increased customer goodwill and
increased regulator goodwill as some intangible benefits.
The Natural Step
The Natural Step is a Sustainability Management System developed by Karl-Henrik Robert with
the assistance of many groups of scientists and consultants (Reichert 1998). A sustainability management

9
system differs from an environmental management system in its consideration of social impacts (e.g.,
employees, community) in addition to environmental and financial impacts. Most simply, The Natural
Step consists of four system conditions derived from laws of thermodynamics and mass conservation.
These system conditions are as follows (Reichert 1998):
1. Concentrations of substances extracted from the Earth’s crust must not systematically increase in
nature: Does an action reduce the use of finite fossil fuel and mineral resources or molecules?
2. Substances produced by society must not systematically increase in nature: Does an action reduce
the use of long-lived synthetic products or materials?
3. The physical basis for the productivity and diversity of nature must not be systematically reduced:
Does an activity preserve or increase natural diversity and the capacity of ecocycles?
4. Energy and other resources must not be used unjustly or inefficiently: Does an activity reduce the
consumption of energy and other natural resources?
According to The Natural Step, problems with environmental waste will not cease until all four
conditions are achieved. It advocates that political and economic issues need to be re-prioritized such that
society can reduce, and eventually remove, its heavy dependence on natural resources. Serving as an
example of reprioritization, the four system conditions of The Natural Step should be used to formulate a
strategic step-by-step plan for success. If this is not achieved, organizations will find they will receive a
negative return on investment because finding resources will become increasingly expensive as they
become rarer.
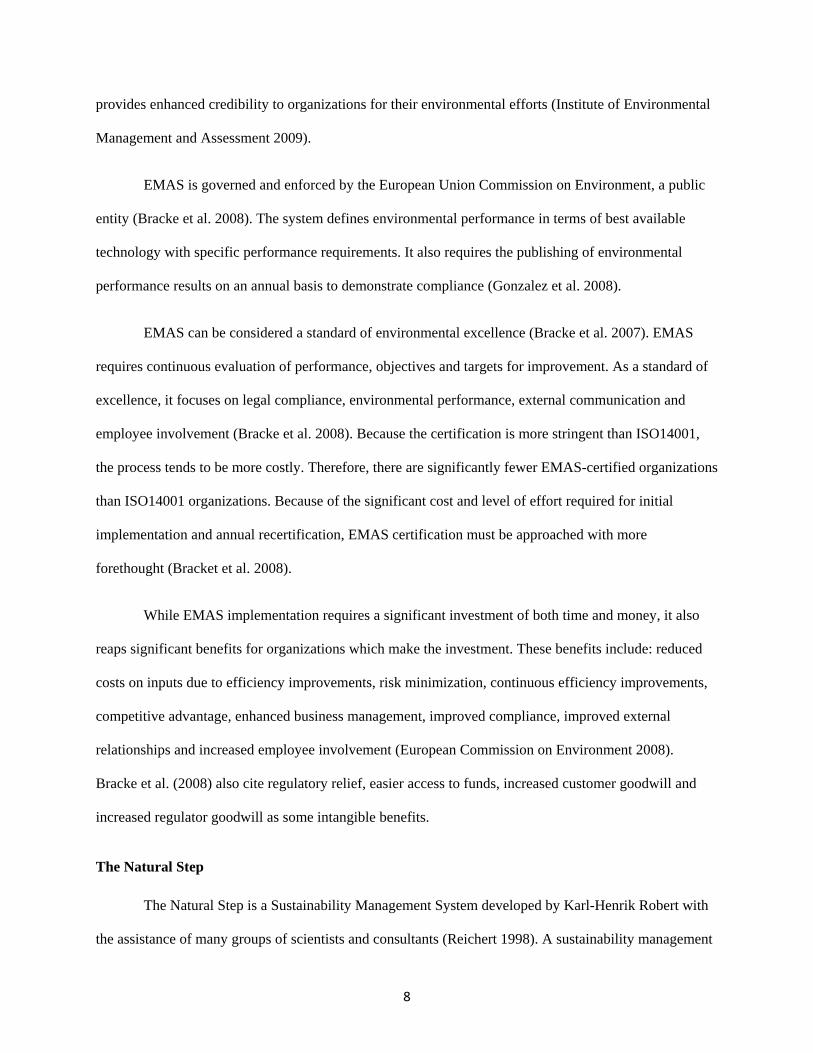
According to Robert, “Non-sustainable development could be visualized as entering deeper and
deeper into a funnel, in which the space becomes narrower and narrower [Fig. 2]. To the individual,
company, municipality, or country wanting to make skillful investments, the crucial thing must be to
direct its investments toward the opening of the funnel rather than into the wall. In reality, this means that

10
the smart investor makes himself less and less economically dependent on continued violation of the
system conditions” (Reichert 1998, 21).
Figure 2. The Natural Step sustainability funnel. To prevent themselves from running into the wall of the funnel, corporations must incorporate system conditions into their operations which will reduce their dependence on resources and move them toward the open space (adapted from Fig. 1 in Leadbitter 2002, 2207).
The strategic principle used in The Natural Step (TNS) is backcasting, or looking at the current
situation from a future perspective. The first step in backcasting is envisioning the desired future situation
that is in line with the four system conditions. Next, organizations must assess their current situation from
the perspective of their future situation. Using the results of the assessment, organizations can determine
what actions they must take and investments they must make in order to arrive at the desired future state.
To ensure that operations stay within the constraints of The Natural Step, every new strategy for pursing
the future state must be assessed against the four system conditions (Ciegis and Grunda 2006).
Unlike ISO14001 or EMAS, there are no documentation requirements. Organizations that choose
to implement The Natural Step are accountable only to themselves. The Natural Step Network
Sustainability Conditions met
Today
Fast diminishing resourcesFast-growing population

11
(www.thenaturalstep.org), a non-profit organization with offices in 11 countries, will provide assistance
to organizations that choose to implement The Natural Step management system; however, it does not
have any enforcement responsibilities. Thus, the effectiveness of The Natural Step is significantly
dependent on the extent to which an organization chooses to adhere to the system conditions. Table 1
below provides a comparison of the characteristics of the three EMSs.
OBJECTIVES
The objectives of this master’s project were:
• to build a decision analysis tool to assist corporations in choosing among three or more
environmental and/or sustainable management systems;
• to demonstrate the functionality of the tool by applying it to the choice among three EMSs by
four companies, two chemical manufacturers and two general manufacturing facilities; and,
• to evaluate the effectiveness of such a tool and refine the tool based on testing with one
corporation that has either implemented a system or is considering implementation.
METHODS
I undertook this project using the following research methods:
Multicriteria Decision Analysis
One way managers can sort out the conflicting objectives and varying attributes present in
environmental management systems is through the use of a multicriteria decision analysis approach.
Robert Clemen discusses when decision analysis can be useful: “…the problems utilities face are
particularly appropriate for treatment with decision analysis techniques; they involve long time frames

12
Table 1. A summary of the differences among ISO14001, EMAS and The Natural Step.
ISO 1400 EMAS The Natural Step
Foundational structure An underlying commitment to continuous improvement with requirements for setting of objectives and targets and implementation of an audit program to measure progress towards objectives and targets1
Four-step process including environmental impact assessment, EMS implementation, internal audits and external certification audits2
Four System Conditions 1. Concentrations of substances extracted from the Earth’s crust must not systematically increase in nature 2. Substances produced by society must not systematically increase in nature 3. The physical basis for the productivity and diversity of nature must not be systematically reduced 4. Energy and other resources must not be used unjustly or inefficiently3
3rd party certification required
Optional1
YES4
NO3
Specific environmental performance requirements
NO: only a commitment to continuous improvement1
YES: specific environmental performance indicators must be met to maintain certification4
NO: only a commitment to the system conditions3
Date program started 19965 19954 19893
Number of facilities with implementation
>50,0005 >41004 >10006
Stated benefits • Improve environmental performance
• Increase competitive advantage
• Ensure compliance • Provide employee
assurance7
• Reduced costs • Risk minimization • Competitive
advantage • Increased employee
involvement 2,4
• Reduced material usage
• Good environmental stewardship
• Reduction of waste material
• Outreach to the community6
1 Martin 1998 2 Bracke et al. 2008 3 Reichert 1998 4 European Commission on Environment 2008 5 International Organization for Standardization 2008 6 The Natural Step 2009 7 Gonzalez-Benito 2005
13
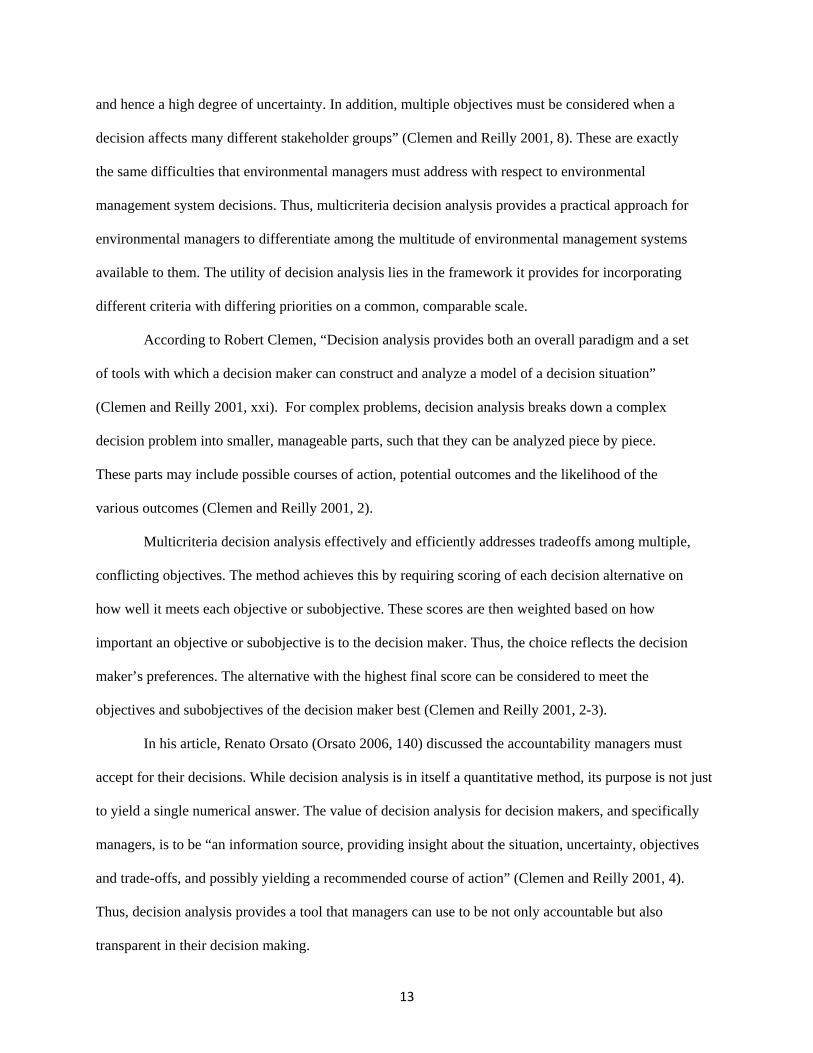
and hence a high degree of uncertainty. In addition, multiple objectives must be considered when a
decision affects many different stakeholder groups” (Clemen and Reilly 2001, 8). These are exactly
the same difficulties that environmental managers must address with respect to environmental
management system decisions. Thus, multicriteria decision analysis provides a practical approach for
environmental managers to differentiate among the multitude of environmental management systems
available to them. The utility of decision analysis lies in the framework it provides for incorporating
different criteria with differing priorities on a common, comparable scale.
According to Robert Clemen, “Decision analysis provides both an overall paradigm and a set
of tools with which a decision maker can construct and analyze a model of a decision situation”
(Clemen and Reilly 2001, xxi). For complex problems, decision analysis breaks down a complex
decision problem into smaller, manageable parts, such that they can be analyzed piece by piece.
These parts may include possible courses of action, potential outcomes and the likelihood of the
various outcomes (Clemen and Reilly 2001, 2).
Multicriteria decision analysis effectively and efficiently addresses tradeoffs among multiple,
conflicting objectives. The method achieves this by requiring scoring of each decision alternative on
how well it meets each objective or subobjective. These scores are then weighted based on how
important an objective or subobjective is to the decision maker. Thus, the choice reflects the decision
maker’s preferences. The alternative with the highest final score can be considered to meet the
objectives and subobjectives of the decision maker best (Clemen and Reilly 2001, 2-3).
In his article, Renato Orsato (Orsato 2006, 140) discussed the accountability managers must
accept for their decisions. While decision analysis is in itself a quantitative method, its purpose is not just
to yield a single numerical answer. The value of decision analysis for decision makers, and specifically
managers, is to be “an information source, providing insight about the situation, uncertainty, objectives
and trade-offs, and possibly yielding a recommended course of action” (Clemen and Reilly 2001, 4).
Thus, decision analysis provides a tool that managers can use to be not only accountable but also
transparent in their decision making.

14
Research Design
The design of this project was to compare three environmental management systems:
ISO14001, Eco-Management and Audit Scheme and The Natural Step. ISO14001 was an easy choice
for this project because it is the most widely implemented environmental management system.
Additionally, it is an international standard, and thus has been widely adopted across the world. The
Eco-Management and Audit Scheme was of interest because it contrasts with ISO14001, both in
implementation breadth (confined to Europe) and its very stringent compliance requirements. I
selected the Natural Step (TNS) as the third system in the project because TNS focuses on the softer,
human component of an organization’s operations, in addition to the environmental component.
Comparing this type of softer system against more regimented systems such as ISO and EMAS was
intriguing. An additional benefit of all three of these systems was that none of them were sector-
specific. They can all be applied to and adopted by many types and sizes of organizations.
To narrow the scope of my research, I chose to focus on two types of companies: chemical
and general manufacturing. I selected these companies because I had relationships with
environmental employees in both types of these organizations, and because they are two of the more
common industrial sectors, so their responses would resonate with a large proportion of the corporate
and industrial population.
To determine a set of attributes for comparing EMSs, and then to assess each of the systems
on these attributes, I consulted with several EMS “experts.” They were people who have significant
experience with environmental management systems and are either currently working with or have
worked with environmental management systems in the past. Most of these people were consultants
or academics with whom I had professional relationships prior to this project. I also solicited
feedback from an EMS specialist at a state regulatory agency.
To characterize the preferences and priorities among attributes for representative
corporations, I solicited preference feedback from a number of corporate environmental managers
from a spectrum of business sectors, from the financial industry to the chemicals industry and

15
including the food industry. These respondents were selected based on professional relationships from
my work as a consultant. Additionally, several respondents were selected from my relationships with
environmental professionals in the Air and Waste Management Association.
Finally, to evaluate the effectiveness and “user friendliness” of my decision tool, I solicited
feedback from the environmental manager of a small chemicals company that does not currently have
an EMS in place but is considering implementation of a formal system. This environmental manager
is someone with whom I have worked professionally. He inspired me to make this tool because he is
someone who wants to do the right thing and be proactive, but he does not always have the financial
and human resources to do it the “fancy” way.
Surveys and Interviews
I used both surveys and interviews to solicit feedback and personal preferences on the attributes,
measurement scales and final decision analysis tool from my research subjects. Table 2 summarizes the
research instruments which were used for each group of research subjects. The content of each of the
surveys/interviews is summarized below.
The purpose of the surveys and interviews with the corporate environmental representatives was
to:
• assess the organization’s priorities with respect to the implementation of their
environmental management systems;
• understand how the management system decision was made at their organizations and
what the driving factors were in those decisions; and,
• solicit respondents assessments of each of the decision criteria based on how important it
was to them and their organizations (assessment of weights).

16
Table 2. Research instruments used for groups of research subjects.
Research group Participants Research instrument
Feedback solicited
Corporate respondents
Environmental managers
Surveys, interviews
Personal preference for attributes
Experts (Group 1) Academics and consultants
Interviews Appropriateness of proposed attributes, measurement scales
Experts (Group 2) Industry managers, consultants, regulatory agency
Surveys Assessment of each EMS with provided attributes and measurement scales
Corporate environmental managers
two chemical, two manufacturing
Survey, interviews
Personal preference for attributes, levels of measurement scales
Reviewer Environmental manager at chemical company
Interview Personal preference for attributes, levels of measurement scales; comments regarding the interview process and the tool itself
The purpose of the interviews with environmental management system experts (Group 1) was to
determine the most appropriate attributes and associated measurement scales to be used for this decision
process. In the interview, I provided the respondents with copies of the proposed objectives hierarchy,
attributes and measurement scales. I requested the following feedback with closed-ended questions:
• agreement/disagreement regarding primary objectives and definition of attributes for an
EMS; and,
• opinions regarding the measurement scales defined for each attribute.
The purpose of the surveys with environmental management system experts (Group 2) was to
determine how well each of the selected environmental management systems performed based on the

17
decision criteria provided. The survey requested the following information from respondents using
closed-ended questions:
• scores for each assigned attribute for each system;
• comments regarding the definitions of attributes for an EMS; and,
• comments regarding clarity of the measurement scales defined for each attribute.
In some instances, I conducted interviews in place of surveys. I asked the subjects’ opinions
regarding the primary objectives and attributes of environmental management systems. Interviewees
were also asked for opinions regarding the clarity of the measurement scales defined for scoring each
attribute and also how they rated each attribute using the defined measurement scales.
Interviews were also conducted to follow up with survey subjects on their responses. Topics
for discussion included clarification of survey responses and inquiries regarding the quality of the
survey itself.
The purpose of the interviews and surveys with the environmental managers from the four
selected companies was to determine their personal preferences with respect to each level on the
measurement scales (utilities) and with respect to each attribute relative to the others (weights). The
objective of the surveys was to:
• solicit respondents’ assessments of each of the decision criteria listed based on how
important it was to them and their organizations (assessment of weights); and
• solicit respondents’ assessments of their relative preference for each value on the
measurement scale relative to the others (utilities).
The purpose of the interview with the reviewer was to evaluate the “rough draft” of the decision
tool. I selected this reviewer because he was available, comfortable with the method and familiar with the
concept of environmental management systems. The interview consisted of a full run of decision analysis

18
methods. These included questions to understand the reviewer’s preference for each level on a
measurement scale relative to the other levels, and also the respondent’s priorities for each of the
attributes relative to each other (attribute weights). The interview occurred in two sittings due to the
concentrated quantitative nature of the questions. The second meeting was used to fill in gaps from the
initial interview, to clarify some lingering questions and to ask general questions about the nature of the
tool itself.
Sensitivity Analysis
A sensitivity analysis was conducted using Logical Decisions (LDW) (Logical Decisions 2009)
software on the collected decision data to determine how sensitive the decision results were to variation in
the weights of all attributes used as inputs to the decision model.
Due to the use of human subjects, I filed an application for exemption from full review with
the Institutional Review Board regarding use of human subjects in this research. For this project,
human subjects were used for both surveys and interviews. Most of these subjects were recruited
through the researcher’s personal and professional networks. The surveys and the email letters used to
recruit survey respondents can be found in Appendix A.
APPLICATION OF METHODS To develop this decision analysis tool for environmental management systems, I applied
multiattribute utility theory, a method of multicriteria decision analysis. As described briefly in the
section above, multiattribute utility theory (MAUT) uses a combination of objectives, performance
scores, utilities and weights to determine the most useful alternative for the decision maker. The
required steps for decision analysis are described below as applied to this research project.
.

19
Determination of Decision Objective
To initiate the MAUT process, I first defined the overall decision objective and selected the
most likely alternatives for the decision. For this project, the decision objective was to select the
environmental/sustainability management system that is the best fit for an organization/decision
maker.
Determination of Subobjectives and Attributes
Once an objective has been determined, MAUT mandates that the objective be broken into
subobjectives, and the subobjectives into attributes, or criteria, that can be measured to determine the
progress toward that subobjective. For this project, I first conducted a general review of the management
systems that I used to generate an initial objectives hierarchy with attribute measurement scales. The
objectives hierarchy is the pictorial breakdown of the primary and subgoals of a decision. The subgoals
are further broken down into attributes, which are characteristics of the subgoals that can be assigned a
rating (quantitative or qualitative) using a defined measurement scale. The ratings provide a means for
comparison among various decision alternatives. The process of rating is often referred to as scoring.
By conducting a literature review, and using previous knowledge, I divided the objective into
three subobjectives: stakeholder priorities, reduced environmental impact and improved stakeholder
relationships. By researching the structure and formulation of each system, using feedback from some
initial interviews with environmental management system professionals and drawing on my
professional experience with management systems, I assembled an initial list of 25 criteria for
assessing the differences among the three systems.
To verify that these criteria were both meaningful and appropriate, I interviewed two people
with extensive management systems experience who work in the environmental field. The feedback
indicated that the allocation of attributes into the social, environmental and business categories were
fairly accurate. The most useful feedback was that out of the initial list of approximately 25 criteria,
many of them would not vary enough in performance to differentiate the three systems in the eyes of
20
stakeholders. By working closely with an EMS expert in academia, I was able to trim the list of 25
criteria to a more reasonably sized list of 11 criteria. The trimming process entailed grouping the
attributes into categories that were similar, and then eliminating those which could be considered
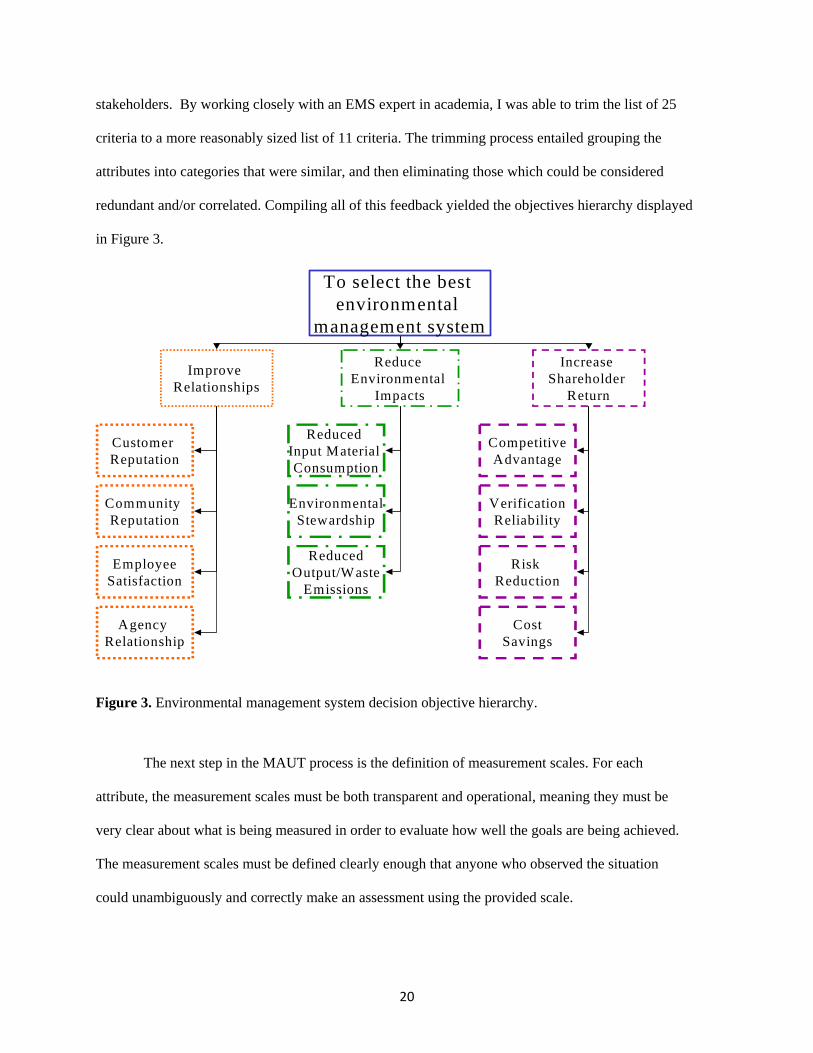
redundant and/or correlated. Compiling all of this feedback yielded the objectives hierarchy displayed
in Figure 3.
Figure 3. Environmental management system decision objective hierarchy.
The next step in the MAUT process is the definition of measurement scales. For each
attribute, the measurement scales must be both transparent and operational, meaning they must be
very clear about what is being measured in order to evaluate how well the goals are being achieved.
The measurement scales must be defined clearly enough that anyone who observed the situation
could unambiguously and correctly make an assessment using the provided scale.
Improve Relationships
Reduce Environmental
Impacts
Increase Shareholder
Return
To select the best environmental
management system
Customer Reputation
Community Reputation
EmployeeSatisfaction
Agency Relationship
Reduced Input Material Consumption
EnvironmentalStewardship
ReducedOutput/Waste
Emissions
CompetitiveAdvantage
VerificationReliability
Risk Reduction
CostSavings

21
The attribute scales which I determined through surveys and interviews are displayed in
Tables 3,4 and 5 for maximizing shareholder return attributes, reducing environmental footprint
attributes and improving stakeholder relationships attributes, respectively. I originally crafted
measurement scales for each attribute based on initial management system research and professional
knowledge of environmental management systems. I was able to finalize the scales using feedback
from interviews with an environmental management systems expert and an environmental
management systems practitioner. The feedback consisted mostly of adjustments to the numerical
scales to be more realistic. For example, in the initial measurement scales, the levels for assessing
competitive advantage were 0-5%, 5-10%, 10-15%, 15-20% and >20% additional business from new
customers. This was an unrealistic proposition, because it would be extremely difficult for a business
to recognize 0-5% additional business as the result of management system implementation. The
statistics would get lost in the noise of highs and lows of an organization’s business. Based on that
feedback, I adjusted the scale to make it more realistic by widening the measurement levels. The
interviewees also provided recommendations for proxy scales for several of the attributes. Proxy
scales are strongly correlated with the attribute, but easier and more convenient to measure than the
attribute itself. For example, one of the attributes I considered important in assessing these systems
with respect to their effect on stakeholder relationships was the relationship of the
facility/organization with the community. Trying to create a qualitative scale for this attribute that
would be transparent to any intelligent person was challenging, if not impossible. One of the
interviewees suggested that I instead assess the number of complaints received by the organization as
a proxy for the status of the relationship between the organization and the community.
Scoring of Attributes
After defining the measurement scales, the decision analyst must score the alternatives. In
this step, each of the alternatives needs to be scored based on how well that alternative performs with
respect to each attribute. To accurately assess how well each of the systems performs, I assembled a
22
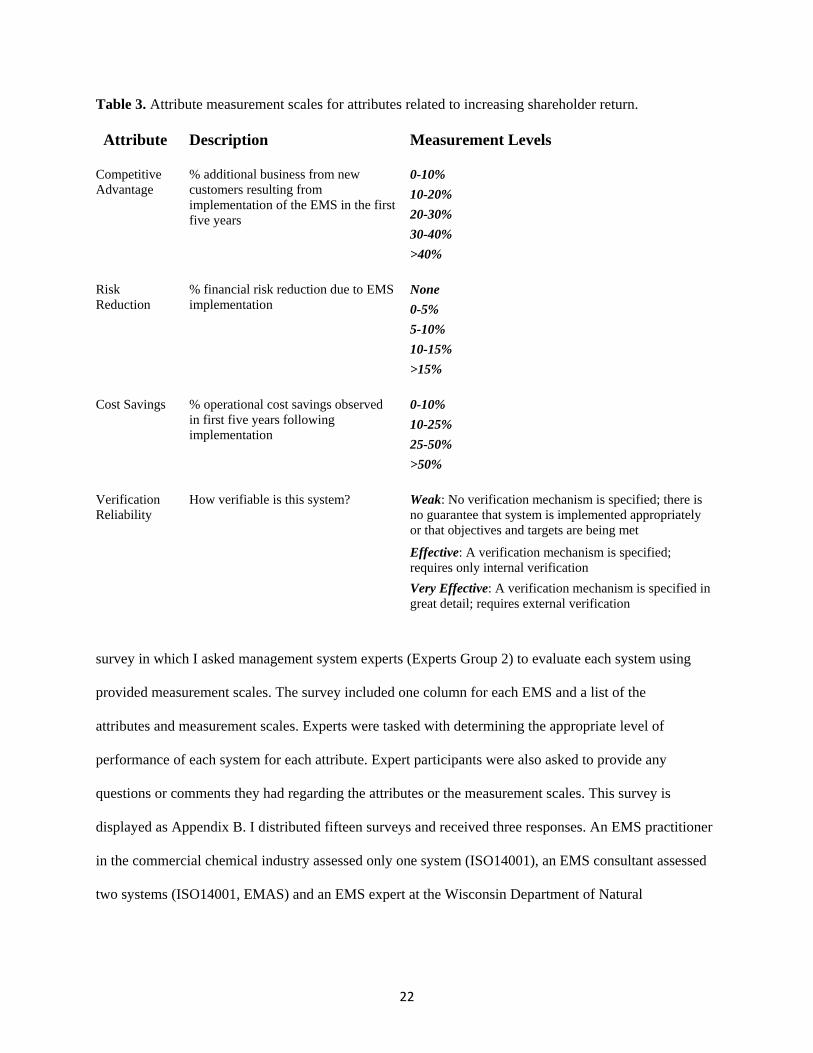
Table 3. Attribute measurement scales for attributes related to increasing shareholder return.
Attribute Description Measurement Levels
0-10% 10-20% 20-30% 30-40%
Competitive Advantage
% additional business from new customers resulting from implementation of the EMS in the first five years
>40%
None 0-5% 5-10% 10-15%
Risk Reduction
% financial risk reduction due to EMS implementation
>15%
0-10% 10-25% 25-50%
Cost Savings % operational cost savings observed in first five years following implementation
>50%
Weak: No verification mechanism is specified; there is no guarantee that system is implemented appropriately or that objectives and targets are being met
Effective: A verification mechanism is specified; requires only internal verification
Verification Reliability
How verifiable is this system?
Very Effective: A verification mechanism is specified in great detail; requires external verification
survey in which I asked management system experts (Experts Group 2) to evaluate each system using
provided measurement scales. The survey included one column for each EMS and a list of the
attributes and measurement scales. Experts were tasked with determining the appropriate level of
performance of each system for each attribute. Expert participants were also asked to provide any
questions or comments they had regarding the attributes or the measurement scales. This survey is
displayed as Appendix B. I distributed fifteen surveys and received three responses. An EMS practitioner
in the commercial chemical industry assessed only one system (ISO14001), an EMS consultant assessed
two systems (ISO14001, EMAS) and an EMS expert at the Wisconsin Department of Natural

23
Table 4. Attribute measurement scales for attributes related to reducing environmental impact.
Resources assessed all three systems. The performance scores for each system (Tables 6-8) were
implemented in the decision tool as a reference score for future users. Among the three data sets,
there were several slight discrepancies in assigned ratings. For any rating in which there was a
discrepancy between reviewers, the highest assigned rating was used. The highest rating was used
throughout because it reflects the maximum potential benefit of the implemented management
system. I believe that a decision maker will want to understand the maximum potential benefit of
performance with respect to a specific attribute, rather than an average, or conservative estimate.
All three systems scored the same for two of the attributes: employee satisfaction and
customer relationships (Tables 6-8). Since there is no variation in the performance of these two
attributes, they do not help differentiate among the three EMSs. However, since several of the other
Attribute Description Measurement Levels
No Change Little (0-25%) Intermediate (25-50%)
Reduced Consumption
How will this system contribute to reduction of total input material consumption?
Significant (>50%)
No Change Little (0-25%) Intermediate (25-50%)
Reduced Emissions How will the system contribute to total reduced emissions/waste?
Significant (>50%)
No: Not at all Somewhat: The system guidelines do not directly address environmental stewardship Moderate: The system guidelines address environmental stewardship; however, no formal guidance is provided.
Environmental Stewardship
Does the system provide a framework for responding to new environmental management challenges?
Significant: This is addressed directly in the system guidelines with specific guidance; the system is structured around predicting and preparing for future challenges

24
Table 5. Attribute measurement scales for attributes related to improving stakeholder relationships.
steps in the process, including personal preference surveys, were already complete before the systems
were fully assessed, I retained them for consistency.
Utility Determination
Once all of the alternatives were scored for each attribute, I determined how much the
decision maker preferred one level of performance on an attribute to a higher or lower level. For this
project, each point on each measurement scale for each attribute must be assessed.
Attribute Description Measurement Levels
None: Agency relationship will remain unchanged Some: The number of notices of violation will decrease by 0-20% in first five years
Agency Relationship
How will this system affect the organization’s relationship with regulatory agencies?
Significant: The number of notices of violation will decrease by greater than 20% in the first five years
No: There will be no observable change in morale/turnover rate Possible: There is a potential for employee morale to improve and turnover will improve by up to 5%.
Employee Satisfaction
Will implementation of this system contribute to employee morale and satisfaction within the first five years?
Definite: There will be an observable difference in morale and turnover will improve by greater than 5%
None: There will be no change in the number of complaints about operations
Slight: Number of complaints will decrease by 0-25% Moderate: Number of complaints will decrease 25-50%
Community Reputation
To what extent will implementation of this system improve the reputation of the organization in the community?
Significant: Number of complaints will decrease by more than 50%
<5
5-20% 20-50%
Customer Reputation
How much additional business will the organization receive from existing customers as a result of system implementation?
>50%

25
Table 6. Performance ratings for ISO14001, EMAS and The Natural Step from three experts in consulting, industry and regulatory compliance for maximizing shareholder return. Boldface type denotes performance ratings which were used in the decision analysis.
Attribute Expert ISO 14001 EMAS The Natural Step
Consulting 0-10% 0-10% Not Assessed Industry
0-10%
Not Assessed
Not Assessed
Cost savings
Compliance
>50%
25-50%
>50%
Consulting
10-20%
0-10%
Not Assessed
Industry
0-10%
Not Assessed
Not Assessed
Competitive advantage
Compliance
10-20%
0-10%
0-10%
Consulting
Effective
Very Effective
Not Assessed
Industry
Effective
Not Assessed
Not Assessed
Verification reliability
Compliance
Effective
Effective
Weak
Consulting
0-5%
5-10%
Not Assessed
Industry
None
Not Assessed
Not Assessed
Risk reduction
Compliance
0-5%
None
None
To elicit an accurate understanding of utility, I assembled a survey (Appendix C) in which I asked
four environmental managers (two each from chemical industry and general manufacturing) to
rate each measurement point relative to the others. In the survey, I asked respondents to rate each
measurement point for each criterion from 1-100 based on their relative preference for that
measurement point. Once all points values were assigned, the utilities were determined using the ratio
method (Clemen and Reilly 2001, 612).

26
Table 7. Performance ratings for ISO14001, EMAS and The Natural Step from three experts in consulting, industry and regulatory compliance for reducing environmental impact. Boldface type denotes performance ratings used in the decision analysis.
Attribute Expert ISO14001 EMAS The Natural Step
Consulting
25-50%
>50%
Not Assessed
Industry
25-50%
Not Assessed
Not Assessed
Reduced outputs
Compliance
25-50%
25-50%
25-50%
Consulting
25-50%
25-50%
Not Assessed
Industry
25-50%
Not Assessed
Not Assessed
Reduced inputs
Compliance
0-25%
0-25%
0-25%
Consulting
Somewhat
Somewhat
Not Assessed
Industry
Somewhat
Not Assessed
Not Assessed
Environmental stewardship
Compliance
Somewhat
Somewhat
Moderate
I received responses from four environmental managers, two from chemical manufacturing facilities,
and two from general manufacturing facilities. The chemical facilities differed in size, with one
having less than 500 people and one having up to 2,000 people. The manufacturing facilities also
differed in size, with one having less than 500 people and one having a little over 2,000 people. Once
all feedback was received, the utilities were input into the decision tool both as a reference for the
decision maker and to demonstrate the tool’s functionality. The corresponding utility functions for each of
the four decisionmakers are displayed in Figures 4 through 14.
In general, the two chemical facilities had more similarities in preferences with respect to the
environmental attributes than for those for either stakeholder relationships or shareholder return. They

27
Table 8. Performance ratings for ISO14001, EMAS and The Natural Step from three experts in consulting, industry and regulatory compliance for improving stakeholder relationships. Boldface type denotes performance assessments used in the decision analysis.
Attribute Expert ISO14001 EMAS The Natural Step
Consulting Slight Improvement
Slight Improvement
Not Assessed
Industry
Slight Improvement
Not Assessed
Not Assessed
Agency relationship
Compliance
None
None
None
Consulting
<5%
<5%
Not Assessed
Industry
<5%
Not Assessed
Not Assessed
Customer reputation
Compliance
<5%
<5%
<5%
Consulting
0-25% less complaints
0-25% less complaints
Not Assessed
Industry
25-50% less complaints
Not Assessed
Not Assessed
Community reputation
Compliance
0-25% less complaints
None
0-25% less complaints
Consulting
<5% turnover improvement
<5% turnover improvement
Not Assessed
Industry
<5% turnover improvement
Not Assessed
Not Assessed
Employee satisfaction
Compliance
<5% turnover improvement
<5% turnover improvement
<5% turnover improvement
had the greatest number of differences in their preferences with respect to stakeholder relationship
attributes. The two manufacturing facilities showed very similar preferences with respect to the attributes
for both the environmental and the stakeholder relationships. This seems logical since these facilities are

28
Figure 4. Utilities for competitive advantage from each of the four respondents.
Figure 5. Utilities for risk reduction from each of the four respondents.
Figure 6. Utilities for cost savings from each of the four respondents.

29
Figure 7. Utilities for verification reliability from each of the four respondents.
Figure 8. Utilities for reduced consumption from each of the four respondents.
Figure 9. Utilities for reduced emissions from each of the four respondents.

30
Figure 10. Utilities for environmental stewardship from each of the four respondents.
Figure 11. Utilities for agency relationship from each of the four respondents.
Figure 12. Utilities for employee satisfaction from each of the four respondents.

31
Figure 13. Utilities for community reputation from each of the four respondents.
Figure 14. Utilities for customer reputation from each of the four respondents.
of the same type. However, these similarities were not seen between the two chemical facilities, so it
is possible that the similarities observed between the preferences of the decisionmakers at the
manufacturing facilities were only a coincidence. If we look at the facilities of comparable size, we
see that the two larger facilties had the greatest number of similarities in preferences with respect to
those attributes which improved shareholder return and with respect to most of those attributes which
measured stakeholder relationships. The two smaller facilities also demonstrated similar preferences

32
with respect to attributes which improved shareholder return and improved stakeholder relationships.
Overall, more similarities were found between the facilities of equivalent size than between those in a
similar industrial sector.
Determination of Weights
After determining the relative levels of preference for each measurement level, I determined
the relative importance of each attribute (weights). To determine an accurate assessment of weights, I
assembled a survey in which I asked respondents to rate each attribute on a scale from 1-100 based on
how important it is to the respondent and their organization as they consider environmental
management systems (Appendix D). There were two groups of respondents for this survey. The first
group was the four environmental managers from the chemical and manufacturing facilities.
Approximately 45 other surveys were distributed to environmental managers working in a variety of
sectors in the corporate world with some familiarity with management systems. Twelve surveys were
returned yielding a response rate of 27%. I asked respondents to assign a weight of 0-100 both at the
primary objective level, and then separately at the level of the 11 attributes. To calculate the weights
from both sets of responses, I summed the total scores for all attributes. I then divided each individual
score by the total, effectively normalizing them such that the sum of all the weights was one.
To ensure that the priorities of each respondent were properly aligned and that the respondent
was consistent in his/her responses, I compared the weight assigned to each primary objective to the
total weights of the attributes directly related to that primary objective. For example, I added up the
weights for competitive advantage, risk reduction, cost savings and verification reliability and
compared the total to the weight allocated to the maximizing shareholder return sub-objective. This
comparison was conducted for all of the survey results received as an initial quality check of the
consistency of the weights assigned. I followed up with three environmental manager respondents
who had a discrepancy of greater than 5% between the subobjective weights and total of the

33
associated attribute weights. The responses from the chemical and manufacturing
facilities’representatives were not consistent. The smaller chemical facility was the only respondent
whose attribute weights reflected the weights given to the primary objectives. I followed up with the
other three respondents to inquire about their inconsistent preferences. The two larger facilities
indicated that they felt the weights allocated to the attributes were correct, so they reassigned weights
to the primary objectives to consistently reflect the weights assigned to the attributes. The smaller
manufacturing facility chose to reassign weights to some of the attributes to better align them with the
weights assigned to the primary objectives.
With respect to the four representatives from the chemical and manufacturing facilities, the
elicited weights differed among respondents (Table 9). However, I observed several similarities as
well. In general, those attributes associated with improving shareholder value were weighted more
heavily. Also, generally speaking, among the environmental attributes, these facilities valued
environmental stewardship more than being able to decrease emissions or decrease the amount of
material consumed. Additionally, verification reliability appears to be very important across all four
facilities. It is also interesting to note that the two smaller facilities viewed competitive advantage as
the most important attribute, but one of the larger facilities saw it as least important.
The survey responses of attribute weights from the variety of environmental managers across
many industries also varied significantly as expected (Table 10). I averaged the weights by industry,
for purposes of the tool. Consistent with the weights assigned by the four facility managers (Table 9),
both the verification reliability and environmental stewardship attributes were weighted most heavily.
These results contrast with those of Table 9 in that only one of the industries appears to strongly value
cost savings and competitive advantage. These results seem to indicate that companies adopting
EMSs are not as much motivated by financial indicators as they are by the reliability of the
verification mechanism and the ability of the system to prepare them for future environmental
challenges.

34
Table 9. Normalized weighting of attributes determined through surveys from two manufacturing industry environmental managers and two chemical industry managers.. Italicized numbers in parentheses are totals of associated attribute weights. Attribute Small
Chemical Facility
Large Chemical Facility
Small Manufacturing Facility
Large Manufacturing Facility
BUSINESS NEEDS
0.63 (0.51) 0.30 (0.31) 0.33 (0.37) 0.38 (0.30)
Competitive advantage
0.15
0.010
0.13
0.10
Cost savings
0.11
0.077
0.067
0.067
Reduced liability
0.081
0.11
0.067
0.010
Verification reliability
0.16
0.12
0.093
0.13
ENVIRONMENTAL IMPACT
0.31 (0.15)
0.36 (0.31)
0.33 (0.34)
0.38 (0.27)
Environmental stewardship
0.11
0.11
0.12
0.10
Reduced emissions
0.016
0.10
0.11
0.067
Reduce input material consumption
0.016
0.10
0.11
0.10
SOCIAL IMPACT
0.063 (0.34)
0.34 (0.38)
0.33 (0.30)
0.25 (0.43)
Improved agency relationship
0.010
0.095
0.11
0.12
Employee satisfaction
0.081
0.095
0.013
0.10
Customer reputation
0.13
0.077
0.093
0.10
Community reputation
0.13
0.11
0.093
0.10

35
Table 10. Weight assigned to three objectives and 11 attribute measures by environmental managers from five industry sectors. Italicized numbers in parentheses represent the total of associated attribute weights. Corporate Sector/Attribute
Electronics Mfg and Service (n=2)
Financial (n=2)
Chemical (n=2)
Food (n=1)
Consulting(n=5)
BUSINESS NEEDS 0.38 (0.37) 0.098 (0.24) 0.30 (0.29) 0.64 (0.51) 0.42 (0.46) Competitive advantage
0.061
0.034
0.00
0.15
0.069
Cost savings
0.00
0.081
0.078
0.12
0.13
Reduced liability
0.18
0.00
0.11
0.082
0.14
Verification reliability
0.12
0.12
0.120
0.16
0.13
ENVIRONMENTAL IMPACT
0.38 (0.37)
0.46 (0.34)
0.36 (0.31)
0.31 (0.15)
0.23 (0.17)
Environmental stewardship
0.24
0.13
0.11
0.12
0.13
Reduced emissions
0.061
0.11
0.10
0.016
0.042
Reduce input material consumption
0.061
0.11
0.10
0.016
0.00
SOCIAL IMPACT
0.25 (0.27)
0.44 (0.42)
0.34 (0.38)
0.063 (0.34)
0.35 (0.37)
Improved agency relationship
0.061
0.10
0.096
0.000
0.11
Employee satisfaction
0.024
0.11
0.096
0.082
0.11
Customer reputation
0.12
0.081
0.078
0.13
0.083
Community reputation
0.061
0.13
0.11
0.13
0.069
Calculation of Overall Utility
Using the performance scores, utilities and weights I solicited, I calculated overall utility of a
given alternative as follows:

36
1111332211 *...*** aaaaa uWuWuWuWU ++++=
where Ua is equal to the total utility of an alternative a, Wx is the weight on attribute x and uax is the
utility of the performance level of attribute x for alternative a.
I calculated the overall utility for each of the three EMSs, based on the preferences of the
representatives of each of the two chemical facilities and each of the two general manufacturing
facilities (Table 11). Based on these final utilities, EMAS was found to be the “best fit” system for
three out of four of the facilities. ISO14001 was found to be the “best fit” system for the chemical
facility with less than 500 employees. However, many of the final values for EMAS were quite close
to those for ISO14001, indicating that small differences in utility or weight could have changed the
results. I explored this possibility using sensitivity analysis.
Table 11. Overall utility of the three EMSs based on expert ratings of performance (Tables 6 through 8) and preferences of four industry representatives (Fig. 4-14 and Table 9). Respondent ISO14001 EMAS The Natural Step
Small
Chemical 0.41* 0.36 0.25
Large Chemical 0.38 0.40* 0.22
Small
Manufacturing 0.40 0.43* 0.22
Large Manufacturing 0.40 0.45* 0.25
* Most preferred alternative for each respondent
Sensitivity Analysis Sensitivity analysis involves adjusting the weights, utilities or performance ratings of various
attributes to determine how much they must change for a different alternative to become preferred.

37
Sensitivity analysis can be conducted using a spreadsheet program such as Excel or specialized
software programs such as Logical Decisions (Logical Decisions 2009). For this project, I used
Logical Decisions (Logical Decisions 2009) to conduct sensitivity analysis on the preferences of each
of the four environmental managers at the chemical and manufacturing facilities and on the weights
allotted to each attribute by each of the four managers. I also built an Excel model to conduct
sensitivity analysis on the performance assessments.
Sensitivity to Changes in Attribute Weights
For this sensitivity analysis discussion, I originally intended to analyze only those attributes
where a 10% increase or decrease in weight resulted in a different EMS being preferred. However, I
found that there were several attributes, specifically cost savings and environmental stewardship,
where there was significant variability in final utilities with a weight increase of greater than 10% that
warranted inclusion in this discussion.
Overall utilities of the three EMSs were sensitive to changes in the weight on verification
reliability for all four decisionmakers’ preferences (e.g.,Fig.15). For example, the weight allocated to
this attribute by the large chemical facility decisionmaker was about 12%, resulting in EMAS as the
preferred alternative. However, when this weight decreased by approximately three percent,
ISO14001 became the preferred alternative. EMAS became significantly more preferred as more
weight was applied to verification reliability because EMAS received a higher performance score for
verification reliability than either ISO14001 or The Natural Step. Also, note that no matter what
weight was applied to verification reliability, The Natural Step never became the preferred
alternative. The results of sensitivity analysis for change in weights on reduced outputs and emissions
for the preferences of three of the four facility decisionmakers were very similar to those for
verification reliability (e.g.,Fig. 16). For the preference set of the large manufacturing facility
decisionmaker, EMAS was the preferred alternative no matter what weight was applied to reduced
outputs and emissions.

38
Utility
Percent of Weight on Verification Reliability Goal
1.000
0.000
0 100
Eco-Management and Audit SchemeISO14001The Natural Step
Figure 15. Sensitivity of overall utility to changes in the weight on verification reliability for the preferences of the large chemical facility.
Utility
Percent of Weight on Reduced Output/Waste Emissions Goal
1.000
0.189
0 100
Eco-Management and Audit SchemeISO14001The Natural Step
Figure 16. Sensitivity of overall utility to changes in the weight on reduced outputs for the preferences of the large chemical facility.
The overall utilities for the three EMSs also showed significant sensitivity to changes in the
weight on cost savings for three of the four facility decisionmakers. The preferred alternative for the
preference set of the small chemical facility decisionmaker was consistently ISO14001, for all
weights applied to the cost savings attribute. The overall utilities of the large chemical facility and

39
small manufacturing facility were highly sensitive to small changes in the weight applied to cost
savings (<10%), where the large manufacturing facility required a larger weight change (>30%) to
cause a change in the the preferred alternative (Fig. 17). For the large manufacturing facility, the
weight initially allocated to cost savings was about 8%, which resulted in EMAS as the preferred
alternative. However, as more weight was applied to cost savings, ISO14001 became the preferred
alternative at approximately 40% weight, and The Natural Step became more preferred than EMAS at
approximately 70% weight. This was likely due to the better performance rating received by both The
Natural Step and ISO14001 for cost savings compared to EMAS. Note that this is one of the few
sensitivity analyses where The Natural Step was not completely dominated. Although the preferred
alternative for the large manufacturing facility does not change within the 10% weight change limits
originally set on the cost savings attribute, I included it in this discussion because all four
decisionmakers ranked cost savings as one of the top five attributes of importance in their weight
allocations.
Utility
Percent of Weight on Cost Savings Goal
1.000
0.190
0 100
Eco-Management and Audit Scheme
ISO14001The Natural Step
Figure 17 Sensitivity of overall utility to changes in the weight on cost savings for the preferences of the large manufacturing facility.
. The overall utilities for the three EMSs also showed significant sensitivity to small changes in

40
the weight applied to competitive advantage for all four facilities (Fig. 18). For example, for the small
manufacturing facility, at the 12% weight allocated by this decisionmaker, the preferred alternative
was EMAS. However, as slightly more weight was applied, the preferred alternative became
ISO14001 at approximately 20% weight. ISO14001 became significantly more preferred as more
weight was applied to competitive advantage likely due to the higher performance rating received by
ISO14001 on this attribute compared to EMAS and The Natural Step. Also note that no matter what
weight was applied to competitive advantage, The Natural Step never became the preferred
alternative.
Utility
Percent of Weight on Competitive Advantage Measure Measure
0.495
0.000
0 100
Eco-Management and Audit SchemeISO14001
The Natural Step
Figure 18. Sensitivity of overall utility to changes in the weight on competitive advantage for the preferences of the small manufacturing facility.
The overall utilities for the three EMSs also showed sensitivity to larger changes in the
weight applied to environmental stewardship for all four facilities (Fig. 19). For example, for the
small chemical facility, the preferred alternative changed from ISO14001 to The Natural Step with an
approximate 20% increase in weight on environmental stewardship. The Natural Step became the
most preferred alternative at approximately 30% weight, due to the strong performance score received
by The Natural Step on this attribute. A 20% weight increase is quite significant and highly
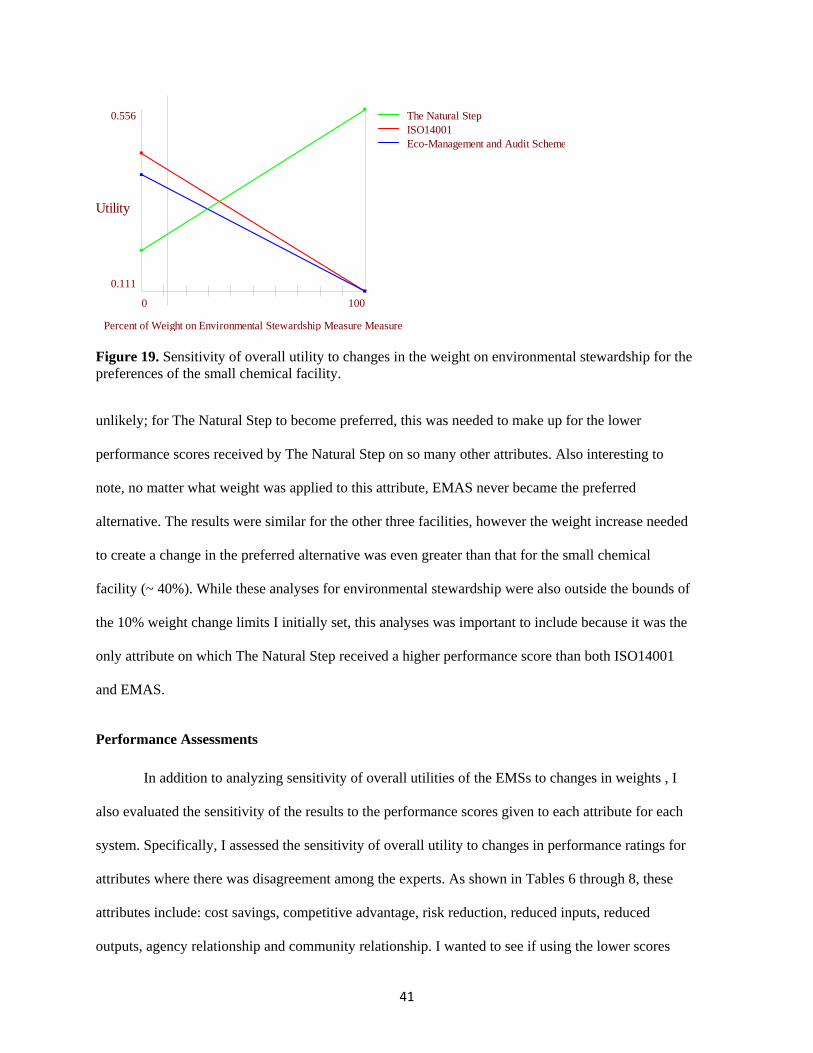
41
Utility
Percent of Weight on Environmental Stewardship Measure Measure
0.556
0.111
0 100
ISO14001Eco-Management and Audit Scheme
The Natural Step
Figure 19. Sensitivity of overall utility to changes in the weight on environmental stewardship for the preferences of the small chemical facility.
unlikely; for The Natural Step to become preferred, this was needed to make up for the lower
performance scores received by The Natural Step on so many other attributes. Also interesting to
note, no matter what weight was applied to this attribute, EMAS never became the preferred
alternative. The results were similar for the other three facilities, however the weight increase needed
to create a change in the preferred alternative was even greater than that for the small chemical
facility (~ 40%). While these analyses for environmental stewardship were also outside the bounds of
the 10% weight change limits I initially set, this analyses was important to include because it was the
only attribute on which The Natural Step received a higher performance score than both ISO14001
and EMAS.
Performance Assessments
In addition to analyzing sensitivity of overall utilities of the EMSs to changes in weights , I
also evaluated the sensitivity of the results to the performance scores given to each attribute for each
system. Specifically, I assessed the sensitivity of overall utility to changes in performance ratings for
attributes where there was disagreement among the experts. As shown in Tables 6 through 8, these
attributes include: cost savings, competitive advantage, risk reduction, reduced inputs, reduced
outputs, agency relationship and community relationship. I wanted to see if using the lower scores

42
from Tables 6 through 8 instead of higher ones when there was a disagreement would change the final
results. I assessed the sensitivity to performance ratings by changing the performance scores for one
attribute at a time from the highest to the lowest performance rating given by the experts, and finally,
by changing all of them from their highest to their lowest values together (Table 12). For the most
part, changing any one of the attribute performance ratings did not affect the final outcome. This
indicated that the decision to use the higher performance rating provided by the experts when there
was a discrepancy between two experts was acceptable. The most interesting result from this
evaluation was that when all of the attributes for each alternative were assessed at the lowest rating
received from an expert, for the preferences of all four environmental managers the preferred
alternative was The Natural Step. In reviewing the scores received by The Natural Step as listed in
Tables 6 through 8, the performance rating with the greatest impact was that assigned to cost savings.
The lone evaluator for The Natural Step indicated that greater than 50% savings can be achieved with
implementation of The Natural Step. This contrasted to the low scores (0-10%) received by ISO14001
and EMAS. Although EMAS and ISO14001 received higher performance ratings on other attributes
than The Natural Step, the difference was not significant enough to overcome The Natural Step’s cost
savings advantage. Given that The Natural Step performed so much more poorly on most attributes
than either ISO14001 and EMAS, and given the wide implementation of ISO14001 and EMAS, these
results indicated that the use of higher performance ratings provided a more plausible assessment of
the tradeoffs among the systems and that the assessment of greater than 50% cost savings for The
Natural Step may have been overly optimistic. This also served as a reminder that these performance
ratings would be more accurate if elicited from more experts. Thus, this assessment was only as good
as the judgment of the experts who provided information.
Final Interview with Decision System Reviewer
Once sufficient data were collected to determine expert values for performance scores,
utilities and weights, I conducted an interview with a corporate environmental professional who is

43
Table 12. Sensitivity of overall utilities of EMSs to changes in performance ratings (i.e., using the lower scores assigned by the experts, where high and low scores are those denoted in Tables 6-8) for the preferences of environmental managers from four types of facilities. Boldface font indicates the most preferred alternative for each scenario. Large boldface font indicates the preferred alternative is different than the base case.
Overall Utility of EMSs Performance
Ratings Alternative
Small Manufacturing
Large Manufacturing
Small Chemical
Large Chemical
ISO14001
0.398 0.396 0.411 0.379
EMAS 0.429 0.445 0.364 0.402
All high (base case)
TNS 0.218 0.245 0.251 0.220 ISO14001 0.33 0.328 0.296 0.301 EMAS 0.38 0.385 0.281 0.385
Cost savings lowest, all others highest TNS 0.218 0.245 0.251 0.220
ISO14001 0.371 0.362 0.355 0.379 EMAS 0.429 0.445 0.273 0.402
Competitive advantage lowest, all others highest
TNS 0.218 0.245 0.251 0.220
ISO14001 0.384 0.396 0.4 0.379 EMAS 0.402 0.445 0.343 0.342
Risk reduction lowest, all others highest TNS 0.218 0.245 0.251 0.220
ISO14001
0.398
0.396
0.411
0.368
EMAS 0.375 0.418 0.359 0.37
Reduced outputs lowest, all others highest TNS 0.218 0.245 0.251 0.220
ISO14001 0.344 0.355 0.404 0.379 EMAS 0.375 0.405 0.357 0.351
Reduced inputs lowest, all others highest TNS 0.218 0.245 0.251 0.220
ISO14001 0.371 0.359 0.411 0.338 EMAS 0.402 0.409 0.364 0.361
Agency relationship lowest, all others highest
TNS 0.218 0.245 0.251 0.220
ISO14001 0.37 0.365 0.345 0.36 EMAS 0.42 0.435 0.338 0.383
Community relationship lowest, all others highest
TNS 0.218 0.245 0.251 0.220
ISO14001 0.18 0.187 0.157 0.181 EMAS 0.17 0.177 0.131 0.176
All lowest
TNS 0.218 0.245 0.251 0.220
considering implementation of an environmental management system. The selection of this person
was purposeful; he was the person I had in mind when I started this project. This professional works

44
for a small chemical company (less than 500 employees) and has the title of facilities and operations
manager. Since he is not an owner of the company, he requested anonymity both for him and his
company. In my work with him professionally, I realized that he is someone who wants to do the
right thing and wants to be proactive and compliant, but he does not have the human or financial
resources to dedicate to research systems, make a custom EMS system or pay consultants a large sum
of money to do this for him.
The purpose of the interview was to test the usefulness of the decision tool. First, I introduced
the objectives hierarchy, and then each of the alternatives. Then, I explained the elicitation process. I
elicited utilities using the certainty equivalent method (Clemen and Reilly 2001, 538) and I elicited
weights using swing weighting (Clemen and Reilly 2001). I checked the weights for the 11 attributes
to ensure that they were consistent with those allocated to the three primary objectives: maximizing
shareholder return, reducing environmental impacts and improving stakeholder relationships. The
stakeholder relationship subobjective had a discrepancy, so we repeated the allocation to make the
attribute weights more consistent with the weight on stakeholder relationships. Following the
interview, I used the elicited utilities and weights to determine the most preferred alternative for the
decision maker. The most preferred alternative was ISO14001with a final utility of 0.48, followed by
EMAS with a final utility of 0.43 and then The Natural Step with a final utility of 0.31. This was a
logical result for several reasons. First, ISO14001 has a good verification mechanism, it will help
with environmental stewardship and it will help reduce financial risk, all factors which are important
to the decision maker. Additionally, a third party audit is not required, which would be an additional
expense for a small company with limited resources. Because it is managed and enforced by the
European Union, EMAS is confined to the European continent. Since the decision maker works for an
American company, certification under EMAS would be logistically impossible.
Similar to the results for the chemical and manufacturing facilities, I evaluated the sensitivity
of the reviewer’s results to determine which weights most significantly impacted the final outcome.

45
For the system reviewer, the weights with the most influence on the preferred alternative were
competitve advantage, environmental stewardship and reduced outputs (Figs. 20 through 22).
For the initial weight allocated to competitive advantage by the decision system reviewer
(~17%), the most preferred alternative was ISO14001 (Fig. 20). However, if this decisionmaker had
allocated about ten percent less weight to this attribute, the preferred alternative would have become
EMAS. ISO14001 became the preferred alternative at approximately 12% weight, likely due to the
higher performance score it received for competitive advantage compared to EMAS and The Natural
Step. This was also evident from how much more significantly ISO14001 became preferred as more
weight was applied to competitive advantage.Also, note that The Natural Step never became
preferred, no matter how much weight was applied to competitive advantage.
Utility
Percent of Weight on Competitive Advantage Measure Measure
0.521
0.000
0 100
ISO14001Eco-Management and Audit SchemeThe Natural Step
Figure 20. Sensitivity of overall utility to changes in the weight on competitive advantage for the preferences of the decision system reviewer.
For the initial weight allocated to environmental stewardship by the decision system reviewer
(~9%), the most preferred alternative was ISO14001 (Fig. 21). When the weight applied was
increased to approximately 25%, The Natural Step became the most preferred alternative. This was
logical since The Natural Step received a much higher performance rating on this attribute

46
Utility
Percent of Weight on Environmental Stewardship Measure Measure
0.923
0.154
0 100
ISO14001Eco-Management and Audit Scheme
The Natural Step
Figure 21. Sensitivity of overall utility to changes in the weight on environmental stewardship for the preferences of the decision system reviewer.
than the other two systems did. No matter how much weight was applied to this attribute, EMAS
never became preferred.
For the weight initially allocated to reduced outputs by the decision system reviewer (~12%),
ISO14001 was the preferred alternative (Fig. 22). However, if the weight on reduced outputs was
increased to about 18%, the preferred alternative became EMAS. This was likely due to the better
performance rating on this attribute for EMAS compared to the other two systems. Also note that no
matter how much weight was applied to this attribute, The Natural Step never became preferred.
Utility
Percent of Weight on Reduced Output/Waste Emissions Measure Measure
1.000
0.271
0 100
ISO14001Eco-Management and Audit Scheme
The Natural Step
Figure 22. Sensitivity of overall utility to changes in the weight on reduced outputs for the preferences of the decision system reviewer.
47
I also evaluated the sensitivity of the overall utilities of the three EMSs for my system
reviewer to changes in performance ratings given by experts in Tables 6 through 8. I changed each
attribute rating to its lowest level from Tables 6 through 8 one by one and also changed all 11 to their
lowest levels together (Table 13).These results indicated that the decision to use the higher
performance rating was acceptable because the rankings of EMSs are mostly the same. However,
similar to the four facility cases (Table 12), when all the low ratings were used, The Natural Step was
the most preferred alternative. As discussed previously, this indicated that the higher ratings provided
a more plausible assessment of tradeoffs and that the performance rating of more than 50% for The
Natural Step cost savings may be overly optimistic.
DISCUSSION
By constructing this tool, I have learned a significant amount about the motivations of
different types of companies implementing EMSs, the realities of implementation and the limitations
of one-size-fits-all systems. In general, the attributes which were most important to companies were
competitive advantage, verification reliability and environmental stewardship. Competitive advantage
was especially important to smaller companies. This seemed logical because smaller companies have
to work harder for customers, since many times they are limited in resources in comparison to larger
corporations. The consistently high weight allocated to verification reliability indicated that when
companies implement a system, they want confirmation that they have done it properly. This also
seemed logical because a company would not want to spend much time and effort implementing a
system without knowing whether it is operating correctly and/or efficiently. Environmental
stewardship also was consistently allocated significant weight. This indicated that companies want a
tool to help them prepare for the future with respect to environmental issues.
ISO14001 is the most implemented environmental management system in the world
(Gavronski et al. 2008). One might infer from this statistic that ISO14001 is the best environmental

48
Table 13. Sensitivity of overall utilities of EMSs to changes in performance ratings (i.e., using the lower scores assigned by the experts, where high and low scores are those denoted in Tables 6-8) for the preferences of the decision system reviewer. Boldface font indicates the most preferred alternative for each scenario. Large boldface font indicates the preferred alternative is different than the base case.
Performance ratings of attributes
Alternative
Overall utility for EMS
ISO14001 0.477 EMAS 0.426
All high (base case)
TNS 0.313 ISO14001 0.404 EMAS 0.397
Cost savings low, all others high
TNS 0.313 ISO14001 0.386 EMAS 0.426
Competitive advantage low, all others high
TNS 0.313 ISO14001 0.473 EMAS 0.385
Risk reduction low, all others high
TNS 0.313 ISO14001 0.477 EMAS 0.376
Reduced outputs low, all others high
TNS 0.313 ISO14001 0.439 EMAS 0.388
Reduced inputs low, all others high
TNS 0.313 ISO14001 0.453 EMAS 0.402
Agency relationship low, all others high
TNS 0.313 ISO14001
0.461
EMAS 0.403
Community relationship low, all others high
TNS 0.313 ISO14001 0.231 EMAS 0.207
All low
TNS 0.313

49
management system for any and every type of organization. The results of this study question the
accuracy of this premise. For three out of four organizations with environmental management systems
already in place, the most preferred alternative was the Eco-Management and Audit Scheme. Because
the Eco-Management and Audit Scheme is more stringent than ISO14001 with respect to verification
practices and environmental performance requirements, these results indicated that companies may be
looking for more structure and verification than ISO14001 has to offer. However, the name
recognition associated with ISO14001, in addition to reported lower implementation costs and level
of effort, are likely enough to sway companies toward that system. This would be especially true for
smaller companies that do not have as many human or physical resources to spend on stringent
verification processes and implementation efforts. This was further verified by the finding that
ISO14001 is the preferred alternative for the smaller chemical company respondent and for the final
tool reviewer, also from a small company.
Generally, EMAS and ISO14001 were very close in their overall performance scores, with
each system having certain strengths. ISO14001 was favored by small companies who prioritize
competitive advantage and cost savings. The larger companies tended to favor a system like EMAS,
which has a stringent validation process and significant environmental performance requirements.
The Natural Step was dominated on almost all attributes by the other two EMSs. The Natural Step
would be a preferred alternative only for a company who prioritizes environmental stewardship above
all else, a company not as concerned about validation or immediate cost savings or competitive
advantage. Surprisingly, there were very few trends in preferences observed between companies in
similar industrial sectors. The preferences of the two manufacturing companies were similar, but
those of the two chemical companies were not.
I found that many companies are actually employing more than one of these management
systems at a time. In my literature reviews, and in responses to several of my surveys, I saw examples
of companies that used ISO14001 to help them meet their EMAS certification requirements. Other
companies used ISO14001 to help them follow the four principles of The Natural Step. In fact, when I

50
contacted someone from The Natural Step (Jennifer Reid, Program Officer,The Natural Step Canada,
March 1, 2010), she indicated that The Natural Step organization actually recommends that people
have another system in place in tandem with The Natural Step. The representative stated that The
Natural Step is meant to be more of a crown that sits on top of a structured environmental
management system. She implied that The Natural Step was more of an add-on than a system in itself.
For this project, The Natural Step was treated independently, perhaps explaining the low performance
rating it received for so many of the attributes. However, I suspect that the scores would be quite
different for the combination of two or more systems. For another study, it might be interesting to see
how much more “useful” a set of systems would be to a decision maker instead of only one.
One expert said that he reviewed the survey, but did not feel it was realistic. The expert
indicated that, in his experience, the decision about management systems usually came down to
politics, control issues and corporate culture. He provided no other feedback. Because this comment
significantly questioned the premise of the project, I took it very seriously. I discussed this with three
professionals who work with environmental management systems on a regular basis. They confirmed
that the project indeed was significant and that there was no reason to question its premise.
Although the scope of this tool was appropriate for this master’s project, it was quite limited
in the grand scheme of things. At the beginning of the project, I struggled significantly in trying to
assemble a reliable objectives hierarchy and reasonable number of associated attributes. This
prolonged process likely would have been expedited had I conducted some preliminary interviews
with industry representatives before assembling the oversized hierarchy and attribute list that I did
initially. I solicited feedback from only two types of companies and from only two facilities of each
type. I only interviewed one person to assess the usefulness of the tool. More interviews likely would
have provided more well-rounded, valuable feedback. Also, due to time and resource constraints, the
utility and weight elicitations from the chemical and manufacturing facilities were completed mostly
by survey, whereas face to face interviews would likely have produced more accurate and thoughtful
results. Finding experts knowledgeable enough about management systems to assess each of them on

51
the criteria I developed was challenging. The assessments are only as good as the judgments of the
people who made the assessments. A larger number of experts would likely have resulted in more
reliable performance ratings. Most potential experts were familiar with one or perhaps two of the
systems, so the performance scores could potentially be biased because they were not scored relative
to the others.
CONCLUSIONS AND RECOMMENDATIONS The results of this project demonstrated that the Eco-Management and Audit Scheme was the
most preferred alternative for three out of four test cases. ISO14001 was the preferred alternative for
one small chemical facility test case and one small chemical facility user.
The most important attributes contributing to the overall merit of EMSs were verification
reliability and environmental stewardship. Companies want to ensure that the system they implement
is verifiable and that it will provide them with a process and a strategy for addressing new
environmental challenges. Some similarities were also seen in the decisionmakers’ assessments of the
importance of cost savings, competitive advantage and risk reduction for companies of similar size.
The smaller companies in particular were concerned with competitive advantage.
On the whole, the Eco-Management and Audit Scheme scored the best of the three EMSs on
the majority of the attributes. ISO14001 scored higher than EMAS only on cost savings, competitive
advantage and community reputation. The Natural Step scored higher than EMAS only on cost
savings and environmental stewardship. Although EMAS scored well, it was not perfect for all
company objectives.
Through the course of this project, it became apparent that most people, when they discuss
environmental management systems, have their own ideas about what they think the management
system should accomplish at their organizations. These preferences will determine how the
management system is implemented, and also how results are assessed. If cost savings are important,
organizations will look at financial impacts. If environmental footprint is important, they will

52
consider production and emissions. For the most part, the tool I created captured these different
preferences and provided one way to assess the tradeoffs among them.
Companies who do not know much about environmental management systems can use my
tool as a guide to narrow the scope of the many EMS options which are available. The tool also
serves as a good guide to sorting out what is really important to a company as they consider the
usefulness of an environmental management system. My hope is that these companies will expand the
tool for their own uses, populating the performance rating table with information about the systems
which are of interest to the decisionmakers in their organizations and adding organization-specific
preferences which may not be already included.
When companies use this tool and make decisions regarding environmental management
systems, I encourage them to consider a combination of EMSs rather than a single system such as
ISO14001. By implementing a combination of systems, such as ISO14001 and EMAS or ISO14001
and The Natural Step, companies can maximize the effectiveness of their efforts, meet more of their
goals, and make greater headway toward the triple bottom line of increased shareholder return,
reduced environmental impact and improved stakeholder relationships.
ACKNOWLEDGMENTS
Completion of this project would have been impossible without the assistance of a large number of
individuals. I would first like to thank all of the research subjects who participated in this study, most
especially the decision tool reviewer who provided inspiration for this project. I will always be
indebted to my advisor, Dr. Lynn Maguire, who challenged me in every way to be my best and
provided the right mix of patience and encouragement when it was most needed. Dr. Deborah Rigling
Gallagher inspired my interest in environmental management systems, and also served as a technical
expert and sounding board. I would also like to recognize Sarah Herndon, who provided technical
editing guidance and my classmates and friends Tom Bernitt and Sara Sahm Mroz who provided a

53
significant amount of moral support along the way. Finally, special thanks to my husband who
supported me the whole way and ensured that I ate and slept during the final weeks of chaos.

54
LITERATURE CITED Azapagic, Adisa and Slobadan Perden. "An Integrated Sustainability Decision Support
Framework Part I: Problem Structuring." International Journal of Sustainable Development and World Ecology 12.2 (2005): 98-112.
Bracke, Roeland and Johan Albrecht. “Competing Environmental Management Standards: How
ISO14001 outnumbered EMAS in Germany, the UK, France and Sweden.” Environment and Planning: Government and Policy 25 (2007): 611-27.
Bracke, Roeland, Verbecke, Tom and Veerle Dejonckheere. “What determines the decision to implement EMAS? A European Firm Level Study.” Environmental Resource Economics 41 (2008): 499-518.
Ciegis, Remigijus and Rokas Grunda. “Sustainable Business: The Natural Step Framework.” Environmental Research, Engineering and Management 2 (2006): 59-67.
Clemen, Robert T and Terence Reilly. Making Hard Decisions with Decision Tools. California:
Duxbury, 2001. European Commission on Environment. "What is EMAS?" European Commission on
Environment. http://ec.europa.eu/environment/emas/index_en.htm (accessed September 25, 2008). Gallagher, Deborah-Rigling. Course documents for DEL-MEM 2008 Spring Semester Class:
Business Strategy for Environmental Sustainability. (Module: Management Systems- Environmental Management Systems) Nicholas School of the Environment, Duke University: Durham, NC.
Gonzalez-Benito, J. and O. Gonzalez-Benito. “An Analysis of the Relationship between
Environmental Motivations and ISO14001 Certification.” British Journal of Management 16 (2005): 133-148.
Gonzalez, P., Sarkis, J., and B. Adenso-Diaz. “Environmental management system certification
and its influence on corporate practices-Evidence from the Automotive Industry”. International Journal of Operations and Production Management 28(2008): 1021-41.
Institute of Environmental Management and Assessment. "Introducing EMAS." Institute of Environmentaal Management and Assessment. http://www.emas.org.uk/aboutemas/mainframe.htm (accessed February 20, 2009).
International Organization for Standardization. "ISO-Management Standards." International Organization for Standardization. http://www.iso.org/iso/management_standards.htm (accessed September 19, 2008). Fryxall, Gerald, Wing-Hung Lo, Carlos and Shan Shan Chung. "Influence of Motivations for
Seeking ISO14001 Certification on Perceptions on EMS Effectiveness in China." Environmental Management 33.2 (2004): 239-51.

55
Johnston, Paul, Mark Everard, David Santillo, and Karl-Henrik Robert. “Reclaiming the
Definition of Sustainability.” Environmental Science and Pollution Res 14 (2007): 60-6. Leadbitter, Jason. "PVC and Sustainability." Progress in Polymer Science 27(2002): 2197-2226. MacDonald, Jamie P. “Strategic Sustainable Development using the ISO14001 Standard.”
Journal of Cleaner Production 13 (2005): 631-43. Martin, Raymond. ISO 14001 Guidance Manual. Tennessee: National Center for Environmental
Decisionmaking Research, 1998. Orsato, Renato J. "Competitive Environmental Strategies: When Does It Pay to Be Green?"
California Management Review 48.2 (2006): 127-43. Reichert, Joel. IKEA and the Natural Step. University of Virginia Darden Graduate School of
Business: World Resources Institute. Charlottesville, 1998.
Rowland-Jones, Rhys, Meinwen Pryde, and Malcolm Cresser. “An Evaluation of Current Environmental Management Systems as indicators of Environmental Performance.” Management of Environmental Quality 16 (2005): 211-19.
Sambasivan, Murali and Ng Yun Fei. "Evaluation of Critical Success Factors of Implementation
of ISO 14001 Using Analytic Hierarchy Process (Ahp): A Case Study from Malaysia." Journal of Cleaner Production 16 (2008): 1424-33.
Stead, W. Edward, Jean Garner Stead and Mark Starik. Sustainable Strategic Management. New
York: M.E. Sharpe, 2004. The Natural Step, Canada. "TNS Framework-Overview". The Natural Step. http://www.naturalstep.ca/understanding-sustainability.html (accessed September 19, 2008). United Nations Environment Programme. "Sustainability Management and Reporting- Benefits
for Financial Institutions in Developing and Emerging Economies." Geneva, 2006. United States Environmental Protection Agency. "Basic Information-Environmental Management Systems." United States Environmental Protection Agency. http://www.epa.gov/EMS/info/index.htm (accessed September 25, 2008). United States. Environmental Protection Agency. "Environmental Management System Tools: A Reference Guide." June 2001. http://www.epa.gov/EMS/resources/guides.htm (accessed
September 19, 2008).

56
APPENDICES

57
Appendix A: Recruitment Letter for Project Participants
RESEARCH INSTRUMENTS
Recruitment will consist primarily of an initial email solicitation, and then either a phone call or another email
follow-up after the subject has expressed interest in participating.
Initial Email:
Dear _________:
As you may know, in addition to my job at Environmental Resources Management, I am currently in my second
year of a two-year graduate program through Duke University’s Nicholas School of the Environment. My final
master’s project is the construction of a decision analysis tool to evaluate tradeoffs in environmental management
systems. The three systems I am evaluating in this project are ISO14001, The Natural Step and the Eco-
Management and Audit System (EMAS)
[For corporate representatives, this paragraph applies]: I am interested in better understanding what criteria are
important to you and your organization as you consider implementing or when you implemented your
environmental management system. What about the system makes it a good fit for your organization? What
criteria did you consider significant? Insignificant? What was your organizations drivers in implementation?
[For consultants and experts in EMS]: Based on an understanding of each of these systems and a literature
review, I have assembled a list of criteria which could be considered significant for one or more of these systems.
To create an effective tool, I need an understanding of how well each of the systems scores for each of these
criteria. Given your experience in this field, I am hoping that you will provide a realistic assessment of each of
these systems using the given criteria and measurement scales. I am also interested in understanding how well
I’ve captured relevant criteria and if the proposed measurement scales are appropriate for the given criteria.
Information gathered in this survey will be useful in building a realistic decision tool that corporations can use to
evaluate the tradeoffs between these three systems. It will also be flexible enough to add or subtract one system or
another for further comparison. If you or other colleagues would be interested in contributing to the project,
please respond to this e-mail so I can provide more details. Then, if you decide to participate, I will administer a
survey electronically or by telephone, whichever is most convenient for you and your colleagues.
Thank you for your time and please let me know if you have any questions. I look forward to hearing from you.
Sincerely,
Mary Pat Bomher
DEL-MEM 08
Nicholas School of the Environment

Additional information on each system can be found at the following urls:
The Natural Step: http://www.thenaturalstep.org/en/canada/
ISO14001: www.praxiom.com/iso-14001-2004.htm
EMAS: http://ec.europa.eu/environment/emas/index_en.htm
Criteria Units Measurement Points ISO14001 EMAS
The Natural
Step Comments
0-10%
10-20%
20-30%
30-40%
>40%
0-10%
10-25%
25-50%
>50%
Sub-Objective: Increasing Shareholder Return
Cost Savings: What percent of cost savings
will be observed as a result of this EMS
implementation within the first five years of
implementation?
% cost
savings
% Additional
Profit
Environmental Management System Assessment INSTRUCTIONS: Below, you will find a table with a list of criteria for evaluating the differences between ISO 14001, Eco-Management and Audit System (EMAS) and
The Natural Step. For each criteria, a scale has been proposed with between two and five assessment levels.
Based on your experience and expertise, please assign a rating to each of the three systems for each criteria using one of the points from the measurement scale provided.
Please note any comments or questions you have regarding the criteria or measurement scales in the comments column.
Primary Objective: To select the "best" environmental management system
Competitive Advantage: What percent of
additional business from new customers will be
observed within the first five years of EMS
implementation?
Appendix B: Performance Assessment Survey
58

Criteria Units Measurement Points ISO14001 EMAS
The Natural
Step Comments
Sub-Objective: Increasing Shareholder ReturnNone
0-5%
5-10%
10-15%
>15%
Weak : The verification mechanism
is ineffective; both objectives and
targets and continuous
improvement are destined to fail
Effective : The verification
mechanism will contribute to
continual improvement but not all
objectives and targets
Very Effective : The verification
mechanism will result in continuous
improvement and all objectives and
targets being met.
No Change
Little (0-25% reduction)
Intermediate (25-50% reduction)
Significant (>50% reduction)
Verification Liability: How verifiable will the
stakeholders of the organization view the
system?
Sub-objective: Reduce Environmental Impacts
% reductionReduced Input Material Consumption: How
will implementation of this system contribution
to reducing input material consumption within
the first five years?
Risk Reduction: What % financial risk
reduction from production will be observed
due to EMS implementation?
% risk
reduction

Criteria Units Measurement Points ISO14001 EMAS
The Natural
Step Comments
Sub-Objective: Increasing Shareholder ReturnNo Change
Little (0-25% reduction)
Intermediate (25-50% reduction)
Significant (>50% reduction)
No: Not at all
Somewhat: System indirectly
addresses the issue but provides no
specific guidance on how to enact
Moderate: The system provides
very general guidelines for change
management but no direct detail.
Significant : This is a primary
characteristic of the system; it is
structured around predicting and
preparing for future challenges.
Sub-objective: Improving Stakeholder Relationships
Reduced Emissions: How will system
implementation contribute to the reduction of
emissions and/or waste within the first five
years?
% reduction
Environmental Stewardship: Does this
system provide a structure for responding to
new environmental management challenges?

Criteria Units Measurement Points ISO14001 EMAS
The Natural
Step Comments
Sub-Objective: Increasing Shareholder ReturnNone : Agency relationship will
remain unchanged.
Some : The number of NOVs and
inspections will decrease by up to
20% in the first five years.
Significant : The number of NOVs
and inspections will decrease by
greater than 20% in the first five
years.
No : There will be no observable
change in employee morale and
turnover rate.
Possible : Employee morale may
improve and the employee turnover
rate will improve by up to 5%.
Certain : There will be an
observable difference in employee
morale and the employee turnover
rate will improve by greater than
5%
None : There will be no change in
the number of complaints about
operations.
Slight : The number of complaints
will decrease by 0-25%
Moderate: The number of
complaints will decrease by 25-50%
Significant: The number of
complaints will decrease by greater
than 50%
Employee Satisfaction: Will implementation
of this system contribute to employee morale
and satisfaction within the first five years?
Employee
Turnover
Community Reputation: To what extent will
implementation of this system improve the
reputation of the organization with the local
community within the first five years?
% complaint
reduction
Agency Relationship: How will
implementation of this system affect the
organization's relationship with regulatory
agencies within the first five years?
% reduction
in NOVs and
inspections

Criteria Units Measurement Points ISO14001 EMAS
The Natural
Step Comments
Sub-Objective: Increasing Shareholder Return<5%
5-20%
20-50%
>50%
Do you give approval for the use of your name and company's name in the final, published version of this
project?
______ YES ______ NO
Customer Reputation: How much additional
business will the organization receive from
existing customers within the first five years as
a result of system implementation?
% additional
profit

Environmental Management System Assessment Survey- Part II
Additional information on each system can be found at the following urls:
The Natural Step: http://www.thenaturalstep.org/en/canada/
ISO14001: www.praxiom.com/iso-14001-2004.htm
EMAS: http://ec.europa.eu/environment/emas/index_en.htm
Attribute Description Measurement Levels Score
0-10%
10-20%
20-30%
30-40%
>40%
None
0-5%
5-10%
10-15%
>15%
0-10%
10-25%
INSTRUCTIONS: Below, you will find a table with a list of criteria for evaluating the tradeoffs between ISO 14001, Eco-Management and Audit System (EMAS) and The
Natural Step. For each criterion, a scale has been proposed with 1-5 measurement points.
1. For each measurement point, please assign a points value between 0-100 based on the importance of that level of performance to you relative to the others. For
example, to evaluate toppings for an ice cream dish, I might assign 25 points for chocolate sauce, 35 points for chocolate sauce with sprinkles but 90 points for chocolate
sauce, sprinkles and whip cream because whip cream means that much more in my relative preference. For responses requesting numerical values, scores will be assigned
using proportional scoring based on worst and best possible outcomes for that criteria. If you feel that any of the measurement scales or criteria are inappropriate or unclear,
please note in the comment box. Also, please make suggestions for any other criteria you would consider important in evaluating tradeoffs between these systems.
INCREASING SHAREHOLDER VALUE
Competitive Advantage
% additional business from new customers resulting from
implementation of the EMS in the first five years
Risk Reduction
% financial risk reduction from production observed due to
EMS implementation

25-50%
>50%
Weak : No verification
mechanism is specified;
there is no guarantee that
system is implemented
appropriately or that
objectives and targets are
being met
Effective : A verification
mechanism is specified;
requires only internal
verification
Very Effective : A
verification mechanism is
specified in great detail;
requires external verification
No Change
Little (0-25%)
Intermediate (25-50%)
Significant (>50%)
REDUCING ENVIRONMENTAL IMPACT
Cost Savings
% operational cost savings observed in first five years
following implementation
Verification Reliability How verifiable is this system?
Reduced Consumption
How will this system contribute to reduction of input
material consumption?

No Change
Little (0-25%)
Intermediate (25-50%)
Significant (>50%)Reduced Emissions How will the system contributed to reduced emissions/waste?

No : Not at all
Somewhat : The system
guidelines do not directly
address environmental
stewardship
Moderate: The system
guidelines address
environmental stewardship,
however, no formal
guidance is provided.
Significant: This is
addressed directly in the
system guidelines with
specific guidance; is the
system is structured around
predicting and preparing for
future challenges
None : Agency relationship
will remain unchanged
Some : The number of
notices of violation will
decrease by 0-20% in first
five years
Significant : The number of
notices of violation will
decrease by greater than
20% in the first five years
No: There will be no
observable change in
morale/turnover rate
Possible: Employee morale
may improve and turnover
may improve by up to 5%
Definite: There will be an
observable difference in
morale and turnover will
improve by greater than 5%Employee Satisfaction
IMPROVING STAKEHOLDER RELATIONSHIPS
Agency Relationship
How will this system affect the organization’s relationship
with regulatory agencies?
Does the system provide a framework for responding to new
environmental management challenges?
Will implementation of this system contribute to employee
morale and satisfaction within the first five years?
Environmental Stewardship

None: There will be no
change in the number of
complaints about operations
Slight: Number of
complaints will decrease by
0-25%
Moderate: Number of
complaints will decrease 25-
50%Significant: Number of
complaints will decrease by
more than 50%
<5
5-20%
20-50%
>50%
Community Reputation
To what extent will implementation of this system improve
the reputation of the organization in the community?
Customer Reputation
How much additional business will the organization receive
from existing customers as a result of system
implementation?
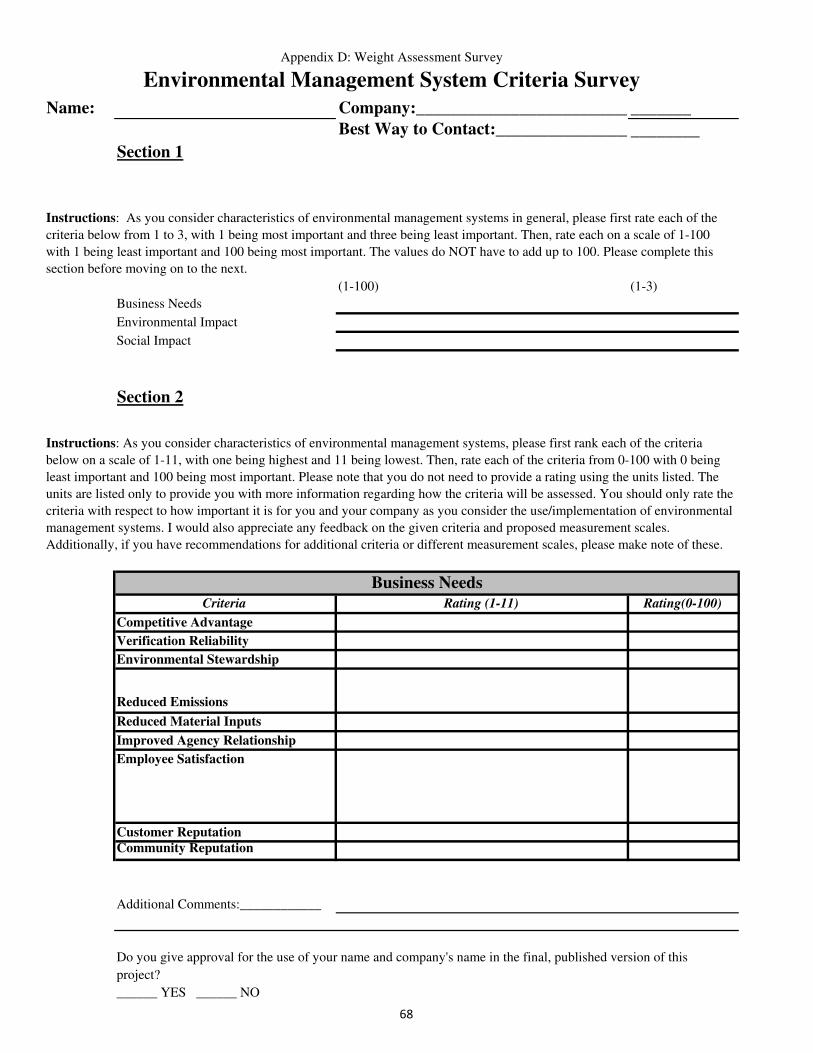
Environmental Management System Criteria Survey
Name: Company:______________________________ _______
Best Way to Contact:_____________________________
Section 1
(1-100) (1-3)
Business Needs
Environmental Impact
Social Impact
Section 2
Criteria Rating (1-11) Rating(0-100)
Competitive Advantage
Verification Reliability
Environmental Stewardship
Reduced Emissions
Reduced Material Inputs
Improved Agency Relationship
Employee Satisfaction
Customer Reputation
Community Reputation
Additional Comments:____________
Do you give approval for the use of your name and company's name in the final, published version of this
project?
______ YES ______ NO
Business Needs
Instructions: As you consider characteristics of environmental management systems, please first rank each of the criteria
below on a scale of 1-11, with one being highest and 11 being lowest. Then, rate each of the criteria from 0-100 with 0 being
least important and 100 being most important. Please note that you do not need to provide a rating using the units listed. The
units are listed only to provide you with more information regarding how the criteria will be assessed. You should only rate the
criteria with respect to how important it is for you and your company as you consider the use/implementation of environmental
management systems. I would also appreciate any feedback on the given criteria and proposed measurement scales.
Additionally, if you have recommendations for additional criteria or different measurement scales, please make note of these.
Instructions: As you consider characteristics of environmental management systems in general, please first rate each of the
criteria below from 1 to 3, with 1 being most important and three being least important. Then, rate each on a scale of 1-100
with 1 being least important and 100 being most important. The values do NOT have to add up to 100. Please complete this
section before moving on to the next.
Appendix D: Weight Assessment Survey
68