Embed Size (px)
Citation preview
Earnings Release
CONSOLIDATED FINANCIAL STATEMENTSNintendo Co., Ltd. and Consolidated Subsidiaries
October 26, 2006Nintendo Co., Ltd. 11-1 Kamitoba hokotate-cho,Minami-ku, Kyoto 601-8501Japan
FINANCIAL HIGHLIGHTS1. Consolidated Results for the Six Months Ended September 2005 and 2006, and Year Ended March 31, 2006(1) Consolidated operating results (Amounts below one million are rounded down)
Net sales Operating income Income before income taxes and extraordinary items
million yen % million yen % million yen % Six months ended Sept. 30, '06Six months ended Sept. 30, '05
Year ended Mar. 31, '06
Net income Net income per share Diluted net income per sharemillion yen % yen yen
Six months ended Sept. 30, '06Six months ended Sept. 30, '05
Year ended Mar. 31, '06[Notes] *Investment gains (losses) on equity method:
*Average number of shares outstanding (consolidated basis):
*Changes in accounting policies: none
(2) Consolidated financial positionTotal assets Net assets Capital adequacy ratio
million yen million yen % yen As of Sept. 30, '06As of Sept. 30, '05As of Mar. 31, '06
[Notes] *Number of shares outstanding (consolidated basis): As of Sept. 30, '06: 127,909,148 shares, As of Sept. 30, '05: 127,917,607 shares, As of Mar. 31, '06: 127,914,104 shares(3) Consolidated cash flows
Cash flows fromoperating activities
Cash flows frominvesting activities
Cash flows fromfinancing activities
Cash and cashequivalents - ending
million yen million yen million yen million yenSix months ended Sept. 30, '06Six months ended Sept. 30, '05
Year ended Mar. 31, '06
(4) Company group information Consolidated subsidiaries: 20 Non-consolidated subsidiary with equity method applied: 0 Affiliates with equity method applied: 7
(5) Change in scope of consolidation and equity method application Consolidated subsidiaries: 1 newly added Affiliates with equity method applied: no change
2. Forecast for the Fiscal Year Ending March 2007 (April 1, 2006 - March 31, 2007)
Net sales Income before income taxesand extraordinary items Net income
million yen million yen million yenYear ending Mar. 31, '07
Estimated annual earnings per share: 781.80 yen
[Notes] *With respect to the forecast, please refer to page 3 for the forward-looking conditions and other related matters.
603,253 580,835 (40,994)
7,149.40 7,613.79 83.9
*The number of outstanding shares used for calculating "Estimated annual earnings per share" is not the one at the six-month period end but the estimated average number of shares outstanding for the fiscal year.
740,000 170,000 100,000
46,382 (60,166) (63,523)
(208,807) (51,150) (100,382)
19,993
617,139
-
78.3
Six months ended Sept. 30, '06: 127,911,816 shares, Six months ended Sept. 30, '05: 129,722,707 shares, Year ended Mar. 31, '06: 128,821,844 shares
82.9 914,533
Net assets per share
- 762.28 282.34
989,319 1,103,618
160,759 509,249
7,733.31
424.86
-
(28.3) 90,349
176,364 56,824 67,111
Six months ended Sept. 30, '06: 1,292 million yen, Six months ended Sept. 30, '05: 1,519 million yen, Year ended Mar. 31, '06: 267 million yen
(25,485)
1,160,703
54,345 36,625 98,378
48.4
1,263,030
(21.1)
298,817
974,091
242.2 19,613
*Percentage for net sales, operating income, income before income taxes and extraordinary items, and net income show increase (decrease) from the previous semi-annual consolidated accounting period.
69.4 94,676 (51.0) (6.2)
66.6
<Appendix> Nintendo Co., Ltd.(consolidated)
COMPANY GROUP INFORMATION
Distribution channelOther channel
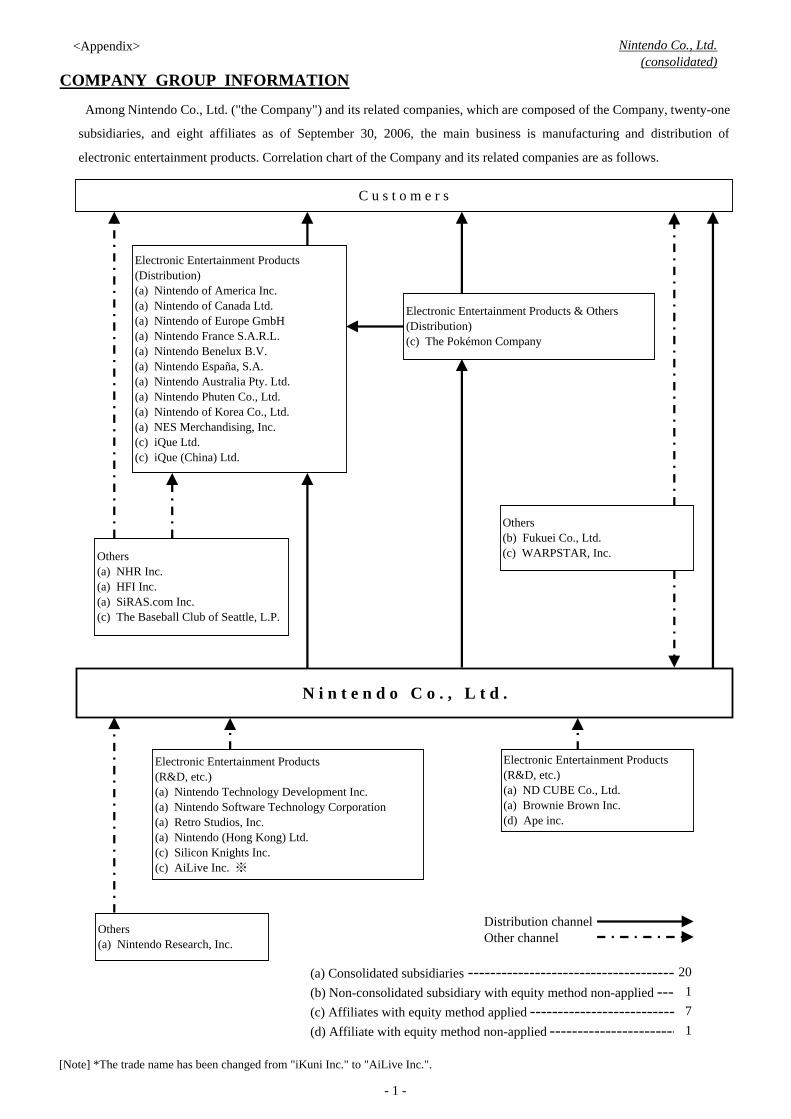
(a) Consolidated subsidiaries ------------------------------------- 20(b) Non-consolidated subsidiary with equity method non-applied --- 1(c) Affiliates with equity method applied -------------------------- 7(d) Affiliate with equity method non-applied ----------------------- 1
[Note] *The trade name has been changed from "iKuni Inc." to "AiLive Inc.".
C u s t o m e r s
Others(b) Fukuei Co., Ltd.(c) WARPSTAR, Inc.
Electronic Entertainment Products(R&D, etc.)(a) ND CUBE Co., Ltd.(a) Brownie Brown Inc.(d) Ape inc.
Electronic Entertainment Products(Distribution)(a) Nintendo of America Inc.(a) Nintendo of Canada Ltd.(a) Nintendo of Europe GmbH(a) Nintendo France S.A.R.L.(a) Nintendo Benelux B.V.(a) Nintendo España, S.A.(a) Nintendo Australia Pty. Ltd.(a) Nintendo Phuten Co., Ltd.(a) Nintendo of Korea Co., Ltd.(a) NES Merchandising, Inc.(c) iQue Ltd.(c) iQue (China) Ltd.
Others(a) NHR Inc.(a) HFI Inc.(a) SiRAS.com Inc.(c) The Baseball Club of Seattle, L.P.
Electronic Entertainment Products(R&D, etc.)(a) Nintendo Technology Development Inc.(a) Nintendo Software Technology Corporation(a) Retro Studios, Inc.(a) Nintendo (Hong Kong) Ltd.(c) Silicon Knights Inc.(c) AiLive Inc. ※
N i n t e n d o C o . , L t d .
Among Nintendo Co., Ltd. ("the Company") and its related companies, which are composed of the Company, twenty-one
subsidiaries, and eight affiliates as of September 30, 2006, the main business is manufacturing and distribution of
electronic entertainment products. Correlation chart of the Company and its related companies are as follows.
Electronic Entertainment Products & Others(Distribution)(c) The Pokémon Company
Others(a) Nintendo Research, Inc.
- 1 -
<Appendix> Nintendo Co., Ltd.(consolidated)
MANAGEMENT POLICY
1. Basic Management Policy
2. Basic Policy of Profit Distribution
3. Targeted Management Index
4. Medium and Long Term Management Strategy and Challenges
5. Matters Pertaining to Parent Company
In the field of home entertainment, Nintendo Co., Ltd. ("the Company") and its consolidated subsidiaries (together with theCompany, "Nintendo") strive to create new and unique forms of entertainment while maintaining a robust business structure.
Nintendo places the highest emphasis on providing customers with a "world of fun", which is both innovative andentertaining with creative elements that have never been experienced.
It is the Company's basic policy to internally provide the capital necessary to fund future growth, including capitalinvestments, and to maintain a strong and liquid financial position in preparation for sudden changes in the businessenvironment and intensified competition. As for direct profit returns to our shareholders, dividends are paid consideringprofit levels evaluated in each fiscal period.
Annual dividend per share will be established at the higher of the amount calculated by dividing 33% of consolidatedoperating income by the total number of outstanding shares, excluding treasury stock, as of the end of the fiscal yearrounded up to the 10 yen digit, and the amount calculated based on the 50% consolidated net income standard rounded up tothe 10 yen digit. Although no maximum level is established, the annual minimum dividend per share is kept at 140 yen.
Retained earnings are maintained for effective use in research of new technology and development of new products, capitalinvestments, enhancement of selling power, and common stock buyback whenever deemed appropriate.
In the home entertainment industry, it is essential to provide new and entertaining products consistently. Uponaccomplishing this, Nintendo aims to improve its corporate value by sustaining robust growth and increasing profit. BecauseNintendo deals with entertainment products, which by nature hold many uncertainties in terms of their product development,and operates in a market which involves intense competition, flexible business decisions are made without being constrainedby any specific management index.
The video game industry has developed as one of the few entertainment fields which was launched and driven by Japan.Throughout the early years, the success of the industry was dependent upon increasingly spectacular graphics and morecomplex games. In recent years, however, the traditional success formula of developing splendid and complex games hasbecome less productive. High development costs cannot be avoided by pursuing this traditional method and there is acommon perception in the industry as a whole that further expansion of the market will be difficult.
Nintendo will continue the original challenge to provide an unprecedented gaming experience using technical innovationsin unique ways. It is essential for our human resources to be even more flexible and positive. By taking advantage of beingthe only platform holder with a powerful in-house software development team, Nintendo will strive to expand its businessand increase revenue and profit with new ideas to gaming that can be enjoyed by anyone, regardless of age, gender, or priorgaming experience, consequently expanding the gaming population for which Nintendo is aiming.
Not applicable
- 2 -

<Appendix> Nintendo Co., Ltd.(consolidated)
OPERATING RESULTS1. Review of Operations
2. Annual Outlook
During the semi-annual fiscal year ended September 30, 2006, despite concerns over crude oil price trends or risinginterest rates, the Japanese economy continued to show a pattern of recovery due to improvements in corporate earnings,intensified capital investments, and steady consumer spending supported by improvements in the employment environmentand household income. Looking overseas, the U.S. economy is being concerned about its slowdown even though itcontinued to show steady performance due to favorable consumer spending and capital investments. As for the Europeaneconomy, the business environment showed indications of moderate improvement.
In the video game industry, the video game market in Japan as a whole has expanded with the robust growth in thehandheld game market, even though the market for consoles showed weak performance. The handheld game market is onthe rise in overseas as well.
Nintendo's approach was to expand the gaming population with "Nintendo DS" which has made it possible for new andunprecedented entertainments to be introduced that expand the definition of video games. The software lineup known as"Touch! Generations", which offers an entertaining experience that provides skilled gamers with a fresh sensation and at thesame time, drives those who were not familiar with video games in the past to start playing with easy access and user-friendly operation, has cultivated an new user demographic including seniors and females.
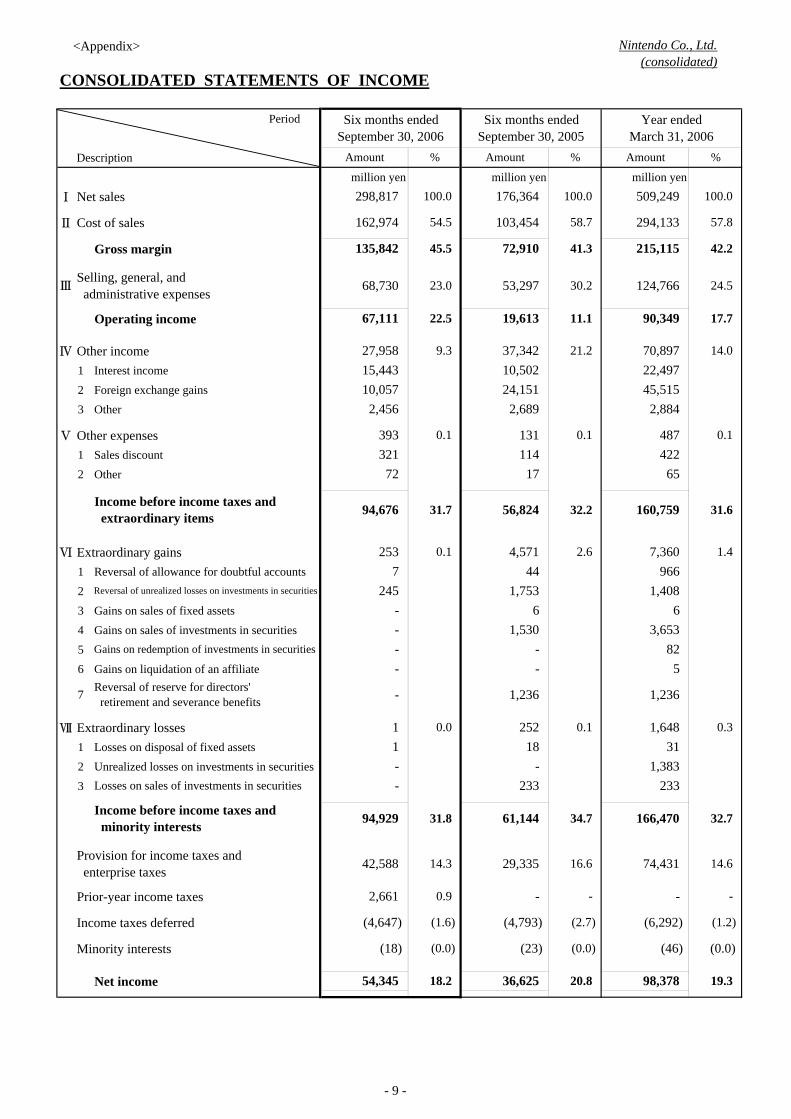
Consolidated net sales for the six months ended Sept. 30, 2006 resulted in 298.8 billion yen, including overseas sales of177.6 billion yen, which accounted for 59.4% of total sales. Income before income taxes and extraordinary items was 94.6billion yen. Net income was 54.3 billion yen.
With respect to sales by business category, handheld game products in the electronic entertainment products division,"Nintendo DS" and "Nintendo DS Lite" sold a total of more than 10 million units on a worldwide basis during the semi-annual fiscal year (26.82 million units life-to-date), resulting from continuous robust sales of "Nintendo DS Lite" followingits March launch in Japan and strong sales following its June release in overseas. In addition, "Nintendo DS" softwareenjoyed a boost in sales as well. For instance, "New Super Mario Bros.", the latest side-scrolling action game in "SuperMario" series with easy access and user-friendly operation, sold 6.76 million units worldwide, and "Brain Age: Train YourBrain in Minutes a Day" series, which continued to enjoy favorable sales since their Japan launch last year and the initialgame of which cultivated a new video game market of brain training in overseas, sold a total of 4.59 million units on aworldwide basis in this interim period (8.51 million units life-to-date). Software lineup of "Touch! Generations", includingbrain training titles, sold a total of 13.54 million units in Japan and 25.27 million units worldwide on a life-to-date basis,consequently making great progress in expanding the gaming population of females and seniors in particular who tend to beless involved in games. As for console business, sales of both hardware and software declined compared to figures for thefirst half of the last fiscal year due to the fact that a new video gaming console is awaiting to be launched in the second halfof the fiscal year. In total, net sales in the electronic entertainment products division were 297.9 billion yen, while sales inthe other products division (playing cards, karuta, etc.) were 0.8 billion yen.
With respect to geographic segment information, sales in Japan were 286.3 billion yen including inter-segment sales of161.9 billion yen. Operating income was 69.6 billion yen. Sales in the Americas were 94.0 billion yen including inter-segment sales of 1.2 billion yen. Operating income was 0 billion yen. Sales in Europe were 78.0 billion yen including inter-segment sales of 0 billion yen. Operating income was 3.0 billion yen.
In order to expand gaming population in the console business as well, Nintendo will aim to popularize "Wii" (the latestvideo gaming console to be launched at the end of the calendar year) as an "everyday-use gaming device for all the family"allowing the new emergence of gaming console inseparable from daily lives, under the concept of "brand new days withWii". As for handheld gaming market, Nintendo will continue to strive to gain more popularity with an expansion insoftware lineup by launching new types of games that expand user base such as "Touch! Generations" as well as easyaccesible games to challenging games in due proportion.
With regard to consolidated performance forecasts for the fiscal year ending March 31, 2007, net sales are projected toreach 740.0 billion yen, operating income 145.0 billion yen, income before income taxes and extraordinary items 170.0billion yen, net income 100.0 billion yen. Assumed exchange rates for the second half of the fiscal year are 115.00 yen perU.S. dollar and 143.00 yen per euro.
As for the cash dividends, based on "2. Basic Policy of Profit Distribution", if Nintendo achieves the current forecast forthe fiscal year ending March 31, 2007, the annual cash dividend per share will be 400 yen (70 yen at six-month period end,330 yen at fiscal year-end).[Note] Above forecasts were prepared based on management's assumptions with information available at this time andtherefore involve known and unknown risks and uncertainties. Please note such risks and uncertainties may cause the actualresults to be materially different from the forecasts when making investment decisions.
- 3 -
<Appendix> Nintendo Co., Ltd.(consolidated)
FINANCIAL POSITION
Cash flows from operating activities:
Cash flows from investing activities:
Cash flows from financing activities:
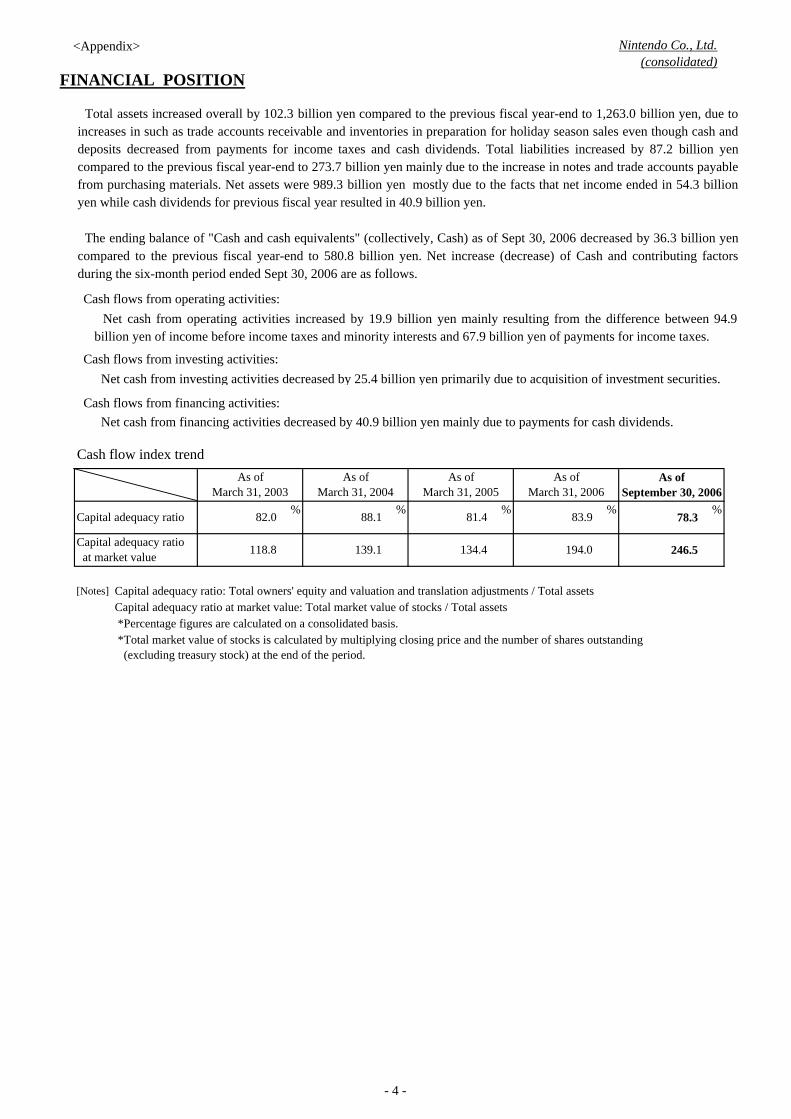
Cash flow index trend
% % % % %
[Notes] Capital adequacy ratio: Total owners' equity and valuation and translation adjustments / Total assets Capital adequacy ratio at market value: Total market value of stocks / Total assets *Percentage figures are calculated on a consolidated basis.
134.4
81.4
139.1
88.1
246.5
78.3
194.0
83.9
*Total market value of stocks is calculated by multiplying closing price and the number of shares outstanding (excluding treasury stock) at the end of the period.
As ofSeptember 30, 2006
Capital adequacy ratio at market value
Capital adequacy ratio 82.0
118.8
As ofMarch 31, 2003
As ofMarch 31, 2004
As ofMarch 31, 2005
As ofMarch 31, 2006
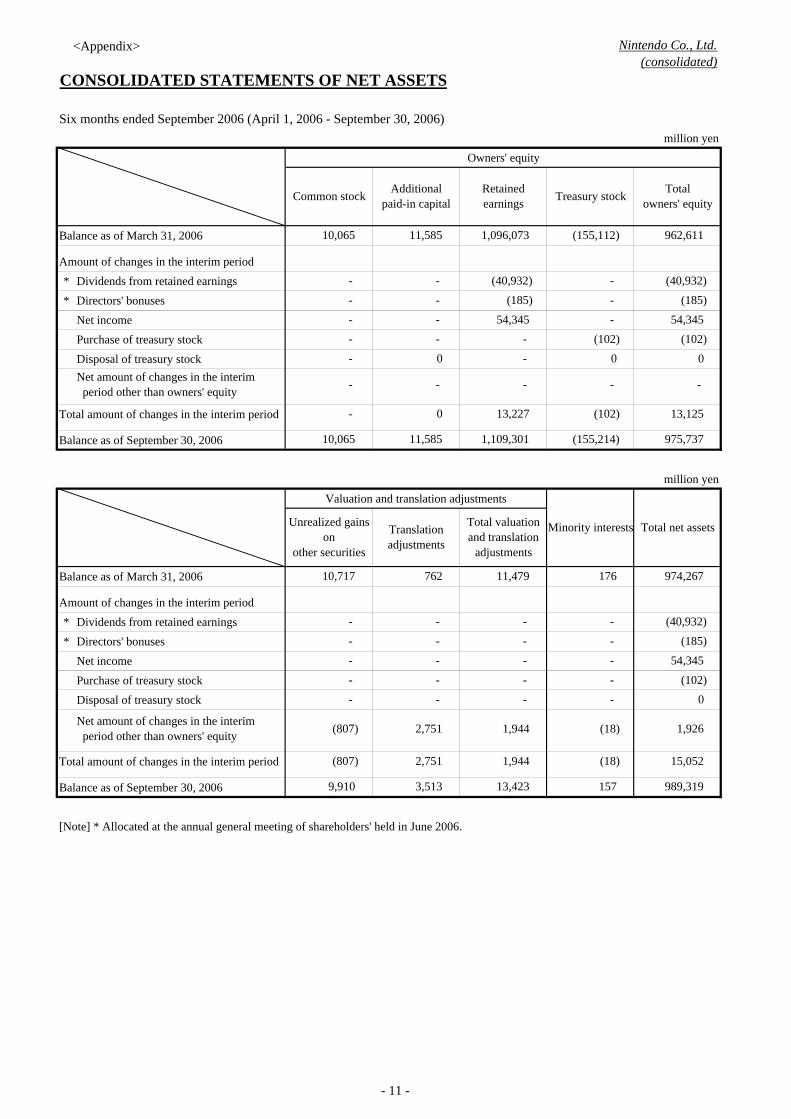
Total assets increased overall by 102.3 billion yen compared to the previous fiscal year-end to 1,263.0 billion yen, due toincreases in such as trade accounts receivable and inventories in preparation for holiday season sales even though cash anddeposits decreased from payments for income taxes and cash dividends. Total liabilities increased by 87.2 billion yencompared to the previous fiscal year-end to 273.7 billion yen mainly due to the increase in notes and trade accounts payablefrom purchasing materials. Net assets were 989.3 billion yen mostly due to the facts that net income ended in 54.3 billionyen while cash dividends for previous fiscal year resulted in 40.9 billion yen.
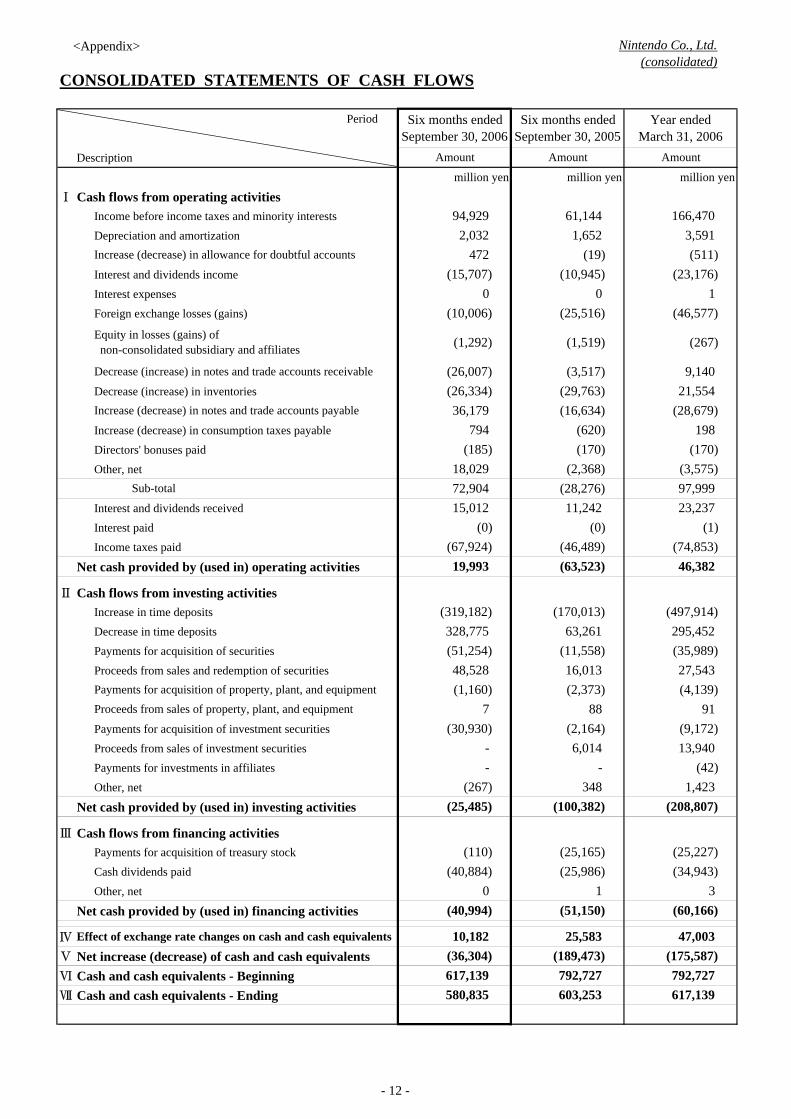
The ending balance of "Cash and cash equivalents" (collectively, Cash) as of Sept 30, 2006 decreased by 36.3 billion yencompared to the previous fiscal year-end to 580.8 billion yen. Net increase (decrease) of Cash and contributing factorsduring the six-month period ended Sept 30, 2006 are as follows.
Net cash from operating activities increased by 19.9 billion yen mainly resulting from the difference between 94.9billion yen of income before income taxes and minority interests and 67.9 billion yen of payments for income taxes.
Net cash from investing activities decreased by 25.4 billion yen primarily due to acquisition of investment securities.
Net cash from financing activities decreased by 40.9 billion yen mainly due to payments for cash dividends.
- 4 -
<Appendix> Nintendo Co., Ltd.(consolidated)
RISK FACTORS
1. Risks around Economic Environment
2. Risks around Business Activities
・Overseas business expansion and international activitiesNintendo runs business in the Americas, Europe, Australia, Asia, etc. besides Japan. Launching new business in these
overseas markets involves risks such as ① unexpected enforcement or amendments to laws or regulations, ② disadvantagesfrom emergence of political or economic factors, ③ disadvantages from inconsistency of multilateral taxation systems anddiversity of tax law interpretation, ④ difficulties in recruiting and retaining human resources, ⑤ social disruption byterrorist attacks, war, and other incidents.
・Product valuation and adequate inventory procurementDemand for products in the video game industry is significantly influenced by consumers' preferences as well as
seasonality characterized by short product life cycle and huge demand around the holiday seasons. Although production istargeted at the equilibrium point of supply and demand, accurate projections are extremely difficult to obtain, which maylead to the risk of excessive inventories. In addition, inventory obsolescence could have an adverse effect on Nintendo'soperations and financial position.
Listed below are the various risks that could significantly affect Nintendo's operating performance, stock price, and
financial condition. However, unpredictable risks may exist other than the risks set forth herein. Note that matters pertaining
to the future presented herein are determined by Nintendo as of the semi-annual consolidated acccounting period end.
・Fluctuation in foreign exchange ratesNintendo distributes its products globally with overseas sales accounting for approximately 60% of total sales. Most of the
monetary transactions are made in local currencies. In addition, the Company holds a substantial amount of assetsdenominated in foreign currencies including cash deposits without exchange contracts. Thus, fluctuation in foreign exchangerates would have a strong influence on business results not only when foreign currencies are converted to Japanese yen butalso when revaluated for financial reporting purposes. Japanese yen appreciation against the U.S. dollar or Euro would havea negative impact on Nintendo's profitability.
・Fluctuation of and competition in the marketNintendo is engaged in a business categorized under the massive entertainment industry. Therefore, Nintendo's business is
affected by trends in other types of entertainment. The video game market may shrink if consumer preferences shift to otherforms of entertainment. The emergence of new competitors resulting from technological innovation could have a detrimentalimpact as well.
In the video game industry, it may become even more difficult to generate profits as more expenses for research &development and marketing are required and as price competition intensifies with giant enterprises entering into the market.As a result, Nintendo may find difficulties in maintaining or expanding its market share as well as sustaining profitability.
・Development of new productsAlthough Nintendo continues to develop innovative and appealing products in the field of computer entertainment, the
development process is complicated and includes many uncertainties. Various risks involved are as follows.① Despite the substantial costs and time needed for some software development, there is no guarantee that all new productswill be accepted by consumers due to ever shifting consumer preferences. As a result, development of certain products maybe suspended or aborted.② While hardware requires long term development, constant technical progress is taking place. Thus, Nintendo may not beable to equip in its products with technology which can be utilized in entertainment. Furthermore, in the case of a delayedlaunch, it is possible that market share could be adversely affected.③ Due to characteristics of Nintendo products, it may become difficult to sell or develop the products as planned, whichcould lead to significant variances from financial forecasts.
- 5 -
<Appendix> Nintendo Co., Ltd.(consolidated)
3. Other Risks
・Dependency on outside manufacturersNintendo commissions a number of certain outside manufacturers to produce key components or assemble finished
products. In the event of their business failures, Nintendo may have trouble in procuring key components or manufacturingits products. In addition, in periods of high demand, they may not have the capacity to provide the ordered amount ofcomponents. A shortage of key components could lead to issues such as margin decline due to higher pricing as well asinsufficient product supply, and quality control. These problems may impair the relationship between Nintendo and itscustomers.
Furthermore, since most of suppliers' production bases are located overeseas, it would negatively affect Nintendo'soperations when production is restrained by riots or disasters in the area.
・Business operations affected by seasonal fluctuationsDemand for products is subject to seasonal fluctuations as most of the demand is focused around the holiday seasons.
Should Nintendo fail to meet the high demand of the period in any of its business activities, for the launch of attractive newproducts and supplying hardware, it would suffer unfavorable operating performance.
Other than risks set forth above, factors such as product liability, limitations of protecting intellectual property, leakage ofpersonal and confidential information, changes in accounting standards and taxation systems, litigation, uncollectibility oftrade accounts and notes receivable, collapse of financial institutions, and environmental restrictions may adversely affectNintendo's operations and financial position.
- 6 -
<Appendix> Nintendo Co., Ltd.(consolidated)
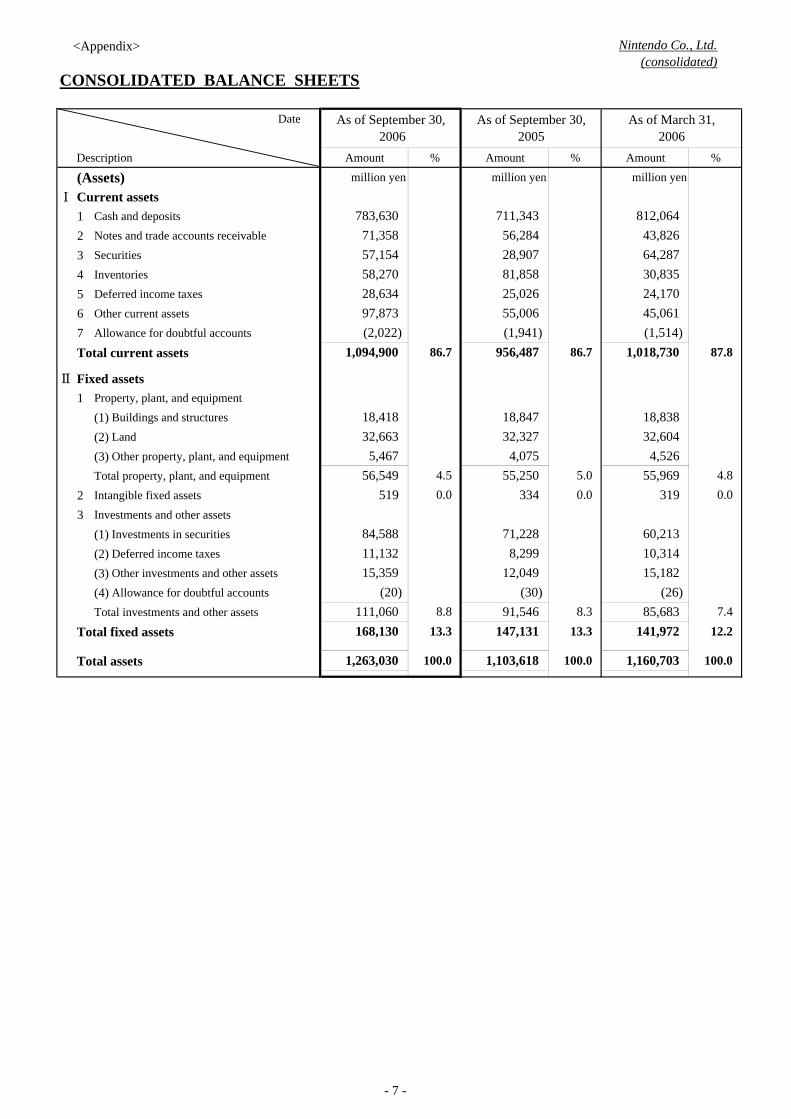
CONSOLIDATED BALANCE SHEETS
Date
Description Amount % Amount % Amount %
(Assets) million yen million yen million yen
Ⅰ Current assets1 Cash and deposits
2 Notes and trade accounts receivable
3 Securities
4 Inventories
5 Deferred income taxes
6 Other current assets
7 Allowance for doubtful accounts
Total current assets
Ⅱ Fixed assets1 Property, plant, and equipment
(1) Buildings and structures
(2) Land
(3) Other property, plant, and equipmentTotal property, plant, and equipment
2 Intangible fixed assets
3 Investments and other assets
(1) Investments in securities
(2) Deferred income taxes
(3) Other investments and other assets
(4) Allowance for doubtful accountsTotal investments and other assets
Total fixed assets
Total assets
85,683
10,314
(26) 7.4
As of September 30, 2006
32,663
84,588
15,359 (20)
15,182
71,228
0.0 319
(30)
8,299 11,132
1,103,618
111,060 91,546
60,213
8.3
As of March 31,2006
1,263,030
4.5
100.0
13.3
519 56,549
8.8
783,630 71,358
168,130 147,131
43,826 812,064
As of September 30,2005
711,343
86.7
56,284 28,907 81,858 25,026 55,006
24,170 30,835 64,287
956,487
45,061
57,154 58,270 28,634 97,873
87.8 1,018,730 (1,514)
4.8
32,604
55,969
18,838
4,526
18,847 32,327
4,075
(2,022) 1,094,900
(1,941) 86.7
18,418
5,467 55,250 5.0
12,049
0.0 334 0.0
12.2
100.0 100.0
13.3 141,972
1,160,703
- 7 -

<Appendix> Nintendo Co., Ltd.(consolidated)
Date
Description Amount % Amount % Amount %million yen million yen million yen
Ⅰ Current liabilities1 Notes and trade accounts payable2 Accrued income taxes3 Reserve for bonuses4 Reserve for directors' bonuses5 Other current liabilities
Total current liabilities
Ⅱ Non-current liabilities1 Non-current accounts payable2 Total non-current liabilities
Total liabilities
Minority interests
Ⅰ Common stockⅡ Additional paid-in capitalⅢ Retained earningsⅣ Unrealized gains on other securitiesⅤ Translation adjustmentsⅥ Treasury stock
Total shareholders' equity
(Net assets)Ⅰ Owners' equity
1 Common stock2 Additional paid-in capital3 Retained earnings4 Treasury stock
Total owners' equity
Ⅱ Valuation and translation adjustments 1 Unrealized gains on other securities
2 Translation adjustments
Ⅲ Minority interests
Total net assets
Total liabilities and net assets
-
- -
- -
77.3
- - -
-
- -
-
- - - - -
- -
- -
- - - -
- - - -
1,263,030 100.0
78.3
0.0
989,319
157
9,910 3,513
975,737
Total liabilities, minority interests, and shareholders' equity
10,065 11,585
1,109,301 (155,214)
-
10,717
3,299
(Minority interests)
1,555
66,660
3,415 4,125
130
21.3
0.4 Reserve for retirement and severance benefits
(Liabilities)
As of September 30,2005
As of September 30, 2006
(0.4)
-
46,089
4,989
863
268,722
-
- - 1,096,073
0.9
- -
(14.0)
1,043,275 94.5 - 9,558
(4,890) (155,059) -
- -
11,585 1.0 10,065 11,584
186,435 273,711 21.7 17.1 188,885
182,274
861
4,406 4,161
16.7
0.4
184,479
990
1,732
43,684 41,314
1,556 - -
83,817 53,040
106,849 34,759
As of March 31,2006
154,285
16.1
15.7
0.4
0.0 0.0
- 0.9
198 176
0.9
-
10,065 1.0
94.4 0.9 0.1
(13.4) 762
(155,112) 83.9 82.9 974,091
- -
100.0 1,160,703 100.0
- 1.0 13,423 Total valuation and translation adjustments
- -
(Shareholders' equity)
1,103,618 -
- 914,533 -
- 8 -
<Appendix> Nintendo Co., Ltd.(consolidated)
CONSOLIDATED STATEMENTS OF INCOME
Period
Descriptionmillion yen million yen million yen
Ⅰ Net sales
Ⅱ Cost of sales
Gross margin
Operating income
Ⅳ Other income1 Interest income2 Foreign exchange gains3 Other
Ⅴ Other expenses1 Sales discount2 Other
Ⅵ Extraordinary gains1 Reversal of allowance for doubtful accounts2 3 Gains on sales of fixed assets4 Gains on sales of investments in securities5 6 Gains on liquidation of an affiliate
Ⅶ Extraordinary losses1 Losses on disposal of fixed assets2 Unrealized losses on investments in securities3
Prior-year income taxes
Income taxes deferred
Minority interests
Net income
82
1,408 6
3,653
160,759
7,360 1.4 966
31.6
(0.0)
19.3
(6,292)
(46)
98,378
(1.2)
65
2,884
487 422
70,897 14.0 22,497 45,515
54,345
100.0
294,133 57.8
215,115 42.2
509,249
90,349 17.7
0.1
31.7
Gains on redemption of investments in securities
Income before income taxes and extraordinary items 94,676
14.6
7 1,236
27,958 9.3 15,443 10,057
2,456
393 0.1
20.8
(2.7)
(0.0)
22.5
18.2
(0.0)
(1.6)
31.8
(4,793)
(23)
1,530
1,236 -
0.1
6
- -
44
- -
36,625
0.0 1
-
61,144
42,588
-
(4,647)
(18)
14.3
5
34.7
0.3 31
233
166,470 32.7
1,383
Provision for income taxes and enterprise taxes
114
74,431
1,648
32.2
252 0.1 18
233
29,335
2,689
131 0.1
2.6
17
37,342 21.2 10,502 24,151
41.3
103,454
72,910
19,613 11.1
58.7
16.6
1,753
4,571
Income before income taxes and minority interests
Reversal of reserve for directors' retirement and severance benefits
94,929
- -
1
- Losses on sales of investments in securities
Selling, general, and administrative expenses
30.2 124,766 24.5
%Amount % Amount
Ⅲ 68,730 23.0 53,297
100.0
54.5 162,974
135,842 45.5
67,111
298,817
Reversal of unrealized losses on investments in securities
72
253 7
245
321
Six months endedSeptember 30, 2006
Year endedMarch 31, 2006
Six months endedSeptember 30, 2005
56,824
Amount
176,364
%
100.0
0.9 2,661 - - - -
- 9 -
<Appendix> Nintendo Co., Ltd.(consolidated)
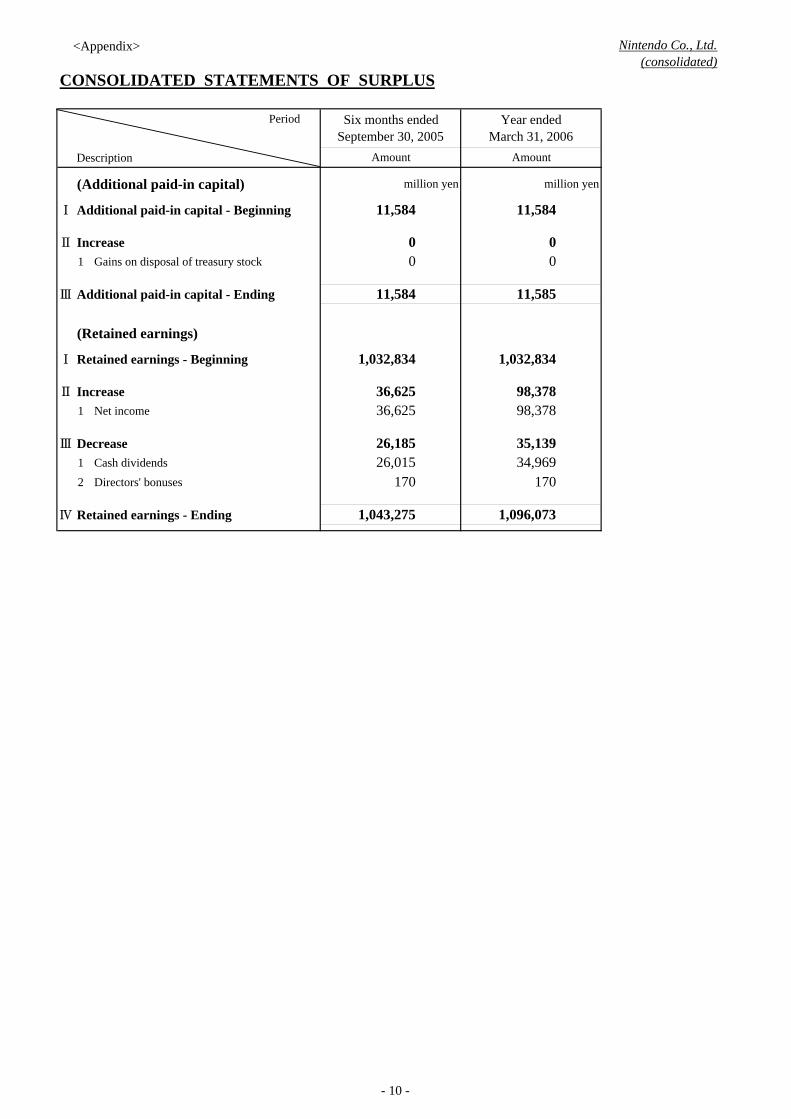
CONSOLIDATED STATEMENTS OF SURPLUS
Period
Description
(Additional paid-in capital) million yen million yen
Ⅰ Additional paid-in capital - Beginning
Ⅱ Increase1 Gains on disposal of treasury stock
Ⅲ Additional paid-in capital - Ending
(Retained earnings)
Ⅰ Retained earnings - Beginning
Ⅱ Increase1 Net income
Ⅲ Decrease1 Cash dividends2 Directors' bonuses
Ⅳ Retained earnings - Ending
26,185 26,015
170 170 34,969 35,139
11,585
98,378 98,378
11,584
0 0
Amount
Year endedMarch 31, 2006
Six months endedSeptember 30, 2005
Amount
1,043,275 1,096,073
11,584
36,625
1,032,834 1,032,834
36,625
11,584
0 0
- 10 -
<Appendix> Nintendo Co., Ltd.(consolidated)
CONSOLIDATED STATEMENTS OF NET ASSETS
Six months ended September 2006 (April 1, 2006 - September 30, 2006)million yen
Owners' equity
Balance as of March 31, 2006
Amount of changes in the interim period* Dividends from retained earnings* Directors' bonuses
Net incomePurchase of treasury stockDisposal of treasury stock
Total amount of changes in the interim period
Balance as of September 30, 2006
million yenValuation and translation adjustments
Balance as of March 31, 2006
Amount of changes in the interim period* Dividends from retained earnings* Directors' bonuses
Net incomePurchase of treasury stockDisposal of treasury stock
Total amount of changes in the interim period
Balance as of September 30, 2006
[Note] * Allocated at the annual general meeting of shareholders' held in June 2006.
- - - -
(102) 0
1,926
974,267
(40,932)
54,345 (185)
(18)
157
(18)
-
- - -
-
1,944
13,423
1,944
-
- - -
-
2,751
3,513
2,751
-
- - -
-
(807)
9,910
(807)
-
- - -
-
13,125
975,737
10,717 762 11,479 176
(40,932)
54,345 (102)
0
(185) -
-
(102)
(155,214)
(102) 0
-
10,065
11,585
-
- - 0
- -
-
Unrealized gainson
other securities
Translationadjustments
Total valuationand translation
adjustments
Minority interests
- -
Treasury stock Totalowners' equity
1,096,073 (155,112) 962,611
-
-
(40,932)
54,345 (185) - -
Common stock Additionalpaid-in capital
Retainedearnings
10,065
Net amount of changes in the interim period other than owners' equity
Net amount of changes in the interim period other than owners' equity
15,052
989,319
Total net assets
- 0
11,585
13,227
1,109,301
- 11 -
<Appendix> Nintendo Co., Ltd.(consolidated)
CONSOLIDATED STATEMENTS OF CASH FLOWS
Period
Descriptionmillion yen million yen million yen
Ⅰ Cash flows from operating activitiesIncome before income taxes and minority interestsDepreciation and amortization
Interest and dividends income Interest expenses Foreign exchange losses (gains)
Decrease (increase) in inventories
Increase (decrease) in consumption taxes payable Directors' bonuses paid Other, net
Interest and dividends received Interest paid Income taxes paid
Net cash provided by (used in) operating activities
Ⅱ Cash flows from investing activitiesIncrease in time deposits Decrease in time deposits Payments for acquisition of securities Proceeds from sales and redemption of securities
Payments for acquisition of investment securities Proceeds from sales of investment securities Payments for investments in affiliatesOther, net
Net cash provided by (used in) investing activities
Ⅲ Cash flows from financing activitiesPayments for acquisition of treasury stock Cash dividends paid Other, net
Net cash provided by (used in) financing activities
Ⅳ
Ⅴ Net increase (decrease) of cash and cash equivalentsⅥ Cash and cash equivalents - BeginningⅦ Cash and cash equivalents - Ending
Year endedMarch 31, 2006
Six months endedSeptember 30, 2005
6,014
Amount
61,144
(23,176) 1
(46,577)
Six months endedSeptember 30, 2006
(42) 13,940
-
(175,587)
(1,519)
(2,164)
Increase (decrease) in notes and trade accounts payable
Proceeds from sales of property, plant, and equipment
Sub-total
(170,013) 63,261
(11,558) 16,013
Payments for acquisition of property, plant, and equipment (2,373) 88
Effect of exchange rate changes on cash and cash equivalents
792,727
348 (100,382)
(25,165)
1,423 (208,807)
3 (60,166)
47,003
Decrease (increase) in notes and trade accounts receivable
Increase (decrease) in allowance for doubtful accounts
Equity in losses (gains) of non-consolidated subsidiary and affiliates (1,292)
(26,007)
(15,707) 0
(10,006)
792,727 580,835 603,253 617,139
(110)
- (267)
7 (30,930)
(25,485)
-
15,012 (0)
(67,924) 19,993
72,904
(3,517)
1,652 (19)
18,029
36,179 794
(185)
(10,945) 0
(25,516)
(620)
(29,763) (16,634)
166,470 3,591 (511)
(267)
9,140 21,554
(28,679) 198
(170) (3,575) 97,999 23,237
(1) (74,853) 46,382
(497,914) 295,452
(4,139) 91
(9,172)
(35,989) 27,543
0 (40,994)
10,182 (36,304)
(2,368) (28,276) 11,242
Amount Amount
94,929 2,032
472
(26,334)
(170)
(40,884)
(189,473)
(0) (46,489) (63,523)
(319,182) 328,775 (51,254) 48,528 (1,160)
(25,227) (34,943)
(51,150) 1
(25,986)
25,583
617,139
- 12 -
<Appendix> Nintendo Co., Ltd.(consolidated)
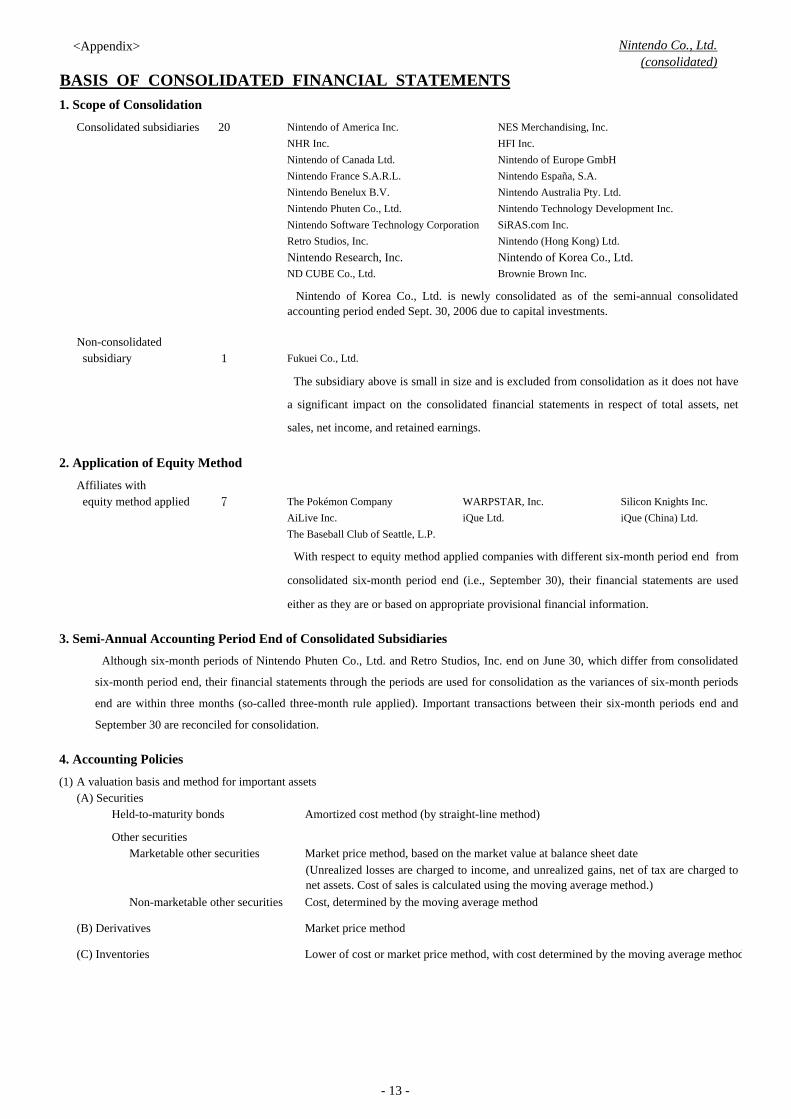
BASIS OF CONSOLIDATED FINANCIAL STATEMENTS1. Scope of Consolidation
Consolidated subsidiaries 20 Nintendo of America Inc. NES Merchandising, Inc.NHR Inc. HFI Inc. Nintendo of Canada Ltd. Nintendo of Europe GmbHNintendo France S.A.R.L. Nintendo España, S.A.Nintendo Benelux B.V. Nintendo Australia Pty. Ltd.Nintendo Phuten Co., Ltd. Nintendo Technology Development Inc.Nintendo Software Technology Corporation SiRAS.com Inc.Retro Studios, Inc. Nintendo (Hong Kong) Ltd.Nintendo Research, Inc. Nintendo of Korea Co., Ltd.ND CUBE Co., Ltd. Brownie Brown Inc.
Non-consolidated subsidiary 1 Fukuei Co., Ltd.
2. Application of Equity Method
Affiliates with equity method applied 7 The Pokémon Company WARPSTAR, Inc. Silicon Knights Inc.
AiLive Inc. iQue Ltd. iQue (China) Ltd.The Baseball Club of Seattle, L.P.
3. Semi-Annual Accounting Period End of Consolidated Subsidiaries
4. Accounting Policies
(1) A valuation basis and method for important assets(A) Securities
Held-to-maturity bonds Amortized cost method (by straight-line method)
Other securitiesMarketable other securities Market price method, based on the market value at balance sheet date
Non-marketable other securities Cost, determined by the moving average method
(B) Derivatives Market price method
(C) Inventories Lower of cost or market price method, with cost determined by the moving average method
Although six-month periods of Nintendo Phuten Co., Ltd. and Retro Studios, Inc. end on June 30, which differ from consolidated
six-month period end, their financial statements through the periods are used for consolidation as the variances of six-month periods
end are within three months (so-called three-month rule applied). Important transactions between their six-month periods end and
September 30 are reconciled for consolidation.
The subsidiary above is small in size and is excluded from consolidation as it does not have
a significant impact on the consolidated financial statements in respect of total assets, net
sales, net income, and retained earnings.
With respect to equity method applied companies with different six-month period end from
consolidated six-month period end (i.e., September 30), their financial statements are used
either as they are or based on appropriate provisional financial information.
(Unrealized losses are charged to income, and unrealized gains, net of tax are charged tonet assets. Cost of sales is calculated using the moving average method.)
Nintendo of Korea Co., Ltd. is newly consolidated as of the semi-annual consolidatedaccounting period ended Sept. 30, 2006 due to capital investments.
- 13 -
<Appendix> Nintendo Co., Ltd.(consolidated)
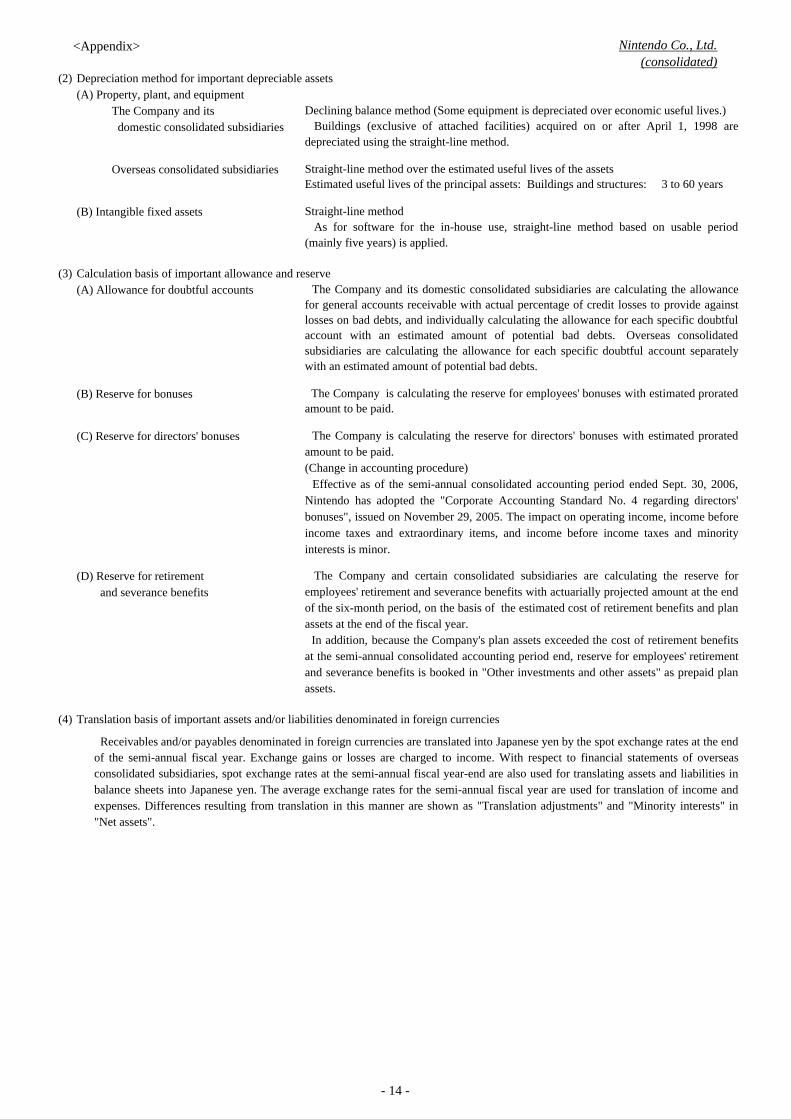
(2) Depreciation method for important depreciable assets(A) Property, plant, and equipment
The Company and its domestic consolidated subsidiaries
Overseas consolidated subsidiaries
(B) Intangible fixed assets
(3) Calculation basis of important allowance and reserve(A) Allowance for doubtful accounts
(B) Reserve for bonuses
(C) Reserve for directors' bonuses
(D) Reserve for retirement and severance benefits
(4) Translation basis of important assets and/or liabilities denominated in foreign currencies
Declining balance method (Some equipment is depreciated over economic useful lives.)Buildings (exclusive of attached facilities) acquired on or after April 1, 1998 are
depreciated using the straight-line method.
The Company is calculating the reserve for employees' bonuses with estimated proratedamount to be paid.
The Company is calculating the reserve for directors' bonuses with estimated proratedamount to be paid.(Change in accounting procedure)
Effective as of the semi-annual consolidated accounting period ended Sept. 30, 2006,Nintendo has adopted the "Corporate Accounting Standard No. 4 regarding directors'bonuses", issued on November 29, 2005. The impact on operating income, income beforeincome taxes and extraordinary items, and income before income taxes and minorityinterests is minor.
Receivables and/or payables denominated in foreign currencies are translated into Japanese yen by the spot exchange rates at the endof the semi-annual fiscal year. Exchange gains or losses are charged to income. With respect to financial statements of overseasconsolidated subsidiaries, spot exchange rates at the semi-annual fiscal year-end are also used for translating assets and liabilities inbalance sheets into Japanese yen. The average exchange rates for the semi-annual fiscal year are used for translation of income andexpenses. Differences resulting from translation in this manner are shown as "Translation adjustments" and "Minority interests" in"Net assets".
The Company and its domestic consolidated subsidiaries are calculating the allowancefor general accounts receivable with actual percentage of credit losses to provide againstlosses on bad debts, and individually calculating the allowance for each specific doubtfulaccount with an estimated amount of potential bad debts. Overseas consolidatedsubsidiaries are calculating the allowance for each specific doubtful account separatelywith an estimated amount of potential bad debts.
Straight-line method over the estimated useful lives of the assetsEstimated useful lives of the principal assets: Buildings and structures: 3 to 60 years
Straight-line methodAs for software for the in-house use, straight-line method based on usable period
(mainly five years) is applied.
The Company and certain consolidated subsidiaries are calculating the reserve foremployees' retirement and severance benefits with actuarially projected amount at the endof the six-month period, on the basis of the estimated cost of retirement benefits and planassets at the end of the fiscal year.
In addition, because the Company's plan assets exceeded the cost of retirement benefitsat the semi-annual consolidated accounting period end, reserve for employees' retirementand severance benefits is booked in "Other investments and other assets" as prepaid planassets.
- 14 -
<Appendix> Nintendo Co., Ltd.(consolidated)
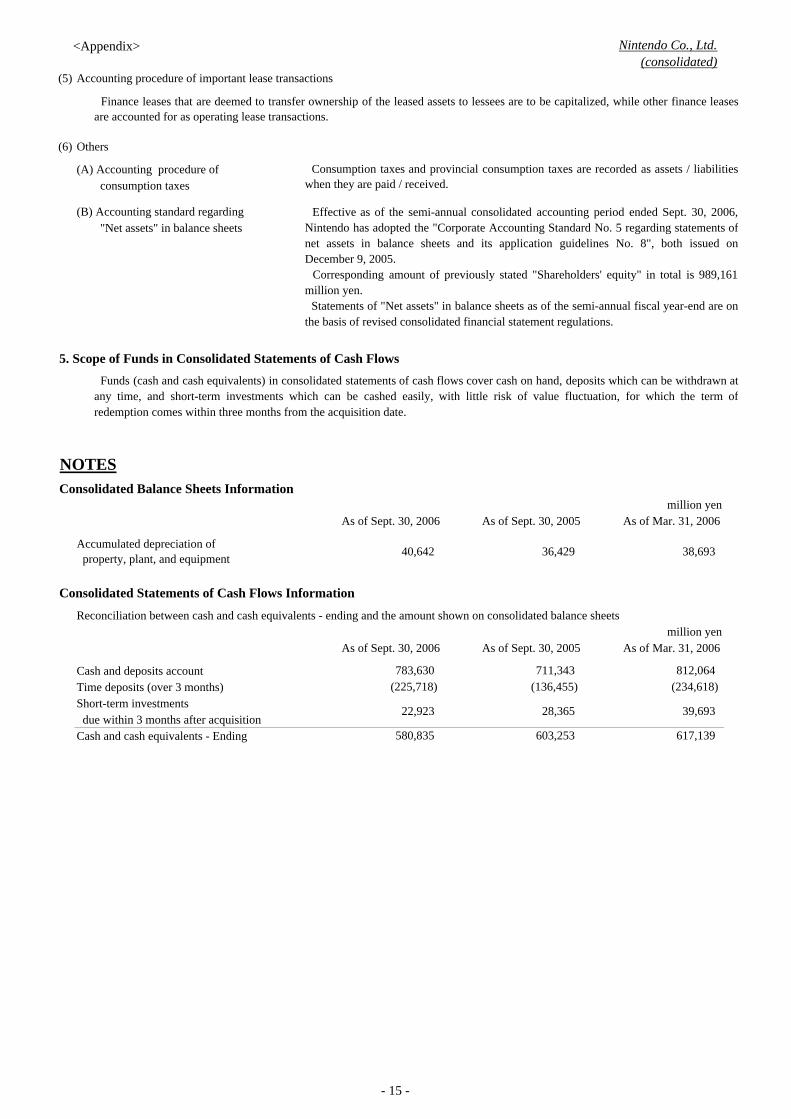
(5) Accounting procedure of important lease transactions
(6) Others
(A) Accounting procedure of consumption taxes
(B) Accounting standard regarding "Net assets" in balance sheets
5. Scope of Funds in Consolidated Statements of Cash Flows
NOTESConsolidated Balance Sheets Information
million yenAs of Sept. 30, 2006 As of Sept. 30, 2005 As of Mar. 31, 2006
Consolidated Statements of Cash Flows Information
Reconciliation between cash and cash equivalents - ending and the amount shown on consolidated balance sheetsmillion yen
As of Sept. 30, 2006 As of Sept. 30, 2005 As of Mar. 31, 2006
Cash and deposits accountTime deposits (over 3 months)Short-term investments due within 3 months after acquisitionCash and cash equivalents - Ending 580,835 603,253 617,139
783,630 711,343 812,064 (225,718) (136,455) (234,618)
22,923 28,365 39,693
Accumulated depreciation of property, plant, and equipment 38,693 36,429 40,642
Funds (cash and cash equivalents) in consolidated statements of cash flows cover cash on hand, deposits which can be withdrawn atany time, and short-term investments which can be cashed easily, with little risk of value fluctuation, for which the term ofredemption comes within three months from the acquisition date.
Finance leases that are deemed to transfer ownership of the leased assets to lessees are to be capitalized, while other finance leasesare accounted for as operating lease transactions.
Consumption taxes and provincial consumption taxes are recorded as assets / liabilitieswhen they are paid / received.
Effective as of the semi-annual consolidated accounting period ended Sept. 30, 2006,Nintendo has adopted the "Corporate Accounting Standard No. 5 regarding statements ofnet assets in balance sheets and its application guidelines No. 8", both issued onDecember 9, 2005.
Corresponding amount of previously stated "Shareholders' equity" in total is 989,161million yen.
Statements of "Net assets" in balance sheets as of the semi-annual fiscal year-end are onthe basis of revised consolidated financial statement regulations.
- 15 -
<Appendix> Nintendo Co., Ltd.(consolidated)
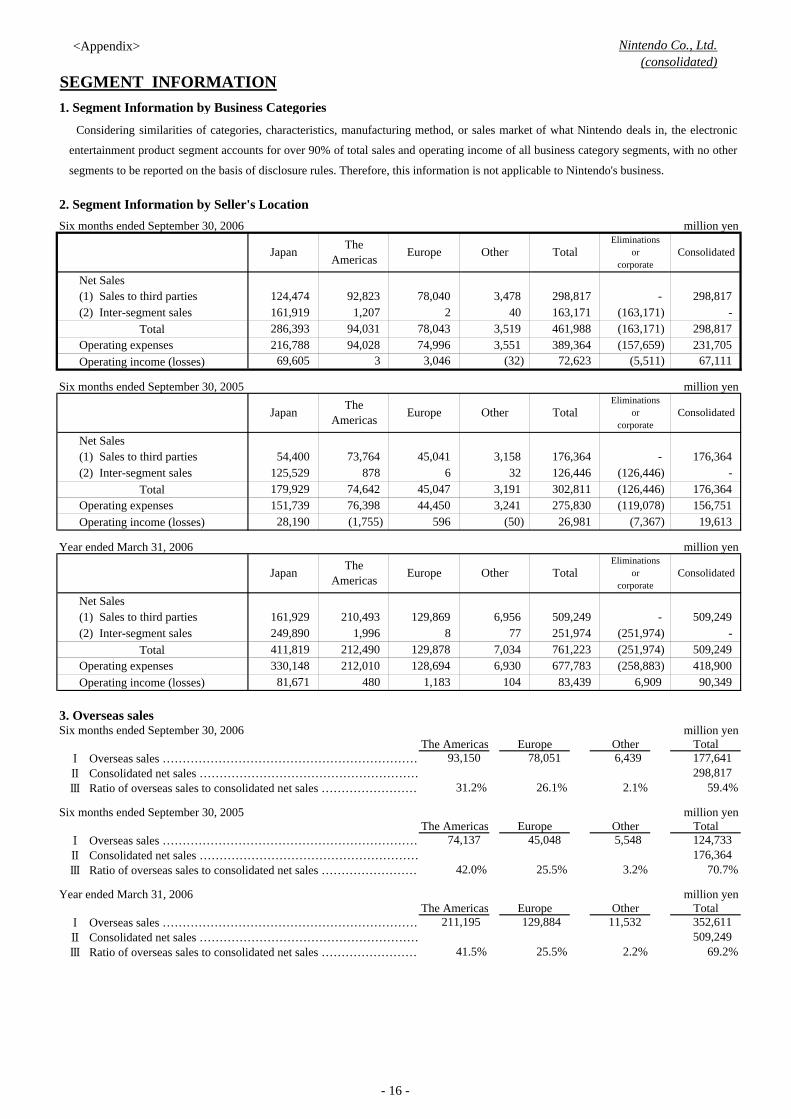
SEGMENT INFORMATION1. Segment Information by Business Categories
2. Segment Information by Seller's LocationSix months ended September 30, 2006 million yen
Net Sales
Total
Operating income (losses)
Six months ended September 30, 2005 million yen
Net Sales
Total
Operating income (losses)
Year ended March 31, 2006 million yen
Net Sales
Total
Operating income (losses)
3. Overseas salesSix months ended September 30, 2006 million yen
The Americas Europe Other TotalⅠ Overseas sales …………………………………………………………Ⅱ Consolidated net sales …………………………………………………Ⅲ Ratio of overseas sales to consolidated net sales ……………………
Six months ended September 30, 2005 million yenThe Americas Europe Other Total
Ⅰ Overseas sales …………………………………………………………Ⅱ Consolidated net sales …………………………………………………Ⅲ Ratio of overseas sales to consolidated net sales ……………………
Year ended March 31, 2006 million yenThe Americas Europe Other Total
Ⅰ Overseas sales …………………………………………………………Ⅱ Consolidated net sales …………………………………………………Ⅲ Ratio of overseas sales to consolidated net sales ……………………
Operating expenses
211,195
81,671 480 1,183 104 6,930
129,884
74,137 45,048
151,739 76,398 44,450
330,148 212,010 128,694
Japan
129,869
411,819 212,490
Operating expenses
(1)
275,830 (119,078) (1,755) 28,190 (50)
156,751
Operating expenses
(1) Sales to third parties(2) Inter-segment sales
Japan TheAmericas
Consolidated
3,158
(258,883)
TheAmericas
Europe Other Total
TheAmericas Europe Other
3,241 74,642
418,900
216,788 94,028 74,996 3,551 389,364 (157,659) 231,705
Total
Eliminationsor
corporate
176,364 -
176,364
54,400 125,529
73,764 878
45,041 6
179,929 32 (126,446)
TotalEliminations
orcorporate
461,988 (163,171)
72,623 (5,511)
(7,367)
302,811
-
(126,446)
176,364 126,446
Consolidated
19,613 26,981
298,817 -
67,111
(163,171) 298,817
Japan Europe Other
161,919 1,207 78,040 3,478
3,519 298,817 286,393
Consolidated
94,031 78,043
- (2) Inter-segment sales 2 40 163,171 (1) 124,474 92,823 Sales to third parties
69,605 3 3,046 (32)
5,548
45,047
596
3,191
Eliminationsor
corporate
677,783
2.1%
93,150
42.0% 25.5% 3.2%176,364
70.7%
78,051 6,439
31.2% 26.1%
509,249 Sales to third parties - (2) Inter-segment sales
161,929 509,249 249,890 1,996 8 77 251,974 (251,974) -
210,493 6,956
129,878 7,034 761,223 (251,974) 509,249
83,439 6,909
11,532 352,611
41.5% 25.5% 2.2% 69.2%
90,349
509,249
59.4%
177,641 298,817
124,733
Considering similarities of categories, characteristics, manufacturing method, or sales market of what Nintendo deals in, the electronic
entertainment product segment accounts for over 90% of total sales and operating income of all business category segments, with no other
segments to be reported on the basis of disclosure rules. Therefore, this information is not applicable to Nintendo's business.
- 16 -
<Appendix> Nintendo Co., Ltd.(consolidated)
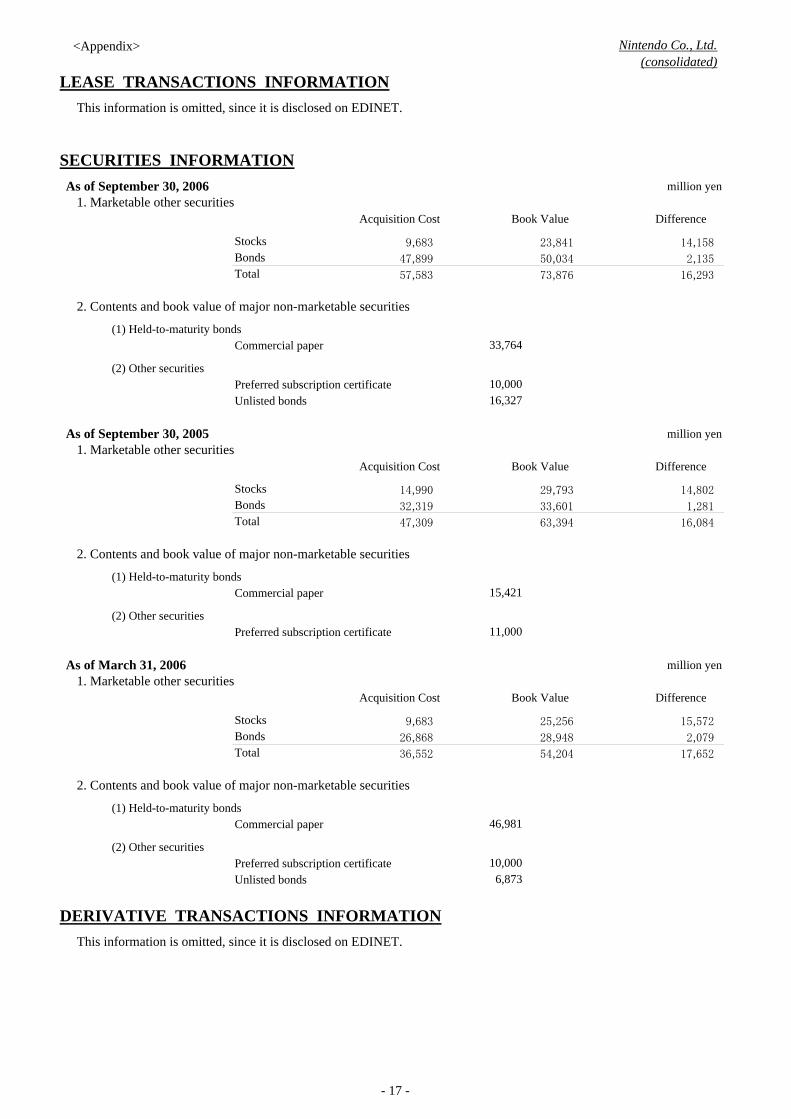
LEASE TRANSACTIONS INFORMATIONThis information is omitted, since it is disclosed on EDINET.
SECURITIES INFORMATION As of September 30, 2006 million yen
1. Marketable other securitiesAcquisition Cost Book Value Difference
StocksBondsTotal
2. Contents and book value of major non-marketable securities
(1) Held-to-maturity bonds Commercial paper
(2) Other securitiesPreferred subscription certificateUnlisted bonds
As of September 30, 2005 million yen1. Marketable other securities
Acquisition Cost Book Value Difference
StocksBondsTotal
2. Contents and book value of major non-marketable securities
(1) Held-to-maturity bonds Commercial paper
(2) Other securitiesPreferred subscription certificate
As of March 31, 2006 million yen1. Marketable other securities
Acquisition Cost Book Value Difference
StocksBondsTotal
2. Contents and book value of major non-marketable securities
(1) Held-to-maturity bonds Commercial paper
(2) Other securitiesPreferred subscription certificateUnlisted bonds
DERIVATIVE TRANSACTIONS INFORMATIONThis information is omitted, since it is disclosed on EDINET.
10,000
10,000
36,552 54,204
32,319 33,601
15,421
47,309 63,394
14,990
15,572
26,868 28,948 2,079
9,683 25,256
29,793 14,802
9,683
47,899
57,583
23,841
50,034
73,876
33,764
6,873
14,158
2,135
16,293
11,000
16,327
1,281
16,084
17,652
46,981
- 17 -
<Appendix> Nintendo Co., Ltd.(consolidated)
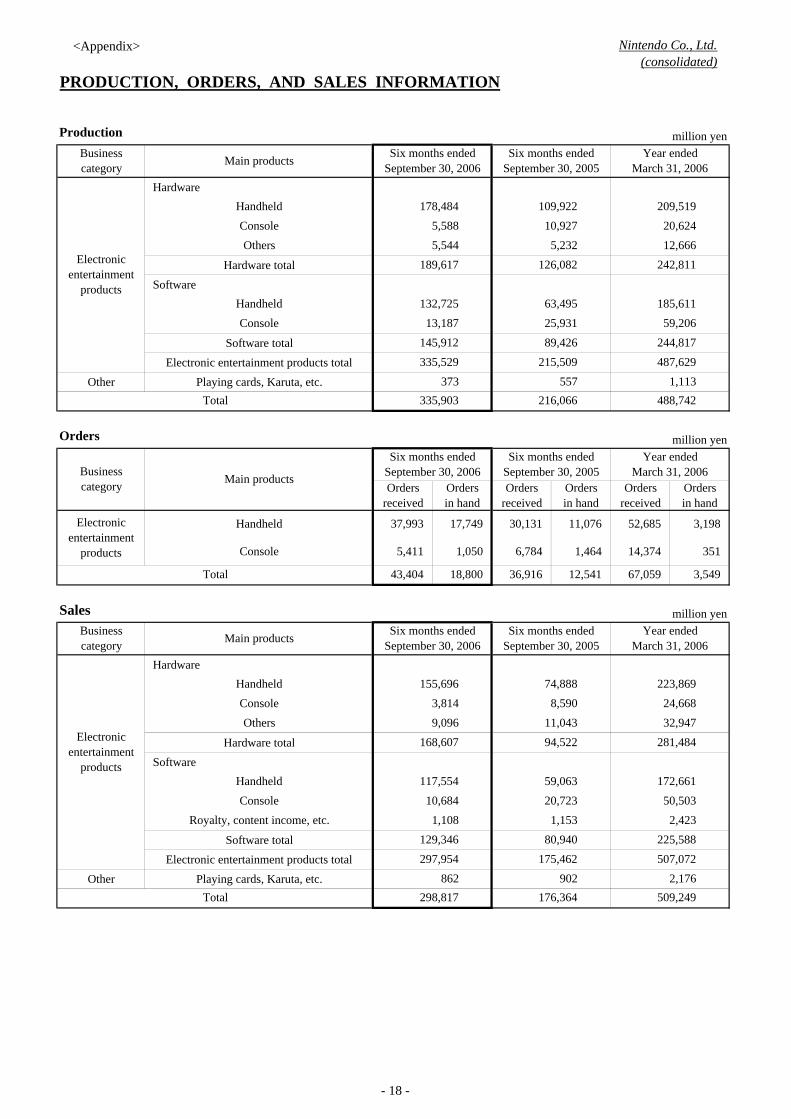
PRODUCTION, ORDERS, AND SALES INFORMATION
Production million yen
Hardware
Hardware total Software
Software totalElectronic entertainment products total
Other Playing cards, Karuta, etc.
Orders million yen
Sales million yen
Hardware
Hardware total Software
Software totalElectronic entertainment products total
Other Playing cards, Karuta, etc.
Main products
Electronicentertainment
products
Businesscategory Main products
Handheld
HandheldConsole
ConsoleOthers
Businesscategory
Console 10,684 20,723 59,063
94,522
Console 3,814 8,590
50,503
862 902 2,176
129,346 80,940 225,588 297,954 175,462 507,072
1,108 1,153 2,423
Total 298,817 176,364 509,249
Royalty, content income, etc.
281,484 Electronicentertainment
products
Others 9,096 11,043 32,947
Handheld 117,554 172,661
168,607
24,668 Handheld 155,696 74,888 223,869
Year endedMarch 31, 2006
Six months endedSeptember 30, 2006
Six months endedSeptember 30, 2005
Handheld
Console
Total
52,685
14,374
67,059
3,198
351
3,549
30,131
6,784
36,916
11,076
1,464
12,541
37,993
5,411
43,404
17,749
1,050
18,800
Six months endedSeptember 30, 2006
Six months endedSeptember 30, 2005
Year endedMarch 31, 2006
Ordersreceived
Ordersin hand
Ordersreceived
Ordersin hand
Ordersreceived
Ordersin hand
1,113 488,742
557 216,066
373 335,903
209,519 20,624 12,666
242,811
185,611 59,206
244,817 487,629
63,495 25,931 89,426
215,509
10,927 5,232
126,082
178,484 5,588 5,544
189,617
Six months endedSeptember 30, 2006
Six months endedSeptember 30, 2005
Year endedMarch 31, 2006
109,922
Businesscategory Main products
Electronicentertainment
products
Total
132,725 13,187
145,912 335,529
- 18 -
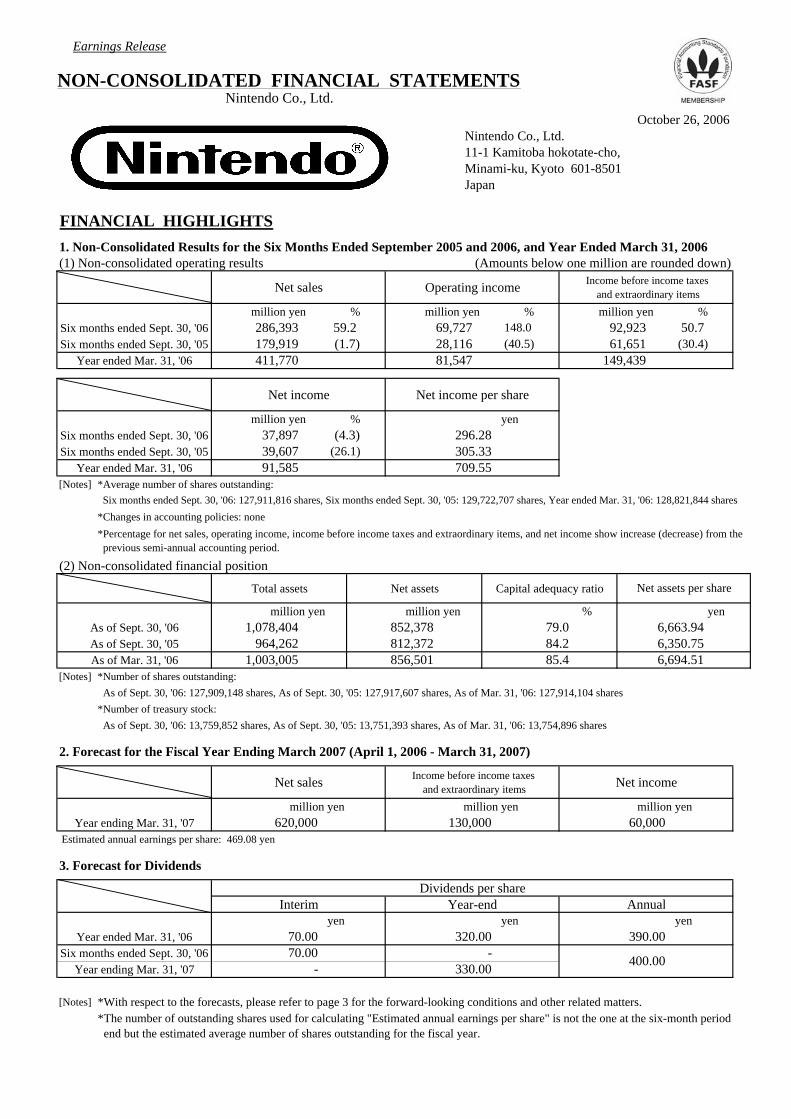
Earnings Release
NON-CONSOLIDATED FINANCIAL STATEMENTSNintendo Co., Ltd.
October 26, 2006Nintendo Co., Ltd. 11-1 Kamitoba hokotate-cho,Minami-ku, Kyoto 601-8501Japan
FINANCIAL HIGHLIGHTS1. Non-Consolidated Results for the Six Months Ended September 2005 and 2006, and Year Ended March 31, 2006(1) Non-consolidated operating results (Amounts below one million are rounded down)
Net sales Operating income Income before income taxes and extraordinary items
million yen % million yen % million yen % Six months ended Sept. 30, '06Six months ended Sept. 30, '05
Year ended Mar. 31, '06
Net income Net income per share
million yen % yenSix months ended Sept. 30, '06Six months ended Sept. 30, '05
Year ended Mar. 31, '06[Notes] *Average number of shares outstanding:
*Changes in accounting policies: none
(2) Non-consolidated financial position
Total assets Net assets Capital adequacy ratio
million yen million yen % yen As of Sept. 30, '06As of Sept. 30, '05As of Mar. 31, '06
[Notes] *Number of shares outstanding: As of Sept. 30, '06: 127,909,148 shares, As of Sept. 30, '05: 127,917,607 shares, As of Mar. 31, '06: 127,914,104 shares
*Number of treasury stock: As of Sept. 30, '06: 13,759,852 shares, As of Sept. 30, '05: 13,751,393 shares, As of Mar. 31, '06: 13,754,896 shares
2. Forecast for the Fiscal Year Ending March 2007 (April 1, 2006 - March 31, 2007)
Net sales Income before income taxes and extraordinary items Net income
million yen million yen million yenYear ending Mar. 31, '07
Estimated annual earnings per share: 469.08 yen
3. Forecast for Dividends
Dividends per shareInterim Year-end Annual
yen yen yenYear ended Mar. 31, '06
Six months ended Sept. 30, '06Year ending Mar. 31, '07
[Notes] *With respect to the forecasts, please refer to page 3 for the forward-looking conditions and other related matters.
Net assets per share
69,727 179,919
1,003,005
59.2 286,393 28,116
1,078,404 964,262
81,547
148.0
*Percentage for net sales, operating income, income before income taxes and extraordinary items, and net income show increase (decrease) from the previous semi-annual accounting period.
Six months ended Sept. 30, '06: 127,911,816 shares, Six months ended Sept. 30, '05: 129,722,707 shares, Year ended Mar. 31, '06: 128,821,844 shares
149,439
296.28 305.33
411,770
50.7 (30.4) (1.7)
92,923 (40.5)
79.0
37,897 39,607 91,585
(4.3) (26.1)
709.55
61,651
6,694.51
6,663.94
85.4 856,501
852,378 812,372 6,350.75 84.2
*The number of outstanding shares used for calculating "Estimated annual earnings per share" is not the one at the six-month period end but the estimated average number of shares outstanding for the fiscal year.
- 330.00 70.00 -
620,000 130,000 60,000
400.00
70.00 320.00 390.00
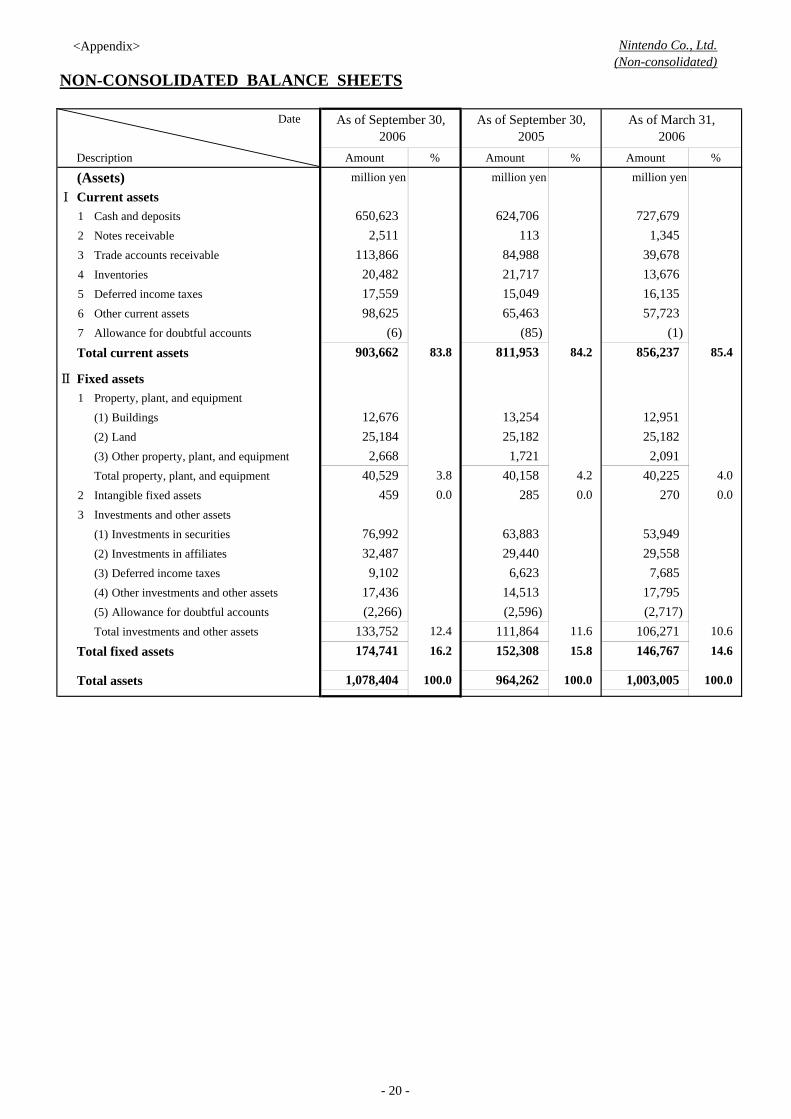
<Appendix> Nintendo Co., Ltd.(Non-consolidated)
NON-CONSOLIDATED BALANCE SHEETS
Date
Description Amount % Amount % Amount %
(Assets) million yen million yen million yen
Ⅰ Current assets1 Cash and deposits2 Notes receivable3 Trade accounts receivable4 Inventories5 Deferred income taxes6 Other current assets7 Allowance for doubtful accounts
Total current assets
Ⅱ Fixed assets1 Property, plant, and equipment
(1) Buildings(2) Land(3) Other property, plant, and equipmentTotal property, plant, and equipment
2 Intangible fixed assets3 Investments and other assets
(1) Investments in securities(2) Investments in affiliates(3) Deferred income taxes(4) Other investments and other assets(5) Allowance for doubtful accountsTotal investments and other assets
Total fixed assets
Total assets 100.0
15.8 146,767
964,262 1,003,005
40,158 4.2
14,513
0.0 285
13,254 25,182
1,721
(6) 903,662
(85) 83.8
12,676
2,668
85.4 856,237 (1)
4.0
25,182
40,225
12,951
2,091
113,866 20,482 17,559 98,625
16,135 13,676 39,678
811,953
57,723
84.2
65,463
113 84,988 21,717 15,049
650,623 2,511 1,345
727,679
As of September 30,2005
624,706
As of March 31,2006
1,078,404
3.8
100.0
16.2
459 40,529
12.4
9,102
0.0
53,949
11.6
32,487 29,440 29,558
133,752 111,864
7,685
174,741 152,308
(2,596)
6,623
As of September 30, 2006
25,184
76,992
17,436 (2,266)
17,795
63,883
0.0 270
10.6 14.6
100.0
106,271 (2,717)
- 20 -
<Appendix> Nintendo Co., Ltd.(Non-consolidated)
Date
Description Amount % Amount % Amount %million yen million yen million yen
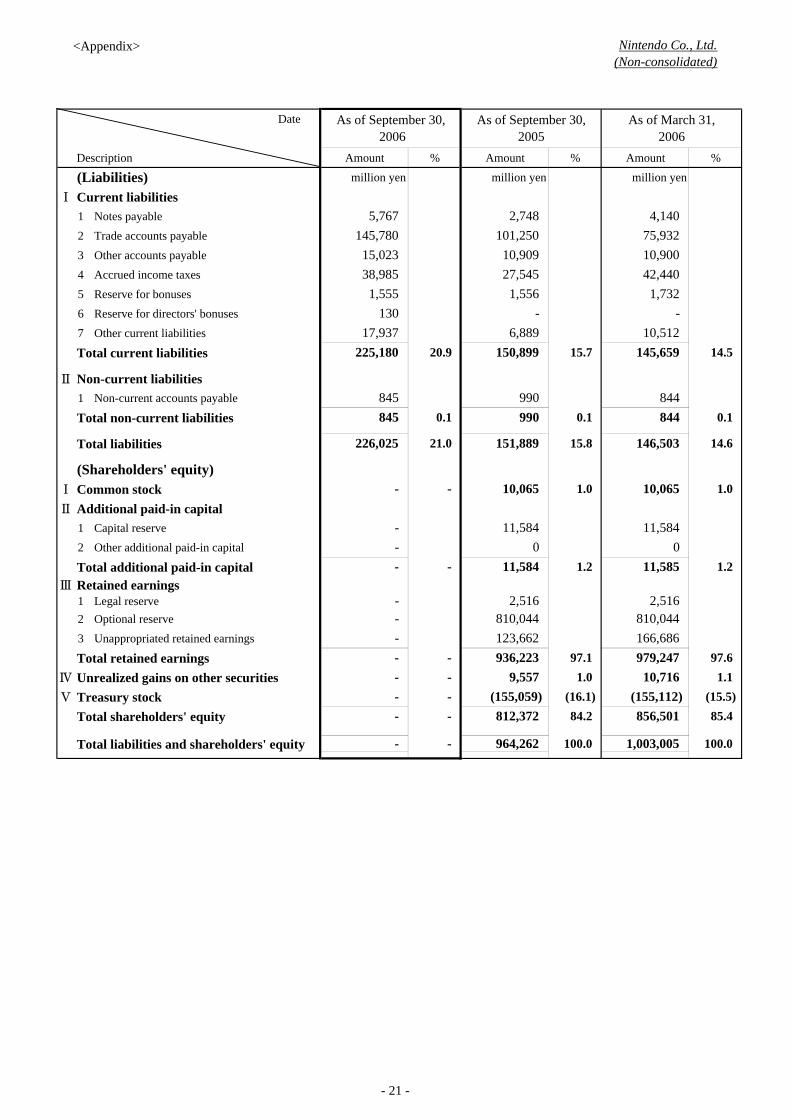
Ⅰ Current liabilities1 Notes payable2 Trade accounts payable3 Other accounts payable4 Accrued income taxes5 Reserve for bonuses6 Reserve for directors' bonuses7 Other current liabilities
Total current liabilities
Ⅱ Non-current liabilities1 Non-current accounts payable
Total non-current liabilities
Total liabilities
Ⅰ Common stockⅡ Additional paid-in capital
1 Capital reserve2 Other additional paid-in capital
Total additional paid-in capitalⅢ Retained earnings
1 Legal reserve2 Optional reserve3 Unappropriated retained earnings
Total retained earningsⅣ Unrealized gains on other securitiesⅤ Treasury stock
Total shareholders' equity
Total liabilities and shareholders' equity
- - 1.2 11,584
-
1.0 97.1
- - - -
- (155,059) 812,372 84.2
1.0 1.0
11,584
1.2 11,585
10,065
20.9 15.7
0.1 0.1
150,899
990 990
14.6
14.5
0.1
17,937
As of September 30, 2006
4,140 75,932
2,748 101,250
As of March 31,2006
5,767
10,900 42,440
10,909
145,659
844
1,556 1,732
6,889 10,512
226,025 21.0 15.8 151,889
- 9,557 - - 936,223
- 810,044 -
123,662
10,065 -
0 - - 11,584
-
(Liabilities)
(Shareholders' equity)
As of September 30,2005
15,023 38,985
145,780
845 845
225,180
27,545
10,716
0
2,516
146,503
1.1
844
979,247 97.6 166,686 810,044
2,516
(16.1)
100.0 1,003,005 100.0 964,262
(15.5) (155,112) 85.4 856,501
130 - - 1,555
- -
- 21 -
<Appendix> Nintendo Co., Ltd.(Non-consolidated)
Date
Description Amount % Amount % Amount %
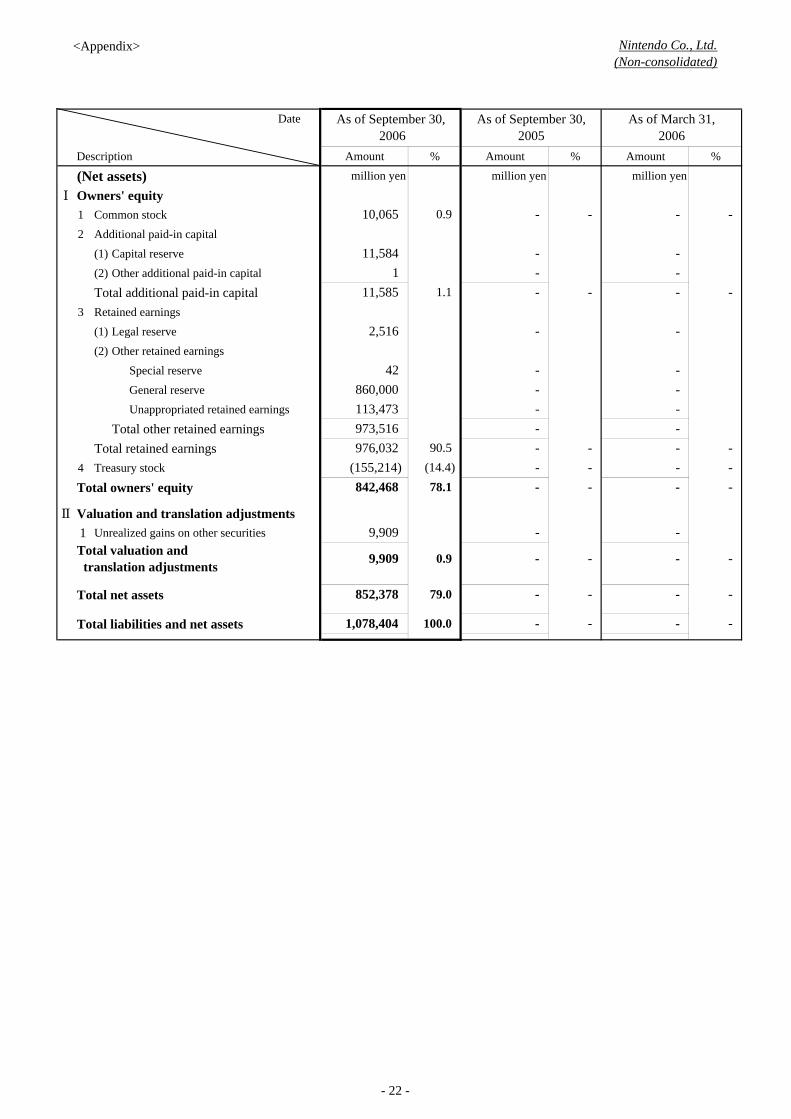
(Net assets) million yen million yen million yen
Ⅰ Owners' equity1 Common stock2 Additional paid-in capital
(1) Capital reserve(2) Other additional paid-in capital
Total additional paid-in capital3 Retained earnings
(1) Legal reserve(2) Other retained earnings
Special reserveGeneral reserveUnappropriated retained earnings
Total other retained earningsTotal retained earnings
4 Treasury stock
Total owners' equity
Ⅱ Valuation and translation adjustments 1 Unrealized gains on other securities
Total net assets
Total liabilities and net assets
Total valuation and translation adjustments
976,032 90.5
-
0.9
As of March 31,2006
As of September 30,2005
(155,214)
113,473
11,584
860,000 42
1,078,404 100.0
9,909
842,468
9,909 0.9
852,378 79.0
-
-
-
-
-
- - - -
-
-
- -
-
-
-
-
-
-
-
-
-
-
- - -
-
-
-
-
-
(14.4) - 78.1 -
- -
973,516 -
1 -
2,516
11,585 -
-
-
- -
10,065
As of September 30, 2006
- -
- - -
1.1
- 22 -
<Appendix> Nintendo Co., Ltd.(Non-consolidated)
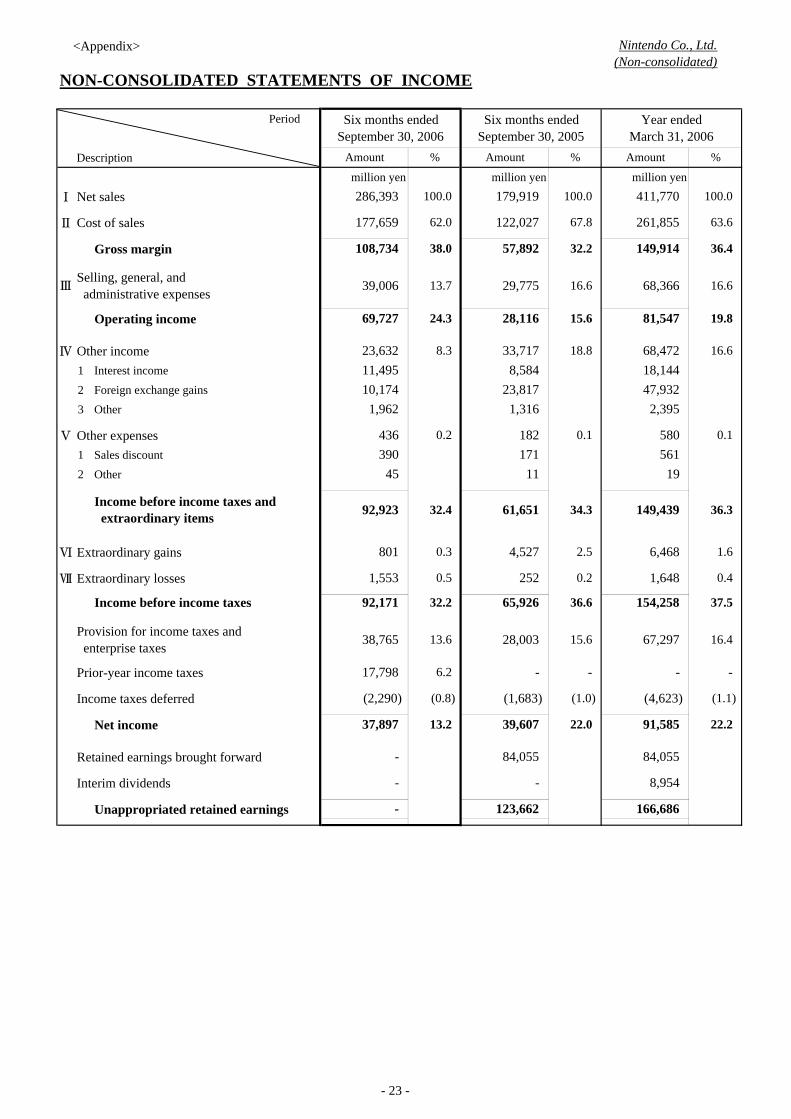
NON-CONSOLIDATED STATEMENTS OF INCOME
Period
Descriptionmillion yen million yen million yen
Ⅰ Net sales
Ⅱ Cost of sales
Gross margin
Operating income
Ⅳ Other income1 Interest income2 Foreign exchange gains3 Other
Ⅴ Other expenses1 Sales discount2 Other
Ⅵ Extraordinary gains
Ⅶ Extraordinary losses
Prior-year income taxes
Income taxes deferred
Net income
Retained earnings brought forward
Interim dividends
Unappropriated retained earnings
-
8,954 - -
166,686 - 123,662
- 84,055
(1.0)
84,055
22.2
(1.1)
16.4
149,439
6,468
67,297
1,648
2.5
15.6
- -
19
2,395
580 561
19.8
0.1
68,472 16.6 18,144
13.6
47,932
4,527
0.2
32.2
0.1
8,584 23,817
1,316
1.6
36.3
0.4
Income before income taxes and extraordinary items 92,923 34.3
436 0.2
61,651
37,897
390 45
92,171
17,798 6.2 -
100.0
261,855 63.6
149,914 36.4
411,770
81,547
(2,290)
22.0 13.2
(0.8) (1,683)
39,607
(4,623)
91,585
801
Provision for income taxes and enterprise taxes
171
0.5 1,553
38,765
32.4
28,003
11
0.3
252
Selling, general, and administrative expenses
16.6 68,366 16.6
%Amount % Amount
67.8
Ⅲ 39,006 13.7 29,775
33,717 18.8
100.0
62.0
38.0 32.2 57,892
28,116 15.6
100.0
69,727
286,393
122,027 177,659
108,734
Amount
179,919
%
182
11,495 10,174
1,962
24.3
23,632 8.3
Six months endedSeptember 30, 2006
Year endedMarch 31, 2006
Six months endedSeptember 30, 2005
Income before income taxes 37.5 154,258 36.6 65,926
- 23 -

<Appendix> Nintendo Co., Ltd.(Non-consolidated)
NON-CONSOLIDATED STATEMENTS OF NET ASSETSSix months ended September 2006 (April 1, 2006 - September 30, 2006)
million yenOwners' equity
Additional paid-in capital
Balance as of March 31, 2006
* Reversal of special reserve* Dividends from retained earnings* Directors' bonuses* General reserve
Net incomePurchase of treasury stockDisposal of treasury stock
Balance as of September 30, 2006
million yenOwners' equity
Retained earningsOther retained earnings
Balance as of March 31, 2006
* Reversal of special reserve* Dividends from retained earnings* Directors' bonuses* General reserve
Net incomePurchase of treasury stockDisposal of treasury stock
Balance as of September 30, 2006
million yenValuation and translation adjustments
Balance as of March 31, 2006
* Reversal of special reserve* Dividends from retained earnings* Directors' bonuses* General reserve
Net incomePurchase of treasury stockDisposal of treasury stock
Balance as of September 30, 2006[Note] *Allocated at the annual general meeting of shareholders' held in June 2006.
Net amount of changes in the interim period other than owners' equity (806)
Total amount of changes in the interim period 0 0 - -
- -
856,501
-
852,378
- 37,897
(102) 0
(40,932)
(806)
(4,123)
9,909
10,716
- - - - - - -
9,909
(806)
Unrealized gains onother securities
Total valuation andtranslation adjustments
- -
10,716
Amount of changes in the interim period
Total amount of changes in the interim period
10,065
-
-
- (2)
-
- -
10,065
2,516
-
42
- -
- - - -
11,584
- - - - - - -
11,584
0
- - - - - - 0
1
11,585
- - - - - - 0
11,585
Amount of changes in the interim period
Legal reserveSpecial reserve General reserve
Treasurystock
Totalowners'equity
2,516 44
Total retainedearnings
845,785 979,247 810,000 (155,112) 166,686
- -
Unappropriatedretained earnings
-
2 (40,932)
(180) - -
- -
-
(180) -
-
37,897 - -
-
- -
860,000
(50,000) 37,897
50,000 - - -
-
- (40,932)
- (40,932)
- -
(180) -
37,897 (102)
- (102)
113,473
0 -
Total net assets
(180)
Common stock Total additional paid-in capital
Other additionalpaid-in capitalCapital reserve
0
842,468 (155,214) 976,032
(3,316) (102) (3,214) (53,212) 50,000 (2) -
Total amount of changes in the interim period (806) (806)
Amount of changes in the interim period
- - -
- 24 -
<Appendix> Nintendo Co., Ltd.(Non-consolidated)
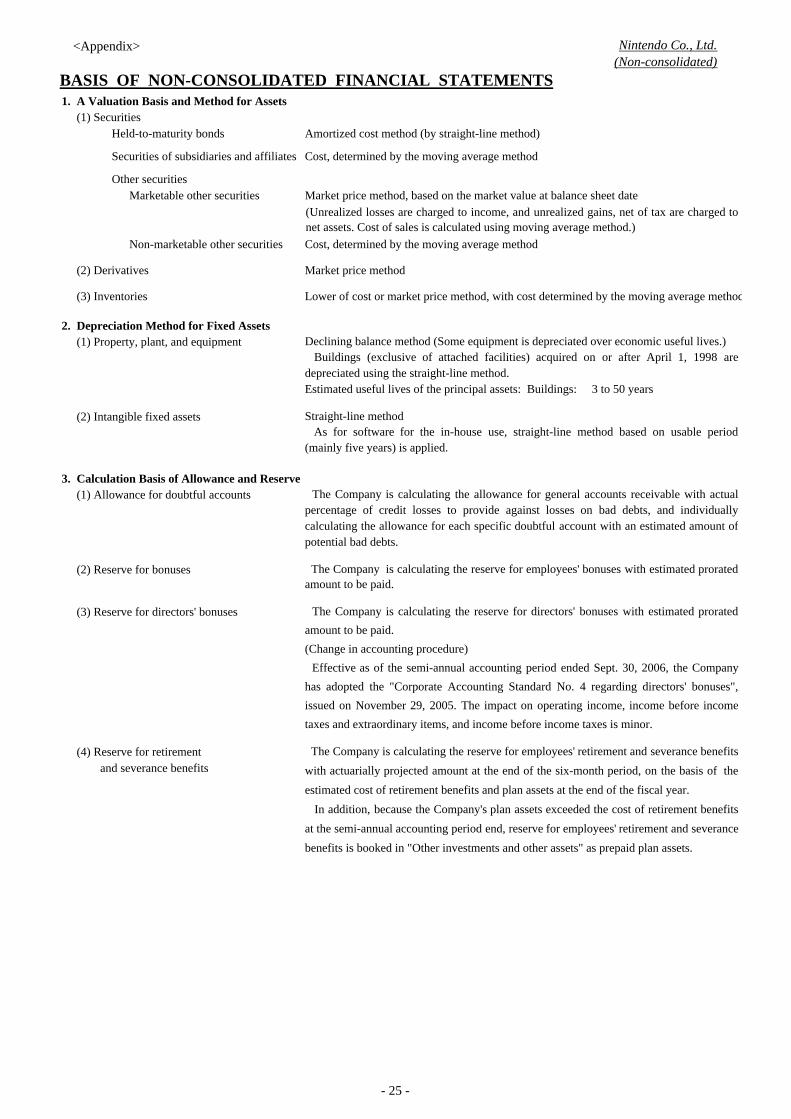
BASIS OF NON-CONSOLIDATED FINANCIAL STATEMENTS1. A Valuation Basis and Method for Assets
(1) SecuritiesHeld-to-maturity bonds Amortized cost method (by straight-line method)
Securities of subsidiaries and affiliates Cost, determined by the moving average method
Other securitiesMarketable other securities Market price method, based on the market value at balance sheet date
Non-marketable other securities Cost, determined by the moving average method
(2) Derivatives Market price method
(3) Inventories Lower of cost or market price method, with cost determined by the moving average method
2. Depreciation Method for Fixed Assets(1) Property, plant, and equipment
(2) Intangible fixed assets
3. Calculation Basis of Allowance and Reserve(1) Allowance for doubtful accounts
(2) Reserve for bonuses
(3) Reserve for directors' bonuses
(4) Reserve for retirement and severance benefits
Declining balance method (Some equipment is depreciated over economic useful lives.)Buildings (exclusive of attached facilities) acquired on or after April 1, 1998 are
depreciated using the straight-line method.Estimated useful lives of the principal assets: Buildings: 3 to 50 years
The Company is calculating the reserve for employees' bonuses with estimated proratedamount to be paid.
The Company is calculating the reserve for directors' bonuses with estimated proratedamount to be paid.(Change in accounting procedure)
Effective as of the semi-annual accounting period ended Sept. 30, 2006, the Companyhas adopted the "Corporate Accounting Standard No. 4 regarding directors' bonuses",issued on November 29, 2005. The impact on operating income, income before incometaxes and extraordinary items, and income before income taxes is minor.
The Company is calculating the allowance for general accounts receivable with actualpercentage of credit losses to provide against losses on bad debts, and individuallycalculating the allowance for each specific doubtful account with an estimated amount ofpotential bad debts.
Straight-line methodAs for software for the in-house use, straight-line method based on usable period
(mainly five years) is applied.
The Company is calculating the reserve for employees' retirement and severance benefitswith actuarially projected amount at the end of the six-month period, on the basis of theestimated cost of retirement benefits and plan assets at the end of the fiscal year.
In addition, because the Company's plan assets exceeded the cost of retirement benefitsat the semi-annual accounting period end, reserve for employees' retirement and severancebenefits is booked in "Other investments and other assets" as prepaid plan assets.
(Unrealized losses are charged to income, and unrealized gains, net of tax are charged tonet assets. Cost of sales is calculated using moving average method.)
- 25 -
<Appendix> Nintendo Co., Ltd.(Non-consolidated)
4. Translation Basis of Assets and/or Liabilities Denominated in Foreign Currencies
5. Accounting Procedure of Lease Transactions
6. Others
(1) Accounting procedure of consumption taxes
(2) Accounting standard regarding "Net assets" in balance sheets
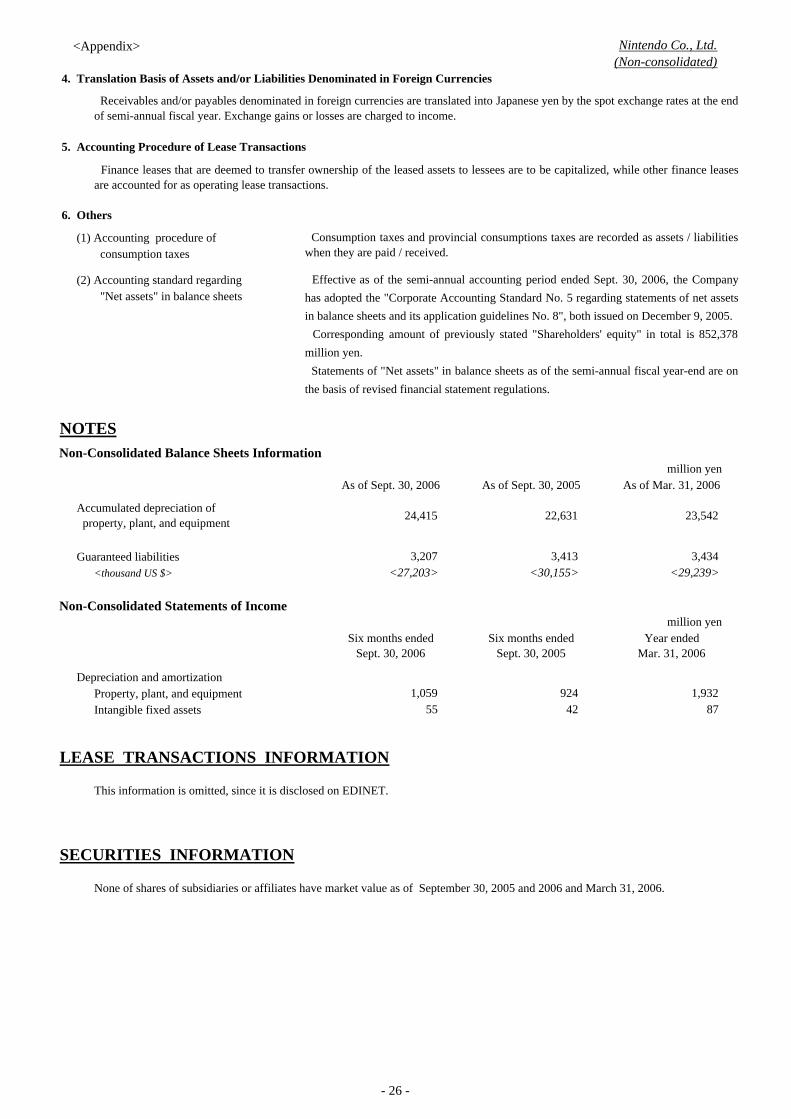
NOTESNon-Consolidated Balance Sheets Information
million yenAs of Sept. 30, 2006 As of Sept. 30, 2005 As of Mar. 31, 2006
Guaranteed liabilities<thousand US $>
Non-Consolidated Statements of Incomemillion yen
Depreciation and amortization Property, plant, and equipmentIntangible fixed assets
LEASE TRANSACTIONS INFORMATION
SECURITIES INFORMATION
Accumulated depreciation of property, plant, and equipment 23,542 22,631 24,415
3,207 3,413 3,434
55 42 87
Six months endedSept. 30, 2006
Six months endedSept. 30, 2005
Year endedMar. 31, 2006
1,059 924 1,932
<27,203> <30,155> <29,239>
Finance leases that are deemed to transfer ownership of the leased assets to lessees are to be capitalized, while other finance leasesare accounted for as operating lease transactions.
Consumption taxes and provincial consumptions taxes are recorded as assets / liabilitieswhen they are paid / received.
Receivables and/or payables denominated in foreign currencies are translated into Japanese yen by the spot exchange rates at the endof semi-annual fiscal year. Exchange gains or losses are charged to income.
Effective as of the semi-annual accounting period ended Sept. 30, 2006, the Companyhas adopted the "Corporate Accounting Standard No. 5 regarding statements of net assetsin balance sheets and its application guidelines No. 8", both issued on December 9, 2005.
Corresponding amount of previously stated "Shareholders' equity" in total is 852,378million yen.
Statements of "Net assets" in balance sheets as of the semi-annual fiscal year-end are onthe basis of revised financial statement regulations.
This information is omitted, since it is disclosed on EDINET.
None of shares of subsidiaries or affiliates have market value as of September 30, 2005 and 2006 and March 31, 2006.
- 26 -
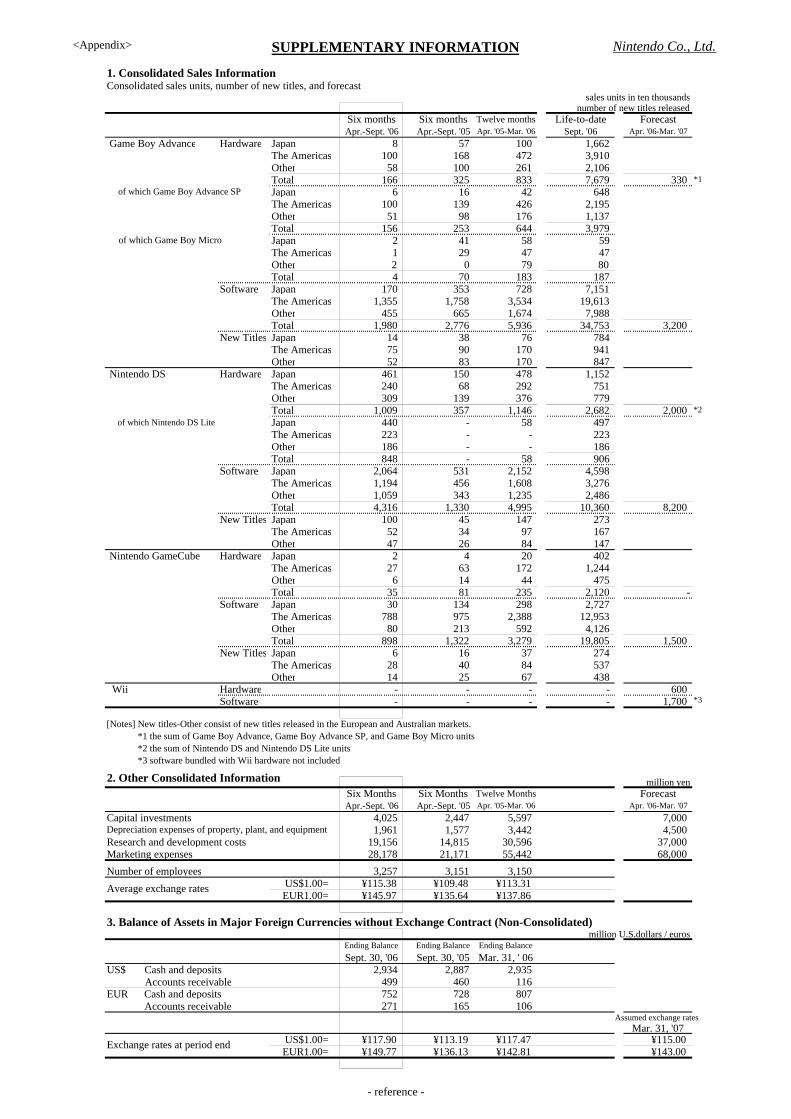
<Appendix> SUPPLEMENTARY INFORMATION Nintendo Co., Ltd.
1. Consolidated Sales InformationConsolidated sales units, number of new titles, and forecast
sales units in ten thousandsnumber of new titles released
Six months Six months Twelve months Life-to-date ForecastApr.-Sept. '06 Apr.-Sept. '05 Apr. '05-Mar. '06 Sept. '06 Apr. '06-Mar. '07
Game Boy Advance Hardware Japan 8 57 100 1,662 The Americas 100 168 472 3,910 Other 58 100 261 2,106 Total 166 325 833 7,679 330 *1Japan 6 16 42 648 The Americas 100 139 426 2,195 Other 51 98 176 1,137 Total 156 253 644 3,979 Japan 2 41 58 59 The Americas 1 29 47 47 Other 2 0 79 80Total 4 70 183 187
Software Japan 170 353 728 7,151 The Americas 1,355 1,758 3,534 19,613 Other 455 665 1,674 7,988 Total 1,980 2,776 5,936 34,753 3,200
New Titles Japan 14 38 76 784 The Americas 75 90 170 941 Other 52 83 170 847
Nintendo DS Hardware Japan 461 150 478 1,152 The Americas 240 68 292 751 Other 309 139 376 779 Total 1,009 357 1,146 2,682 2,000 *2
of which Nintendo DS Lite Japan 440 - 58 497 The Americas 223 - - 223 Other 186 - - 186 Total 848 - 58 906
Software Japan 2,064 531 2,152 4,598 The Americas 1,194 456 1,608 3,276 Other 1,059 343 1,235 2,486 Total 4,316 1,330 4,995 10,360 8,200
New Titles Japan 100 45 147 273 The Americas 52 34 97 167 Other 47 26 84 147
Nintendo GameCube Hardware Japan 2 4 20 402 The Americas 27 63 172 1,244 Other 6 14 44 475 Total 35 81 235 2,120 -
Software Japan 30 134 298 2,727 The Americas 788 975 2,388 12,953 Other 80 213 592 4,126 Total 898 1,322 3,279 19,805 1,500
New Titles Japan 6 16 37 274 The Americas 28 40 84 537 Other 14 25 67 438
Wii Hardware - - - - 600 Software - - - - 1,700 *3
[Notes] New titles-Other consist of new titles released in the European and Australian markets.[Notes] *1 the sum of Game Boy Advance, Game Boy Advance SP, and Game Boy Micro units[Notes] *2 the sum of Nintendo DS and Nintendo DS Lite units[Notes] *3 software bundled with Wii hardware not included
million yenSix Months Six Months Twelve Months ForecastApr.-Sept. '06 Apr.-Sept. '05 Apr. '05-Mar. '06 Apr. '06-Mar. '07
Capital investments 4,025 2,447 5,597 7,000 1,961 1,577 3,442 4,500
Research and development costs 19,156 14,815 30,596 37,000 Marketing expenses 28,178 21,171 55,442 68,000 Number of employees 3,257 3,151 3,150
US$1.00= ¥115.38 ¥109.48 ¥113.31EUR1.00= ¥145.97 ¥135.64 ¥137.86
3. Balance of Assets in Major Foreign Currencies without Exchange Contract (Non-Consolidated)million U.S.dollars / euros
Ending Balance Ending Balance Ending BalanceSept. 30, '06 Sept. 30, '05 Mar. 31, ' 06
US$ Cash and deposits 2,934 2,887 2,935 US$ Accounts receivable 499 460 116 EUR Cash and deposits 752 728 807 EUR Accounts receivable 271 165 106
Assumed exchange rates Mar. 31, '07
US$1.00= ¥117.90 ¥113.19 ¥117.47 ¥115.00EUR1.00= ¥149.77 ¥136.13 ¥142.81 ¥143.00
Exchange rates at period end
Average exchange rates
of which Game Boy Micro
of which Game Boy Advance SP
2. Other Consolidated Information
Depreciation expenses of property, plant, and equipment
- reference -