Embed Size (px)
Citation preview
RESEARCHPAPERS
Diversity enhances carbon storage intropical forestsL. Poorter1*, M. T. van der Sande1,2, J. Thompson3,4, E. J. M. M. Arets2,A. Alarcón5, J. Álvarez-Sánchez6, N. Ascarrunz5, P. Balvanera7,G. Barajas-Guzmán6, A. Boit8, F. Bongers1, F. A. Carvalho9, F. Casanoves10,G. Cornejo-Tenorio7, F. R. C. Costa9, C. V. de Castilho11,J. F. Duivenvoorden12, L. P. Dutrieux13, B. J. Enquist14, F. Fernández-Méndez15,B. Finegan16, L. H. L. Gormley17, J. R. Healey17, M. R. Hoosbeek18,G. Ibarra-Manríquez7, A. B. Junqueira9,19,20, C. Levis1,9, J. C. Licona5,L. S. Lisboa21, W. E. Magnusson9, M. Martínez-Ramos7, A. Martínez-Yrizar22,L. G. Martorano23, L. C. Maskell24, L. Mazzei23, J. A. Meave6, F. Mora7,R. Muñoz6, C. Nytch4, M. P. Pansonato9, T. W. Parr24, H. Paz7,E. A. Pérez-García6, L. Y. Rentería7, J. Rodríguez-Velazquez7,D. M. A. Rozendaal1,26, A. R. Ruschel23, B. Sakschewski8, B. Salgado-Negret27,J. Schietti9, M. Simões25, F. L. Sinclair17,28, P. F. Souza9, F. C. Souza9, J. Stropp29,H. ter Steege30,31, N. G. Swenson32, K. Thonicke8, M. Toledo5, M. Uriarte33,P. van der Hout34, P. Walker35, N. Zamora36 and M. Peña-Claros1
1Forest Ecology and Forest Management Group, WageningenUniversity, PO Box 47, 6700 AA Wageningen, The Netherlands,2Alterra, Wageningen UR, Wageningen, The Netherlands,3Centre for Ecology & Hydrology, Penicuik, UK, 4Department ofEnvironmental Science, University of Puerto Rico, Río Piedras,Puerto Rico, 5Instituto Boliviano de Investigación Forestal(IBIF), FCA-UAGRM, Santa Cruz de la Sierra, Bolivia,6Facultad de Ciencias, Universidad Nacional Autónoma deMéxico, México DF, México, 7Instituto de Investigaciones enEcosistemas y Sustentabilidad, Universidad Nacional Autónomade México, Morelia, México, 8Potsdam Institute for ClimateImpact Research e.V. (PIK), Potsdam, Germany andBerlin-Brandenburg Institute of Advanced Biodiversity Research(BBIB), 14195 Berlin, Germany, 9Instituto Nacional dePesquisas da Amazônia (INPA), Manaus, Brazil, 10BiostatisticsUnit, CATIE, Turrialba, Costa Rica, 11Embrapa Roraima, BoaVista, Brazil, 12IBED, University of Amsterdam, Amsterdam, TheNetherlands, 13Lab of GIS and Remote-Sensing, WageningenUniversity, Wageningen, The Netherlands, 14Department ofEcology and Evolutionary Biology, University of Arizona, P.O.Box 210088, Tucson, AZ 85721, USA and The Santa Fe Institute,1399 Hyde Park Rd, Santa Fe, NM 87501, USA, 15Grupo deInvestigación en Biodiversidad y Dinámica de EcosistemasTropicales, Universidad del Tolima, Ibagué, Colombia andLaboratory of Ecology and Evolution of Plant, UniversidadeFederal de Viçosa, Brazil, 16Production and Conservation inForests Programme, CATIE, Turrialba, Costa Rica, 17School ofEnvironment, Natural Resources and Geography, BangorUniversity, Bangor, UK, 18Department of Soil Quality,Wageningen University, Wageningen, The Netherlands, 19Centrefor Crop Systems Analysis, Wageningen University, Wageningen,The Netherlands, 20Knowledge, Technology and InnovationGroup, Wageningen University, Wageningen, The Netherlands,21ESALQ, USP, Piracicaba, Brazil, 22Instituto de Ecología,UNAM, Hermosillo, Mexico, 23Embrapa Amazônia Oriental,Belém, Brazil, 24Centre for Ecology and Hydrology (CEH),Lancaster, UK, 25Embrapa Solos, Rio de Janeiro, Brazil,26Department of Ecology and Evolutionary Biology, University ofConnecticut, Storrs, USA, 27Instituto de Investigación deRecursos Biológicos Alexander von Humboldt, Bogotá, Colombia,28World Agroforestry Centre (ICRAF), Nairobi, Kenya,29Institute of Biological and Health Sciences, Federal Universityof Alagoas, Maceió, Brazil, 30Naturalis Biodiversity Center,Leiden, Netherlands., 31Ecology and Biodiversity Group, UtrechtUniversity, Utrecht, The Netherlands, 32Department of Biology,University of Maryland, College Park, Maryland 20742, USA,33Department of Ecology, Evolution and Environmental Biology,Columbia University, New York, USA, 34Van der Hout ForestryConsulting, Rotterdam, The Netherlands, 35Wildtracks, POBox 278, Belize City, Belize, 36Instituto Nacional deBiodiversidad (INBio), Santo Domingo, Costa Rica
ABSTRACT
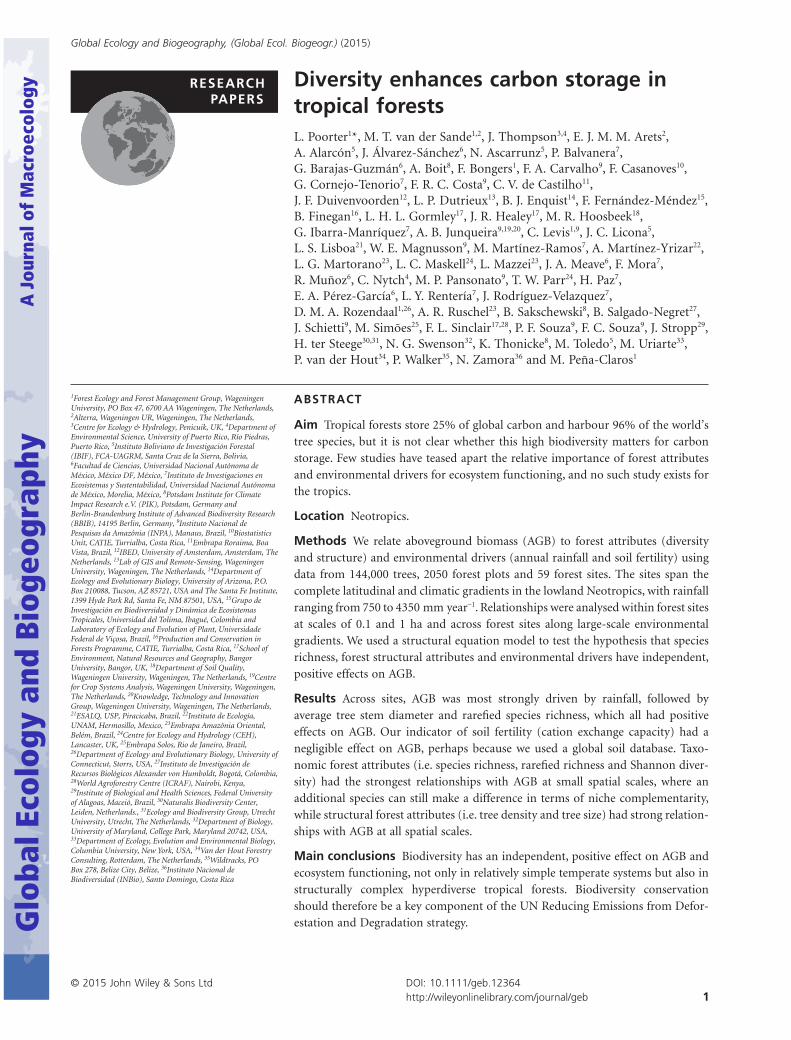
Aim Tropical forests store 25% of global carbon and harbour 96% of the world’stree species, but it is not clear whether this high biodiversity matters for carbonstorage. Few studies have teased apart the relative importance of forest attributesand environmental drivers for ecosystem functioning, and no such study exists forthe tropics.
Location Neotropics.
Methods We relate aboveground biomass (AGB) to forest attributes (diversityand structure) and environmental drivers (annual rainfall and soil fertility) usingdata from 144,000 trees, 2050 forest plots and 59 forest sites. The sites span thecomplete latitudinal and climatic gradients in the lowland Neotropics, with rainfallranging from 750 to 4350 mm year−1. Relationships were analysed within forest sitesat scales of 0.1 and 1 ha and across forest sites along large-scale environmentalgradients. We used a structural equation model to test the hypothesis that speciesrichness, forest structural attributes and environmental drivers have independent,positive effects on AGB.
Results Across sites, AGB was most strongly driven by rainfall, followed byaverage tree stem diameter and rarefied species richness, which all had positiveeffects on AGB. Our indicator of soil fertility (cation exchange capacity) had anegligible effect on AGB, perhaps because we used a global soil database. Taxo-nomic forest attributes (i.e. species richness, rarefied richness and Shannon diver-sity) had the strongest relationships with AGB at small spatial scales, where anadditional species can still make a difference in terms of niche complementarity,while structural forest attributes (i.e. tree density and tree size) had strong relation-ships with AGB at all spatial scales.
Main conclusions Biodiversity has an independent, positive effect on AGB andecosystem functioning, not only in relatively simple temperate systems but also instructurally complex hyperdiverse tropical forests. Biodiversity conservationshould therefore be a key component of the UN Reducing Emissions from Defor-estation and Degradation strategy.
bs_bs_banner
Global Ecology and Biogeography, (Global Ecol. Biogeogr.) (2015)
© 2015 John Wiley & Sons Ltd DOI: 10.1111/geb.12364http://wileyonlinelibrary.com/journal/geb 1
*Correspondence: Lourens Poorter, ForestEcology and Forest Management Group,Wageningen University, PO Box 47, Wageningen6700 AA, The Netherlands.E-mail: [email protected]
KeywordsBiodiversity, biomass, ecosystem functioning, Neotropics, rainfall, REDD+,scale, soil, tropical forest.
INTRODUCTION
Tropical forests are hotspots for carbon and biodiversity; they
only cover 7–10% of the Earth’s land surface but they store 25%
of the terrestrial above- and belowground carbon (Bonan,
2008), are responsible for 34% of terrestrial primary productiv-
ity (Beer et al., 2010) and harbour 96% of the world’s estimated
45,000 tree species (Fine et al., 2008). From a practical point of
view, this provides a win–win situation for the UN Reducing
Emissions from Deforestation and Degradation (REDD+) ini-
tiative, which aims to conserve carbon storage of tropical forest
while safeguarding biodiversity. Importantly, biodiversity con-
servation can be much more than a side benefit alone, if a higher
biodiversity enhances carbon sequestration and storage (Diaz
et al., 2009). Forest functioning may be determined not only by
taxonomic attributes (i.e. measures of species identity) of the
vegetation but also by structural attributes, and by the direct and
indirect effects of environmental drivers (see the conceptual
model in Fig. 1a). Surprisingly few studies have teased apart the
relative importance of these environmental drivers and forest
attributes for ecosystem properties and processes (but see
Paquette & Messier, 2011; Vilà et al., 2013).
Over the past two decades there has been a strong emphasis
on the role of biodiversity in ecosystem properties, processes
and services (Naeem et al., 2009, and references therein). Species
richness is thought to enhance productivity through: (1) niche
complementarity, where species have different niches and are
therefore able to access more of the available resources or facili-
tate each other, thus enhancing overall productivity (Tilman
et al., 2001); (2) the selection effect, as by chance a very produc-
tive species is included in the community (Loreau & Hector,
2001); and (3) the insurance effect, as one species contributes
more to ecosystem productivity in one year and another species
in another year (Yachi & Loreau, 1999; Isbell et al., 2011). These
hypotheses about the relationship between species richness and
productivity could also apply to standing biomass, as higher
productivity may lead to faster accumulation of biomass, and
productivity and biomass are therefore positively correlated in
forests (Chisholm et al., 2013).
Not only taxonomic attributes (i.e. species identity) but also
structural attributes, such as stem diameter, tree density and leaf
area index, determine biomass, resource capture and productiv-
ity. Vegetation structure contributes directly to biomass, but
variations in structure, such as leaf layering, may also enhance
light capture and carbon gain. Structural attributes may vary
more strongly than taxonomic attributes within communities
(due to disturbances) and across communities (due to environ-
mental gradients), and may have a larger direct impact on
biomass and ecosystem processes. A recent study found, for
example, that vegetation quantity (biomass) rather than vegeta-
tion quality (i.e. species functional traits and variation therein)
was the main driver of productivity in tropical secondary forests
(Lohbeck et al., 2015). The question is therefore whether taxo-
nomic attributes may explain any additional variation in
aboveground biomass (AGB) once the role of structural attrib-
utes has explicitly been taken into account (Fig. 1a).
A recent meta-analysis showed that in experimental studies
species richness increased primary productivity and standing
biomass and that biodiversity loss therefore has a negative effect
on ecosystem functioning (Cardinale et al., 2011). However,
most studies included in the meta-analysis were carried out at
small spatial scales and involved grasslands and aquatic systems,
and most experiments used a small number of species (fewer
than 10; Cardinale et al., 2011); thus the effect of high species
richness could not be assessed. It is not clear therefore whether
the relationship between biodiversity and biomass will also hold
for: (1) larger spatial scales where there may be a saturating
effect as the number of species rises without a further increase in
carbon storage; (2) areas under different environmental con-
trols; and (3) hyperdiverse communities in the tropics where
many species might be functionally redundant.
The relationships between species richness, AGB and produc-
tivity may vary with spatial scale. Experimental grassland studies
and many forest surveys have typically used small plots, and
found that the positive effect of species richness on biomass or
biomass productivity saturates with only three to eight species
(Tilman et al., 2001; Zhang et al., 2012; Gamfeldt et al., 2013;
Vilà et al., 2013). Chisholm et al. (2013) found for temperate
and tropical forests that species richness and biomass were
positively related within forest sites at small spatial scales
(20 m × 20 m), probably because in a small area with relatively
few species any additional species still matter for productivity
and AGB. At larger spatial scales (100 m × 100 m) there was no
consistent relationship between species richness and biomass,
probably as a result of such a saturation effect.
The relationship between species richness and productivity
may also vary with systems under different environmental con-
ditions. In a study using small survey plots in Canada, Paquette
& Messier (2011) found that in boreal forests facing harsh envi-
ronmental conditions, functional tree diversity affected produc-
tivity strongly and positively, whereas in benign and productive
temperate forests diversity had a weaker effect on productivity.
Paquette & Messier hypothesized that in stressful (e.g. cold or
dry) environments diversity contributes to facilitation processes
and, hence, to productivity, whereas in benign environments
diversity results in more competition. It cannot be ruled out,
L. Poorter et al.
Global Ecology and Biogeography, © 2015 John Wiley & Sons Ltd2
however, that the stronger diversity effect in boreal forests is
simply a result of the lower species richness there.
Both taxonomic and structural attributes and ecosystem
properties and processes may vary along environmental gradi-
ents (Fig. 1a). Species richness of tropical lowland forests tends
to increase with rainfall and reduced seasonality (ter Steege
et al., 2003). The density of large trees, forest AGB and net
primary productivity all increase with resource availability
(annual rainfall and soil fertility) and decrease with temperature
(Malhi et al., 2004; Baraloto et al., 2011; Quesada et al., 2012;
Slik et al., 2013). Hence, environmental drivers are likely to
affect AGB either directly or indirectly (via their effect on taxo-
nomic and structural forest attributes) (Fig. 1a).
Here we relate AGB to taxonomic and structural forest attrib-
utes, as well as to rainfall and soil fertility. We use data from
144,000 trees that were sampled in 2050 forest plots established
in 59 forest sites. This dataset spans the complete latitudinal and
climatic gradient in the lowland Neotropics (ranging from 750
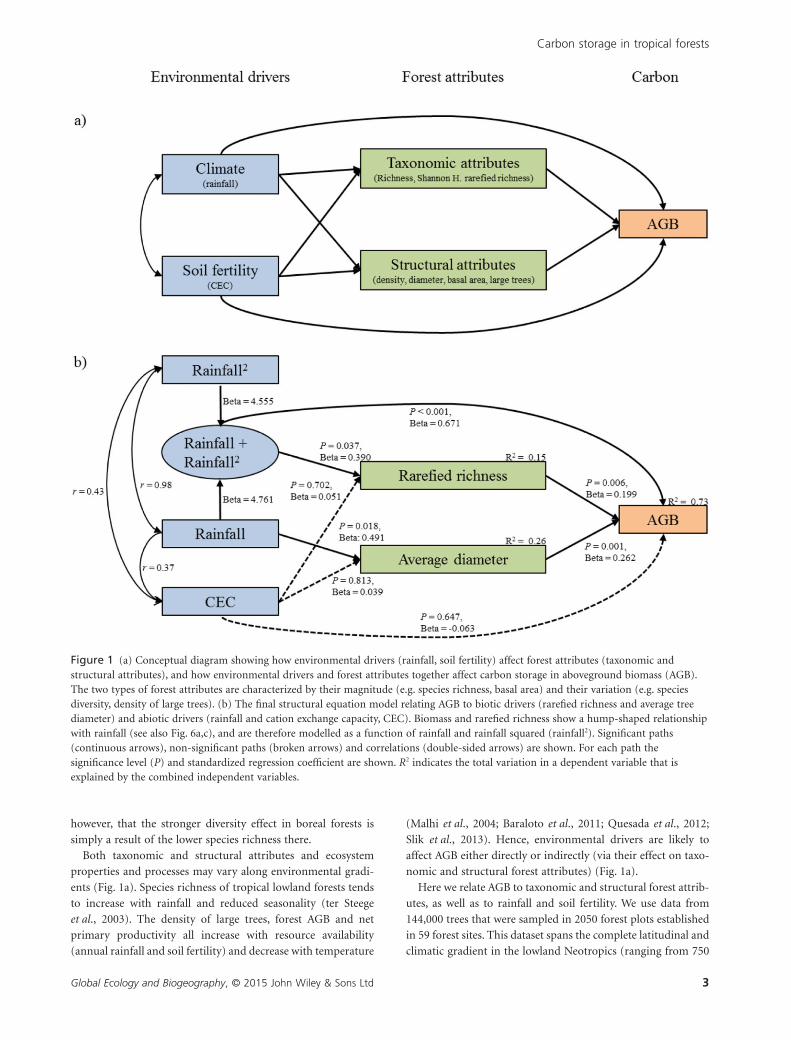
Figure 1 (a) Conceptual diagram showing how environmental drivers (rainfall, soil fertility) affect forest attributes (taxonomic andstructural attributes), and how environmental drivers and forest attributes together affect carbon storage in aboveground biomass (AGB).The two types of forest attributes are characterized by their magnitude (e.g. species richness, basal area) and their variation (e.g. speciesdiversity, density of large trees). (b) The final structural equation model relating AGB to biotic drivers (rarefied richness and average treediameter) and abiotic drivers (rainfall and cation exchange capacity, CEC). Biomass and rarefied richness show a hump-shaped relationshipwith rainfall (see also Fig. 6a,c), and are therefore modelled as a function of rainfall and rainfall squared (rainfall2). Significant paths(continuous arrows), non-significant paths (broken arrows) and correlations (double-sided arrows) are shown. For each path thesignificance level (P) and standardized regression coefficient are shown. R2 indicates the total variation in a dependent variable that isexplained by the combined independent variables.
Carbon storage in tropical forests
Global Ecology and Biogeography, © 2015 John Wiley & Sons Ltd 3
to 4350 mm of rainfall per year) and covers all major forest types
(from dry deciduous to wet forests; see Appendix S1 in Support-
ing Information). Relationships were analysed at a local scale
under relatively homogeneous environmental conditions within
forest sites (0.1 and 1 ha plots) and at a regional scale along
large-scale environmental and biogeographical gradients across
forest sites.
We address two major questions. First, what are the effects of
taxonomic and structural attributes on AGB and what is their
relative importance? We hypothesize that species diversity has a
positive effect on biomass (through niche complementarity, the
selection effect or the insurance effect) and that this effect can be
observed at small (0.1 ha) spatial scales (where richness is low, so
an additional species still makes a difference) but not at larger (1
ha) spatial scales (because of species redundancy). We predict
that as stem density and average stem diameter increase there
will be greater AGB, and that they have stronger effects on AGB
than taxonomic forest attributes. The second is what are the
direct effects of environmental drivers on AGB, and on the taxo-
nomic and structural attributes of the forest? We hypothesize
that with an increase in resource availability (water and nutri-
ents) there will be an increase in AGB, forest structure (i.e. tree
size) and taxonomic diversity, and that annual rainfall will have
a stronger effect than soil fertility given the large climatic gra-
dient considered.
METHODS
Study sites
We compiled information on species diversity, structure and
biomass from 294 1-ha plots and 1975 0.1-ha plots established
in 59 mature forest sites that covered nearly the full latitudinal
range of Neotropical forests from Mexico to Bolivia (Fig. 2,
Appendix S1). Rainfall ranged from 750 to 4350 mm year−1, and
soil cation exchange capacity (CEC) ranged from 1 to 83
cmol kg−1. For all analyses we just focus on trees because there
was no consistent inventory data for lianas and palms, and
in most forests lianas and palms make only a small contribu-
tion to AGB. For an extensive description of the methods see
Appendix S2.
Biomass calculations
We took advantage of available plot data in mature, fully devel-
oped ‘old-growth’ forests, without visible effects of past human
disturbance. The size, shape, spatial distribution and contigu-
ousness of plots varied across sites (Appendix S1). For this study,
we calculated forest attributes at two spatial scales (0.1 and
1 ha).
In many plots only trees with a stem diameter at breast height
(d.b.h.; the diameter of the tree at 1.3 m from the ground)
of 10 cm or more were measured, but in other plots data for
trees with d.b.h. ≥ 5 cm were also included as these small stems
can contribute a significant part of AGB in drier forests. AGB
was calculated for plots of 0.1 and 1 ha, as the relationship
between AGB and diversity is scale dependent (Chisholm et al.,
2013). For each plot, AGB was calculated for each tree using six
different allometric equations. The allometric equations were
based on stem diameter only (Pearson et al., 2005; henceforth
referred to as the ‘Brown’ equations) or a combination of stem
diameter and wood density (Chave et al., 2005; henceforth
referred to as the ‘Chave’ equations). Brown and Chave both
present three different equations for different forest types: dry
forest, moist forest and wet forest. For use in the Chave calcula-
tions wood density (WD, g cm−3) data came from local sites or
from the Neotropical data of a global WD database (Zanne et al.,
2009; http://datadryad.org/handle/10255/dryad.235). Biomass
was then summed across all trees to obtain AGB (in Mg ha−1).
We first checked to what extent AGB varied with the type of
allometric equation used for biomass, and with both diameter
cut-off limits (Appendix S3). The Chave and Brown estimates of
plot AGB for trees with d.b.h. ≥ 10 cm were tightly related
(r2 = 0.81). The estimated plot AGB using the Chave equations
was on average 1.15 times the estimated AGB using the Brown
equations (paired t-test, t = 16.1, P < 0.001, n = 480). Using the
Chave equations, the estimated plot AGB for trees with
d.b.h. ≥ 5 cm was on average 1.04 times the AGB of trees with
d.b.h. ≥ 10 cm, and this ratio was especially large for dry forests
(on average 1.178) but close to 1 for moist forests (1.033) and
wet forests (1.020; Appendix S3). In dry forests, small trees
(5–10 cm d.b.h.) therefore make a relatively large contribution
to AGB, although their absolute contribution is small. For
further analysis we then used the Chave equations that corre-
sponded to the forest type (dry, moist or wet) to which the plot
belonged, and we used trees with d.b.h ≥ 10 cm, as these data
were available for all plots. We used the Chave equations because
they include wood density, which is an important source of
large-scale variation in AGB (Mitchard et al., 2014).
Structural attributes
Variation in AGB across forest plots is, amongst other things, a
function of the tree density, mean stem diameter and wood
density of trees. It is therefore not a question of whether these
variables are related to AGB, but what their relative strength is in
determining AGB plot biomass. For each plot, five structural
attributes were calculated for which data were available and that
are relevant to the biomass model used: overall tree density,
density of large trees (d.b.h. ≥ 60 cm), mean tree diameter and
stand basal area. Note that biomass of individual trees is calcu-
lated based on tree diameter, and hence tree biomass scales
closely with the basal area of the individual tree. This is some-
what different from stand basal area. A high stand basal area can
be caused by many small trees (each containing little biomass)
or a few trees with a large basal area (each containing a dispro-
portionately large biomass).
Taxonomic attributes
For each plot, three taxonomic attributes were calculated:
species richness per area, rarefied species richness per 50 indi-
L. Poorter et al.
Global Ecology and Biogeography, © 2015 John Wiley & Sons Ltd4
viduals and Shannon diversity. Rarefied species richness is the
number of species observed when a certain number of trees
are randomly drawn from a plot. Such rarefaction removes the
confounding effect of tree density on species richness. For rar-
efied richness we used 50 individuals as a reference, as this
number of individuals is found in both the 0.1-ha plots and
the 1-ha plots. Calculations were made using either EstimateS
9.1.0 (Colwell, 2011) or the R package Vegan (Oksanen et al.,
2014).
Environmental factors
For each site, six climatic variables were obtained from the
nearest climatological station, or from interpolated climatic
maps from WorldClim (Hijmans et al., 2005). We used mean
annual rainfall as the main climatic variable for subsequent
analyses because it was closely related to all other climate
variables, and to AGB and forest attributes. For each site six
soil variables were obtained using site coordinates and maps
from the Harmonized World Soil Database (Nachtergaele
et al., 2012). Data on soil N and P were not available from
this database. We used CEC (in cmol kg−1) as our main soil
variable because it was strongly correlated with the other fer-
tility measures and provides a straightforward measure of soil
fertility.
Statistical analyses
Pearson correlations were used to evaluate whether there was an
association between AGB and each of the measures of taxo-
nomic and structural attributes within sites for 0.1- and 1-ha
plots. For the 1-ha level, one correlation was made per site, using
all 1-ha plots (with a minimum of four plots). For the 0.1-ha
level, several correlations were made per site if these small plots
were nested within a 1-ha plot and if several 1-ha plots were
available. In that case a correlation was made per 1-ha plot using
all 0.1-ha subplots nested within the larger 1-ha plot, and this
was repeated for all the 1-ha plots. Alternatively, a single corre-
lation was made across all plots at a site if these small plots were
not nested within a single 1-ha plot. To evaluate how general
these within-site correlations were, we then calculated at the 0.1-
and 1-ha levels the average and 95% confidence interval of all of
these correlation coefficients combined, pooling all sites. If the
95% confidence interval does not overlap with zero, it means
that, in general, there is a significant correlation between AGB
and the variable concerned. We checked the consistency of the
results by repeating this analysis with a mixed linear model in
which site was included as a random factor in order to account
for the nestedness of the data (Appendix S4). For the 0.1-ha
plots, the 1-ha plot to which they belonged was also included as
a random factor in the model.
We also analysed whether there was a relationship between
AGB, taxonomic attributes and structural attributes across sites,
and therefore across large-scale environmental gradients. Where
data from multiple plots were available at each site we averaged
the data per site to avoid problems with nestedness. For the sites
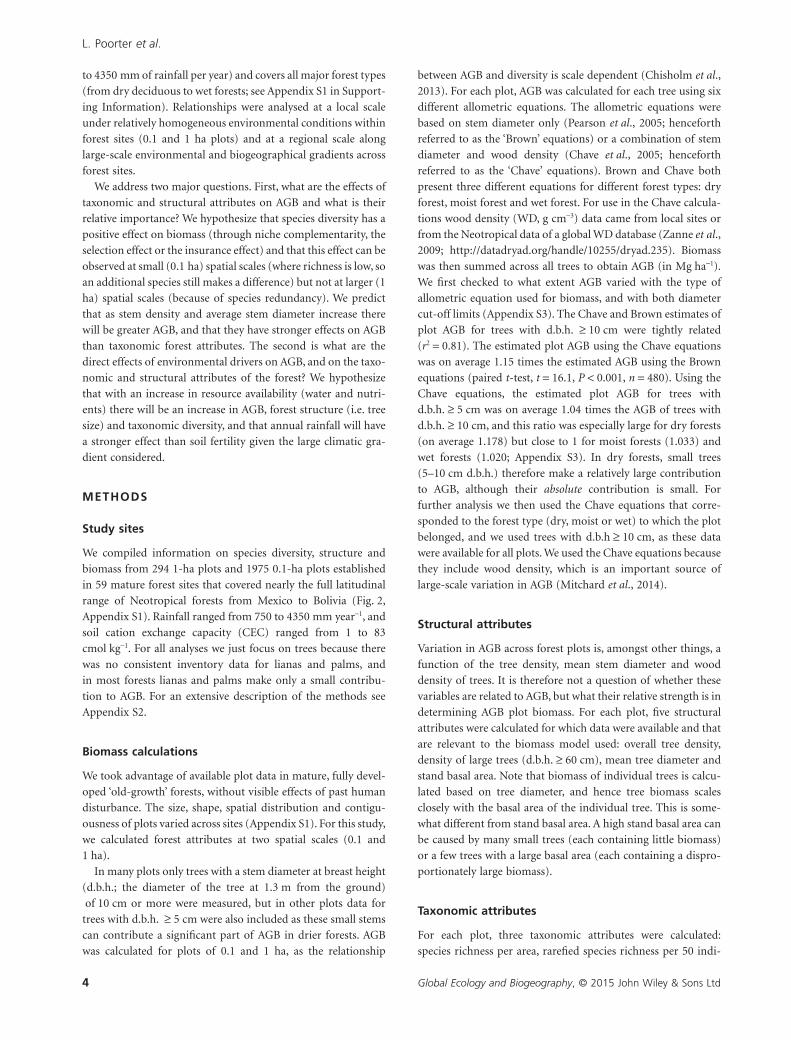
Figure 2 Map of vegetation cover in Latin America, with thelocation of the 60 study sites: (a) aboveground biomass (AGB,Mg ha−1), (b) rarefied species richness (number of species/50stems), and (c) average stem diameter (cm). The size of thesymbol scales with the value of the attribute. The intensity of thegreen colour (or shading) indicates the amount of forest cover.The background layer is derived from a Moderate ResolutionImaging Spectroradiometer (MODIS) vegetation continuous fields(VCF) product (Hansen et al., 2003).
Carbon storage in tropical forests
Global Ecology and Biogeography, © 2015 John Wiley & Sons Ltd 5
that had both 0.1- and 1-ha plots, we only used the average of
the 1-ha plots, as they provide more accurate estimates of
biomass and diversity. In total, data were available for 59 sites
(26 site averages based on 1-ha plots and 33 site averages based
0.1-ha plots). One outlying site with a small plot with an excep-
tionally high AGB was removed from subsequent regression and
structural equation modelling (SEM) analyses.
Structural equation modelling
We used SEM to test for the direct and indirect effects of climate,
soil fertility and taxonomic and structural attributes on AGB
(Fig. 1a). To avoid complexity with nestedness of plots within
sites, we based the SEM on average values for 58 sites. Average
site values were estimated with a different accuracy. To account
for this, sites in the SEM were weighted by the square root of the
total plot area per site.
To test the conceptual model of Fig. 1(a), we selected only one
variable per ‘box’ (climate, soil, taxonomic attributes or struc-
tural attributes) as we had a limited number of replicates (sites).
We used annual rainfall as the climate variable and CEC as the
soil variable. Because bivariate scatterplots indicated that AGB
and rarefied richness showed a hump-shaped relationship with
rainfall, we included for these two response variables both rain-
fall and rainfall squared as predictor variables in the analysis
(Fig. 1b), allowing us to model such a hump-shaped relation-
ship. The combined effect of rainfall and rainfall squared was
evaluated by including a composite variable (the oval box in
Fig. 1b).
Of the three taxonomic attributes considered, we only
included rarefied species richness in the SEM, because it is less
dependent on plot size and multiple regressions indicated that it
was the best predictor of AGB (data not shown). Of the four
structural attributes considered (stand basal area, average tree
diameter, number of trees larger than 60 cm d.b.h. and stem
density), we did a series of SEMs using the same model structure
as in Fig. 1(a) but a different structural variable each time. The
models included: square root-transformed AGB as the depend-
ent variable; rarefied species richness as an endogenous variable
(i.e. a variable that is affected by other variables); annual rainfall,
rainfall squared and CEC as exogenous variables (i.e. independ-
ent variables that have only an effect on other variables); and a
composite variable combining rainfall and rainfall squared. The
only model that significantly fitted the data (i.e., it had a P-value
greater than 0.05) was the model that included average tree
diameter as a structural attribute.
The indirect effects of the exogenous variables (rainfall and
CEC) on AGB were calculated by multiplying the standardized
coefficients of all paths on one route between one of the exog-
enous variables and AGB. All SEM analyses were performed in R
3.0.2. The models were specified with variables and paths (the
‘arrows’ between variables) using the sem function of the lavaan
package (Rosseel, 2012). The replicate weights were defined
using the svydesign function of the survey package, and the
lavaan.survey function was used to evaluate the models when
taking replicate weights into account.
RESULTS
Within-site relations
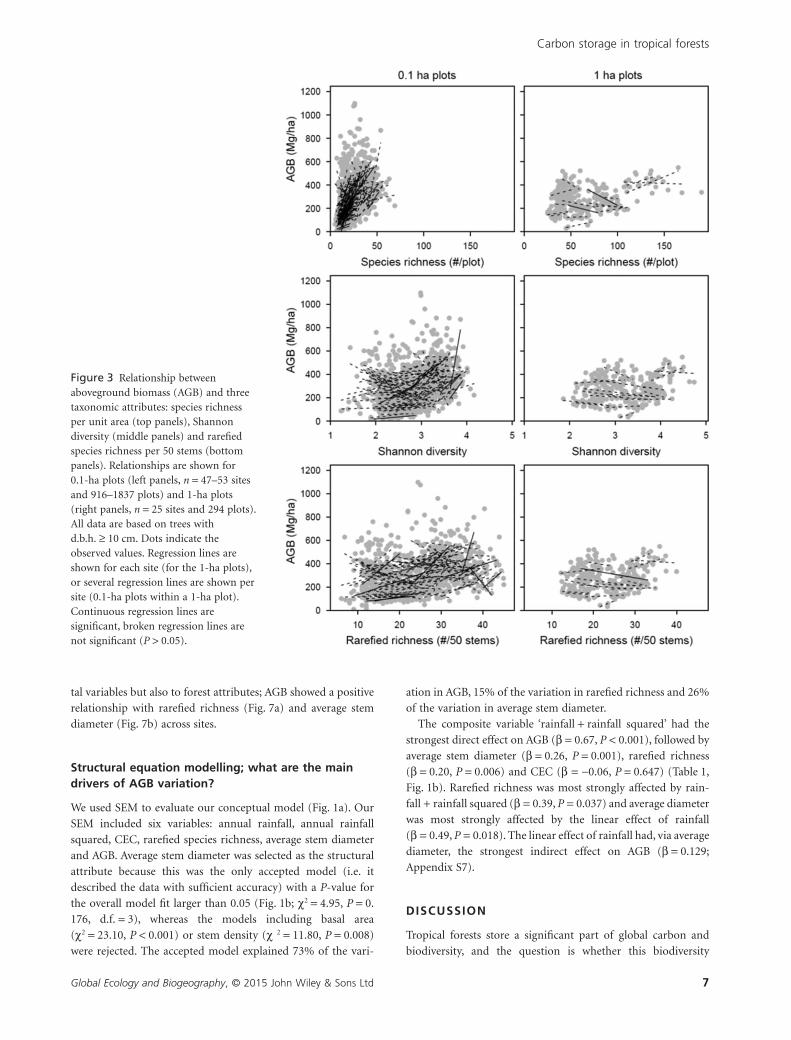
Within each study site, the AGB of the plots was regressed
against the forest attributes. Within most study sites, AGB
tended to increase (non-significantly) with species richness,
Shannon diversity and rarefied richness for the 0.1-ha plots,
whereas there were no clear relationships for the 1-ha plots
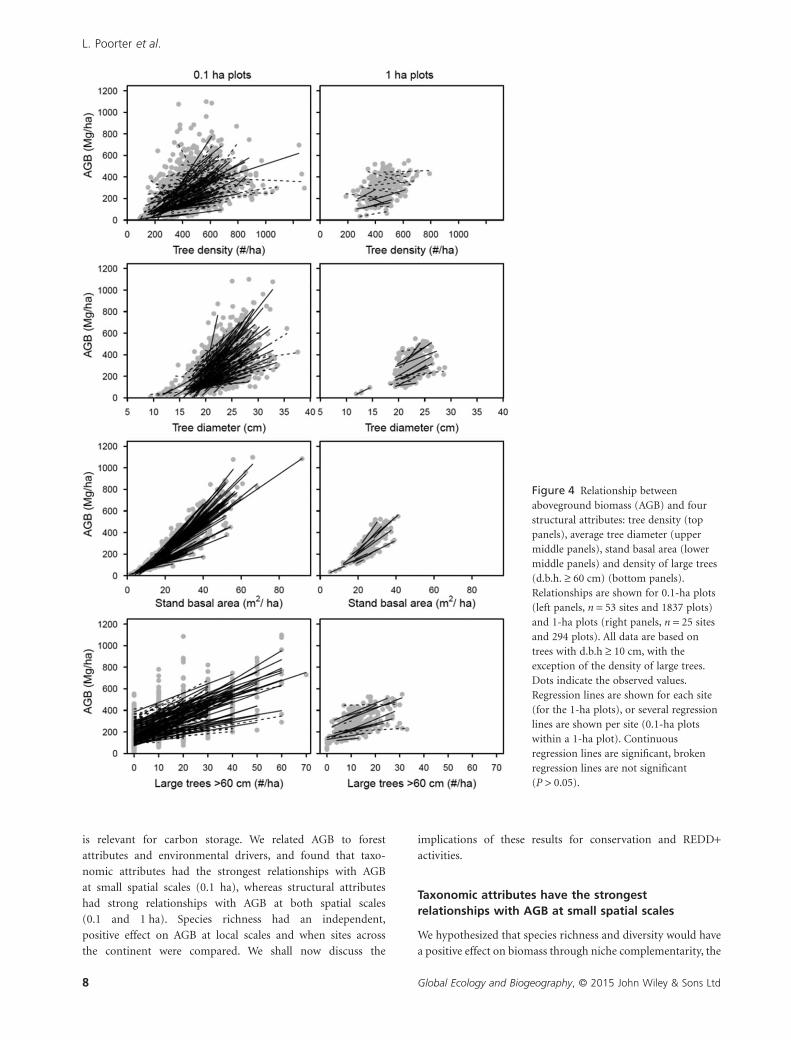
(Fig. 3). Within each study site, AGB increased consistently with
average tree diameter, stand basal area and large tree density of
the plots, for both 0.1- and 1-ha spatial scales, whereas tree
density was only significant at the 0.1-ha scale (Fig. 4). The
relationship was especially strong between AGB and stand basal
area.
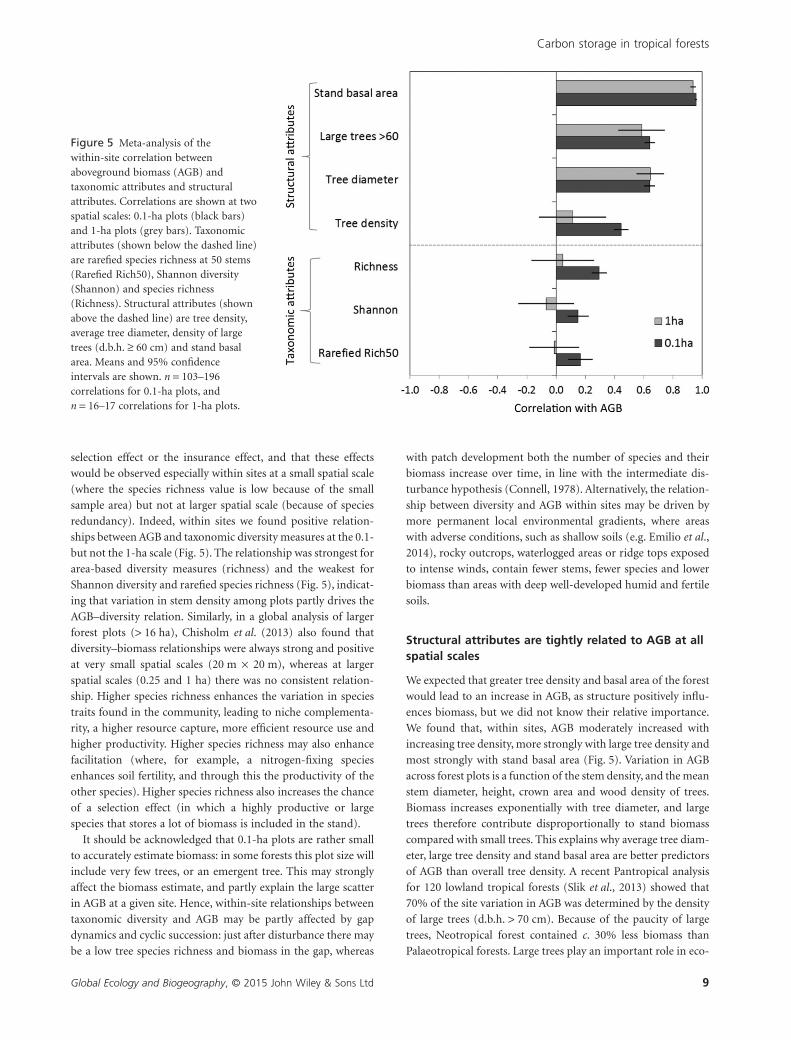
To test the generality of these relationships, we conducted a
meta-analysis on the value of the correlation coefficient
between AGB and each of the predictor variables within each
site (Fig. 5; n = 103–196 correlations for 0.1-ha plots and
n = 16–17 correlations for 1-ha plots) and calculated the mean
correlation and 95% confidence intervals. This meta-analysis
confirmed that, overall, there was a consistent significant posi-
tive relationship between AGB and taxonomic attributes at the
0.1-ha scale (i.e. the 95% confidence interval of the average
correlation coefficient did not overlap with zero), whereas this
relationship disappeared at the 1-ha scale. Not surprisingly,
structural variables such as stand basal area, average tree diam-
eter and the density of large trees are significantly and strongly
positively related to AGB at both 0.1- and 1-ha spatial scales
(Fig. 5). Similar results were found with a mixed linear model
in which site was included as a random factor, to account for
the nestedness of the data (Appendix S4). The strength of this
within-site correlation between AGB and taxonomic diversity/
stem density declined with the amount of annual rainfall at the
site (Appendix S5).
Cross-site relationships between AGB andforest attributes
In addition to testing within sites, we also analysed whether
there were bivariate relationships between AGB and taxonomic
attributes and structural attributes across our 58 Neotropical
forest sites, and thus across large-scale environmental gradients.
For this analysis we selected the best scalable measure of diver-
sity (rarefied richness) and one of the best structural predictors
of AGB (average tree diameter). Rarefied richness varied 2.7-
fold across sites (from 15 to 42 species per 50 stems; Fig. 2b),
average tree diameter varied 2.4-fold (from 13 to 32 cm; Fig. 2c)
and AGB varied 8.1-fold (from 59 to 479 Mg ha−1; Fig. 2a).
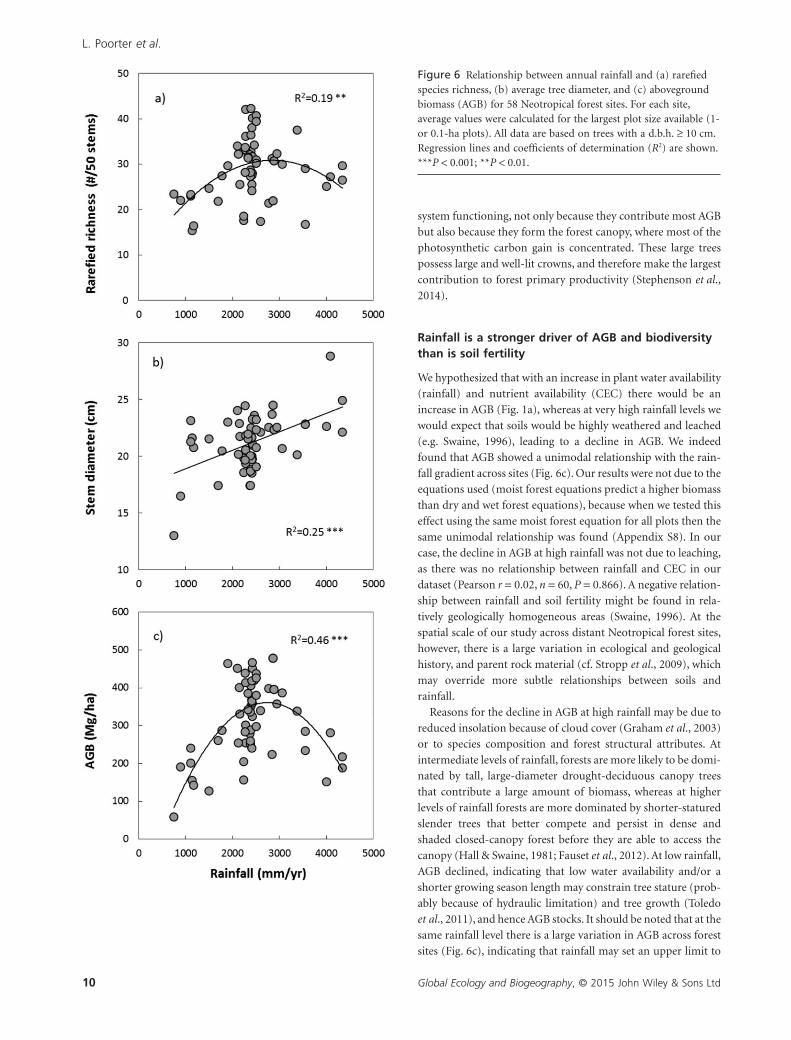
Rarefied richness (Fig. 6a) and AGB (Fig. 6c) showed a
hump-backed relationship with annual rainfall and peaked
halfway along the rainfall gradient, between 2000 and
3000 mm year−1. Average tree diameter increased continuously
with rainfall (Fig. 6b). All three variables tended to decrease with
the CEC of the soil (Appendix 6), although the relationships
were non-significant. AGB was not only related to environmen-
L. Poorter et al.
Global Ecology and Biogeography, © 2015 John Wiley & Sons Ltd6
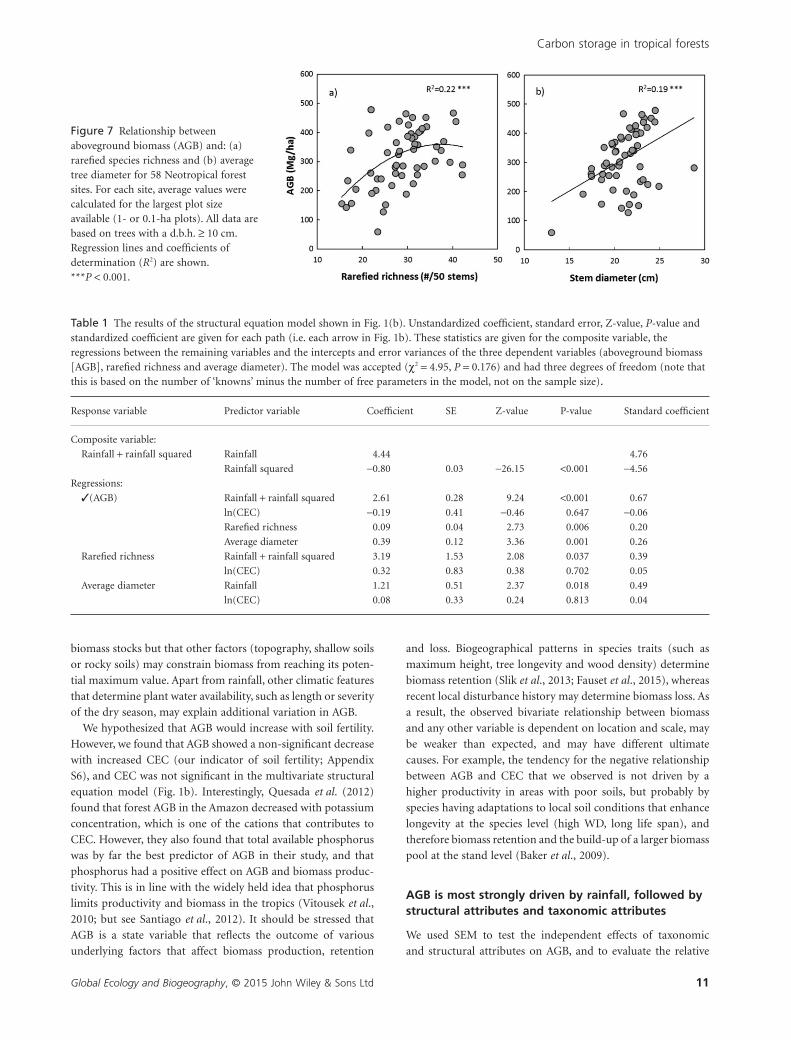
tal variables but also to forest attributes; AGB showed a positive
relationship with rarefied richness (Fig. 7a) and average stem
diameter (Fig. 7b) across sites.
Structural equation modelling; what are the maindrivers of AGB variation?
We used SEM to evaluate our conceptual model (Fig. 1a). Our
SEM included six variables: annual rainfall, annual rainfall
squared, CEC, rarefied species richness, average stem diameter
and AGB. Average stem diameter was selected as the structural
attribute because this was the only accepted model (i.e. it
described the data with sufficient accuracy) with a P-value for
the overall model fit larger than 0.05 (Fig. 1b; χ2 = 4.95, P = 0.
176, d.f. = 3), whereas the models including basal area
(χ2 = 23.10, P < 0.001) or stem density (χ 2 = 11.80, P = 0.008)
were rejected. The accepted model explained 73% of the vari-
ation in AGB, 15% of the variation in rarefied richness and 26%
of the variation in average stem diameter.
The composite variable ‘rainfall + rainfall squared’ had the
strongest direct effect on AGB (β = 0.67, P < 0.001), followed by
average stem diameter (β = 0.26, P = 0.001), rarefied richness
(β = 0.20, P = 0.006) and CEC (β = −0.06, P = 0.647) (Table 1,
Fig. 1b). Rarefied richness was most strongly affected by rain-
fall + rainfall squared (β = 0.39, P = 0.037) and average diameter
was most strongly affected by the linear effect of rainfall
(β = 0.49, P = 0.018). The linear effect of rainfall had, via average
diameter, the strongest indirect effect on AGB (β = 0.129;
Appendix S7).
DISCUSSION
Tropical forests store a significant part of global carbon and
biodiversity, and the question is whether this biodiversity
Figure 3 Relationship betweenaboveground biomass (AGB) and threetaxonomic attributes: species richnessper unit area (top panels), Shannondiversity (middle panels) and rarefiedspecies richness per 50 stems (bottompanels). Relationships are shown for0.1-ha plots (left panels, n = 47–53 sitesand 916–1837 plots) and 1-ha plots(right panels, n = 25 sites and 294 plots).All data are based on trees withd.b.h. ≥ 10 cm. Dots indicate theobserved values. Regression lines areshown for each site (for the 1-ha plots),or several regression lines are shown persite (0.1-ha plots within a 1-ha plot).Continuous regression lines aresignificant, broken regression lines arenot significant (P > 0.05).
Carbon storage in tropical forests
Global Ecology and Biogeography, © 2015 John Wiley & Sons Ltd 7
is relevant for carbon storage. We related AGB to forest
attributes and environmental drivers, and found that taxo-
nomic attributes had the strongest relationships with AGB
at small spatial scales (0.1 ha), whereas structural attributes
had strong relationships with AGB at both spatial scales
(0.1 and 1 ha). Species richness had an independent,
positive effect on AGB at local scales and when sites across
the continent were compared. We shall now discuss the
implications of these results for conservation and REDD+activities.
Taxonomic attributes have the strongestrelationships with AGB at small spatial scales
We hypothesized that species richness and diversity would have
a positive effect on biomass through niche complementarity, the
Figure 4 Relationship betweenaboveground biomass (AGB) and fourstructural attributes: tree density (toppanels), average tree diameter (uppermiddle panels), stand basal area (lowermiddle panels) and density of large trees(d.b.h. ≥ 60 cm) (bottom panels).Relationships are shown for 0.1-ha plots(left panels, n = 53 sites and 1837 plots)and 1-ha plots (right panels, n = 25 sitesand 294 plots). All data are based ontrees with d.b.h ≥ 10 cm, with theexception of the density of large trees.Dots indicate the observed values.Regression lines are shown for each site(for the 1-ha plots), or several regressionlines are shown per site (0.1-ha plotswithin a 1-ha plot). Continuousregression lines are significant, brokenregression lines are not significant(P > 0.05).
L. Poorter et al.
Global Ecology and Biogeography, © 2015 John Wiley & Sons Ltd8
selection effect or the insurance effect, and that these effects
would be observed especially within sites at a small spatial scale
(where the species richness value is low because of the small
sample area) but not at larger spatial scale (because of species
redundancy). Indeed, within sites we found positive relation-
ships between AGB and taxonomic diversity measures at the 0.1-
but not the 1-ha scale (Fig. 5). The relationship was strongest for
area-based diversity measures (richness) and the weakest for
Shannon diversity and rarefied species richness (Fig. 5), indicat-
ing that variation in stem density among plots partly drives the
AGB–diversity relation. Similarly, in a global analysis of larger
forest plots (> 16 ha), Chisholm et al. (2013) also found that
diversity–biomass relationships were always strong and positive
at very small spatial scales (20 m × 20 m), whereas at larger
spatial scales (0.25 and 1 ha) there was no consistent relation-
ship. Higher species richness enhances the variation in species
traits found in the community, leading to niche complementa-
rity, a higher resource capture, more efficient resource use and
higher productivity. Higher species richness may also enhance
facilitation (where, for example, a nitrogen-fixing species
enhances soil fertility, and through this the productivity of the
other species). Higher species richness also increases the chance
of a selection effect (in which a highly productive or large
species that stores a lot of biomass is included in the stand).
It should be acknowledged that 0.1-ha plots are rather small
to accurately estimate biomass: in some forests this plot size will
include very few trees, or an emergent tree. This may strongly
affect the biomass estimate, and partly explain the large scatter
in AGB at a given site. Hence, within-site relationships between
taxonomic diversity and AGB may be partly affected by gap
dynamics and cyclic succession: just after disturbance there may
be a low tree species richness and biomass in the gap, whereas
with patch development both the number of species and their
biomass increase over time, in line with the intermediate dis-
turbance hypothesis (Connell, 1978). Alternatively, the relation-
ship between diversity and AGB within sites may be driven by
more permanent local environmental gradients, where areas
with adverse conditions, such as shallow soils (e.g. Emilio et al.,
2014), rocky outcrops, waterlogged areas or ridge tops exposed
to intense winds, contain fewer stems, fewer species and lower
biomass than areas with deep well-developed humid and fertile
soils.
Structural attributes are tightly related to AGB at allspatial scales
We expected that greater tree density and basal area of the forest
would lead to an increase in AGB, as structure positively influ-
ences biomass, but we did not know their relative importance.
We found that, within sites, AGB moderately increased with
increasing tree density, more strongly with large tree density and
most strongly with stand basal area (Fig. 5). Variation in AGB
across forest plots is a function of the stem density, and the mean
stem diameter, height, crown area and wood density of trees.
Biomass increases exponentially with tree diameter, and large
trees therefore contribute disproportionally to stand biomass
compared with small trees. This explains why average tree diam-
eter, large tree density and stand basal area are better predictors
of AGB than overall tree density. A recent Pantropical analysis
for 120 lowland tropical forests (Slik et al., 2013) showed that
70% of the site variation in AGB was determined by the density
of large trees (d.b.h. > 70 cm). Because of the paucity of large
trees, Neotropical forest contained c. 30% less biomass than
Palaeotropical forests. Large trees play an important role in eco-
Figure 5 Meta-analysis of thewithin-site correlation betweenaboveground biomass (AGB) andtaxonomic attributes and structuralattributes. Correlations are shown at twospatial scales: 0.1-ha plots (black bars)and 1-ha plots (grey bars). Taxonomicattributes (shown below the dashed line)are rarefied species richness at 50 stems(Rarefied Rich50), Shannon diversity(Shannon) and species richness(Richness). Structural attributes (shownabove the dashed line) are tree density,average tree diameter, density of largetrees (d.b.h. ≥ 60 cm) and stand basalarea. Means and 95% confidenceintervals are shown. n = 103–196correlations for 0.1-ha plots, andn = 16–17 correlations for 1-ha plots.
Carbon storage in tropical forests
Global Ecology and Biogeography, © 2015 John Wiley & Sons Ltd 9
system functioning, not only because they contribute most AGB
but also because they form the forest canopy, where most of the
photosynthetic carbon gain is concentrated. These large trees
possess large and well-lit crowns, and therefore make the largest
contribution to forest primary productivity (Stephenson et al.,
2014).
Rainfall is a stronger driver of AGB and biodiversitythan is soil fertility
We hypothesized that with an increase in plant water availability
(rainfall) and nutrient availability (CEC) there would be an
increase in AGB (Fig. 1a), whereas at very high rainfall levels we
would expect that soils would be highly weathered and leached
(e.g. Swaine, 1996), leading to a decline in AGB. We indeed
found that AGB showed a unimodal relationship with the rain-
fall gradient across sites (Fig. 6c). Our results were not due to the
equations used (moist forest equations predict a higher biomass
than dry and wet forest equations), because when we tested this
effect using the same moist forest equation for all plots then the
same unimodal relationship was found (Appendix S8). In our
case, the decline in AGB at high rainfall was not due to leaching,
as there was no relationship between rainfall and CEC in our
dataset (Pearson r = 0.02, n = 60, P = 0.866). A negative relation-
ship between rainfall and soil fertility might be found in rela-
tively geologically homogeneous areas (Swaine, 1996). At the
spatial scale of our study across distant Neotropical forest sites,
however, there is a large variation in ecological and geological
history, and parent rock material (cf. Stropp et al., 2009), which
may override more subtle relationships between soils and
rainfall.
Reasons for the decline in AGB at high rainfall may be due to
reduced insolation because of cloud cover (Graham et al., 2003)
or to species composition and forest structural attributes. At
intermediate levels of rainfall, forests are more likely to be domi-
nated by tall, large-diameter drought-deciduous canopy trees
that contribute a large amount of biomass, whereas at higher
levels of rainfall forests are more dominated by shorter-statured
slender trees that better compete and persist in dense and
shaded closed-canopy forest before they are able to access the
canopy (Hall & Swaine, 1981; Fauset et al., 2012). At low rainfall,
AGB declined, indicating that low water availability and/or a
shorter growing season length may constrain tree stature (prob-
ably because of hydraulic limitation) and tree growth (Toledo
et al., 2011), and hence AGB stocks. It should be noted that at the
same rainfall level there is a large variation in AGB across forest
sites (Fig. 6c), indicating that rainfall may set an upper limit to
Figure 6 Relationship between annual rainfall and (a) rarefiedspecies richness, (b) average tree diameter, and (c) abovegroundbiomass (AGB) for 58 Neotropical forest sites. For each site,average values were calculated for the largest plot size available (1-or 0.1-ha plots). All data are based on trees with a d.b.h. ≥ 10 cm.Regression lines and coefficients of determination (R2) are shown.***P < 0.001; **P < 0.01.
L. Poorter et al.
Global Ecology and Biogeography, © 2015 John Wiley & Sons Ltd10
biomass stocks but that other factors (topography, shallow soils
or rocky soils) may constrain biomass from reaching its poten-
tial maximum value. Apart from rainfall, other climatic features
that determine plant water availability, such as length or severity
of the dry season, may explain additional variation in AGB.
We hypothesized that AGB would increase with soil fertility.
However, we found that AGB showed a non-significant decrease
with increased CEC (our indicator of soil fertility; Appendix
S6), and CEC was not significant in the multivariate structural
equation model (Fig. 1b). Interestingly, Quesada et al. (2012)
found that forest AGB in the Amazon decreased with potassium
concentration, which is one of the cations that contributes to
CEC. However, they also found that total available phosphorus
was by far the best predictor of AGB in their study, and that
phosphorus had a positive effect on AGB and biomass produc-
tivity. This is in line with the widely held idea that phosphorus
limits productivity and biomass in the tropics (Vitousek et al.,
2010; but see Santiago et al., 2012). It should be stressed that
AGB is a state variable that reflects the outcome of various
underlying factors that affect biomass production, retention
and loss. Biogeographical patterns in species traits (such as
maximum height, tree longevity and wood density) determine
biomass retention (Slik et al., 2013; Fauset et al., 2015), whereas
recent local disturbance history may determine biomass loss. As
a result, the observed bivariate relationship between biomass
and any other variable is dependent on location and scale, may
be weaker than expected, and may have different ultimate
causes. For example, the tendency for the negative relationship
between AGB and CEC that we observed is not driven by a
higher productivity in areas with poor soils, but probably by
species having adaptations to local soil conditions that enhance
longevity at the species level (high WD, long life span), and
therefore biomass retention and the build-up of a larger biomass
pool at the stand level (Baker et al., 2009).
AGB is most strongly driven by rainfall, followed bystructural attributes and taxonomic attributes
We used SEM to test the independent effects of taxonomic
and structural attributes on AGB, and to evaluate the relative
Figure 7 Relationship betweenaboveground biomass (AGB) and: (a)rarefied species richness and (b) averagetree diameter for 58 Neotropical forestsites. For each site, average values werecalculated for the largest plot sizeavailable (1- or 0.1-ha plots). All data arebased on trees with a d.b.h. ≥ 10 cm.Regression lines and coefficients ofdetermination (R2) are shown.***P < 0.001.
Table 1 The results of the structural equation model shown in Fig. 1(b). Unstandardized coefficient, standard error, Z-value, P-value andstandardized coefficient are given for each path (i.e. each arrow in Fig. 1b). These statistics are given for the composite variable, theregressions between the remaining variables and the intercepts and error variances of the three dependent variables (aboveground biomass[AGB], rarefied richness and average diameter). The model was accepted (χ2 = 4.95, P = 0.176) and had three degrees of freedom (note thatthis is based on the number of ‘knowns’ minus the number of free parameters in the model, not on the sample size).
Response variable Predictor variable Coefficient SE Z-value P-value Standard coefficient
Composite variable:
Rainfall + rainfall squared Rainfall 4.44 4.76
Rainfall squared −0.80 0.03 −26.15 <0.001 −4.56
Regressions:
✓(AGB) Rainfall + rainfall squared 2.61 0.28 9.24 <0.001 0.67
ln(CEC) −0.19 0.41 −0.46 0.647 −0.06
Rarefied richness 0.09 0.04 2.73 0.006 0.20
Average diameter 0.39 0.12 3.36 0.001 0.26
Rarefied richness Rainfall + rainfall squared 3.19 1.53 2.08 0.037 0.39
ln(CEC) 0.32 0.83 0.38 0.702 0.05
Average diameter Rainfall 1.21 0.51 2.37 0.018 0.49
ln(CEC) 0.08 0.33 0.24 0.813 0.04
Carbon storage in tropical forests
Global Ecology and Biogeography, © 2015 John Wiley & Sons Ltd 11
importance of biotic and environmental drivers of variation in
AGB across sites. Standardized path coefficients indicate that
AGB is most strongly driven by the direct and indirect effects of
rainfall (Table 1, Appendix S7, Fig. 1b), followed by average stem
diameter and rarefied richness, whereas CEC had a negligible
effect (Fig. 1b).
At this continental scale, rainfall was a much stronger driver
of AGB than our indicator of soil fertility (CEC). It should be
stressed that this may partly be the result of methodological
constraints; we did not use data on soil conditions at each site
and for each plot, but instead used a global soil database to infer
soil fertility and we did not consider other nutrients, such as
phosphorus. Yet, it may also indicate that rainfall constrains
productivity and AGB at large spatial scales, whereas soil fertility
may become more important at regional (Quesada et al., 2012)
and local scales (Laurance et al., 1999).
Rarefied species richness has a clear, independent and positive
effect on AGB at this continental scale, once other structural and
environmental drivers have been taken into account. To our
knowledge, this is the first large-scale study to analyse the mul-
tivariate relationships between AGB and its drivers (environ-
ment and forest attributes) and to demonstrate that biodiversity
has an independent positive effect on the AGB of highly diverse
tropical forests. Most empirical studies that have examined the
effects of biodiversity on forest AGB or productivity have
ignored the effect of forest structure (e.g. Gamfeldt et al., 2013),
the environment (Cavanaugh et al., 2014) or both (Chisholm
et al., 2013). Baruffol et al. (2013) showed for a single subtropi-
cal forest site that during succession diversity had an independ-
ent, positive effect on plot basal area growth. Our study shows
that the findings from experimental studies, temperate grass-
lands and relatively simple temperate forests that biodiversity
matters for ecosystem functioning can therefore also be
extended to structurally complex and hyperdiverse tropical
forests that contain as many as 15–42 species per 50 stems
(Appendix S1).
We used a SEM approach to control as well as possible for
other potentially confounding factors, but correlation does not
necessarily mean causation. Controlled experiments (e.g.
Hector et al., 2011) and modelling studies (e.g. Sakschewski
et al., 2015) are needed to provide further support for a causal
relationship between biodiversity and carbon storage in the
tropics. Our study shows that the biodiversity effect is suffi-
ciently strong to be picked up in the real world, and to be
ecologically relevant.
Implications for carbon storage and REDD+
We have shown that AGB is related to the environment as well as
to structure and diversity of the forest, and these results have
three important implications for carbon storage in tropical
forest and the REDD+ programme.
First, our results show that rainfall is the most important
driver of AGB, and that AGB peaks in the middle of the rainfall
gradient. If AGB also scales closely with belowground biomass
then this result implies that, in terms of carbon storage, poten-
tial gains from REDD programmes are highest in tropical moist
forests as these forests occur at intermediate rainfall and store
the largest amount of biomass (Fig. 2). So for REDD+, forest
conservation, restoration or reforestation could best be concen-
trated in these areas. The hump-backed relationship between
AGB and rainfall means that any decrease in rainfall will have
different repercussions for long-term carbon storage in wet and
dry forests. In currently wet forests, a decline in rainfall may lead
in the long term to higher AGB (e.g. Fauset et al., 2012), whereas
in currently moist and dry forest it may lead to lower AGB.
Second, structural attributes are amongst the best predictors
of AGB, and they are tightly related to AGB at all spatial scales
assessed – from small spatial scales (Fig. 4) up to large spatial
scales across the continent (Figs 1b & 7). Structural attributes
have the advantage that they can easily be measured in the field
by local communities or assessed using remote sensing tech-
niques. By using remote sensing techniques one can easily scale
up field data and produce spatially continuous AGB information
over large areas (Baccini et al., 2012), thus providing a better
assessment of global carbon storage, deforestation and forest
degradation, and providing benchmark maps for REDD+ moni-
toring, reporting and verification activities. Although remote
sensing maps hold great promise, they may fail to capture
regional gradients in biomass that are driven by other forest
attributes, such as forest height and wood density (Mitchard
et al., 2014). By linking field data to structural indices derived
from remote sensing, one may map and detect large-scale pat-
terns in AGB while maintaining local realism.
A third implication for REDD+ is that areas with high diver-
sity also tend to have a high biomass (Fig. 7a), indicating that
areas with a high carbon storage potential also have a high
conservation potential. Moreover, species richness has an inde-
pendent and positive effect on AGB (Fig. 1b). Species richness
may also buffer ecosystem productivity against environmental
change (Isbell et al., 2011), and enhance the ecosystem’s resili-
ence to disturbance (Diaz et al., 2009). We found that rarefied
species richness had a direct effect on forest biomass, despite the
very large number of species found in these hyperdiverse tropi-
cal forests. The fact that in this study diversity co-determines
forest functioning indicates that the conservation of biodiversity
should not be considered as a simple co-benefit of REDD+ (Diaz
et al., 2009), but as an integral and crucial component of all
REDD activities.
CONCLUDING REMARKS
To our knowledge, this is the first study to show the relative
importance of environmental conditions and structural and
taxonomic attributes for the amount of AGB of highly diverse
tropical forests across large spatial scales. AGB is mainly driven
by rainfall, followed by structure and species richness. Species
richness has an independent positive effect on AGB. From the
perspective of REDD+, biodiversity conservation is therefore
not only a goal in itself but will also help to increase carbon
storage. Hence, conserving biodiversity is a win–win strategy
because biodiversity is crucial for forest functioning.
L. Poorter et al.
Global Ecology and Biogeography, © 2015 John Wiley & Sons Ltd12
ACKNOWLEDGEMENTS
We are grateful to all the people who have established and meas-
ured the plots, and the institutions and funding agencies that
supported them (e.g. CONACyT, the Darwin Initiative). This
study was partly funded by European Union’s Seventh Frame-
work Programme ([FP7/2007–13]) under grant agreement no
283093; Role Of Biodiversity In climate change mitigatioN
(ROBIN). We thank Nick Brokaw, Rick Condit, Robin Foster,
Steve Hubbell, Joe Wright and Jess Zimmerman for kindly
allowing us to use their (plot) data, Joe Wright and two anony-
mous referees for their very helpful comments on the manu-
script, and James Grace and Daniel Laughlin for their helpful
advice on the SEM analysis. The Chamela plot was supported
by the ReserBos project (SEP-CONACyT/2009-129740). The
Luquillo forest dynamics plot was supported by Luquillo Long
Term Ecological Research program (LTER), USA National
Science Foundation and others. The San Emilio plot was sup-
ported by an NSF CAREER and a Fulbright Fellowship award to
BJE. The BCI 50-ha plot was organized by S. P. Hubbell, R. B.
Foster, R. Condit, S. Lao and R. Perez under the Center for
Tropical Forest Science and the Smithsonian Tropical Research
in Panama. Numerous organizations have provided funding,
principally the US National Science Foundation, and hundreds
of field workers have contributed.
REFERENCES
Baccini, A., Goetz, S.J., Walker, W.S., Laporte, N.T., Sun, M.,
Sulla-Menashe, D., Hackler, J., Beck, P.S.A., Dubayah, R.,
Friedl, M.A., Samanta, S. & Houghton, R.A. (2012) Estimated
carbon dioxide emissions from tropical deforestation
improved by carbon-density maps. Nature Climate Change, 2,
182–185.
Baker, T.R., Phillips, O.L., Laurance, W.F. et al. (2009) Do species
traits determine patterns of wood production in Amazonian
forests? Biogeosciences, 6, 297–307.
Baraloto, C., Rabaud, S., Molto, Q., Blanc, L., Fortunel, C.,
Hérault, B., Dávila, N., Mesones, I., Rios, M., Valderrama, E. &
Fine, P.V.A. (2011) Disentangling stand and environmental
correlates of aboveground biomass in Amazonian forests.
Global Change Biology, 17, 2677–2688.
Baruffol, M., Schmid, B., Bruelheide, H., Chi, X., Hector, A., Ma,
K., Michalski, S., Tang, Z. & Niklaus, P.A. (2013) Biodiversity
promotes tree growth during succession in subtropical forest.
PLoS ONE, 8, e81246.
Beer, C., Reichstein, M., Tomelleri, E. et al. (2010) Terrestrial
gross carbon dioxide uptake: global distribution and
covariation with climate. Science, 329, 834–838.
Bonan, G.B. (2008) Forests and climate change: forcings, feed-
backs, and the climate benefits of forests. Science, 320, 1444–
1449.
Cardinale, B.J., Matulich, K.L., Hooper, D.U., Byrnes, J.E., Duffy,
E., Gamfeldt, L., Balvanera, P., O’Connor, M.I. & Gonzalez, A.
(2011) The functional role of producer diversity in ecosys-
tems. American Journal of Botany, 98, 572–592.
Cavanaugh, K.C., Gosnell, J.S., Davis, S.L., Ahumada, J.,
Boundja, P., Clark, D.B., Mugerwa, B., Jansen, P.A., O’Brien,
T.G., Rovero, F., Sheil, D., Vasquez, R. & Andelman, S. (2014)
Carbon storage in tropical forests correlates with taxonomic
diversity and functional dominance on a global scale. Global
Ecology and Biogeography, 23, 563–573.
Chave, J., Andalo, C., Brown, S., Cairns, M.A., Chambers, J.Q.,
Eames, D., Folster, H., Formard, F., Higuchi, N., Kira, T.,
Lescure, J.P., Nelson, B.W., Ogawa, H., Puig, H., Riera, B. &
Yamakura, T. (2005) Tree allometry and improved estimation
of carbon stocks and balance in tropical forests. Oecologia,
145, 87–99.
Chisholm, R.A., Muller-Landau, H.C., Abdul Rahman, K. et al.
(2013) Scale-dependent relationships between tree species
richness and ecosystem function in forests. Journal of Ecology,
101, 1214–1224.
Colwell, R.K. (2011) Estimates: statistical estimation of species
richness and shared species from samples. Version 9. 2011.
User’s guide and application Available at: http://purl.oclc.org/
estimates (accessed 21 November 2013).
Connell, J.H. (1978) Diversity in tropical rain forests and coral
reefs. Science, 199, 1302–1310.
Diaz, S., Hector, A. & Wardle, D.A. (2009) Biodiversity in
forest carbon sequestration initiatives: not just a side
benefit. Current Opinion in Environmental Sustainability, 1,
55–60.
Emilio, T., Quesada, C.A., Costa, F.R., Magnusson, W.E., Schietti,
J., Feldpausch, T.R., Brienen, R.J., Baker, T.R., Chave, J. &
Álvarez, E. (2014) Soil physical conditions limit palm and tree
basal area in Amazonian forests. Plant Ecology and Diversity, 7,
215–229.
Fauset, S., Baker, T.R., Lewis, S.L., Feldpausch, T.R.,
Affum-Baffoe, K., Foli, E.G., Hamer, K.C. & Swaine, M.D.
(2012) Drought-induced shifts in the floristic and functional
composition of tropical forests in Ghana. Ecology Letters, 15,
1120–1129.
Fauset, S., Johnson, M.O., Gloor, M. et al. (2015)
Hyperdominance in Amazonian forest carbon cycling. Nature
Communications, 6, art. no. 6857.
Fine, P.V.A., Ree, R.H. & Burnham, R.J. (2008) The disparity in
tree species richness among tropical, temperate, and boreal
biomes: the geographical area and age hypothesis. Tropical
forest community ecology (ed. by R.P. Carson and S.A.
Schnitzer), pp. 31–45. Blackwell, Oxford.
Gamfeldt, L., Snäll, T., Bagchi, R., Jonsson, M., Gustafsson, L.,
Kjellander, P., Ruiz-Jaen, M.C., Fröberg, M., Stendahl, J.,
Philipson, C.D., Mikusinski, G., Andersson, E., Westerlund, B.,
Andrén, H., Moberg, F., Moen, J. & Bengtsson, J. (2013)
Higher levels of multiple ecosystem services are found in
forests with more tree species. Nature Communications, 4, art.
no. 1340.
Graham, A.E., Mulkey, S.S., Kitajima, K., Phillips, N.G. &
Wright, S.J. (2003) Cloud cover limits net CO2 uptake and
growth of a rainforest tree during tropical rainy seasons. Pro-
ceedings of the National Academy of Sciences USA, 100, 572–
576.
Carbon storage in tropical forests
Global Ecology and Biogeography, © 2015 John Wiley & Sons Ltd 13
Hall, J.B. & Swaine, M.D. (1981) Distribution and ecology of
vascular plants in tropical rainforest: forest vegetation in Ghana.
Dr W. Junk Publishers, The Hague, The Netherlands.
Hansen, M.C., DeFries, R.S., Townshend, J.R.G., Carroll, M. &
Dimiceli, C. (2003) Global percent tree cover at a spatial reso-
lution of 500 meters: first results of the MODIS vegetation
continuous fields algorithm. Earth Interactions, 7, 1–15.
Hector, A., Philipson, C., Saner, P., Chamagne, J., Dzulkifli, D.,
O’Brien, M., Snaddon, J.L., Ulok, P., Weilenmann, M.,
Reynolds, G. & Godfray, H.C.J. (2011) The Sabah Biodiversity
Experiment: a long-term test of the role of tree diversity in
restoring tropical forest structure and functioning. Philosophi-
cal Transactions of the Royal Society B: Biological Sciences, 366,
3303–3315.
Hijmans, R.J., Cameron, S.E., Parra, J.L., Jones, P.G. & Jarvis, A.
(2005) Very high resolution interpolated climate surfaces for
global land areas. International Journal of Climatology, 25,
1965–1978.
Isbell, F., Calcagno, V., Hector, A., Connolly, J., Harpole, W.S.,
Reich, P.B., Scherer-Lorenzen, M., Schmid, B., Tilman, D., van
Ruiven, J., Weigelt, A., Wilsey, B.J., Zavaleta, E.S. & Loreau, M.
(2011) High plant diversity is needed to maintain ecosystem
services. Nature, 477, 199–202.
Laurance, W.F., Fearnside, P.M., Laurance, S.G., Delamonica, P.,
Lovejoy, T.E., Rankin-de Merona, J.M., Chambers, J.Q. &
Gascon, C. (1999) Relationship between soils and Amazon
forest biomass: a landscape-scale study. Forest Ecology and
Management, 118, 127–138.
Lohbeck, M., Poorter, L., Martínez-Ramos, M. & Bongers, F.
(2015) Biomass is the main driver of changes in ecosystem
process rates during tropical forest succession. Ecology, 96,
1242–1252.
Loreau, M. & Hector, A. (2001) Partitioning selection and com-
plementarity in biodiversity experiments. Nature, 412, 72–76.
Malhi, Y., Baker, T.R., Phillips, O.L. et al. (2004) The above-
ground coarse wood productivity of 104 Neotropical forest
plots. Global Change Biology, 10, 563–591.
Mitchard, E.T.A., Feldpausch, T.R., Brienen, R.J.W. et al. (2014)
Markedly divergent estimates of Amazon forest carbon
density from ground plots and satellites. Global Ecology and
Biogeography, 23, 935–946.
Nachtergaele, F., van Velthuizen, H., Verelst, L. & Wiberg, D.
(2012) Harmonized world soil database version 1.2. FAO, Rome
and IIASA, Laxenburg, Austria.
Naeem, S., Bunker, D.E., Hector, A., Loreau, M. & Perrings, C.
(2009) Biodiversity, ecosystem functioning, and human well-
being. An ecological and economic perspective. Oxford Univer-
sity Press, Oxford.
Oksanen, J., Blanchet, F.G., Kindt, R., Legendre, P., Minchin, R.,
O’Hara, R.B., Simpson, G.L., Solymos, P., Stevens, M.H.H. &
Wagner, H. (2014) Package vegan: Community ecology
package. R package version 2.2-0. Available at: http://cran.r-
project.org/web/packages/vegan/ (accessed 14 January 2014).
Paquette, A. & Messier, C. (2011) The effect of biodiversity on
tree productivity: from temperate to boreal forests. Global
Ecology and Biogeography, 20, 170–180.
Pearson, R., Walker, S. & Brown, S. (2005) Source book for
land use, land-use change and forestry projects. World Bank,
Washington, DC.
Quesada, C.A., Phillips, O.L., Schwarz, M. et al. (2012) Basin-
wide variations in Amazon forest structure and function
are mediated by both soils and climate. Biogeosciences, 9,
2203–2246.
Rosseel, Y. (2012) lavaan: an R package for structural equation
modeling. Journal of Statistical Software, 48, 1–36.
Sakschewski, B., von Bloh, W., Boit, A., Rammig, A., Kattge, J.,
Poorter, L., Peñualeas, J. & Thonicke, K. (2015) Leaf and stem
economics spectra drive diversity of functional plant traits in
a dynamic global vegetation model. Global Change Biology, 21,
2711–2725.
Santiago, L.S., Wright, S.J., Harms, K.E., Yavitt, J.B., Korine, C.,
Garcia, M.N. & Turner, B.L. (2012) Tropical tree seedling
growth responses to nitrogen, phosphorus and potassium
addition. Journal of Ecology, 100, 309–316.
Slik, J.W.F., Paoli, G., McGuire, K. et al. (2013) Large trees drive
forest aboveground biomass variation in moist lowland
forests across the tropics. Global Ecology and Biogeography, 22,
1261–1271.
Stephenson, N.L., Das, A.J., Condit, R. et al. (2014) Rate of tree
carbon accumulation increases continuously with tree size.
Nature, 507, 90–93.
Stropp, J., Ter Steege, H. & Malhi, Y. (2009) Disentangling
regional and local tree diversity in the Amazon. Ecography, 32,
46–54.
Swaine, M.D. (1996) Rainfall and soil fertility as factors limiting
forest species distributions in Ghana. Journal of Ecology, 84,
419–428.
Ter Steege, H., Pitman, N., Sabatier, D. et al. (2003) A spatial
model of tree α-diversity and tree density for the Amazon.
Biodiversity and Conservation, 12, 2255–2277.
Tilman, D., Reich, P.B., Knops, J., Wedin, D., Mielke, T. &
Lechman, C. (2001) Diversity and productivity in a long-term
grassland experiment. Science, 294, 843–845.
Toledo, M., Poorter, L., Peña-Claros, M., Alarcón, A., Balcázar, J.,
Leaño, C., Licona, J.C., Llanque, O., Vroomans, V., Zuidema, P.
& Bongers, F. (2011) Climate is a stronger driver of tree and
forest growth rates than soil and disturbance. Journal of
Ecology, 99, 254–264.
Vilà, M., Carillo-Gavilán, A., Vayreda, J., Bugmann, H., Fridman,
J., Grodzki, W., Haase, J., Kunstler, G., Schelhaas, M.J. &
Trasobares, A. (2013) Disentangling biodiversity and climatic
determinants of wood production. PLOSone, 8, e53530.
Vitousek, P.M., Porder, S., Houlton, B.Z. & Chadwick, O.A.
(2010) Terrestrial phosphorus limitation: mechanisms, impli-
cations, and nitrogen–phosphorus interactions. Ecological
Applications, 20, 5–15.
Yachi, S. & Loreau, M. (1999) Biodiversity and ecosystem prod-
uctivity in a fluctuating environment: the insurance hypoth-
esis. Proceedings of the National Academy of Sciences USA, 96,
1463–1468.
Zanne, A.E., Lopez-Gonzalez, G., Coomes, D.A., Ilic, J., Jansen,
S., Lewis, S.L., Miller, R.B., Swenson, N.G., Wiemann, M.C. &
L. Poorter et al.
Global Ecology and Biogeography, © 2015 John Wiley & Sons Ltd14
Chave, J. (2009) Data from: towards a worldwide wood eco-
nomics spectrum. Dryad Digital Repository. Available at:
http://dx.doi.org/10.5061/dryad.234 (accessed 21 November
2013).
Zhang, Y., Chen, H.Y.H. & Reich, P.B. (2012) Forest productivity
increases with evenness, species richness and trait variation: a
global meta-analysis. Journal of Ecology, 100, 742–749.
SUPPORTING INFORMATION
Additional supporting information may be found in the online
version of this article at the publisher s web-site.
Appendix S1 Overview of sites included in the study.
Appendix S2 Extended methods.
Appendix S3 Aboveground plot biomass estimates using the
Chave and Brown equations and using different diameter cut-
off limits.
Appendix S4 Mixed linear model results of the relationship
between aboveground biomass and taxonomical and structural
forest attributes at the 0.1- and 1-ha level.
Appendix S5 Strength of the relation between aboveground
biomass, species richness and stem density versus annual rainfall
of the sites.
Appendix S6 Relationship between cation exchange capacity
and rarefied richness, average stem diameter and aboveground
biomass.
Appendix S7 Standardized coefficients of the indirect paths in
the structural equation model.
Appendix S8 Relationship between average aboveground
biomass at a site and annual rainfall.
BIOSKETCH
This data analysis was carried out as a collaborative
research effort amongst people involved in the
EU-funded ROBIN project (the ROle of Biodiversity In
climate change mitigatioN) and other forest researchers
with an interest in the diversity and dynamics of tropi-
cal forests. We hope that such a large-scale comparative
approach provides a better insight into the functioning
of these forests.
Editor: Thomas Hickler
Carbon storage in tropical forests
Global Ecology and Biogeography, © 2015 John Wiley & Sons Ltd 15