Embed Size (px)
Citation preview

Consequences of induced brassinosteroid deficiency in Arabidopsis leaves
Florian Schröder, Janina Lisso, Toshihiro Obata, Alexander Erban, Eugenia Maximova, Patrick
Giavalisco, Joachim Kopka, Alisdair R. Fernie, Lothar Willmitzer, Carsten Müssig

Figure S1. Growth parameters of rosette leaves five and six of CPD-antisense and cbb1 plants.
Leaves were analyzed as described in Figure 2 and Figure 5. Data are given as mean ± SE.
20 leaves were analysed per point in time. Values denoted with an asterisk are significantly
different from their control (t test, P < 0.05). A, Leaf length. B, Leaf width. C, Leaf thickness.
D, Area of palisade cells. E, Area of spongy parenchyma cells. F, Number of palisade cells
per leaf. G, Number of spongy parenchyma cells per leaf. H, Number of epidermis cells per
leaf.
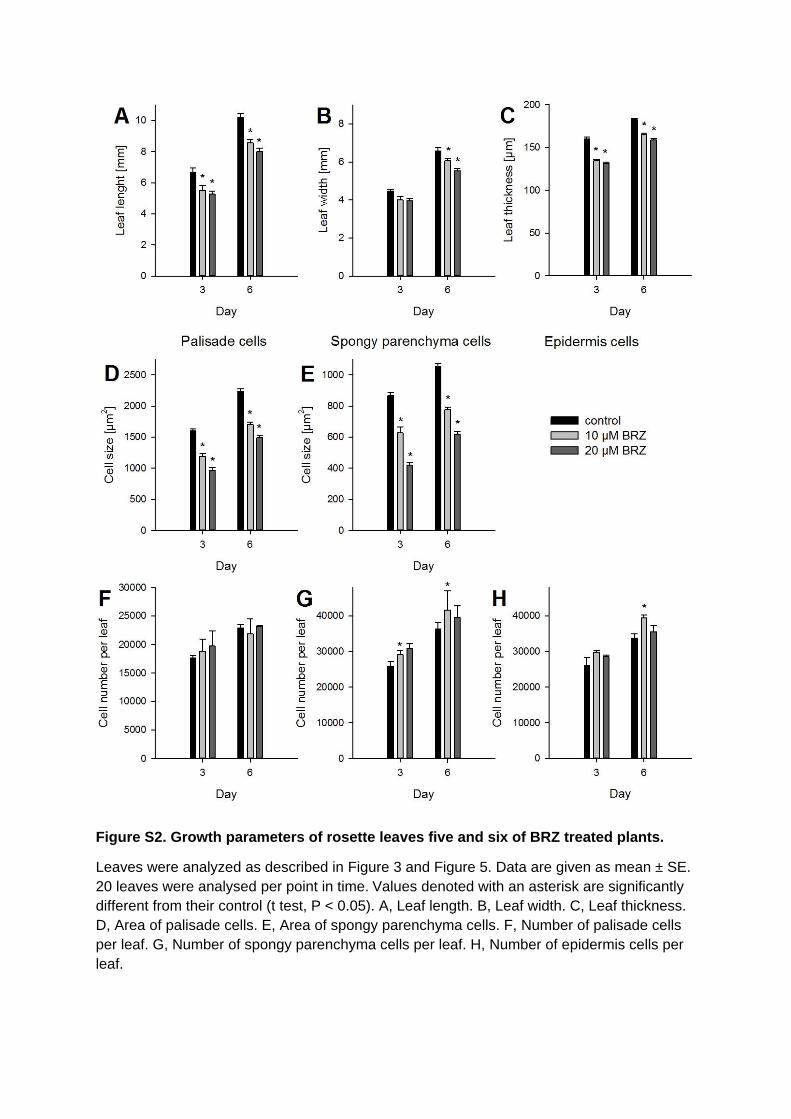
Figure S2. Growth parameters of rosette leaves five and six of BRZ treated plants.
Leaves were analyzed as described in Figure 3 and Figure 5. Data are given as mean ± SE.
20 leaves were analysed per point in time. Values denoted with an asterisk are significantly
different from their control (t test, P < 0.05). A, Leaf length. B, Leaf width. C, Leaf thickness.
D, Area of palisade cells. E, Area of spongy parenchyma cells. F, Number of palisade cells
per leaf. G, Number of spongy parenchyma cells per leaf. H, Number of epidermis cells per
leaf.
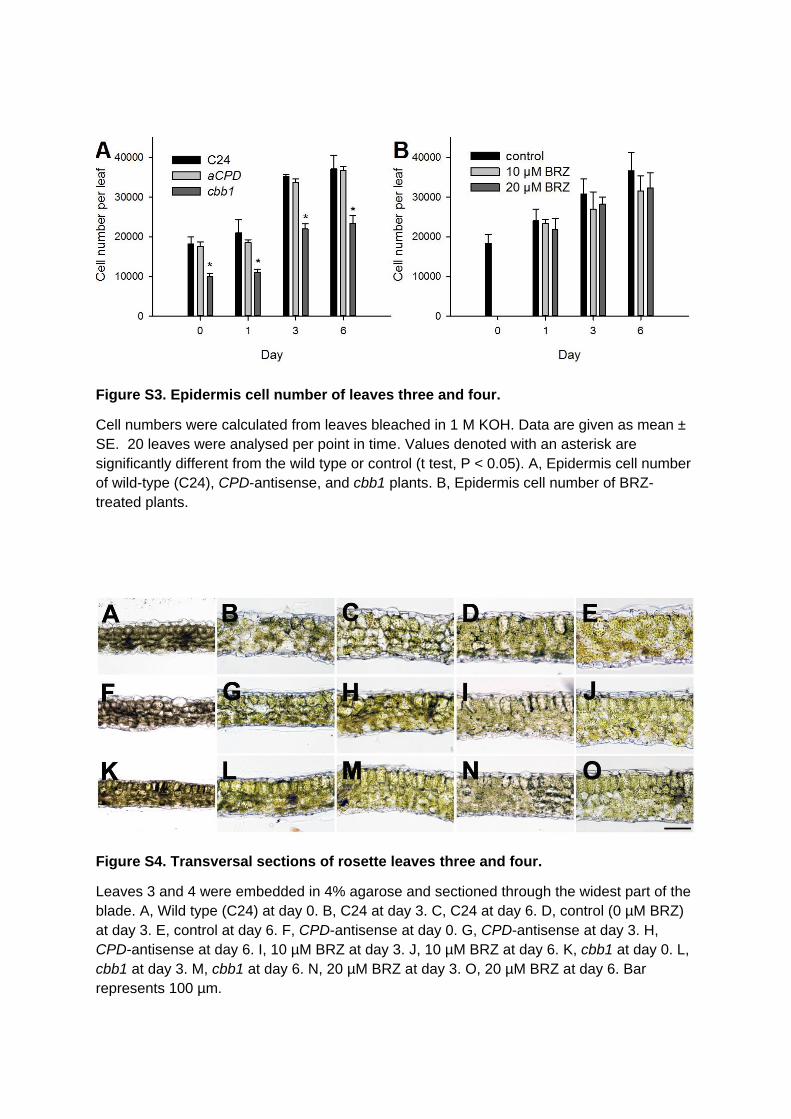
Figure S3. Epidermis cell number of leaves three and four.
Cell numbers were calculated from leaves bleached in 1 M KOH. Data are given as mean ±
SE. 20 leaves were analysed per point in time. Values denoted with an asterisk are
significantly different from the wild type or control (t test, P < 0.05). A, Epidermis cell number
of wild-type (C24), CPD-antisense, and cbb1 plants. B, Epidermis cell number of BRZ-
treated plants.
Figure S4. Transversal sections of rosette leaves three and four.
Leaves 3 and 4 were embedded in 4% agarose and sectioned through the widest part of the
blade. A, Wild type (C24) at day 0. B, C24 at day 3. C, C24 at day 6. D, control (0 µM BRZ)
at day 3. E, control at day 6. F, CPD-antisense at day 0. G, CPD-antisense at day 3. H,
CPD-antisense at day 6. I, 10 µM BRZ at day 3. J, 10 µM BRZ at day 6. K, cbb1 at day 0. L,
cbb1 at day 3. M, cbb1 at day 6. N, 20 µM BRZ at day 3. O, 20 µM BRZ at day 6. Bar
represents 100 µm.
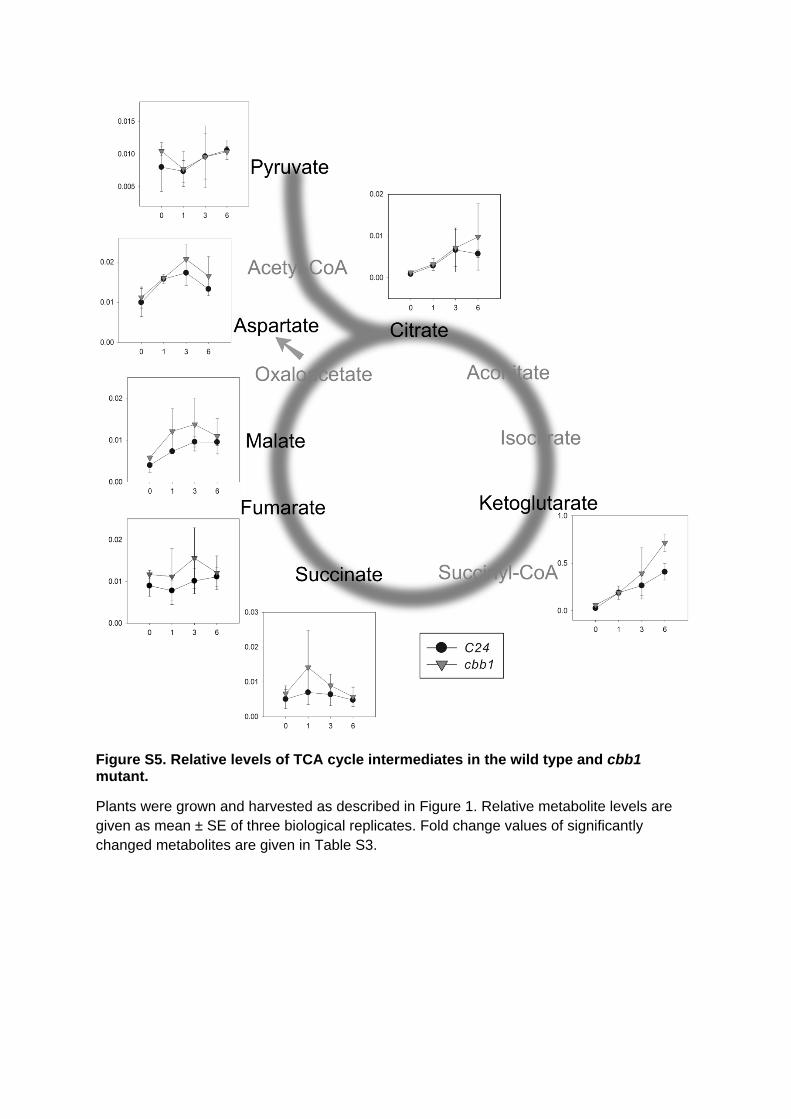
Figure S5. Relative levels of TCA cycle intermediates in the wild type and cbb1 mutant.
Plants were grown and harvested as described in Figure 1. Relative metabolite levels are
given as mean ± SE of three biological replicates. Fold change values of significantly
changed metabolites are given in Table S3.
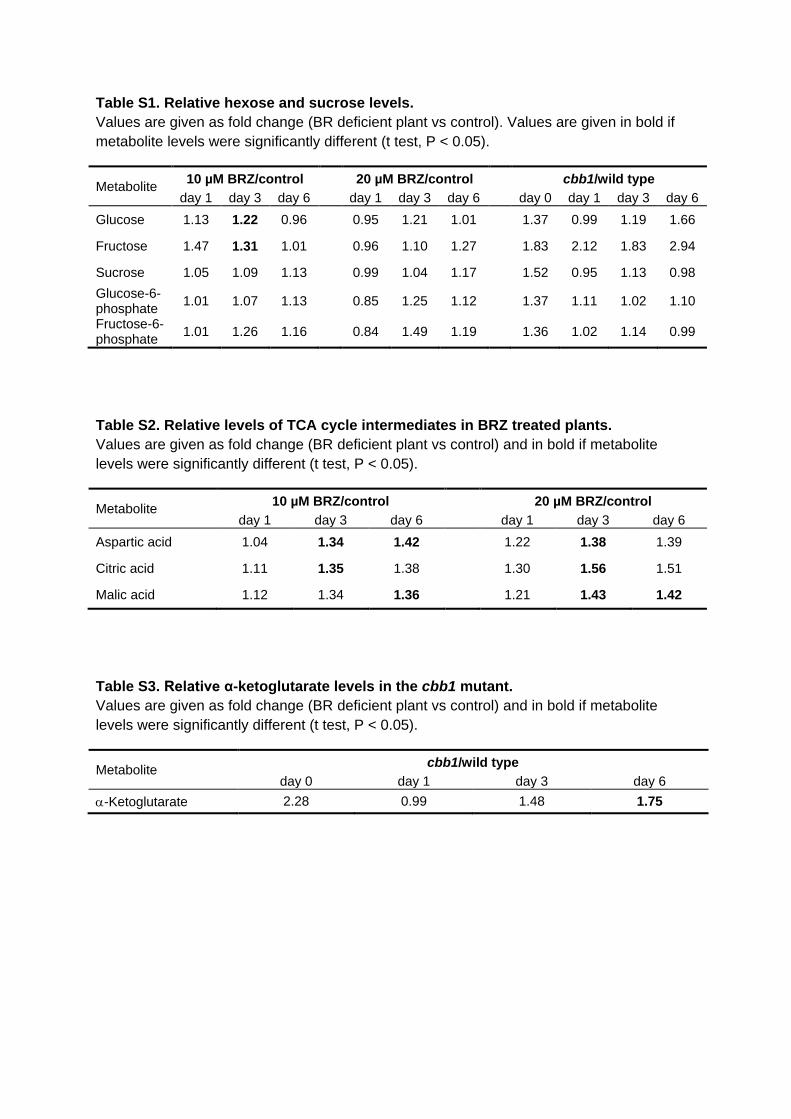
Table S1. Relative hexose and sucrose levels.
Values are given as fold change (BR deficient plant vs control). Values are given in bold if
metabolite levels were significantly different (t test, P < 0.05).
Metabolite 10 µM BRZ/control 20 µM BRZ/control cbb1/wild type
day 1 day 3 day 6 day 1 day 3 day 6 day 0 day 1 day 3 day 6
Glucose 1.13 1.22 0.96 0.95 1.21 1.01 1.37 0.99 1.19 1.66
Fructose 1.47 1.31 1.01 0.96 1.10 1.27 1.83 2.12 1.83 2.94
Sucrose 1.05 1.09 1.13 0.99 1.04 1.17 1.52 0.95 1.13 0.98
Glucose-6-phosphate
1.01 1.07 1.13 0.85 1.25 1.12 1.37 1.11 1.02 1.10
Fructose-6-phosphate
1.01 1.26 1.16 0.84 1.49 1.19 1.36 1.02 1.14 0.99
Table S2. Relative levels of TCA cycle intermediates in BRZ treated plants.
Values are given as fold change (BR deficient plant vs control) and in bold if metabolite
levels were significantly different (t test, P < 0.05).
Metabolite 10 µM BRZ/control 20 µM BRZ/control
day 1 day 3 day 6 day 1 day 3 day 6
Aspartic acid 1.04 1.34 1.42 1.22 1.38 1.39
Citric acid 1.11 1.35 1.38 1.30 1.56 1.51
Malic acid 1.12 1.34 1.36 1.21 1.43 1.42
Table S3. Relative α-ketoglutarate levels in the cbb1 mutant.
Values are given as fold change (BR deficient plant vs control) and in bold if metabolite
levels were significantly different (t test, P < 0.05).
Metabolite cbb1/wild type
day 0 day 1 day 3 day 6
-Ketoglutarate 2.28 0.99 1.48 1.75


![Reactive Oxygen Species Are Involved in Brassinosteroid-Induced … · Reactive Oxygen Species Are Involved in Brassinosteroid-Induced Stress Tolerance in Cucumber1[W] ... Vert and](https://img.pdfslide.us/doc/110x75/60ebd8840c3a8322ad22a20e/reactive-oxygen-species-are-involved-in-brassinosteroid-induced-reactive-oxygen.jpg)