Embed Size (px)
Citation preview
1CONNECTING WITH THE CONSUMER Copyright © 2014 The Nielsen Company
C O N N E C T I N G W I T H T H E C O N S U M E RTHE IMPORTANCE OF INTEGRATING MARKETING PROMISE WITH SERVICE DELIVERY

2 CONNECTING WITH THE CONSUMER
T E L E C O M – W H E R E C H A N G EI S A C O N S TA N TOf all industries, telecom is one of the fastest changing. Product and
service plan dynamics are always in a state of flux with new offerings
appearing on the market daily and redefining what is important to
consumers. By the look of things, these changes will keep on coming!
To stay ahead of competition, telecom companies expend considerable
time, energy and effort in understanding the emerging consumer
needs, desires and usage trends. This is done in an effort to improve
their customer experience strategy and delivery of that strategy, in
tune with customer expectations.
This paper minutely explores the relationship of mobile service
providers with their consumers, and discusses the typical challenges
of defining, measuring, and improving customer experience.
The paper aims to give directional feedback to mobile service
providers and enable them to create competitive differentiation and
simultaneously maintain and even gain market share.
C O N S I D E R AT I O N S F O R S U R V E YD E S I G NWith the above purpose in mind, we designed a quantitative survey
that captured feedback on mobile users’ experience with their telecom
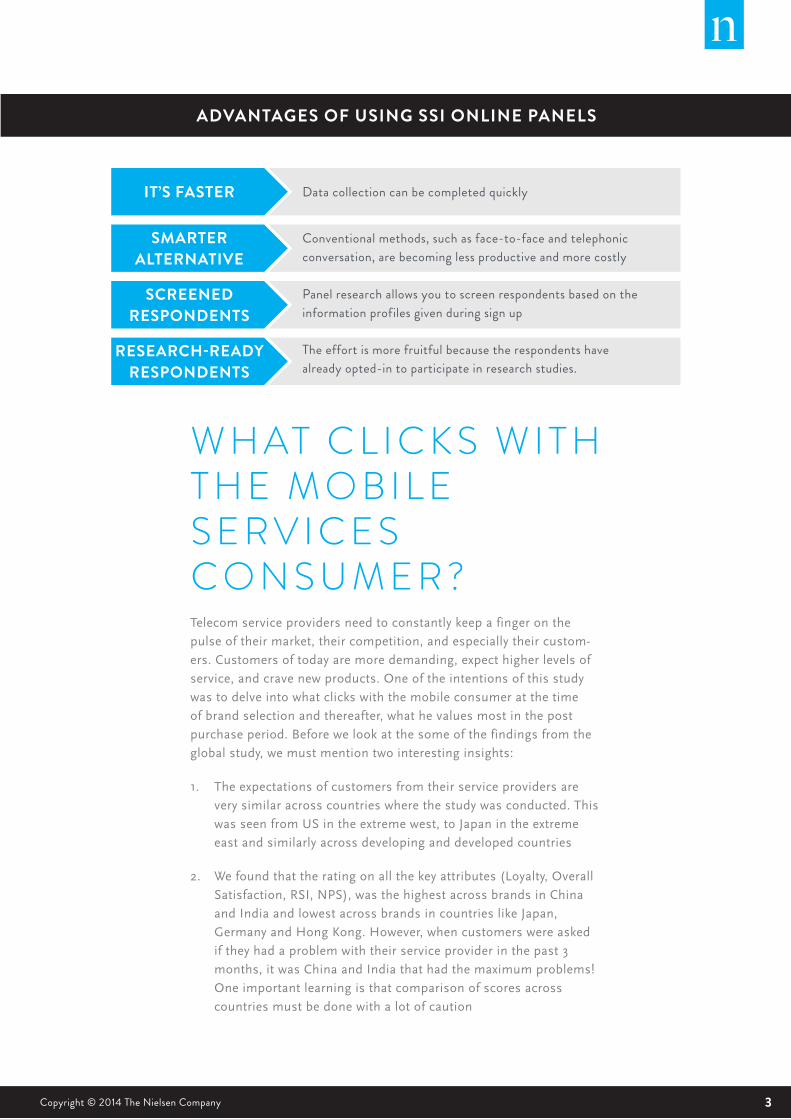
service provider. The survey was conducted online using SSI Panels,
which offer several advantages (detailed in infographic below). The
surveys extended across eleven countries and over 9000 respondents.
Respondents above 18 years, who owned a mobile phone and used
the services of one or more mobile service providers were considered.
As many as 49 mobile service providers were covered with adequate
representation of both pre-paid and post-paid consumers.
3CONNECTING WITH THE CONSUMER Copyright © 2014 The Nielsen Company
W H AT C L I C K S W I T H T H E M O B I L ES E R V I C E SC O N S U M E R ?Telecom service providers need to constantly keep a finger on the
pulse of their market, their competition, and especially their custom-
ers. Customers of today are more demanding, expect higher levels of
service, and crave new products. One of the intentions of this study
was to delve into what clicks with the mobile consumer at the time
of brand selection and thereafter, what he values most in the post
purchase period. Before we look at the some of the findings from the
global study, we must mention two interesting insights:
1. The expectations of customers from their service providers are
very similar across countries where the study was conducted. This
was seen from US in the extreme west, to Japan in the extreme
east and similarly across developing and developed countries
2. We found that the rating on all the key attributes (Loyalty, Overall
Satisfaction, RSI, NPS), was the highest across brands in China
and India and lowest across brands in countries like Japan,
Germany and Hong Kong. However, when customers were asked
if they had a problem with their service provider in the past 3
months, it was China and India that had the maximum problems!
One important learning is that comparison of scores across
countries must be done with a lot of caution
ADVANTAGES OF USING SSI ONLINE PANELS
IT’S FASTER
SMARTER ALTERNATIVE
SCREENED RESPONDENTS
RESEARCH-READY RESPONDENTS
Data collection can be completed quickly
Conventional methods, such as face-to-face and telephonic conversation, are becoming less productive and more costly
Panel research allows you to screen respondents based on the information profiles given during sign up
The effort is more fruitful because the respondents have already opted-in to participate in research studies.
4 CONNECTING WITH THE CONSUMER
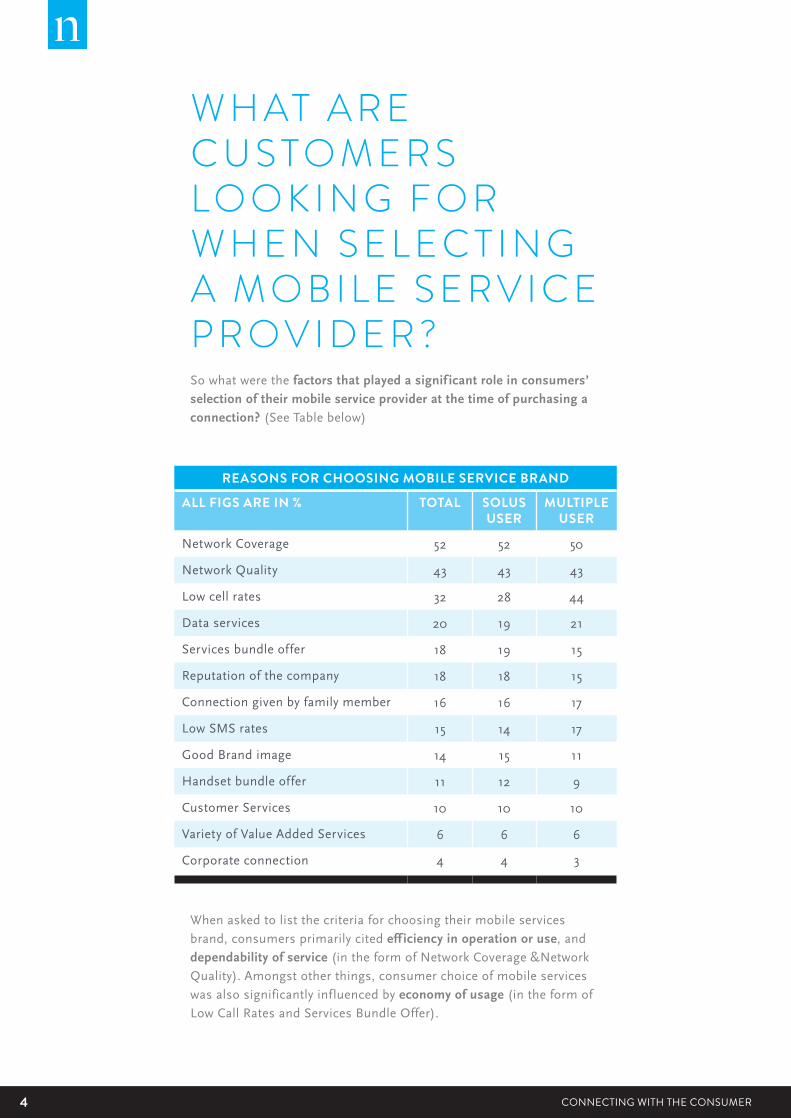
W H AT A R EC U S TO M E R S L O O K I N G F O R W H E N S E L E C T I N G A M O B I L E S E R V I C E P R O V I D E R ?So what were the factors that played a signif icant role in consumers’ selection of their mobile service provider at the time of purchasing a connection? (See Table below)
When asked to list the criteria for choosing their mobile services
brand, consumers primarily cited eff iciency in operation or use, and
dependability of service (in the form of Network Coverage &Network
Quality). Amongst other things, consumer choice of mobile services
was also significantly influenced by economy of usage (in the form of
Low Call Rates and Services Bundle Offer).
REASONS FOR CHOOSING MOBILE SERVICE BRAND
ALL FIGS ARE IN % TOTAL SOLUS USER
MULTIPLE USER
Network Coverage 52 52 50
Network Quality 43 43 43
Low cell rates 32 28 44
Data services 20 19 21
Services bundle offer 18 19 15
Reputation of the company 18 18 15
Connection given by family member 16 16 17
Low SMS rates 15 14 17
Good Brand image 14 15 11
Handset bundle offer 11 12 9
Customer Services 10 10 10
Variety of Value Added Services 6 6 6
Corporate connection 4 4 3

5CONNECTING WITH THE CONSUMER Copyright © 2014 The Nielsen Company
Economy of usage was an even bigger factor for dual users while
choosing multiple service providers.
Other factors that were deal makers in influencing brand choice were
cited to be ‘Good Brand Image’ / ‘Reputation of Company’, combined
with ‘Customer Service’ and ‘Variety of VAS’
W H ATC U S TO M E R SR E A L LY WA N T F R O M T H E I RM O B I L EE X P E R I E N C E:I.E. WHAT KEEPS THEM FROM CHURNING OUT?
With mobile phone penetration reaching a saturation point in many
countries, ‘retention’ has become more of a focal point than even
‘acquisition’. In the pursuit of market share, it is natural for Telecom
Companies to be keen to understand customer satisfaction in order to
cultivate strong relationships with them. Now, as the logical next step,
to help mobile service companies compete in this fast-paced Telecom
market, it is essential to identify the crucial drivers of satisfaction that
truly impact customer engagement post-purchase and keep them from
churning out.
Our study measured seven key factors that affect consumer experience
of mobile phone users. These seven key factors were regressed
onto Key Performance Indicators as Independent variables, and the
calculated impact was used to rank these seven key factors in order of
influence (See Table below).

6 CONNECTING WITH THE CONSUMER
CALL CENTRE
VOICE QUALITY
FACTORS
(REGRESSIONSCORES)DRIVERS
(TOP 2 BOX%)PERFORMANCE
IN STORE/OUTLET EXPERIENCE
RATE PLANS / PRICE
VALUE ADDED SERVICES
DATA QUALITY
BILLING EXPERIENCE/RECHARGE EXPERIENCE
19.3 41
14.9 39
14.5 48
13.8 48
13.0 42
12.7 56
11.7 41
‘Rate Plans/ Price’ emerged as the top driver of customer satisfaction
This expectation also existed as a pre purchase criteria. This indicates that the consumer’s inclination for cost savings is here to stay
Mobile service providers have graduated from providing basic voice
and telephony services to offering a host of entertainment and other
‘Value Added Services’ (VAS), and this emerged as the second most inf luential driver for mobile service usage experience. Somehow, VAS
was not considered as the most important criteria while purchasing.
With the convergence of technologies, data services are growing
exponentially and ‘Data traffic quality’ has emerged as the third most
important influencer. This too has been indicated by consumers in
their pre purchase criteria.
Payment experience’ in terms of variety of payment options and their
seamless execution emerged as the fourth most important dimension,
while ‘Customer Support’ came in fifth
Voice Quality (Network Quality) which was the numero uno criteria
while purchasing a connection, slipped down to sixth place. Perhaps
once a selection had been made on Network Coverage and Quality,
Voice Quality was assumed to be a given with little disruption.
Globally, Voice Quality has the best performance relative to all other
variables.

7CONNECTING WITH THE CONSUMER Copyright © 2014 The Nielsen Company
P O I N T S TOP O N D E R:Top of the mind reasons for selection of a brand (i.e. Brand Attraction)
and reasons for staying with a brand (i.e. Brand Retention) overlap,
but with some noteworthy differences. They are similar but not the
same, now let us explore why.
At the beginning of wireless telecom history, service providers competed on network coverage and/or price. Then the industry evolved and Value Added Services entered the equation. Today, with
the rapid growth in the demand for Data Services; coverage, speed
and price come into play once again with an even greater force while
choosing a service provider. Our data also confirms the growing
penetration and importance of ‘Data Services’ on the mobile phone. It
has emerged amongst the Top four consumer Attraction and Retention
criteria for a brand, and which in turn requires the foundation of
strong infrastructure and competitive pricing.
However, for the mobile operators whose margins are already squeezed and who are reeling under pressures of the price war, there is no scope for prices to go down further. But there are two avenues where they can still compete
a. The deployment of new technology
b. The improvement of service performance.
This is where VAS and Service delivery factors come in. Therefore
operators can use products and services as differentiators on the
customer experience front.
The findings imply that it is imperative that mobile services providers
pay special attention to the basics, notably, the three essentials: a)
constantly build and upgrade their network and bandwidth, b) offer
more innovative subscription packages, and c) invest to ensure better
quality of service and positive brand experiences.
These may seem like basic hygiene factors but balancing Financials
and Network quality at the sell side, with Innovation and Service
Delivery on the experience side, could be the ‘success mantra’ in the
mobile/ wireless telecom space.

8 CONNECTING WITH THE CONSUMER
R E L AT I O N S H I P S T R E N G T H I N D E X:A STRONG PERFORMANCE INDICATOR
As discussed earlier, improving customer experience and satisfaction
is a top priority for mobile service providers. Focusing on customer
experience can enable mobile service providers to respond more
effectively to customer requirements, build customer loyalty, and
create a stronger value perception in the minds of customers.
Additionally, improved customer experience can generate sustainable
competitive differentiation, improving prospects for long term
profitability.
While most Mobile Service providers measure ‘satisfaction’ or ‘loyalty’
as a Key Performance Indicator (KPI), Nielsen measures the deeper
‘cause’ of Loyalty rather than Loyalty itself. Nielsen defines the
“cause” of Loyalty as Strength of the Relationship between the service
provider and the customer.
This Relationship Strength Index (RSI), is a composite of six
statements, which reflect both the tangible as well as the intangible
aspects of the relationship.
WHAT IS THE RSI ADVANTAGE?• RSI Statements are specific and easy to understand
• The first two questions included in the RSI define the ‘brick and mortar’ of Customer Engagement/Experience. These are: ‘Overall satisfaction’ and ‘Performance relative to competition’.
• As is common knowledge, Customer Engagement is also the result of a customer’s perception of the value received in a transaction or relationship; where value equals perceived service quality relative to price. Thus, Value for Money (VFM) is the third parameter that we measure under RSI.
• Experience tells us that rational elements account for only half the typical customer experience; the rest is emotional. An organization’s strong reputation and recognized expertise, translates into Trust. And it is this element of ‘Trust’ along with the constituent of ‘Responsiveness’ which creates emotional bonds and is therefore also included in the RSI
• The RSI also includes an element of Price Premiumness / Price Sensitivity
• The RSI follows the hierarchy of customer expectations – from Needs Fulfilment to Trust
• The value of this RSI ranges from a minimum of 0 (signifying a weak relationship),to a maximum of 10 (Signifying a strong relationship).

9CONNECTING WITH THE CONSUMER Copyright © 2014 The Nielsen Company
THE RELATIONSHIP STRENGTH INDEX (CORE QUESTIONS)
R S I A N D I T S L I N K TO I N-M A R K E T P E R F O R M A N C EWe also observed a strong contrast in the experience (in terms of
% satisfied) across the seven factors amongst High RSI and Low
RSI customers, thus providing a compelling reason to believe that
experience across these 7 factors drove strength of engagement/
strength of relationship (With a R2=0.6)
FACTORS(TOP 2 BOX %)
TOTAL LOW RSI(BOTTOM DECILE)
HIGH RSI(TOP DECILE)
Rate Plans / Price 41 8 89
Value Added services 39 5 88
Data Quality 49 12 91
Billing Experience/Recharge experience 48 13 90
Call Centre 42 8 87
Voice Quality 56 19 93
In store/Outlet experience 41 10 88
OVERALL OPINION VS OTHERS
VALUE FOR MONEYSATISFACTIONNEED
FULFILMENT TRUST
“ABC is a
brand that
you can truly
trust”
PRICE PREMIUM
“If another
product/service
provider were to
offer you a similar
product/service
at a marginally
lower price, how likely are you to shift from
ABC to the new
service provider?”
“Compared
to other product
and services
in the market,
what is your
overall opinion
about ABC?”
“Based on the
benefits you
get from ABC,
you feel It is
well worth the money
you paid for it”
“To what extent
would you
say you are
satisf ied or dissatisfied
with the
products and
services of
ABC?”
“ABC offers
products
and services
that are
responsive to your
needs and
requirements”

10 CONNECTING WITH THE CONSUMER
We discovered that two statements included in the RSI, which define
the ‘brick and mortar’ of Customer Engagement/Experience (i.e.
‘Overall Satisfaction’ and ‘Performance Relative to Competition’), are
even by themselves able to explain the impact of these 7 factors quite
well (With a healthy R2=0.54). We have in our analysis, also created another KPI by combining these two statements into what we are now calling the Experience Index (EI)
T H E L OYA LT YFA C TO RWhile we have a good idea of what drives high customer satisfaction,
increased competition in the telecommunication industry has
necessitated that companies pay attention towards retaining
customers.
Retention of customers is key to corporate survival and can only be
achieved through building strong customer relationships. When built
right, customer relationships can have a cascading effect, leading
to Loyalty, positively impacting revenue, and ultimately resulting in
sustainable growth.
The loyalty behaviors that we incorporated in our survey were both
behavioural and attitudinal, as listed below-
1. relationship continuance
2. recommendation (word of mouth advertising)
3. ‘I rarely think about leaving’
4. ‘It would take a lot for me to leave’
These four parameters together made up our loyalty Index called
Claimed Behavior Index (CBI). The value of this index also ranges from
a minimum of 0 and a maximum of 10.
We also observed a strong contrast in loyalty behaviour (in terms
of % agree) across the four parameters amongst High RSI and Low
RSI customers. Our data shows that higher strength of customer
relationship (RSI) leads to greater customer loyalty (CBI), which
in turn has a positive rub off on profitability. There exists a strong
link between RSI and future behaviour of the customer (See Table
below). Thus, strong RSI does lead to better loyalty in its various
manifestations.
11CONNECTING WITH THE CONSUMER Copyright © 2014 The Nielsen Company
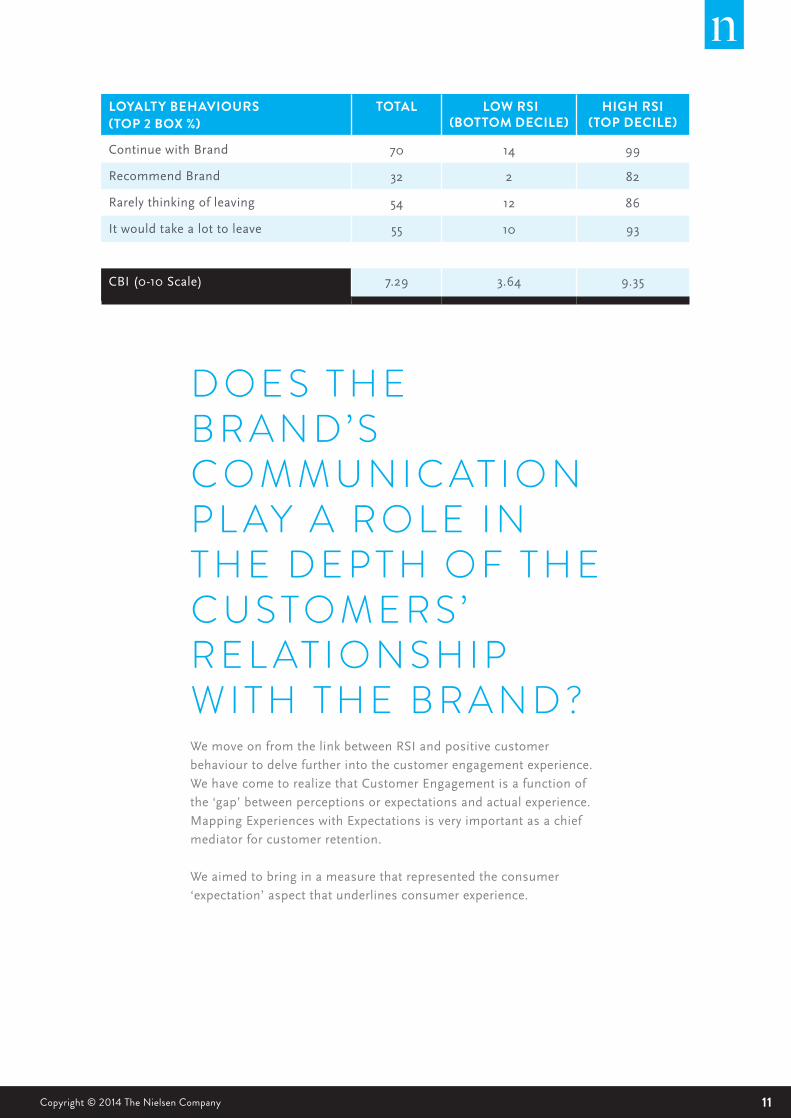
D O E S T H E B R A N D’SC O M M U N I C AT I O N P L AY A R O L E I N T H E D E P T H O F T H E C U S TO M E R S’R E L AT I O N S H I P W I T H T H E B R A N D ?We move on from the link between RSI and positive customer
behaviour to delve further into the customer engagement experience.
We have come to realize that Customer Engagement is a function of
the ‘gap’ between perceptions or expectations and actual experience.
Mapping Experiences with Expectations is very important as a chief
mediator for customer retention.
We aimed to bring in a measure that represented the consumer
‘expectation’ aspect that underlines consumer experience.
LOYALTY BEHAVIOURS(TOP 2 BOX %)
TOTAL LOW RSI (BOTTOM DECILE)
HIGH RSI(TOP DECILE)
Continue with Brand 70 14 99
Recommend Brand 32 2 82
Rarely thinking of leaving 54 12 86
It would take a lot to leave 55 10 93
CBI (0-10 Scale) 7.29 3.64 9.35

12 CONNECTING WITH THE CONSUMER Copyright © 2014 The Nielsen Company
WHY MEASURE BRAND EQUITY IN A CUSTOMER SATISFACTION STUDY?Contrary to conventional wisdom, there is a key set of fundamental
metrics — which can be actively managed — linking the health of a
brand to revenue and consumer commitment.
THE CAUSALITY OF THIS RELATIONSHIP HAS BEEN LONG ESTABLISHED.However, behavioural intentions are not adequate. We also need
to know how much customers ‘like’ the brand and whether this
‘affability’ will translate into positive outcomes
B. Hence, we also went a step ahead to explore the relationship
between the Brand Equity Index (BEI) and future Claimed Behavior
Index (CBI)
The aim is to develop a customer metric that is better able to predict
subsequent behaviours and economic performance, so we ran a
correlation analysis between the key Input – Output variables.
Brand Equity literature tells us that customers’ positive feelings
towards a product or service brand, creates purchase intention in
their mind. This intention may lead to the act of purchase, and will be
strengthened if actual experience is in line with the Expectations.
With the objective of providing this perspective, we included Nielsen’s
proprietary Brand Health KPI called Brand Equity Index (BEI) into the
measurement.
Thus, our analysis now worked at two levels:
A. Experience (measured via RSI) will feed in (positively/ negatively)
to BEI. So we attempted to explore the relationship between RSI
and BEI.
Traditional approach towards building customer relationships and
ultimately loyalty and market share can be represented thus:
Brand Equity is an intelligent way of estimating the extent to which
‘expectations’ that existed before consumption of product / service,
have been validated through ’experience’ with the product/ service.
CUSTOMER SATISFACTION
CUSTOMER LOYALTY PROFITABILITY

13CONNECTING WITH THE CONSUMER Copyright © 2014 The Nielsen Company
CAN THIS HELP BRANDS ‘WALK THE TALK’?While rational measures (Overall Satisfaction and Opinion w.r.t.
competition) i.e. EI, is a good predictor of Future behavioural
intentions (EI correlation with CBI is 0.74), adding other Rational
measures like VFM and the Emotional undertones like Trust and
Responsiveness (i.e. RSI) enhance the strength of the correlation (RSI
correlation with CBI is 0.80).
The correlation of BEI with CBI was also positive (at 0.55).
The variation in RSI across 11 countries is far less than that of BEI. We
asked ourselves why. The answer lies in the fact that RSI comes from
actual experience of the service, while BEI comes from awareness
and understanding of the brand gathered from multiple sources.
Moreover, telecom brands are similar in service. Over the past decade,
the focus has been on operational efficiencies and mimicking each
other’s ‘best practices’. Telecom as an industry has been trying to plug
inefficiencies. They have been under pressure because of declining
voice and data margins. Thus service levels and processes are not
very distinguishable. On the other hand, brand communication is
quite differentiated. This is apparent from the variance in RSI and BEI
scores.
The correlation analysis was used to measure the magnitude and the
direction of the relationship between the role of EI, RSI, BEI and CBI
of Current users of the brand. We found that, as hypothesized, there
exist meaningful linear relationships between the variables: RSI, EI,
BEI and CBI.
(Note: Relationship Strength Index (RSI), Engagement Index (EI), Claimed Behavior Index (CBI) and Brand Equity Index (BEI) are proprietary measures of The Nielsen Company)
STRENGTH OF RELATIONSHIP BETWEEN RELATIONSHIP STRENGTH INDEX (RSI), ENGAGEMENT INDEX (EI), BRAND EQUITY INDEX (BEI) AND FUTURE LOYALTYINTENTIONS – CLAIMED BEHAVIOUR INDEX (CBI)
CBI
RSI 0.8
EI 0.74
BEI 0.55
RSI+BEI 0.76
EI +BEI 0.73

14 CONNECTING WITH THE CONSUMER
RSI BEI FOR TOTAL SAMPLE
BEI FOR CUSTOMERS
STANDARD DEVIATION 1.88 2.62 2.71
Since most brands are similar in terms of service delivery (as
represented by RSI), It is no wonder that price is the top consideration
for customers, There is a need for service differentiation. And this
promise of service differentiation needs to be tied back to the brand
communication.
So, as a whole, using the above analysis we have successfully been
able to link Customer Engagement (RSI) to Brand Equity (BEI ) and
both of them to Loyalty (CBI) which should result in profitability and
growth. In our work across sectors, we see companies often failing
to “walk the talk’, and this could be a reminder to promise the right
things on their brand communication and then deliver on those
promises
Our motivation was not simply to establish these relationships, but
also to demonstrate how they work in the context of multiple brands
across multiple countries in the telecommunications industry. We
observed that market leaders were usually high on RSI as well as BEI.
Hence it made sense to align improvement initiatives with those
exhibited by the highest performers (i.e. work on both Customer
Experience STRATEGY & Communication and also on Customer
Experience DELIVERY)
15CONNECTING WITH THE CONSUMER Copyright © 2014 The Nielsen Company
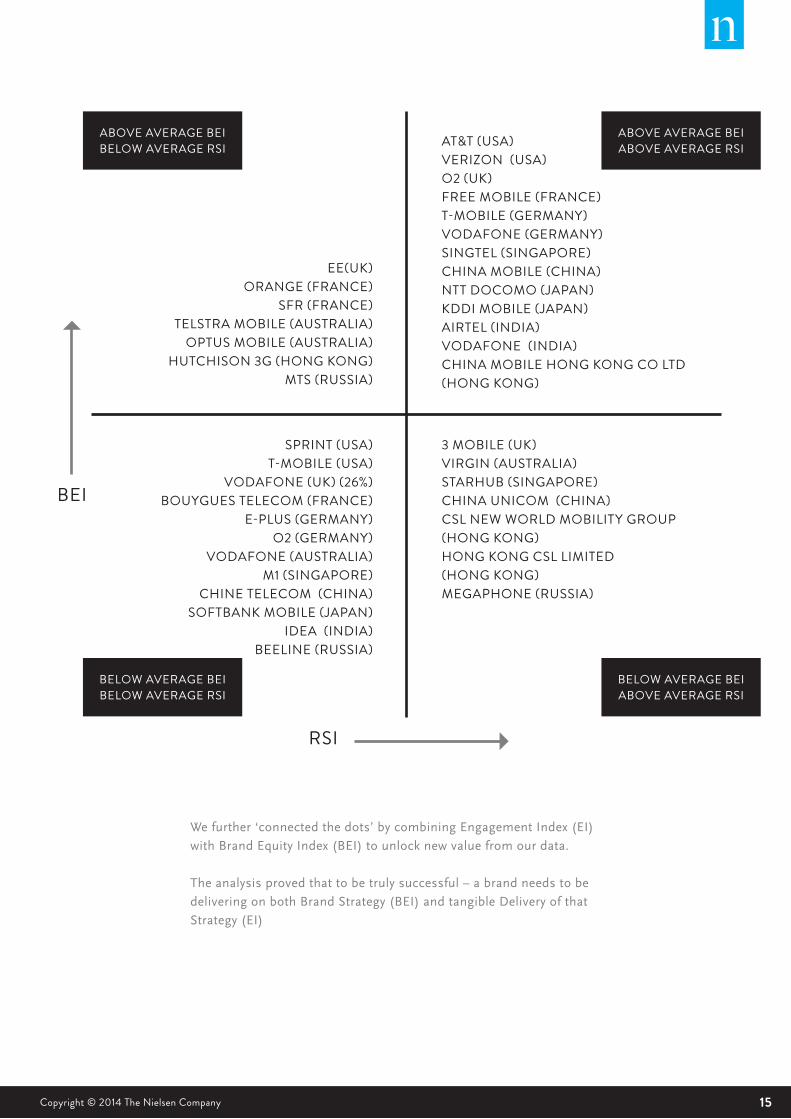
AT&T (USA)VERIZON (USA)O2 (UK)FREE MOBILE (FRANCE) T-MOBILE (GERMANY) VODAFONE (GERMANY) SINGTEL (SINGAPORE) CHINA MOBILE (CHINA) NTT DOCOMO (JAPAN) KDDI MOBILE (JAPAN) AIRTEL (INDIA) VODAFONE (INDIA) CHINA MOBILE HONG KONG CO LTD (HONG KONG)
We further ‘connected the dots’ by combining Engagement Index (EI)
with Brand Equity Index (BEI) to unlock new value from our data.
The analysis proved that to be truly successful – a brand needs to be
delivering on both Brand Strategy (BEI) and tangible Delivery of that
Strategy (EI)
EE(UK) ORANGE (FRANCE)
SFR (FRANCE) TELSTRA MOBILE (AUSTRALIA)
OPTUS MOBILE (AUSTRALIA) HUTCHISON 3G (HONG KONG)
MTS (RUSSIA)
ABOVE AVERAGE BEIBELOW AVERAGE RSI
BELOW AVERAGE BEIBELOW AVERAGE RSI
ABOVE AVERAGE BEIABOVE AVERAGE RSI
BELOW AVERAGE BEIABOVE AVERAGE RSI
SPRINT (USA)T-MOBILE (USA)
VODAFONE (UK) (26%)BOUYGUES TELECOM (FRANCE)
E-PLUS (GERMANY) O2 (GERMANY)
VODAFONE (AUSTRALIA) M1 (SINGAPORE)
CHINE TELECOM (CHINA) SOFTBANK MOBILE (JAPAN)
IDEA (INDIA) BEELINE (RUSSIA)
3 MOBILE (UK) VIRGIN (AUSTRALIA) STARHUB (SINGAPORE) CHINA UNICOM (CHINA) CSL NEW WORLD MOBILITY GROUP (HONG KONG) HONG KONG CSL LIMITED (HONG KONG) MEGAPHONE (RUSSIA)
RSI
BEI

16 CONNECTING WITH THE CONSUMER Copyright © 2014 The Nielsen Company
Using EI and BEI, we created a 2X2 Matrix and segmented the
respondents into Asset Base, Threat Base, Opportunity Base and Weak
Underbelly Base (See graphic below)
OPPORTUNITY
THREAT
ASSET
WEAK UNDERBELLY
BRAND EQUITY INDEX
ENG
AG
EMEN
T IN
DEX
LOW HIGH
LOW
HIG
H
Our analysis of the Loyalty Behaviours pertaining to each of these
segments revealed that the strongest Loyalty emanated from the Asset
Base, where both EI and BEI were high
LOYALTY BEHAVIOURS SCALE ASSET BASE
OPPORTUNITY BASE
WEAK UNDERBELLY
BASE
THREAT BASE
HIGH EI HIGH BEI
HIGH EI LOW BEI
LOW EI HIGH BEI LOW EI LOW BEI
Likelihood to Continue to Use Unlikely 0.20% 4.10% 2.70% 15.50%
Likely 94% 82% 61% 35%
Likelihood to Recommend NPS 50% 11% -9% -58%
Rarely think about leaving
current service providerDisagree 9% 12% 20% 37%
Agree 80% 67% 42% 25%
Take a lot to leave current
service providerDisagree 4% 10% 15% 40%
Agree 82% 67% 44% 21%
17CONNECTING WITH THE CONSUMER Copyright © 2014 The Nielsen Company
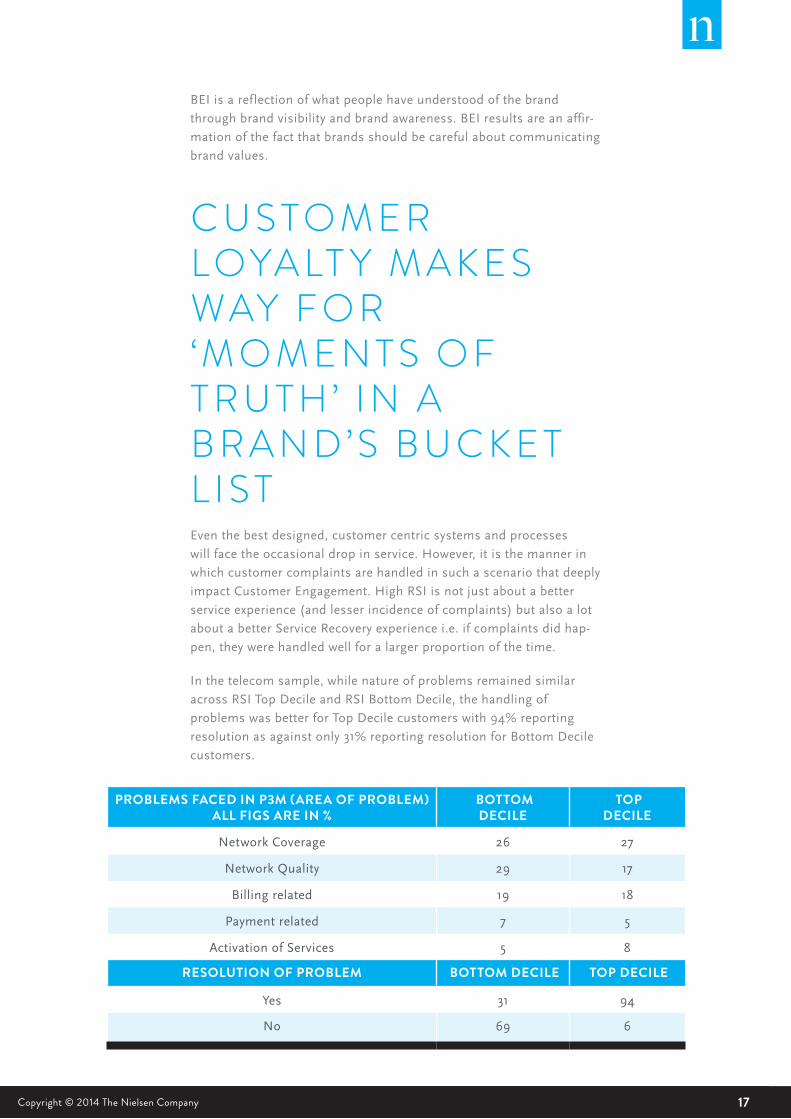
BEI is a reflection of what people have understood of the brand
through brand visibility and brand awareness. BEI results are an affir-
mation of the fact that brands should be careful about communicating
brand values.
C U S TO M E RL OYA LT Y M A K E S WAY F O R‘M O M E N T S O F T R U T H’ I N A B R A N D’S B U C K E T L I S TEven the best designed, customer centric systems and processes
will face the occasional drop in service. However, it is the manner in
which customer complaints are handled in such a scenario that deeply
impact Customer Engagement. High RSI is not just about a better
service experience (and lesser incidence of complaints) but also a lot
about a better Service Recovery experience i.e. if complaints did hap-
pen, they were handled well for a larger proportion of the time.
In the telecom sample, while nature of problems remained similar
across RSI Top Decile and RSI Bottom Decile, the handling of
problems was better for Top Decile customers with 94% reporting
resolution as against only 31% reporting resolution for Bottom Decile
customers.
PROBLEMS FACED IN P3M (AREA OF PROBLEM)ALL FIGS ARE IN %
BOTTOMDECILE
TOPDECILE
Network Coverage 26 27
Network Quality 29 17
Billing related 19 18
Payment related 7 5
Activation of Services 5 8
RESOLUTION OF PROBLEM BOTTOM DECILE TOP DECILE
Yes 31 94
No 69 6

18 CONNECTING WITH THE CONSUMER Copyright © 2014 The Nielsen Company
This brings home the point that recent actual behaviour may be a
stronger reflection of how customers feel as compared to future inten-
tions
C U S TO M E RC A L L I N G -S E R V I C ER E C O V E R Y I S T H E H A L L M A R K O F Q U A L I T Y TO O !Our study showed that the RSI, EI and CBI scores were better than the
global average for consumers who had NOT faced any problems in the
past three months (See Table below)
GLOBAL AVERAGE
PEOPLE WHO DID NOT FACE A PROBLEM
PEOPLE WHO FACED A PROBLEM BUT DID NOT COMPLAIN
PEOPLE WHO FACED A PROBLEM AND COMPLAINED
SATISFIED WITH PROBLEM
RESOLUTION (TOP 2 BOX)
DISSATISFIED WITH PROBLEM
RESOLUTION (BOTTOM 2 BOX)
RSI 6.68 6.92 5.6 5.97 7.87 4.63
EI 6.56 6.78 5.5 5.93 7.9 4.64
CBI 7.29 7.55 6.27 6.43 8.15 5.01
And, there was a dip in RSI, EI and CBI of consumers who had faced a
problem in the past three months. This dip was steeper for consumers
who had faced a problem but had not complained to the Mobile
Service provider about it.
From amongst the consumers who did complain (and hence
provided the Mobile service provider with an opportunity for Service
recovery), when the resolution of the problem was to the consumer’s
satisfaction, there was a discernible improvement in the RSI, EI and
CBI scores to levels that were even higher than the global average.
Alternatively, if the resolution was not to the satisfaction of the
consumer, then, understandably, there was a discernible dip in the
RSI, EI and CBI scores, to levels lower than global average.

19CONNECTING WITH THE CONSUMER Copyright © 2014 The Nielsen Company
The good news is that the positive ripple effect of good service
recovery does not end here, it goes on to rub off positively on current
behaviors. (See Table below)
So consumers who have complained and have had a satisfactory
resolution of their problem are more likely to engage in positive,
revenue impacting behaviour like:
• Speaking positively about the brand
• Recommending the brand
• Increase spending
• Report ‘delightful’ experiences with the brand
SPOKEN POSITIVELY ABOUT THE
BRAND
HAVE RECOMMENDED THE BRAND
EXPERIENCED INCIDENTS THAT HAVE DELIGHTED OR UPSET
CHANGE IN SPENDING
YES NO YES NO DELIGHTED UPSET INCREASED DECREASED REMAINED SAME
Satisfied
with
problem
resolution
(Top 2
Box%)
46 10 49 11 58 8 37 9 18
Dissatisfied
with
problem
resolution
(Bottom 2
Box%)
4 11 3 11 2 13 7 11 9

20 CONNECTING WITH THE CONSUMER Copyright © 2014 The Nielsen Company
C A L L TO A C T I O N:HOW CAN MOBILE SERVICE PROVIDERS DIFFERENTIATE THEMSELVES AND MINIMISE CUSTOMER ATTRITION IN AN INCREASINGLY COMPETITIVE MARKETPLACE?
• Mobile service providers need to master the art of retaining
customers and reducing churn
• Globally the telecom industry is in the midst of a transformational
shift, driven by a huge surge in data traffic on telecom networks.
Hence, now more than ever, for mobile service providers, the
‘mantra’ for driving engagement: would be about continuously
upgrading infrastructure, reach and quality of network; while at
the same time maintaining a stronger focus on maximizing cost
efficiency and maintain high service standards.
• Since mobile consumption habits are changing, Innovation in
content is a global need along with informative VAS
• However, Technology is only one of the drivers of this business
model. Most telecom providers want to hold onto their customers
by providing value added customer service. It would make sense
to therefore define the same ‘value added customer service’
properly. Customers must be provided with the information on
what they can expect right upstream in their experience. This
is where brand communication needs to be taken care of by
promising the ‘right’ things/ benefits to the consumers. For great
service differentiation, a very clear promise needs to be made
(BEI), and then those promises need to be well delivered at every
touch point.
• The findings suggest that companies must balance and manage
different aspects of customer expectations and customer
experiences simultaneously if they are to optimize the desired
loyalty behaviours.
• If a mobile service provider wants to decrease disloyalty, they
need to maximize efforts on Service Recovery. The first step is
to eliminate the factors that would make a customer walk away.
Good service recovery creates goodwill and may even trigger a
“wow” effect with customers. Then, the same customers are likely
to become stronger loyalists and spread positive WOM for the
brand.
21CONNECTING WITH THE CONSUMER Copyright © 2014 The Nielsen Company
ABOUT NIELSEN Nielsen Holdings N.V. (NYSE: NLSN) is a global information and
measurement company with leading market positions in marketing
and consumer information, television and other media measurement,
online intelligence and mobile measurement. Nielsen has a presence
in approximately 100 countries, with headquarters in New York, USA
and Diemen, the Netherlands.
For more information, visit www.nielsen.com.
Copyright © 2014 The Nielsen Company. All rights reserved. Nielsen
and the Nielsen logo are trademarks or registered trademarks of
CZT/ACN Trademarks, L.L.C. Other product and service names are
trademarks or registered trademarks of their respective companies.
14/8157

22 CONNECTING WITH THE CONSUMER


![General Overview of Mobile Service Providers in India[1]_2](https://img.pdfslide.us/doc/110x75/577cdf3f1a28ab9e78b0c85c/general-overview-of-mobile-service-providers-in-india12.jpg)