Embed Size (px)
DESCRIPTION
thesis
Citation preview
Customer Satisfaction Towards Mobile Network Service Providers
Submitted to : Dr. Rina Mam
Gaurav Moorjani and Rohan Pandya4/27/2015
Index
TABLE OF CONTENTS
01) Introduction
02) Objectives
03) Research Methodology
04) Data Analysis
05) Findings
06) Suggestions
05) Conclusion
1

Acknowledgement
There are a few words of gratitude for the individuals without whom this study would
not have been possible.
My first and foremost knee down gratitude goes to the almighty for his divine help
throughout this project work.
I take this opportunity to express my sincere gratitude towards Dean, School of Business and
Law, Navrachana University for giving me an opportunity to gain practical knowledge about
corporate working through this project. Not forgetting the guidance given by Dr. Rina Mam.
Also, my gratitude lies with all non – teaching staff members for their support and help
that they extended to me. I would like to thank all the respondents who gave me their
precious time and their views in filling the questionnaires. I am also grateful to all the
people who helped me in every possible way to take up the study. I also appreciate my
close friends and colleagues in motivating me to complete my research.
Finally, I am indebted to my dear parents for their love and support and for constantly
motivating me to excel.
2

Introduction
Theoretical Background of the Topic
Customer Satisfaction
According to Philip Kotler, “satisfaction is a person’s feelings of pressure or disappointment resulting from product’s perceived performance (outcome) in relation to his or her expectations. Customer satisfaction is the level of a person’s felt state resulting from comparing a product’s perceived performance (outcome) in relation to the person’s expectations”.
This satisfaction level is a function of difference between perceived performance and expectations. If the product’s performance, exceed expectation the customer highly satisfied or delighted. If the performance matches the expectations the customer is satisfied. If the products performance fall shorts of expectations the customer is dissatisfied.
Many companies are aiming for high satisfaction because customers who are just satisfied still find it easy to switch when a better offer comes along. High satisfaction or delight creates an emotional affinity with brand.
Variety of factors that affect customer satisfaction includes product quality, product availability and after sales support such as warranties and services. Customer satisfaction is seen as a proof of delivering a quality product or service. It is believed that customer satisfaction brings sales growth, and market share. A company can always increase customer satisfaction by lowering its price or increasing its services but this may result in lower profits. Thus the purpose of marketing is to generate customer value profitability.
India is on the threshold of a new millennium. India chose for global economy, exposing her to winds of change in the market place, which has expanded vastly and become fiercely competitive. In the changed environment, decision makers view the marketing concept as the key to success. Marketing in practice has to manage products, pricing, promotion and distribution.
A successful product can be developed by exploding these opportunities. While delivering the value of the consumer we make use of marketing support. This support is based on the knowledge of consumers and distribution. Marketing support both at the introduction of products and maturing is considered
Marketing, as suggested by the American Marketing Association is "an organizational function and a set of processes for creating, communicating and delivering value to customers and for managing customer relationships in ways that benefit the organization and its stakeholders".
The two major factors of marketing are the recruitment of new customers (acquisition) and the retention and expansion of relationships with existing customers (base management). Marketing methods are informed by many of the social, particularly psychology, sociology, and economics. Anthropology is also a small, but growing, influence. Market research underpins these activities. Through advertising, it is also related to many of the creative arts.
3
For a marketing plan to be successful, the mix of the four "Ps"1 i.e. product, price, place, promotion must reflect the wants and desires of the consumers in the target market. Trying to convince a market segment to buy something they don't want is extremely expensive and seldom successful. Marketers depend on marketing research, both formal and informal, to determine what consumers want and what they are willing to pay for. Marketers hope that this process will give them a sustainable competitive advantage. Marketing management is the practical application of this process. The offer is also an important addition to the 4P's theory.
Introduction to Telecom Industry
Indian telecom sector the number of telephone subscribers in India increased from 957.61 million at the end of September 2014 to 962.63 million at the end of October 2014, thereby showing a monthly growth rate of 0.52%. The urban subscription increased from 569.56 million at the end of September 2014 to 570.58 million at the end of October 2014 and the rural subscription increased from 388.05 million to 392.05 million during the same period. The monthly growth rates of urban and rural subscription were 0.18% and 1.03% respectively.
The overall Tele-density in India increased from 76.75 at the end of September 2014 to 77.07 at the end of October 2014. The Urban Tele-density increased from 148.07 to 148.10 and Rural Tele-density increased from 44.96 to 45.39 in the month of October 2014. The shares of urban subscribers and rural subscribers at the end of October 2014 were 59.27% and 40.73% respectively.
Total wireless subscriber base increased from 930.20 million at the end of September 2014 to 935.35 million at the end of October 2014, thereby registering a monthly growth rate of 0.55%. Wireless subscription in urban areas increased from 547.70 million at the end of September 2014 to 548.78 million at the end of October 2014. The wireless subscription in rural areas increased from 382.50 million to 386.57 million during the same period. The monthly growth rates of urban and rural wireless subscription were 0.20% and 1.06% respectively.
India saw the fastest growth in new mobile-phone connections with 18 million net additions in the third quarter of 2014, according to a report by Swedish mobile network equipment maker Ericsson. The number of smart phones, which account for just 37 per cent of all mobile-phone subscriptions, will reach 2,700 million by 2014, and growing at 15 per cent compounded annual growth rate, will cross 6,100 by 2020. The falling cost of handsets, coupled with improved usability and increasing network coverage, are factors that are making mobile technology a popular phenomenon in the country. The broadband services user-base in India is expected to grow to 250 million connections by 2017, according to GSMA. It also expects to see increased mobile broadband penetration in India, with over 250 million on either 3G /4G by 2017.
Composition of telephone subscribers in India -The wireless segment (96.9 per cent of total telephone subscriptions) dominates the market, while the wireline segment accounts for the rest.
Evolution of the industry-Important Milestones
Year
1
4
1851 First operational land lines were laid by the government near Calcutta (seat
of British power)
1881 Telephone service introduced in India
1883 Merger with the postal system
1923 Formation of Indian Radio Telegraph Company (IRT)
1932 Merger of ETC and IRT into the Indian Radio and Cable Communication
Company (IRCC)
1947 Nationalization of all foreign telecommunication companies to form the
Posts, Telephone and Telegraph (PTT), a monopoly run by the
government's Ministry of Communications
1985 Department of Telecommunications (DOT) established, an exclusive
provider of domestic and long-distance service that would be its own
regulator (separate from the postal system)
1986 Conversion of DOT into two wholly government-owned companies: the
Videsh Sanchar Nigam Limited (VSNL) for international telecommunications
and Mahanagar Telephone Nigam Limited (MTNL) for service in
metropolitan areas.
1997 Telecom Regulatory Authority of India created.
1999 Cellular Services are launched in India. New National Telecom Policy is
5

adopted.
2000 DoT becomes a corporation, BSNL
Market Size
Telecommunications is one of the prime support services needed for rapid growth and modernisation of various sectors of the economy. Driven by strong adoption of data consumption on handheld devices, the total mobile services market revenue in India will reach US$ 29.8 billion in 2014 and is expected to touch US$ 37 billion in 2017, registering a compound annual growth rate (CAGR) of 5.2 per cent, according to research firm IDC.
According to a study by GSMA, it has been expected that smartphones will account for two out of every three mobile connections globally by 2020 and India is all set to become the fourth largest smartphone market.
India is projected to have 213 million mobile internet users by June 2015, a 23 per cent rise over a six month period, according to Mobile Internet in India 2014 report.
The broadband services user-base in India is expected to grow to 250 million connections by 2017, according to the UK-based GSM Association (GSMA).
India saw the fastest growth in new mobile-phone connections with 18 million net additions in the third quarter of 2014, followed by China with 12 million new additions, according to a report by Swedish mobile network equipment maker Ericsson.
The Indian telecom sector is expected to create four million direct and indirect jobs over the next 5 years on the back of the government’s efforts to increase penetration in rural areas along with the growth in the smartphone numbers and internet usage, according to estimates by Randstad India. “The telecom sector has been growing aggressive at an average for 35 per cent a year for close to two decades,” said Mr K Uppaluri, CEO, Randstad India.
Investment
With daily increasing subscriber base, there have been a lot of investments and developments in the sector. The industry has attracted FDI worth US$ 16,994.68 million during the period April 2000 to
6

January 2015, according to the data released by Department of Industrial Policy and Promotion (DIPP).
Some of the major developments in the recent past are:
Sterlite Technologies Ltd has announced an annual seed fund of US$ 100,000 to strengthen India’s investments in broadband technology research, by investing in Indian start-ups, working on innovative broadband deployment technologies.
Maxx Mobilink plans to start production of mobile handsets at its Haridwar plant, beginning with assembling devices from April 2015. Maxx will invest over Rs 6 crore (US$ 965,615.81) initially in setting up the R&D laboratory.
Huawei Technologies has won two contracts worth a combined US$ 120 million from Bharti Airtel and Idea Cellular to upgrade their wireline networks.
Tata Communications has invested in acquiring capacity in Seabras-1, a submarine cable being developed between the US and Brazil, seeking to increase services in the Latin American region.
Bharti Airtel and IHS Holding have signed an agreement under which latter will acquire about 1,100 telecom towers across Zambia and Rwanda.
Ericsson has won a seven-year deal worth more than US$ 1 billion to manage the network of Reliance Communications across 11 service areas, making the Swedish telecom gear maker the only service provider to manage the pan-India network of a mobile phone operator.
Government Initiatives
The government has fast-tracked reforms in the telecom sector and plans to clear the proposal allowing spectrum trading and sharing ahead of the year-end deadline as it wants to lift the business sentiment for the forthcoming airwave auction. Some of the other major initiatives taken by the government are as follows:
The Government of Uttar Pradesh (UP) has secured investment deals valued at Rs 5,000 crore (US$ 804.64 million) for setting up mobile manufacturing units in the state.
The Government of India plans to roll out free high-speed wi-fi in 2,500 cities and towns across the country over the next three years and the programme, involving an investment of up to Rs 7,000 crore (US$ 1.12 billion), will be implemented by state-owned Bharat Sanchar Nigam Ltd (BSNL).
Citizens of India are expected to get a minimum of 2 megabits per second (MBPS) Wi-Fi speed at every government owned service point such as railways stations, airports, bus stops, hospitals and all government departments that deal with the public on a daily basis.
The Union Cabinet of India has approved the largest ever telecom spectrum auction that is targeted to fetch at least Rs 64,840 crore (US$ 10.43 billion). The government will sell 380.75 megahertz (MHz) of second generation (2G) spectrum in three bands—the premium 900 MHz, 1800 MHz and 800 MHz.
7

To speed up the national optical fibre network (NOFN) project, the Department of Telecommunications (DoT) has advised officials to use public buildings such as post offices, railway stations and schools.
The Government of Kerala has decided to allow mobile telecom service providers to set up towers on government land and buildings. This is the first time that a State Government has opened its own land, buildings and offices to mobile companies.
Road Ahead
India will emerge as a leading player in the virtual world by having 700 million internet users of the 4.7 billion global users by 2025, as per a Microsoft report.
With the government’s favourable regulation policies and 4G services hitting the market, rapid growth is expected in the Indian telecommunication sector in the next few years. Also, with developments in this sector, services such as security and surveillance, remote monitoring of ATM machines, home automation, traffic management, retail, logistics and grid energy could eventually facilitate optimisation of resources.
Objectives of the study:
To study the evaluation of cell phones with particular reference to India. To ascertain the attributer who influenced the customer’s in selecting the particular services
provider. To study the consumer’s satisfaction towards different cell phone service providers in
Vadodara City. To offer valuable suggestions to improve the services of cell phones in Vadodara city.
Need of the study:
Exchange of information becomes the necessity of life to a common man. In the modern world an individual tends to communicate anything to everything right from the place where he/she stands. Even while riding vehicle he / she wants communicate within a fraction of second at quick speed with clear voice, without any disturbance. Like line crossing, out of order, etc. most of which lack in the connection given by the department of tele-communication. Cell phones emerges as a boon quench such a thirst, the by providing facilities, which a common man cannot imagine. Though cell phone industry has its origin in the recent past and the growth has been excellent. Day by day many new competitors enter the market with new attractive schemes, provide additional facilities, add new features to existing ones, reduce the charges of incoming and outgoing calls, introduce varieties of handsets, models a healthy competition that benefits the subscribers. Hence in this context, it is important to study how much a customer is satisfied.
Scope of study:
The present study is contained to Vadodara and it is decided to consider Airtel, Idea and etc. cell phone service rendered to the customers. In Vadodara there are various cellular services available such as Airtel, Idea and Vodafone etc. but the cellular services has been selected to study the
8
consumer’s satisfaction in it is the most popular private cellular services. The main objectives of this study is to analyse the customers satisfaction and problems, faced by Airtel, Idea, etc., cellular services in Vadodara city has been taken for the current research work.
Statement of problem:
Now-a-days, the customers are more dynamic. Their taste, needs and preference can the changing as per current scenario. Hence the development of cellular industry mainly depends on the customer satisfaction. However the following questions may arise regarding customer satisfaction.
What are all expectations by the customer’s regarding service provided by the cell phone service provider?
Whether the service provided by cell phone industry is satisfying the customers? Are the facilities available adequate to satisfy the customers?
Research Methodology
It is a way to systematically solve the research problem. This research methodology is different research methods or technique. So it is necessary for their searcher to study both the things. Researcher is a scientific inquiry and has three essential characteristic i.e. objectivity, accuracy and continuity. Methodology has been an important bearing in the collection of reliable and pertinent information as wells on the outcome of the study. Determination of an
9

appropriate methodology for is a pre-cursor for any research project to be meaningful, error free and compressive. This refers to collection, analysis and interpretation of data and above all the presentation of all those information in a systematic manner. For the present study, out of the research techniques available, the historical method, statistical method, survey method has been adopted
Historical method has been adopted to expound information regarding the past and phase wise development of the organization till date.
Survey method has been adopted through structured questions asked in an informal set-up with different target groups following it up by analysis of data and drawing inferences on the general perception of the people on different issue under study.
The reason being detailed information can be obtained from a sample of large population and over all a survey method was carried out for the fact that it requires less time.
Source of data
The study undertaken there to be mainly based on the primary data i.e. structured questionnaire is designed. The study also contains secondary data i.e. data from authenticated websites and journals for the latest updates just to gain an insight for the views of various experts.
METHODOLOGY & PRESENTATION OF DATA
The data collected is then coded in the tables to make the things presentable and more effective. The results are shown by tables which will help me out in easy and effective presentation and hence results are being obtained.
Sampling Design
Research design
The design for this study is Exploratory and Random sampling.
Data collection
The data is collected randomly irrespective of the category of the people in the form of questionnaire and the sample size is 122 respondents.
Data Analysis and Interpretation
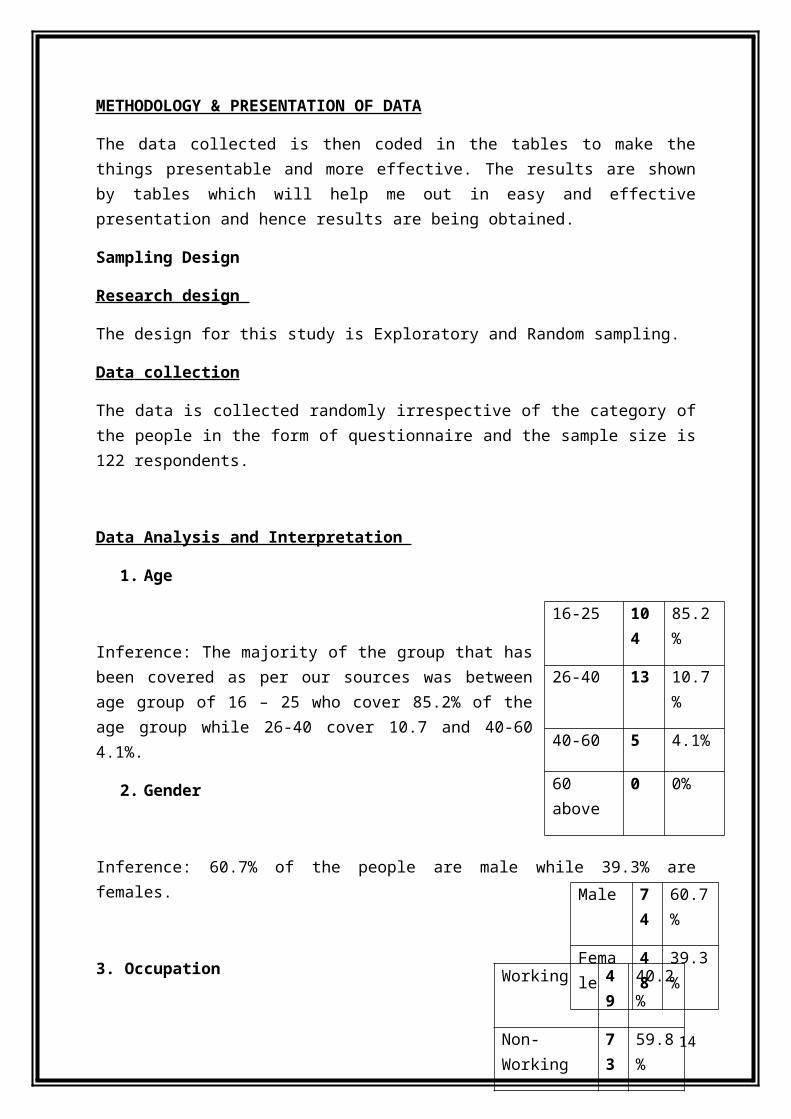
1. Age
10
16-25 104 85.2%
26-40 13 10.7%
40-60 5 4.1%
60 above 0 0%

Inference: The majority of the group that has been covered as per our sources was between age group of 16 – 25 who cover 85.2% of the age group while 26-40 cover 10.7 and 40-60 4.1%.
2. Gender
Inference: 60.7% of the people are male while 39.3% are females.
3. Occupation
Inference: Since our contacts were very limited we got 40.2% as working and 59.8% as non-working. The non-working people include students.
4. If Working, You are into
Inference: As stated the non-working people cover a huge percentage over working gropus. This is because our sources were very limited.
5. Annual House Hold Income
Inference: 30.3% of the people are having an annual house hold income of 1-5 Lakhs while 27.9% of the people are having incomes over 10 Lakhs.
6. Which cell phone (Service Provider) do you use?
Inference: Most of the people are using Vodafone (42.6%) while Idea has a share of 22.1% while rests of the people are using different network service providers.
7. Which type of scheme is most preferable by you ?
11
Male 74 60.7%
Female 48 39.3%Working 49 40.2%
Non-Working 73 59.8%
Business 18 14.8%
Service 20 16.4%
Self Employed
10 8.2%
Professional 13 10.7%
Below 1 Lakhs 17 13.9%
1 Lakhs - 5Lakhs 37 30.3%
5.5 Lakhs - 10 Lakhs
28 23%
Above 10 Lakhs 34 27.9%Vodafone 52 42.6%Idea 27 22.1%Airtel 28 23%Tata Docomo 6 4.9%BSNL 4 3.3%Uninor 2 1.6%Reliance 3 2.5%Other 0 0%
Pre-Paid 71 58.2%
Post Paid 51 41.8%

Inference: 58.2% people prefer pre-paid while 41.8% are prefer postpaid. As there is more number of non-working people which are students, they are using the pre-paid facility.
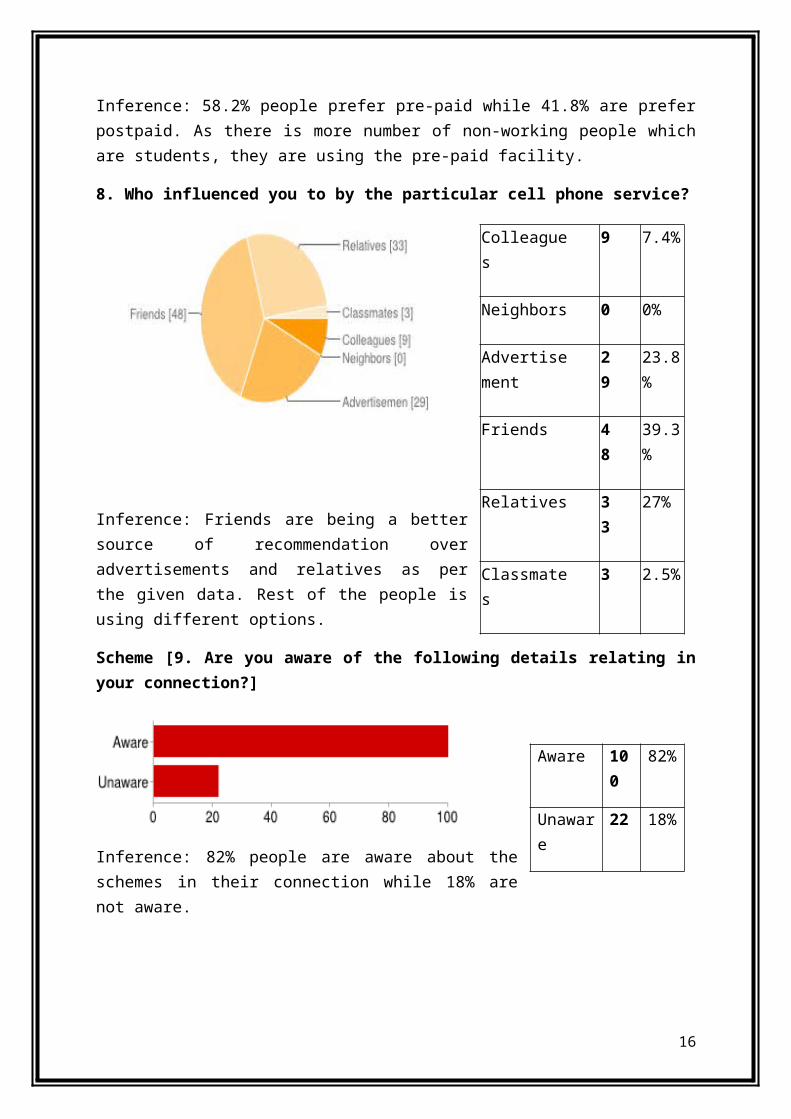
8. Who influenced you to by the particular cell phone service?
Inference: Friends are being a better source of recommendation over advertisements and relatives as per the given data. Rest of the people is using different options.
Scheme [9. Are you aware of the following details relating in your connection?]
Inference: 82% people are aware about the schemes in their connection while 18% are not aware.
12
Colleagues 9 7.4%
Neighbors 0 0%
Advertisement 29 23.8%
Friends 48 39.3%
Relatives 33 27%
Classmates 3 2.5%
Aware 100 82%
Unaware
22 18%

Balance of Talk charges [9. Are you aware of the following details relating in your connection?]
Inference: 79.5% of the people know how to check their balance of talk charges in their cell while 20.5% don’t know.
Periodical offers [9. Are you aware of the following details relating in your connection?]
Inference: there is a 5% difference among the people who are aware or not aware about periodical offers with respect to their service providers.
Modes of payment [9. Are you aware of the following details relating in your connection?]
Inference: 89.3% of the people know that they can pay by cash, cheque etc. to pay for their services.
Note: Only applicable for the post-paid people paying by cheque.
Monthly rental charges [10. Are you influenced by the following factors relating in your connection?]
13
Aware 97 79.5%
Unaware 25 20.5%
Aware 64 52.5%
Unaware 58 47.5%
Aware 109 89.3%
Unaware 13 10.7%
Aware 97 79.5%
Unaware 25 20.5%
Inference: 79.5% are influenced if there is any sudden increase in their monthly rental charges while 20.5% people are not much influenced about it.
Signal of tower networking [10. Are you influenced by the following factors relating in your connection?]
Inference: 68.9% are influenced by the signal of tower networking as there are working group people who want to stay connected all the time while 31.1% people are not much influenced about this factor.
Outgoings call charges [10. Are you influenced by the following factors relating in your connection?]
Inference: 81.1% people are influenced by the factor that what they are paying for their outgoing calls while 18.9% are not influenced by this factor.
Price [11. Satisfaction about the particular cell phone service provider?]
Inference: 64.8% people are satisfied by the service they are getting with respect to the price while 35.2% people are not.
Performance [11. Satisfaction about the particular cell phone service provider ?]
14
Aware 84 68.9%
Unaware 38 31.1%
Aware 99
81.1%
Unaware
23
18.9%
Highly Satisfactory 79
64.8%
Non-Satisfacotry 43
35.2%
Highly Satisfactory
94 77%
Non-Satisfactory 28 23%

Inference: 77% people are happy with the performance of their network service providers depending upon the quality provided while 23% are not satisfied.
Customer Care Service [11. Satisfaction about the particular cell phone service provider?]
Inference: 71.3% of the people are happy with their customer care service which means that they are getting the feedback which is required while 28.7% are not.
Schemes [11. Satisfaction about the particular cell phone service provider?]
Inference: 63.1 % people are satisfied by the schemes which they are offered by various telecom companies while 36.9% are not.
Periodical Offers [11. Satisfaction about the particular cell phone service provider?]
Inference:53.3% of the people are satisfied by the periodical offers which are provided by which they enjoy some benefits over the time like roaming charges reduced at a reduced rate for a very loyal customer where as 46.7% are not satisfied.
12. What kind of problems occurs the most for which you need to contact customer care/service department of your service provider?
15
Highly Satisfactory 87
71.3%
Non-Satisfactory 35
28.7%
Highly Satisfactory 77
63.1%
Non-Satisfactory 45
36.9%
Highly Satisfactory 65
53.3%
Non-Satisfactory 57
46.7%
Inference: The most troubled factor for the people is activation/deactivation accounting 41%.
13. How long have you used the service of that company?
Inference: with 36.1% of the people using this service for 3.1 – 6 shows that they might continue with the service while 25.4% are happy with the service provided.
14. You would continue with the current service provider for the next
16
Billing related
13 10.7%
Activation/deactivation related
50 41%
Information about VAS’s 24 19.7%
Network problem 35 28.7%
Less than 1 year 11 9%
1 year - 3 years 36 29.5%
3.1 years - 6 years 44 36.1%
Greater than 6 years 31 25.4%

Inference: With 50% of the people stating that they would continue the service for more than 3 years shows the amount of satisfaction towards their network service providers.
15. You consider mobile as a?
Inference: whether the working group or non-working group everyone considers mobile as a necessity in today’s modern era as communication as become very easy for people.
17
6 months 20 16.4%
1 year 24 19.7%
3 years 16 13.1%
Over 3 years
61 50%
Necessity 113 92.6%
Status 4 3.3%
Luxury 5 4.1%

Findings:
On the basis of consumer preference, majority of the people prefer Vodafone. On the basis of occupation, the students are only used cell phones in more level. On the basis of family income, 13.9% of the respondents are using cell phones, which
are all get family income of less than 1 Lakh Rupees. Majority of the peoples are selecting the network service providers influenced by their
friends. Majority of the peoples are using prepaid scheme. On the basis of schemes at the time of the service, 82% of people are highly satisfied. 50% of the people are satisfied with their service providers and will continue for more
than 3 years. On the basis of consumer’s attitude, majority of the people state that cell phones are
necessity to all. 4.1% of the respondents are only states that cell phones are luxury.
Suggestions:
BSNL, Uninor, Tata indicom and Reliance should try to expand their customer’s network.
All the service providers should try to increase post-paid users. 41% of the people are unhappy with activation/deactivation services so they should
try to decrease the number of people unhappy with that service. Customers between 3.1 years – 6 years which is 36.1 % i.e the company should covert
these customers into loyal customers so that they are tied with them for a longer period of time.
There is a small gap in the satisfaction of periodical offers and the telecom companies should be offering such periodical offers which are more useful rather than just for name sake.
Conclusion:
This study attempts to find out the satisfaction of consumer regarding cell phone service providers.
18
This decade, most of the peoples using cell phones. So, service providers are increasing in more level. So service providers should overcome one another’s competition. So, it leads to adding new features, schemes, periodical offers to their service. So, the consumers get maximum benefit from their service provider. Now-a-days, cell phones are very necessity to all. Because, it’s giving safety to men, women and college students also by reaming in touch with each other.
19