Embed Size (px)
Citation preview
CONGESTION MANAGEMENT SYSTEM
PERFORMANCE MONITORING & EVALUATION PLAN
Accepted by the OMPO Technical Advisory Committee
on July 15, 2005
Updated December 2005
O A H U M E T R O P O L I T A N P L A N N I N G O R G A N I Z A T I O N

UPDATED DECEMBER 2005
CONGESTION MANAGEMENT SYSTEM
PERFORMANCE MONITORING & EVALUATION PLAN
Prepared by:
OAHU METROPOLITAN PLANNING ORGANIZATION
in association with
State of Hawaii Department of Transportation State of Hawaii Department of Business, Economic Development & Tourism
City and County of Honolulu Department of Transportation Services City and County of Honolulu Department of Planning and Permitting
The preparation of this document was financed in part through grants from the U.S. Department of Transportation, Federal Transit Administration and Federal Highway Administration, under Chapter 53 of 49 U.S.C. and 23 U.S.C. The
contents of this document do not necessarily reflect the official views of the U.S. Department of Transportation.
O A H U M E T R O P O L I T A N P L A N N I N G O R G A N I Z A T I O N

Performance Monitoring & Evaluation Plan Page i i
[This page intentionally left blank.]
Performance Monitoring & Evaluation Plan Page i i i
TABLE OF CONTENTS
Table of Contents .............................................................................................................................................iii Glossary of Acronyms.......................................................................................................................................v Background.........................................................................................................................................................1 Introduction........................................................................................................................................................1 System Definition ..............................................................................................................................................2 Definition of Congestion..................................................................................................................................2 Performance and Evaluation............................................................................................................................4
Criteria for Selection of Performance Measures .................................................................................................... 4 Travel Forecasting ....................................................................................................................................................... 4
Identification of Highway Performance Measures .......................................................................................6 1. Change in Volume-to-Capacity Ratio .......................................................................................................... 6 2. List of Congested Roadways ......................................................................................................................... 7 3. Transit Mode Share ........................................................................................................................................ 7 4. Vehicle Volume............................................................................................................................................... 8 5. Vehicle Miles Traveled by Facility Type...................................................................................................... 9 6. Vehicle Hours Traveled by Facility Type.................................................................................................... 9 7. Vehicle Hours of Delay by Facility Type .................................................................................................. 10
Identification of Transit Performance Measures.........................................................................................11 1. List of Congested Roadways ....................................................................................................................... 11 2. Transit Mode Share ...................................................................................................................................... 11 3. Transit Trips to Work .................................................................................................................................. 12 4. Vehicle Miles Traveled by Facility Type.................................................................................................... 12 5. Vehicle Hours Traveled by Facility Type.................................................................................................. 12 6. Vehicle Hours of Delay by Facility Type .................................................................................................. 12
CMS Point System ...........................................................................................................................................13 System Performance Reports .........................................................................................................................16 Conclusions.......................................................................................................................................................17

Performance Monitoring & Evaluation Plan Page iv
[This page intentionally left blank.]
Performance Monitoring & Evaluation Plan Page v
GLOSSARY OF ACRONYMS
CFR Code of Federal Regulations
CMS Congestion Management System
COG Council of Governments
DOT Department of Transportation
DTS City and County of Honolulu Department of Transportation Services
FY Fiscal Year
HDOT Hawaii Department of Transportation
ISTEA Intermodal Surface Transportation Efficiency Act
LOS Level of Service
MPO Metropolitan Planning Organization
OMPO Oahu Metropolitan Planning Organization
ORTP Oahu Regional Transportation Plan
RTP Regional Transportation Plan
SAFETEA-LU Safe, Accountable, Flexible, Efficient Transportation Equity Act: A Legacy for Users
SOV Single Occupancy Vehicle
TEA-21 Transportation Equity Act for the 21st Century
TIP Transportation Improvement Program
TMA Transportation Management Area
V/C Volume-to-Capacity
VHT Vehicle Hours Traveled
VMT Vehicle Miles Traveled

Performance Monitoring & Evaluation Plan Page vi
[This page intentionally left blank.]
Performance Monitoring & Evaluation Plan Page 1
BACKGROUND
Formal development and operation regulations for a Congestion Management System (CMS) began in 1991 with the federal Intermodal Surface Transportation Efficiency Act (ISTEA). ISTEA required both state departments of transportation and metropolitan planning organizations to implement a CMS; at the state level, five additional management systems (pavement, bridge, safety, public transportation, and intermodal) were also required.
In 1995, the National Highway System Designation Act made all of the management systems optional at the state level. However, the metropolitan planning provisions of ISTEA continued to require transportation management areas (TMAs) with a population of over 200,000 to maintain a CMS as part of their planning process. The Oahu TMA has a population over 200,000.
ISTEA’s successor, the Transportation Equity Act for the 21st Century (TEA-21), adopted in 1998, required a CMS. The Safe, Accountable, Flexible, Efficient Transportation Equity Act: A Legacy for Users (SAFETEA-LU), signed into law by the President in August 2005, continued this requirement in the metropolitan planning process.
The results of the CMS must be considered in the development of the TMA’s Regional Transportation Plan (RTP) and Transportation Improvement Program (TIP). Congestion management strategies are identified and evaluated through the CMS.
INTRODUCTION
The CMS for the Oahu Metropolitan Planning Organization (OMPO) identifies congested surface transportation facilities, evaluates projects proposed to mitigate congestion, and prioritizes these projects using quantifiable performance measures in order to assist decision-makers in selecting projects for inclusion in the TIP and Oahu Regional Transportation Plan (ORTP).
The Performance Monitoring and Evaluation Plan is the mechanism for collecting the data needed to quantify the performance measures and track congestion over time. This report will:
Describe the CMS network for Oahu;
Provide an overview of the OMPO travel forecasting models;
Define the performance measures to be used;
Identify the data to be collected that is associated with each performance measure;
Address the frequency and responsibilities of data collection;
Describe data analysis techniques; and
Performance Monitoring & Evaluation Plan Page 2
Explain the application of the performance measures.
The application of this report will be part of the Oahu TIP and ORTP processes.
SYSTEM DEFINITION
The existing CMS covers the island of Oahu, including all segments and corridors that experience congestion. Included are freeways, expressways, arterials, and collectors as defined by the regional functional classification system and included in the OMPO travel models.
DEFINITION OF CONGESTION
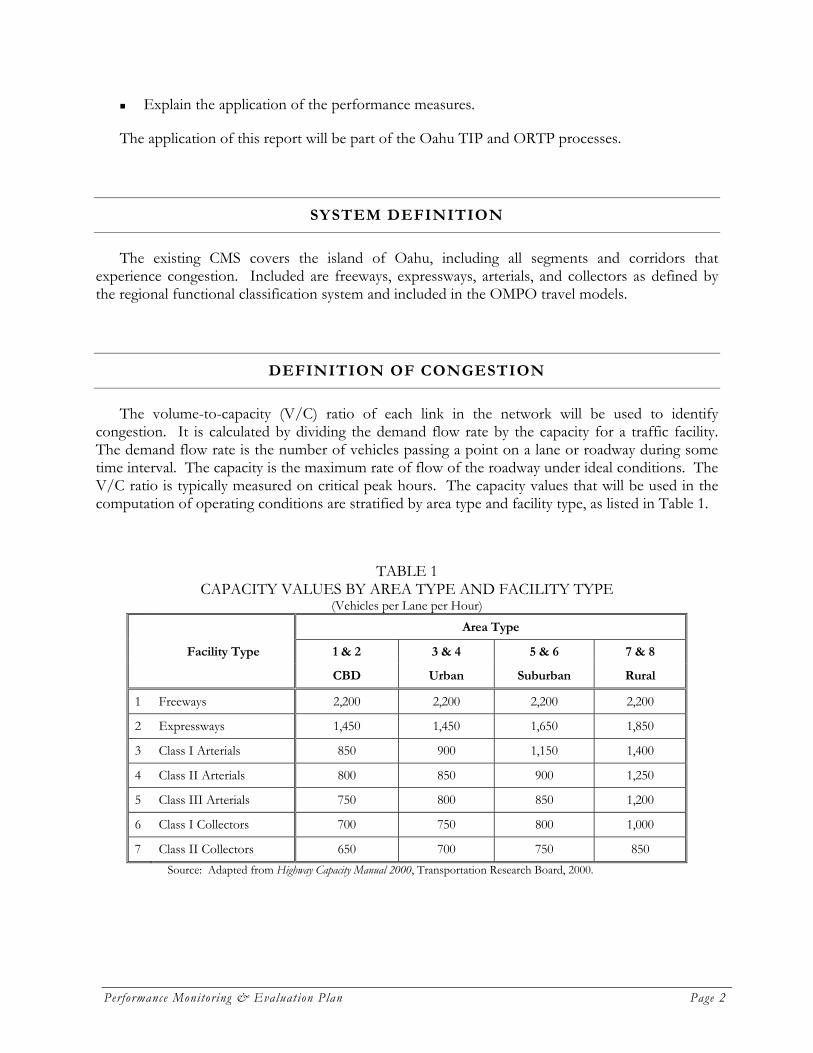
The volume-to-capacity (V/C) ratio of each link in the network will be used to identify congestion. It is calculated by dividing the demand flow rate by the capacity for a traffic facility. The demand flow rate is the number of vehicles passing a point on a lane or roadway during some time interval. The capacity is the maximum rate of flow of the roadway under ideal conditions. The V/C ratio is typically measured on critical peak hours. The capacity values that will be used in the computation of operating conditions are stratified by area type and facility type, as listed in Table 1.
TABLE 1 CAPACITY VALUES BY AREA TYPE AND FACILITY TYPE
(Vehicles per Lane per Hour) Area Type
Facility Type 1 & 2 3 & 4 5 & 6 7 & 8
CBD Urban Suburban Rural
1 Freeways 2,200 2,200 2,200 2,200
2 Expressways 1,450 1,450 1,650 1,850
3 Class I Arterials 850 900 1,150 1,400
4 Class II Arterials 800 850 900 1,250
5 Class III Arterials 750 800 850 1,200
6 Class I Collectors 700 750 800 1,000
7 Class II Collectors 650 700 750 850 Source: Adapted from Highway Capacity Manual 2000, Transportation Research Board, 2000.
Performance Monitoring & Evaluation Plan Page 3
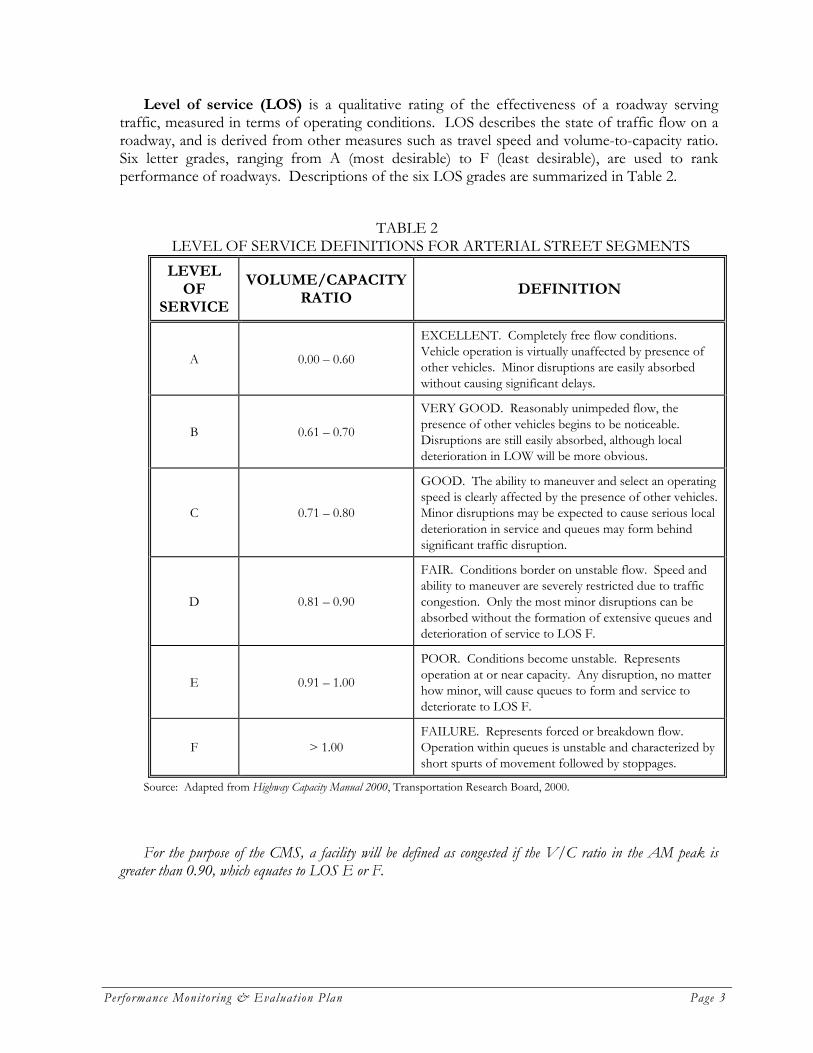
Level of service (LOS) is a qualitative rating of the effectiveness of a roadway serving traffic, measured in terms of operating conditions. LOS describes the state of traffic flow on a roadway, and is derived from other measures such as travel speed and volume-to-capacity ratio. Six letter grades, ranging from A (most desirable) to F (least desirable), are used to rank performance of roadways. Descriptions of the six LOS grades are summarized in Table 2.
TABLE 2
LEVEL OF SERVICE DEFINITIONS FOR ARTERIAL STREET SEGMENTS LEVEL
OF SERVICE
VOLUME/CAPACITY RATIO
DEFINITION
A 0.00 – 0.60
EXCELLENT. Completely free flow conditions. Vehicle operation is virtually unaffected by presence of other vehicles. Minor disruptions are easily absorbed without causing significant delays.
B 0.61 – 0.70
VERY GOOD. Reasonably unimpeded flow, the presence of other vehicles begins to be noticeable. Disruptions are still easily absorbed, although local deterioration in LOW will be more obvious.
C 0.71 – 0.80
GOOD. The ability to maneuver and select an operating speed is clearly affected by the presence of other vehicles. Minor disruptions may be expected to cause serious local deterioration in service and queues may form behind significant traffic disruption.
D 0.81 – 0.90
FAIR. Conditions border on unstable flow. Speed and ability to maneuver are severely restricted due to traffic congestion. Only the most minor disruptions can be absorbed without the formation of extensive queues and deterioration of service to LOS F.
E 0.91 – 1.00
POOR. Conditions become unstable. Represents operation at or near capacity. Any disruption, no matter how minor, will cause queues to form and service to deteriorate to LOS F.
F > 1.00 FAILURE. Represents forced or breakdown flow. Operation within queues is unstable and characterized by short spurts of movement followed by stoppages.
Source: Adapted from Highway Capacity Manual 2000, Transportation Research Board, 2000.
For the purpose of the CMS, a facility will be defined as congested if the V/C ratio in the AM peak is greater than 0.90, which equates to LOS E or F.
Performance Monitoring & Evaluation Plan Page 4
PERFORMANCE AND EVALUATION
There is a multitude of ways to measure surface transportation system performance. As identified in the OMPO CMS Procedures and Responsibilities Report (April 2001), some of the performance measures that are used by the Hawaii Department of Transportation (HDOT) and the City & County of Honolulu’s Department of Transportation Services (DTS) include LOS based on volume-to-capacity ratios, complaints and suggestions by the public, visual observation of traffic flow, traffic volumes, travel times, accident records, and t-test analyses.
For transit, DTS’ performance measures include load factors, schedule adherence, LOS, passengers/revenue vehicle mile, and passengers/revenue vehicle hours.
Additionally, for pedestrian and bicycle performance measures, HDOT and DTS currently use conflicts between pedestrian and bicycles, interaction with vehicles, and pathway/route utilization.
CRITERIA FOR SELECTION OF PERFORMANCE MEASURES
The CMS is a performance-based system to manage both existing and future transportation facilities through the use of travel demand and operational strategies where those actions are shown to be effective. The CMS is used to monitor and analyze the magnitude of congestion on a multi-modal transportation system and to plan and implement appropriate actions to alleviate congestion, thereby enhancing the performance of the overall transportation system. As such, one of the fundamental issues in the development of a CMS is the identification of performance measures to identify congestion and monitor the effects of implemented strategies in reducing congestion.
In an effort to select CMS performance measures that could be immediately incorporated into the OMPO metropolitan planning process, a number of issues were considered. As such, performance measures were selected that met the following criteria:
1) have data that are readily available and/or collectable;
2) can be forecast;
3) are meaningful in the context of objectives that are important to the region; and
4) reflect the resources available to OMPO and the participating agencies.
Each of the selected CMS performance measures can be forecast using travel models. A description of the OMPO travel models is found in the next section, followed by definitions and details about each of the CMS performance measures.
TRAVEL FORECASTING
The current OMPO travel models are a result of a model-update effort that began in 1993. An origin-destination survey was conducted in 1995 with the model calibrated in 1998. The
Performance Monitoring & Evaluation Plan Page 5
model is considered a “best practice” model and has been used in the 2025 update of the ORTP and as part of the TIP project evaluation for FYs 2004-2006 (including various amendments).
The OMPO travel models have adopted the general structure that has been used for several decades for urban travel models in the United States. All model sets that have been developed recently in several urban areas have continued to use this "sequential" approach to travel forecasting in which travel patterns are assumed to be the product of a sequence of individual decisions:
the number of trips that a household will make -- "trip generation;"
the destinations of these trips -- "trip distribution;"
the modes that will be used for travel -- "mode choice;" and
the paths on the network that the trips will take -- "network assignment."
Since the mid-1990’s, a rising chorus of criticism has highlighted what has been known for some time: typical applications of the sequential approach to travel forecasting have many undesirable features. Three general themes stand out in these critiques:
1) the sequential models do not use information consistently throughout;
2) important influences on travel patterns are absent from the models; and
3) important choices are ignored, or are represented very crudely.
All of these criticisms are legitimate when they are applied to the "typical" implementation of the sequential model set. However, they are not necessarily fatal flaws; rather, they serve to highlight the limitations of the state of transportation modeling practices and computer technology.
In practice, recently developed model sets and improved computer capabilities have, in fact, made significant strides in overcoming many of these limitations. While no single urban area currently has models that include all of these improvements, all of these improvements can be found in one or more of the recently developed model sets in the United States. Together, these new model sets demonstrate the full range of refinements that are being made to the sequential approach to travel forecasting. Consequently, the development of the OMPO procedures adopt these approaches, and add several additional improvements to overcome most of the limitations found in older sequential model sets.
The OMPO travel models can be used to address a wide variety of planning and analytical requirements, including project-level forecasting for highway improvements for both general traffic and high-occupancy vehicles, analysis of traffic impacts in subareas around significant new developments, analysis of strategies to manage transportation demand to relieve congestion and preserve air quality, consideration of major fixed-guideway transit investments, and planning for strategic bus improvements.
Performance Monitoring & Evaluation Plan Page 6
IDENTIFICATION OF HIGHWAY PERFORMANCE MEASURES
As a result of the criteria for the selection of performance measures previously described, the ability to use existing data through the OMPO travel models, and the meaningfulness of each in the context of objectives that are important to the region, seven performance measures have been identified to evaluate and prioritize proposed highway projects for their potential to improve overall system or general facility performance. These performance measures are as follows:
Change in V/C Ratio
List of Congested Roadways
Transit Mode Share
Vehicle Volume
Vehicle Miles Traveled
Vehicle Hours Traveled
Vehicle Hours of Delay
Each performance measure is described below.
1. CHANGE IN VOLUME-TO-CAPACITY RATIO
Definition
As discussed previously, the V/C ratio is a measurement of roadway travel performance.
Data Collection Techniques
Loop detectors and other vehicle detection systems are most commonly used to collect volume data. HDOT annually provides traffic counts to OMPO. Data with regard to forecasted V/C ratios will come directly from the OMPO travel forecasting model. LOS is computed based on the V/C ratios using Table 2.
Ability to Forecast
Travel models can forecast traffic volumes and calculate a V/C ratio. Travel volumes can be forecasted for roadway segments where actual volume data is not available or where traffic volumes under consistent conditions are needed for an entire region.
Applications
V/C ratios are used in the CMS of many other areas due to the widespread collection of volume data and the relative ease of forecasting, including Southern New Jersey Metropolitan
Performance Monitoring & Evaluation Plan Page 7
Planning Organization (MPO), New Jersey; Palm Beach MPO, Florida; etc. LOS is used as a CMS performance measure in Wichita Sedgwick County MPO, Kansas; Riverside County Transportation Commission, California; etc.
Traffic volumes can be forecasted. Annual data is also collected by HDOT and provided to OMPO annually. V/C ratios are most effective when dealing with a short time period, such as a 2-hour AM peak period.
OMPO is able to forecast V/C using its travel models. OMPO will use this performance measure to determine the project’s forecasted impact on the AM peak V/C ratio of the roadway facility on which the project is planned.
2. LIST OF CONGESTED ROADWAYS
Definition
A list of congested roadways (LOS E or F) based on the Year 2030 CMS baseline will be documented in the CMS State of Congestion on Oahu report.
Data Collection Techniques
The OMPO travel model will be used to calculate the V/C ratio for every link in the model highway network for the Year 2030. This data is used to identify locations of projected significant congestion during the two-hour AM peak period.
Ability to Forecast
Travel models can forecast traffic volumes and calculate a V/C ratio.
Applications
OMPO will use this performance measure to determine whether a proposed project will be located on a facility that is on the list of congested roadways, as identified in the CMS State of Congestion on Oahu report.
3. TRANSIT MODE SHARE
Definition
The federal regulations state that, “in both metropolitan and non-metropolitan areas, consideration needs to be given to strategies that reduce SOV [single occupant vehicle] travel and improve existing transportation efficiency” [23 CFR 500.109(a)]. Transit is a key component of the transportation system, and complements the roadway network. Transit mode share is designed to identify projects that increase or decrease the forecasted transit mode share.
Performance Monitoring & Evaluation Plan Page 8
Data Collection Techniques
Data with regard to mode share will come directly from the OMPO travel models as a result of the mode choice sequencing.
Ability to Forecast
OMPO’s travel model can forecast transit share.
Applications
Part of increasing mobility includes the broadening of mode choices for travelers. Transit mode share is used by other areas as a performance measure (e.g., Lane County Council of Governments (COG), Oregon; Atlanta Regional Commission, Georgia; etc.).
Transit share is able to be forecasted with the OMPO travel models. OMPO will use this performance measure to determine the project’s forecasted impact on the transit share of daily resident trips to work.
4. VEHICLE VOLUME
Definition
Vehicle volume is the number of vehicles that use a given roadway over a specified time period.
Data Collection Techniques
Loop detectors and other vehicle detection systems are most commonly used to collect vehicle volume data. HDOT annually provides volume counts to OMPO. Data with regard to forecasted vehicle volumes will come directly from the OMPO travel model.
Ability to Forecast
Travel models can forecast vehicle volumes and calculate projected volumes. Vehicle volumes can be forecasted for roadway segments where actual volume data is not available or where vehicle volumes under consistent conditions are needed for an entire region.
Applications
Vehicle volumes can be forecasted. Data for the current year is also currently collected by HDOT and provided to OMPO annually.
OMPO is able to forecast vehicle volume using its travel models. OMPO will use this performance measure to determine either the additional number of vehicles forecasted to use the upgraded existing facility or the number of vehicles forecasted to use the new facility in the AM peak.
Performance Monitoring & Evaluation Plan Page 9
5. VEHICLE MILES TRAVELED BY FACILITY TYPE
Definition
Vehicle miles traveled (VMT) is a unit to measure vehicle travel made by a private vehicle, such as an automobile, van, pickup truck, or motorcycle. Each mile traveled is counted as one vehicle mile regardless of the number of persons in the vehicle.
Data Collection Techniques
Volume data similar to that which is required to calculate V/C ratio is required for the calculation of VMT. Refer to the data collection techniques discussion for the V/C ratio.
Ability to Forecast
OMPO’s models can forecast VMT on a daily basis by facility type for the entire network.
Applications
Similar to V/C ratios, VMT is used in many CMS’ throughout the U.S. due to the widespread collection of volume data and the relative ease of forecasting. Existing traffic volumes are already collected by HDOT and provided to OMPO annually.
When VMT is used with vehicle hours traveled, an estimate of the average speed over the entire network can be ascertained. Used as part of a travel model, this can provide an indication of the relative effectiveness of transportation improvements.
OMPO is able to compute daily VMT by facility using the travel model. OMPO will use this performance measure to determine the project’s forecasted impact on the systemwide AM peak VMT.
6. VEHICLE HOURS TRAVELED BY FACILITY TYPE
Definition
Vehicle hours traveled (VHT) is a measurement of the total hours traveled by all vehicles. It is calculated by multiplying the number of vehicles times the travel time of those vehicles on a network or specific links. VHT is an indicator of how additional travel demand influences congestion in the system from a travel time standpoint. It is commonly used as a system-wide measurement of travel demand.
Data Collection Techniques
Volume data similar to that which is required to calculate V/C ratio is required for the calculation of VHT. Refer to the data collection techniques discussion for the V/C ratio.
Performance Monitoring & Evaluation Plan Page 10
Ability to Forecast
OMPO’s models can forecast VHT on a daily basis by facility type for the entire network.
Applications
Similar to V/C ratios, VHT is used in many CMS’ throughout the U.S. due to the widespread collection of volume data and the relative ease of forecasting. Some of the areas that use VHT include East West Gateway COG, St. Louis, Missouri and the South Jersey Transportation Planning Organization, New Jersey.
When VHT is used with VMT, an estimate of the average speed over the entire network can be ascertained. Used as part of a travel model, this can provide an indication of the relative effectiveness of transportation improvements.
Volume data is already collected by HDOT and provided to OMPO annually. OMPO is able to compute daily VMT and VHT using the travel models. OMPO will use this performance measure to determine the project’s forecasted impact on the systemwide AM peak VHT.
7. VEHICLE HOURS OF DELAY BY FACILITY TYPE
Definition
Vehicle hours of delay (VHD) is defined as the difference between vehicle hours traveled under congested conditions and vehicle hours of travel that would otherwise be expected under free flow conditions. Thus, VHD is calculated using travel times and travel speeds.
Data Collection Techniques
Data with regard to forecasted VHD will come directly from the OMPO travel models.
Ability to Forecast
OMPO’s models can forecast VHD on a daily basis by facility type for the entire network.
Applications
VHD is used as a performance measure in CMS’ throughout the U.S. (e.g., Tulsa TMA; Ohio DOT; etc.).
OMPO is able to forecast daily VHD using the travel models. OMPO will use this performance measure to determine the project’s forecasted impact on the systemwide AM peak VHD.
Performance Monitoring & Evaluation Plan Page 11
IDENTIFICATION OF TRANSIT PERFORMANCE MEASURES
Six performance measures have been identified to evaluate and prioritize proposed transit projects for their potential to improve overall system or general facility performance. Although the performance measures for transit projects are similar to those for highway projects, they cannot be compared directly with highway performance measures. The performance measures for transit projects are as follows:
List of Congested Roadways
Transit Mode Share
Transit Trips to Work
Vehicle Miles Traveled
Vehicle Hours Traveled
Vehicle Hours of Delay
Each performance measure is described below.
1. LIST OF CONGESTED ROADWAYS
Definition
As discussed earlier in the “Identification of Highway Performance Measures” section, a list of significantly congested roadways will be documented in the CMS State of Congestion on Oahu report.
Applications
The application of this performance measure is slightly different from that used for highway projects. OMPO will use this performance measure to determine whether the transit project is forecasted to decrease the AM peak vehicle volume on a facility that is on the list of congested roadways, as identified in the CMS State of Congestion on Oahu report.
2. TRANSIT MODE SHARE
This performance measure is the same as the performance measure for highway projects.
Performance Monitoring & Evaluation Plan Page 12
3. TRANSIT TRIPS TO WORK
Definition
Transit trips to work refers to the number of transit trips by residents with the purpose of going to work.
Data Collection Techniques
The OMPO travel model will be used to forecast transit trips to work.
Ability to Forecast
Travel models can forecast transit trips to work.
Applications
OMPO will use this performance measure to determine the project’s forecasted impact on the number of transit trips to work.
4. VEHICLE MILES TRAVELED BY FACILITY TYPE
This performance measure is the same as the performance measure for highway projects.
5. VEHICLE HOURS TRAVELED BY FACILITY TYPE
This performance measure is the same as the performance measure for highway projects.
6. VEHICLE HOURS OF DELAY BY FACILITY TYPE
This performance measure is the same as the performance measure for highway projects.
Performance Monitoring & Evaluation Plan Page 13
CMS POINT SYSTEM
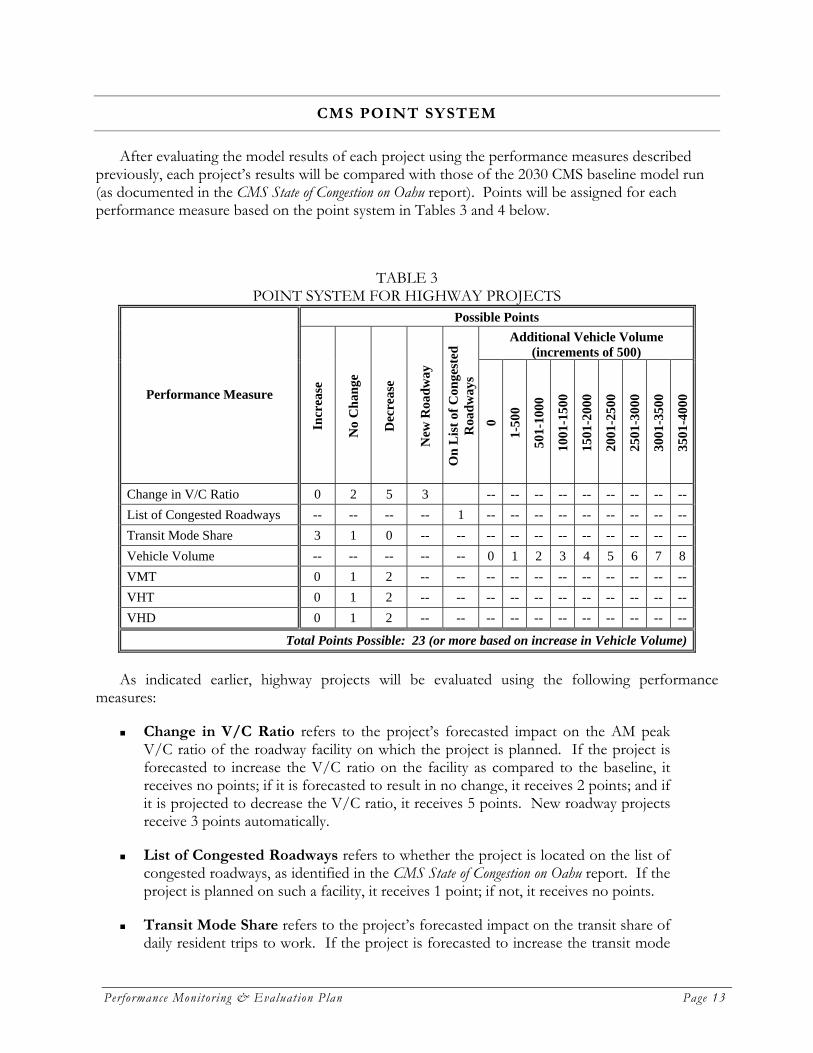
After evaluating the model results of each project using the performance measures described previously, each project’s results will be compared with those of the 2030 CMS baseline model run (as documented in the CMS State of Congestion on Oahu report). Points will be assigned for each performance measure based on the point system in Tables 3 and 4 below.
TABLE 3 POINT SYSTEM FOR HIGHWAY PROJECTS
Possible Points Additional Vehicle Volume
(increments of 500)
Performance Measure
Incr
ease
No
Cha
nge
Dec
reas
e
New
Roa
dway
On
Lis
t of C
onge
sted
R
oadw
ays
0
1-50
0
501-
1000
1001
-150
0
1501
-200
0
2001
-250
0
2501
-300
0
3001
-350
0
3501
-400
0
Change in V/C Ratio 0 2 5 3 -- -- -- -- -- -- -- -- --List of Congested Roadways -- -- -- -- 1 -- -- -- -- -- -- -- -- --Transit Mode Share 3 1 0 -- -- -- -- -- -- -- -- -- -- --Vehicle Volume -- -- -- -- -- 0 1 2 3 4 5 6 7 8 VMT 0 1 2 -- -- -- -- -- -- -- -- -- -- --VHT 0 1 2 -- -- -- -- -- -- -- -- -- -- --VHD 0 1 2 -- -- -- -- -- -- -- -- -- -- --
Total Points Possible: 23 (or more based on increase in Vehicle Volume)
As indicated earlier, highway projects will be evaluated using the following performance measures:
Change in V/C Ratio refers to the project’s forecasted impact on the AM peak V/C ratio of the roadway facility on which the project is planned. If the project is forecasted to increase the V/C ratio on the facility as compared to the baseline, it receives no points; if it is forecasted to result in no change, it receives 2 points; and if it is projected to decrease the V/C ratio, it receives 5 points. New roadway projects receive 3 points automatically.
List of Congested Roadways refers to whether the project is located on the list of congested roadways, as identified in the CMS State of Congestion on Oahu report. If the project is planned on such a facility, it receives 1 point; if not, it receives no points.
Transit Mode Share refers to the project’s forecasted impact on the transit share of daily resident trips to work. If the project is forecasted to increase the transit mode
Performance Monitoring & Evaluation Plan Page 14
share as compared to the baseline, it receives 3 points; if it is forecasted to result in no change, it receives 1 point; and if it is projected to decrease the transit mode share, it receives 0 points.
Vehicle Volume refers to either the additional number of vehicles forecasted to use the upgraded existing facility or the number of vehicles forecasted to use the new roadway facility in the AM peak. Points are assigned based on a sliding scale as indicated in the table above. Note that the number of points could increase in excess of what is displayed on the table depending upon the project’s forecasted vehicle volume on the facility.
VMT refers to the project’s forecasted impact on the systemwide AM peak VMT. If the project is forecasted to increase the VMT as compared to the baseline, it receives 0 points; if it is forecasted to result in no change, it receives 1 point; and if it is projected to decrease the VMT, it receives 2 points.
VHT refers to the project’s forecasted impact on the systemwide AM peak VHT. If the project is forecasted to increase the VHT as compared to the baseline, it receives 0 points; if it is forecasted to result in no change, it receives 1 point; and if it is projected to decrease the VHT, it receives 2 points.
VHD refers to the project’s forecasted impact on the systemwide AM peak VHD. If the project is forecasted to increase the VHD as compared to the baseline, it receives 0 points; if it is forecasted to result in no change, it receives 1 point; and if it is projected to decrease the VHD, it receives 2 points.
Performance Monitoring & Evaluation Plan Page 15
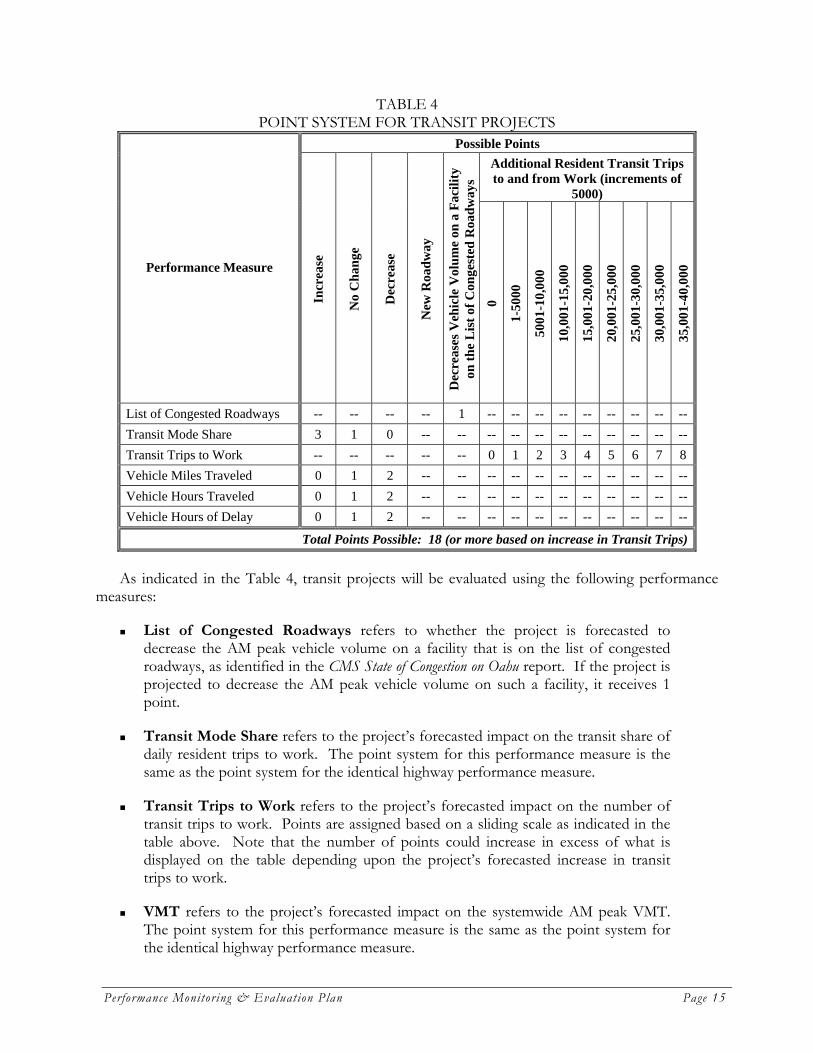
TABLE 4 POINT SYSTEM FOR TRANSIT PROJECTS
Possible Points Additional Resident Transit Trips to and from Work (increments of
5000)
Performance Measure
Incr
ease
No
Cha
nge
Dec
reas
e
New
Roa
dway
Dec
reas
es V
ehic
le V
olum
e on
a F
acili
ty
on th
e L
ist o
f Con
gest
ed R
oadw
ays
0
1-50
00
5001
-10,
000
10,0
01-1
5,00
0
15,0
01-2
0,00
0
20,0
01-2
5,00
0
25,0
01-3
0,00
0
30,0
01-3
5,00
0
35,0
01-4
0,00
0
List of Congested Roadways -- -- -- -- 1 -- -- -- -- -- -- -- -- --Transit Mode Share 3 1 0 -- -- -- -- -- -- -- -- -- -- --Transit Trips to Work -- -- -- -- -- 0 1 2 3 4 5 6 7 8 Vehicle Miles Traveled 0 1 2 -- -- -- -- -- -- -- -- -- -- --Vehicle Hours Traveled 0 1 2 -- -- -- -- -- -- -- -- -- -- --Vehicle Hours of Delay 0 1 2 -- -- -- -- -- -- -- -- -- -- --
Total Points Possible: 18 (or more based on increase in Transit Trips)
As indicated in the Table 4, transit projects will be evaluated using the following performance measures:
List of Congested Roadways refers to whether the project is forecasted to decrease the AM peak vehicle volume on a facility that is on the list of congested roadways, as identified in the CMS State of Congestion on Oahu report. If the project is projected to decrease the AM peak vehicle volume on such a facility, it receives 1 point.
Transit Mode Share refers to the project’s forecasted impact on the transit share of daily resident trips to work. The point system for this performance measure is the same as the point system for the identical highway performance measure.
Transit Trips to Work refers to the project’s forecasted impact on the number of transit trips to work. Points are assigned based on a sliding scale as indicated in the table above. Note that the number of points could increase in excess of what is displayed on the table depending upon the project’s forecasted increase in transit trips to work.
VMT refers to the project’s forecasted impact on the systemwide AM peak VMT. The point system for this performance measure is the same as the point system for the identical highway performance measure.
Performance Monitoring & Evaluation Plan Page 16
VHT refers to the project’s forecasted impact on the systemwide AM peak VHT. The point system for this performance measure is the same as the point system for the identical highway performance measure.
VHD refers to the project’s forecasted impact on the systemwide AM peak VHD. The point system for this performance measure is the same as the point system for the identical highway performance measure.
Note that although the transit performance measures are similar to those for highway projects, the points received for individual highway projects should not be compared directly with points received for individual transit projects.
SYSTEM PERFORMANCE REPORTS
The CMS for Oahu supports the long-term transportation goals and objectives defined in the ORTP and assists in the region’s competitive TIP project evaluation and selection process. It also provides an important feedback function to both the long-range ORTP and the short-range TIP. In addition, the CMS helps to identify system deficiencies and potential solutions through the establishment of a set of performance measures, the monitoring and reporting on system performance, and evaluating the effectiveness of implemented strategies. Note that although the transit performance measures are similar to those for highway projects, the points received for individual highway projects should not be compared directly with points received for individual transit projects.
Output from the CMS could influence changes to regional transportation policies, identify potential congestion management strategies for implementation, or highlight a corridor or sub-area for more detailed analysis to determine the best mix of strategies. This information is provided in a series of reports, listed below.
State of Congestion on Oahu
This report (i.e., CMS Performance Monitoring & Evaluation Plan) identified performance measures to identify congestion and evaluate projects as part of the CMS. These performance measures will be applied to a Year 2030 baseline system, and the results will be documented in the State of Congestion on Oahu report – a CMS baseline system performance report.
The State of Congestion on Oahu report will:
Provide an overview of the socioeconomic conditions and travel forecasts on Oahu;
Apply the performance measures to the Year 2000 and Year 2030 baseline system; and
Identify the roadways that are forecasted to have significant congestion in the Year 2030 AM peak.
Performance Monitoring & Evaluation Plan Page 17
CMS Analysis of Proposed TIP and ORTP Projects
The CMS reports for both proposed TIP projects and proposed ORTP projects will evaluate and prioritize proposed highway and transit projects for their potential to improve overall system or general facility performance.
The CMS reports for proposed TIP and ORTP projects will:
Identify each of the projects proposed for inclusion into the TIP/ORTP;
Evaluate each of the congestion-related projects, as appropriate, using the OMPO travel forecasting model;
Compare the results of each project with the baseline, as identified in the CMS State of Congestion on Oahu report.
Rank each project based on the points assigned to it using quantifiable performance measures, as defined in this report (i.e., CMS Performance Monitoring & Evaluation Plan); and
Detail how the ranked projects were incorporated into the metropolitan planning process in order to assist decision-makers in selecting projects for inclusion into the TIP/ORTP.
CONCLUSIONS
Performance measures are a central component of the CMS. Federal regulations require that performance measures provide the basis for identifying the extent, severity, and specific locations of congestion problems on a system-wide basis. Data collected for performance measures can be used to track changes in congestion over time, to identify potential causes of congestion and congestion management strategies, and to evaluate the effectiveness of strategies which are implemented.
The performance measures identified in this report will be used to identify deficiencies in the CMS network and evaluate proposed congestion relief projects for inclusion in the OMPO TIP and ORTP. Note that although the transit performance measures are similar to those for highway projects, the points received for individual highway projects should not be compared directly with points received for individual transit projects.
Future expansion of the CMS will investigate additional, and reevaluate current, performance measures to support continued evaluation of Oahu’s transportation system.

This report was funded in part through grants from the Federal Highway Administration and Federal Transit Administration, U.S. Department of Transportation. The views and opinions of the agency expressed herein do not
necessarily state or reflect those of the U. S. Department of Transportation.