Embed Size (px)
Citation preview

International Journal of Smart Electrical Engineering, Vol.2, No.1, Winter 2013 ISSN: 2251-9246
23
Congestion Management in Power Systems Via Intelligent
Method
S.A.Hashemi Zadeh 1, A.A.Gharaveisi
2, GH.Shahgholian
3
1 Department of electrical engineering, Islamic Azad University, Rafsanjan, Iran, [email protected] 2 Assistant, of Control Engineering, Department of electrical engineering, Shahid bahonar University, Kerman, Iran, [email protected]
3 Associate, of Electrical Engineering, Department of electrical engineering, Islamic Azad University, Najaf abad, Iran, [email protected]
Abstract
In the deregulated power systems, transmission congestion is one of the significant and main problems of the electrical
networks which can cause incremental cost in the energy. This problem has resulted to new challenging issues in different parts of
power systems which there was not in the traditional systems or at least had very little importance. Transmission congestion
happens when the maximum available power transmission capacity is lower than the consumption side. As congestion happens,
the system power losses are increased which can cause problem in the voltage constraints. Therefore, this paper proposes a new
method to handle the optimal management and control of congestion problem by the use of distributed generations (DGs). In this
regard, the optimal size and location of DGs are investigated using the powerful bacteria foraging algorithm (BFA) as a new
intelligence-based optimization technique to solve the congestion problem on the three IEEE 14-bus, 30-bus and 57-bus test
systems. The simulation results show the high speed, fast convergence and accurate performance of the proposed algorithm to
solve the congestion problem in the system.
Keywords: Bactria foraging algorithm, Power losses, Congestion management, Distributed generations (DGs).
© 2013 IAUCTB-IJSEE Science. All rights reserved
1. Introduction
Nowadays, as the result of recent growths in the
electrical power consumption part, deregulation and
movement of power systems from traditional structure
to the competitive environment (electricity market) and
economical and environmental problems associated
with the large power stations, DGs have found a
significant role in the new power systems. According to
the recent report by CIGRE, the amounts of power
produced by DGs in the Denmark and Netherlands are
37% and 40%, respectively. Recently, the DG usage is
widely increased which along with their many benefits,
releasing the power market in Europe is one of the main
reasons of its popularity. It is predicted that after Kyoto
contract among all countries to support the green
energy, the utilization of these kinds of power sources
to produce electrical power would be increased more
than before. However, the key issue is that utilization of
DGs in any circumstances cannot yield suitable results.
The wrong allocation and sizing of DGs can increase
the total power losses in the system. the congestion
management in the power system is investigated by the
genetic algorithm (GA) [1]. wind turbines (WTs) are
utilized to solve the congestion problem in the system
operation[2]-[3]. the particle swarm optimization (PSO)
algorithm is used to handle the complex and
sophisticated congestion problem with the purpose of
cost minimization, suitably[4]. the power sensitivity to
the line reactance is employed as a criterion to reduce
pp.23:31
International Journal of Smart Electrical Engineering, Vol.2, No.1, Winter 2013 ISSN: 2251-9246
24
the congestion in the system [5]. TCSC and SVC are
utilized to increase the security margin and congestion
concurrently in [6]. In the area of long term planning,
the instruction of new power stations as well as
transmission system planning are proposed as proper
methods to solve the congestion problem [7]. Since the
operational cost minimization considering the
congestion is a complex problem. PSO algorithm as a
powerful optimization technique is utilized [8].
Congestion management in the transmission system
considering the network voltage security is investigated
in [9]. the DG sizing and allocation is implemented
using LMP and MIP [10].
2. Explaining DG definition
Distributed generation (DG) is generally defined as
power production locally at the consumption place but
sometimes it is defined as technologies which include
the renewable power sources. The most general aspect
of DGs is that neglecting the process of power
production, the capacities of DGs are small and are
connected to the network directly. According to the
international energy agency (IEA), DG is defin ed as
the power source which supplies the consumer energy
on-site and help network in electrical power services.
From GIGRE point view, DG is a power source which
has the bellow characteristics: is not constructed
centralized, its dispatching is not implemented
centralized, its size is usually lower that 50 MW to 100
MW. Considering DGs in the power system can have
many benefits such as high power quality, voltage
profile enhancement, loss reduction, reducing peak
load shedding, increasing the system reliability,
reducing THD and line congestion minimization. In
addition to the above mentioned benefits, the small size
of these kinds of power sources makes it possible to
install it in a very short time at the specific place.
Distributed generations can be divided into 4 main
types:
The first type can just produce and supply active
power which photovoltaics belong to this category.
Photovoltaics just produce active power which enters
directly to the battery to be stored. Therefore, it can
just produce active power.
The second type can just produce reactive power.
Synchronous condensers belong to this category.
Synchronous condenser is a synchronous machine
which works at no-load. It is connected to the network
to improve its condition by producing or consuming
reactive power through exciting control.
The third type can produce both of active and
reactive components. WTs are in this category which
gets use of induction motors to produce electricity. Gas
turbines and diesel generators are other examples of
this group.
The forth type is bus voltage regulator. Here, the
DG unit along with the active power, it can produce or
consume reactive power to regulate buts voltage in the
system.
This paper gets use of the third type which can produce
both of active and reactive powers.
3. Congestion definition and its roots
Congestion in definition means to employ the
transmission system over the determined operational
limitations. In other words, when the sudden changes
in the output power generation of at least one generator
in the network, transmission line disruption or load
increase cause malfunction in the operation of the
power system, the network would experience
congestion.
4. Objective function and the constraints
The objective function and the relevant constraints
are shown below:
The congestion in a line is evaluated as follows:
(1)
Where is the power flow between the two
buses of i and j and is the power flow between the
two buses of i and j. The objective function of the
problem is then formulated as follows:
‖
‖
(2)
Also, the power loss after using DG in the system is
reduced. The voltage and power constraints are shown
from Eq. 2 to Eq. 7 as follows:
min mzxi i iV V V (2)
min maxDG DG DGQ Q Q
(3)
min maxDG DG DGP P P (4)
min maxi ig gi gQ Q Q (5)
min maxi ig gi gP P P (6)
( , )
( , ) 1
m
loss line i j
line i j
P P
(7)
Where Vi is the voltage of ith
bus; giQ and
giP are the
reactive and active power produced at ith
bus; DGQ and
DGP are the active and reactive power produced by
International Journal of Smart Electrical Engineering, Vol.2, No.1, Winter 2013 ISSN: 2251-9246
25
DG; ).( jilineP and
max).( jilineP are the active power flow
between ith
and jth
bus and the maximum active power
flow between ith
and jth
respectively and lossP is the
power loss.
4.1. The proposed method
In this paper, a new method is proposed to handle
the management and control of congestion problem as
well as to find the optimal place and size of DGs using
bacteria foraging algorithm (BFA). The simulations are
implemented in the MATLAB software to minimize
the objective function.
5. Bactria Foraging Algorithm (BFA)
Natural selection tends to eliminate animals
with poor foraging strategies and favor the propagation
of genes of those animals that have successful foraging
strategies. The Escherichia coli (E. coli) bacteria that
are present in our intestines, also undergo this foraging
strategies. The social foraging behaviour of E. coli
bacteria has been used to solve optimization problems.
The optimization in BFA comprises the following
process: chemotaxis, swarming, reproduction,
elimination and dispersal. The chemotaxis is the
activity that bacteria gathering to nutrient-rich area
naturally. The characteristic of E. coli bacteria is: the
diameter is 1µm, the length is 2µm, under appropriate
conditions can reproduce (split) in 20 min. The move
of the E. coli is done with flagellum [16]. An E. coli
bacterium alternates between running and tumbling.
5.1. Chemotaxis step
The process in the control system is achieved
through Swimming and tumbling via flagellum. To
represent a tumble, a unit length random direction,
Say , this will be used to define the direction of
movement after a tumble, then:
Where is the position of the ith bacterium
at jth chemotaxis step, kth reproduction step and lth
elimination and dispersal step. is the size of step
taken in the random direction that specified by the
tumble (run length unit). If the new position of
bacterium is better than the old position,
then the bacterium will keep taking successive step in
that direction. The number of iteration chemotaxis step
is NC. And the maximum number of permissible
successive steps is Ns.
5.2. Swarming step
The bacteria in times of stresses release attractants
to signal bacteria to swarm together. It however also
releases a repellant to signal others to be at a minimum
distance from it. Thus all of them will have a cell to
cell attraction via attractant and cell to cell repulsion
via repellant. The mathematical representation for
swarming can be represented by:
∑
∑ [ ( ∑ ( )
)]
∑ [ ( ∑ ( )
)]
Where :
dattract: depth of the attractant
wattract: measure of the width of the attractant
hrepellant: height of the repellant effect
wrepellant: measure of the width of the repellant
p: number of parameters to be optimized
S : total number of bacteria
Jcc: the cost function to be added to the actual cost
function to be minimized, to present a time varying
cost function.
5.3. Reproduction
After NC chemotaxis step, a reproductive step is
occurs. The fitness of bacteria is calculated, that is,
during all chemotaxis steps:
∑
Then this fitness is sorted in ascending order. The
least healthy bacteria die and the other bacteria, each
bacterium split into two bacteria, thus the size of the
population is constant.
5.4. Elimination and Dispersal:
The chemotaxis step provides a basis for local
search, and the productive step speeds the convergence.
While to a large extent, only chemotaxis and
reproduction are not enough for global optima
searching. Then an elimination and dispersal event is
necessary.
For each elimination and dispersal event each
bacterium is eliminated with a probability Ped, and
dispersed them to a new environment. The selection of
Ped, play an important role in convergence of the
algorithm.
International Journal of Smart Electrical Engineering, Vol.2, No.1, Winter 2013 ISSN: 2251-9246
26
If Ped is large, the algorithm can degrade to random
exhaustive search. If however, it is chosen
appropriately, it can help the algorithm jump out of
local optima and into a global optimum.
5.5. Pseudo code for BFA:
[step1]: Initialization
1. p: number of parameter that be optimized
2. S: the total number of bacteria
3. NC, Nre, Ned: the number of chemotaxis steps, the
number of reproduction steps, the number of
elimination and dispersal events, respectively.
4. Ns: the maximum number of permissible successive
steps
5. The values of : dattract, wattract, hrepellant, wrepellant
6. Ped: the probability of elimination and dispersal
event
7. C(i) : the step size
[step2]: Elimination and dispersal loop: l=l+1
[step3]: Reproduction loop: k=k+1
[step4]: chemotaxis loop: j=j+1
[a]. for i = 1,2,…,N take a chemotaxis step for
each bacterium i as follows:
[b]. compute fitness function, Let
[c]. let to save this value since
we may find a better cost via a run.
[d]. Tumble: generate a random vector
that
[e]. Move: Let
√
[f]. compute J(i,j+1,k,l) and let
[g]. swim
i) Let m = 0(counter for swim length)
ii) While m<Ns
● Let m=m+1
● If J(i,j+1,k,l) < Jlast (if doing better), Let
Jlast=J(i,j+1,k,l) and
√
● Else let m = Ns
[h]. Go to next bacterium (i+1) if i ≠ N
[step5]. If j<NC, go to step 3.
[step6]. Reproduction
[a]. for the given k and l, and for each i =
1,2,…,N , Let
∑
Sort this fitness in order of ascending.
[b]. The Sr bacteria with the highest Jhealth values
die, the remaining Sr bacteria with the best values
split
[step7]. If k < Nre, go to step 3.
[step8]. Elimination and dispersal
For i=1,2,…,N, with probability Ped, eliminate
and disperse each bacterium, and this result in keeping
the number of bacteria in the population constant.
To do this, if a bacterium is eliminated, simply
one to a random location on the optimization domain.
If l< Ned, then go to step 2; otherwise END.
6. Simulation Results
The proposed method to solve the congestion
problem as well as to find the optimal place and size of
DGs is based on BFA. The 14-bus, 30-bus and 57-bus
IEEE test systems are utilized to examine the method.
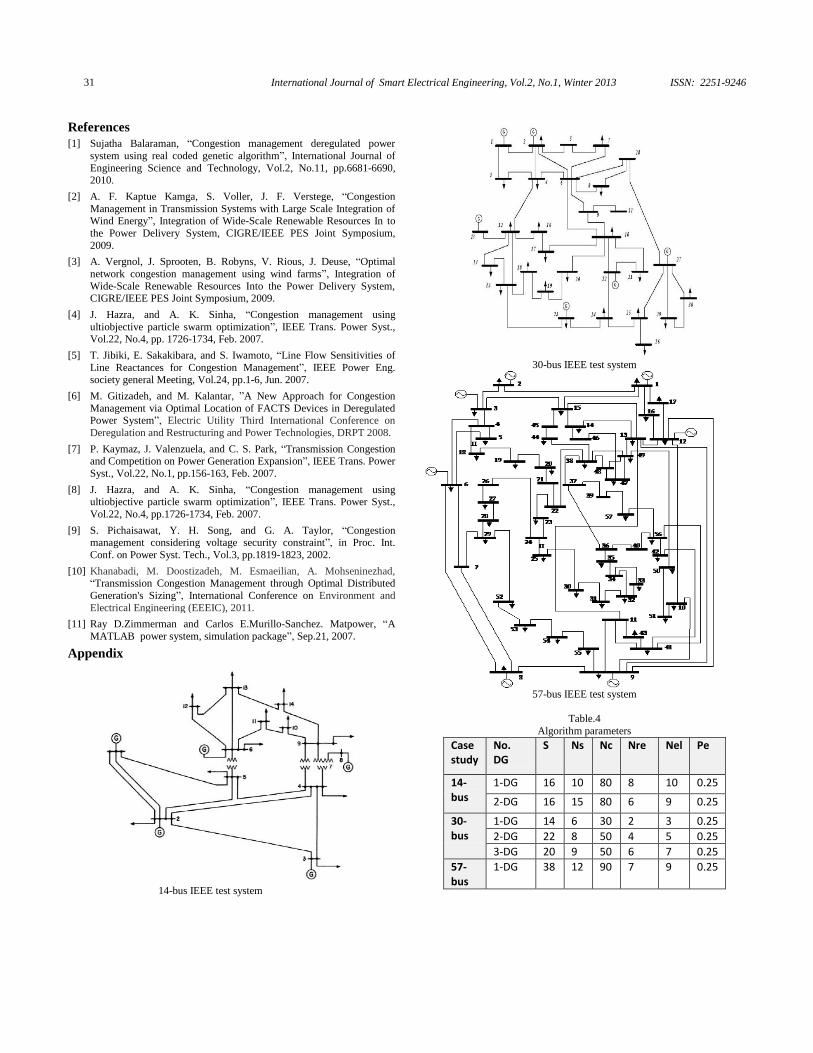
The complete network data can be found in [11]. The
network diagrams of the 14-bus, 30-bus and 57-bus
IEEE test systems are shown in the appendix. The 14-
bus test system has 20 lines, 5 generators, 11 loads; the
30-bus test system has 41 lines, 6 generators, 20 loads
and the 57-bus test system has 80 lines, 7 generators,
42 loads. The output active and reactive powers for
DGs are supposed to be in the range of 5 MW to 50
MW and -5 MVar to 10 MVar, respectively. This
limitation belongs the DGs with the type of gas turbine.
At first, one DG is placed in the system and the results
are investigated. Then 2 and 3 DGs are placed and the
results are again checked. If the power flow in a line is
more than 80% of its nominal capacity it is supposed to
be in congestion. In the 14-bus IEEE test system, line 1
(between buses 1-2) has the most congestion with the
value of 82.5% (evaluated by Eq. 1). In Eq. 6, the
nominal capacity of line 6 is 190 MW which after load
flow it is 156.8338 MW. According to Eq. 6, since the
value of 82.5% is more than 80% as the criterion, line 1
is passing power more than its capacity and is supposed
to be in congestion. In the 30-bus test system, a 5%
increase in the loads would cause line 10 (line between
the two buses of 6 and 8) to experience congestion with
the value of 82.23% which is calculated in Eq. 7. Eq. 8
is for the 57-bus test system. In Eq. 7, the nominal
power of line 10 is supposed to be 32 MW which after
load flow it carries 26.31 MW which means 82.23 % or
congestion situation. Similar analysis is implemented
for the other lines. In the 57-bus test system, all loads
are increased 8 % and the nominal power flow for all
International Journal of Smart Electrical Engineering, Vol.2, No.1, Winter 2013 ISSN: 2251-9246
27
lines is supposed as 225 MW. In this situation, the
system is in congestion and line 15 has the maximum
congestion by 82.88% which is shown in Eq. 8. In Eq.
8, the nominal capacity of the line 15 (between the
buses 1 and 15) is supposed 225 MW which after load
flow the power flow of this line is 186.49 MW.
According to Eq. 8, since the value of 82.88% is more
than 80% so line 15 is in congestion. Now, it is time to
get use of DG and BFA to solve the congestion
problem in the network. After that the algorithm
searching process is finished, three values indicating
the bus number, the active power value and the reactive
power value are shown in the output. The results are
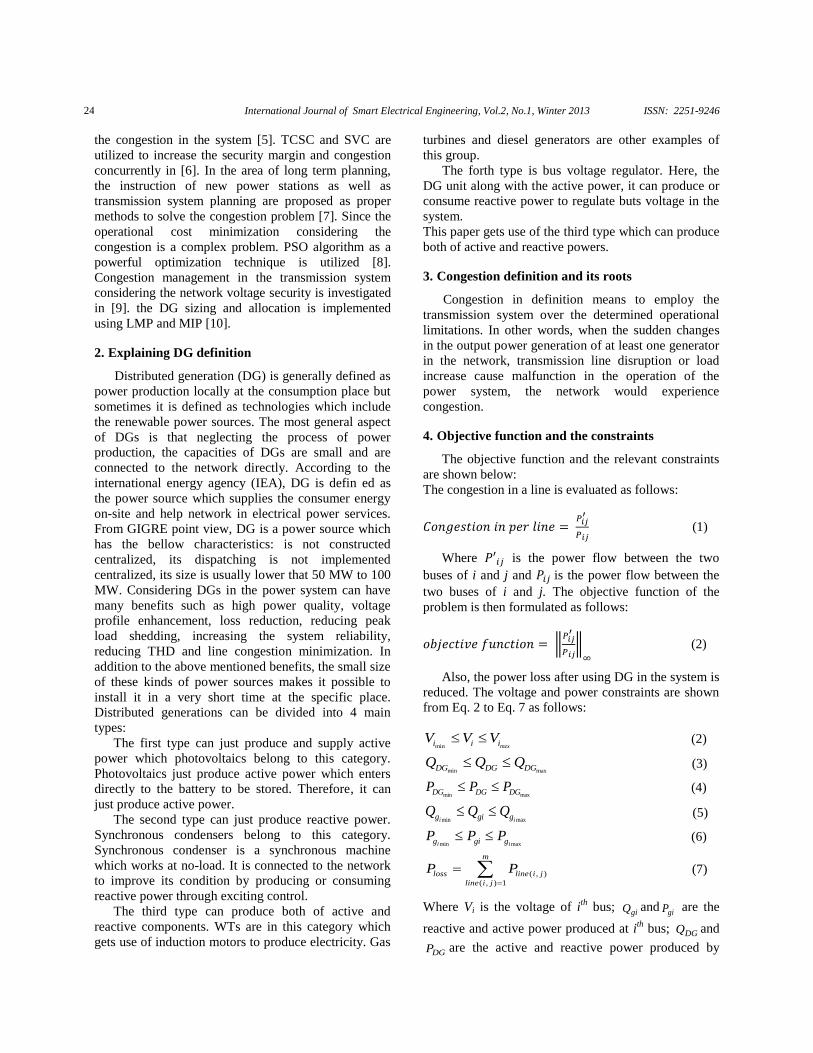
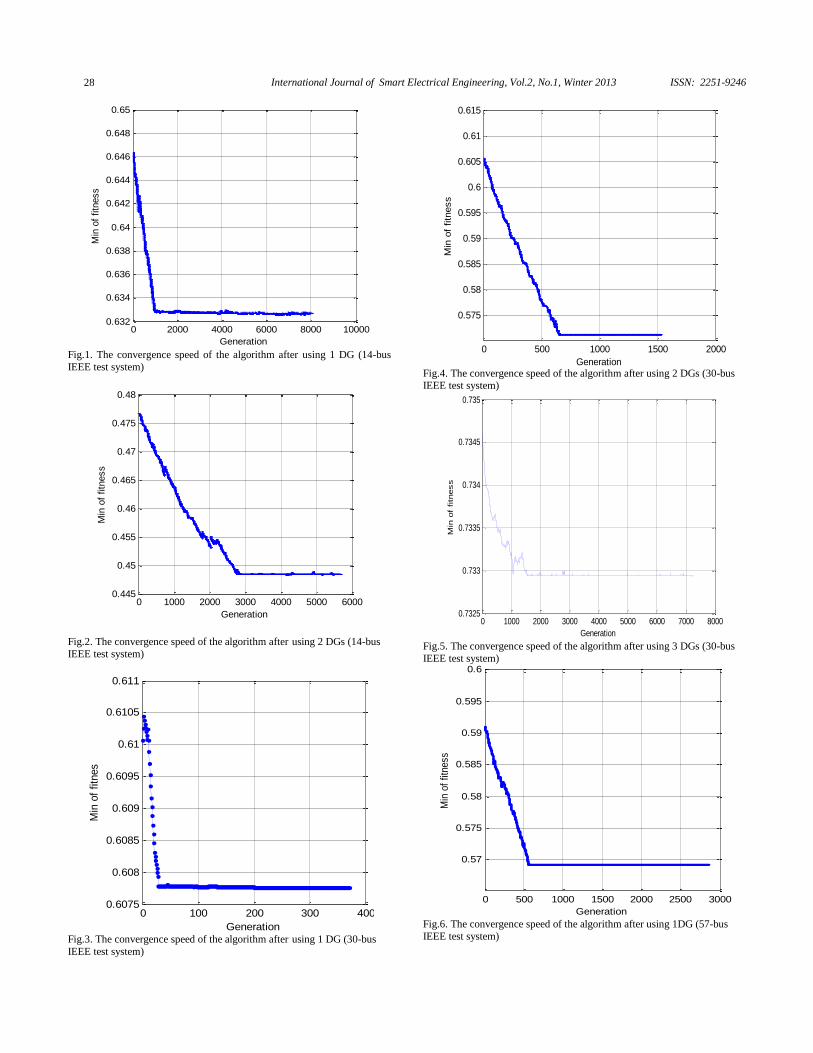
shown in Table.1. Fig.1 shows the parameter
convergence. The algorithm parameters are shown in
appendix.
Congestion in line number 1 = %54.82100190
8338.156 (6)
Congestion in line number 10 = %23.8210032
31.26 (7)
Congestion in line number 15 = %88.82100225
49.186 (8)
According to the equation 6,7 and 8, there are 2.54%,
2.23% and 2.88% congestion in the 14-bus, 30-bus and
57-bus test systems, respectively. This congestion is as
the result of malfunction process in the network. If this
congestion is not solved in a short time, it will
disconnect the congestion line. If the problem is not
solved again, it will disconnect the other lines too. This
process will continue to result in islanding. In this
paper, the congestion problem is detected at the first
moments and therefore, the system would be kept safe.
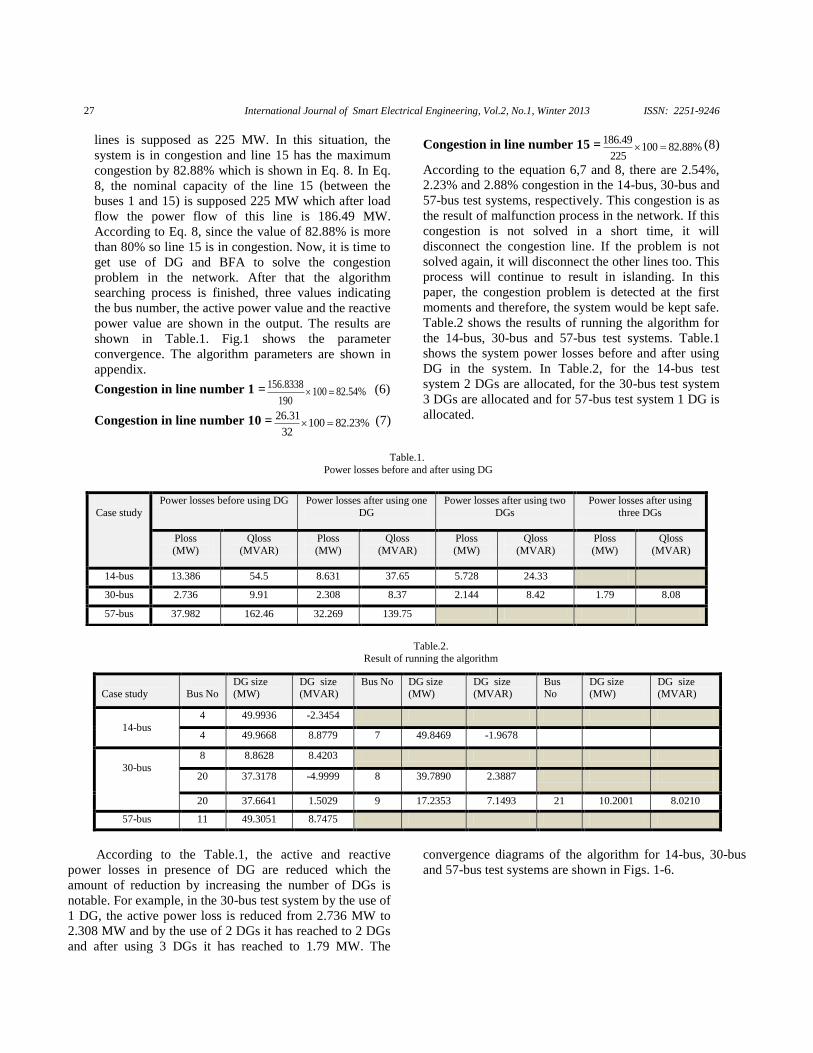
Table.2 shows the results of running the algorithm for
the 14-bus, 30-bus and 57-bus test systems. Table.1
shows the system power losses before and after using
DG in the system. In Table.2, for the 14-bus test
system 2 DGs are allocated, for the 30-bus test system
3 DGs are allocated and for 57-bus test system 1 DG is
allocated.
Table.1.
Power losses before and after using DG
Table.2.
Result of running the algorithm
Case study
Bus No
DG size (MW)
DG size (MVAR)
Bus No DG size (MW)
DG size (MVAR)
Bus No
DG size (MW)
DG size (MVAR)
14-bus
4 49.9936 -2.3454
4 49.9668 8.8779 7 49.8469 -1.9678
30-bus
8 8.8628 8.4203
20 37.3178 -4.9999 8 39.7890 2.3887
20 37.6641 1.5029 9 17.2353 7.1493 21 10.2001 8.0210
57-bus 11 49.3051 8.7475
According to the Table.1, the active and reactive
power losses in presence of DG are reduced which the
amount of reduction by increasing the number of DGs is
notable. For example, in the 30-bus test system by the use of
1 DG, the active power loss is reduced from 2.736 MW to
2.308 MW and by the use of 2 DGs it has reached to 2 DGs
and after using 3 DGs it has reached to 1.79 MW. The
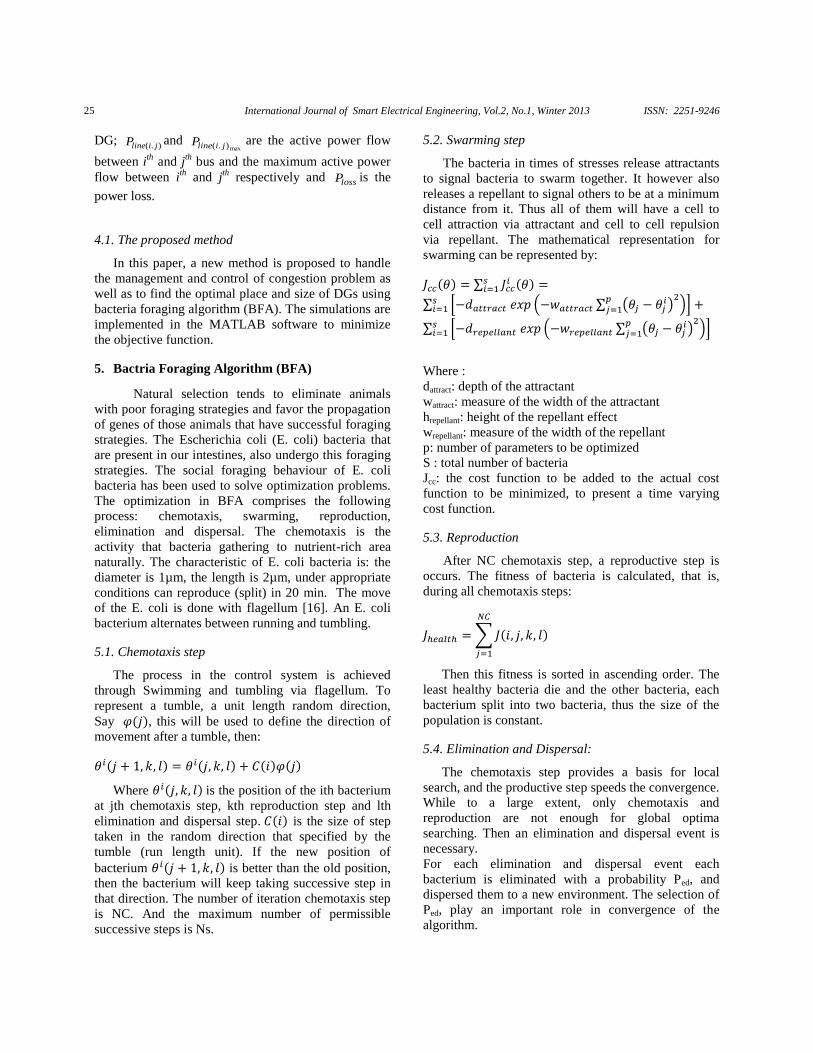
convergence diagrams of the algorithm for 14-bus, 30-bus
and 57-bus test systems are shown in Figs. 1-6.
Case study
Power losses before using DG Power losses after using one
DG
Power losses after using two
DGs
Power losses after using
three DGs
Ploss
(MW)
Qloss
(MVAR)
Ploss
(MW)
Qloss
(MVAR)
Ploss
(MW)
Qloss
(MVAR)
Ploss
(MW)
Qloss
(MVAR)
14-bus 13.386 54.5 8.631 37.65 5.728 24.33
30-bus 2.736 9.91 2.308 8.37 2.144 8.42 1.79 8.08
57-bus 37.982 162.46 32.269 139.75
International Journal of Smart Electrical Engineering, Vol.2, No.1, Winter 2013 ISSN: 2251-9246
28
Fig.1. The convergence speed of the algorithm after using 1 DG (14-bus
IEEE test system)
Fig.2. The convergence speed of the algorithm after using 2 DGs (14-bus
IEEE test system)
Fig.3. The convergence speed of the algorithm after using 1 DG (30-bus
IEEE test system)
Fig.4. The convergence speed of the algorithm after using 2 DGs (30-bus IEEE test system)
Fig.5. The convergence speed of the algorithm after using 3 DGs (30-bus
IEEE test system)
Fig.6. The convergence speed of the algorithm after using 1DG (57-bus
IEEE test system)
0 2000 4000 6000 8000 100000.632
0.634
0.636
0.638
0.64
0.642
0.644
0.646
0.648
0.65
Min
of
fitn
ess
Generation
0 1000 2000 3000 4000 5000 60000.445
0.45
0.455
0.46
0.465
0.47
0.475
0.48
Generation
Min
of
fitn
ess
0 100 200 300 4000.6075
0.608
0.6085
0.609
0.6095
0.61
0.6105
0.611
Generation
Min
of
fitn
es
0 500 1000 1500 2000
0.575
0.58
0.585
0.59
0.595
0.6
0.605
0.61
0.615
Generation
Min
of
fitn
ess
0 1000 2000 3000 4000 5000 6000 7000 80000.7325
0.733
0.7335
0.734
0.7345
0.735
Generation
Min
of
fitn
ess
0 500 1000 1500 2000 2500 3000
0.57
0.575
0.58
0.585
0.59
0.595
0.6
Min
of
fitn
ess
Generation

International Journal of Smart Electrical Engineering, Vol.2, No.1, Winter 2013 ISSN: 2251-9246
29
After using DG in the 14-bus, 30-bus and 57-bus test
systems, the congestion in the lines as well as the total
power losses are reduced. The results of congestion for the
lines with the most congestion value are shown in Table.3.
Table.3.
The results of Congestion
Case study
Congestion value in the
line before using DG
Congestion value in the
line after using one DG
Congestion value in the
line after using two DGs
Congestion value in the
line after using three DGs
14-bus 82.54% 63.22% 44.8%
30-bus 82.23% 58.12% 27.75% 32.59%
57-bus 82.88% 73.18%
As it can be seen from Table.3, the amount of
congestion for the 14-bus system in the line 1 has been
82.54 % which after using 1 DG it is reduced to 63.22%
value and by using 2 DGs it is reduced to 44.80% value. In
the 30-bus test system, the most congestion is for line 10
with the value of 82.23% which after using 1 DG it is
reduced to 58.12% value and by using 2 DGs it is reduced
to 27.75% value and after using 3 DGs it is reduced to
32.59% value. In the 57-bus test system, the line 15 the
most congestion is for line 15 with the value of 82.88%
which by the use of 1 DG has reached to the value of
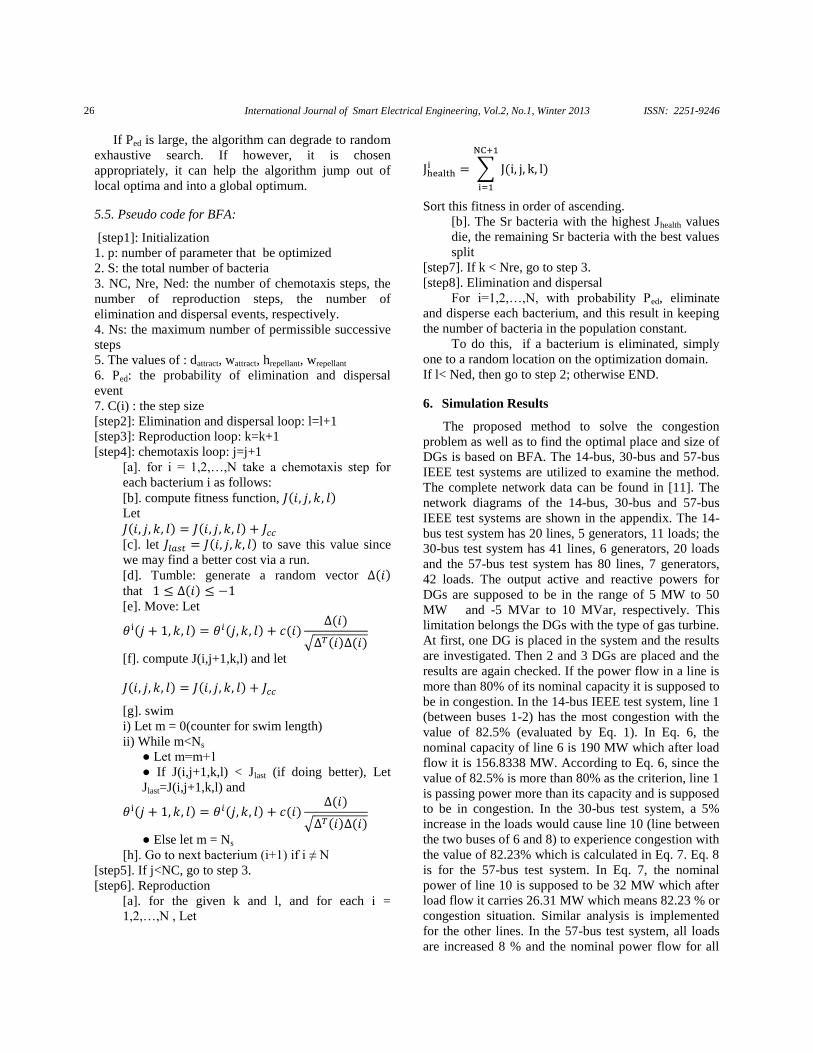
73.18%. Figs. 7 to 12 show the amount of congestion
reduction in all lines of 14-bus, 30-bus and 57-bus test
systems after using DGs.
Fig.7. The congestion amount before and after using one DG in the 14-bus
test system
Fig.8. The congestion amount before and after using two DGs in the 14-bus test system
Fig.9. The congestion amount before and after using one DG in the 30-bus
test system
0 5 10 15 20 250
0.1
0.2
0.3
0.4
0.5
0.6
0.7
0.8
0.9
Line number
Congestion
without DG
with DG0 5 10 15 20 25
0
0.1
0.2
0.3
0.4
0.5
0.6
0.7
0.8
0.9
Line number
Congestion
without DG
with DG
0 10 20 30 40 500
0.1
0.2
0.3
0.4
0.5
0.6
0.7
0.8
0.9
Line number
Congestion
without DG
with DG
International Journal of Smart Electrical Engineering, Vol.2, No.1, Winter 2013 ISSN: 2251-9246
30
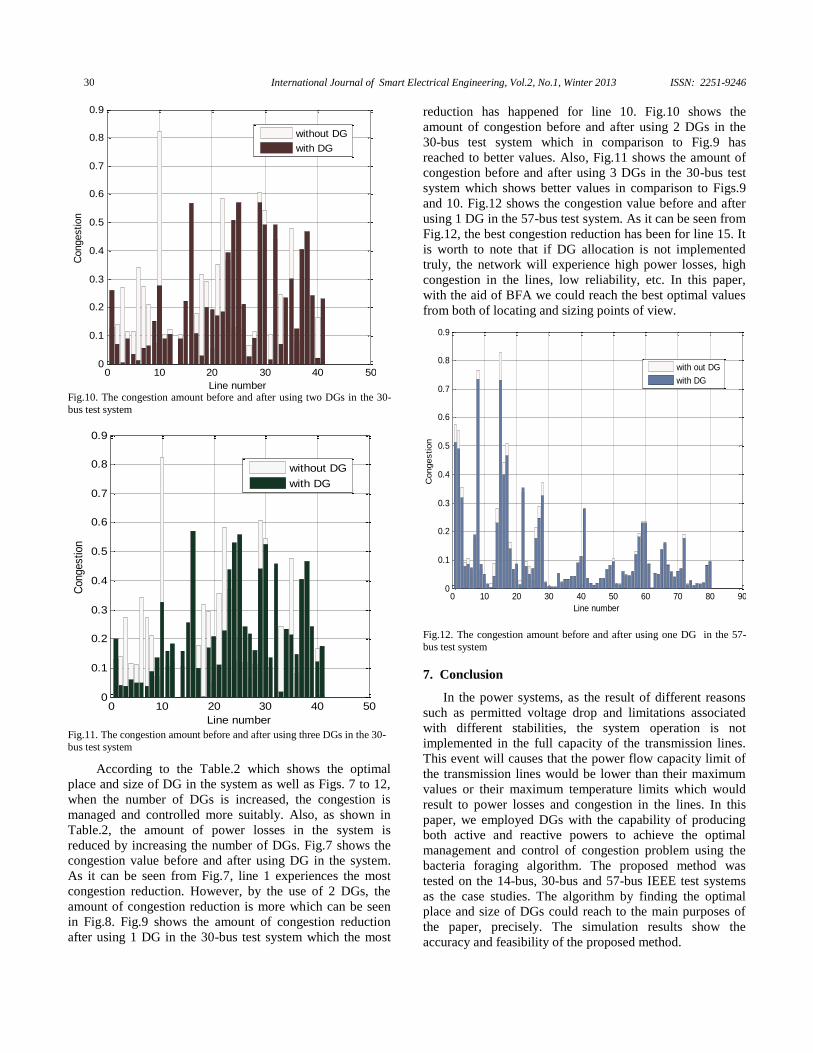
Fig.10. The congestion amount before and after using two DGs in the 30-
bus test system
Fig.11. The congestion amount before and after using three DGs in the 30-
bus test system
According to the Table.2 which shows the optimal
place and size of DG in the system as well as Figs. 7 to 12,
when the number of DGs is increased, the congestion is
managed and controlled more suitably. Also, as shown in
Table.2, the amount of power losses in the system is
reduced by increasing the number of DGs. Fig.7 shows the
congestion value before and after using DG in the system.
As it can be seen from Fig.7, line 1 experiences the most
congestion reduction. However, by the use of 2 DGs, the
amount of congestion reduction is more which can be seen
in Fig.8. Fig.9 shows the amount of congestion reduction
after using 1 DG in the 30-bus test system which the most
reduction has happened for line 10. Fig.10 shows the
amount of congestion before and after using 2 DGs in the
30-bus test system which in comparison to Fig.9 has
reached to better values. Also, Fig.11 shows the amount of
congestion before and after using 3 DGs in the 30-bus test
system which shows better values in comparison to Figs.9
and 10. Fig.12 shows the congestion value before and after
using 1 DG in the 57-bus test system. As it can be seen from
Fig.12, the best congestion reduction has been for line 15. It
is worth to note that if DG allocation is not implemented
truly, the network will experience high power losses, high
congestion in the lines, low reliability, etc. In this paper,
with the aid of BFA we could reach the best optimal values
from both of locating and sizing points of view.
Fig.12. The congestion amount before and after using one DG in the 57-
bus test system
7. Conclusion
In the power systems, as the result of different reasons
such as permitted voltage drop and limitations associated
with different stabilities, the system operation is not
implemented in the full capacity of the transmission lines.
This event will causes that the power flow capacity limit of
the transmission lines would be lower than their maximum
values or their maximum temperature limits which would
result to power losses and congestion in the lines. In this
paper, we employed DGs with the capability of producing
both active and reactive powers to achieve the optimal
management and control of congestion problem using the
bacteria foraging algorithm. The proposed method was
tested on the 14-bus, 30-bus and 57-bus IEEE test systems
as the case studies. The algorithm by finding the optimal
place and size of DGs could reach to the main purposes of
the paper, precisely. The simulation results show the
accuracy and feasibility of the proposed method.
0 10 20 30 40 500
0.1
0.2
0.3
0.4
0.5
0.6
0.7
0.8
0.9
Line number
Congestion
without DG
with DG
0 10 20 30 40 500
0.1
0.2
0.3
0.4
0.5
0.6
0.7
0.8
0.9
Line number
Congestion
without DG
with DG
0 10 20 30 40 50 60 70 80 900
0.1
0.2
0.3
0.4
0.5
0.6
0.7
0.8
0.9
Line number
Congestion
with out DG
with DG
International Journal of Smart Electrical Engineering, Vol.2, No.1, Winter 2013 ISSN: 2251-9246
31
References
[1] Sujatha Balaraman, “Congestion management deregulated power
system using real coded genetic algorithm”, International Journal of
Engineering Science and Technology, Vol.2, No.11, pp.6681-6690, 2010.
[2] A. F. Kaptue Kamga, S. Voller, J. F. Verstege, “Congestion
Management in Transmission Systems with Large Scale Integration of Wind Energy”, Integration of Wide-Scale Renewable Resources In to
the Power Delivery System, CIGRE/IEEE PES Joint Symposium,
2009.
[3] A. Vergnol, J. Sprooten, B. Robyns, V. Rious, J. Deuse, “Optimal
network congestion management using wind farms”, Integration of
Wide-Scale Renewable Resources Into the Power Delivery System, CIGRE/IEEE PES Joint Symposium, 2009.
[4] J. Hazra, and A. K. Sinha, “Congestion management using
ultiobjective particle swarm optimization”, IEEE Trans. Power Syst., Vol.22, No.4, pp. 1726-1734, Feb. 2007.
[5] T. Jibiki, E. Sakakibara, and S. Iwamoto, “Line Flow Sensitivities of
Line Reactances for Congestion Management”, IEEE Power Eng. society general Meeting, Vol.24, pp.1-6, Jun. 2007.
[6] M. Gitizadeh, and M. Kalantar, ”A New Approach for Congestion
Management via Optimal Location of FACTS Devices in Deregulated Power System”, Electric Utility Third International Conference on
Deregulation and Restructuring and Power Technologies, DRPT 2008.
[7] P. Kaymaz, J. Valenzuela, and C. S. Park, “Transmission Congestion and Competition on Power Generation Expansion”, IEEE Trans. Power
Syst., Vol.22, No.1, pp.156-163, Feb. 2007.
[8] J. Hazra, and A. K. Sinha, “Congestion management using ultiobjective particle swarm optimization”, IEEE Trans. Power Syst.,
Vol.22, No.4, pp.1726-1734, Feb. 2007.
[9] S. Pichaisawat, Y. H. Song, and G. A. Taylor, “Congestion management considering voltage security constraint”, in Proc. Int.
Conf. on Power Syst. Tech., Vol.3, pp.1819-1823, 2002.
[10] Khanabadi, M. Doostizadeh, M. Esmaeilian, A. Mohseninezhad, “Transmission Congestion Management through Optimal Distributed
Generation's Sizing”, International Conference on Environment and
Electrical Engineering (EEEIC), 2011.
[11] Ray D.Zimmerman and Carlos E.Murillo-Sanchez. Matpower, “A
MATLAB power system, simulation package”, Sep.21, 2007.
Appendix
14-bus IEEE test system
30-bus IEEE test system
57-bus IEEE test system
Table.4
Algorithm parameters
Case study
No. DG
S Ns Nc Nre Nel Pe
14-bus
1-DG 16 10 80 8 10 0.25
2-DG 16 15 80 6 9 0.25
30-bus
1-DG 14 6 30 2 3 0.25
2-DG 22 8 50 4 5 0.25
3-DG 20 9 50 6 7 0.25
57-bus
1-DG 38 12 90 7 9 0.25