Embed Size (px)
Citation preview
1
Conformational disorder and dynamics of proteins
sensed by Raman optical activity
Carl Mensch†,‡
, Patrick Bultinck‡ and Christian Johannessen
†*
†. Department of Chemistry, University of Antwerp, Groenenborgerlaan 171, B-2020
Antwerp, Belgium.
‡. Department of Chemistry, Ghent University, Krijgslaan 281 (S3), B-9000 Ghent, Belgium.
ABSTRACT Raman optical activity (ROA) spectra of proteins hold a lot of information about
their structure in solution. To elucidate the ROA spectra of the intrinsically disordered proteins
(IDPs), involved in neurodegenerative diseases, the effect of conformational disorder and
dynamics on the ROA spectra was studied. Density functional theory (DFT) computations of
small ensembles of model peptides with increasing disorder show that the ROA patterns of α-
helical and poly-proline II (PPII) structure reflect the average backbone angles in the ensemble.
While the amide III region in the ROA of the α-helical peptides is shown to be surprisingly
robust with disorder, the amide III region of PPII secondary structure diminishes in intensity
with increasing structural disorder. The results show that the ROA spectra of IDPs hence more
likely stem from short stretches of well-defined PPII helices rather than a very flexible chain.
Further DFT computations support that mixing of PPII with helical secondary structure is
consistent with experimental spectra of IDPs, while mixing with β-strand results in spectral
2
patterns that are not observed experimentally. The detailed information obtained from these
results contributes to a better understanding of the spectrum-structure relation.
INTRODUCTION
Over the past decades, Raman optical activity (ROA) has been shown to be a spectroscopic
technique that is uniquely sensitive to the solution structure of biomolecules.1,2
Nevertheless, its
use as a complementary structural elucidation technique in structural biology is not widespread.
Exactly because of this strong structural sensitivity, the detailed interpretation of the
spectroscopic signals is very challenging. Since ROA provides unique spectral patterns for inter
alia peptides,3 proteins
1, glycoproteins
4,5 and intrinsically disordered proteins (IDPs)
6,7 there is a
clear incentive to create a deeper understanding of the structure-spectrum relationship. Especially
proteins such as IDPs are challenging to characterize by standard techniques.8 As these proteins
are involved in neurodegenerative disorders such as Alzheimer’s and Parkinson’s disease, there
is a strong motivation to develop structure elucidation techniques that are complementary to for
example nuclear magnetic resonance (NMR) methodologies.8
The strength of Raman spectroscopies in the study of dynamic systems stems from the very short
time scale of the scattering process (~ 3.3 x 10⁻¹⁴
s for a vibration with wavenumber 1000 cm-1
)
which is much smaller than that of conformational changes.9 The spectra are therefore a
superposition of snap-shot spectra arising from all conformations that the protein adopts in
solution. Conventional Raman spectra of proteins arise from molecular vibrations in both the
side-chains as well as the backbone of the protein. ROA on the other hand is measured as the
difference in the right- (IR) and left-handed (IL) circularly polarized components in Raman
scattered light and as such only picks up signals arising from rigid and chiral parts of the protein.
3
Therefore, the experimentally observed ROA spectral patterns mainly arise from amide bond and
skeletal stretching vibrations in the backbone of the protein and thus depend on the secondary
structure of the protein.1 While the most important secondary structure elements such as α-helix
and β-sheet can readily be identified from a protein’s ROA spectrum, the detailed interpretation
of ROA spectra is elusive.10
Recently, our group reported the creation of a ROA database that provides the relation between
the secondary structure and the corresponding ROA patterns.10
The database consists of a large
collection of calculated ROA spectra, each corresponding to a single secondary structure model.
Using that database, the experimental ROA patterns of various peptides adopting a specific
secondary structure in solution could be elucidated. Interestingly, the database also correctly
assigns the secondary structure of the flexible XAO peptide that has an important conformational
propensity to poly-L-proline type II helix (PPII), yet is considered to be flexible and explore
multiple regions of the Ramachandran space.10,11
A PPII helix is characterized by the backbone φ
and ψ torsion angles clustering around φ = -75° and ψ = 145° in the Ramachandran plot and is
also observed for sequences that do not contain proline.11
It is an important secondary structure
element of both globular proteins and flexible and dynamic IDPs.11
Since our ROA database
considers fixed model geometries with a regular arrangement of backbone torsion angles (the
same φ/ψ angles for each residue in the backbone), there is a need to further understand the
effect of conformational dynamics and disorder on the ROA spectra of peptides and proteins. To
this end, using Density Functional Theory (DFT), the ROA spectrum was firstly computed for a
peptide model with a fixed backbone conformation by setting the φ and ψ angles of all residues
in its sequence the same values across the backbone. Next, the effect of conformational dynamics
and disordered was investigated by increasingly deviating the conformation of this peptide from
4
the original regular conformation and monitoring the effect on the computed ROA spectrum. In
this study, the effect of conformational dynamics on the ROA spectra of the left-handed PPII
helix and the right-handed α-helix was studied, since ROA has been shown to be very sensitive
to these types of secondary structure, yet the detailed understanding of their spectral
characteristics is still lacking.10
Furthermore, these secondary structure types are of interest to
elucidate the experimental ROA spectra of IDPs.7
METHODOLOGY
ROA signals of proteins mainly arise from the amide and skeletal stretching vibrations in the
backbone, therefore poly-L-alanine peptides are often used in computational ROA studies since
this is the smallest chiral amino acid and conformational averaging of the side-chains does not
need to be considered.10
In this study, model peptide structures of the general formula HCO-(L-
Ala)7-NH2 were created using the Python peptide builder by Tien et al. that generates the models
based on a set of φ and ψ torsion angles.12
Firstly, different secondary structure element models
were created by setting the torsion angles the same for each residue in each peptide model. To
include conformational dynamics, the model φ and ψ angles were varied to different extents from
the initial angles. To this end, the torsion angles of each residue were generated using the
“randn” function in Matlab R2017a (Mathworks, Inc.) that renders normally distributed
pseudorandom numbers. By increasing the standard deviation of these random numbers, the
generated φ and ψ angles deviate more and more from the initial chosen angles, and hence more
and more conformational variation is imposed on the model peptide. In this way, families of 50
randomly generated conformations were constructed where for each family, respectively a
different degree of conformational freedom was imposed by setting the standard deviation σ of
the torsion angles to 6, 10, 20 or 30.
5
Next, the geometry of each conformation of the model peptide was partially optimized using the
normal mode optimization procedure.13
By locking the normal modes below 300 cm-1
in the
optimization, the backbone conformation is retained, while the modes of spectroscopic interest
are fully relaxed.13
These geometry optimizations were performed using the B3PW91 DFT
functional and the 6-31G(d,p) basis set. Subsequently, the Hessian and Raman and ROA tensors
were calculated using the same functional and the 6-31++G(d,p) basis set. The backscattered
Raman and ROA spectra were constructed by using a Lorentzian function for each normal mode
with a full width at half height of 20 cm-1
to mimic the physical line broadening in the
experimental spectra. A Boltzmann distribution factor was used to correct for temperature (300
K).10
Solvent-solute interactions with water were taken into account using the self-consistent
reaction field model (scrf). For all DFT calculations, the Gaussian 16 (rev A.03) program was
used.14
For the sake of comparison with experimental data in scientific literature, the calculated
spectra in this text are scaled in the wavenumber dimension by using a global scaling factor of
0.987.10
Images of molecular structures were created using Jmol-12.2.32 or CylView v1.0 beta
and figures were produced using Matlab R2017a.15,16
The Ramachandran plots were prepared
with “scatplot” in Matlab.
Results & Discussion
Intrinsic disorder and the PPII secondary structure
IDPs are very flexible proteins but many of their backbone torsion angles fluctuate around φ =
-75° and ψ = 145° characteristic for PPII secondary structure.11
ROA gives unique spectral
patterns of IDPs that support that these dynamic proteins do not behave like random coils but
that they do contain residual structure.7,17,18
The most prominent band (~1320 cm-1
) in the
6
experimental ROA spectra of IDPs is assigned to arise from PPII secondary structure, while
further understanding of the relation between the spectral patterns and a protein’s structure is
lacking.1,18,19
Recently, our group reported the experimental ROA spectrum of the XAO peptide
that is considered to primarily adopt PPII helical structure.10,11,20,21
Yet, the XAO peptide is
flexible and its radius of gyration was shown by small-angle X-ray scattering (SAXS) to be
much smaller than that it would be for a fully extended PPII helix.21
Zhu et al. suggested that this
observation of a low radius of gyration could be reconciled with the strong evidence from
spectroscopic methods pointing to a major contribution of PPII helical structure in the peptide,
by proposing that stretches of PPII structures are truncated by other secondary structure
elements.11,18
We showed that the experimental ROA spectrum of the XAO peptide was very
well reproduced by spectra calculated using DFT of poly-L-alanine model structures with a
regular PPII backbone conformation; i.e. with all backbone torsion set to φ = -75° and ψ =
145°.10
This observation hence prompted us to further study how the spectral patterns would be
affected by conformational dynamics or disorder, as both the XAO peptide and IDPs in general
have a dynamic and flexible structure, although with a propensity for PPII conformation. In
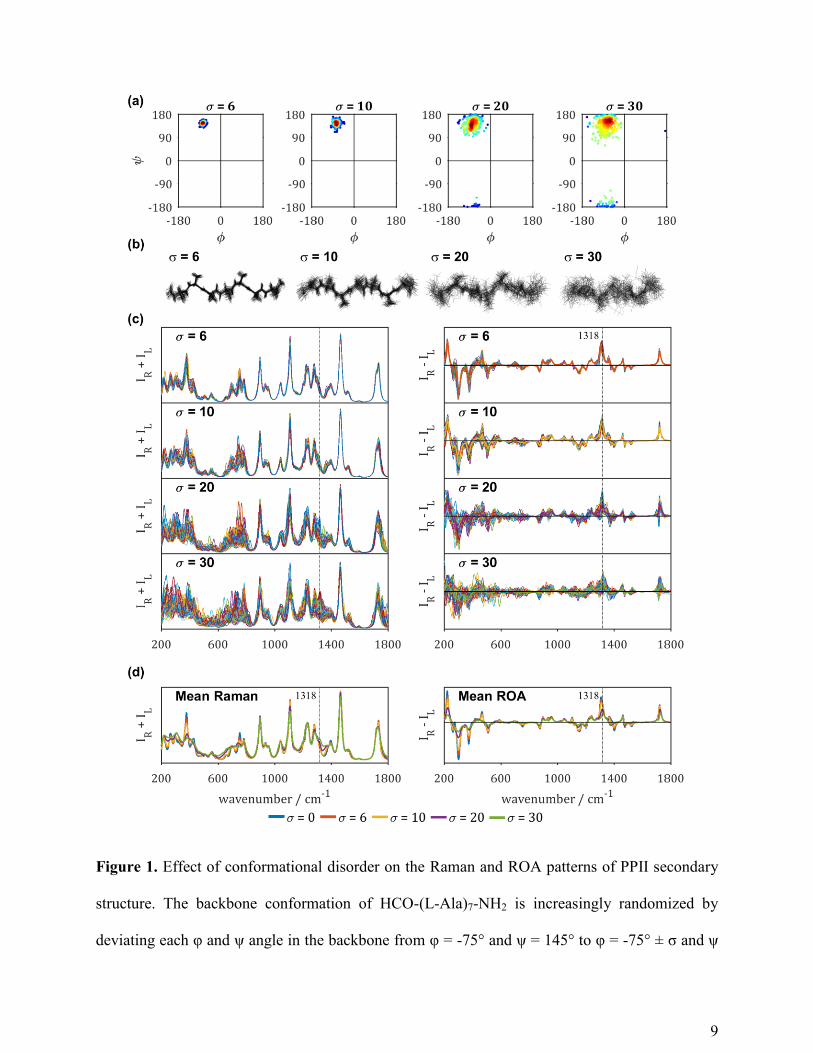
Figure 1, our approach to study this effect is illustrated. The Ramachandran plots in Figure 1 (a)
show the distribution of the torsion angles going from φ = -75° ± σ and ψ = 145° ± σ with a low
standard deviation from the mean angles (σ = 6) to much more conformationally randomized
structures (σ = 30). The Ramachandran plots show all the φ and ψ backbone angles of the 50
conformations of each conformational family. The corresponding molecular geometries are
displayed as superimposed stick figures in Figure 1 (b). In the Raman and ROA spectra, the
most variation is witnessed in the lower wavenumber region (200-800 cm-1
) and the extended
amide III region (1240-1345 cm-1
) as shown in Figure 1 (c). Although the individual spectra are
7
distinctly different, averaging of the spectra over the 50 conformations in each family leads to
mean spectra with similar patterns. In Figure 1 (d), the Raman and ROA spectra of HCO-(L-
Ala)7-NH2 with all backbone angles set to φ = -75° and ψ = 145° (blue, σ = 0) are compared to
the mean spectra of the four conformational families (σ = 6, 10, 20, 30 in red, yellow, purple and
green, respectively). The conventional Raman spectral patterns are affected only to a very
limited extent by the increasing conformational disorder. The most apparent changes are the
broadening of the lower wavenumber region (200-800 cm-1
), which leads to the lowering of the
band maxima in that region.
ROA is more sensitive to the increase in conformational freedom. Both the low wavenumber
region and the extended amide III region in the ROA spectra are strongly reduced in intensity
with increasing conformational disorder of the HCO-(L-Ala)7-NH2 peptide model. The ratio of
the maximum intensity of the amide III relative to the amide I region is also reduced as the
maximum intensity of the amide III region drops significantly with increasing disorder. This
might be an indication that the relative ratio in experimental spectra of IDPs can be used as an
indicator of the dynamics or conformational freedom of IDPs. For example, both the XAO
peptide10
(see above) and the IDP α-synuclein7 have a positive amide III band with a maximum
intensity that is higher relative to the amide I maximum intensity in their experimental ROA
spectra. The ROA spectra in Figure 1 hence suggest that the standard deviation of the mean
torsion angles of XAO and α-synuclein in the PPII region of the Ramachandran plot is limited
and lower than roughly σ = 20. This suggests that the ROA patterns of IDPs arise from short
sequences in the protein adopting PPII conformation with torsion angles very close to φ = -75°
and ψ = 145°. Our results support the hypothesis that the XAO peptide adopts PPII helical
8
secondary structure truncated by other secondary structure elements and furthermore indicate
that the variation of the backbone angles in the PPII region of the Ramachandran plot is limited.
To further investigate the effect of mixing different secondary structure elements, in following
sections the effect of mixing PPII secondary structure with left-handed helical structure is
evaluated. Before this mixing can be considered, in the next section, we first examine how the
ROA patterns of α-helical structure on its own are affected by increasing conformational
disorder.
9
Figure 1. Effect of conformational disorder on the Raman and ROA patterns of PPII secondary
structure. The backbone conformation of HCO-(L-Ala)7-NH2 is increasingly randomized by
deviating each φ and ψ angle in the backbone from φ = -75° and ψ = 145° to φ = -75° ± σ and ψ
10
= 145° ± σ. (a) Ramachandran plots displaying the increasing deviation from the mean angles φ
= -75° and ψ = 145° angles for each family of 50 structures with a set standard deviation σ. (b)
Superposition of the 50 conformations of HCO-(L-Ala)7-NH2 shown as stick figures for each
family. The y-axes are set to the same limits. (c) Individual Raman (IR+IL) and ROA (IR-IL)
spectra of each family of 50 conformations. (d) Mean Raman and ROA spectra of the four
families (σ = 6 (red), 10 (yellow), 20 (purple) or 30 (green) compared to the computed spectrum
of HCO-(L-Ala)7-NH2 with all backbone angles set to φ = -75° and ψ = 145° (blue; σ = 0).
The ROA patterns of left-handed helical structure.
The ROA bands that mark α-helical protein structure are well-studied and were assigned years
ago.1,22
The most distinctive patterns are a -/+ couplet centered at ~ 1650 cm-1
in the amide I
region and a -/+/+ pattern at ~ 1245/1300/1345 cm-1
in the extended amide III region.1,10
The
relative ratios of the amide III bands of α-helical proteins differ, which therefore has been
suggested to be sensitive to the exact secondary structure. However, the detailed interpretation
has been matter of debate in scientific literature. Already in 1999, Blanch et al. suggested that
the positive band around 1345 cm-1
(Cα-H bending vibration parallel to the C-N bond, coupled
with amide III) marks hydrated helical structure, while the 1300 cm-1
(Cα-H bending vibration
perpendicular to the C-N bond, coupled with amide III) was proposed to be a signature of α-
helical structure without hydration.10,23,24
These assignments were later questioned and shown to
be inaccurate.10
Nevertheless, our group showed that the ratio of the two bands is very sensitive
to the exact helical geometry, which can be affected by intramolecular hydrogen bonding or
interaction with the solvent.10
The database developed in our group showed that helical structure
with the C=O group tilting outwards from the helix axis, gives rise to a very intense ROA band
around 1300 cm-1
, while the band around 1345 cm-1
is a conservative marker of α-helical
11
structure. Since that database consists of regular conformations with repeated φ and ψ angles,
here the influence of conformational dynamics on the ROA patterns of α-helical structure was
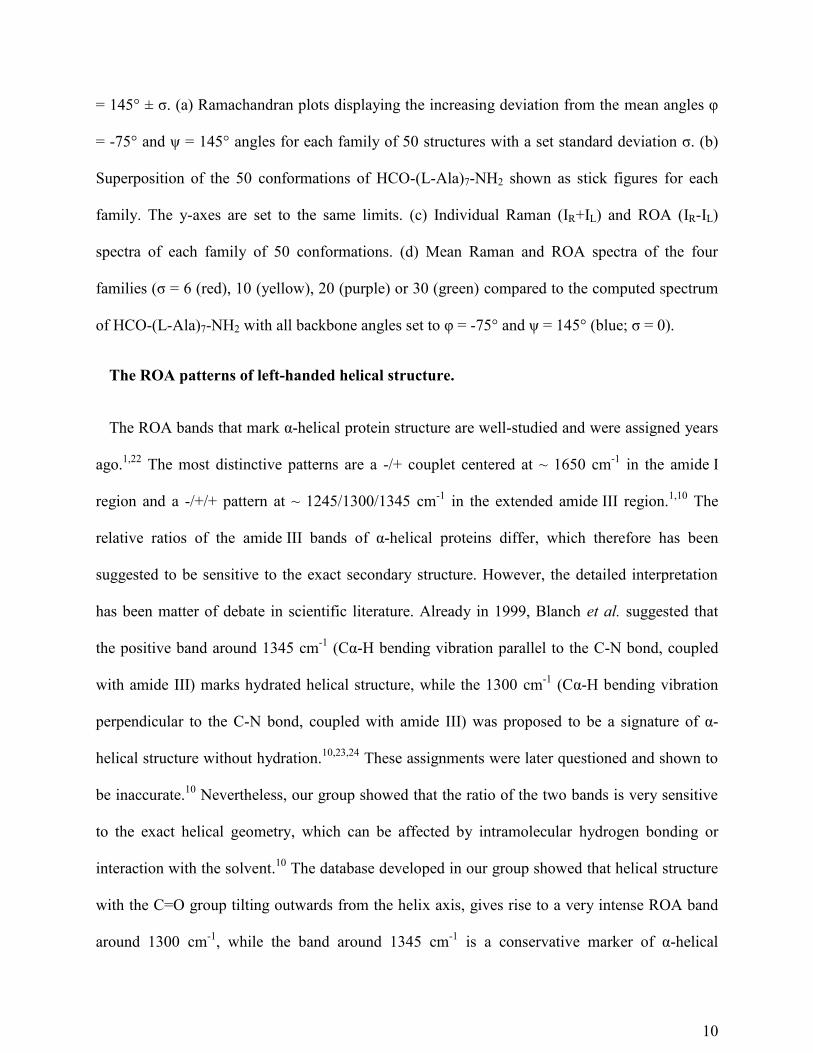
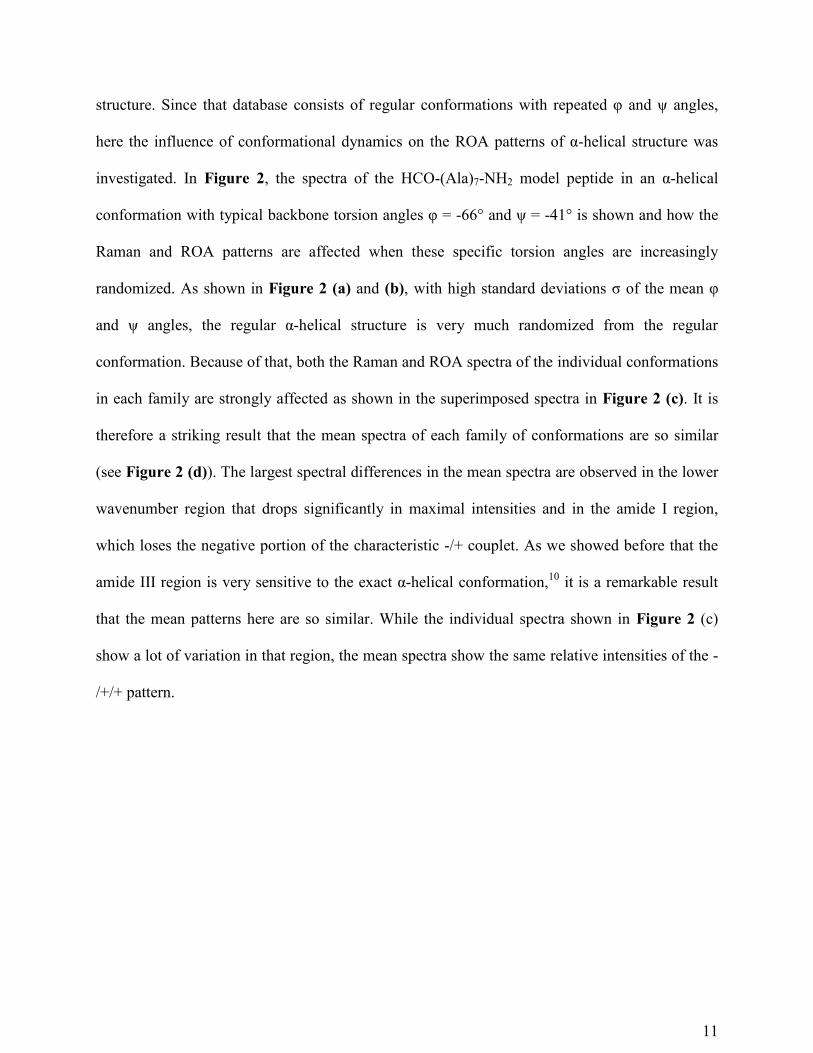
investigated. In Figure 2, the spectra of the HCO-(Ala)7-NH2 model peptide in an α-helical
conformation with typical backbone torsion angles φ = -66° and ψ = -41° is shown and how the
Raman and ROA patterns are affected when these specific torsion angles are increasingly
randomized. As shown in Figure 2 (a) and (b), with high standard deviations σ of the mean φ
and ψ angles, the regular α-helical structure is very much randomized from the regular
conformation. Because of that, both the Raman and ROA spectra of the individual conformations
in each family are strongly affected as shown in the superimposed spectra in Figure 2 (c). It is
therefore a striking result that the mean spectra of each family of conformations are so similar
(see Figure 2 (d)). The largest spectral differences in the mean spectra are observed in the lower
wavenumber region that drops significantly in maximal intensities and in the amide I region,
which loses the negative portion of the characteristic -/+ couplet. As we showed before that the
amide III region is very sensitive to the exact α-helical conformation,10
it is a remarkable result
that the mean patterns here are so similar. While the individual spectra shown in Figure 2 (c)
show a lot of variation in that region, the mean spectra show the same relative intensities of the -
/+/+ pattern.
12
Figure 2. Effect of conformational disorder on the ROA patterns of α-helical secondary
structure. The backbone conformation of HCO-(L-Ala)7-NH2 is increasingly randomized by
13
deviating each φ and ψ angle in the backbone from φ = -66° and ψ = -41° to φ = -66° ± σ and ψ
= -41° ± σ. (a) Ramachandran plots displaying the increasing deviation from the central φ = -66°
and ψ = -41° angles for each family of 50 structures with a set standard deviation σ. (b)
Superposition of the 50 conformations of HCO-(L-Ala)7-NH2 shown as stick figures for each
conformational family. The y-axis is set to the same limits. (c) Individual Raman (IR+IL) and
ROA (IR-IL) spectra of each family of 50 conformations. (d) Mean Raman and ROA spectra of
the four families (σ = 6 (red), 10 (yellow), 20 (purple) or 30 (green) compared to the computed
spectrum of HCO-(L-Ala)7-NH2 with all backbone angles set to φ = -75° and ψ = 145° (blue; σ =
0).
ROA is sensitive to the mean α-helical conformation.
As our previous work showed that ROA is very sensitive to the exact α-helical conformation,
10 the results shown in Figure 2 were extended to other α-helical conformations (specific pairs of
φ and ψ angles) to study the effect of conformational disorder in more detail. Similar to the
results discussed above, firstly the ROA spectra of regular HCO-Ala7-NH2 model conformations
with repeated φ and ψ backbone angles were computed. These computed Raman and ROA
spectra are shown in Figure 3 by the blue lines and thus correspond to a Raman and a ROA
spectrum of a single conformation. By looking at five different pairs of φ and ψ angles, the effect
of slight differences in the α-helical conformation is evaluated. These results are also compared
to a 310-helical conformation (φ = -71° and ψ = -18°) to confirm the structural sensitivity of ROA
to different types of helix. The red, yellow, purple and green lines correspond to the average
spectra of families of 50 structures with the standard deviation σ of the mean φ and ψ backbone
14
angles being σ = 6, 10, 20 or 30, respectively (see Figure S1-S5 for the spectra of the individual
conformations).
The mean Raman spectra in Figure 3 mostly show broadening of the spectral patterns with
increasing conformational disorder (higher σ) from the original regular helix conformation (blue;
σ = 0). The spectral differences in the mean ROA spectra are similar to those observed in Figure
2. Also for the other α-helical conformations, the amide I region in the ROA spectra in Figure 3
does not show the negative contribution of the couplet upon increasing conformational disorder.
Since for α-helical proteins and peptides the amide I is always observed as a -/+ couplet, this
indicates that this spectral pattern arises from regular helical structure with a limited variation of
the backbone φ and ψ angles.
In accordance with our previous analysis,10
the spectra of the α-helical models with slightly
different mean backbone angles show markedly different amide III patterns. This is observed in
Figure 3, by comparing the ROA spectra of the same color. For example, the blue spectra of the
top three panels show a much higher positive maximum intensity around 1345 cm-1
, relative to
the 1300 cm-1
band, compared to the ratio in the panels below.
The effect of increasingly deviating the conformation from the regular conformation can be
seen by comparing the ROA spectra within the same panel from σ = 0 (blue) to σ = 30 (green).
Very surprisingly, the amide III region of the α-helical models is robust with the increase in
variation of the backbone conformation; in other words, the -/+/+ pattern and relative ratios
remain generally the same for each combination of φ and ψ angles. This shows that the amide III
region of α-helical proteins is a pattern resulting from the average helix conformation in the
structural ensemble. In agreement with our previous results, the positive band around 1345 cm-1
is a robust marker of α-helical structure; it is found in all calculated spectra of α-helical structure,
15
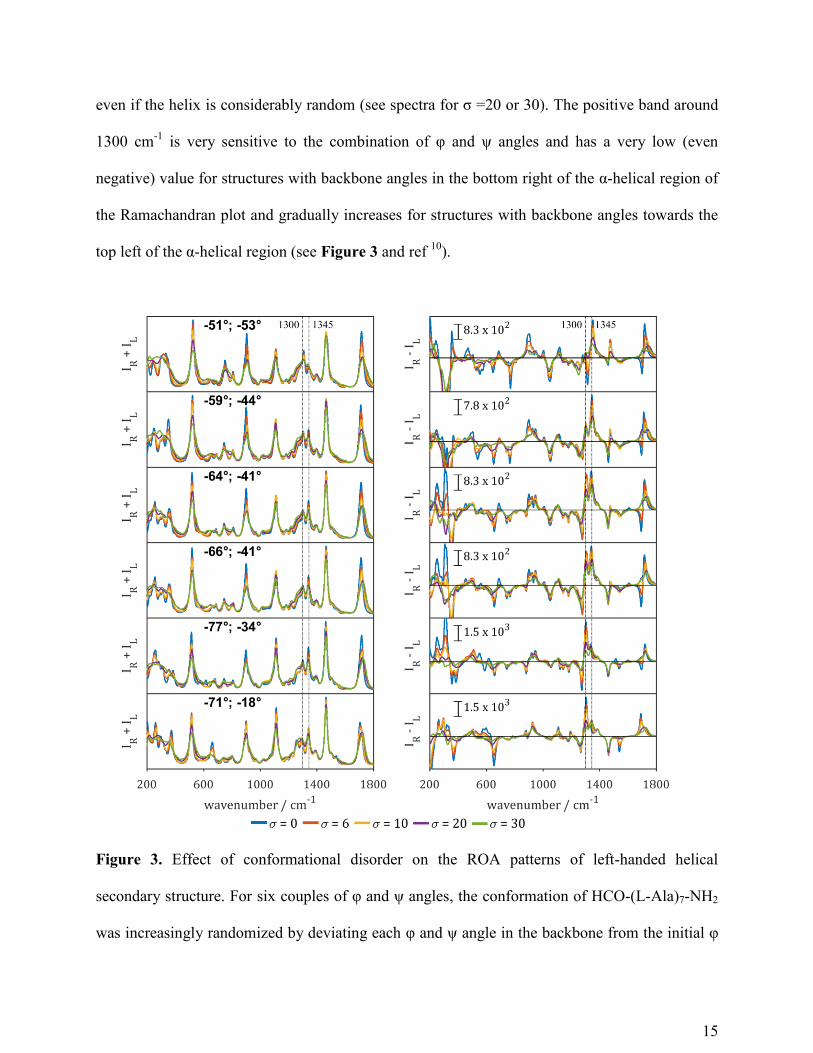
even if the helix is considerably random (see spectra for σ =20 or 30). The positive band around
1300 cm-1
is very sensitive to the combination of φ and ψ angles and has a very low (even
negative) value for structures with backbone angles in the bottom right of the α-helical region of
the Ramachandran plot and gradually increases for structures with backbone angles towards the
top left of the α-helical region (see Figure 3 and ref 10
).
Figure 3. Effect of conformational disorder on the ROA patterns of left-handed helical
secondary structure. For six couples of φ and ψ angles, the conformation of HCO-(L-Ala)7-NH2
was increasingly randomized by deviating each φ and ψ angle in the backbone from the initial φ
16
and ψ to φ ± σ and ψ ± σ in families of 50 conformations with respective standard deviation σ.
Mean Raman (IR+IL) and ROA (IR-IL) spectra of HCO-Ala7-NH2 with backbone torsion angles
set to various values corresponding to α-helical secondary structure or 310-helix (σ = 0; blue) and
the deviation from that with torsion angles with a standard deviation from these angles set to σ =
6 (red), 10 (yellow), 20 (purple) or 30 (green). The red, yellow, purple and green spectra
correspond to the average of 50 spectra of the family of 50 model structures with randomly
generated normal distributed torsion angles.
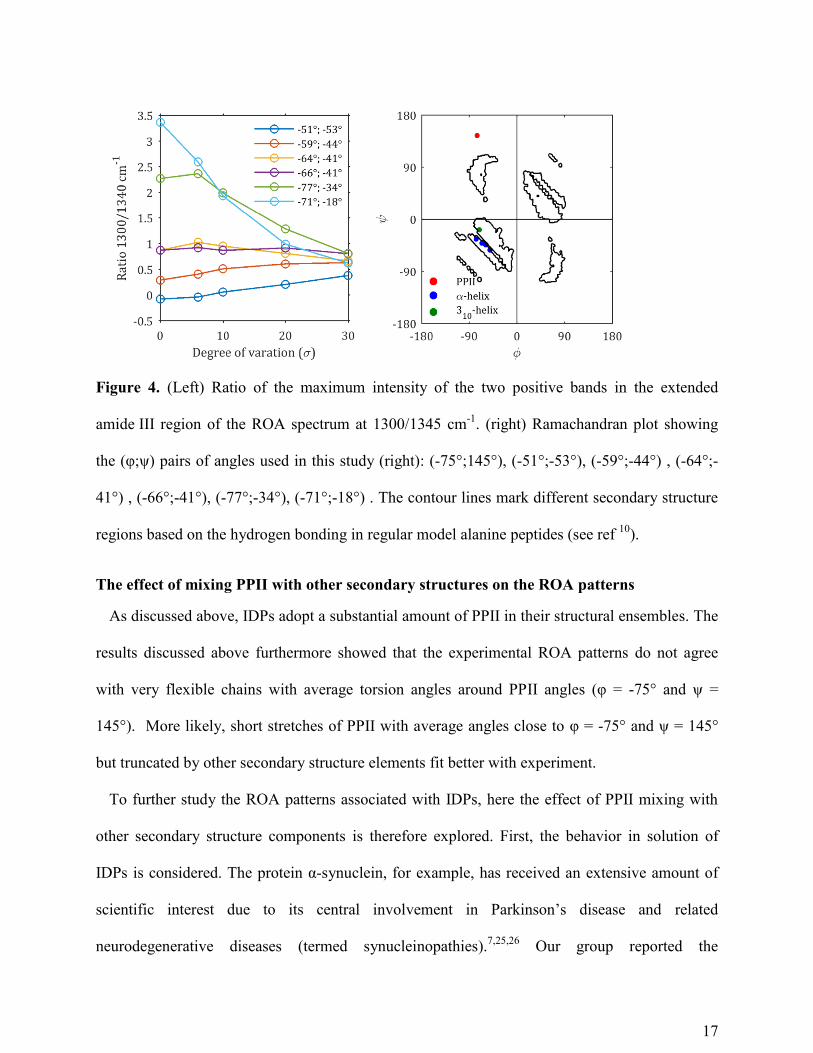
These observations are further supported by analyzing the ratio of the maximum intensity of
the two positive bands at 1300 cm-1
and 1345 cm-1
in the amide III region in Figure 4. In
accordance with our earlier results, the ratio is very sensitive to the exact combination of the φ
and ψ angles, observing very high ratios for structures with backbone angles in the top left of the
helical region in the Ramachandran plot, to much lower ratios in the bottom right. Both for the α-
helical model with torsion angles set φ = -77° and ψ = -34° and the 310-model with φ = -71° and
ψ = -18°, the positive band around 1300 cm-1
has a very high intensity that collapses with
increasing conformational freedom.
Only with a very high degree of conformational dynamics or disorder (σ = 30), all helical
models, including the 310-conformation, obtain a similar ROA pattern (Figure 3) and intensity
ratio (Figure 4). To conclude the above results, the intensity ratio of the two bands is sensitive to
the average helical conformation.
17
Figure 4. (Left) Ratio of the maximum intensity of the two positive bands in the extended
amide III region of the ROA spectrum at 1300/1345 cm-1
. (right) Ramachandran plot showing
the (φ;ψ) pairs of angles used in this study (right): (-75°;145°), (-51°;-53°), (-59°;-44°) , (-64°;-
41°) , (-66°;-41°), (-77°;-34°), (-71°;-18°) . The contour lines mark different secondary structure
regions based on the hydrogen bonding in regular model alanine peptides (see ref 10
).
The effect of mixing PPII with other secondary structures on the ROA patterns
As discussed above, IDPs adopt a substantial amount of PPII in their structural ensembles. The
results discussed above furthermore showed that the experimental ROA patterns do not agree
with very flexible chains with average torsion angles around PPII angles (φ = -75° and ψ =
145°). More likely, short stretches of PPII with average angles close to φ = -75° and ψ = 145°
but truncated by other secondary structure elements fit better with experiment.
To further study the ROA patterns associated with IDPs, here the effect of PPII mixing with
other secondary structure components is therefore explored. First, the behavior in solution of
IDPs is considered. The protein α-synuclein, for example, has received an extensive amount of
scientific interest due to its central involvement in Parkinson’s disease and related
neurodegenerative diseases (termed synucleinopathies).7,25,26
Our group reported the
18
experimental ROA patterns of α-synculein adopting different conformations, yet, the origin of
the spectral patterns of IDPs and small differences in their ROA spectra are unknown.7 To
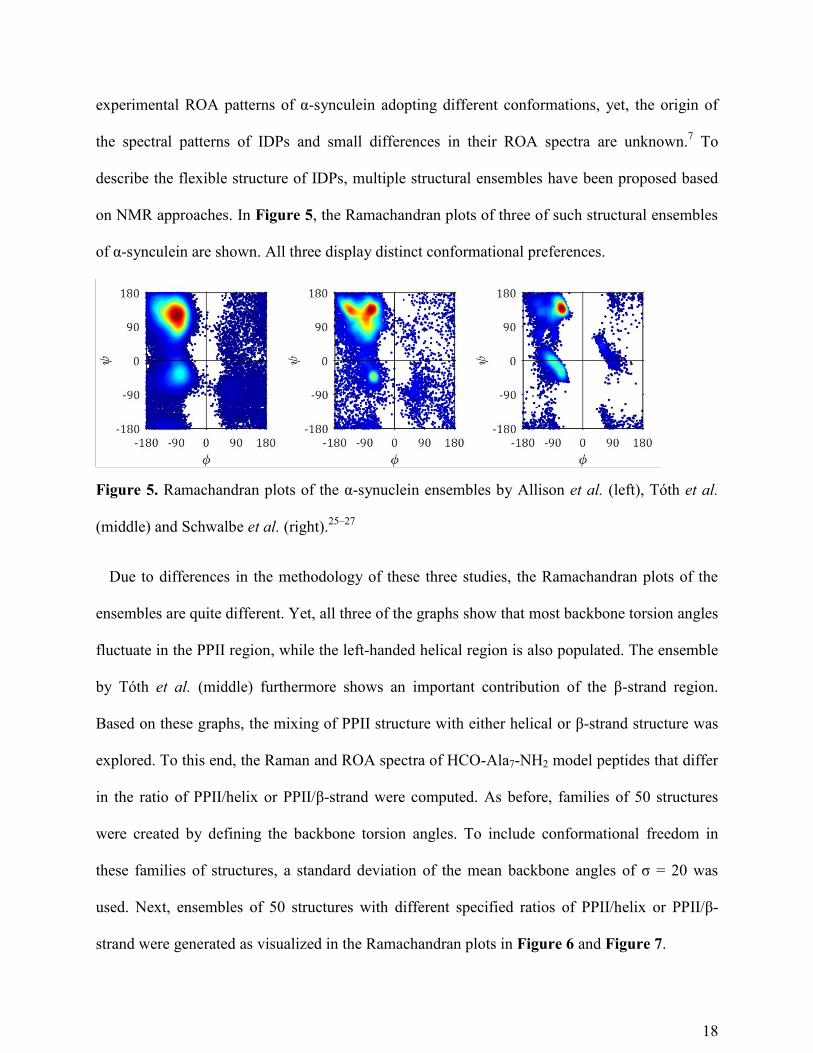
describe the flexible structure of IDPs, multiple structural ensembles have been proposed based
on NMR approaches. In Figure 5, the Ramachandran plots of three of such structural ensembles
of α-synculein are shown. All three display distinct conformational preferences.
Figure 5. Ramachandran plots of the α-synuclein ensembles by Allison et al. (left), Tóth et al.
(middle) and Schwalbe et al. (right).25–27
Due to differences in the methodology of these three studies, the Ramachandran plots of the
ensembles are quite different. Yet, all three of the graphs show that most backbone torsion angles
fluctuate in the PPII region, while the left-handed helical region is also populated. The ensemble
by Tóth et al. (middle) furthermore shows an important contribution of the β-strand region.
Based on these graphs, the mixing of PPII structure with either helical or β-strand structure was
explored. To this end, the Raman and ROA spectra of HCO-Ala7-NH2 model peptides that differ
in the ratio of PPII/helix or PPII/β-strand were computed. As before, families of 50 structures
were created by defining the backbone torsion angles. To include conformational freedom in
these families of structures, a standard deviation of the mean backbone angles of σ = 20 was
used. Next, ensembles of 50 structures with different specified ratios of PPII/helix or PPII/β-
strand were generated as visualized in the Ramachandran plots in Figure 6 and Figure 7.
19
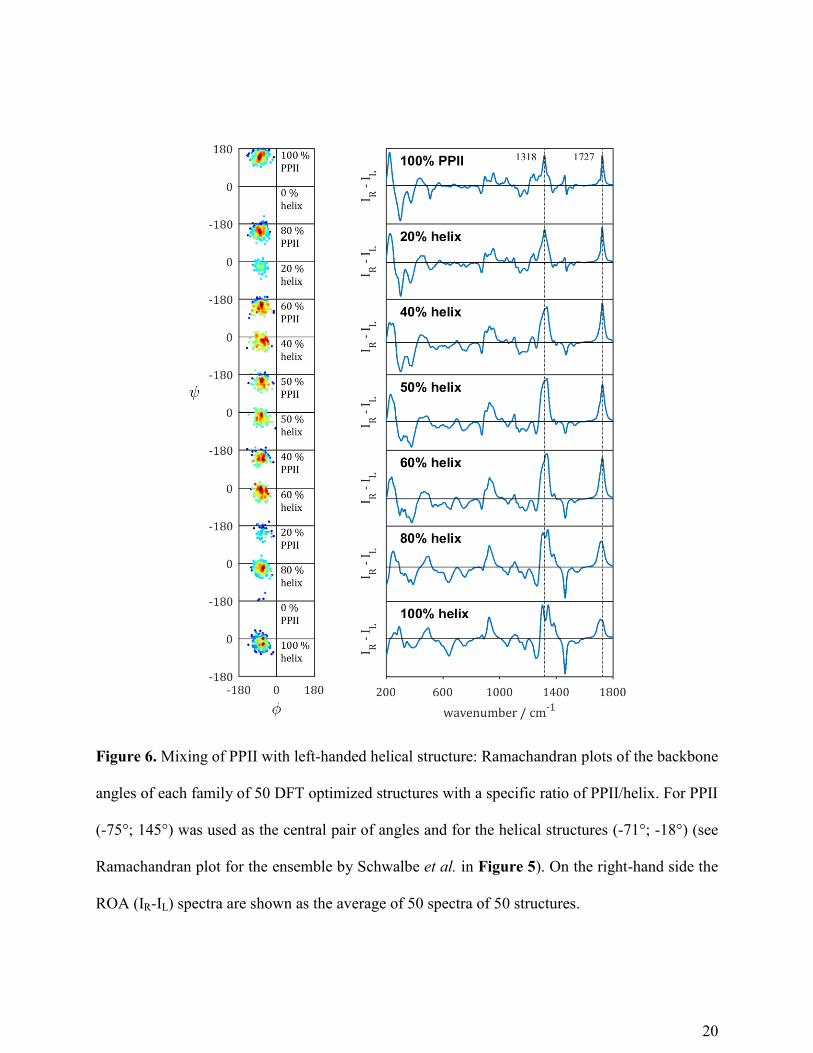
In Figure 6, the average ROA spectra of the different conformational families of PPII/helix are
shown (the corresponding Raman spectra are shown in Figure S6). The amide I band in both the
Raman and ROA shifts down about 15 cm-1
going from 100 % PPII to 100 % left-handed helix,
because of the presence of C=O∙∙∙H-N hydrogen bonds in the helical structures. A broad
amide III band around 1230-1240 cm-1
in the Raman spectra, gradually decreases, marking the
reduction in PPII content while the positive bands around 1300 cm-1
and 1345 cm-1
increase,
both arising from Cα-H bending modes coupled to amide III vibrational motions in helical
structure.
In the ROA spectra, the change in the extended amide III region is more visible with the
positive band at 1318 cm-1
(100% PPII) becoming broader upon increase in helical content, with
eventually the appearance of the characteristic two positive bands marking α-helical structure
around 1300 cm-1
and 1345 cm-1
(100% helix). Two important conclusions can be drawn from
this graph. First, the broad asymmetric band in the amide III region in the ROA spectra with
mixed PPII/helix suggests that the extended amide III region in experimental ROA spectra of
IDPs arises from PPII segments mixed with other structural elements such as helical structure.
Second, the appearance of the two positive ROA bands marking α-helical structure at 1300 cm-1
and 1345 cm-1
only for a content of 80-100 % helix again shows that ROA is sensitive to rigid
secondary structure elements in solution. As experimental ROA spectra of proteins in solution
with much less helical content than 80 % already show the two positive bands, these bands must
arise from sequences of multiple residues adopting a left-handed helix. Since here a helix with
310-backone angles was considered, the unfolding of an α-helix to PPII structure was calculated
to further study the mixing of secondary structures.
20
Figure 6. Mixing of PPII with left-handed helical structure: Ramachandran plots of the backbone
angles of each family of 50 DFT optimized structures with a specific ratio of PPII/helix. For PPII
(-75°; 145°) was used as the central pair of angles and for the helical structures (-71°; -18°) (see
Ramachandran plot for the ensemble by Schwalbe et al. in Figure 5). On the right-hand side the
ROA (IR-IL) spectra are shown as the average of 50 spectra of 50 structures.
21
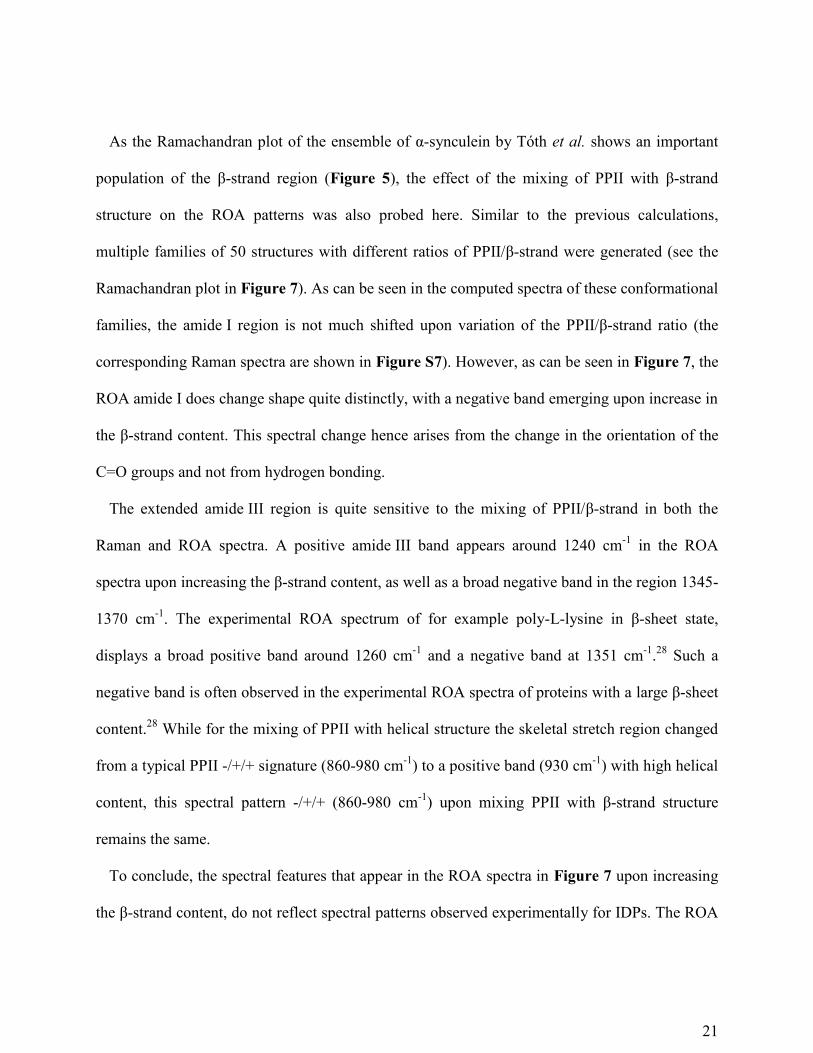
As the Ramachandran plot of the ensemble of α-synculein by Tóth et al. shows an important
population of the β-strand region (Figure 5), the effect of the mixing of PPII with β-strand
structure on the ROA patterns was also probed here. Similar to the previous calculations,
multiple families of 50 structures with different ratios of PPII/β-strand were generated (see the
Ramachandran plot in Figure 7). As can be seen in the computed spectra of these conformational
families, the amide I region is not much shifted upon variation of the PPII/β-strand ratio (the
corresponding Raman spectra are shown in Figure S7). However, as can be seen in Figure 7, the
ROA amide I does change shape quite distinctly, with a negative band emerging upon increase in
the β-strand content. This spectral change hence arises from the change in the orientation of the
C=O groups and not from hydrogen bonding.
The extended amide III region is quite sensitive to the mixing of PPII/β-strand in both the
Raman and ROA spectra. A positive amide III band appears around 1240 cm-1
in the ROA
spectra upon increasing the β-strand content, as well as a broad negative band in the region 1345-
1370 cm-1
. The experimental ROA spectrum of for example poly-L-lysine in β-sheet state,
displays a broad positive band around 1260 cm-1
and a negative band at 1351 cm-1
.28
Such a
negative band is often observed in the experimental ROA spectra of proteins with a large β-sheet
content.28
While for the mixing of PPII with helical structure the skeletal stretch region changed
from a typical PPII -/+/+ signature (860-980 cm-1
) to a positive band (930 cm-1
) with high helical
content, this spectral pattern -/+/+ (860-980 cm-1
) upon mixing PPII with β-strand structure
remains the same.
To conclude, the spectral features that appear in the ROA spectra in Figure 7 upon increasing
the β-strand content, do not reflect spectral patterns observed experimentally for IDPs. The ROA
22
spectra of mixing PPII backbone torsion angles with helical backbone torsion angles is on the
other hand reminiscent of the experimental ROA spectral patterns observed for IDPs. Finally, to
further study the mixing of PPII with helical secondary structure, in the next section the
unfolding of an α-helix to a PPII backbone is studied.
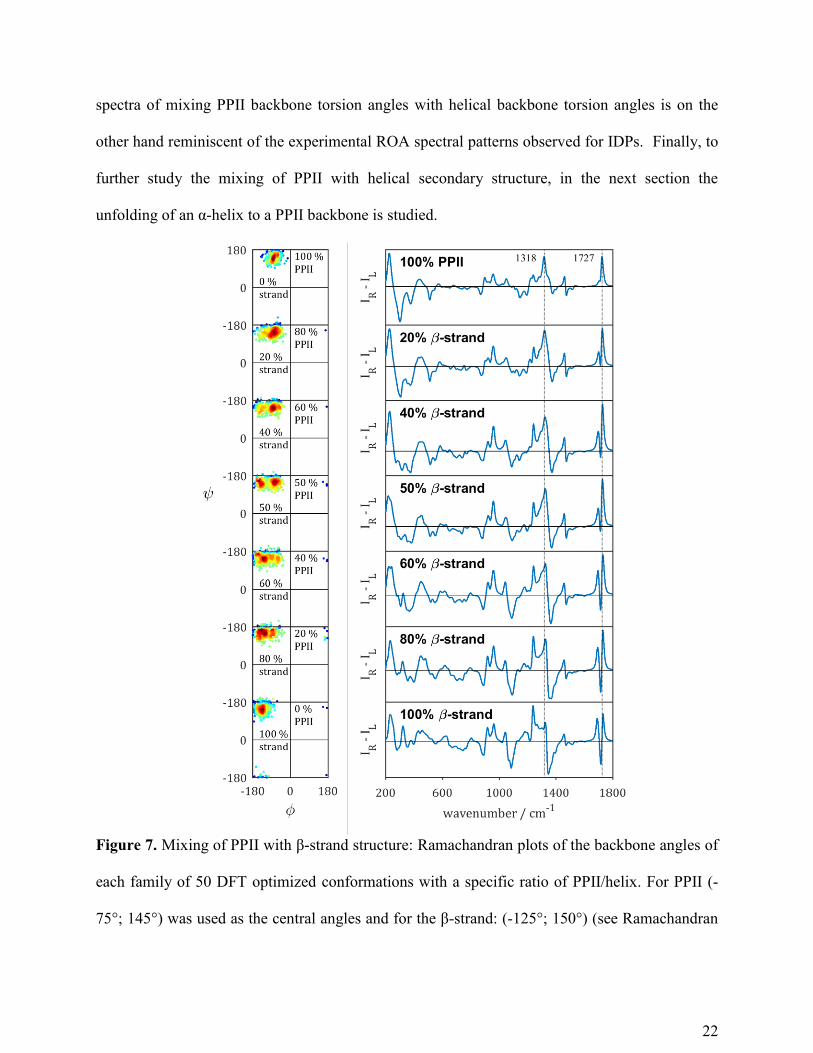
Figure 7. Mixing of PPII with β-strand structure: Ramachandran plots of the backbone angles of
each family of 50 DFT optimized conformations with a specific ratio of PPII/helix. For PPII (-
75°; 145°) was used as the central angles and for the β-strand: (-125°; 150°) (see Ramachandran
23
plot for the Tóth ensemble in Figure 5). On the right-hand side the ROA (IR-IL) spectra are
shown as the average of 50 spectra of the 50 corresponding structures.
α-Helix unfolding to PPII
Above, the transition of helical structure to PPII secondary structure was probed by varying all
backbone torsion angles of a peptide model simultaneously and calculating the Raman and ROA
spectra at set percentages of the two secondary structures (two pairs of φ and ψ angles). In this
section, the change in the spectra is considered when one regular α-helical model peptide makes
a gradual transition to PPII extended helix by changing the backbone angles of each residue one
by one starting from the N-terminus. By doing this for a HCO-(L-Ala)11-NH2 peptide, the
difference with the results described above, is that multiple consecutive residues of both
secondary structure types coexist within the same peptide.
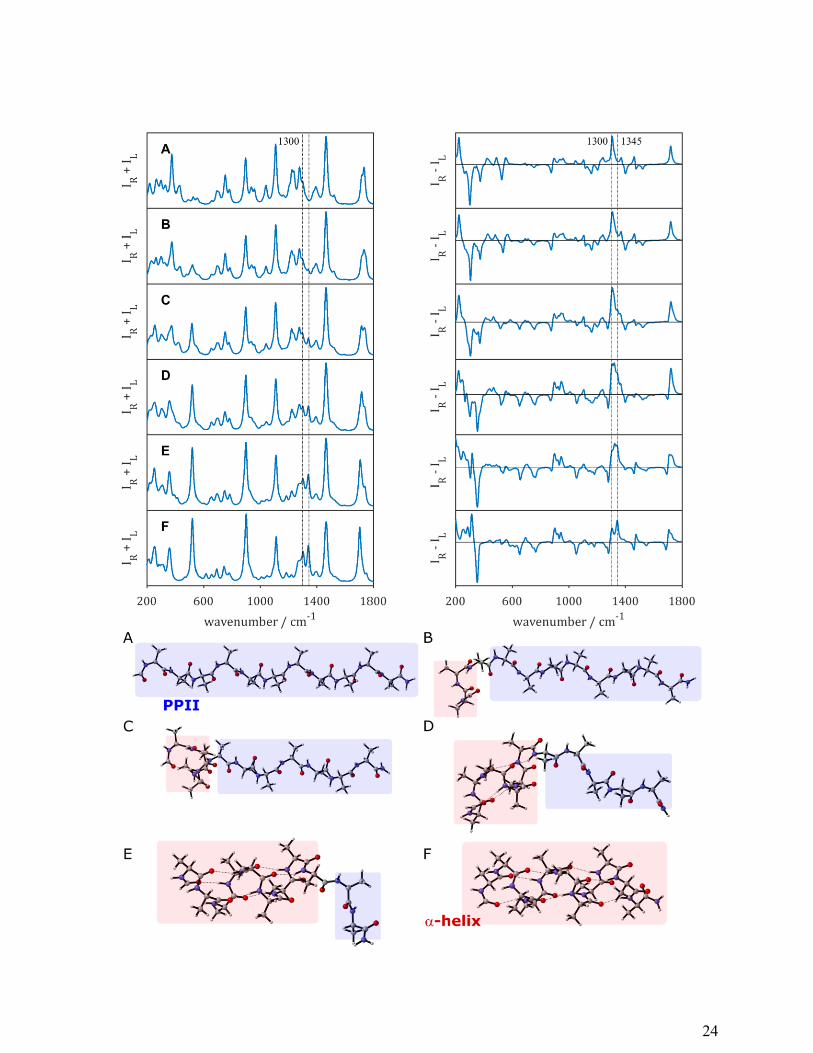
As shown in Figure 8, upon varying the structure from 100 % PPII to 100 % α-helix, the
largest changes in the Raman spectra appear in the regions 500-550 cm-1
(backbone deformations
and out-of-plane N-H bending), the extended amide III region and the amide I region. The ROA
spectra show considerable changes across the entire spectral window. The amide I in the ROA
spectra changes from a positive band associated with PPII structure to a -/+ couplet marking α-
helical structure. The most interesting spectral region appears to be the amide III region that
retains a strong positive band around 1300-1325 cm-1
, while only for the spectrum consisting of
100 % α-helical backbone the two positive amide III bands are clearly distinguishable.
24
25
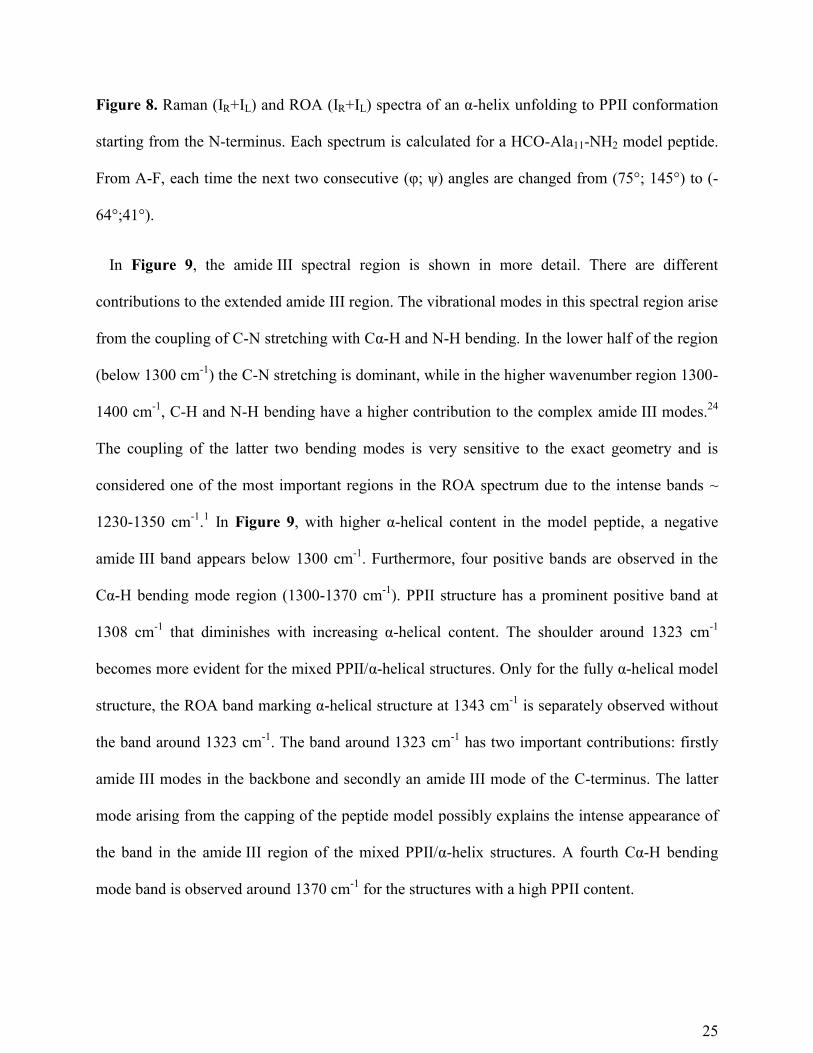
Figure 8. Raman (IR+IL) and ROA (IR+IL) spectra of an α-helix unfolding to PPII conformation
starting from the N-terminus. Each spectrum is calculated for a HCO-Ala11-NH2 model peptide.
From A-F, each time the next two consecutive (φ; ψ) angles are changed from (75°; 145°) to (-
64°;41°).
In Figure 9, the amide III spectral region is shown in more detail. There are different
contributions to the extended amide III region. The vibrational modes in this spectral region arise
from the coupling of C-N stretching with Cα-H and N-H bending. In the lower half of the region
(below 1300 cm-1
) the C-N stretching is dominant, while in the higher wavenumber region 1300-
1400 cm-1
, C-H and N-H bending have a higher contribution to the complex amide III modes.24
The coupling of the latter two bending modes is very sensitive to the exact geometry and is
considered one of the most important regions in the ROA spectrum due to the intense bands ~
1230-1350 cm-1
.1 In Figure 9, with higher α-helical content in the model peptide, a negative
amide III band appears below 1300 cm-1
. Furthermore, four positive bands are observed in the
Cα-H bending mode region (1300-1370 cm-1
). PPII structure has a prominent positive band at
1308 cm-1
that diminishes with increasing α-helical content. The shoulder around 1323 cm-1
becomes more evident for the mixed PPII/α-helical structures. Only for the fully α-helical model
structure, the ROA band marking α-helical structure at 1343 cm-1
is separately observed without
the band around 1323 cm-1
. The band around 1323 cm-1
has two important contributions: firstly
amide III modes in the backbone and secondly an amide III mode of the C-terminus. The latter
mode arising from the capping of the peptide model possibly explains the intense appearance of
the band in the amide III region of the mixed PPII/α-helix structures. A fourth Cα-H bending
mode band is observed around 1370 cm-1
for the structures with a high PPII content.
26
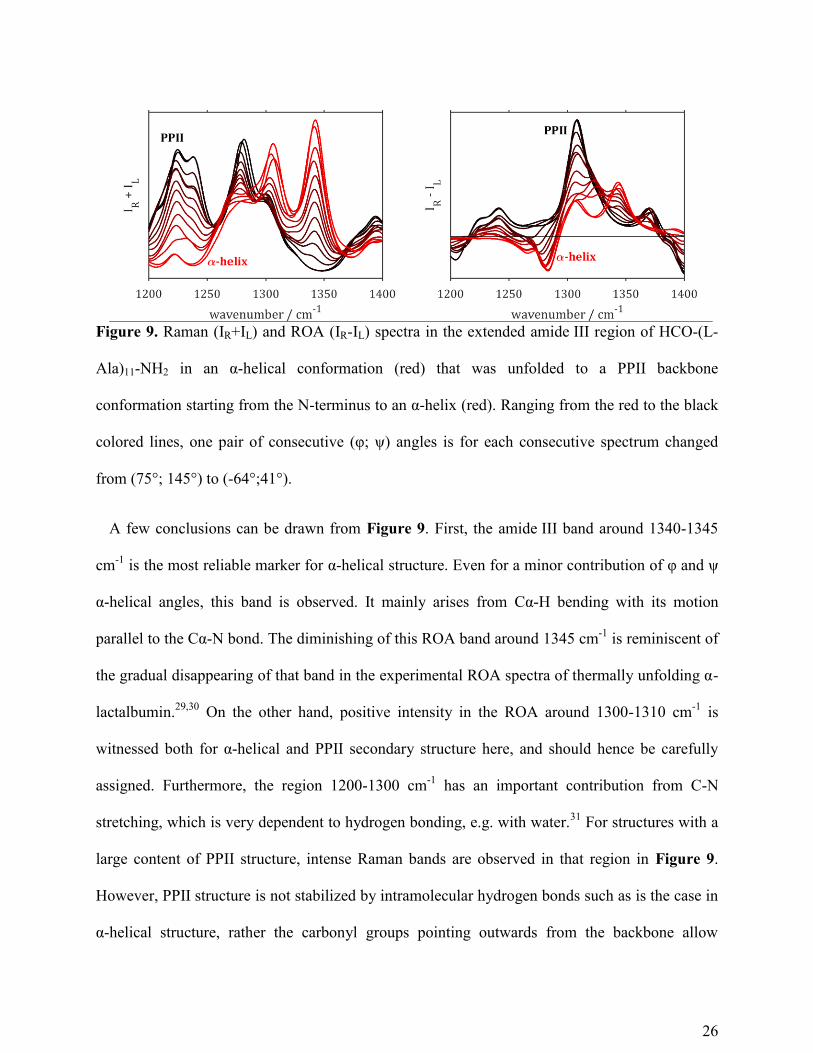
Figure 9. Raman (IR+IL) and ROA (IR-IL) spectra in the extended amide III region of HCO-(L-
Ala)11-NH2 in an α-helical conformation (red) that was unfolded to a PPII backbone
conformation starting from the N-terminus to an α-helix (red). Ranging from the red to the black
colored lines, one pair of consecutive (φ; ψ) angles is for each consecutive spectrum changed
from (75°; 145°) to (-64°;41°).
A few conclusions can be drawn from Figure 9. First, the amide III band around 1340-1345
cm-1
is the most reliable marker for α-helical structure. Even for a minor contribution of φ and ψ
α-helical angles, this band is observed. It mainly arises from Cα-H bending with its motion
parallel to the Cα-N bond. The diminishing of this ROA band around 1345 cm-1
is reminiscent of
the gradual disappearing of that band in the experimental ROA spectra of thermally unfolding α-
lactalbumin.29,30
On the other hand, positive intensity in the ROA around 1300-1310 cm-1
is
witnessed both for α-helical and PPII secondary structure here, and should hence be carefully
assigned. Furthermore, the region 1200-1300 cm-1
has an important contribution from C-N
stretching, which is very dependent to hydrogen bonding, e.g. with water.31
For structures with a
large content of PPII structure, intense Raman bands are observed in that region in Figure 9.
However, PPII structure is not stabilized by intramolecular hydrogen bonds such as is the case in
α-helical structure, rather the carbonyl groups pointing outwards from the backbone allow
27
hydrogen bonding with water.11
This urges the need to study the effect of explicit hydration on
the ROA patterns in more detail, specifically in the case of PPII structure. Also the negative
ROA band around 1280 cm-1
appears upon hydrogen bond formation in the α-helical segment of
the model peptide. Experimentally, the ROA spectra of IDPs show a negative band in this region.
Based on the calculations in this study, there are no indications this negative band arises from
PPII secondary structure, which is the main structural element of IDPs. The calculated spectra in
this study however show that it could arise from helical contributions.
Conclusions
This study of the effect of conformational dynamics and structural disorder showed that ROA
patterns mainly reflect the average distribution of the backbone conformation. Therefore, the
approach to elucidate experimental ROA spectra based on a large database of calculated spectra
of fixed model structures reported before by our group is a good simple methodology to study
the amide modes.10
Only upon larger variation of the backbone angles of common secondary
structure elements such as PPII and left-handed helical structure, the ROA patterns average.
This study furthermore supports the view that experimental ROA patterns likely stem from the
most rigid components in the structural ensemble. For example, in the case of IDPs, a strong
positive band ~ 1318 cm-1
in the amide III reflects PPII secondary structure with backbone
angles close (variation of the mean angles σ ≤ 20°) to the average PPII backbone angles (φ = -
75° and ψ = 145°), rather than a fully flexible structure with the mean backbone angles being φ =
-75° and ψ = 145°. Furthermore, the mixing of PPII with other secondary structure elements may
explain the experimentally observed ROA patterns. Mixing of PPII structure with right-handed
helical structure is more reminiscent of experimental ROA patterns than mixing with β-strand
28
structure. Both hydration32
and the explicit side-chains33,34
have been suggested to influence the
ROA patterns, yet these effects are not fully understood. Future research on the ROA patterns of
proteins should therefore focus on the effect of explicit solvation and the effect of the amino acid
side-chains on the on the calculated spectra. Since IDPs are hydrated, the effect of water
molecules near the peptide will probably have a large effect on the amide modes. Furthermore, it
was shown that ROA is extremely sensitive to the exact conformation of α-helical structure and
the tilt of the carbonyl groups in the C=O∙∙∙H-N hydrogen bonds, which could be affected by
explicit hydrogen bonding with water.10
Also the CH and CH2 groups in amino acid side-chains
could have a pronounced effect on e.g. the amide III region through coupling of the vibrational
modes of these groups with Cα-H and N-H bending modes, which will hence be the focus of our
future research.
ASSOCIATED CONTENT
Supporting Information.
The Raman and ROA spectra of the separate conformations of which the mean spectra are
shown in Figure 3 as well as the Raman spectra computed for the conformations for which to the
ROA spectra are shown in Figure 6 and Figure 7 are included in the supporting information. This
material is available free of charge online at http://pubs.acs.org/.
AUTHOR INFORMATION
Corresponding Author
*Phone: +32 3 265 35 05. Fax: +32 3 265 32 33. E-mail: [email protected].
ACKNOWLEDGMENT
29
We thank the Flemish Supercomputing Centre (VSC) for providing computing resources and
support. C.M. acknowledges the University of Antwerp for funding his research. C.M. also
thanks prof. Malene Ringkjøbing Jensen and prof. Michele Vendruscolo for providing the α-
synuclein ensembles.
ABBREVIATIONS
ROA, Raman optical activity; IDP, intrinsically disordered protein; DFT, density functional
theory; PPII, poly-L-proline type II helix; NMR, nuclear magnetic resonance; scrf, self-
consistent reaction field.
REFERENCES
(1) Barron, L. D.; Hecht, L.; Blanch, E. W.; Bell, A. F. Prog. Biophys. Mol. Biol. 2000, 73, 1–
49.
(2) Barron, L. D. Biomed. Spectrosc. Imaging 2015, 4, 223–253.
(3) Hudecova, J.; Kapitan, J.; Baumruk, V.; Hammer, R. P.; Keiderling, T. A.; Bour, P. J.
Phys. Chem. A 2010, 114, 7642–7651.
(4) Mensch, C.; Pendrill, R.; Widmalm, G.; Johannessen, C. ChemPhysChem 2014, 15, 2252–
2254.
(5) Johannessen, C.; Pendrill, R.; Widmalm, G.; Hecht, L.; Barron, L. D. Angew. Chemie Int.
Ed. 2011, 50, 5349–5351.
(6) Van de Vondel, E.; Mensch, C.; Johannessen, C. J. Phys. Chem. B 2016, 120, 886–890.
(7) Mensch, C.; Konijnenberg, A.; Van Elzen, R.; Lambeir, A.-M.; Sobott, F.; Johannessen,
C. J. Raman Spectrosc. 2017, 48, 910–918.
30
(8) Uversky, V. N. Protein Sci. 2013, 22, 693–724.
(9) Wilson, G.; Hecht, L.; Barron, L. D. Biochemistry 1996, 35, 12518–12525.
(10) Mensch, C.; Barron, L. D.; Johannessen, C. Phys. Chem. Chem. Phys. 2016, 18, 31757–
31768.
(11) Adzhubei, A. A.; Sternberg, M. J. E.; Makarov, A. A. J. Mol. Biol. 2013, 425, 2100–2132.
(12) Tien, M. Z.; Sydykova, D. K.; Meyer, A. G.; Wilke, C. O. PeerJ 2013, 1, e80.
(13) Bour, P.; Keiderling, T. A. J. Chem. Phys. 2002, 117, 4126–4132.
(14) Frisch, M. J.; Trucks, G. W.; Schlegel, H. B.; Scuseria, G. E.; Robb, M. A.; Cheeseman, J.
R.; Scalmani, G.; Barone, V.; Petersson, G. A.; Nakatsuji, H.; Li, X.; Caricato, M.;
Marenich, A. V.; Bloino, J.; Janesko, B. G.; Gomperts, R.; Mennucci, B.; Hratchian, H.
P.; Ortiz, J. V.; Izmaylov, A. F.; Sonnenberg, J. L.; Williams-Young, D.; Ding, F.;
Lipparini, F.; Egidi, F.; Goings, J.; Peng, B.; Petrone, A.; Henderson, T.; Ranasinghe, D.;
Zakrzewski, V. G.; Gao, J.; Rega, N.; Zheng, G.; Liang, W.; Hada, M.; Ehara, M.; Toyota,
K.; Fukuda, R.; Hasegawa, J.; Ishida, M.; Nakajima, T.; Honda, Y.; Kitao, O.; Nakai, H.;
Vreven, T.; Throssell, K.; Jr., J. A. M.; Peralta, J. E.; Ogliaro, F.; Bearpark, M. J.; Heyd, J.
J.; Brothers, E. N.; Kudin, K. N.; Staroverov, V. N.; Keith, T. A.; Kobayashi, R.;
Normand, J.; Raghavachari, K.; Rendell, A. P.; Burant, J. C.; Iyengar, S. S.; Tomasi, J.;
Cossi, M.; Millam, J. M.; Klene, M.; Adamo, C.; Cammi, R.; Ochterski, J. W.; Martin, R.
L.; Morokuma, K.; Farkas, O.; Foresman, J. B.; Fox, D. J. Gaussian 16, Revision A.03,
2016.
(15) Jmol: an open-source Java viewer for chemical structures in 3D. http://www.jmol.org/.
31
(16) CYLview: Visualization and analysis software for computational chemistry.
http://www.cylview.org/.
(17) Barron, L. D.; Zhu, F.; Hecht, L.; Tranter, G. E.; Isaacs, N. W. J. Mol. Struct. 2007, 834–
836, 7–16.
(18) Zhu, F.; Kapitan, J.; Tranter, G. E.; Pudney, P. D. A.; Isaacs, N. W.; Hecht, L.; Barron, L.
D. Proteins Struct. Funct. Bioinforma. 2007, 70, 823–833.
(19) Blanch, E. W.; Morozova-Roche, L. A.; Cochran, D. A. E.; Doig, A. J.; Hecht, L.; Barron,
L. D. J. Mol. Biol. 2000, 301, 553–563.
(20) Schweitzer-Stenner, R.; Measey, T. J. Proc. Natl. Acad. Sci. 2007, 104, 6649–6654.
(21) Zagrovic, B.; Lipfert, J.; Sorin, E. J.; Millett, I. S.; van Gunsteren, W. F.; Doniach, S.;
Pande, V. S. Proc. Natl. Acad. Sci. 2005, 102, 11698–11703.
(22) Blanch, E. W.; Bell, A. F.; Hecht, L.; Day, L. A.; Barron, L. D. J. Mol. Biol. 1999, 290, 1–
7.
(23) Blanch, E. W.; Hecht, L.; Day, L. A.; Pederson, D. M.; Barron, L. D. J. Am. Chem. Soc.
2001, 123, 4863–4864.
(24) Jacob, C. R.; Reiher, M. J. Chem. Phys. 2009, 130, 084106.
(25) Tóth, G.; Gardai, S. J.; Zago, W.; Bertoncini, C. W.; Cremades, N.; Roy, S. L.; Tambe, M.
A.; Rochet, J.-C.; Galvagnion, C.; Skibinski, G.; Finkbeiner, S.; Bova, M.; Regnstrom, K.;
Chiou, S.-S.; Johnston, J.; Callaway, K.; Anderson, J. P.; Jobling, M. F.; Buell, A. K.;
Yednock, T. A.; Knowles, T. P. J.; Vendruscolo, M.; Christodoulou, J.; Dobson, C. M.;
32
Schenk, D.; McConlogue, L. PLoS One 2014, 9, e87133.
(26) Allison, J. R.; Varnai, P.; Dobson, C. M.; Vendruscolo, M. J. Am. Chem. Soc. 2009, 131,
18314–18326.
(27) Schwalbe, M.; Ozenne, V.; Bibow, S.; Jaremko, M.; Jaremko, L.; Gajda, M.; Jensen, M.
R.; Biernat, J.; Becker, S.; Mandelkow, E.; Zweckstetter, M.; Blackledge, M. Structure
2014, 22, 238–249.
(28) McColl, I. H.; Blanch, E. W.; Gill, A. C.; Rhie, A. G. O.; Ritchie, M. A.; Hecht, L.;
Nielsen, K.; Barron, L. D. J. Am. Chem. Soc. 2003, 125, 10019–10026.
(29) Wilson, G.; Ford, S. J.; Cooper, A.; Hecht, L.; Wen, Z. Q.; Barron, L. D. J. Mol. Biol.
1995, 254, 747–760.
(30) Wilson, G.; Hecht, L.; Barron, L. D. J. Mol. Biol. 1996, 261, 341–347.
(31) Myshakina, N. S.; Ahmed, Z.; Asher, S. A. J. Phys. Chem. B 2008, 112, 11873–11877.
(32) Luber, S. J. Phys. Chem. A 2013, 117, 2760–2770.
(33) Kessler, J.; Kapitan, J.; Bour, P. J. Phys. Chem. Lett. 2015, 6, 3314–3319.
(34) Kessler, J.; Yamamoto, S.; Bour, P. Phys. Chem. Chem. Phys. 2017, 19, 13614–13621.