Embed Size (px)
Citation preview

Task 3.2
Conceptual Model Review ofNapa Valley Groundwater Model
Prepared for:Napa County
November 2010

NOVEMBER 2010 CONCEPTUAL MODEL REVIEW
LUHDORFF & SCALMANINI, CONSULTING ENGINEERS i
TABLE OF CONTENTS1.0 Introduction ........................................................................................................................ 1
1.1 Groundwater Model Purpose ........................................................................................... 12.0 Model Code Selection ........................................................................................................ 23.0 DHI Conceptual Model...................................................................................................... 3
3.1 Preliminary Evaluation of Conceptual Model ..................................................................... 54.0 Model Development and Construction ............................................................................ 6
4.1 Pumping/Irrigation ................................................................................................................ 74.2 Representation of Streams ................................................................................................... 84.3 Groundwater Recharge ........................................................................................................ 8
5.0 Review of Model Development ......................................................................................... 95.1 Aquifer Properties ................................................................................................................ 95.2 Groundwater Pumping ....................................................................................................... 105.3 Groundwater/Surface Water Interactions .......................................................................... 115.4 Groundwater Recharge ...................................................................................................... 11
6.0 Model Calibration ............................................................................................................. 116.1 Review of Model Calibration............................................................................................ 12
7.0 Conclusions and Recommendations ............................................................................... 138.0 References ......................................................................................................................... 16
List of TablesTable 1 – Aquifer Properties as Reported in Final BDR Technical
Appendix (DHI, 2006a) ...........................................................................................8Table 2 – Groundwater Pumping by Area .......................................................................................9Table 3 – Estimated Groundwater Recharge .................................................................................10
Attachment AAttachment B

NOVEMBER 2010 CONCEPTUAL MODEL REVIEW
LUHDORFF & SCALMANINI, CONSULTING ENGINEERS 1
1.0 Introduction
The purpose of this technical memorandum is to provide a general review of the Napa ValleyGroundwater model (groundwater model) produced by DHI Water & Environment (DHI) as partof the 2005 Napa County Baseline Data Report (2005 BDR) (Jones & Stokes et al., 2005). Thismemorandum is not intended to be a full peer-review in which model code, input/output files,and output results would be analyzed. Opinions stated herein are based solely on a review of the2006 Final BDR Technical Appendix (DHI, 2006a), which presents the model code, modelconstruction, calibration, and application of modeling efforts introduced in Chapters 15, 16, and17 of the BDR. Further information on the groundwater model was reviewed from the 2005 BDRand a 2007 technical memorandum Modeling Analysis in Support of Vineyard DevelopmentScenarios Evaluation (DHI, 2007) in which the groundwater model was updated/expanded andapplied in evaluating various vineyard development scenarios. The scope of Luhdorff &Scalmanini, Consulting Engineers’ (LSCE) work, described herein, included a review of theconceptual model developed by DHI from which the inputs to the groundwater model werebased. In addition, information provided on the model code, construction, and development ofthe groundwater model and model calibration were also reviewed. The focus of LSCE’s workwas to assess whether the information provided in the reviewed documents was complete andwhether the model can be used for the stated purpose for which it was developed.
This technical memorandum includes a summary description of the information provided in thedocuments regarding the purpose of the groundwater model, the conceptualization of thegroundwater system being modeled (the conceptual model), groundwater model construction anddevelopment, and groundwater model calibration, with each section followed by the results ofLSCE’s review. Tables and figures from DHI’s Final BDR Technical Appendix (2006) andSensitivity Analysis of the Napa County Water Quantity and Water Quality Models (2006)referred to in the text of this memorandum have been included in Attachments A and B,respectively.
1.1 Groundwater Model Purpose
The groundwater model was developed by DHI in conjunction with the Napa Valley and LakeBerryessa Surface Water models to simulate existing groundwater and surface water conditionson a regional basis. The groundwater model could be further developed in the future to assesslocalized and site specific environmental effects related to specific projects.
The groundwater model focused on those regions within Napa County where “groundwater is asignificant source of potable water” (DHI, 2006a), primarily in the North Napa Valley and theMilliken-Sarco-Tulucay (MST) and Carneros Subareas.
The purpose of the groundwater model as currently constructed is for assessing regional ratherthan local groundwater conditions. From what was reviewed, it appears that further work on thegroundwater model would be necessary for it to be considered for local or site specificapplications. The groundwater model also focuses on selected subareas of the Napa Valleywhere groundwater is a significant source of potable water. This seems to indicate that areas

NOVEMBER 2010 CONCEPTUAL MODEL REVIEW
LUHDORFF & SCALMANINI, CONSULTING ENGINEERS 2
where there are currently significant amounts of private pumping (not municipal or agricultural)are where the groundwater modeling effort was focused. Areas where future growth isanticipated in the County, where private groundwater pumping is anticipated to increase, do notappear to have been a focus of the model effort.
2.0 Model Code Selection
As described in the reviewed reports and documentation, the groundwater model was created inconjunction with the Napa River and Lake Berryessa Surface Water models and water qualitymodels for Napa County using the proprietary MIKE SHE model code. Specifically, thegroundwater model covered the same area as the Napa River Surface Water model, while theLake Berryessa Surface Water Model simulated a different portion of Napa County. MIKE SHEis a “physically based distributed hydrologic model that simulates the major flow components ofthe land-based portion of the hydrologic cycle” (DHI, 2006a). The model code allows for thecoupling of groundwater and surface water models. As a groundwater model, MIKE SHE issimilar to MODFLOW, as they both incorporate a modular structure in which the user can addcomponents of the hydrologic cycle which are represented in the modeled area. The surfacewater model code incorporates several model components, each containing several solutionoptions for the processes being simulated. The surface water model provides the ability tosimulate groundwater recharge from the simulation of surface water features (overland flow,channel flow, and precipitation). Also, MIKE SHE provides flexibility by allowing the modelerto emphasize more important processes while simplifying less important ones.
The description of the model code, which was presented in the model reports and documentation,and the menu of model components and solution methods that could be or were selected formodeling the groundwater system in the Napa Valley indicate that MIKE SHE is a complexmodel code in which a clear understanding of the purpose for developing the model and a welldeveloped conceptual model are required. Otherwise the selection of model components andsolution algorithms will introduce limitations to the use of the model. It appeared from thedocumentation that the groundwater model coupled to the surface water model is not simulatingimportant stream aquifer interactions, selected recharge processes, and geologic features whichmay impact groundwater flow. This may be the result of the lack of a complete description ofthese issues in the documentation or a shortcoming in the model code. A follow-up conversationwith Jeremy Kobor indicated that the surface and groundwater models are fully coupled and fullysimulate stream-aquifer interaction (Kobor, 2010). Further investigation of the groundwater andsurface water model files will be necessary to confirm the simulation of groundwater and surfacewater interactions.
All groundwater modeling platforms have limitations which must be considered in selectingwhich model platform to use. MIKE SHE, as applied in creating the Napa Valley Groundwatermodel, is limited in the following way. In creating the Napa Valley Surface Water model, whichwas used as a dynamic boundary condition for the groundwater model, the two-layer UZ/ET(unsaturated zone/evapotranspiration) method was selected to represent conditions in theunsaturated zone and the Linear Reservoir algorithm was selected to represent the saturated zoneor groundwater system. The use of these two algorithms together does not allow the groundwatertable to fluctuate throughout the model domain. This simplification, as outlined in section 2.5.1.1

NOVEMBER 2010 CONCEPTUAL MODEL REVIEW
LUHDORFF & SCALMANINI, CONSULTING ENGINEERS 3
of Final BDR Technical Appendix (DHI, 2006a), can lead to an underestimation of ET andcreates a semi-integrated groundwater/surface water model which “lacks the gradient-drivenproperties of flow of a fully physically based solution.” Essentially, discharge of groundwater tosurface water features was not simulated or is partially simulated. As stated in section 2.5.1.1 ofFinal BDR Technical Appendix:
“The linear reservoir algorithm for the [saturated zone] is a groundwater balance tool thatprovides baseflow into the MIKE 11 river network. Use of the linear reservoir algorithmis effective for establishing water budgets, but should not be used for applications wherethe specific groundwater questions need to be addressed.” (DHI, 2006a)
For this reason, the current modeling approach could not be used to investigate pumping inducedchanges to groundwater/surface water interactions (e.g., changing seepage losses due todeclining groundwater levels). This limitation could be resolved where necessary by using the 3-dimensional finite difference algorithm (instead of the linear reservoir algorithm) for the NapaValley Surface Water model, assuming no computational limitations would prevent this.
Overall, the selection of the MIKE SHE platform may be adequate for modeling the groundwaterconditions that exist in the Napa Valley. However, the current selection of model code optionsmay not allow the groundwater model to adequately represent groundwater conditions, andespecially groundwater/surface water interactions, in the Napa Valley as is discussed in greaterdetail below. In addition, the complexity of the model code would likely require Napa Countyto contract out work utilizing the groundwater model rather than having in-house capability torun predictive scenarios to assess impacts from future developments or groundwatermanagement programs.
3.0 DHI Conceptual Model
The first step in creating any groundwater/surface water model is to develop a conceptualunderstanding of the geologic and hydrologic conditions of the area being modeled. Thisconceptualization (commonly referred to as the conceptual model) is created based on availableknowledge of the area and is the foundation from which a model is developed. The conceptualmodel also provides constraints on the adjustment of model inputs during model calibration.Partial descriptions of some conceptual model components that were incorporated in thegroundwater model are described in the Final BDR Technical Appendix (DHI, 2006a) andModeling Analysis in Support of Vineyard Development Scenarios Evaluation (DHI, 2007). Thissection provides a brief overview and preliminary evaluation of the conceptual modelcomponents that were used for the Napa River Watershed Groundwater model.
The documentation that was reviewed did not present a clear understanding that a conceptualmodel was developed to form the basis for the development of the groundwater model. Thedocumentation lacked complete descriptions of all the recharge and discharge components thatexist in the Napa Valley in addition to geologic features which may impact groundwater flow inthe model area. The documentation focused on a description of the primary water producinggeologic units that are present in the North Napa Valley area and the MST and CarnerosSubareas. The groundwater model covers the Napa River watershed with the north, east, and

NOVEMBER 2010 CONCEPTUAL MODEL REVIEW
LUHDORFF & SCALMANINI, CONSULTING ENGINEERS 4
west boundaries following drainage divides and the southern boundary open to the San FranciscoBay (Figure 2-6, Attachment A). The complex geology of the Napa Valley area and the MSTSubarea was briefly described with references to previous USGS (Faye, 1973; Johnson, 1977;Farrar and Metzger, 2003) reports. A description of the Huichica Formation in the CarnerosSubarea was not presented. The Napa River watershed was generally conceptualized as a largebasin of impermeable rock overlain in three distinct areas by more permeable units. The threeareas that were the focus of the groundwater model were the North Napa Valley area and theMST and Carneros Subareas. Each of these three areas was represented as a separate water-producing geologic unit. The geologic unit that is the primary source for groundwater in theNorth Napa Valley area was the Napa Valley Alluvium, which consists of highly permeable,unconsolidated alluvium eroded from the surrounding hills/mountains and concentrated in thecenter of Napa Valley. This alluvium is unconfined near the surface and semi-confined at depth.Wells screened within this unit tend to be highly productive (yields on the order of 3,000 gpm).The extent of the alluvium and thickness was extrapolated south of the North Napa Valley areathrough a review of previous reports and well logs. The thickness of the alluvium increases in awesterly and southerly direction within the Napa Valley Floor toward the San Francisco Bay.Values and distribution of hydraulic conductivity (K) for the North Napa Valley area reflected asimilar distribution as was presented in Faye (1973), and extrapolated to the rest of the NapaValley Floor to the south. The initial values of K ranged from 0.5 to 80 feet/day. In the MSTSubarea, the primary aquifer consists of fractured and interbedded tuffaceous Sonoma Volcanicslocated east of the Soda Creek Fault. There is a small area of the MST located west of the SodaCreek Fault in which alluvium is the primary groundwater-bearing unit. Within the SonomaVolcanics, yields are on the order of 150 gpm in the more productive wells. The tuffaceousmember of the Sonoma Volcanics, which is the primary aquifer for the MST Subarea east of thefault, is underlain by relatively impermeable andesite. The Carneros Subarea is dominated by theHuichica Formation. Well yields are generally less than 5 gpm in this area. There is very littlegeologic or groundwater level data available for the Carneros Subarea which limits theconceptualization and representation of this area.
The description of boundary conditions, including recharge and discharge components of themodel domain, were limited to brief descriptions of the primary uses of groundwater forirrigation, private domestic use, and open space along with selected recharge components relatedto precipitation and streamflow. Groundwater pumping in Napa County is limited to agriculturalirrigation (>95% vineyards), irrigation of open spaces, rural residential use, and winery use.None of the municipalities in the county rely on groundwater. Pumping data for each of theseuses were estimated since residential and agricultural pumping are not metered, and no electricconsumption records were available for irrigation wells. As a result, a number of assumptionswere implemented in the estimation of groundwater pumping. These assumptions includedestimating total groundwater pumping rates to be equal to existing and projected water demandsfor rural residential, open space irrigation, and winery use, as reported in a 2005 report by WestYost and Associates (WYA, 2005). These demands were distributed evenly over areasdesignated as “developed” in land-use data that did not fall within city boundaries of any of themunicipalities (Figure 2-31 Attachment A). Groundwater pumping for irrigated agriculture wasbased on California Department of Water Resources (DWR) estimates of applied water forvineyards in the Napa Valley. The DWR data were based on 2001 data which reported vineyardirrigation at 38,600 ac-ft/yr applied to 34,300 acres of vineyards (equivalent to 13.5 in/yr).

NOVEMBER 2010 CONCEPTUAL MODEL REVIEW
LUHDORFF & SCALMANINI, CONSULTING ENGINEERS 5
Precipitation was described as the primary recharge source along with recharge from streamflow.Precipitation data were derived from precipitation stations around Napa County and fromstatewide estimates.
3.1 Preliminary Evaluation of Conceptual Model
The documentation of the conceptual model for the area was not well described or explained.The conceptual model should account for or include a description of the following items:
Regional and local geologic conditions, including structural features which influencegroundwater flow and occurrence;Regional and local groundwater conditions and trends;Groundwater recharge components and occurrence, including precipitation, rechargefrom irrigation, imported water, recharge from streams and other surface water features,manmade recharge facilities, and subsurface inflows. The spatial and temporalvariability of these components should be presented;Discharge components, including groundwater pumping, evaporation, andevapotranspiration of irrigated crops and native vegetation should be presented. Inaddition, the quantity and purpose of groundwater pumping, groundwater discharge tostreams, and subsurface outflow should be discussed; andAquifer properties of the various geologic units being simulated;
The conceptualization of the Napa River watershed presented a general description of the majorgeologic units that ultimately were simulated in the Napa Valley Floor, including the MSTSubarea. However, a description of the Huichica Formation in the Carneros Subarea was notpresented. Information regarding features which influence groundwater flow (impermeableunits, faults, etc.) were not fully addressed, especially the role of the Soda Creek Fault in theMST Subarea. The description of recharge components failed to address groundwater rechargefrom irrigation, the fate of imported water which is used by municipalities for water supply, thefate of water pumped for private use, and stream/aquifer interaction within the model area.Some of the discharge components which exist in the model area such as contribution ofgroundwater to streamflow and subsurface outflows in the model area were either not welldocumented or absent. The information provided on the distribution of aquifer properties in thegeologic units was incomplete as the distribution of storage values (specific yield and storativity)and level of confinement for the aquifer units present in the model area were not fully described.The understanding of the distribution of K in the North Napa Valley area was primarilyreferenced from previous documents; however, the understanding of K distribution in theremaining portion of Napa Valley was not verified by an examination of existing data (welllogs).
In summary, there was not a complete description of the conceptual model or an identification ofthe components of the conceptual model that exist in the Napa Valley. As a result, it is difficultto assess how representative the groundwater model is to the Napa River watershed system beingsimulated. A follow-up letter from Jeremy Kobor (Kobor, 2008) identified the lack of data in theCarneros Subarea in particular and the Napa Valley in general, however, there remains a lack of

NOVEMBER 2010 CONCEPTUAL MODEL REVIEW
LUHDORFF & SCALMANINI, CONSULTING ENGINEERS 6
completeness in the identification of hydrogeologic processes that exist which could lead tomodel input parameters (discussed further below) that were adjusted during calibration from notbeing representative of groundwater conditions within the watershed area.
4.0 Model Development and Construction
The groundwater model encompasses the Napa River watershed and consists of two layers. Theupper layer was designated as being unconfined and the lower layer was designated as confined.Three primary areas within the Napa River watershed were the focus of the groundwater model:the Napa Valley Floor and the MST and Carneros Subareas. The Napa Valley Groundwatermodel is a regional representation of the three primary aquifers in the Napa River watershed: 1)Napa Valley Alluvium (Valley Floor), 2) Permeable Sonoma Volcanics (MST Subarea), 3)Huichica Formation (Carneros Subarea). Aquifer parameters were based on geologic studies ofthe areas being modeled, where available, and were estimated otherwise. The Napa ValleyAlluvium was simulated as the primary water-bearing unit in the Napa Valley Floor, while thetuffaceous unit of the Sonoma Volcanics and the Huichica Formation were the primary water-bearing units simulated in the MST and Carneros Subareas. The initial assignments of aquiferproperties for these three water-bearing units were based on information presented in historicaldocuments (Faye, 1973) for the Napa Valley Alluvium and Johnson (1977) for the SonomaVolcanics in the MST. No information was available for the Huichica Formation so values anorder of magnitude less than the Sonoma Volcanics were used initially (for hydraulicconductivity). Aquifer values for the impermeable rock units that were simulated in areasoutside the Napa Valley Floor, including outside the MST and Carneros Subareas, were assignedaquifer properties based on literature values. The aquifer values were subsequently revisedduring model calibration. Table 1 lists the initial values of aquifer properties that were inputinto the groundwater model. Literature values representative of impermeable rocks (Fetter, 2001)were used to represent the impermeable units of the remaining Napa River watershed.
The selection and description of boundary conditions were not discussed in any of thedocumentation provided other than the tidal fluctuations in the San Francisco Bay that were usedin the southern portion of the model domain. The model domain is subdivided into cells that are250 meters on each side. The calibration period is four years in length and spans from January2000 to December 2003. Time steps vary from 15 minutes to 8 hours. The use and length ofstress periods were not reported. The methodology used in selecting initial conditions was alsonot reported.

NOVEMBER 2010 CONCEPTUAL MODEL REVIEW
LUHDORFF & SCALMANINI, CONSULTING ENGINEERS 7
Table 1Aquifer Properties as Reported in Final BDR Technical Appendix (DHI, 2006a)
Alluvium HuichicaFormation
ImpermeableSonoma
Volcanics
PermeableSonoma
Volcanics(MST)
Kxy (ft/day) 40 to 110 0.2 1.00E-04 2Source Table 2-11 Table 2-11 Table 2-11 Table 2-11Kz (ft/day) 4 to 11 0.2 1.00E-04 2Source Table 2-11 Table 2-11 Table 2-11 Table 2-11 Sy 0.08 0.035 0.02 0.046Source Table 2-11 Table 2-11 Table 2-11 Table 2-11n 0.25 0.15 0.02 0.2Source Table 2-11 Table 2-11 Table 2-11 Table 2-11Ss 8.84E-06 1.41E-06 1.38E-06 1.43E-06Source Table 2-11 Table 2-11 Table 2-11 Table 2-11
Kz = vertical hydraulic conductivity; Kxy = horizontal hydraulic conductivity;Sy = specific yield; n = porosity; Ss = specific storageAdapted from Table 2-11, Figures 2-29 and 2-30 (Attachment A)
4.1 Pumping/Irrigation
Groundwater pumping was distributed evenly, using wells, over lands designated as the majorland use categories (rural residential, improved open spaces, wineries, and agricultural irrigation)(Figure 2-32 Attachment A). The water demand, realized in the model as distributed pumpingand irrigation, was spread throughout the year as described in Table 2-12 (Attachment A).Table 2 provides a breakdown of groundwater pumping as applied in the Napa ValleyGroundwater model.
Pumping was implemented in the model as a series of pumping wells with the pumping beingevenly distributed over those areas which used groundwater and were outside of city boundaries.The amount of groundwater pumped for irrigation was assumed to be similar to the volumeapplied for irrigation. The amount of groundwater pumped for irrigation did not change on anannual basis and accounted for frost protection, heat protection, and irrigation needs.

NOVEMBER 2010 CONCEPTUAL MODEL REVIEW
LUHDORFF & SCALMANINI, CONSULTING ENGINEERS 8
Table 2Groundwater Pumping by Area*
(reported as ac-ft/yr)
Groundwater UseCategory
NorthNapa
Valley
Milliken-Sarco-
TulucaySubarea
CarnerosSubarea Total
Rural Residential 2300 800 350 3450Improved OpenSpaces 1111 1564 96 2771Wineries 974 87 259 1320Irrigated Agriculture* - - - 38600
* Adapted from Napa County Final BDR Technical Appendix (DHI, 2006a)** Values for distribution of irrigated agricultural pumping by area not reported.
4.2 Representation of Streams
Streamflow was modeled using MIKE 11, a one-dimensional hydrodynamic module used toanalyze the movement of water in a river network, including flow through man-made structuresand other surface water features. The main stream and 2 to 3 tributaries from each of the 188watersheds in the Napa River Watershed Model area were extracted from the 1-meter resolutiondigital elevation model (DEM) provided by the County. Upstream boundaries for each of thestreams were defined by a no-flow boundary condition at the upper topographic limit of thewatersheds. The downstream boundary was defined as the point where the Napa River crossesthe southern county boundary. Tidal water levels from the Mare Island Navy Shipyard NationalOceanic and Atmospheric Administration station were used for the southernmost boundarycondition. Stream channel dimensions were derived using an empirical relationship that relatesthe upstream drainage area to the average channel width and depth for streams in the SanFrancisco Bay region (See Final BDR Technical Appendix pg. 2-11). The MIKE SHEgroundwater model acts as a dynamic boundary condition for the MIKE 11 model.
4.3 Groundwater Recharge
Groundwater recharge for the Napa Valley Groundwater model is calculated in the Napa ValleySurface Water model and relayed as a “dynamic boundary condition” to the groundwater model.The amount of recharge relayed from the surface water model to the groundwater model isdependent on different soil types, their location and properties, stream channel properties (e.g.,Manning’s coefficient), as well as a number of module-specific parameters. For instance,infiltration to the unsaturated zone is controlled by a time-invariant maximum infiltration ratethat is spatially distributed according to soil type. Soil parameters used for the surface water andgroundwater models are outlined in Table 2-8 from Final BDR Technical Appendix(Attachment A).

NOVEMBER 2010 CONCEPTUAL MODEL REVIEW
LUHDORFF & SCALMANINI, CONSULTING ENGINEERS 9
All water balance information (including recharge) reported for the Napa Valley Groundwatermodel is given as a rate (in/yr) without the necessary model area required to calculate volumes.For this reason, a complete analysis of recharge to the groundwater model cannot be completed,nor can a volumetric water balance be calculated which is often a telling measure of thereliability of modeled results. Recharge values reported in 2005 BDR are provided in Table 3.
Table 3Estimated Groundwater Recharge*
(acre-feet)
Recharge SourceNorthNapa
Valley
Milliken-Sarco-
TulucaySubarea
CarnerosSubarea
Direct Precipitation ** 250 **Streambed Infiltration - 3,050** -Subsurface Inflow - 2,100 -Total 26,800 5,400 -Years Considered 1962-1989 1975 -* As reported in the 2005 BDR.
** Greatest source of recharge to area
5.0 Review of Model Development
A review of the primary input parameters described in the reviewed documents is presentedbelow. The primary input parameters include aquifer properties, groundwater pumping,groundwater/surface water interaction, and groundwater recharge.
5.1 Aquifer Properties
The input of aquifer properties was summarized fairly well in the 2005 BDR, however, the textand figures in the reviewed documents did not segregate the aquifer parameters by model layer.The reviewed documents did not differentiate between the initial and calibrated values of aquiferparameters, primarily hydraulic conductivity. The selections of calibrated hydraulic conductivityvalues in the model were not always justified nor did they appear to represent the conceptualmodel description of the distribution and/or range of values in some areas.
Another issue is the reported specific yield (Sy) values. The text of the report (see Final BDRTechnical Appendix pg. 2-16) states that Sy values for the Sonoma Volcanics and HuichicaFormation were estimated under the assumption that Sy is roughly equal to porosity (n). Yet inTable 1 (Table 2-11 in Napa County BDR Technical Appendix), reported n values are 3 to 4.5times the reported Sy values. In both cases, the K and Sy values reported in Table 1 were muchmore reasonable for the modeled system and although the text of the technical appendixrepeatedly states that the values in Table 1 are initial values, it appears that some of the initial

NOVEMBER 2010 CONCEPTUAL MODEL REVIEW
LUHDORFF & SCALMANINI, CONSULTING ENGINEERS 10
values have been replaced with other values. The values that were actually used in the modelshould be presented.
The MST Subarea was subdivided into three aquifer parameter zones that represented differenthydraulic conductivity values. The values assigned to these zones were not adequately explainednor did they appear to be supported by the conceptualization of the MST Subarea or the USGSdocuments referenced in Final BDR Technical Appendix (DHI, 2006a) used as a basis for theassignment of aquifer properties. For instance, a sharp division was created near the center ofthe MST Subarea with a K of 250 ft/day to the north and Ks of 1 to 2 ft/day in the two zoneslocated to the south (Figure 2-30, Attachment A).
While any groundwater model represents a simplification of the original conceptual model, a fewlimitations exist in the groundwater model which could lead to limitations in model application.In the MST Subarea, the Soda Creek Fault appears to have been left out of the model. This faultis a significant, well-defined structure which may have a notable influence on flow in the region.
As noted above, the geology of the region is conceptualized as a large drainage basin ofimpermeable rock overlain in three distinct areas (North Napa Valley area and the MST andCarneros Subareas) by more permeable units. Within each of these three areas, only the primaryaquifer is considered while deeper units which are less permeable than the primary aquifer arenot represented. For example, underlying the Napa Valley alluvium throughout most of thevalley is the tuffaceous member of the Sonoma Volcanics. The tuffaceous member of theSonoma Volcanics is the primary aquifer unit in the MST. While the contribution of these lesspermeable underlying units are likely minimal on the regional scale, this simplification may notbe valid when modeling more local conditions. The contribution of these underlying layers mayneed to be incorporated as the model is applied in more local studies.
An additional limitation to the model is the limited to non-existent representation of othersubareas within the model. Any part of the model not in the Napa Valley Floor, including theMST and Carneros Subareas, has been lumped into the category of “impermeable rocks”, whichdisregards any local geologic conditions. For this reason, the groundwater model should not beused to analyze these other subareas.
5.2 Groundwater Pumping
The simulation of groundwater pumping in the groundwater model is not fully explained as towhether pumping is distributed in multiple model layers or confined to a single model layer.Also, if pumping is simulated in multiple layers, then the distribution of pumping by layer needsto be clarified and the methodology that was used to segregate pumping by layer also needs to beexplained. If the model is developed to simulate local site conditions in the future, the pumpingdistribution will need to be revised, especially if pumping is confined to a single model layer.

NOVEMBER 2010 CONCEPTUAL MODEL REVIEW
LUHDORFF & SCALMANINI, CONSULTING ENGINEERS 11
5.3 Groundwater/Surface Water Interactions
The precise method used to calculate groundwater/surface water interactions for the Napa Valleysub-domain is unclear. The primary source of confusion lies in the coupling of the two models.As a stand-alone model, the Napa Valley Surface Water model does not account for baseflowcontributions from groundwater to streams, while the groundwater model does. According toTable 2-20 (Attachment A), within the North Napa Valley area, tributary recharge accounts for18% of all precipitation and the text states that the surface water model acts as a “dynamicboundary condition” for the groundwater model. It is unclear how tributary recharge is handledbetween the two models. It is also unclear whether the tributary recharge calculated in thegroundwater model is accounted for in the surface water model. Table 2-17 (Attachment A)suggests that the surface water model does not account for this contribution to streamflow andwould, therefore, underestimate streamflow and groundwater recharge from the streams. Withoutfurther inspection of the model code and input files used, it remains unclear precisely howgroundwater/surface water interactions are accounted for and how much error is introduced toboth the groundwater and surface water models by the assumptions incorporated in theirdevelopment.
5.4 Groundwater Recharge
The model currently accounts for recharge from precipitation and streams; however, rechargefrom applied irrigation is not accounted for. In addition, the fate of water used in municipalities,rural residential, and wineries is not discussed. It is not known if a portion of the water used inthese areas is accounted for as groundwater recharge.
6.0 Model Calibration
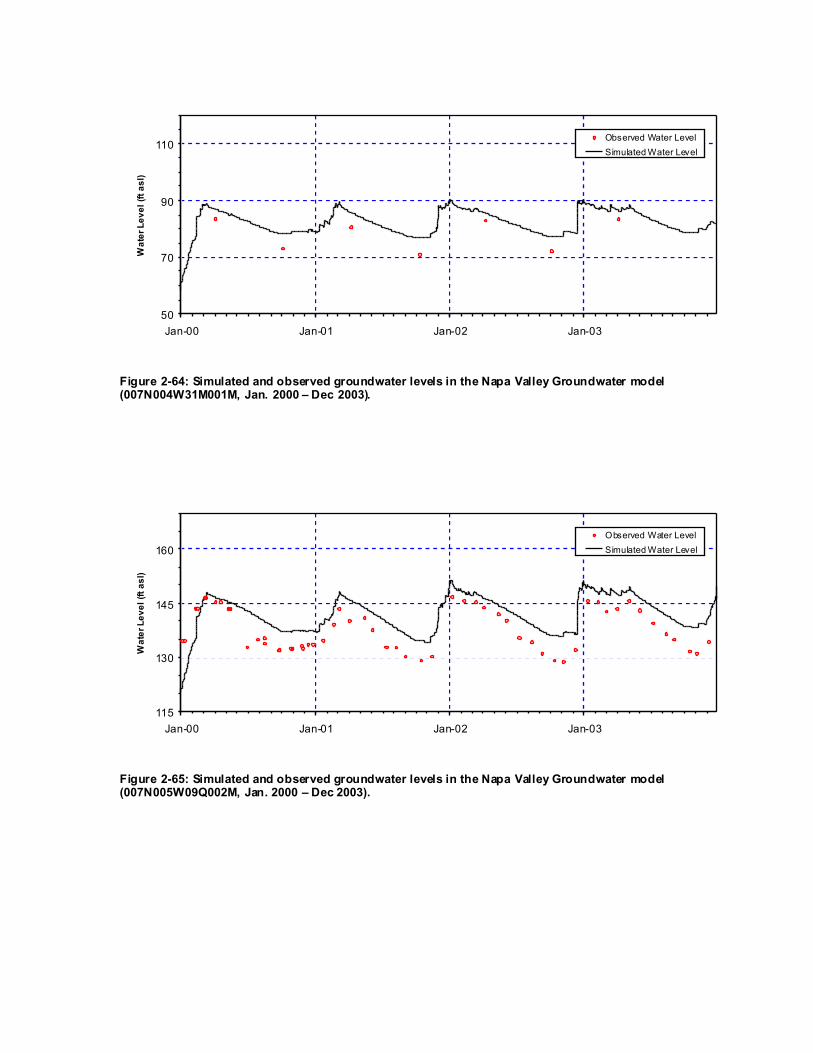
The Final BDR Technical Appendix states that “…the goal of the calibration for the Napa ValleyGroundwater Model was to provide a reasonable estimate of water-levels at the regional andsubbasin level throughout a long-term simulation period” (pg. 2-18). Six wells were selected forcalibration of the model, 3 wells are located in the North Napa Valley alluvium (50 to 434 datapoints per well) and 3 wells are located in the MST Subarea (7 to 9 data points per well) (Figure2-35, Attachment A). No wells were selected from the Carneros Subarea due to a lack ofgroundwater data spanning the modeled time period. The text states that K, Sy, and S were usedas variables in the calibration, although the methods used to adjust aquifer parameters are notoutlined. Hydrographs comparing the calibrated model results to water level measurements areprovided in the Final BDR Technical Appendix (Figures 2-61 through 2-66, Attachment A). Ingeneral, the northernmost wells (completed in the Napa Valley alluvium) most closely matchobserved water levels and trends. Measured and observed values in the north generally fallwithin 10 feet of each other. Modeled and observed water levels for the MST Subarea generallyfall within 20 feet of each other, although some points differ by as much as 40 feet. Thisincreased error in the MST Subarea is expected and likely attributed to theassumptions/simplifications incorporated to represent the complex geologic conditions of thearea. Of greater concern is the fact that all of the calibration wells consistently over predict waterlevels by varying degrees.

NOVEMBER 2010 CONCEPTUAL MODEL REVIEW
LUHDORFF & SCALMANINI, CONSULTING ENGINEERS 12
While no sensitivity analysis is mentioned in the Final BDR Technical Appendix, a separatereport, Sensitivity Analysis of the Napa County Water Quantity and Water Quality Models (DHI,2006b) analyzes the sensitivity of the model to certain parameters. Unfortunately, the parametersselected for the sensitivity analysis are all related to surface water flow (Table 1, AttachmentB). While these results are encouraging as far as the representation of different land usesthroughout the surface water model, the sensitivity of the groundwater model to the estimatedaquifer parameters remains unknown. As was mentioned in the Final BDR Technical Appendix(DHI, 2006a), a limiting factor in the development of the models was a lack of data. For theNapa Valley Groundwater model a number of simplifications were required to estimate the rangeand distribution of aquifer properties, especially in the MST and Carneros Subareas. Also, the Syand Ss of each of the aquifer units were largely unknown.
6.1 Review of Model Calibration
The selection of a very short calibration period appears to be primarily related to the surfacewater model calibration period and not reflective of the availability of longer term groundwaterlevel data that are available. The calibration of the groundwater model was extremely short (fouryears); and did not present any calibration statistics, residuals, or bias in model output. Thelimited length of the model calibration period resulted in the omission of extended dry and wetperiods. Therefore, a high degree of uncertainty exists about the capability of the model toadequately represent how the groundwater basin responds to extremes in climatic conditions. Inmanaging groundwater resources, it often is important to adequately forecast the response ofgroundwater levels when groundwater pumping is maximized during drought periods.
The limited selection of calibration wells is inadequate and is surprising given the extensivenetwork of wells that exist in the Napa Valley Floor and the MST Subarea. The lack of anycalibration in the Carneros Subarea or presentation of simulated groundwater levels in that arearesults in a lack of confidence in the reliability of the groundwater model to adequately representthe hydrogeologic conditions in that area.
The lack of a sensitivity analysis of the aquifer parameters that were selected prevents anevaluation of the model’s level of uncertainty. A sensitivity analysis should be conducted inwhich variations of the aquifer parameters by an order of magnitude or more are applied to eachindividual parameter. This would be beneficial in assessing the level of uncertainty in thecalibrated values.
To effectively analyze the development and reliability of any groundwater model, the inclusionof a volumetric water budget or mass balance is conducted. A typical water budget outlinesinflows and outflows to the model domain from each of the various model components (e.g.,pumping, discharge to streams, infiltration, and inflow/outflow at model boundaries). Checkingthese values against known or estimated values for the model area can help the developer/user todetect specific areas of concern; while the difference between total inflows and outflowsprovides a broader quantification of general model error (inflows and outflows should be roughlyequal although a percent error of 5% or less is typically considered acceptable). Thedocumentation available for the groundwater model does not provide a volumetric water budget.Instead rates in in/yr and percent of total rainfall were reported (Tables 2-16, 2-17, 2-19 and

NOVEMBER 2010 CONCEPTUAL MODEL REVIEW
LUHDORFF & SCALMANINI, CONSULTING ENGINEERS 13
2-20, Attachment A) without the model domain size which would allow for conversion tovolumes. Nevertheless, examination of the data provided offers some insight into areas where themodel could be improved.
Two tables outlining the groundwater model water balance are provided in Final BDR TechnicalAppendix (Tables 2-19 and 2-20, Appendix A), one table (2-19) summarizes the water balancefor the whole groundwater model and a second table (2-20) compares modeled values for theportion of the Napa Valley north of Oak Knoll Avenue (north Napa Valley) to values from a1991 report (Napa County Flood Control and Water Conservation District, 1991) whichgenerally covered the same portion of the Napa Valley. Similar tables are also provided for theNapa Valley Surface Water model as well (Tables 2-16 and 2-17, Appendix A). As discussed inthe BDR report, the most significant source of difference for both models is groundwater/surface water interactions. In considering the total model domain, baseflow to streams accountsfor 7.9 in/yr (Table 2-19), or 23% of total precipitation while baseflow from streams accountsfor 0.3 in/yr, or roughly 1% of total precipitation. In the north Napa Valley area (Table 2-20),modeled baseflow to streams accounts for 42% of total precipitation, and baseflow from streams(tributary recharge) accounts for 18% of total precipitation. This is compared to 12% and 7% oftotal precipitation as reported in the 1991 report. Comparison of baseflow to streams and totalgroundwater/surface water interaction between the groundwater model and the 1991 report(Table 2-20) results in a difference of 30% (42% compared to 12%) and 41% (derived from thesum of baseflow to streams and tributary recharge values in the 1991 report and compared to thesum of the same values in the groundwater model as a percent of rainfall), respectively, in thedistribution of water within the north Napa Valley area. These values become 22% and 23%,respectively, when considering the whole model area. If the model area is assumed to be 250,000acres, a 25% difference represents 178,000 acre-feet/year of water. This discrepancy is mostlikely a result of how the coupled groundwater/surface water models treat this interaction.
7.0 Conclusions and Recommendations
The MIKE SHE Napa County groundwater model was developed by DHI as a regional planningtool to primarily evaluate watershed-scale conditions and how potential land-use changes in thewatershed would affect groundwater and surface water conditions. Overall, the groundwatermodel provides a short-term snapshot of regional groundwater conditions for the Napa Riverwatershed. The model needs additional work before it can be used for local purposes, especiallyin the MST and Carneros Subareas. The MIKE SHE model code provides flexibility in adaptingthe regional model for local scale applications and individual projects of variable extent andimpact while accounting for both groundwater and surface water conditions. However, the codeis complex with many variable and solution options which would entail extensive training shouldthe County wish to use the model in-house without outside technical assistance.
The model developers conclude in the Final BDR Technical Appendix that “…specific scenariosfor using the Napa Valley Groundwater model include evaluating diversion/groundwaterpumping effects on stream flows, evaluating groundwater pumping effects on local water-levels,and studies of groundwater resources” (pg. 2-26). Application of the Napa Valley Groundwatermodel to basin-wide applications where the effects on groundwater resources from wet and dry

NOVEMBER 2010 CONCEPTUAL MODEL REVIEW
LUHDORFF & SCALMANINI, CONSULTING ENGINEERS 14
periods, along with local site-specific planning applications, is not recommended at this time forthe following reasons:
The short calibration period of four years was reportedly based upon limitations inselected surface water data availability and not on groundwater data availability. As aresult, the ability of the model to adequately simulate longer term historical conditionsthat include wet and dry periods is unknown. Therefore, the use of the model insimulations where the objective is to assess long-term trends (greater than 10 years) andclimate variations is not recommended;
The groundwater model represents a regional watershed perspective which does notincorporate locally specific geologic and hydrologic attributes;
Currently, the primary planning areas of the Napa Valley Floor and the MST andCarneros Subareas, are represented and the latter two subareas are either poorlycalibrated or not calibrated at all;
Other subareas which have existing or planned short term development of groundwaterresources, including Pope Valley, are not represented;
Solution algorithms for groundwater/surface water interactions are complex andintroduce significant error;
Groundwater/surface water interactions are modeled, but not in a fully active anddynamic method. Recharge is not accurately represented;
Documentation of the model’s boundary conditions was not available; therefore, it is notknown how the boundary conditions might influence basin conditions or future regionalgroundwater and local scale analyses;
The groundwater model contains hydraulic conductivity distributions that are notconsistent with the conceptual model.
The short calibration period, the lack of simulation of extended wet and dry periods, and the poorcalibration results along with the other items listed above result in a high degree of uncertainty.A significant level of effort would be needed to address these concerns. The complexity of theMIKE SHE model code limits the ability of Napa County staff in using the model for in-houseanalysis of regional and/or localized applications where groundwater is a primary focus. If NapaCounty does not want to rely fully on outside consultants for modeling services, it isrecommended that a public domain model code, such as the USGS MODFLOW model code beused and a new regional model with a longer calibration period be developed. Once a regionalmodel is developed with a longer calibration period, separate models which focus on localizedareas of the County could also be developed, as needed, using boundary conditions from theregional model as a foundation.
As the MST will likely continue to be a recurring area of concern, it may be in the County’sinterest to refine the physical representation of this area to more closely represent knowngeologic structures and groundwater conditions. Currently, the structure of the MIKE SHEgroundwater model and how it represents groundwater conditions in the MST Subarea does notappear to be supported by the conceptualization of the MST. Therefore, the use of the model to

NOVEMBER 2010 CONCEPTUAL MODEL REVIEW
LUHDORFF & SCALMANINI, CONSULTING ENGINEERS 15
simulate future groundwater development in the MST Subarea may not produce reliableinformation. Similarly, the existing model is not recommended for evaluating futuregroundwater conditions in the Carneros Subarea as a result of the lack of model calibration andlimited understanding of aquifer parameters and groundwater conditions in this subarea.

NOVEMBER 2010 CONCEPTUAL MODEL REVIEW
LUHDORFF & SCALMANINI, CONSULTING ENGINEERS 16
8.0 References
DHI. 2006. MIKE SHE an integrated hydrological modeling system – documentation and usersguide. November 2006.
DHI. 2006a. Final baseline data report (BDR) technical appendix – water quantity and waterquality report, Napa County, California. October 2006.
DHI. 2006b. Sensitivity analysis of the Napa County water quantity and water quality models,Napa County, California. April 2006.
DHI. 2007. Modeling analysis in support of vineyard development scenarios evaluation, NapaCounty, California. February 2007.
DHI. 2008. Recommendations for building on existing work to gain an improved understandingof the county’s groundwater resources. August 1, 2008.
Faye, R.E. 1973. Ground-water hydrology of northern Napa Valley California. Water ResourcesInvestigations 13-73, U.S. Geological Survey, Menlo Park, CA, 64 p.
Fetter, C.W. 2001. Applied hydrogeology. Prentice-Hall, Upper Saddle River, NJ, 598 p.
Johnson, M.J. 1977. Ground-water hydrology of the lower Milliken-Sarco-Tulucay Creeks Area,Napa County, California. Water Resources Investigations Report 77-82, U.S. Geological Survey,Menlo Park, CA, 40 p.
Jones and Stokes & EDAW. 2005. Napa County baseline data report. November , 2005.
Kilgren, Ryan (DHI). 2010. Personal Communication. August 2010.
Kobor, J. 2010. Personal Communication with Jeremy Kobor of O’Connor Environmental Inc.,September 28, 2010.
Luhdorff & Scalmanini, Consulting Engineers (LSCE). 2007. Technical memorandum -guidance on precipitation and streamflow monitoring activities, Napa County, California.January 2010.
Luhdorff & Scalmanini, Consulting Engineers (LSCE). 2010. Personal Communication. August2010.
Napa County Flood Control and Water Conservation District. 1991.Water resources study for theNapa County region. 59 p.
West Yost and Associates. 2005. 2050 Napa Valley Water Resources Study, Pleasanton, CA.

Attachment A

Table 2-11: Aquifer properties used in the Napa Valley Groundwater model.
Geologic Unit n Sy Ss
(ft-1)
Khoriz
(ft/day)
Kvert
(ft/day)
Alluvium 0.25 0.080 8.84E-06 40 - 110 4.0 - 11.0
Huichica Formation 0.15 0.035 1.41E-06 0.2 0.2
Impermeable Sonoma Volcanics 0.02 0.020 1.38E-06 1.0E-04 1.0E-04
Permeable Sonoma Volcanics 0.20 0.046 1.43E-06 2.0 2.0
Table 2-12: Monthly irrigation rates used in the Napa County Surface Water and Groundwater models.
Month Irrigation (in/month)
January 1.49
February 1.49
March -
April -
May 1.35
June 1.35
July 2.12
August 2.12
September 2.12
October -
November -
December 1.49
Total 13.5

Table 2-15: Runoff volume error for the Napa Valley Surface Water model calibration.
Name Simulated Runoff
Volume (TAF)
Observed Runoff
Volume (TAF)
Volume Error
(%)
Napa River @ St. Helena 241 256 6
Napa River @ Napa 607 505 20
Lake Hennessey Inflow 100 83 20
Lake Hennessey Outflow 106 23 > 100
Lake Berryessa Inflow 1141 1289 11
Notes:
Calculations are for the entire simulation period (2000-2003)
TAF = Thousand Acre-Feet
Table 2-16: Simulated annual water balance for the Napa Valley Surface Water model.
Depth (in/yr) Volume (TAF/yr)
Rainfall 33.8 692
Evapotranspiration 20.3 416
Overland Flow to Streams 1.8 36
Groundwater Pumping 2.0 41
Infiltration 16.3 334
Baseflow to Streams 10.1 207
Irrigation 2.4 49
Stream Runoff 26.1 534
Table 2-17: Comparison between simulated water balance in the Napa County Surface Water model and Table 5-1 (Napa County Flood Control and Water Conservation District, 1991).
1991 Report * Model **
Depth (in/yr) % of Rainfall Depth (in/yr) % of Rainfall
Rainfall 35 - 36 -
Irrigation 4.3 12 5.7 16
Tributary Recharge 2.4 7 - -
Evapotranspiration 20 57 20 56
Groundwater Pumping 4.5 13 5.5 15
Stream Runoff 12 34 15 42
Baseflow to Streams 4.3 12 12 33
Notes:
* Annual Water Balance was calculated from a period of record from 1962 to 1989.
** Annual Water Balance was calculated for the simulation period 2000 to 2004.
- Linear Reservoir option for the groundwater model does not allow for stream recharge.

Table 2-18: Simulated annual water balance for the Lake Berryessa Surface Water model and comparison with the Napa Valley Surface Water model.
Lake Berryessa
Depth (in/yr)
Napa Valley
Depth (in/yr)
Rainfall 37.0 33.8
Evapotranspiration 23.6 20.3
Overland Flow to Streams 1.5 1.8
Groundwater Pumping 0.3 2.0
Infiltration 13.9 16.3
Baseflow to Streams 8.6 10.1
Irrigation 0.3 2.4
Stream Runoff 19.8 26.1
Table 2-19: Simulated annual water balance for the Napa Valley Groundwater model.
Groundwater Model
Depth (in/yr)
Rainfall 34.4
Evapotranspiration 19.0
Overland Flow to Streams 3.7
Groundwater Pumping 2.5
Infiltration 11.6
Baseflow from Streams 0.3
Baseflow to Streams 7.9
Irrigation 2.1
Stream Runoff 22.8

Table 2-20: Comparison between simulated water balance in the Napa Valley Groundwater model and Table 5-1 (Napa County Flood Control and Water Conservation District 1991).
1991 Report * Model **
Depth (in/yr) % of Rainfall Depth (in/yr) % of Rainfall
Rainfall 35 - 36 -
Irrigation 4.3 12 5.4 15
Tributary Recharge 2.4 7 6.4 18
Evapotranspiration 20 57 18 50
Groundwater Pumping 4.5 13 5.7 16
Stream Runoff 12 34 13 36
Baseflow to Streams 4.3 12 15 42
Notes:
* Annual Water Balance was calculated from a period of record from 1962 to 1989.
** Annual Water Balance was calculated for the simulation period 2000 to 2004.
Table 2-21: Water balance comparison between scenarios for the Napa Valley Surface Water model.
Total Depth (inches/yr)
Hydrologic Component Existing Conditions Scenario 1a Scenario 1b
Rainfall 46 46 46
ET 25 19 16
Infiltration 19 24 16
Overland to River 4 5 14
Baseflow to River 12 15 10
River Runoff 19 22 27

Explanation
Model Domain
Carneros
North Napa Valley
Milliken-Sarco-Tulucay
5 0 52.5 Miles
�
Figure 2-6: Map showing the approximate locations of the three largest groundwater basins in Napa County, North Napa Valley Groundwater Basin after CDWR (2004), Milliken-Sarco-Tulucay
Groundwater Basin after Farrar and Metzger (2003), and Carneros Groundwater Basin after NFCWC (1991).

Figure 2-27: Extent and thickness of the alluvium lens in the Napa Valley Groundwater model.
3 – 20
21 – 55
56 – 85
86 – 110
111 – 140
141 – 150
151 – 175
176 – 250
251 – 300
301 – 335
336 – 365
366 - 400

Figure 2-28: Extent of the Huichica Formation lens and the permeable Sonoma Volcanics (SV) in the Napa Valley Groundwater model.

Figure 2-29: Distribution of hydraulic conductivity (K) values used for the alluvium in the Napa Valley Groundwater model.
60
85
250
275
300

Figure 2-30: Distribution of hydraulic conductivity (K) values used for the Sonoma Volcanics in the Napa Valley Groundwater model.
1.0
2.5
250

Figure 2-31: Distribution of non-irrigation groundwater pumping used in the Napa Valley Groundwater model.

Explanation
Napa Valley
Irrigated Areas
5 0 52.5 Miles
�
Figure 2-32: Irrigated areas in the Napa Valley Surface Water model and the Napa Valley
Groundwater model.

Figure 2-35: Water-level calibration locations in the Napa Valley Groundwater model and additional locations where water-level data is available.

0
50
100
150
200
250
300
Nov-01 Dec-01 Jan-02 Feb-02 Mar-02 Apr-02 May-02
Discharge (cfs)
Observed Flow
Simulated F low
Figure 2-60: Simulated and observed discharges in the Napa Valley Groundwater model (Huichica
Creek, Nov. 2001 – May 2002).
90
110
130
150
170
Jan-00 Jan-01 Jan-02 Jan-03
Water Level (ft asl)
Observed Water Level
Simulated Water Level
Figure 2-61: Simulated and observed groundwater levels in the Napa Valley Groundwater model (005N003W06R001M, Jan. 2000 – Dec 2003).

120
145
170
195
220
Jan-00 Jan-01 Jan-02 Jan-03
Water Level (ft asl)
Observed Water Level
Simulated Water Level
Figure 2-62: Simulated and observed groundwater levels in the Napa Valley Groundwater model
(005N003W08E001M, Jan. 2000 – Dec 2003).
-10
15
40
65
90
Jan-00 Jan-01 Jan-02 Jan-03
Water Level (ft asl)
Observed Water Level
Simulated Water Level
Figure 2-63: Simulated and observed groundwater levels in the Napa Valley Groundwater model
(006N004W23K003M, Jan. 2000 – Dec 2003).
50
70
90
110
Jan-00 Jan-01 Jan-02 Jan-03
Water Level (ft asl)
Observed Water Level
Simulated Water Level
Figure 2-64: Simulated and observed groundwater levels in the Napa Valley Groundwater model (007N004W31M001M, Jan. 2000 – Dec 2003).
115
130
145
160
Jan-00 Jan-01 Jan-02 Jan-03
Water Level (ft asl)
Observed Water Level
Simulated Water Level
Figure 2-65: Simulated and observed groundwater levels in the Napa Valley Groundwater model (007N005W09Q002M, Jan. 2000 – Dec 2003).

310
320
330
340
350
360
Jan-00 Jan-01 Jan-02 Jan-03
Water Level (ft asl)
Observed Water Level
Simulated Water Level
Figure 2-66: Simulated and observed groundwater levels in the Napa Valley Groundwater model (009N006W31Q001M, Jan. 2000 – Dec 2003).
Scenar io 1b Discharge [ft 3̂/s]Scenar io 1a Discharge [ft 3̂/s]
Existing Conditions Discharge [ft 3̂/s]
November2001
December2001
January2002
0
500
1000
1500
Figure 2-67: Simulated and observed discharges for scenarios 1a and 1b in the Napa Valley Surface
Water model.

Figure 2-68: Simulated water-table surface in the Napa Valley Groundwater Model with arrows
indicating the predominant directions of groundwater flow (August 2003).
0
250
500
3851
-36

Attachment B


![Groundwater Risk Assessment Model (GRAM): Groundwater …...Groundwater Risk Assessment Model (GRAM): Groundwater ... [15–19]. Such an approach requires modeling of pollutant transport](https://img.pdfslide.us/doc/110x75/5f0d13147e708231d4388d71/groundwater-risk-assessment-model-gram-groundwater-groundwater-risk-assessment.jpg)