Embed Size (px)
Citation preview
87
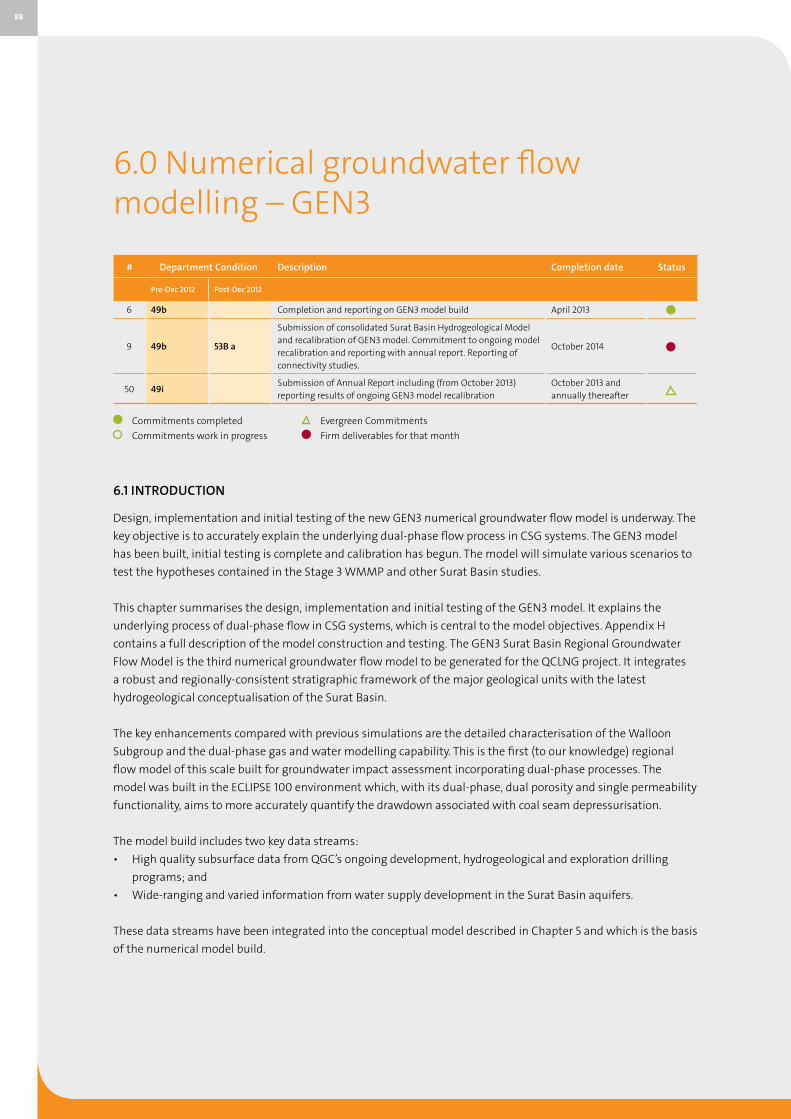
6.0 Numerical groundwater flow modelling – GEN3
88
6.0 Numerical groundwater flow modelling – GEN3
# Department Condition Description Completion date Status
Pre-Dec 2012 Post-Dec 2012
6 49b Completion and reporting on GEN3 model build April 2013
9 49b 53B a
Submission of consolidated Surat Basin Hydrogeological Model and recalibration of GEN3 model. Commitment to ongoing model recalibration and reporting with annual report. Reporting of connectivity studies.
October 2014
50 49iSubmission of Annual Report including (from October 2013) reporting results of ongoing GEN3 model recalibration
October 2013 and annually thereafter
Commitments completed Evergreen Commitments
Commitments work in progress Firm deliverables for that month
6.1 INTRODUCTION
Design, implementation and initial testing of the new GEN3 numerical groundwater flow model is underway. The
key objective is to accurately explain the underlying dual-phase flow process in CSG systems. The GEN3 model
has been built, initial testing is complete and calibration has begun. The model will simulate various scenarios to
test the hypotheses contained in the Stage 3 WMMP and other Surat Basin studies.
This chapter summarises the design, implementation and initial testing of the GEN3 model. It explains the
underlying process of dual-phase flow in CSG systems, which is central to the model objectives. Appendix H
contains a full description of the model construction and testing. The GEN3 Surat Basin Regional Groundwater
Flow Model is the third numerical groundwater flow model to be generated for the QCLNG project. It integrates
a robust and regionally-consistent stratigraphic framework of the major geological units with the latest
hydrogeological conceptualisation of the Surat Basin.
The key enhancements compared with previous simulations are the detailed characterisation of the Walloon
Subgroup and the dual-phase gas and water modelling capability. This is the first (to our knowledge) regional
flow model of this scale built for groundwater impact assessment incorporating dual-phase processes. The
model was built in the ECLIPSE 100 environment which, with its dual-phase, dual porosity and single permeability
functionality, aims to more accurately quantify the drawdown associated with coal seam depressurisation.
The model build includes two key data streams:
• High quality subsurface data from QGC’s ongoing development, hydrogeological and exploration drilling
programs; and
• Wide-ranging and varied information from water supply development in the Surat Basin aquifers.
These data streams have been integrated into the conceptual model described in Chapter 5 and which is the basis
of the numerical model build.
89
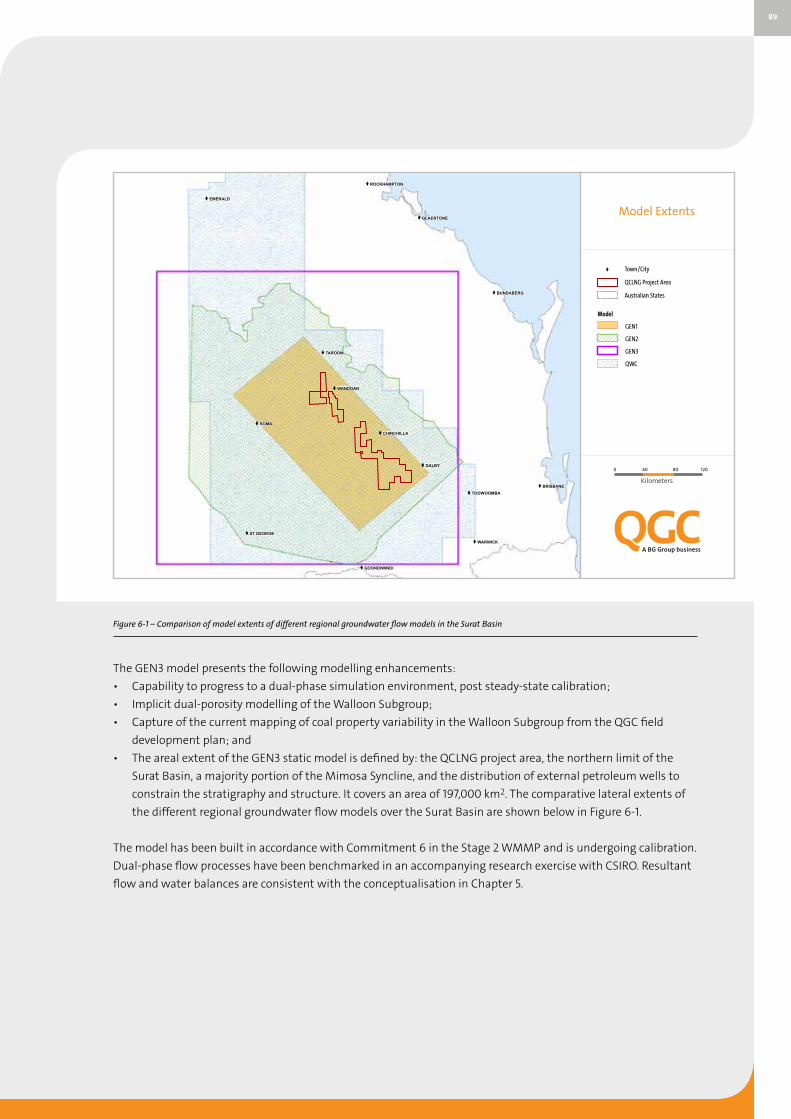
Figure 6-1 – Comparison of model extents of different regional groundwater flow models in the Surat Basin
The GEN3 model presents the following modelling enhancements:
• Capability to progress to a dual-phase simulation environment, post steady-state calibration;
• Implicit dual-porosity modelling of the Walloon Subgroup;
• Capture of the current mapping of coal property variability in the Walloon Subgroup from the QGC field
development plan; and
• The areal extent of the GEN3 static model is defined by: the QCLNG project area, the northern limit of the
Surat Basin, a majority portion of the Mimosa Syncline, and the distribution of external petroleum wells to
constrain the stratigraphy and structure. It covers an area of 197,000 km2. The comparative lateral extents of
the different regional groundwater flow models over the Surat Basin are shown below in Figure 6-1.
The model has been built in accordance with Commitment 6 in the Stage 2 WMMP and is undergoing calibration.
Dual-phase flow processes have been benchmarked in an accompanying research exercise with CSIRO. Resultant
flow and water balances are consistent with the conceptualisation in Chapter 5.
X
X
X
X
X
X
X
X
X
X
X
X
X
X
ROMA
DALBY
TAROOM
WARWICK
EMERALD
WANDOAN
BRISBANE
ST GEORGE
GLADSTONE
TOOWOOMBA
BUNDABERG
CHINCHILLA
GOONDIWINDI
ROCKHAMPTON
Model Extents
±0 40 80 120
Kilometers
X Town/City
QCLNG EIS Area
Australian States
Model ExtentsGEN1
GEN2
GEN3
QWC
DATA SOURCE: Towns, Australian States - GA
Map Projection: GDA 94 SCALE: 1:2,200,000 (A3)
"Based on or contains data provided by the State of Queensland (Department of Environment and Resource Management) 2011. In consideration of the State permitting use of this data you acknowledge and
agree that the State gives no warranty in relation to the data (including accuracy, reliability,completeness, currency or suitability) and accepts no liability (including without limitation,
liability in negligence) for any loss, damage or costs (including consequential damage) relating toany use of the data. Data must not be used for direct marketing or be used in breach of the privacy laws."
Note: Every effort has been made to ensure this information is spatially accurate. The location ofthis information should not be relied on as the exact field location.
12/04/2013A
DATE:CREATED BY:
MAP NO:REV NO:MAP TYPE: Other
PLAN REF:CHECKED BY: SG
M_26095_01TG
v4
Model Extents
Town/City
QCLNG Project Area
Australian States
Kilometers
0 40 80 120
X
X
X
X
X
X
X
X
X
X
X
X
X
X
ROMA
DALBY
TAROOM
WARWICK
EMERALD
WANDOAN
BRISBANE
ST GEORGE
GLADSTONE
TOOWOOMBA
BUNDABERG
CHINCHILLA
GOONDIWINDI
ROCKHAMPTON
Model Extents
±0 40 80 120
Kilometers
X Town/City
QCLNG EIS Area
Australian States
Model ExtentsGEN1
GEN2
GEN3
QWC
DATA SOURCE: Towns, Australian States - GA
Map Projection: GDA 94 SCALE: 1:2,200,000 (A3)
"Based on or contains data provided by the State of Queensland (Department of Environment and Resource Management) 2011. In consideration of the State permitting use of this data you acknowledge and
agree that the State gives no warranty in relation to the data (including accuracy, reliability,completeness, currency or suitability) and accepts no liability (including without limitation,
liability in negligence) for any loss, damage or costs (including consequential damage) relating toany use of the data. Data must not be used for direct marketing or be used in breach of the privacy laws."
Note: Every effort has been made to ensure this information is spatially accurate. The location ofthis information should not be relied on as the exact field location.
12/04/2013A
DATE:CREATED BY:
MAP NO:REV NO:MAP TYPE: Other
PLAN REF:CHECKED BY: SG
M_26095_01TG
v4
X
X
X
X
X
X
X
X
X
X
X
X
X
X
ROMA
DALBY
TAROOM
WARWICK
EMERALD
WANDOAN
BRISBANE
ST GEORGE
GLADSTONE
TOOWOOMBA
BUNDABERG
CHINCHILLA
GOONDIWINDI
ROCKHAMPTON
Model Extents
±0 40 80 120
Kilometers
X Town/City
QCLNG EIS Area
Australian States
Model ExtentsGEN1
GEN2
GEN3
QWC
DATA SOURCE: Towns, Australian States - GA
Map Projection: GDA 94 SCALE: 1:2,200,000 (A3)
"Based on or contains data provided by the State of Queensland (Department of Environment and Resource Management) 2011. In consideration of the State permitting use of this data you acknowledge and
agree that the State gives no warranty in relation to the data (including accuracy, reliability,completeness, currency or suitability) and accepts no liability (including without limitation,
liability in negligence) for any loss, damage or costs (including consequential damage) relating toany use of the data. Data must not be used for direct marketing or be used in breach of the privacy laws."
Note: Every effort has been made to ensure this information is spatially accurate. The location ofthis information should not be relied on as the exact field location.
12/04/2013A
DATE:CREATED BY:
MAP NO:REV NO:MAP TYPE: Other
PLAN REF:CHECKED BY: SG
M_26095_01TG
v4
Model
GEN1
GEN2
GEN3
QWC
90
Moving forward, the calibrated model will be used to run a number of simulations and test hypotheses
developed during complementary technical studies, including:
• The change in pressure, drawdown and flow characteristics under single and dual-phase conditions;
• Assessment of vertical hydraulic connectivity;
• Potential impacts on EPBC listed springs;
• Potential impacts on water users and the resulting ‘make good’ obligations; and
• The need for and the effect of injection on aquifer repressurisation.
The GEN3 model is limited by the data available for its construction. Unlike the OGIA/QWC model which utilised
data from all Surat Basin CSG operators, the GEN3 model is currently limited to public listed and QGC data only.
The 2012 Australian Groundwater Modelling Guidelines (Natural Water Commission, 2012) recommend a dual-
phase flow approach to CSG-related groundwater flow modelling. Accordingly, QGC is assisting OGIA with data
and expertise to implement this testing.
6.2 GEN3 PROJECT OBJECTIVES
To understand the objectives of this project, some of the higher level QCLNG Water Management and Monitoring
Plan (WMMP) objectives and requirements for the GEN3 model should be stated. These are:
• Re-evaluate the conceptual hydrogeological model of the Surat Basin;
• Develop a consistent regional groundwater model that is compliant with the 2012 Australian Groundwater
Modelling Guidelines;
• Create a model that is capable of:
• Predicting drawdown to protect EPBC springs;
• Modelling impacts for existing users;
• Predicting the effectiveness of response actions; and
• Monitoring uncertainty reduction.
Within that context, the detailed model objectives are:
• To advance the modelling of CSG depressurisation for the Surat Basin hydrogeological system;
• To account for the impact of dual-phase phenomenon on the drawdown associated with CSG production
(as prescribed by the 2012 Australian Groundwater Modelling Guidelines);
• To incorporate the latest subsurface data from QGC’s operations;
• To develop procedures that allow the modelling team to:
• Improve the permeability model of the Walloon Subgroup coals;
• Integrate a robust regionally consistent stratigraphic framework of the major geological units in the Surat;
• Account for heterogeneity in the Walloon Coal Measures and Springbok formations and thus improve
upscaling for regional models;
• Refine the assumptions for model boundary conditions to reflect the latest understanding;
• Qualify and quantify the uncertainty associated with the model and how that translates into a range of
outcomes;
• Align QGC’s geology and hydrogeological data into one model;
• Create a 3D visual and numerical representation of the Surat hydrogeological system which is of a Class 2
(2012 Australian Groundwater Modelling Guidelines) confidence level; and
• Create a tool to predict potential impacts and changes in water level spatially over time due to predicted QGC
CSG production.
91
6.3 THE PHYSICS OF COAL SEAM GAS PRODUCTION AND DUAL-PHASE FLOW
As dual-phase flow simulation is an important part of the model objectives, it is useful to describe how dual-
phase flow occurs in CSG systems and its potential influence on water pressures and flows.
CSG reservoirs are characterised by two distinct coal porosity systems: the primary porosity system and the
secondary porosity system. The former is composed of extremely low permeability, isolated micropores with a
very large internal surface area onto which gas is adsorbed and must migrate by diffusion. The latter is composed
of macropores that are composed of the natural fracture network of cleats and fissures where gas in a free state
is found. As fluid pressure in the coal declines, adsorbed gas within the primary porosity system is desorbed and
becomes free phase gas that diffuses through the coal to the secondary porosity system where it flows. The
mechanism of CSG production can be described by the 3D theory of desorption-diffusion-Darcy flow (Seidle 2011).
Permeability in coal is controlled by the magnitude of net stress in the reservoir. This can vary across the field,
in different coal seams, and also change over time with production. Production influences permeability in two
distinct and opposing ways:
• A decline in permeability due to cleat compaction; and
• An increase in permeability due to coal matrix shrinkage as gas desorbs.
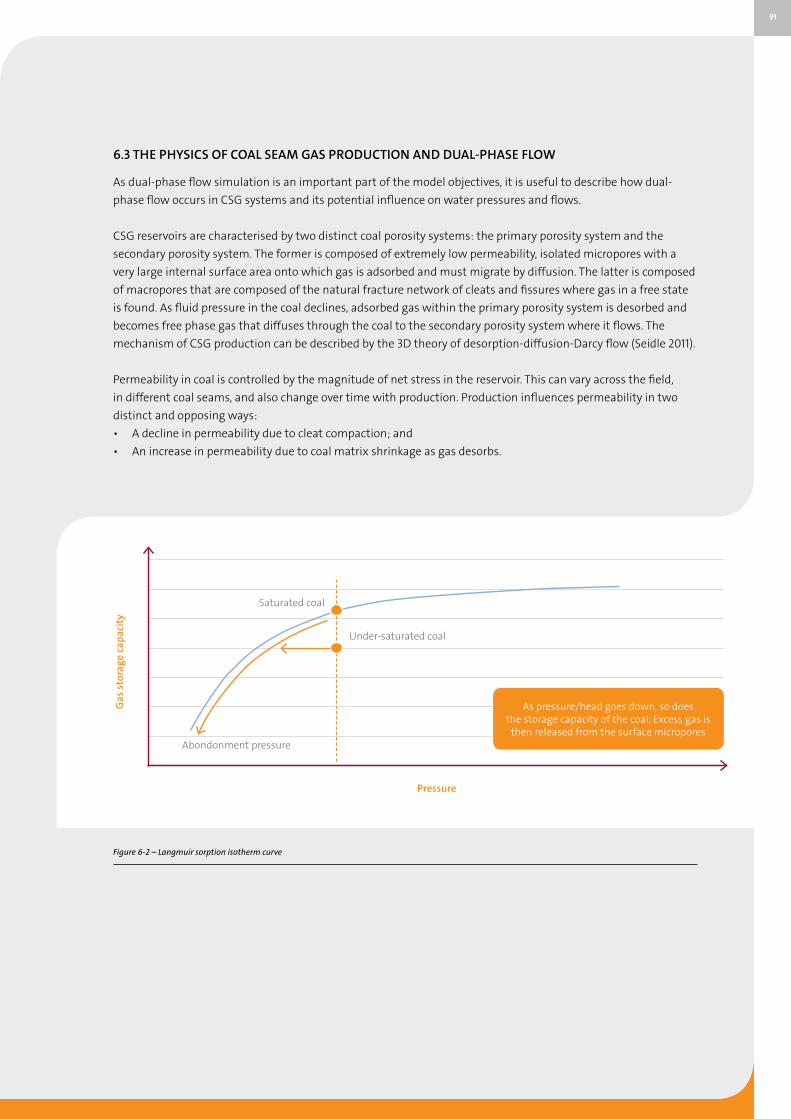
Figure 6-2 – Langmuir sorption isotherm curve
Gas
sto
rage
cap
acit
y
Pressure
As pressure/head goes down, so does the storage capacity of the coal. Excess gas is
then released from the surface micropores
Under-saturated coal
Saturated coal
Abondonment pressure
92
The pressure controlled desorption of gas from the surface micropores of the coal matrix was demonstrated
empirically by Langmuir in 1916. CSG simulators apply a Langmuir sorption isotherm curve to correlate the
rate of gas release with the depressurisation of the coal. The concept is illustrated in Figure 6-2. As water is
extracted from the cleat system, the pressure drops and the system moves down the Langmuir isotherm until
gas is liberated from the surface of the surrounding coal matrix. If the coal is saturated, gas will be liberated
immediately as pressure is reduced with conditions reflecting the move down the Langmuir curve. Once gas is
liberated to freely move within the fracture pore space, it will travel like the water phase towards the localised
region of lowest pressure (most likely the nearest pumping bore). The two phases will compete and thus the ease
of their passage as quantified by permeability will decrease. At the same time, the total fluid compressibility of
the system will change dramatically as it will be dominated by the highly compressible gas. This will delay the
reduction in pressure/head.
A simple way of visualising the difference is that, in a single-phase system, a unit of water is removed from the
coal, the pressure difference between the coal and the bounding aquifer will need to be high enough to replace
that unit of water. In a dual-phase system the removal of a unit of water is partly compensated by the generation
of a volume of gas. Therefore, there is less need for the system to replace that unit of water and the pressure
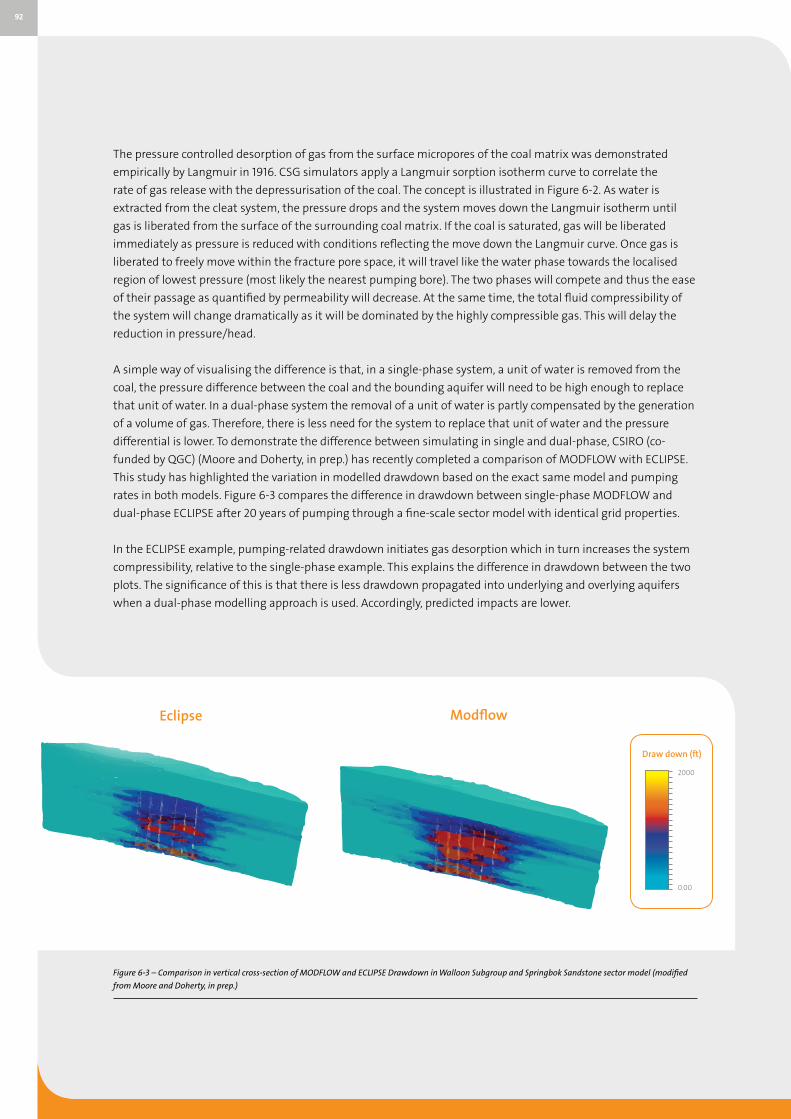
differential is lower. To demonstrate the difference between simulating in single and dual-phase, CSIRO (co-
funded by QGC) (Moore and Doherty, in prep.) has recently completed a comparison of MODFLOW with ECLIPSE.
This study has highlighted the variation in modelled drawdown based on the exact same model and pumping
rates in both models. Figure 6-3 compares the difference in drawdown between single-phase MODFLOW and
dual-phase ECLIPSE after 20 years of pumping through a fine-scale sector model with identical grid properties.
In the ECLIPSE example, pumping-related drawdown initiates gas desorption which in turn increases the system
compressibility, relative to the single-phase example. This explains the difference in drawdown between the two
plots. The significance of this is that there is less drawdown propagated into underlying and overlying aquifers
when a dual-phase modelling approach is used. Accordingly, predicted impacts are lower.
Figure 6-3 – Comparison in vertical cross-section of MODFLOW and ECLIPSE Drawdown in Walloon Subgroup and Springbok Sandstone sector model (modified
from Moore and Doherty, in prep.)
Draw down (ft)
2000
0.00
Eclipse Modflow

93
6.4 MODELLING APPROACH
The GEN3 modelling approach and associated reporting are significantly different from the previous regional
groundwater flow modelling performed within the Surat Basin. These changes in approach have been driven by
the selection of software and a mandate to use as much of the available data as possible. With the selection of
petroleum industry software the workflows required to use this software have had to mimic industry practices.
Equally, the available data for this regional groundwater flow model is significantly different in type and quantity
compared with many previous equivalent studies.
As the data has been collected under petroleum industry standards, the team has implemented petroleum
industry modelling practices. However, the project objectives and model user community are hydrogeologically
focused. Therefore, every effort has been made to be consistent with the 2012 Australian Groundwater Modelling
Guidelines and amalgamate hydrogeological modelling best practices with the inherent modelling best practices
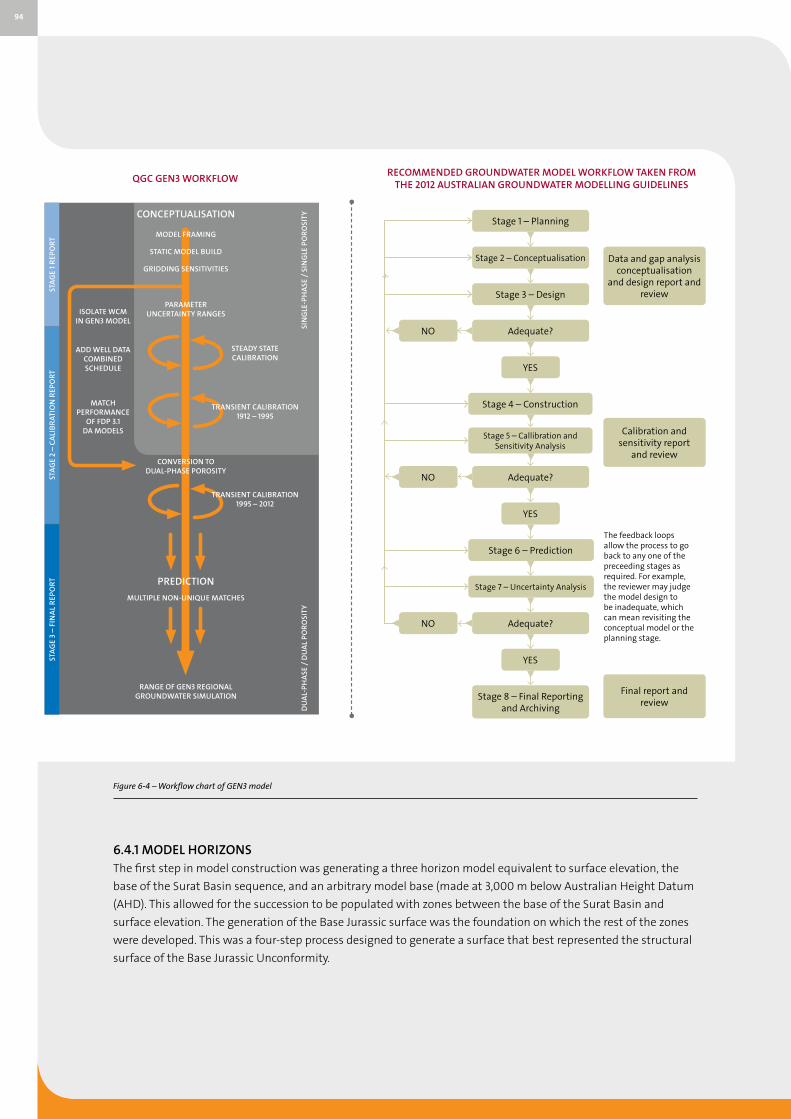
inherited from the software and data available. As a result, Figure 6-4 shows the overall procedure for the GEN3
model. This model build (Appendix H) covers only the initial third of the modelling workflow illustrated.
In accordance with the Commitment, the model has been built and is undergoing calibration. Dual-phase flow
processes have been benchmarked in an accompanying research exercise. Resultant flow and water balances are
consistent with the conceptualisation. Considering the regional nature of the model and the resultant coarse
scaling adopted, the simulation is deemed a suitable starting point for commencement of computer assisted
steady state calibration.
QGC is using a petroleum industry standard software tool called MEPO that allows computer assisted
(automated) optimisation for the steady state calibration. This process includes an uncertainty workflow which
optimises the calibration target match. The model is being run via full simulation means over a period of time
deemed to be long enough to satisfy the performance measures stipulated within the Australian Groundwater
Modelling 2012 Guidelines.
The transient calibration includes the following actions:
• Single-phase single porosity calibration between 1912 and 1995 accounting for historical water extraction in
the Surat Basin prior to CSG extraction; and
• Dual-phase, dual porosity calibration between 1995 and the end of 2012 accounting for historical water
extraction associated with traditional use as well as QGC CSG gas and water extraction from 2005.
• Successful calibration of the model will be confirmed by internal review processes and an independent
external reviewer. The calibrated model will then be used to run a number of simulations and test hypotheses
developed during complementary technical studies, including:
• The propagation of drawdown under single and dual-phase conditions;
• The change in pressure, drawdown and flow characteristics under single and dual-phase conditions;
• Conclusion on aquifer interaction arising out of the connectivity study;
• Potential impacts on Matter of National Environmental Significance (MNES);
• Potential impacts on water users and ‘Make Good’ obligations; and
• The effect of injection on aquifer repressurisation.
Overall the model will be used as a tool to enhance QGC’s understanding of the groundwater flow system.
94
Figure 6-4 – Workflow chart of GEN3 model
6.4.1 MODEL HORIZONSThe first step in model construction was generating a three horizon model equivalent to surface elevation, the
base of the Surat Basin sequence, and an arbitrary model base (made at 3,000 m below Australian Height Datum
(AHD). This allowed for the succession to be populated with zones between the base of the Surat Basin and
surface elevation. The generation of the Base Jurassic surface was the foundation on which the rest of the zones
were developed. This was a four-step process designed to generate a surface that best represented the structural
surface of the Base Jurassic Unconformity.
Stage 1 – Planning
Stage 3 – Design
Adequate?
Data and gap analysis conceptualisation
and design report and review
Adequate?
Calibration and sensitivity report
and review
The feedback loops allow the process to go back to any one of the preceeding stages as required. For example, the reviewer may judge the model design to be inadequate, which can mean revisiting the conceptual model or the planning stage.
Adequate?
Stage 4 – Construction
Stage 6 – Prediction
Stage 5 – Callibration and Sensitivity Analysis
Stage 7 – Uncertainty Analysis
Stage 8 – Final Reporting and Archiving
Final report and review
YES
YES
YES
NO
NO
STA
GE
3 –
FIN
AL
REP
OR
TST
AG
E 2
– C
ALI
BR
ATI
ON
REP
OR
TST
AG
E 1
REP
OR
T MODEL FRAMING
STATIC MODEL BUILD
GRIDDING SENSITIVITIES
MULTIPLE NON-UNIQUE MATCHES
CONVERSION TO DUAL-PHASE POROSITY
RANGE OF GEN3 REGIONAL GROUNDWATER SIMULATION
PARAMETER UNCERTAINTY RANGESISOLATE WCM
IN GEN3 MODEL
ADD WELL DATA COMBINED SCHEDULE
MATCH PERFORMANCE
OF FDP 3.1DA MODELS
DU
AL-
PH
ASE
/ D
UA
L P
OR
OSI
TYSI
NG
LE-P
HA
SE /
SIN
GLE
PO
RO
SITYCONCEPTUALISATION
PREDICTION
STEADY STATECALIBRATION
TRANSIENT CALIBRATION1912 – 1995
TRANSIENT CALIBRATION1995 – 2012
QGC GEN3 WORKFLOWRECOMMENDED GROUNDWATER MODEL WORKFLOW TAKEN FROM
THE 2012 AUSTRALIAN GROUNDWATER MODELLING GUIDELINES
Figure 6-4 – Workflow chart of GEN3 model
Stage 2 – Conceptualisation
NO
95
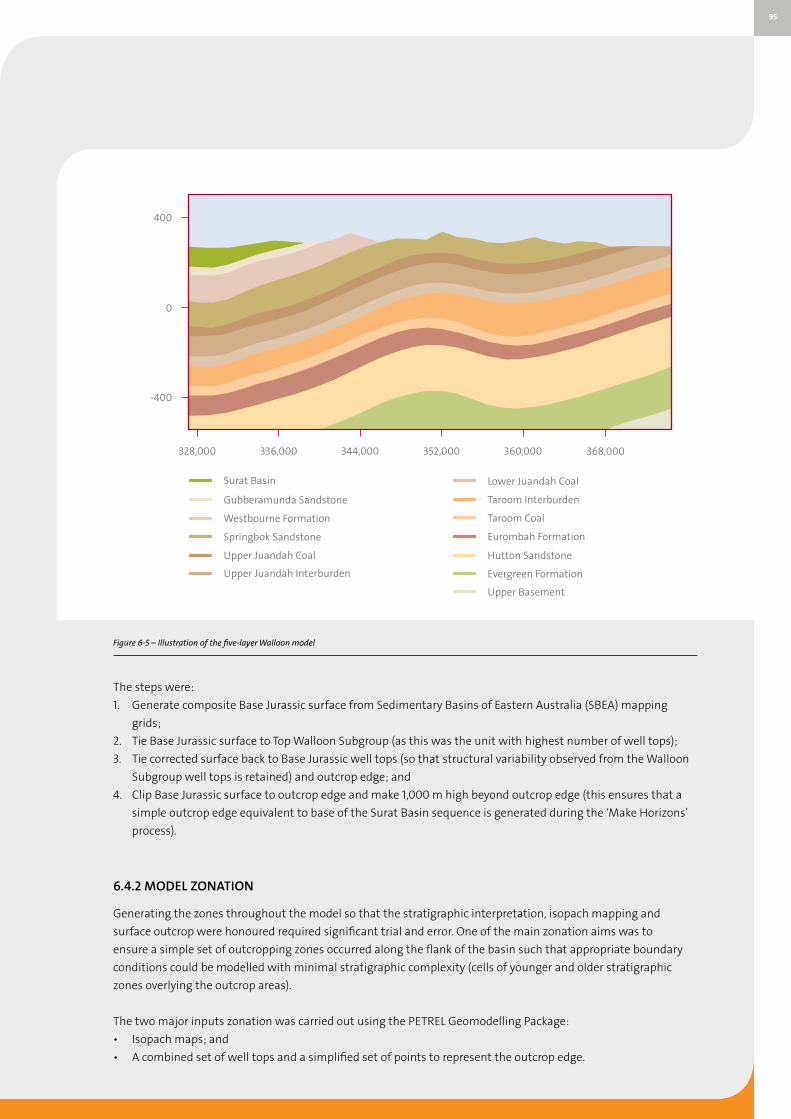
Figure 6-5 – Illustration of the five-layer Walloon model
The steps were:
1. Generate composite Base Jurassic surface from Sedimentary Basins of Eastern Australia (SBEA) mapping
grids;
2. Tie Base Jurassic surface to Top Walloon Subgroup (as this was the unit with highest number of well tops);
3. Tie corrected surface back to Base Jurassic well tops (so that structural variability observed from the Walloon
Subgroup well tops is retained) and outcrop edge; and
4. Clip Base Jurassic surface to outcrop edge and make 1,000 m high beyond outcrop edge (this ensures that a
simple outcrop edge equivalent to base of the Surat Basin sequence is generated during the ‘Make Horizons’
process).
6.4.2 MODEL ZONATION
Generating the zones throughout the model so that the stratigraphic interpretation, isopach mapping and
surface outcrop were honoured required significant trial and error. One of the main zonation aims was to
ensure a simple set of outcropping zones occurred along the flank of the basin such that appropriate boundary
conditions could be modelled with minimal stratigraphic complexity (cells of younger and older stratigraphic
zones overlying the outcrop areas).
The two major inputs zonation was carried out using the PETREL Geomodelling Package:
• Isopach maps; and
• A combined set of well tops and a simplified set of points to represent the outcrop edge.
Upper Basement
Surat Basin
Gubberamunda Sandstone
Westbourne Formation
Springbok Sandstone
Upper Juandah Coal
Upper Juandah Interburden
Lower Juandah Coal
Taroom Interburden
Taroom Coal
Eurombah Formation
Hutton Sandstone
Evergreen Formation
400
0
-400
328,000 368,000336,000 344,000 352,000 360,000

96
6.4.3 WALLOON ZONATION
The coal-bearing intervals of the Walloon Subgroup comprise a highly-interbedded sequence of thin,
discontinuous coal seams interbedded with low-permeability sediments (Ryan et al, 2012). The coal seams
typically comprise 10% of the gross Walloon Subgroup thickness and include up to 45 seams, with 75% of the coal
seams less than 30 cm thick (Ryan et al, 2012).
Capturing this level of stratigraphic heterogeneity in a regional model is not possible. After internal discussions
about upscaling and facies aggregation, it was decided to sum and average the properties of the coal-bearing
intervals into three zones equivalent to the Upper Juandah, Lower Juandah and a combined Tangalooma/Taroom
coal seam. The zones and associated interburden units were generated by dividing the gross Walloon Subgroup
thickness (excluding the Eurombah Formation) by seven and then assigning the coal measure units as 1/7th
the thickness and the interburden units as 2/7th the total thickness. This resulted in a five-layer Walloon model
as pictured in Figure 6-5. The three coal seams each represent 1/7th of the Walloon Subgroup and each of the
interburden layers represent 2/7th.
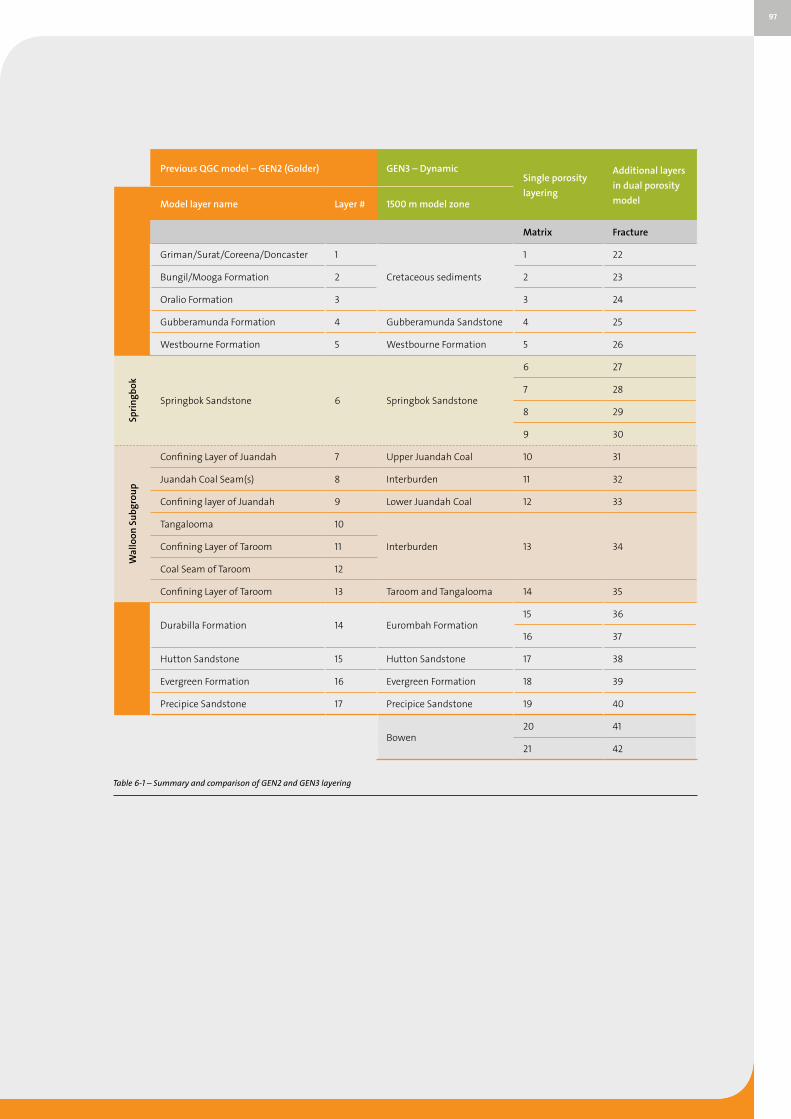
6.4.4 LAYERING
The layering philosophy is driven by the modelling project objectives and by the zone of interest (focus on
Walloon Subgroup with overlying and underlying aquifers and aquitards). Additional layering where more
than one layer exists within a zone was performed on the Eurombah Formation, Springbok Sandstone, Bowen/
Basement zone and the Cretaceous Sediments. Table 6-1 demonstrates the layering approach used which is fully
aligned with the hydrostratigraphy. The objectives and parameters of additional layering for each zone are:
• Cretaceous Sediments: Divide the thick zone into thinner layers to avoid simulation convergence problems
that are common when small cells are next to very large cells (i.e. between these layers and the thinner
Gubberamunda Sandstone);
• Springbok Sandstone: There is a higher resolution dataset in the Springbok Sandstone as every CSG well
first intersects the Springbok Sandstone. Additional petrophysical resolution is provided throughout this
unit given the stratigraphic and lateral heterogeneity of hydraulic properties. A low-permeability Springbok
Sandstone unit is identified throughout the Southern Development Area;
• Eurombah Formation: Layered to allow sensitivity studies of layering and vertical connectivity between the
coal-bearing units and the Hutton Sandstone; and
• Bowen/Basement: This zone is a generic stratigraphic unit that captures everything below the Precipice
Sandstone to a fixed depth of 3,000 m below AHD for ease and for future expandability if required. This zone
is not within the zone of interest but, in line with groundwater 'best practice', it was determined there should
not be a no-flow boundary at the base of the Precipice Sandstone.
97
Previous QGC model – GEN2 (Golder) GEN3 – DynamicSingle porosity
layering
Additional layers
in dual porosity
modelModel layer name Layer # 1500 m model zone
Matrix Fracture
Griman/Surat/Coreena/Doncaster 1
Cretaceous sediments
1 22
Bungil/Mooga Formation 2 2 23
Oralio Formation 3 3 24
Gubberamunda Formation 4 Gubberamunda Sandstone 4 25
Westbourne Formation 5 Westbourne Formation 5 26
Spri
ngb
ok
Springbok Sandstone 6 Springbok Sandstone
6 27
7 28
8 29
9 30
Wal
loon
Su
bgr
oup
Confining Layer of Juandah 7 Upper Juandah Coal 10 31
Juandah Coal Seam(s) 8 Interburden 11 32
Confining layer of Juandah 9 Lower Juandah Coal 12 33
Tangalooma 10
Interburden 13 34Confining Layer of Taroom 11
Coal Seam of Taroom 12
Confining Layer of Taroom 13 Taroom and Tangalooma 14 35
Durabilla Formation 14 Eurombah Formation15 36
16 37
Hutton Sandstone 15 Hutton Sandstone 17 38
Evergreen Formation 16 Evergreen Formation 18 39
Precipice Sandstone 17 Precipice Sandstone 19 40
Bowen20 41
21 42
Table 6-1 – Summary and comparison of GEN2 and GEN3 layering
98
6.4.5 STATIC PROPERTIES
A key component of the GEN3 geological model build is to calculate and populate static hydrogeological
properties (porosity, horizontal permeability and vertical permeability) throughout the model based on the best-
available datasets.
Where insufficient field data exists to generate estimates for dynamic properties, the inputs for the model build
have been conceptualised using the Darcy (saturated) fluid flow equation. That is, they have been assigned based
on the hydraulic conductivity of the formation within which they are to be assigned (e.g. recharge has been
calculated based on the hydraulic gradient of the aquifer, outcrop and formation thickness). This approach has
the following benefits:
• It enables an estimate of model input parameters when limited direct field measurements are available
(e.g. recharge and river conductance parameters);
• It reduces model instabilities by ensuring input parameters are consistent with one another (e.g. by not trying
to assign large recharge volumes into a tight aquitard sequence);
• Is conceptually consistent with groundwater flow principles; and
• Is consistent with the regional scale nature of the GEN3 model.
This approach differs from that used by QWC (2012) and in the QGC GEN2 model.
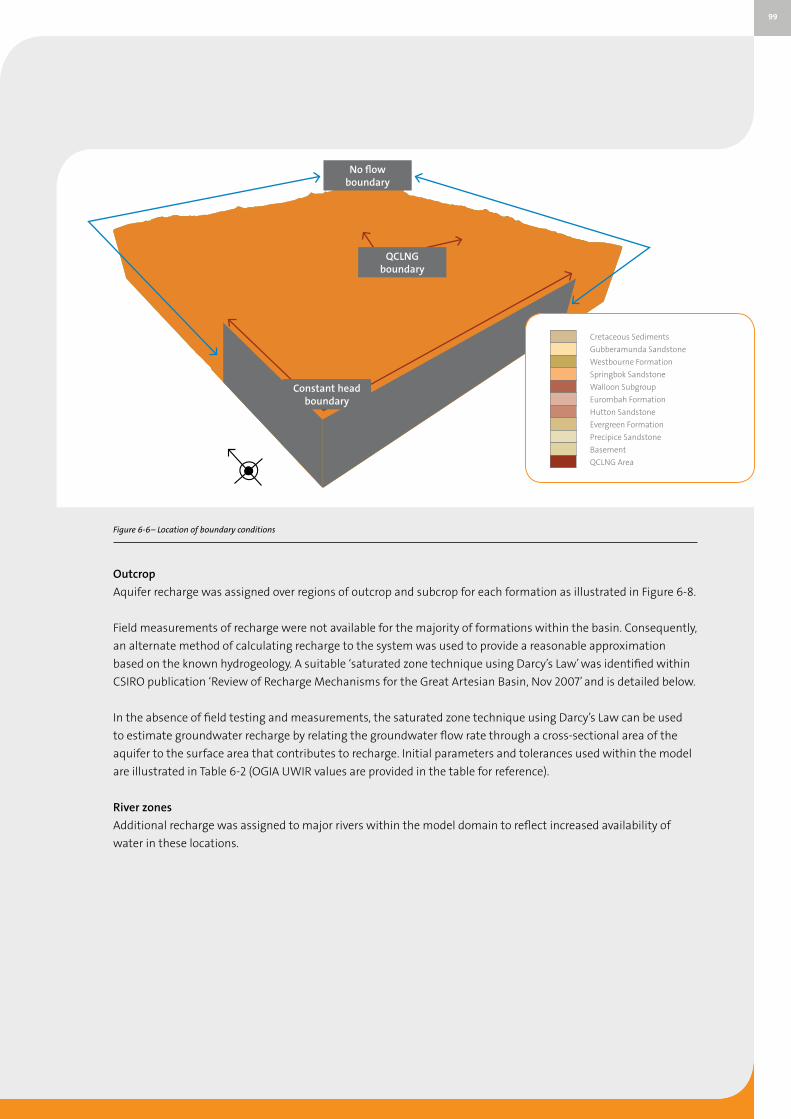
6.4.6 BOUNDARY CONDITIONS
Boundary conditions have been assigned within the model to represent regions of inflow, outflow and absence of
flow within the groundwater system. Boundary conditions utilised in the model include:
• Recharge via rainfall and rivers;
• Discharge via model boundaries and rivers; and
• No flow along some model boundaries.
Boundary conditions are illustrated in Figure 6-7 and discussed in more detail above.
Constant head boundary
Constant head boundaries were assigned to the southern extent of the model. This is representative of the
generally interpreted discharge out of the model to the south. A constant head induces discharge out of the
model which is commensurate with the head difference and aquifer properties.
No flow boundary
No flow boundary conditions exist around the remainder of the model boundary not covered by constant head
boundaries. No flow boundaries reflect regions where the conceptual interpretation suggests that groundwater
movement into and out of the model is anticipated to be limited.
Aquifer recharge
Model recharge input values were limited to rates that the system could feasibly accept. The remainder of water
would conceptually be rejected as surface water runoff and or lost to evaporation. The outcome is that estimated
recharge values approximate ‘net recharge’ rates, and net recharge assumes evapotranspiration has already been
deducted from the recharge rate prior to being applied.
99
Figure 6-6– Location of boundary conditions
Outcrop
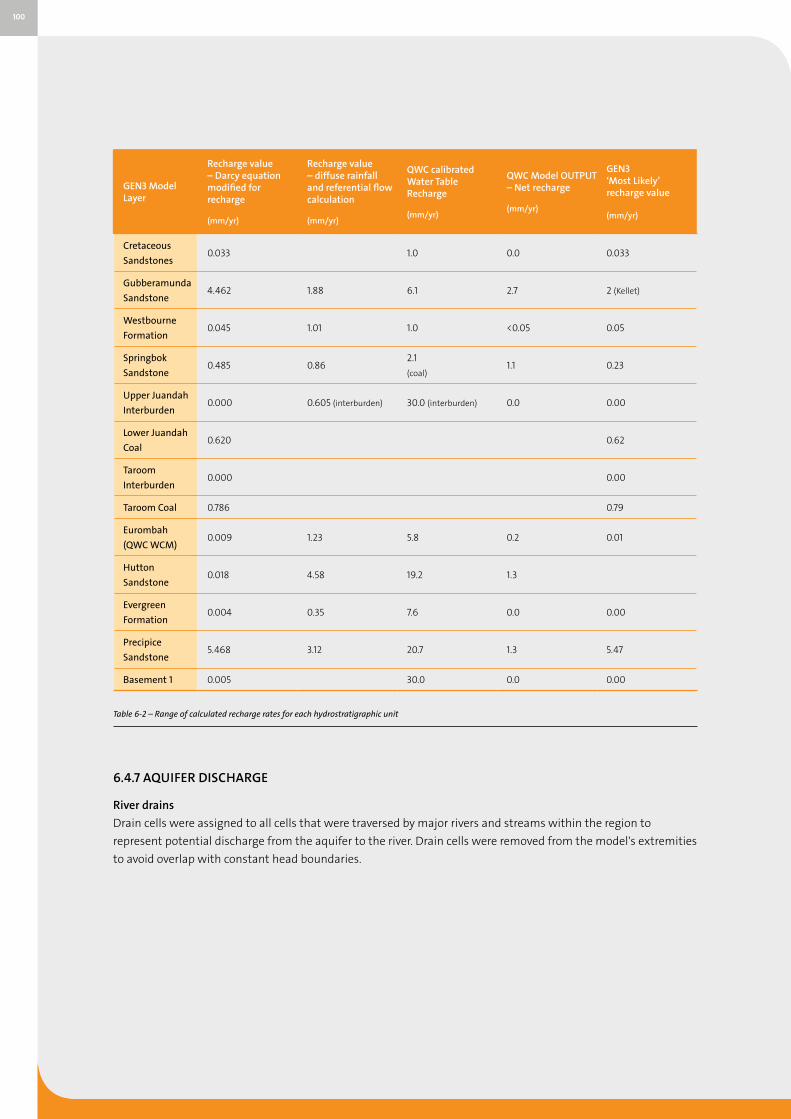
Aquifer recharge was assigned over regions of outcrop and subcrop for each formation as illustrated in Figure 6-8.
Field measurements of recharge were not available for the majority of formations within the basin. Consequently,
an alternate method of calculating recharge to the system was used to provide a reasonable approximation
based on the known hydrogeology. A suitable ‘saturated zone technique using Darcy’s Law’ was identified within
CSIRO publication ‘Review of Recharge Mechanisms for the Great Artesian Basin, Nov 2007’ and is detailed below.
In the absence of field testing and measurements, the saturated zone technique using Darcy’s Law can be used
to estimate groundwater recharge by relating the groundwater flow rate through a cross-sectional area of the
aquifer to the surface area that contributes to recharge. Initial parameters and tolerances used within the model
are illustrated in Table 6-2 (OGIA UWIR values are provided in the table for reference).
River zones
Additional recharge was assigned to major rivers within the model domain to reflect increased availability of
water in these locations.
No flow boundary
Constant head boundary
QCLNG boundary
Cretaceous Sediments
Gubberamunda Sandstone
Westbourne Formation
Springbok Sandstone
Walloon Subgroup
Eurombah Formation
Hutton Sandstone
Evergreen Formation
Precipice Sandstone
Basement
QCLNG Area
100
GEN3 Model Layer
Recharge value – Darcy equation modified for recharge
(mm/yr)
Recharge value – diffuse rainfall and referential flow calculation
(mm/yr)
QWC calibrated Water Table Recharge
(mm/yr)
QWC Model OUTPUT – Net recharge
(mm/yr)
GEN3 ‘Most Likely’ recharge value
(mm/yr)
Cretaceous
Sandstones0.033 1.0 0.0 0.033
Gubberamunda
Sandstone4.462 1.88 6.1 2.7 2 (Kellet)
Westbourne
Formation0.045 1.01 1.0 <0.05 0.05
Springbok
Sandstone0.485 0.86
2.1
(coal)1.1 0.23
Upper Juandah
Interburden0.000 0.605 (interburden) 30.0 (interburden) 0.0 0.00
Lower Juandah
Coal0.620 0.62
Taroom
Interburden0.000 0.00
Taroom Coal 0.786 0.79
Eurombah
(QWC WCM)0.009 1.23 5.8 0.2 0.01
Hutton
Sandstone0.018 4.58 19.2 1.3
Evergreen
Formation0.004 0.35 7.6 0.0 0.00
Precipice
Sandstone5.468 3.12 20.7 1.3 5.47
Basement 1 0.005 30.0 0.0 0.00
Table 6-2 – Range of calculated recharge rates for each hydrostratigraphic unit
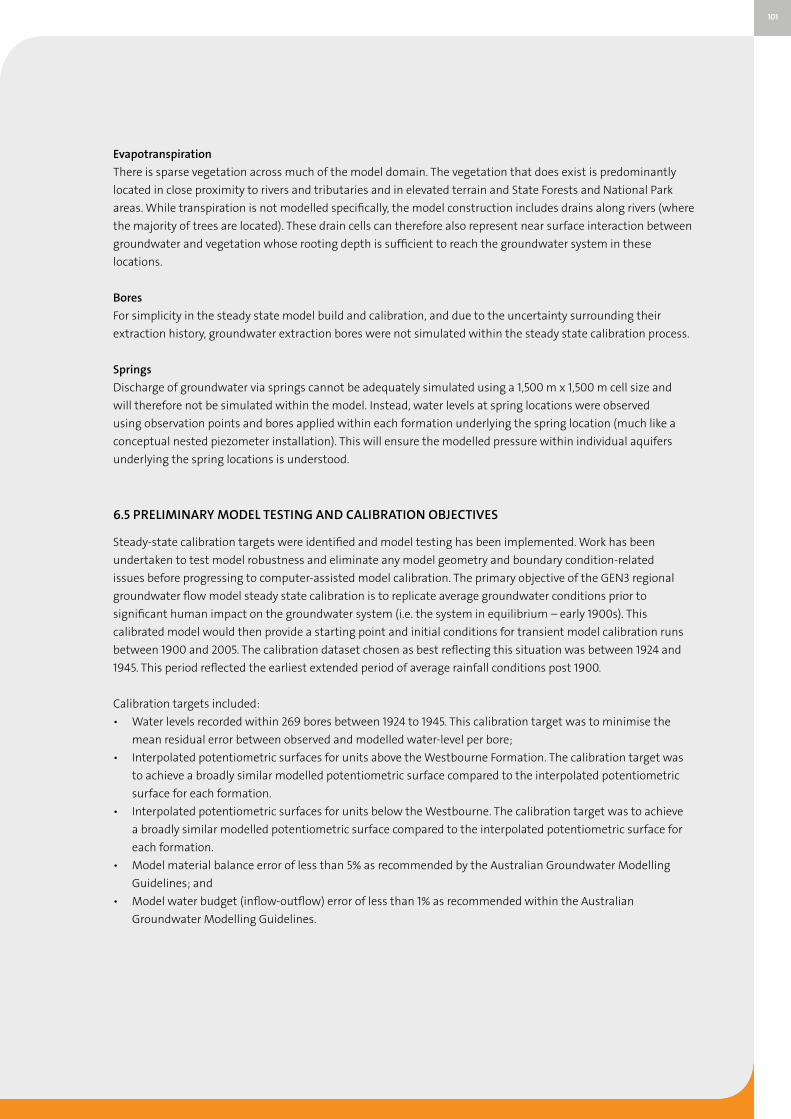
6.4.7 AQUIFER DISCHARGE
River drains
Drain cells were assigned to all cells that were traversed by major rivers and streams within the region to
represent potential discharge from the aquifer to the river. Drain cells were removed from the model's extremities
to avoid overlap with constant head boundaries.
101
Evapotranspiration
There is sparse vegetation across much of the model domain. The vegetation that does exist is predominantly
located in close proximity to rivers and tributaries and in elevated terrain and State Forests and National Park
areas. While transpiration is not modelled specifically, the model construction includes drains along rivers (where
the majority of trees are located). These drain cells can therefore also represent near surface interaction between
groundwater and vegetation whose rooting depth is sufficient to reach the groundwater system in these
locations.
Bores
For simplicity in the steady state model build and calibration, and due to the uncertainty surrounding their
extraction history, groundwater extraction bores were not simulated within the steady state calibration process.
Springs
Discharge of groundwater via springs cannot be adequately simulated using a 1,500 m x 1,500 m cell size and
will therefore not be simulated within the model. Instead, water levels at spring locations were observed
using observation points and bores applied within each formation underlying the spring location (much like a
conceptual nested piezometer installation). This will ensure the modelled pressure within individual aquifers
underlying the spring locations is understood.
6.5 PRELIMINARY MODEL TESTING AND CALIBRATION OBJECTIVES
Steady-state calibration targets were identified and model testing has been implemented. Work has been
undertaken to test model robustness and eliminate any model geometry and boundary condition-related
issues before progressing to computer-assisted model calibration. The primary objective of the GEN3 regional
groundwater flow model steady state calibration is to replicate average groundwater conditions prior to
significant human impact on the groundwater system (i.e. the system in equilibrium – early 1900s). This
calibrated model would then provide a starting point and initial conditions for transient model calibration runs
between 1900 and 2005. The calibration dataset chosen as best reflecting this situation was between 1924 and
1945. This period reflected the earliest extended period of average rainfall conditions post 1900.
Calibration targets included:
• Water levels recorded within 269 bores between 1924 to 1945. This calibration target was to minimise the
mean residual error between observed and modelled water-level per bore;
• Interpolated potentiometric surfaces for units above the Westbourne Formation. The calibration target was
to achieve a broadly similar modelled potentiometric surface compared to the interpolated potentiometric
surface for each formation.
• Interpolated potentiometric surfaces for units below the Westbourne. The calibration target was to achieve
a broadly similar modelled potentiometric surface compared to the interpolated potentiometric surface for
each formation.
• Model material balance error of less than 5% as recommended by the Australian Groundwater Modelling
Guidelines; and
• Model water budget (inflow-outflow) error of less than 1% as recommended within the Australian
Groundwater Modelling Guidelines.
102
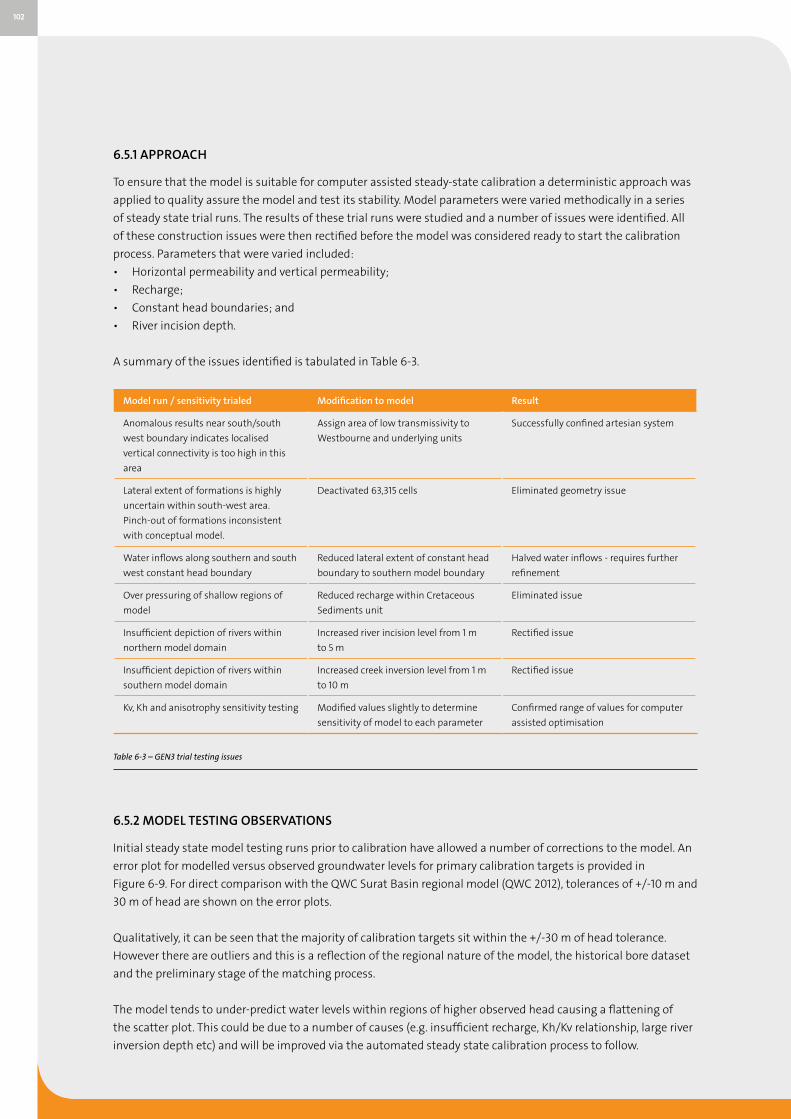
6.5.1 APPROACH
To ensure that the model is suitable for computer assisted steady-state calibration a deterministic approach was
applied to quality assure the model and test its stability. Model parameters were varied methodically in a series
of steady state trial runs. The results of these trial runs were studied and a number of issues were identified. All
of these construction issues were then rectified before the model was considered ready to start the calibration
process. Parameters that were varied included:
• Horizontal permeability and vertical permeability;
• Recharge;
• Constant head boundaries; and
• River incision depth.
A summary of the issues identified is tabulated in Table 6-3.
Model run / sensitivity trialed Modification to model Result
Anomalous results near south/south
west boundary indicates localised
vertical connectivity is too high in this
area
Assign area of low transmissivity to
Westbourne and underlying units
Successfully confined artesian system
Lateral extent of formations is highly
uncertain within south-west area.
Pinch-out of formations inconsistent
with conceptual model.
Deactivated 63,315 cells Eliminated geometry issue
Water inflows along southern and south
west constant head boundary
Reduced lateral extent of constant head
boundary to southern model boundary
Halved water inflows - requires further
refinement
Over pressuring of shallow regions of
model
Reduced recharge within Cretaceous
Sediments unit
Eliminated issue
Insufficient depiction of rivers within
northern model domain
Increased river incision level from 1 m
to 5 m
Rectified issue
Insufficient depiction of rivers within
southern model domain
Increased creek inversion level from 1 m
to 10 m
Rectified issue
Kv, Kh and anisotrophy sensitivity testing Modified values slightly to determine
sensitivity of model to each parameter
Confirmed range of values for computer
assisted optimisation
Table 6-3 – GEN3 trial testing issues
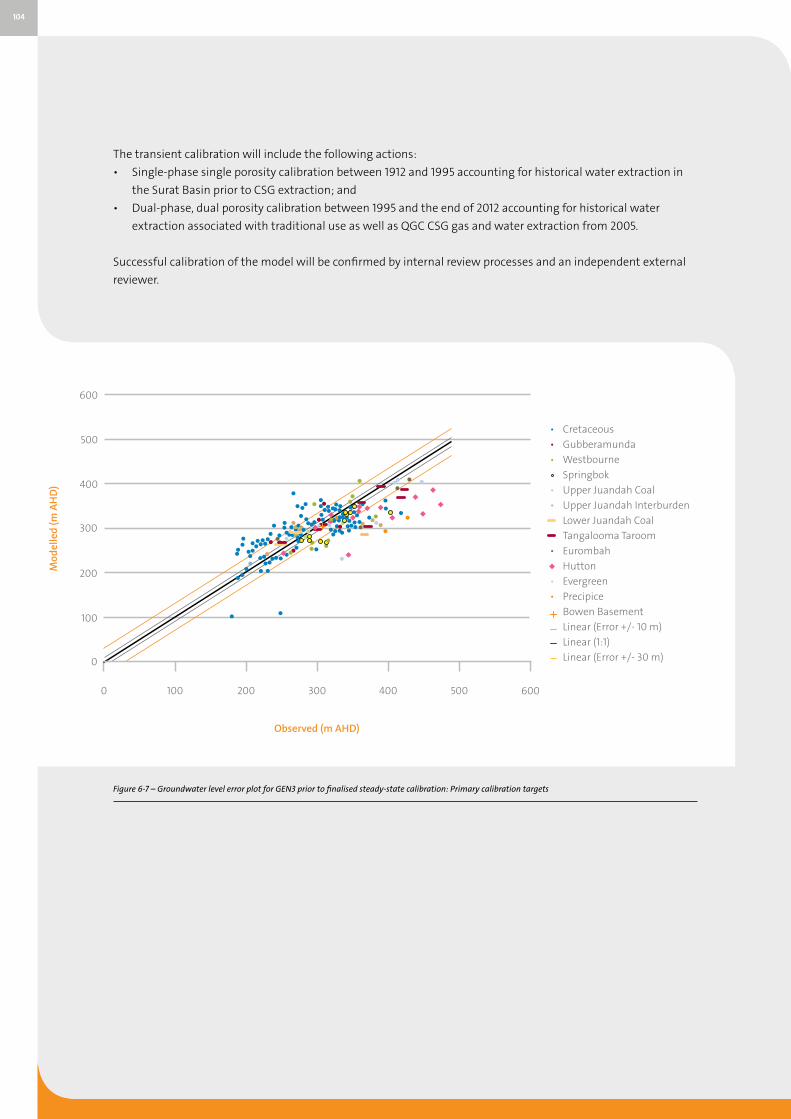
6.5.2 MODEL TESTING OBSERVATIONS
Initial steady state model testing runs prior to calibration have allowed a number of corrections to the model. An
error plot for modelled versus observed groundwater levels for primary calibration targets is provided in
Figure 6-9. For direct comparison with the QWC Surat Basin regional model (QWC 2012), tolerances of +/-10 m and
30 m of head are shown on the error plots.
Qualitatively, it can be seen that the majority of calibration targets sit within the +/-30 m of head tolerance.
However there are outliers and this is a reflection of the regional nature of the model, the historical bore dataset
and the preliminary stage of the matching process.
The model tends to under-predict water levels within regions of higher observed head causing a flattening of
the scatter plot. This could be due to a number of causes (e.g. insufficient recharge, Kh/Kv relationship, large river
inversion depth etc) and will be improved via the automated steady state calibration process to follow.
103
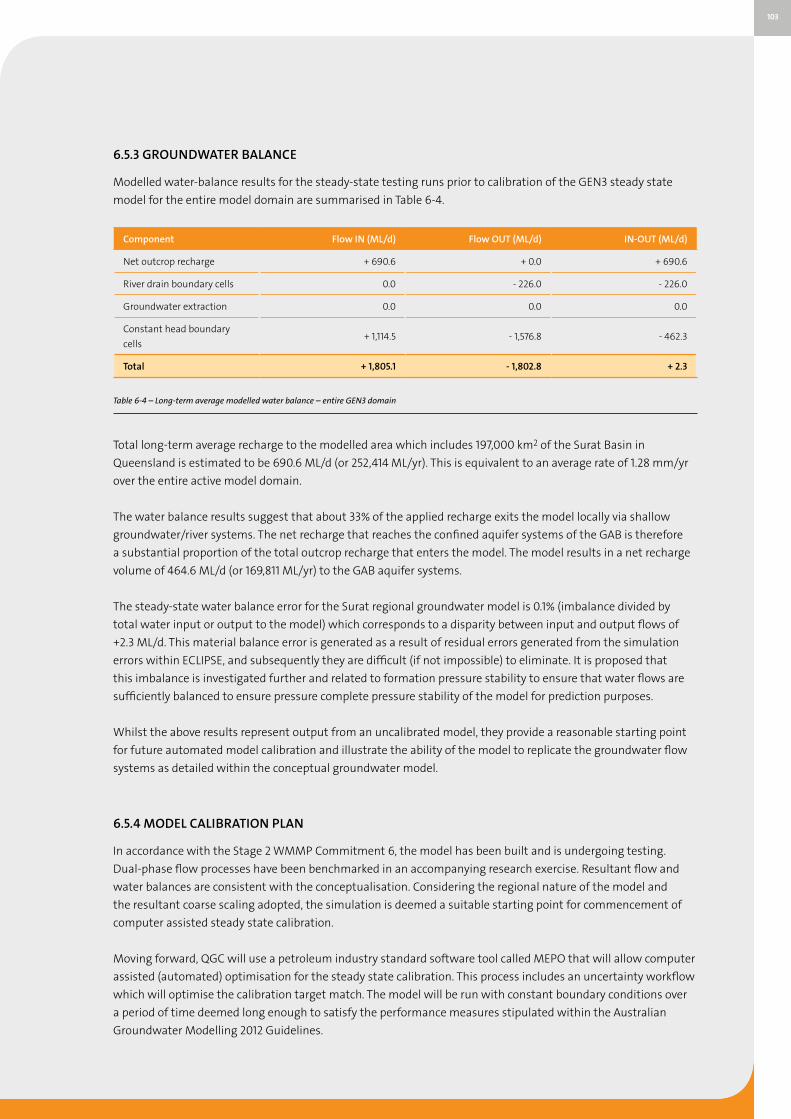
6.5.3 GROUNDWATER BALANCE
Modelled water-balance results for the steady-state testing runs prior to calibration of the GEN3 steady state
model for the entire model domain are summarised in Table 6-4.
Component Flow IN (ML/d) Flow OUT (ML/d) IN-OUT (ML/d)
Net outcrop recharge + 690.6 + 0.0 + 690.6
River drain boundary cells 0.0 - 226.0 - 226.0
Groundwater extraction 0.0 0.0 0.0
Constant head boundary
cells+ 1,114.5 - 1,576.8 - 462.3
Total + 1,805.1 - 1,802.8 + 2.3
Table 6-4 – Long-term average modelled water balance – entire GEN3 domain
Total long-term average recharge to the modelled area which includes 197,000 km2 of the Surat Basin in
Queensland is estimated to be 690.6 ML/d (or 252,414 ML/yr). This is equivalent to an average rate of 1.28 mm/yr
over the entire active model domain.
The water balance results suggest that about 33% of the applied recharge exits the model locally via shallow
groundwater/river systems. The net recharge that reaches the confined aquifer systems of the GAB is therefore
a substantial proportion of the total outcrop recharge that enters the model. The model results in a net recharge
volume of 464.6 ML/d (or 169,811 ML/yr) to the GAB aquifer systems.
The steady-state water balance error for the Surat regional groundwater model is 0.1% (imbalance divided by
total water input or output to the model) which corresponds to a disparity between input and output flows of
+2.3 ML/d. This material balance error is generated as a result of residual errors generated from the simulation
errors within ECLIPSE, and subsequently they are difficult (if not impossible) to eliminate. It is proposed that
this imbalance is investigated further and related to formation pressure stability to ensure that water flows are
sufficiently balanced to ensure pressure complete pressure stability of the model for prediction purposes.
Whilst the above results represent output from an uncalibrated model, they provide a reasonable starting point
for future automated model calibration and illustrate the ability of the model to replicate the groundwater flow
systems as detailed within the conceptual groundwater model.
6.5.4 MODEL CALIBRATION PLAN
In accordance with the Stage 2 WMMP Commitment 6, the model has been built and is undergoing testing.
Dual-phase flow processes have been benchmarked in an accompanying research exercise. Resultant flow and
water balances are consistent with the conceptualisation. Considering the regional nature of the model and
the resultant coarse scaling adopted, the simulation is deemed a suitable starting point for commencement of
computer assisted steady state calibration.
Moving forward, QGC will use a petroleum industry standard software tool called MEPO that will allow computer
assisted (automated) optimisation for the steady state calibration. This process includes an uncertainty workflow
which will optimise the calibration target match. The model will be run with constant boundary conditions over
a period of time deemed long enough to satisfy the performance measures stipulated within the Australian
Groundwater Modelling 2012 Guidelines.
104
The transient calibration will include the following actions:
• Single-phase single porosity calibration between 1912 and 1995 accounting for historical water extraction in
the Surat Basin prior to CSG extraction; and
• Dual-phase, dual porosity calibration between 1995 and the end of 2012 accounting for historical water
extraction associated with traditional use as well as QGC CSG gas and water extraction from 2005.
Successful calibration of the model will be confirmed by internal review processes and an independent external
reviewer.
Figure 6-7 – Groundwater level error plot for GEN3 prior to finalised steady-state calibration: Primary calibration targets
• Cretaceous
Observed (m AHD)
0
0 300100 400200 500
Mod
elle
d (m
AH
D)
200
300
400
500
600
600
• Gubberamunda
• Westbourne
• Springbok
• Upper Juandah Coal
• Upper Juandah Interburden
- Lower Juandah Coal
- Tangalooma Taroom
• Eurombah
• Hutton
• Evergreen
• Precipice
Bowen Basement
Linear (Error +/- 10 m)
Linear (1:1)
Linear (Error +/- 30 m)
100
105
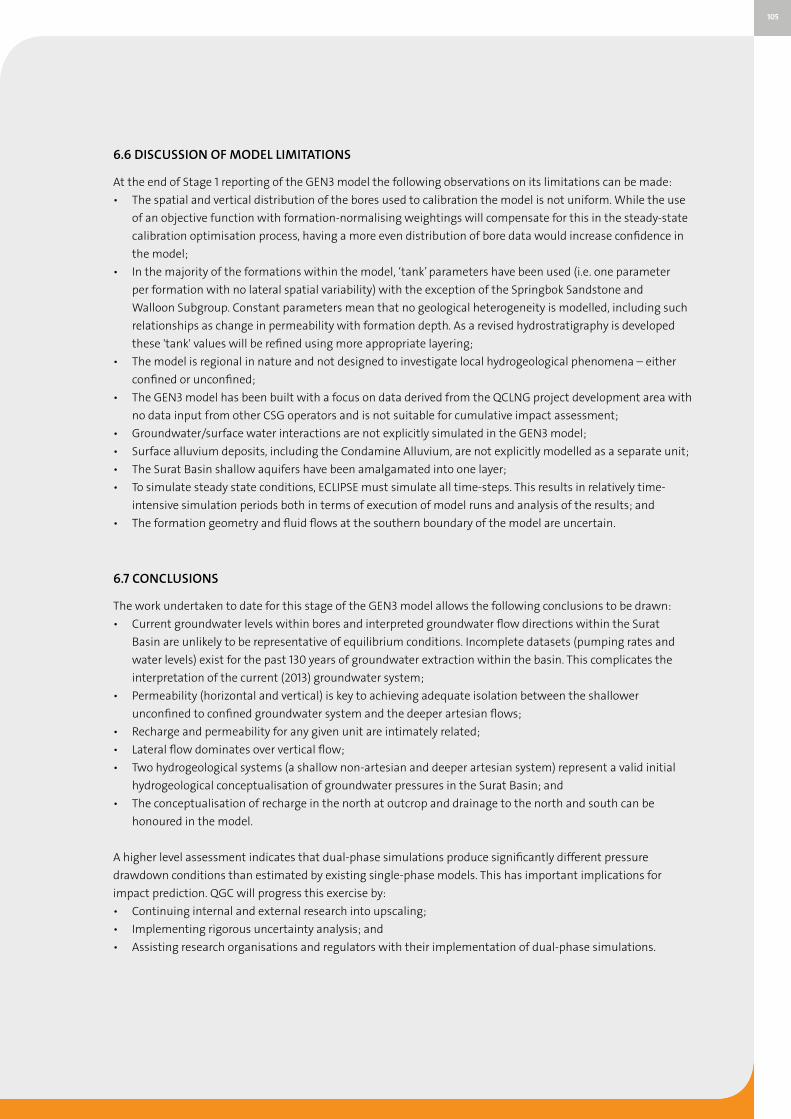
6.6 DISCUSSION OF MODEL LIMITATIONS
At the end of Stage 1 reporting of the GEN3 model the following observations on its limitations can be made:
• The spatial and vertical distribution of the bores used to calibration the model is not uniform. While the use
of an objective function with formation-normalising weightings will compensate for this in the steady-state
calibration optimisation process, having a more even distribution of bore data would increase confidence in
the model;
• In the majority of the formations within the model, ‘tank’ parameters have been used (i.e. one parameter
per formation with no lateral spatial variability) with the exception of the Springbok Sandstone and
Walloon Subgroup. Constant parameters mean that no geological heterogeneity is modelled, including such
relationships as change in permeability with formation depth. As a revised hydrostratigraphy is developed
these 'tank' values will be refined using more appropriate layering;
• The model is regional in nature and not designed to investigate local hydrogeological phenomena – either
confined or unconfined;
• The GEN3 model has been built with a focus on data derived from the QCLNG project development area with
no data input from other CSG operators and is not suitable for cumulative impact assessment;
• Groundwater/surface water interactions are not explicitly simulated in the GEN3 model;
• Surface alluvium deposits, including the Condamine Alluvium, are not explicitly modelled as a separate unit;
• The Surat Basin shallow aquifers have been amalgamated into one layer;
• To simulate steady state conditions, ECLIPSE must simulate all time-steps. This results in relatively time-
intensive simulation periods both in terms of execution of model runs and analysis of the results; and
• The formation geometry and fluid flows at the southern boundary of the model are uncertain.
6.7 CONCLUSIONS
The work undertaken to date for this stage of the GEN3 model allows the following conclusions to be drawn:
• Current groundwater levels within bores and interpreted groundwater flow directions within the Surat
Basin are unlikely to be representative of equilibrium conditions. Incomplete datasets (pumping rates and
water levels) exist for the past 130 years of groundwater extraction within the basin. This complicates the
interpretation of the current (2013) groundwater system;
• Permeability (horizontal and vertical) is key to achieving adequate isolation between the shallower
unconfined to confined groundwater system and the deeper artesian flows;
• Recharge and permeability for any given unit are intimately related;
• Lateral flow dominates over vertical flow;
• Two hydrogeological systems (a shallow non-artesian and deeper artesian system) represent a valid initial
hydrogeological conceptualisation of groundwater pressures in the Surat Basin; and
• The conceptualisation of recharge in the north at outcrop and drainage to the north and south can be
honoured in the model.
A higher level assessment indicates that dual-phase simulations produce significantly different pressure
drawdown conditions than estimated by existing single-phase models. This has important implications for
impact prediction. QGC will progress this exercise by:
• Continuing internal and external research into upscaling;
• Implementing rigorous uncertainty analysis; and
• Assisting research organisations and regulators with their implementation of dual-phase simulations.
106
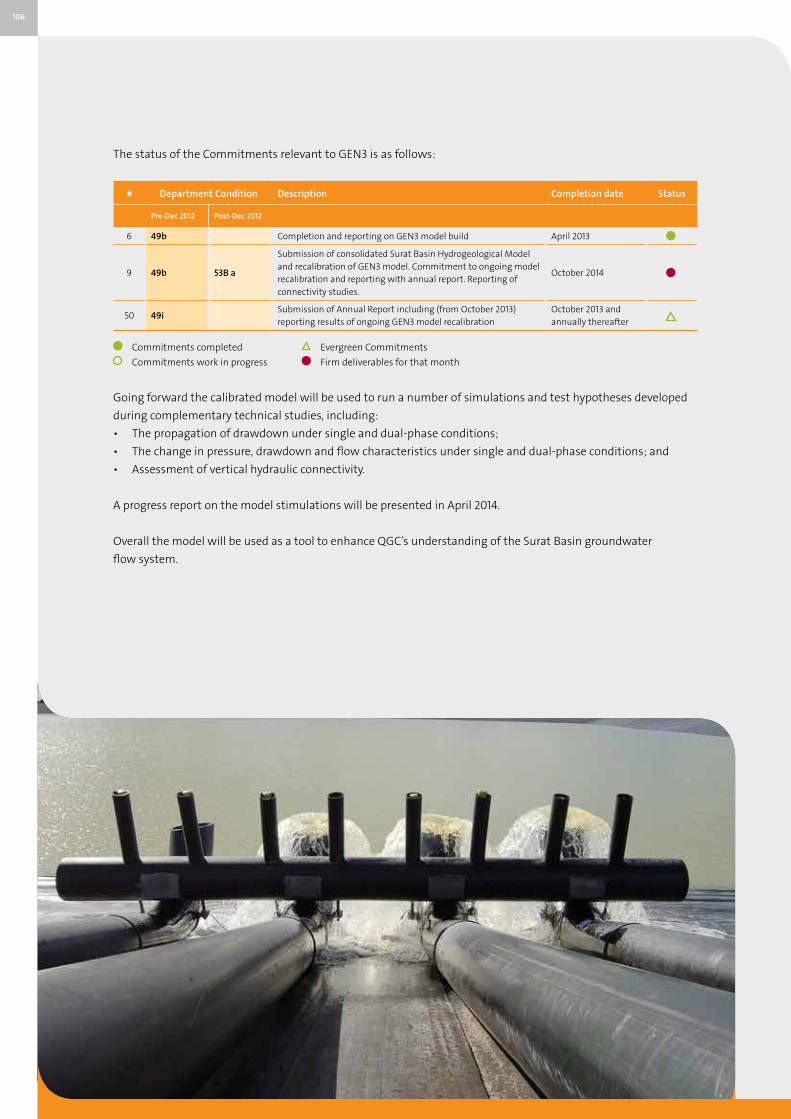
The status of the Commitments relevant to GEN3 is as follows:
# Department Condition Description Completion date Status
Pre-Dec 2012 Post-Dec 2012
6 49b Completion and reporting on GEN3 model build April 2013
9 49b 53B a
Submission of consolidated Surat Basin Hydrogeological Model and recalibration of GEN3 model. Commitment to ongoing model recalibration and reporting with annual report. Reporting of connectivity studies.
October 2014
50 49iSubmission of Annual Report including (from October 2013) reporting results of ongoing GEN3 model recalibration
October 2013 and annually thereafter
Commitments completed Evergreen Commitments
Commitments work in progress Firm deliverables for that month
Going forward the calibrated model will be used to run a number of simulations and test hypotheses developed
during complementary technical studies, including:
• The propagation of drawdown under single and dual-phase conditions;
• The change in pressure, drawdown and flow characteristics under single and dual-phase conditions; and
• Assessment of vertical hydraulic connectivity.
A progress report on the model stimulations will be presented in April 2014.
Overall the model will be used as a tool to enhance QGC’s understanding of the Surat Basin groundwater
flow system.