Embed Size (px)
Citation preview

Calculus 1Lia Vas
Concavity and Inflection Points. Extreme Values and TheSecond Derivative Test.
Consider the following two increasing functions. While they are both increasing, their concavitydistinguishes them.
The first function is said to be concave up and the second to be concave down. More generally,a function is said to be concave up on an interval if the graph of the function is above the tangentat each point of the interval. A function is said to be concave down on an interval if the graph ofthe function is below the tangent at each point of the interval.
Concave up Concave down
In case of the two functions above, their concavity relates to the rate of the increase. Whilethe first derivative of both functions is positive since both are increasing, the rate of the increasedistinguishes them. The first function increases at an increasing rate (see how the tangents becomesteeper as x-values increase) because the slope of the tangent line becomes steeper and steeper as xvalues increase. So, the first derivative of the first function is increasing. Thus, the derivative of thefirst derivative, the second derivative is positive. Note that this function is concave up.
The second function increases at an decreasing rate (see how it flattens towards the right end ofthe graph) so that the first derivative of the second function is decreasing because the slope of the
1
tangent line becomes less and less steep as x values increase. So, the derivative of the first derivative,second derivative is negative. Note that the second function is concave down.
Similarly, consider the following two decreasing functions. We consider again how the concavityrelates both to the rate of the decrease and to the sign of the second derivative.
The first decreasing function decreases at an increasing rate (see how the slopes of tangent linesbecome less and less negative as x-values increase). So, the first derivative of the first function isincreasing. Thus, the derivative of the first derivative, the second derivative is positive. Notealso that this function is concave up.
The second function decreases at an decreasing rate (see how the slope of tangent lines becomemore and more negative as x-values increase). So, the first derivative of the second function isdecreasing. Thus, the derivative of the first derivative, second derivative is negative. Note alsothat this function is concave down.
The chart below summarizes our conclusions regarding the four functions we considered so far.
Thus, we have seen that the concavity exactly corresponds to the the rate of change of the firstderivative which, in turn, exactly corresponds to the sign of the second derivative by the Increas-ing/Decreasing Test applied to the derivative. This correlation is referred to as the Concavity test.
2
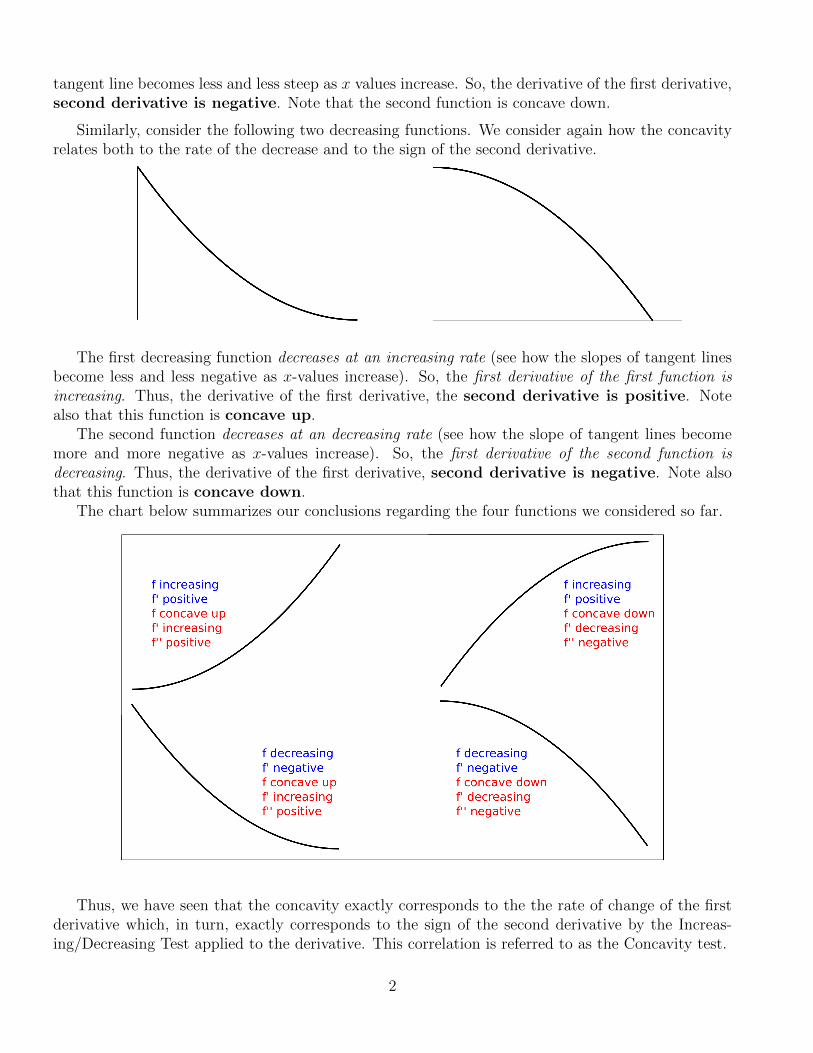
The Concavity Test. For a function f(x) with derivatives f ′ and f ′′
on an interval the following holds.- f is concave up ⇔ f ′ is increasing ⇔ f ′′(x) is positive,- f is concave down ⇔ f ′ is decreasing ⇔ f ′′(x) is negative.
Example 1. Determine the intervals onwhich the function with the graph on the rightdefined on interval (a,∞) is concave up/down.
Solution. The function is concave up on theinterval (a, b) and concave down on the interval(b,∞).
The point at which a function is changing concavity is called the inflection point. In theexample above, the point (b, f(b)) is the inflection point.
If f(x) has an inflection point at x = c, then f ′′(c) = 0 or f ′′(c) does not exist.
Note that if point c is such that f ′′(c) is either zero or undefined, then c is the critical point of f ′.Thus, the inflection points and the critical points of f ′ are in analogous relationship as the criticalpoints of f and the extreme values. So, if f is such that f ′ and f ′′ exist, the following three scenariosare possible.
Case 1 The sign of f ′′ is changing from negative topositive. This means that the function is con-cave down before c, concave up after c and hasan inflection point at x = c.
Case 2 The sign of f ′′ is changing from positive to neg-ative. This means that the function is concaveup before c, concave down after c, and has aninflection point at x = c.
Case 3 The sign of f ′′ is not changing at x = c (it is either positive both before or after c or negativeboth before or after c). In this case, f does not have an inflection point at x = c.
3
The existence of the third case demonstrates that a function does not necessarily have an inflectionpoint at a critical point of f ′. For example, the function x4 is such that f ′ = 4x3 and f ′′(x) = 12x2.f ′′(x) = 12x2 = 0 ⇒ x = 0 so 0 is the critical point of f ′. However, f ′′(x) ≥ 0 for all x so the signof f ′′ does not change at 0. Hence, there is no inflection point at x = 0. Looking at the graph of x4,you can also see that it is concave up on the entire domain.
Using the number line test for f ′′ one can both determine the intervals on which f is concaveup/down as well as classify the critical point of f ′ into three categories matching the three casesabove and determine the inflection points. Let us summarize.
The Inflection Points Test. To determine the inflection points a differentiable function f(x):1. Find f ′′(x).2. Set it to zero and find all the critical points of f ′(x).3. Use the number line to classify the critical points of f ′ into the three cases.
- if f ′′(x) changes sign at c, f has an inflection point at c,- if f ′′(x) does not change the sign at c, f does not have an inflection point at c.
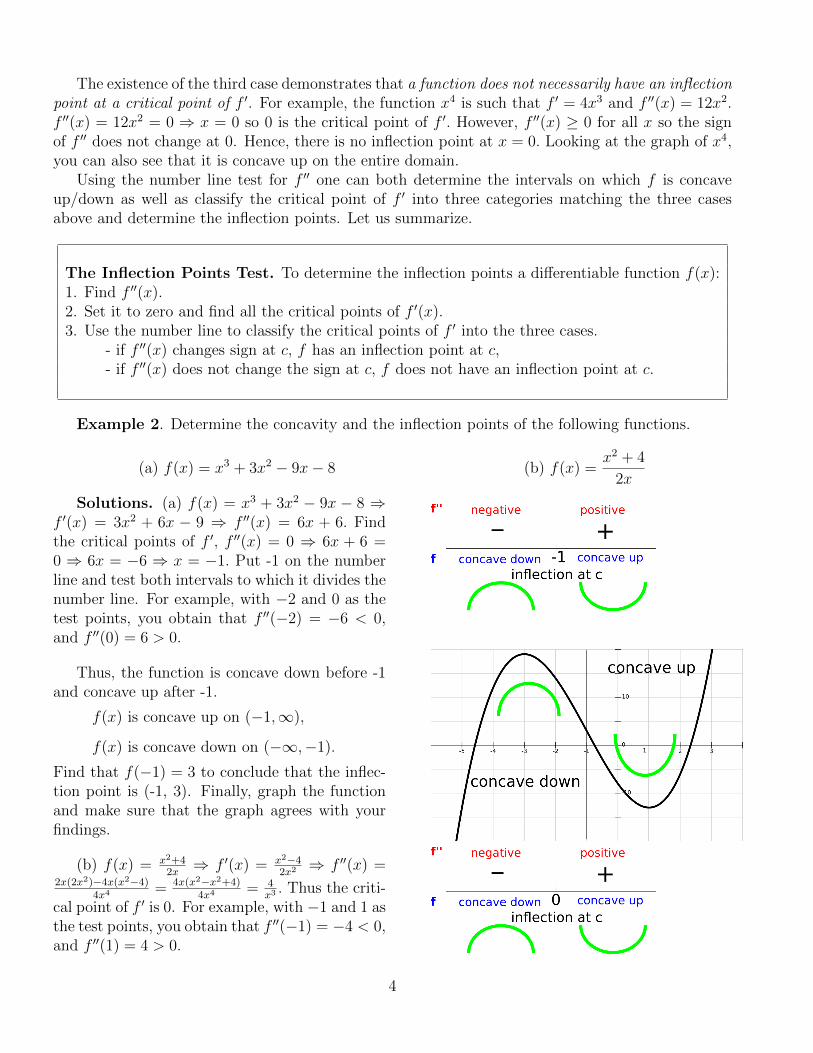
Example 2. Determine the concavity and the inflection points of the following functions.
(a) f(x) = x3 + 3x2 − 9x− 8 (b) f(x) =x2 + 4
2x
Solutions. (a) f(x) = x3 + 3x2 − 9x − 8 ⇒f ′(x) = 3x2 + 6x − 9 ⇒ f ′′(x) = 6x + 6. Findthe critical points of f ′, f ′′(x) = 0 ⇒ 6x + 6 =0 ⇒ 6x = −6 ⇒ x = −1. Put -1 on the numberline and test both intervals to which it divides thenumber line. For example, with −2 and 0 as thetest points, you obtain that f ′′(−2) = −6 < 0,and f ′′(0) = 6 > 0.
Thus, the function is concave down before -1and concave up after -1.
f(x) is concave up on (−1,∞),
f(x) is concave down on (−∞,−1).
Find that f(−1) = 3 to conclude that the inflec-tion point is (-1, 3). Finally, graph the functionand make sure that the graph agrees with yourfindings.
(b) f(x) = x2+42x⇒ f ′(x) = x2−4
2x2 ⇒ f ′′(x) =2x(2x2)−4x(x2−4)
4x4 = 4x(x2−x2+4)4x4 = 4
x3 . Thus the criti-cal point of f ′ is 0. For example, with −1 and 1 asthe test points, you obtain that f ′′(−1) = −4 < 0,and f ′′(1) = 4 > 0.
4
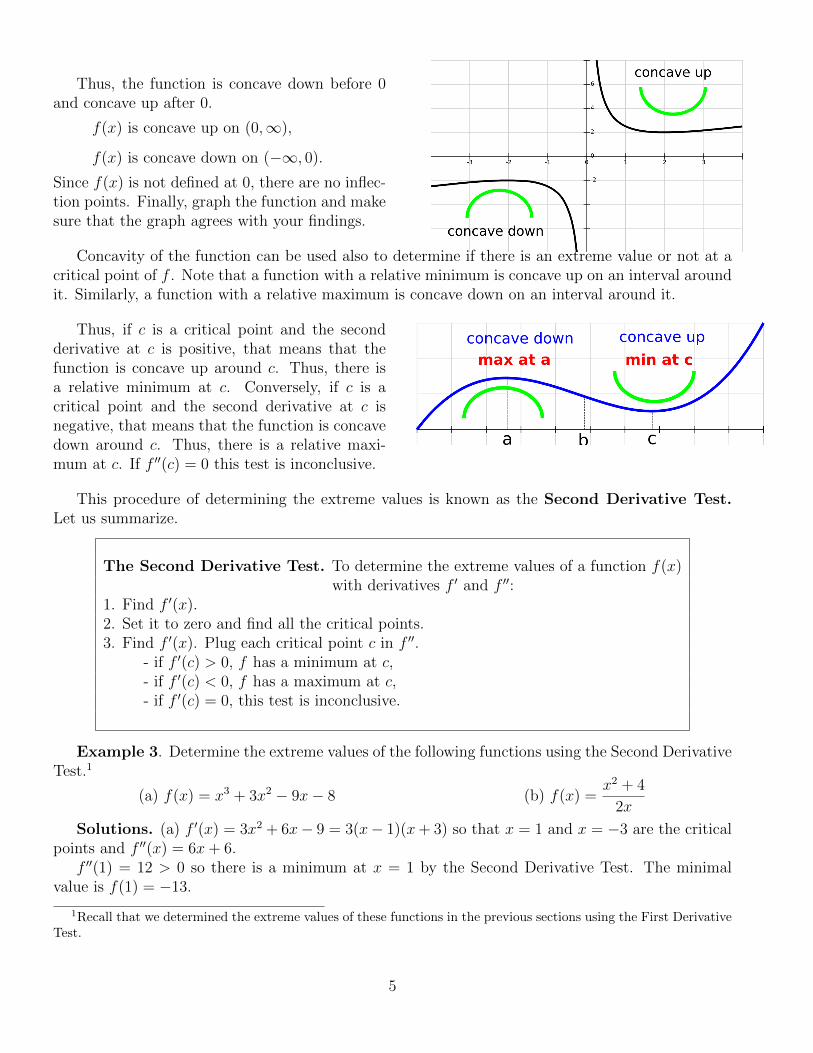
Thus, the function is concave down before 0and concave up after 0.
f(x) is concave up on (0,∞),
f(x) is concave down on (−∞, 0).
Since f(x) is not defined at 0, there are no inflec-tion points. Finally, graph the function and makesure that the graph agrees with your findings.
Concavity of the function can be used also to determine if there is an extreme value or not at acritical point of f . Note that a function with a relative minimum is concave up on an interval aroundit. Similarly, a function with a relative maximum is concave down on an interval around it.
Thus, if c is a critical point and the secondderivative at c is positive, that means that thefunction is concave up around c. Thus, there isa relative minimum at c. Conversely, if c is acritical point and the second derivative at c isnegative, that means that the function is concavedown around c. Thus, there is a relative maxi-mum at c. If f ′′(c) = 0 this test is inconclusive.
This procedure of determining the extreme values is known as the Second Derivative Test.Let us summarize.
The Second Derivative Test. To determine the extreme values of a function f(x)with derivatives f ′ and f ′′:
1. Find f ′(x).2. Set it to zero and find all the critical points.3. Find f ′(x). Plug each critical point c in f ′′.
- if f ′(c) > 0, f has a minimum at c,- if f ′(c) < 0, f has a maximum at c,- if f ′(c) = 0, this test is inconclusive.
Example 3. Determine the extreme values of the following functions using the Second DerivativeTest.1
(a) f(x) = x3 + 3x2 − 9x− 8 (b) f(x) =x2 + 4
2x
Solutions. (a) f ′(x) = 3x2 + 6x− 9 = 3(x− 1)(x+ 3) so that x = 1 and x = −3 are the criticalpoints and f ′′(x) = 6x+ 6.
f ′′(1) = 12 > 0 so there is a minimum at x = 1 by the Second Derivative Test. The minimalvalue is f(1) = −13.
1Recall that we determined the extreme values of these functions in the previous sections using the First DerivativeTest.
5
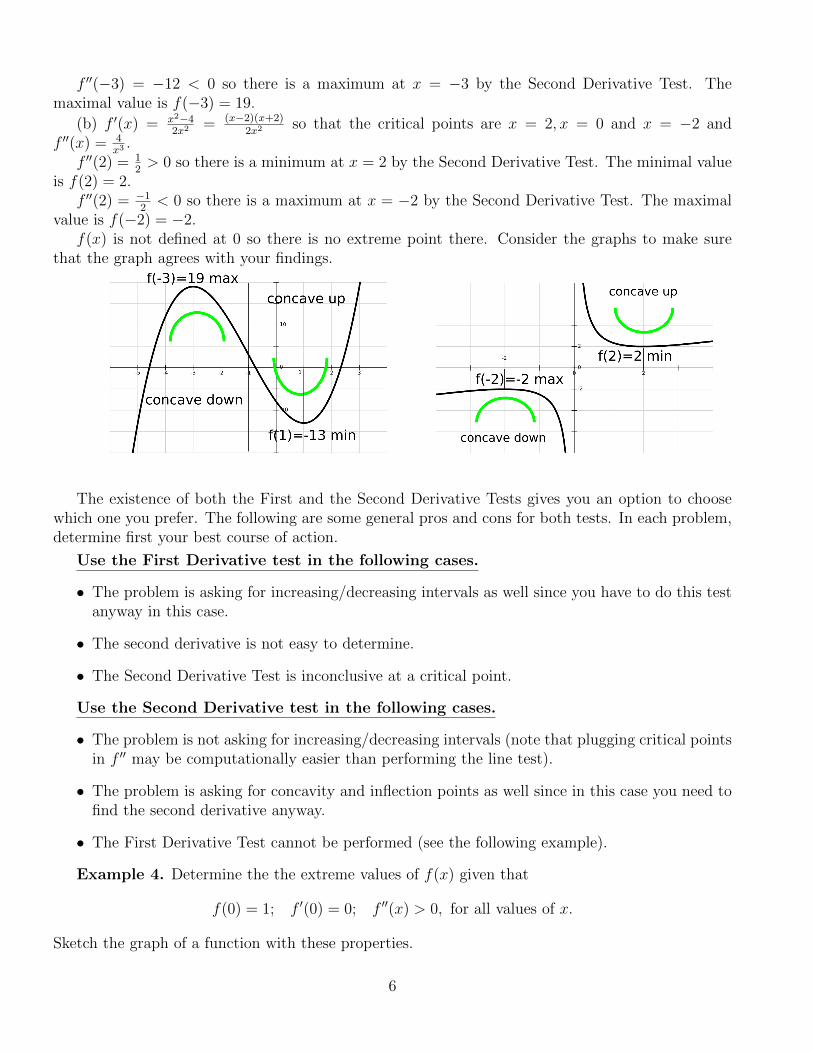
f ′′(−3) = −12 < 0 so there is a maximum at x = −3 by the Second Derivative Test. Themaximal value is f(−3) = 19.
(b) f ′(x) = x2−42x2 = (x−2)(x+2)
2x2 so that the critical points are x = 2, x = 0 and x = −2 andf ′′(x) = 4
x3 .f ′′(2) = 1
2> 0 so there is a minimum at x = 2 by the Second Derivative Test. The minimal value
is f(2) = 2.f ′′(2) = −1
2< 0 so there is a maximum at x = −2 by the Second Derivative Test. The maximal
value is f(−2) = −2.f(x) is not defined at 0 so there is no extreme point there. Consider the graphs to make sure
that the graph agrees with your findings.
The existence of both the First and the Second Derivative Tests gives you an option to choosewhich one you prefer. The following are some general pros and cons for both tests. In each problem,determine first your best course of action.
Use the First Derivative test in the following cases.
• The problem is asking for increasing/decreasing intervals as well since you have to do this testanyway in this case.
• The second derivative is not easy to determine.
• The Second Derivative Test is inconclusive at a critical point.
Use the Second Derivative test in the following cases.
• The problem is not asking for increasing/decreasing intervals (note that plugging critical pointsin f ′′ may be computationally easier than performing the line test).
• The problem is asking for concavity and inflection points as well since in this case you need tofind the second derivative anyway.
• The First Derivative Test cannot be performed (see the following example).
Example 4. Determine the the extreme values of f(x) given that
f(0) = 1; f ′(0) = 0; f ′′(x) > 0, for all values of x.
Sketch the graph of a function with these properties.
6
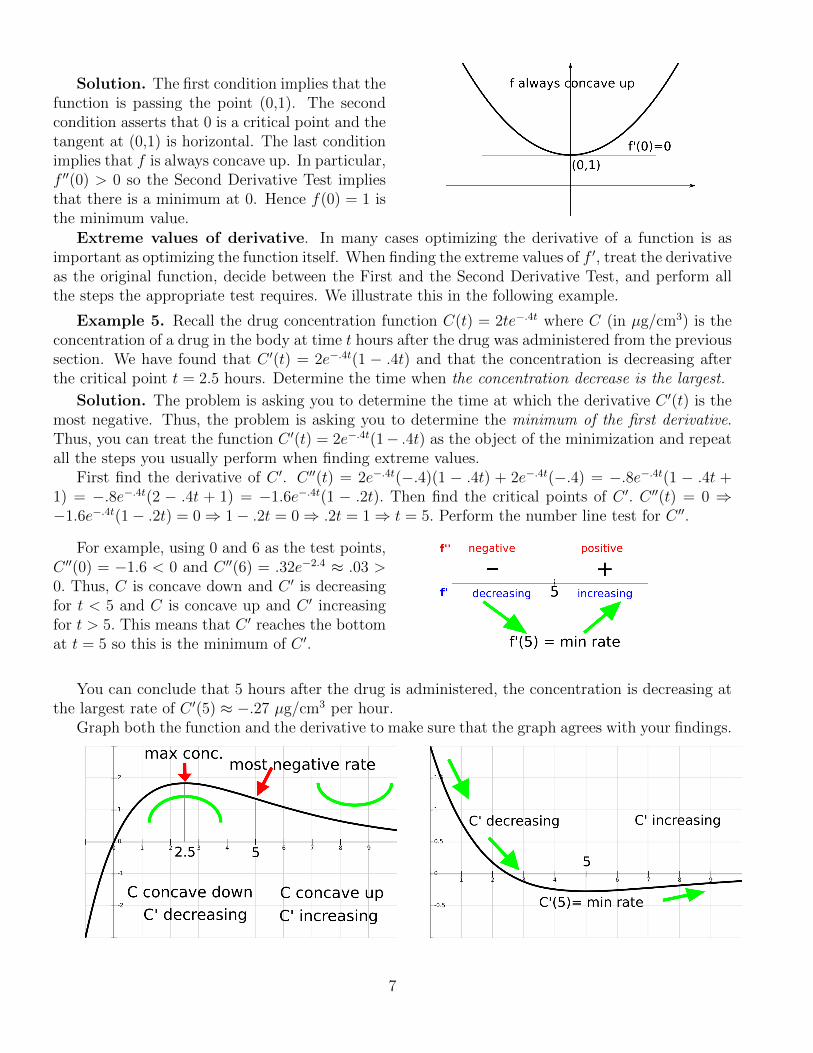
Solution. The first condition implies that thefunction is passing the point (0,1). The secondcondition asserts that 0 is a critical point and thetangent at (0,1) is horizontal. The last conditionimplies that f is always concave up. In particular,f ′′(0) > 0 so the Second Derivative Test impliesthat there is a minimum at 0. Hence f(0) = 1 isthe minimum value.
Extreme values of derivative. In many cases optimizing the derivative of a function is asimportant as optimizing the function itself. When finding the extreme values of f ′, treat the derivativeas the original function, decide between the First and the Second Derivative Test, and perform allthe steps the appropriate test requires. We illustrate this in the following example.
Example 5. Recall the drug concentration function C(t) = 2te−.4t where C (in µg/cm3) is theconcentration of a drug in the body at time t hours after the drug was administered from the previoussection. We have found that C ′(t) = 2e−.4t(1 − .4t) and that the concentration is decreasing afterthe critical point t = 2.5 hours. Determine the time when the concentration decrease is the largest.
Solution. The problem is asking you to determine the time at which the derivative C ′(t) is themost negative. Thus, the problem is asking you to determine the minimum of the first derivative.Thus, you can treat the function C ′(t) = 2e−.4t(1− .4t) as the object of the minimization and repeatall the steps you usually perform when finding extreme values.
First find the derivative of C ′. C ′′(t) = 2e−.4t(−.4)(1 − .4t) + 2e−.4t(−.4) = −.8e−.4t(1 − .4t +1) = −.8e−.4t(2 − .4t + 1) = −1.6e−.4t(1 − .2t). Then find the critical points of C ′. C ′′(t) = 0 ⇒−1.6e−.4t(1− .2t) = 0⇒ 1− .2t = 0⇒ .2t = 1⇒ t = 5. Perform the number line test for C ′′.
For example, using 0 and 6 as the test points,C ′′(0) = −1.6 < 0 and C ′′(6) = .32e−2.4 ≈ .03 >0. Thus, C is concave down and C ′ is decreasingfor t < 5 and C is concave up and C ′ increasingfor t > 5. This means that C ′ reaches the bottomat t = 5 so this is the minimum of C ′.
You can conclude that 5 hours after the drug is administered, the concentration is decreasing atthe largest rate of C ′(5) ≈ −.27 µg/cm3 per hour.
Graph both the function and the derivative to make sure that the graph agrees with your findings.
7
Practice Problems.
1. Find the intervals where f(x) is concave up/down and the inflection points (if any). Find theextreme values using the Second Derivative test.
(a) f(x) = 13x3 + x2 − 15x+ 3 (b) f(x) = 1
x+ x
16
(c) f(x) = lnx+xx
(d) f(x) = xe2x.
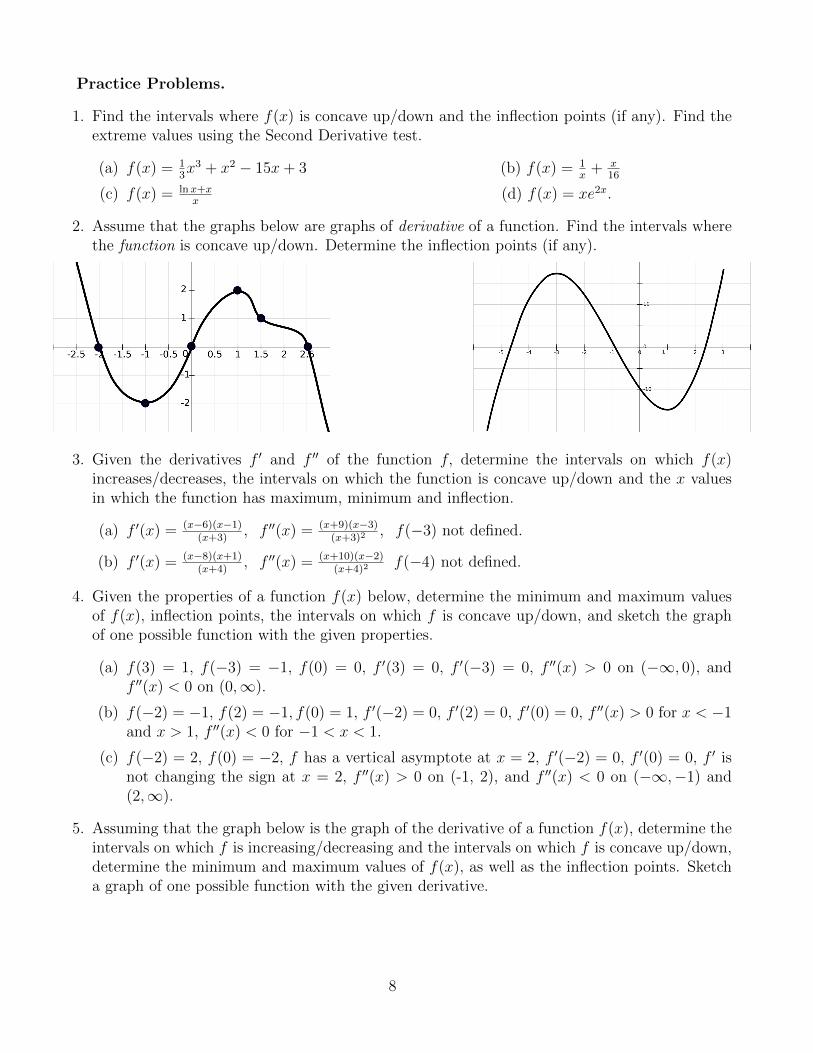
2. Assume that the graphs below are graphs of derivative of a function. Find the intervals wherethe function is concave up/down. Determine the inflection points (if any).
3. Given the derivatives f ′ and f ′′ of the function f, determine the intervals on which f(x)increases/decreases, the intervals on which the function is concave up/down and the x valuesin which the function has maximum, minimum and inflection.
(a) f ′(x) = (x−6)(x−1)(x+3)
, f ′′(x) = (x+9)(x−3)(x+3)2
, f(−3) not defined.
(b) f ′(x) = (x−8)(x+1)(x+4)
, f ′′(x) = (x+10)(x−2)(x+4)2
f(−4) not defined.
4. Given the properties of a function f(x) below, determine the minimum and maximum valuesof f(x), inflection points, the intervals on which f is concave up/down, and sketch the graphof one possible function with the given properties.
(a) f(3) = 1, f(−3) = −1, f(0) = 0, f ′(3) = 0, f ′(−3) = 0, f ′′(x) > 0 on (−∞, 0), andf ′′(x) < 0 on (0,∞).
(b) f(−2) = −1, f(2) = −1, f(0) = 1, f ′(−2) = 0, f ′(2) = 0, f ′(0) = 0, f ′′(x) > 0 for x < −1and x > 1, f ′′(x) < 0 for −1 < x < 1.
(c) f(−2) = 2, f(0) = −2, f has a vertical asymptote at x = 2, f ′(−2) = 0, f ′(0) = 0, f ′ isnot changing the sign at x = 2, f ′′(x) > 0 on (-1, 2), and f ′′(x) < 0 on (−∞,−1) and(2,∞).
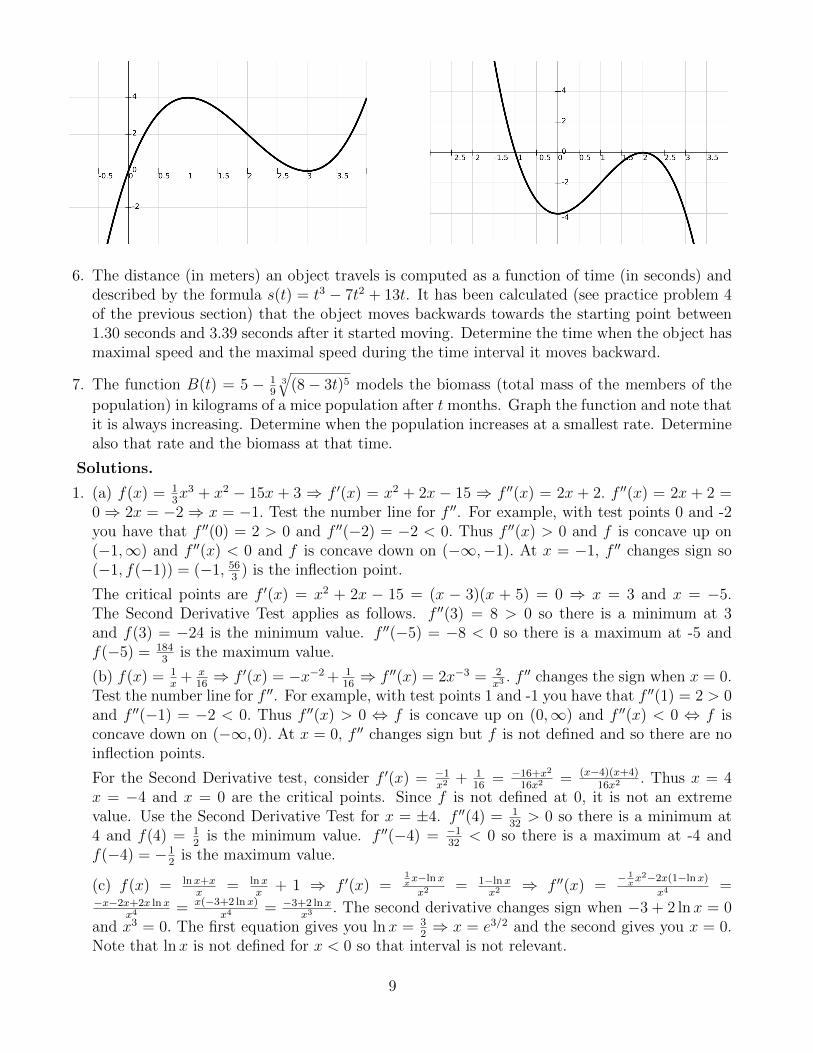
5. Assuming that the graph below is the graph of the derivative of a function f(x), determine theintervals on which f is increasing/decreasing and the intervals on which f is concave up/down,determine the minimum and maximum values of f(x), as well as the inflection points. Sketcha graph of one possible function with the given derivative.
8
6. The distance (in meters) an object travels is computed as a function of time (in seconds) anddescribed by the formula s(t) = t3 − 7t2 + 13t. It has been calculated (see practice problem 4of the previous section) that the object moves backwards towards the starting point between1.30 seconds and 3.39 seconds after it started moving. Determine the time when the object hasmaximal speed and the maximal speed during the time interval it moves backward.
7. The function B(t) = 5 − 19
3
√(8− 3t)5 models the biomass (total mass of the members of the
population) in kilograms of a mice population after t months. Graph the function and note thatit is always increasing. Determine when the population increases at a smallest rate. Determinealso that rate and the biomass at that time.
Solutions.
1. (a) f(x) = 13x3 + x2 − 15x + 3 ⇒ f ′(x) = x2 + 2x − 15 ⇒ f ′′(x) = 2x + 2. f ′′(x) = 2x + 2 =
0⇒ 2x = −2⇒ x = −1. Test the number line for f ′′. For example, with test points 0 and -2you have that f ′′(0) = 2 > 0 and f ′′(−2) = −2 < 0. Thus f ′′(x) > 0 and f is concave up on(−1,∞) and f ′′(x) < 0 and f is concave down on (−∞,−1). At x = −1, f ′′ changes sign so(−1, f(−1)) = (−1, 56
3) is the inflection point.
The critical points are f ′(x) = x2 + 2x − 15 = (x − 3)(x + 5) = 0 ⇒ x = 3 and x = −5.The Second Derivative Test applies as follows. f ′′(3) = 8 > 0 so there is a minimum at 3and f(3) = −24 is the minimum value. f ′′(−5) = −8 < 0 so there is a maximum at -5 andf(−5) = 184
3is the maximum value.
(b) f(x) = 1x
+ x16⇒ f ′(x) = −x−2 + 1
16⇒ f ′′(x) = 2x−3 = 2
x3 . f′′ changes the sign when x = 0.
Test the number line for f ′′. For example, with test points 1 and -1 you have that f ′′(1) = 2 > 0and f ′′(−1) = −2 < 0. Thus f ′′(x) > 0 ⇔ f is concave up on (0,∞) and f ′′(x) < 0 ⇔ f isconcave down on (−∞, 0). At x = 0, f ′′ changes sign but f is not defined and so there are noinflection points.
For the Second Derivative test, consider f ′(x) = −1x2 + 1
16= −16+x2
16x2 = (x−4)(x+4)16x2 . Thus x = 4
x = −4 and x = 0 are the critical points. Since f is not defined at 0, it is not an extremevalue. Use the Second Derivative Test for x = ±4. f ′′(4) = 1
32> 0 so there is a minimum at
4 and f(4) = 12
is the minimum value. f ′′(−4) = −132
< 0 so there is a maximum at -4 andf(−4) = −1
2is the maximum value.
(c) f(x) = lnx+xx
= lnxx
+ 1 ⇒ f ′(x) =1xx−lnx
x2 = 1−lnxx2 ⇒ f ′′(x) =
− 1xx2−2x(1−lnx)
x4 =−x−2x+2x lnx
x4 = x(−3+2 lnx)x4 = −3+2 lnx
x3 . The second derivative changes sign when −3 + 2 lnx = 0and x3 = 0. The first equation gives you lnx = 3
2⇒ x = e3/2 and the second gives you x = 0.
Note that lnx is not defined for x < 0 so that interval is not relevant.
9
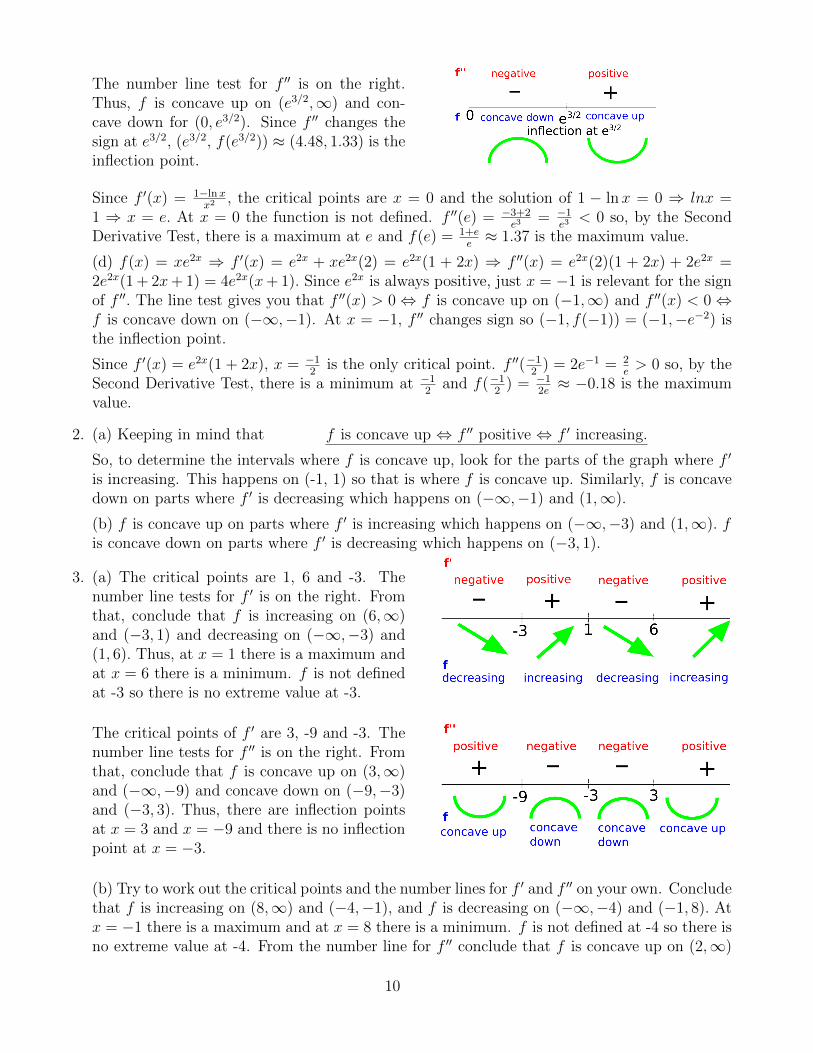
The number line test for f ′′ is on the right.Thus, f is concave up on (e3/2,∞) and con-cave down for (0, e3/2). Since f ′′ changes thesign at e3/2, (e3/2, f(e3/2)) ≈ (4.48, 1.33) is theinflection point.
Since f ′(x) = 1−lnxx2 , the critical points are x = 0 and the solution of 1 − lnx = 0 ⇒ lnx =
1 ⇒ x = e. At x = 0 the function is not defined. f ′′(e) = −3+2e3
= −1e3< 0 so, by the Second
Derivative Test, there is a maximum at e and f(e) = 1+ee≈ 1.37 is the maximum value.
(d) f(x) = xe2x ⇒ f ′(x) = e2x + xe2x(2) = e2x(1 + 2x) ⇒ f ′′(x) = e2x(2)(1 + 2x) + 2e2x =2e2x(1 + 2x+ 1) = 4e2x(x+ 1). Since e2x is always positive, just x = −1 is relevant for the signof f ′′. The line test gives you that f ′′(x) > 0⇔ f is concave up on (−1,∞) and f ′′(x) < 0⇔f is concave down on (−∞,−1). At x = −1, f ′′ changes sign so (−1, f(−1)) = (−1,−e−2) isthe inflection point.
Since f ′(x) = e2x(1 + 2x), x = −12
is the only critical point. f ′′(−12
) = 2e−1 = 2e> 0 so, by the
Second Derivative Test, there is a minimum at −12
and f(−12
) = −12e≈ −0.18 is the maximum
value.
2. (a) Keeping in mind that f is concave up ⇔ f ′′ positive ⇔ f ′ increasing.
So, to determine the intervals where f is concave up, look for the parts of the graph where f ′
is increasing. This happens on (-1, 1) so that is where f is concave up. Similarly, f is concavedown on parts where f ′ is decreasing which happens on (−∞,−1) and (1,∞).
(b) f is concave up on parts where f ′ is increasing which happens on (−∞,−3) and (1,∞). fis concave down on parts where f ′ is decreasing which happens on (−3, 1).
3. (a) The critical points are 1, 6 and -3. Thenumber line tests for f ′ is on the right. Fromthat, conclude that f is increasing on (6,∞)and (−3, 1) and decreasing on (−∞,−3) and(1, 6). Thus, at x = 1 there is a maximum andat x = 6 there is a minimum. f is not definedat -3 so there is no extreme value at -3.
The critical points of f ′ are 3, -9 and -3. Thenumber line tests for f ′′ is on the right. Fromthat, conclude that f is concave up on (3,∞)and (−∞,−9) and concave down on (−9,−3)and (−3, 3). Thus, there are inflection pointsat x = 3 and x = −9 and there is no inflectionpoint at x = −3.
(b) Try to work out the critical points and the number lines for f ′ and f ′′ on your own. Concludethat f is increasing on (8,∞) and (−4,−1), and f is decreasing on (−∞,−4) and (−1, 8). Atx = −1 there is a maximum and at x = 8 there is a minimum. f is not defined at -4 so there isno extreme value at -4. From the number line for f ′′ conclude that f is concave up on (2,∞)
10
and (−∞,−10) and concave down on (−10,−4) and (−4, 2). Thus, there are inflection pointsat x = 2 and x = −10 and there is no inflection point at x = −4.
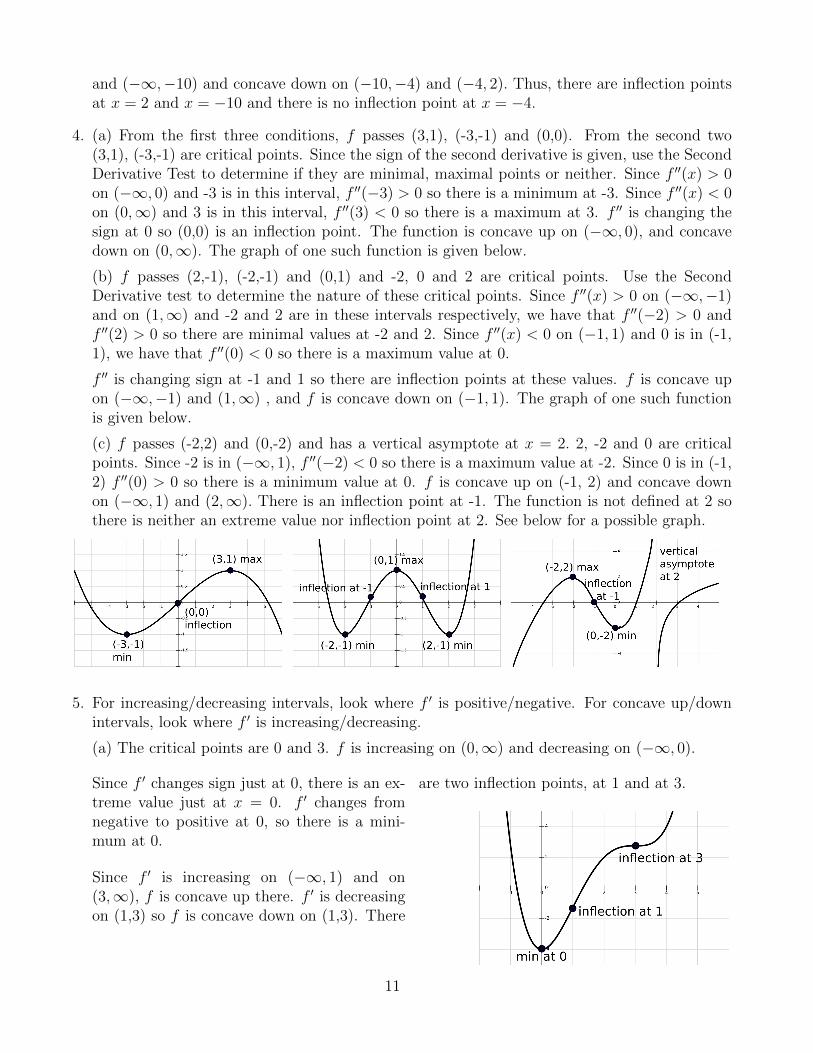
4. (a) From the first three conditions, f passes (3,1), (-3,-1) and (0,0). From the second two(3,1), (-3,-1) are critical points. Since the sign of the second derivative is given, use the SecondDerivative Test to determine if they are minimal, maximal points or neither. Since f ′′(x) > 0on (−∞, 0) and -3 is in this interval, f ′′(−3) > 0 so there is a minimum at -3. Since f ′′(x) < 0on (0,∞) and 3 is in this interval, f ′′(3) < 0 so there is a maximum at 3. f ′′ is changing thesign at 0 so (0,0) is an inflection point. The function is concave up on (−∞, 0), and concavedown on (0,∞). The graph of one such function is given below.
(b) f passes (2,-1), (-2,-1) and (0,1) and -2, 0 and 2 are critical points. Use the SecondDerivative test to determine the nature of these critical points. Since f ′′(x) > 0 on (−∞,−1)and on (1,∞) and -2 and 2 are in these intervals respectively, we have that f ′′(−2) > 0 andf ′′(2) > 0 so there are minimal values at -2 and 2. Since f ′′(x) < 0 on (−1, 1) and 0 is in (-1,1), we have that f ′′(0) < 0 so there is a maximum value at 0.
f ′′ is changing sign at -1 and 1 so there are inflection points at these values. f is concave upon (−∞,−1) and (1,∞) , and f is concave down on (−1, 1). The graph of one such functionis given below.
(c) f passes (-2,2) and (0,-2) and has a vertical asymptote at x = 2. 2, -2 and 0 are criticalpoints. Since -2 is in (−∞, 1), f ′′(−2) < 0 so there is a maximum value at -2. Since 0 is in (-1,2) f ′′(0) > 0 so there is a minimum value at 0. f is concave up on (-1, 2) and concave downon (−∞, 1) and (2,∞). There is an inflection point at -1. The function is not defined at 2 sothere is neither an extreme value nor inflection point at 2. See below for a possible graph.
5. For increasing/decreasing intervals, look where f ′ is positive/negative. For concave up/downintervals, look where f ′ is increasing/decreasing.
(a) The critical points are 0 and 3. f is increasing on (0,∞) and decreasing on (−∞, 0).
Since f ′ changes sign just at 0, there is an ex-treme value just at x = 0. f ′ changes fromnegative to positive at 0, so there is a mini-mum at 0.
Since f ′ is increasing on (−∞, 1) and on(3,∞), f is concave up there. f ′ is decreasingon (1,3) so f is concave down on (1,3). There
are two inflection points, at 1 and at 3.
11
(b) The critical points are -1 and 2. f isincreasing on (−∞,−1) and decreasing on(−1,∞). Since f ′ changes sign just at -1, thereis an extreme value just at -1. f ′ changes frompositive to negative at -1 so there is a maxi-mum at -1.
Since f ′ is increasing on (0,2), f is concave
up on (0,2). Since f ′ is decreasing on (−∞, 0) and on (2,∞), f is concave down there. Thereare two inflection points, at 0 and at 2.
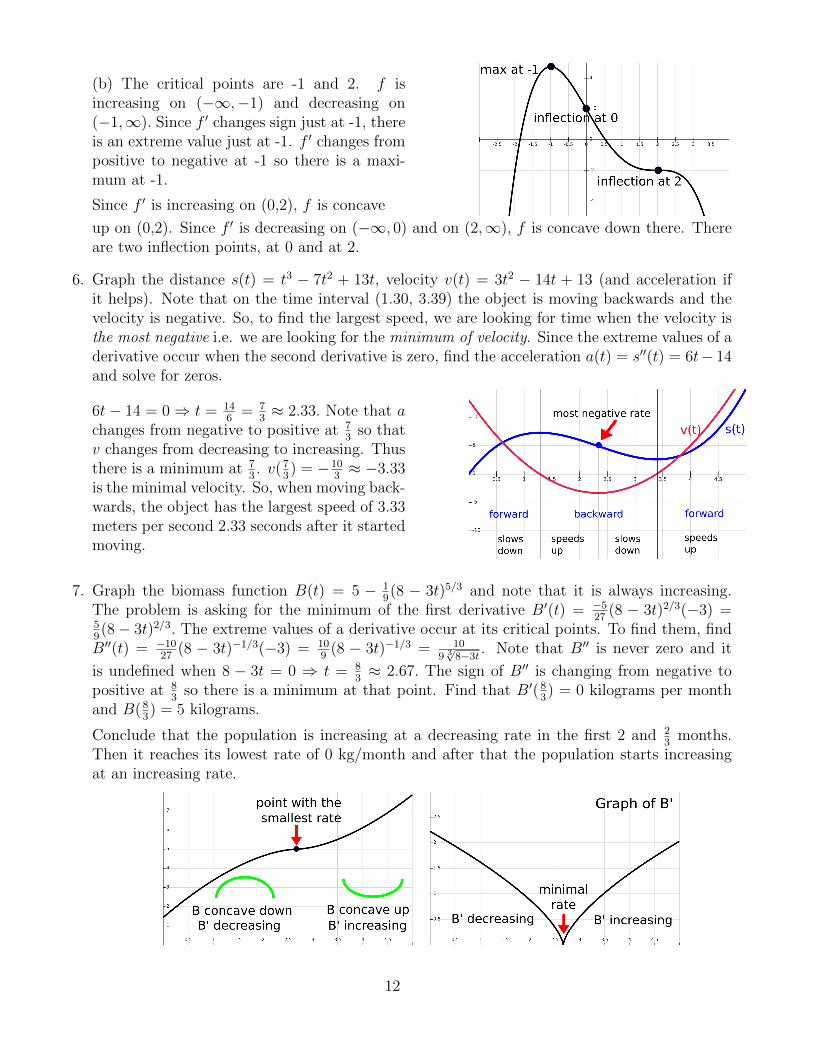
6. Graph the distance s(t) = t3 − 7t2 + 13t, velocity v(t) = 3t2 − 14t + 13 (and acceleration ifit helps). Note that on the time interval (1.30, 3.39) the object is moving backwards and thevelocity is negative. So, to find the largest speed, we are looking for time when the velocity isthe most negative i.e. we are looking for the minimum of velocity. Since the extreme values of aderivative occur when the second derivative is zero, find the acceleration a(t) = s′′(t) = 6t− 14and solve for zeros.
6t− 14 = 0⇒ t = 146
= 73≈ 2.33. Note that a
changes from negative to positive at 73
so thatv changes from decreasing to increasing. Thusthere is a minimum at 7
3. v(7
3) = −10
3≈ −3.33
is the minimal velocity. So, when moving back-wards, the object has the largest speed of 3.33meters per second 2.33 seconds after it startedmoving.
7. Graph the biomass function B(t) = 5 − 19(8 − 3t)5/3 and note that it is always increasing.
The problem is asking for the minimum of the first derivative B′(t) = −527
(8 − 3t)2/3(−3) =59(8− 3t)2/3. The extreme values of a derivative occur at its critical points. To find them, findB′′(t) = −10
27(8 − 3t)−1/3(−3) = 10
9(8 − 3t)−1/3 = 10
9 3√8−3t . Note that B′′ is never zero and it
is undefined when 8 − 3t = 0 ⇒ t = 83≈ 2.67. The sign of B′′ is changing from negative to
positive at 83
so there is a minimum at that point. Find that B′(83) = 0 kilograms per month
and B(83) = 5 kilograms.
Conclude that the population is increasing at a decreasing rate in the first 2 and 23
months.Then it reaches its lowest rate of 0 kg/month and after that the population starts increasingat an increasing rate.
12