Embed Size (px)
Citation preview
© 2011 ISIJ 2056
ISIJ International, Vol. 51 (2011), No. 12, pp. 2056–2063
Application of Statistics of Extreme Values for Inclusions in Stainless Steel on Different Stages of Steel Making Process
Yuichi KANBE,1,2) Andrey KARASEV,1) Hidekazu TODOROKI2) and Pär Göran JÖNSSON1)
1) Materials Science and Engineering, KTH Royal Institute of Technology, Brinellvägen 23, SE-100 44 Stockholm, Sweden. E-mail: [email protected] 2) Nippon Yakin Kogyo Co., Ltd., Technical Research Center, 4-2 Kojima-cho, Kawasaki-ku,Kawasaki, Kanagawa, 210-8558 Japan.
(Received on April 22, 2011; accepted on May 25, 2011)
A statistics of extreme values was applied to determine the largest inclusion sizes in the Type 304 stain-less steel. The samples taken from a tundish, slab and hot rolled steel in one heat were examined byusing a two dimensional observation of inclusions on a metal cross section. It was found that the moltensteel sample contained two different types of inclusions, which were deoxidation products (SiO2–CaO–MgO–Al2O3) and reoxidation products (SiO2–MnO–Cr2O3). As a result, the extreme value distribution (EVD)for different types of inclusions in the melt has two different slopes. Meanwhile, the inclusions in the slabsample provided a good linearity in one EVD. Moreover, the correlation coefficients of the regression linesfor both the slab and rolled steel samples increased significantly with an increased number of measure-ments from 40 to 80 unit areas. It was found also that the EVD data for fractured inclusions on a parallelcross section of rolled steel agreed satisfactorily well with that for the initial spherical inclusions in theslab sample. Based on the geometrical considerations of inclusion deformation and fracture during hot-rolling, the maximum length of fractured inclusions in rolled steel can be estimated reasonably well fromthe EVD for initial undeformed inclusions in the slab sample.
KEY WORDS: extreme value analysis; largest inclusion; regression line; correlation coefficient; hot rolling;fracture; stainless steel.
1. Introduction
It is well known that the large size inclusions in differentsteel grades usually have significant harmful effect on prop-erties and quality of the final products. Therefore, it isimportant to evaluate precisely the inclusion size and num-ber for assessment of steel quality. The statistics of extremevalues is one useful inspection method for estimation ofprobable maximum size of inclusions in the larger area andvolume of steel. In this method, a relatively small area ofsteel sample is examined by using light optical microscopy(LOM) for prediction of the maximum size of inclusions ina larger given area (or volume) of steel.1–7) For improvementof the accuracy of this estimation method, several studieswere carried out.3–7) The probable largest inclusion can bedetermined by using a linear regression formula obtained forextreme value distribution (EVD). Based on numerical sim-ulations, Takahashi6) has reported that the correlation coef-ficient of EVD increased with an increased number of inclu-sions on the unit area. Furthermore, Beretta and Murakami7)
have clarified that the maximum likelihood (ML) method isa reliable method to determine the accurate regression linefrom EVD. However, the reasons of lower linearity of EVDfor inclusions in samples from different stages of steel mak-ing process have not been fully understood.
For rolled steel products, it is well known that some oxideas well as sulfide inclusions become elongated and fractured
during the rolling process. This is mainly due to their softplasticity, especially at high temperatures.8–12) The inclu-sions which are elongated and fractured along the rollingdirection, cause some problems such as anisotropic physicalproperties or crack formation along the inclusions.13–15)
More specifically, Nisitani et al.15) reported that the rate ofcrack growth in the metal matrix increased with the propa-gation of this crack along lined inclusions.
Moreover, it is important for steel making control to pre-dict the longest inclusion in the rolled steel at an earlierstage of the process. It was reported16) that the hot strip isthe preferable sample to estimate the probable largest inclu-sion size from the viewpoint of the time consumption forexaminations.
Furthermore, the three-dimensional (3D) observation ofinclusions with different morphologies is needed for accu-rate extreme value analysis. An electrolytic extraction tech-nique is one of successful methods for 3D investigation ofinclusions on a surface of a film filter after extraction of asteel sample.17,18) Especially for elongated sulfide inclu-sions, the 3D investigation is more accurate compared to aconventional two-dimensional (2D) investigation on a pol-ished cross section of a steel sample.18)
In this study, the EVDs of inclusion sizes were obtainedfor both original and deformed inclusions in a 304 austeniticstainless steel on different stages of a steel making process.More specifically, the EVDs for inclusions in molten steel,
ISIJ International, Vol. 51 (2011), No. 12
2057 © 2011 ISIJ
slab and rolled steel were compared. Thereafter, the predict-ability of the maximum size of inclusions at an early stageof steel production was discussed.
2. Experimental Procedure
2.1. Samples during Steel ProductionA Si–Mn killed 304 austenitic stainless steel has been
selected for this study. The typical composition of this steelis as follows (in mass%): 0.05%C, 0.5%Si, 0.9%Mn,8.1%Ni, 18.1%Cr, 0.0028%O. The steel production of thisaustenitic stainless steel includes the following steps: Aftermelting of scraps in an electric arc furnace (EAF), the meltis refined by using an argon oxygen decarburization (AOD)process. Here, deoxidants in form of Fe–Si alloy and metalmanganese were added. Then, the temperature and compo-sition of molten steel was precisely controlled in a ladle fur-nace (LF) during treatment. Thereafter, the molten steel iscontinuously cast to obtain slabs with a 200 mm thicknessand a 1 000 mm width by means of a vertical continuouscasting machine (CC). The slab is then hot-rolled into an 8.8mm thickness strip after being heated to 1 200°C.
During the processing, samples were taken from a tundishat about 0.2 m under surface of melt by a liquid steel sam-pler (34 mm of diameter with 13 mm of thickness) as wellas from an as-cast slab and a hot-rolled strip. The metalspecimen of slab sample (15 mm × 15 mm × 10 mm) wastaken from near the narrow face of a slab. Meanwhile, themetal specimen of rolled steel sample (10 mm × 40 mm ×8.8 mm of thickness) was taken from the quarter position inwidth direction of strip. It should be noted that all sampleswere taken from the same heat.
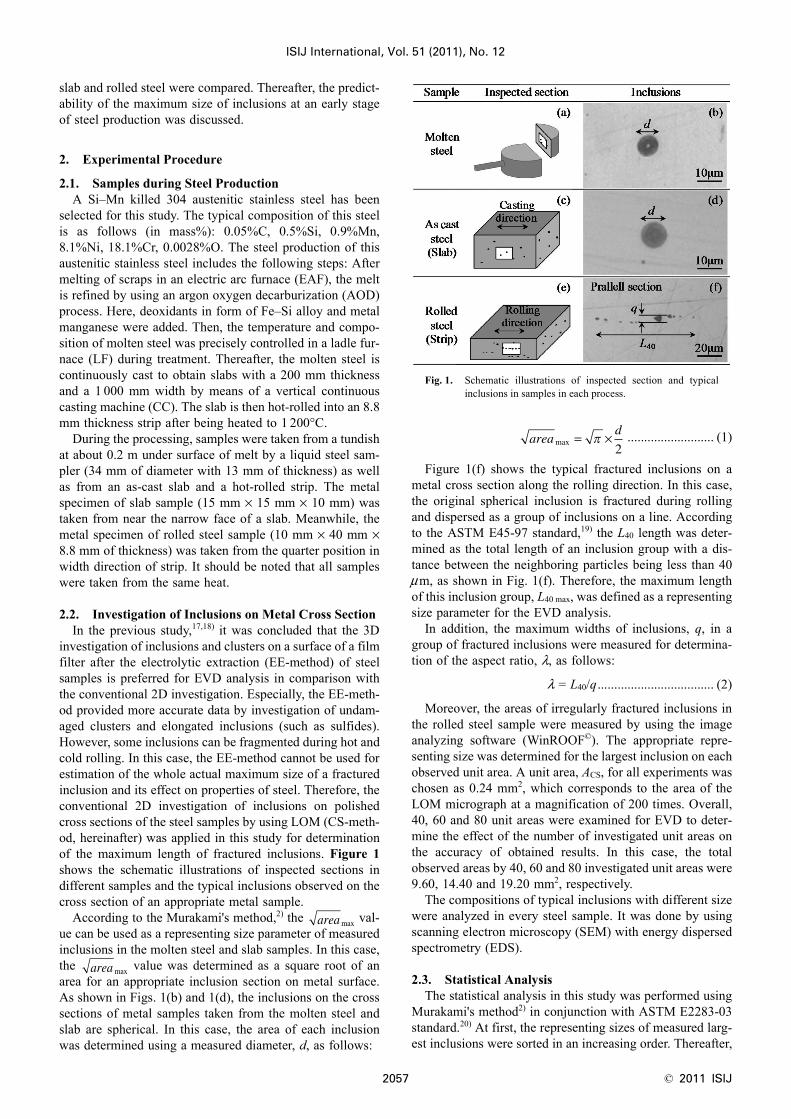
2.2. Investigation of Inclusions on Metal Cross SectionIn the previous study,17,18) it was concluded that the 3D
investigation of inclusions and clusters on a surface of a filmfilter after the electrolytic extraction (EE-method) of steelsamples is preferred for EVD analysis in comparison withthe conventional 2D investigation. Especially, the EE-meth-od provided more accurate data by investigation of undam-aged clusters and elongated inclusions (such as sulfides).However, some inclusions can be fragmented during hot andcold rolling. In this case, the EE-method cannot be used forestimation of the whole actual maximum size of a fracturedinclusion and its effect on properties of steel. Therefore, theconventional 2D investigation of inclusions on polishedcross sections of the steel samples by using LOM (CS-meth-od, hereinafter) was applied in this study for determinationof the maximum length of fractured inclusions. Figure 1shows the schematic illustrations of inspected sections indifferent samples and the typical inclusions observed on thecross section of an appropriate metal sample.
According to the Murakami's method,2) the val-ue can be used as a representing size parameter of measuredinclusions in the molten steel and slab samples. In this case,the value was determined as a square root of anarea for an appropriate inclusion section on metal surface.As shown in Figs. 1(b) and 1(d), the inclusions on the crosssections of metal samples taken from the molten steel andslab are spherical. In this case, the area of each inclusionwas determined using a measured diameter, d, as follows:
.......................... (1)
Figure 1(f) shows the typical fractured inclusions on ametal cross section along the rolling direction. In this case,the original spherical inclusion is fractured during rollingand dispersed as a group of inclusions on a line. Accordingto the ASTM E45-97 standard,19) the L40 length was deter-mined as the total length of an inclusion group with a dis-tance between the neighboring particles being less than 40μm, as shown in Fig. 1(f). Therefore, the maximum lengthof this inclusion group, L40 max, was defined as a representingsize parameter for the EVD analysis.
In addition, the maximum widths of inclusions, q, in agroup of fractured inclusions were measured for determina-tion of the aspect ratio, λ, as follows:
λ = L40/q................................... (2)
Moreover, the areas of irregularly fractured inclusions inthe rolled steel sample were measured by using the imageanalyzing software (WinROOF©). The appropriate repre-senting size was determined for the largest inclusion on eachobserved unit area. A unit area, ACS, for all experiments waschosen as 0.24 mm2, which corresponds to the area of theLOM micrograph at a magnification of 200 times. Overall,40, 60 and 80 unit areas were examined for EVD to deter-mine the effect of the number of investigated unit areas onthe accuracy of obtained results. In this case, the totalobserved areas by 40, 60 and 80 investigated unit areas were9.60, 14.40 and 19.20 mm2, respectively.
The compositions of typical inclusions with different sizewere analyzed in every steel sample. It was done by usingscanning electron microscopy (SEM) with energy dispersedspectrometry (EDS).
2.3. Statistical AnalysisThe statistical analysis in this study was performed using
Murakami's method2) in conjunction with ASTM E2283-03standard.20) At first, the representing sizes of measured larg-est inclusions were sorted in an increasing order. Thereafter,
areamax
areamax
Fig. 1. Schematic illustrations of inspected section and typicalinclusions in samples in each process.
aread
max = ×π2
© 2011 ISIJ 2058
ISIJ International, Vol. 51 (2011), No. 12
the reduced variate for each size data, yi, was determined byEq. (3).
(1 ≤ i ≤ n) ............. (3)
where n is the number of investigated unit areas on a crosssection of a steel sample.
It should be noted that each yi value corresponds to thecumulative frequency of the i-th largest inclusion in the nmeasurements. The EVD for each sample was obtained asrelationship between yi values and representing sizes of larg-est inclusions, xi. A regression line for EVD data was cal-culated for every experiment from the ML method accord-ing to the ASTM E2283-03 standard.20) By extrapolating anobtained regression line, the probable maximum size of thelargest inclusion can be estimated in a given reference area,Aref. In this study, the value of Aref was decided as 240 mm2,which is 1 000 times larger than value of ACS. For estimationof the probable maximum size of an inclusion in the refer-ence area, the value of reduced variate, y, for the Aref valuecan be determined from Eqs. (4) and (5), as follows:
........................ (4)
.................................. (5)
where T is the return period for the reference area (= 1 000in this study).
3. Results and Discussion
3.1. EVD for Spherical Inclusions in Samples fromMolten Steel and Slab
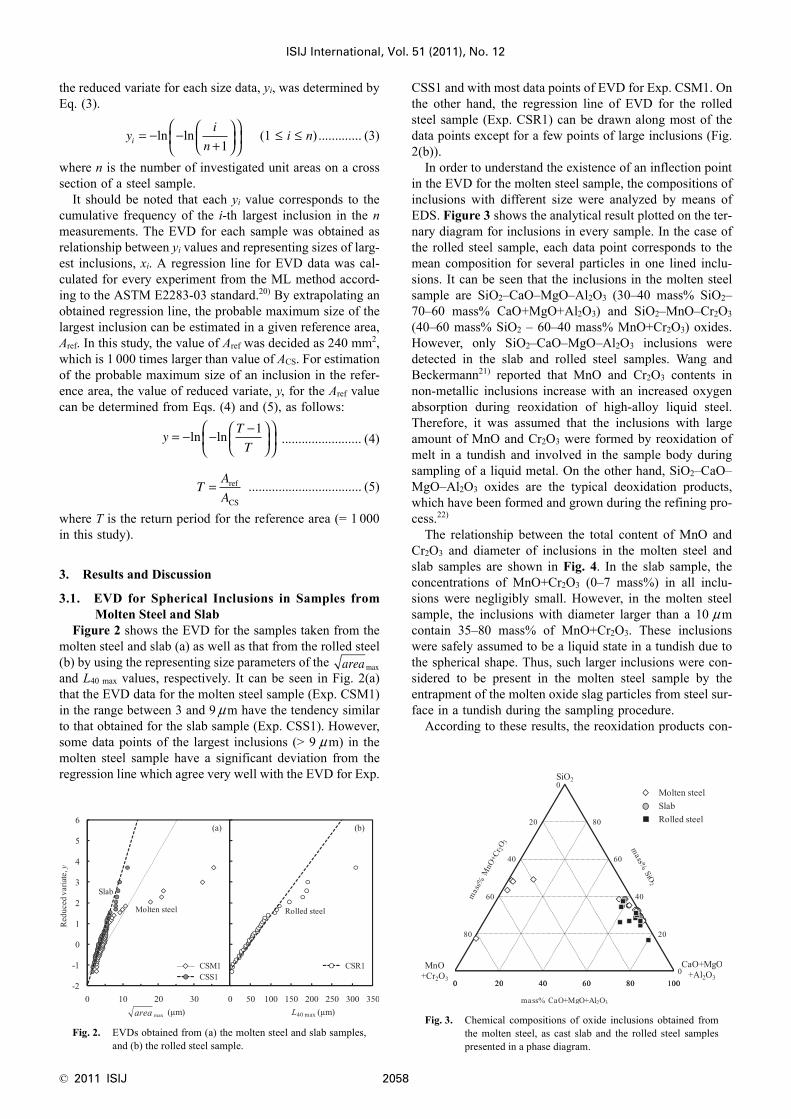
Figure 2 shows the EVD for the samples taken from themolten steel and slab (a) as well as that from the rolled steel(b) by using the representing size parameters of the and L40 max values, respectively. It can be seen in Fig. 2(a)that the EVD data for the molten steel sample (Exp. CSM1)in the range between 3 and 9 μm have the tendency similarto that obtained for the slab sample (Exp. CSS1). However,some data points of the largest inclusions (> 9 μ m) in themolten steel sample have a significant deviation from theregression line which agree very well with the EVD for Exp.
CSS1 and with most data points of EVD for Exp. CSM1. Onthe other hand, the regression line of EVD for the rolledsteel sample (Exp. CSR1) can be drawn along most of thedata points except for a few points of large inclusions (Fig.2(b)).
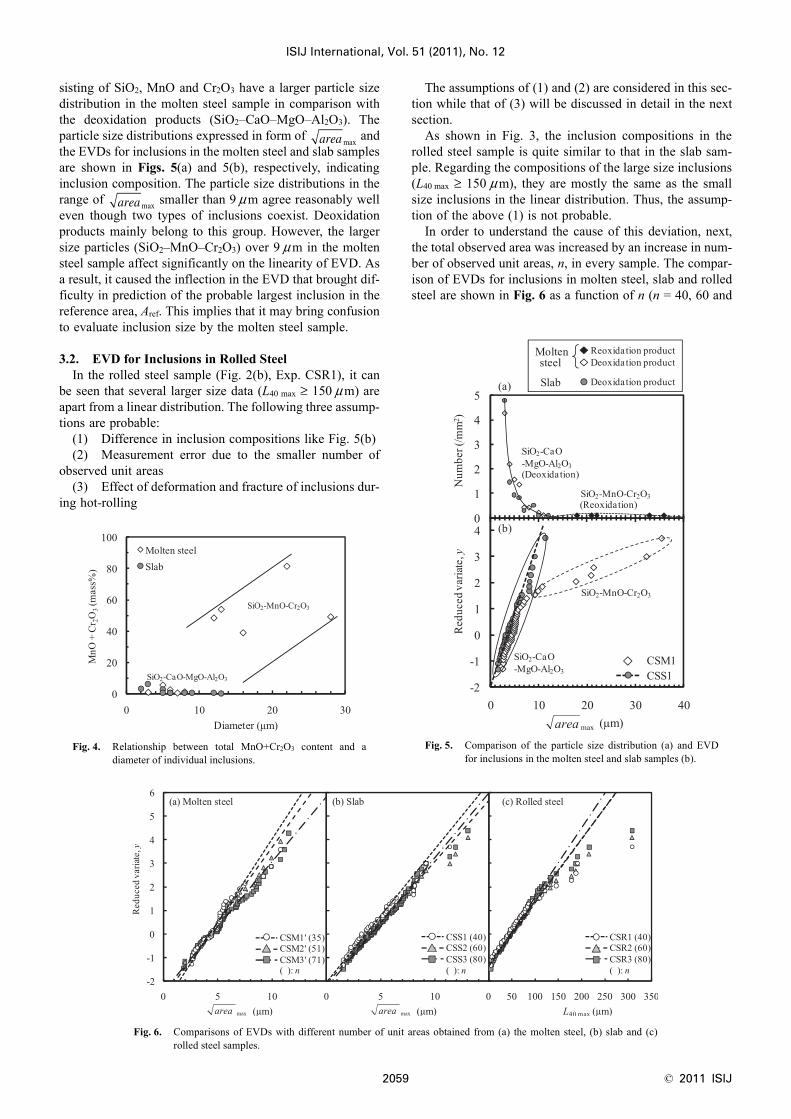
In order to understand the existence of an inflection pointin the EVD for the molten steel sample, the compositions ofinclusions with different size were analyzed by means ofEDS. Figure 3 shows the analytical result plotted on the ter-nary diagram for inclusions in every sample. In the case ofthe rolled steel sample, each data point corresponds to themean composition for several particles in one lined inclu-sions. It can be seen that the inclusions in the molten steelsample are SiO2–CaO–MgO–Al2O3 (30–40 mass% SiO2–70–60 mass% CaO+MgO+Al2O3) and SiO2–MnO–Cr2O3
(40–60 mass% SiO2 – 60–40 mass% MnO+Cr2O3) oxides.However, only SiO2–CaO–MgO–Al2O3 inclusions weredetected in the slab and rolled steel samples. Wang andBeckermann21) reported that MnO and Cr2O3 contents innon-metallic inclusions increase with an increased oxygenabsorption during reoxidation of high-alloy liquid steel.Therefore, it was assumed that the inclusions with largeamount of MnO and Cr2O3 were formed by reoxidation ofmelt in a tundish and involved in the sample body duringsampling of a liquid metal. On the other hand, SiO2–CaO–MgO–Al2O3 oxides are the typical deoxidation products,which have been formed and grown during the refining pro-cess.22)
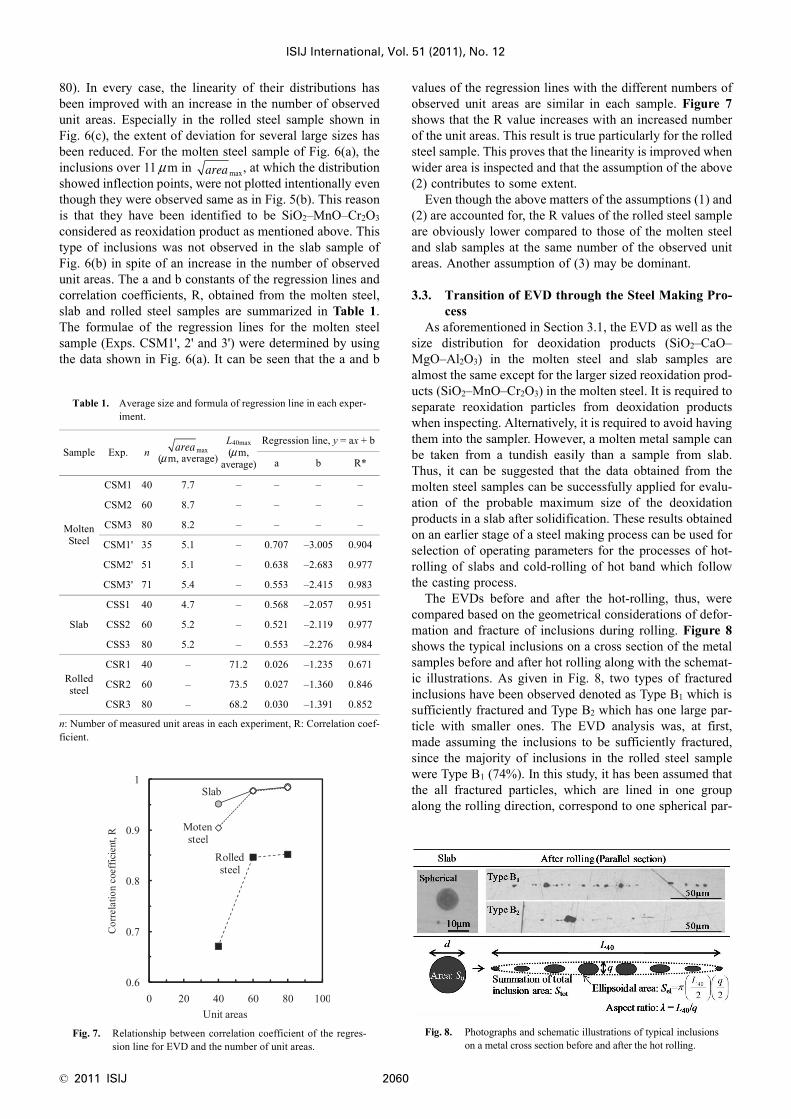
The relationship between the total content of MnO andCr2O3 and diameter of inclusions in the molten steel andslab samples are shown in Fig. 4. In the slab sample, theconcentrations of MnO+Cr2O3 (0–7 mass%) in all inclu-sions were negligibly small. However, in the molten steelsample, the inclusions with diameter larger than a 10 μ mcontain 35–80 mass% of MnO+Cr2O3. These inclusionswere safely assumed to be a liquid state in a tundish due tothe spherical shape. Thus, such larger inclusions were con-sidered to be present in the molten steel sample by theentrapment of the molten oxide slag particles from steel sur-face in a tundish during the sampling procedure.
According to these results, the reoxidation products con-
Fig. 2. EVDs obtained from (a) the molten steel and slab samples,and (b) the rolled steel sample.
yi
ni = − −+
⎛⎝⎜
⎞⎠⎟
⎛
⎝⎜
⎞
⎠⎟ln ln
1
yT
T= − − −⎛
⎝⎜⎞⎠⎟
⎛
⎝⎜
⎞
⎠⎟ln ln
1
TA
A= ref
CS
areamax
Fig. 3. Chemical compositions of oxide inclusions obtained fromthe molten steel, as cast slab and the rolled steel samplespresented in a phase diagram.
ISIJ International, Vol. 51 (2011), No. 12
2059 © 2011 ISIJ
sisting of SiO2, MnO and Cr2O3 have a larger particle sizedistribution in the molten steel sample in comparison withthe deoxidation products (SiO2–CaO–MgO–Al2O3). Theparticle size distributions expressed in form of andthe EVDs for inclusions in the molten steel and slab samplesare shown in Figs. 5(a) and 5(b), respectively, indicatinginclusion composition. The particle size distributions in therange of smaller than 9 μm agree reasonably welleven though two types of inclusions coexist. Deoxidationproducts mainly belong to this group. However, the largersize particles (SiO2–MnO–Cr2O3) over 9 μ m in the moltensteel sample affect significantly on the linearity of EVD. Asa result, it caused the inflection in the EVD that brought dif-ficulty in prediction of the probable largest inclusion in thereference area, Aref. This implies that it may bring confusionto evaluate inclusion size by the molten steel sample.
3.2. EVD for Inclusions in Rolled SteelIn the rolled steel sample (Fig. 2(b), Exp. CSR1), it can
be seen that several larger size data (L40 max ≥ 150 μ m) areapart from a linear distribution. The following three assump-tions are probable:
(1) Difference in inclusion compositions like Fig. 5(b)(2) Measurement error due to the smaller number of
observed unit areas(3) Effect of deformation and fracture of inclusions dur-
ing hot-rolling
The assumptions of (1) and (2) are considered in this sec-tion while that of (3) will be discussed in detail in the nextsection.
As shown in Fig. 3, the inclusion compositions in therolled steel sample is quite similar to that in the slab sam-ple. Regarding the compositions of the large size inclusions(L40 max ≥ 150 μm), they are mostly the same as the smallsize inclusions in the linear distribution. Thus, the assump-tion of the above (1) is not probable.
In order to understand the cause of this deviation, next,the total observed area was increased by an increase in num-ber of observed unit areas, n, in every sample. The compar-ison of EVDs for inclusions in molten steel, slab and rolledsteel are shown in Fig. 6 as a function of n (n = 40, 60 and
Fig. 4. Relationship between total MnO+Cr2O3 content and adiameter of individual inclusions.
areamax
areamax
Fig. 5. Comparison of the particle size distribution (a) and EVDfor inclusions in the molten steel and slab samples (b).
Fig. 6. Comparisons of EVDs with different number of unit areas obtained from (a) the molten steel, (b) slab and (c)rolled steel samples.
© 2011 ISIJ 2060
ISIJ International, Vol. 51 (2011), No. 12
80). In every case, the linearity of their distributions hasbeen improved with an increase in the number of observedunit areas. Especially in the rolled steel sample shown inFig. 6(c), the extent of deviation for several large sizes hasbeen reduced. For the molten steel sample of Fig. 6(a), theinclusions over 11 μm in , at which the distributionshowed inflection points, were not plotted intentionally eventhough they were observed same as in Fig. 5(b). This reasonis that they have been identified to be SiO2–MnO–Cr2O3
considered as reoxidation product as mentioned above. Thistype of inclusions was not observed in the slab sample ofFig. 6(b) in spite of an increase in the number of observedunit areas. The a and b constants of the regression lines andcorrelation coefficients, R, obtained from the molten steel,slab and rolled steel samples are summarized in Table 1.The formulae of the regression lines for the molten steelsample (Exps. CSM1', 2' and 3') were determined by usingthe data shown in Fig. 6(a). It can be seen that the a and b
values of the regression lines with the different numbers ofobserved unit areas are similar in each sample. Figure 7shows that the R value increases with an increased numberof the unit areas. This result is true particularly for the rolledsteel sample. This proves that the linearity is improved whenwider area is inspected and that the assumption of the above(2) contributes to some extent.
Even though the above matters of the assumptions (1) and(2) are accounted for, the R values of the rolled steel sampleare obviously lower compared to those of the molten steeland slab samples at the same number of the observed unitareas. Another assumption of (3) may be dominant.
3.3. Transition of EVD through the Steel Making Pro-cess
As aforementioned in Section 3.1, the EVD as well as thesize distribution for deoxidation products (SiO2–CaO–MgO–Al2O3) in the molten steel and slab samples arealmost the same except for the larger sized reoxidation prod-ucts (SiO2–MnO–Cr2O3) in the molten steel. It is required toseparate reoxidation particles from deoxidation productswhen inspecting. Alternatively, it is required to avoid havingthem into the sampler. However, a molten metal sample canbe taken from a tundish easily than a sample from slab.Thus, it can be suggested that the data obtained from themolten steel samples can be successfully applied for evalu-ation of the probable maximum size of the deoxidationproducts in a slab after solidification. These results obtainedon an earlier stage of a steel making process can be used forselection of operating parameters for the processes of hot-rolling of slabs and cold-rolling of hot band which followthe casting process.
The EVDs before and after the hot-rolling, thus, werecompared based on the geometrical considerations of defor-mation and fracture of inclusions during rolling. Figure 8shows the typical inclusions on a cross section of the metalsamples before and after hot rolling along with the schemat-ic illustrations. As given in Fig. 8, two types of fracturedinclusions have been observed denoted as Type B1 which issufficiently fractured and Type B2 which has one large par-ticle with smaller ones. The EVD analysis was, at first,made assuming the inclusions to be sufficiently fractured,since the majority of inclusions in the rolled steel samplewere Type B1 (74%). In this study, it has been assumed thatthe all fractured particles, which are lined in one groupalong the rolling direction, correspond to one spherical par-
Table 1. Average size and formula of regression line in each exper-iment.
Sample Exp. n (μ m, average)
L40max (μ m,
average)
Regression line, y = ax + b
a b R*
MoltenSteel
CSM1 40 7.7 – – – –
CSM2 60 8.7 – – – –
CSM3 80 8.2 – – – –
CSM1' 35 5.1 – 0.707 –3.005 0.904
CSM2' 51 5.1 – 0.638 –2.683 0.977
CSM3' 71 5.4 – 0.553 –2.415 0.983
Slab
CSS1 40 4.7 – 0.568 –2.057 0.951
CSS2 60 5.2 – 0.521 –2.119 0.977
CSS3 80 5.2 – 0.553 –2.276 0.984
Rolledsteel
CSR1 40 – 71.2 0.026 –1.235 0.671
CSR2 60 – 73.5 0.027 –1.360 0.846
CSR3 80 – 68.2 0.030 –1.391 0.852
n: Number of measured unit areas in each experiment, R: Correlation coef-ficient.
Fig. 7. Relationship between correlation coefficient of the regres-sion line for EVD and the number of unit areas.
areamax
areamax
Fig. 8. Photographs and schematic illustrations of typical inclusionson a metal cross section before and after the hot rolling.
ISIJ International, Vol. 51 (2011), No. 12
2061 © 2011 ISIJ
ticle originally existed in a slab. Taking Eq. (1) into account,the following relationship should be held:
......................... (6)
where Stot is the summation of the areas for all fractured par-ticles lined in a group on a cross section of metal sampleafter rolling, and S0 is the area of the initial spherical inclu-sion on a cross section of a slab sample.
Figure 9 shows the EVDs of the for sphericalinclusions obtained experimentally for the slab sample (Exp.CSS3) in comparison with calculated from fracturedparticles in the rolled steel sample (Exp. CSR3). It can beseen that the EVDs for the slab and rolled steel samples arein good agreement except for a few particles larger than 13μ m. Consequently, the EVD of inclusions in hot-rolled steelcould be estimated using the EVD of inclusions in a slab bygeometrical consideration of the deformation and fragmen-tation of the initial spherical inclusions during hot-rolling ofthe steel.
In this study, it was assumed that the deformed andfractured inclusions of one group after rolling of steel locatedin the form of an ellipsoidal zone as schematically shown in
Fig. 8 by dashed line. The Stot value can be expressed by usingthe length, L40, and width, q, of ellipsoidal zone considering
as follows:
........................ (7)
where f S is the area fraction of fractured inclusions in an areaof ellipsoidal zone.
Thus, L40 can be geometrically calculated by using thevalue of aspect ratio of fractured inclusions, λ, combiningEqs. (2), (6) and (7):
.............................. (8)
This implies that accurate measurement of the λ and f S val-ues enables the estimation of L40. It should be pointed outthat the values of λ and f S depend on the parameters of hot-rolling condition as well as the properties of steel and inclu-sions.
A comparison of the EVDs for rolled inclusions obtainedby measurement (Exp. CSR3) and by calculation (from Eq.(8)) is shown in Fig. 10. The L40 max, Calc values were calcu-lated from the diameters of spherical inclusions in the slabsample (Exp. CSS3; n = 80). Firstly, the values of total arefocused on. In Fig. 10(a), the EVD regression line ofL40 max, Calc (Total) calculated by using the total mean valuesof λ and f S for all inclusions in the rolled steel (27.7 and0.250, respectively) deviates significantly from the realEVD obtained from investigation of the rolled steel sample(Exp. CSR3).
Mean values of λ and f S were determined experimentallyby investigation of fractured inclusions in the rolled steelsample. The results of λ and f S measurements are summa-rized in Table 2. This significant deviation of calculated and
Fig. 9. Comparisons of the EVD for inclusions in the slab androlled steel samples.
S Sd
tot = = ⎛⎝⎜
⎞⎠⎟
0
2
2π
areamax
Stot max
Table 2. Mean λ and f S values obtained from all measurements(Total), Type B1 and Type B2 in Exp. CSR3 with standarddeviation (σ).
Exp. CSR3 n λ σ fs σ
Total 80 27.7 17.6 0.250 0.171
Type B1 59 33.0 16.9 0.214 0.092
Type B2 21 12.7 9.6 0.352 0.275
SL q
e140
2 2= ⎛
⎝⎜⎞⎠⎟⎛⎝⎜
⎞⎠⎟
π
S fL q
Stot = ⋅ ⎛⎝⎜
⎞⎠⎟⎛⎝⎜
⎞⎠⎟
π 40
2 2
L d f40 = λ / s
Fig. 10. Comparison of EVDs for (a) Total, (b) Type B1 and (c) Type B2 inclusion measured in the rolled steel sample(Esp. CSR3) and calculated from the data for slab sample (Exp. CSS3).
© 2011 ISIJ 2062
ISIJ International, Vol. 51 (2011), No. 12
measured EVDs on Fig. 10(a) has to be cleared. The frac-tured inclusions in the rolled steel sample have been classi-fied into two types, Type B1 and Type B2 in this study asstated in the last section; the former is sufficiently deformedand the latter is vice versa. Type B2 is defined as follows inthis study. Type B2 has one larger inclusion with the widthq > 3 μm in one group. In addition, the width of this inclu-sion is more than three times larger than the mean width ofthe other parts in that inclusion group. Type B1 has larger λ(6~76) and smaller f S (0.07~0.46) values than the corre-sponding values of Type B2 (λ = 2~33, f S = 0.12~0.91). Itcan be seen in Fig. 10(b) that the calculated EVD for TypeB1 agrees well with the EVD measured in the rolled steelsample. However, these EVDs for Type B2 have a large dif-ference (Fig. 10(c)). This difference of fracturing phenome-non between Type B1 and B2 might have been caused by thedifference of crystallization behavior of inclusions duringsolidification and heating before hot-rolling. The reason forthis difference, even though both have the same compositionsas explained above, is not fully understood at this moment. Apossible reason for this is that Type B2 is most likely crystal-lized as melilite which is harder to be deformed than glassyoxides. Type B1 is contrary considered to be glassier.
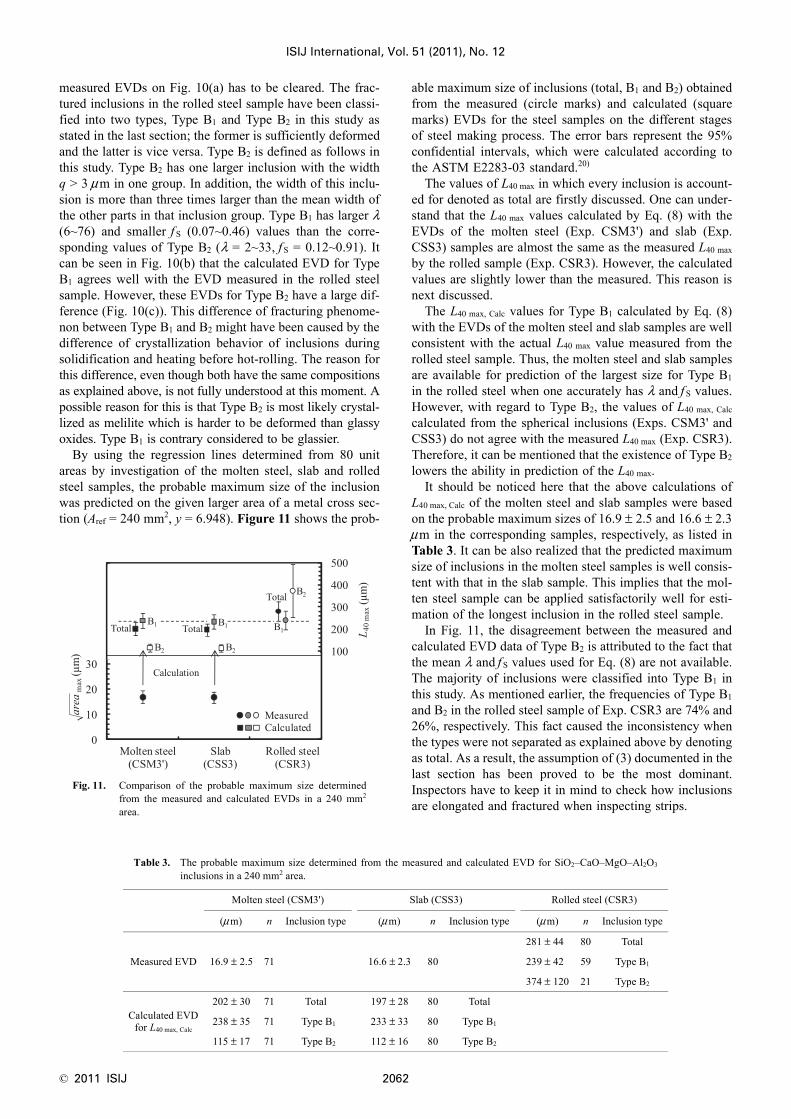
By using the regression lines determined from 80 unitareas by investigation of the molten steel, slab and rolledsteel samples, the probable maximum size of the inclusionwas predicted on the given larger area of a metal cross sec-tion (Aref = 240 mm2, y = 6.948). Figure 11 shows the prob-
able maximum size of inclusions (total, B1 and B2) obtainedfrom the measured (circle marks) and calculated (squaremarks) EVDs for the steel samples on the different stagesof steel making process. The error bars represent the 95%confidential intervals, which were calculated according tothe ASTM E2283-03 standard.20)
The values of L40 max in which every inclusion is account-ed for denoted as total are firstly discussed. One can under-stand that the L40 max values calculated by Eq. (8) with theEVDs of the molten steel (Exp. CSM3') and slab (Exp.CSS3) samples are almost the same as the measured L40 max
by the rolled sample (Exp. CSR3). However, the calculatedvalues are slightly lower than the measured. This reason isnext discussed.
The L40 max, Calc values for Type B1 calculated by Eq. (8)with the EVDs of the molten steel and slab samples are wellconsistent with the actual L40 max value measured from therolled steel sample. Thus, the molten steel and slab samplesare available for prediction of the largest size for Type B1
in the rolled steel when one accurately has λ and f S values.However, with regard to Type B2, the values of L40 max, Calc
calculated from the spherical inclusions (Exps. CSM3' andCSS3) do not agree with the measured L40 max (Exp. CSR3).Therefore, it can be mentioned that the existence of Type B2
lowers the ability in prediction of the L40 max.It should be noticed here that the above calculations of
L40 max, Calc of the molten steel and slab samples were basedon the probable maximum sizes of 16.9 ± 2.5 and 16.6 ± 2.3μm in the corresponding samples, respectively, as listed inTable 3. It can be also realized that the predicted maximumsize of inclusions in the molten steel samples is well consis-tent with that in the slab sample. This implies that the mol-ten steel sample can be applied satisfactorily well for esti-mation of the longest inclusion in the rolled steel sample.
In Fig. 11, the disagreement between the measured andcalculated EVD data of Type B2 is attributed to the fact thatthe mean λ and f S values used for Eq. (8) are not available.The majority of inclusions were classified into Type B1 inthis study. As mentioned earlier, the frequencies of Type B1
and B2 in the rolled steel sample of Exp. CSR3 are 74% and26%, respectively. This fact caused the inconsistency whenthe types were not separated as explained above by denotingas total. As a result, the assumption of (3) documented in thelast section has been proved to be the most dominant.Inspectors have to keep it in mind to check how inclusionsare elongated and fractured when inspecting strips.
Fig. 11. Comparison of the probable maximum size determinedfrom the measured and calculated EVDs in a 240 mm2
area.
Table 3. The probable maximum size determined from the measured and calculated EVD for SiO2–CaO–MgO–Al2O3
inclusions in a 240 mm2 area.
Molten steel (CSM3') Slab (CSS3) Rolled steel (CSR3)
(μ m) n Inclusion type (μ m) n Inclusion type (μm) n Inclusion type
Measured EVD 16.9 ± 2.5 71 16.6 ± 2.3 80
281 ± 44 80 Total
239 ± 42 59 Type B1
374 ± 120 21 Type B2
Calculated EVDfor L40 max, Calc
202 ± 30 71 Total 197 ± 28 80 Total
238 ± 35 71 Type B1 233 ± 33 80 Type B1
115 ± 17 71 Type B2 112 ± 16 80 Type B2
ISIJ International, Vol. 51 (2011), No. 12
2063 © 2011 ISIJ
For usage of steel, it is important to prevent long sizeType B1 to avoid serious sliver defect appearing on strip sur-face as well as the anisotropy of physical properties ofsteel.23) In the case of elongated inclusions like Type B1, thedescribed method is applicable with sufficient accuracy forprediction of the maximum size of inclusions in the hot-rolled steel based on the EVDs for inclusions in the moltensteel and slab samples. However, far more investigation isrequired for inclusions insufficiently deformed to predict thelargest inclusion in a rolled strip in the future.
4. Conclusions
Size measurements of large inclusions in metal samplesof one heat of Type 304 austenitic stainless steel were car-ried out at three stages of the steel making process: in mol-ten steel, slab and hot-rolled steel samples. Statistics ofextreme values of inclusion sizes were applied for predic-tion of a largest size on a sample cross section. The linearityof the extreme value distribution (EVD) and the relationshipamong the EVD of each sample were focused on. The fol-lowing conclusions were obtained:
(1) The extreme value distribution of deoxidation(SiO2–CaO–MgO–Al2O3) and reoxidation (SiO2–MnO–Cr2O3) inclusions in sample of liquid steel from a tundishhas two different slopes. The reoxidation products, whichare involved in sample from surface of melt in a tundish dur-ing sampling, had a larger size than the deoxidation products.
(2) An increase of the measurement number of unitareas from 40 to 80 increases the linearity on the EVD andvalues of correlation coefficient for the regression lines. Itcan improve an accuracy for estimation of the maximumsize for inclusions in steel samples.
(3) As the EVDs for deoxidation inclusions obtainedfrom the molten steel and slab samples agree well, the mol-ten steel samples from a tundish can be used for predictionof the maximum size of these inclusions in slab.
(4) The probable maximum length of fractured inclusionswith similar size particles (Type B1) can be estimated satisfac-torily well from the EVDs for inclusions in molten steel orslab before rolling by using the mean values of area fractionand aspect ratio of the fractured inclusions after rolling.
REFERENCES
1) Y. Uemura and Y. Murakami: Trans. JSME., 56 (1990), 162.2) Y. Murakami: Metal Fatigue –Effects of Small Defects and Nonme-
tallic Inclusions–, Yokendo, Tokyo, (1993).3) S. Beretta and Y. Murakami: Metall. Mater. Trans. B, 32B (2001),
517.4) S. Zhou, Y. Murakami, Y. Fukushima and S. Berretta: Tetsu-to-
Hagané, 87 (2001), 22.S.5) Y. Unigame, K. Hiraoka, I. Takasu and Y. Kato: Bearing Steel Tech-
nology, STP 1465, American Society for Testing and Materials, WestConshohocken, PA, (2007) , 34.
6) J. Takahashi: ISIJ Int., 49 (2009), 1030.7) S. Beretta and Y. Murakami: Fatigue Fract. Eng. Mat. Struct., 21
(1998), 1049.8) T. Malkiewicz and S. Rudnik: J. Iron Steel Inst., 201 (1963), 33.9) H. Iwai, B. Tsujino, S. Isa and T. Ao: Tetsu-to-Hagané, 54 (1968),
1037.10) H. Iwai, B. Tsujino, S. Isa and T. Ao: Tetsu-to-Hagané, 55 (1969),
887.11) S. Ekerot: Scand. J. Metall., 3 (1974), 21.12) S. Kimura, I. Hoshikawa, N. Ibaraki, S. Hattori and T. Osada: Tetsu-
to-Hagané, 88 (2002), 755.13) I. Kozasu: Tetsu-to-Hagané, 61 (1975), 2998.14) M. Kage and H. Nisitani: Trans. JSME., 49 (1983), 286.15) H. Nisitani, M. Kage and T. Yakushiji: J. Soc. Mater. Sci., Jpn., 38
(1989), 501.16) Y. Kanbe, H. Todoroki, N. Hashimoto and S. Nagashima: Sohn Int.
Symp., Advanced Processing of Metals and Materials, Vol. 2, TMS,Warrendale, PA, (2006), 421.
17) Y. Kanbe, A. Karasev, H. Todoroki and P. G. Jönsson: ISIJ Int., 51(2011), 593.
18) Y. Kanbe, A. Karasev, H. Todoroki and P. G. Jönsson: Steel Res. Int.,82 (2011), 313.
19) ASTM E45-97, American Society for Testing and Materials, WestConshohocken, PA, (1998).
20) ASTM E2283-03, American Society for Testing and Materials, WestConshohocken, PA, (2003).
21) L. Wang and C. Beckermann: Metall. Mater. Trans. B, 37B (2006),571.
22) K. Mizuno, H. Todoroki, M. Noda and T. Tohge: ISS Trans., IronSteelmaker, 28 (2001), No.8, 93.
23) S. Inada and H. Todoroki: No. 182nd and 183rd Nishiyama MemorialSeminar, ISIJ, Tokyo, (2004), 227.