Embed Size (px)
Citation preview
Computer Controlled Microindenter System
DoD SBIR Phase II Contract No. N00421-96-C-1121
Naval Air Warfare Center - Aircraft Division Patuxent River, Maryland
Technical Monitor: Dr. Ignacio Perez
Final Report
November 1998 Prepared By: Fahmy M. Haggag Advanced Technology Corporation 661 Emory Valley Road, Suite A Oak Ridge, TN 37830 Tel: (865) 483-5756 Fax: (865) 481-3473 e-mail: [email protected] Web Site: www.atc-ssm.com
Table of Contents Abstract ....................................................................................................................................... 1 Introduction ............................................................................................................................... 2 Phase II Work Plan and Final Results........................................................................................ 3
Task 1 ......................................................................................................................................... 3 Task 2 ......................................................................................................................................... 3 Task 3 ......................................................................................................................................... 3
Brief Description of the Portable/In-Situ Stress-Strain MicroprobeTM (SSM) System.. 4 Task 4 ......................................................................................................................................... 5 Task 5 ......................................................................................................................................... 6
New ABI Tests at Low and High Test Temperatures........................................................ 8 Determination of Fracture Properties from Nondestructive ABI Tests .......................... 8 Indentation Energy to Fracture (IEF) ................................................................................ 9 Calculation of the IEF at various ABI test temperatures for EPRI A533-B Heat 1bK10
Task 6 ....................................................................................................................................... 11 Task 7 ....................................................................................................................................... 11 Task 8 ....................................................................................................................................... 12
Low Cycle Fatigue Damage Detection and Assessment .................................................. 12 Technical Objectives ........................................................................................................... 13 Work Plan............................................................................................................................ 15
Design of Test Matrix ..................................................................................................... 15 Low-Cycle Fatigue Evaluation....................................................................................... 15
Summary of Task 8 Results ............................................................................................... 16 Task 9 ....................................................................................................................................... 17
Current Methods for Measuring Residual Stresses......................................................... 17 Summary of Task 9 Results ............................................................................................... 19
Task 10 ..................................................................................................................................... 20 Task 11 ..................................................................................................................................... 20
REFERENCES ....................................................................................................................... 20
Abstract The Portable/In-Situ Stress-Strain MicroprobeTM (SSM) system (US Patent 4,852,397, August 1989) has been developed by Advanced Technology Corporation (ATC) of Oak Ridge, Tennessee. The first commercial system is currently in use by Harwell Laboratory, United Kingdom since 1991. The SSM system is used in measuring key mechanical properties from small volumes of existing and new materials (e.g. metallic, ceramic, and composites) and in assessing the integrity of aging metallic components and structures in the field (e.g. aircraft, pressure vessels, etc.). Until early 1997, applications of the SSM were successful in testing metallic specimens and components at room temperature (using spherical tungsten carbide indenters). In Phase I of this Navy Small Business Innovation Research (SBIR) project, ATC has extended the capabilities of the SSM system to test ceramic materials and to perform controlled microcrack propagation in single crystals (using a new double-Vickers diamond indenter). Detailed Phase I results of this SBIR project were presented in the Phase I final report, dated October 1995. In Phase II, ATC has expanded the modular capabilities of the SSM system to include: low and high temperature ball indentation testing, evaluation of composites and fiber push-out, new optics and high resolution computer-controlled system for specimen-positioning. Furthermore, ATC developed innovative testing procedures and analytical techniques for the use of different indenter geometries (spherical and cylindrical) to determine creep and stress-relaxation properties. Also, ATC evaluated (at the request of Dr. Ignacio Perez) the feasibility of determining low-cycle fatigue damage and residual stresses from nondestructive ball indentation tests. The limited research on fatigue damage and residual stresses evaluation are considered feasibility studies since they were not investigated in Phase I and have not been solicited by the Navy in the topic number N94-078 of this project. The Navy is currently funding other companies for such topics (e.g. Karta Technologies, Texas, SBIR Phase II for determining residual stresses in aircraft landing gear). Generally, any SBIR Phase II project is limited (by the published SBIR rules) to be a continuation of the same topic of Phase I where the feasibility study was proven or demonstrated and the budget is appropriate for the scope of the solicitation. The new feasibility studies have demonstrated additional capabilities of the SSM system to empirically determine residual stresses (in carbon and high strength steels) and to assess low-cycle fatigue damage in a 2024-T4 aluminum alloy from changes in the yield strength. However, additional funding (Phase III from the Navy or from industry) is required to advance these new capabilities into the commercialization stage. The new capabilities of the computer controlled microindenter system will increase its applications and its market. The SSM system has been successfully manufactured and the low to high temperature indentation testing capabilities (-157ºC/-250ºF to 427ºC/800ºF) have been developed and verified. Furthermore, the true-stress/true-plastic strain curves (measured at various test temperatures) were used with critical fracture stress and critical fracture strain models to determine static and dynamic fracture toughness values in carbon steels. The new fracture toughness determination capability represents a major breakthrough. ATC has received an SBIR Phase II grant from the Department of Energy (DOE) in June 1997 to expand this fracture toughness technology (for several nuclear pressure vessel steels and welds) and to standardize the automated ball indentation (ABI) testing at various temperatures and strain rates. The new
1
developments and the standardization of the ABI technology (currently pursued under ATC’s new DOE Phase II SBIR project) will benefit the Navy and will expand the use of the SSM system. A simple horizontal load frame was temporarily integrated with the SSM system to investigate and evaluate tensile residual stresses from the nondestructive ABI tests. Also, we have proved the nondestructive nature of the ABI tests on several samples of aluminum 2024-T4 subjected to low-cycle fatigue. Furthermore, an indentation creep and indentation stress-relaxation techniques and software programs have been successfully developed. The residual stress and the low-cycle fatigue research investigations could be continued if new funding (Phase III) is received from the Navy. Also, new fixture and indenters have been designed and procured for fiber push-out in composite materials. A state-of-the-art SSM system with all new hardware (including an environmental chamber, a computer-controlled specimen-positioning table, a high-resolution video camera, zoom lens, and a video monitor) and software capabilities (ABI, Tensile, Creep, Stress-Relaxation, and Fiber Push-out) was delivered and commissioned at NAWC-AD, Patuxent River, Maryland in June 1998. This was the major and successful deliverable of this DoD Navy SBIR Phase II project.
Introduction For completeness of this report, the US Navy SBIR solicitation Number N94-078 is given below: “N94-078 TITLE: Microindenter System for the Fabrication of Microcracks CATEGORY: Basic Research: Materials OBJECTIVE: To develop a new computer controlled microindenter system that will allow the operator to introduce simultaneously two indentations in close proximity and in perfect alignment on a crystalline substrate. The device will be capable of controlling, via a computer, the applied load, the indenter orientation and the positions of the indentations on the substrate. The substrate support and the diamond indenter head will be independently temperature controlled via the computer and the process will take place in an inert gas atmosphere. DESCRIPTION: a completely new approach for microelectronics device fabrication consists in the incorporation of cleavage microcracks on an otherwise crack free material. Once the microcracks are introduced, they can be filled with different electronic materials to achieve the desired electronic properties. In order to succeed in this new approach, a controlled way of introducing microcracks in crystalline substrates is required. Commercial microindenters have been used to introduce microcracks in crystalline substrates. Unfortunately, they have only one diamond pyramid in the indenter head and the positioning of the substrate relative to the indenter is performed manually. As a result, alignment in the indentation marks is difficult and poor microcracks develop. This problem can be solved by incorporating two aligned diamond pyramids in a single indenter head. The diamond pyramid tip to tip separation being approximately 200 μm. A computer controlled substrate positioning table would allow for the incorporation of multiple microcracks in one substrate for multi-electronic device fabrication. The applied loads will range between 100g and 2000g. The substrate and indenter head temperature control would allow the cracks to grow without introducing further plastic
2
deformation. Finally, the controlled gas atmosphere would prevent contaminants from entering the crack region. Phase I: Development of two perfectly aligned double Vickers indenter heads for use with a standard Tuckon 300 commercial microindenter from Wilson Industries. One of the double Vickers indenters will be fabricated so that the pyramids have a common side while the other will be fabricated so that the pyramids have a common vertex. The tip to tip separation in both cases will be approximately 200 μm. Also, a final report will be produced that will outline the approach which will be undertaken to pursue requirements for Phase II. Phase II: Development of the complete computer controlled diamond indenter system. The indenter will include the optics, computer controlled positioning and loading, substrate and indenter head temperature control, software and double diamond pyramid indenter heads. Commercial Potential: This device will have the capability of measuring many mechanical properties of materials, such as: Elastic Modulus, Hardness, Fracture Toughness, wear resistance, interfacial properties and all at several temperatures. Potentially new electronic devices could be fabricated with this device”. The goals of Phase I were successfully accomplished and the results presented in the final report of October 1995. This final report describes the successful accomplishments of this SBIR Phase II project. All the tasks of this project were successfully completed as described below.
Phase II Work Plan and Final Results The Phase II work plan consisted of the following tasks: Task 1 : Conduct literature survey. A computer search was conducted at the main library of the University of Tennessee at Knoxville. One objective of this task was to gather state-of-the-art models and/or correlations between various levels of fatigue damage and associated changes in the current stress-strain behavior (hardening or softening) of materials to be investigated in this work (e.g. aluminum and/or steel). A second objective was to study the effects of residual stresses on the uniaxial and multiaxial deformation of metallic materials such as aluminum or steel. Furthermore, indentation creep and stress-relaxation models were reviewed for structural materials as well as for electronics soldering materials. This task is summarized in Appendix A Task 2 : Fahmy M. Haggag (Principal Investigator), Prof. John Landes (The University of Tennessee, Knoxville), and Prof. K. L. Murty (our consultant from North Carolina State University) traveled to the Navy base at Patuxent River in October 1996, to attend a kick-off meeting and to discuss the planned experimental work and hardware and software development tasks. The new capabilities, developed in Phase I, were presented during this trip and the original view graphs of Haggag’s presentation were given to Dr. Ignacio Perez. Also, Dr. Landes and Dr. Murty made separate presentations. Task 3 : The following items have been ordered and received from ATC and other vendors and was delivered later to NAWC-AD on June 1998: Basic SSM system with load capabilities from
3
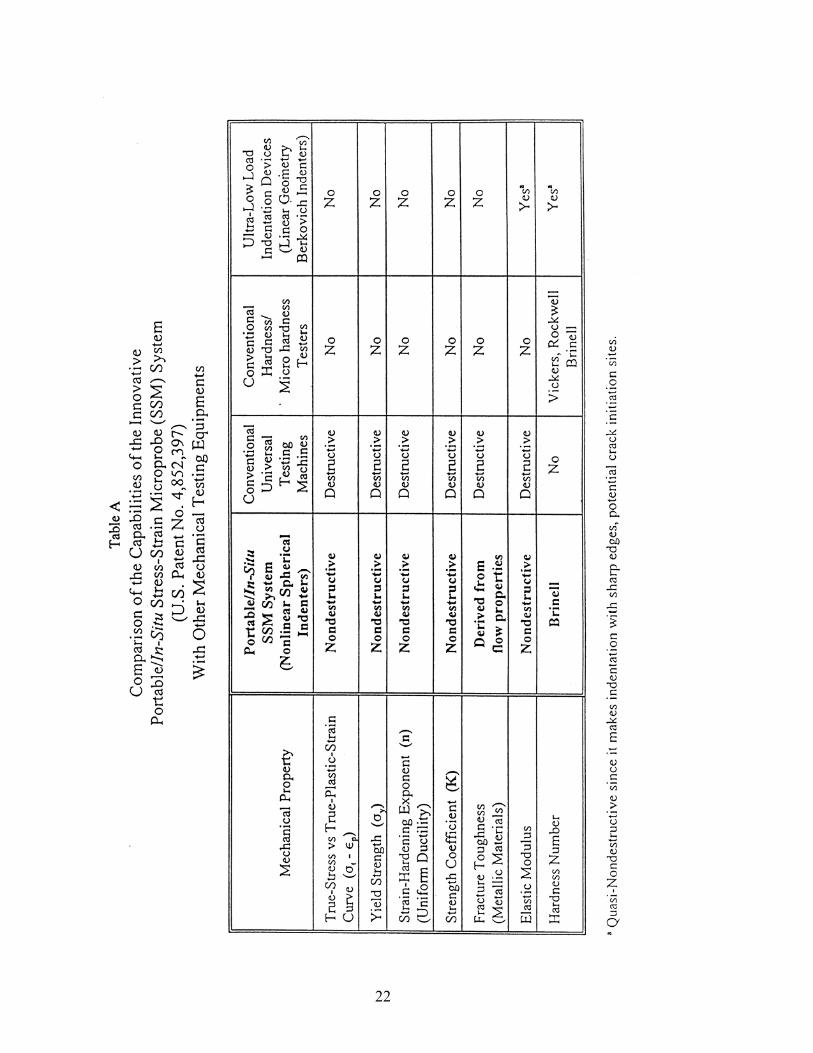
few grams up to 420 kg (1000 lbs), heat/cool chamber and temperature controller for testing in air at -320ºF to +800ºF (-196ºC to +427ºC), motorized high resolution (± 5 microns of a meter) positioning table and optics (0.7 to 4.5 zoom lens, video camera, high resolution monitor with magnification capabilities ranging from 30X to 200X), different geometry indenters (0.010"/0.25-mm, 0.02"/0.50-mm, and 0.062"/1.57-mm diameter fabricated from tungsten carbide, 20-μm-diameter diamond indenter for thin film evaluations, silicon nitride indenters for high temperature testing at 427ºC), small load cells with capacities of 500 grams, 100 lbs, and 1000 lbs), and high temperature fixtures. The basic SSM system was demonstrated at NAWC-AD, Warminster, PA on April 14, 1995. Major differences between the SSM System and other indentation or nanoindentation devices from other vendors include the load capabilities from few grams to 420kg, portable and easy conversion from laboratory to field testing capabilities, and the use of various indenter geometries and test techniques, including ATC’s patented automated ball indentation (ABI) technique to measure stress-strain curves. Table A shows the differences between the SSM system and other equipment. Drawings of the different components and configurations of the new computer controlled microindenter system and its block diagram are shown in Figs. 1 through 7. Also, an example of the innovative 10 microns radius spherical-tip diamond indenter is shown (using Scanning-Electron-Microscope) in Fig.8. Fig. 9 is a photograph of the Navy’s SSM system with all newly-developed options installed in its laboratory bench-top configuration. This system was shipped to the NAWC-AD (Patuxent River, MD) on June 2, 1998 and it was installed and commissioned on June 10 and 11, 1998. Brief Description of the Portable/In-Situ Stress-Strain MicroprobeTM (SSM) System Although the SSM system is described in several publications referenced in this report, a brief description is given here for completeness. The portable Stress-Strain Microprobe system utilizes an electro-mechanical-driven indenter, high resolution displacement transducer and load cell, and a test controller (16-bit data acquisition and control unit). A personal computer (PC) and comprehensive copyrighted ABI software are used for test control, data acquisition, and data analyses. The ABI test is a new in-situ and substantially nondestructive technique which is being used to determine several key mechanical properties (yield strength, true-stress/true-plastic-strain curve, strain-hardening exponent, and an estimate of the local fracture toughness) of metallic materials [Refs. 1-10]. The ABI test is based on controlled sequential indentation cycles on a polished metallic surface by a spherical indenter. The ABI cycles are performed at the same penetration location and each cycle consists of indentation, partial-unload, and reload sequences. The indentation load and its associated penetration depth increase from one cycle to the next until a user-specified depth is reached; then the load is completely removed. The test is fully automated where the computer and test controller are used in innovated ways to control the test as well as to analyze test data. The applied loads and associated displacements are measured using a load cell and a spring-loaded linear variable differential transducer (LVDT). The SSM system uses several interchangeable indenters (0.005 to 0.031 inch radius) according to the thickness and width of the test material. Although some test material might be thick, a small indenter must be used if a narrow heat-affected-zone (HAZ) is to be tested successfully. The indentation load-depth data from each partial elastic-unloading sequence are fitted to a first
4
degree polynomial and then extrapolated to obtain the plastic depth corresponding to zero load. The plastic depth, the maximum cycle load, and the total depth (elastic + plastic) values from each indentation sequence are used to determine the yield strength, produce the ABI-derived true-stress/true-plastic-strain curve, and to estimate the fracture toughness. The ABI analyses are based primarily on elasticity and plasticity theories [Refs. 1-10]. While the ABI test data are presented as real-time graphics and digital displays, the results are given as tabulated summaries and macro-generated plots. The ABI test technique is considered nondestructive because no material is removed from the test surface and only a smooth shallow (as small as 0.003 to 0.010 inch deep) spherical indentation is left at the end of the test. This remaining spherical depression is harmless to the tested structure because it has no sharp edges; hence, it does not introduce any stress concentration sites. Furthermore, the ball indentation leaves a compressive residual stress in the tested surface which will retard crack initiation at the ABI test site. Hence, ABI tests will permit routine in-situ tests of metallic structural components without adversely affecting their structural integrity. Among the significant features of the ABI test technique are: (1) it is nondestructive and can be used on aged structural components without adversely
affecting their integrity, (2) it can be used to determine spatial variations in flow properties (stress-strain curve)
which may be of particular interest, for instance, in the characterization of weldments and their HAZs where large gradients may occur,
(3) it avoids the need to manufacture test specimens, (4) it provides in-situ automated testing which facilitates periodic inspection of components
for structural integrity evaluation and lifetime extension, (5) it is relatively rapid (less than five minutes for a complete ABI test), and (6) it can be used to determine true-stress-true strain data over a wider strain range than that
measured in tensile tests for materials which exhibit low tensile ductility, (7) it uses minimal material which allows efficient and repeated/multiple use of available
samples, (8) tests can be conducted at various strain rates, and at low to high test temperatures using
only a small area of specimen/structure, (9) fracture toughness and Charpy impact properties can be determined from the ABI-
measured flow properties. Task 4 : Although we have written our sophisticated software using “C” and assembly languages, new software development was undertaken to take advantage of the 32-bit Windows® 95 using the “LabVIEW® development environment” for the Computer Controlled Microindenter System. This was also recommended by Dr. Perez. LabView® is a graphical programming language developed by National Instruments to ease the tasks of programming for data acquisition systems, control systems, and test instrumentation. It is rapidly becoming the “de-facto” standard graphical language for these environments. Two sets of ABI and Tensile software programs were provided with the SSM system (written in FoxPro® and LabView® langauages). Six software programs (written in LabView® graphical langauage) have been completed, verified and delivered (namely, automated ball indentation “ABI”, Tensile, Indentation Creep, Indentation Stress-Relaxation, Fiber Push Out, and X-Y
5
Table Positioning). All these software programs are currently installed on the Pentium-200 computer of the Navy’s SSM system (Fig. 9). Furthermore, creep and stress relaxation tests allow the use of either cylindrical or ball indenters. Task 5 : Develop test procedures and analytical techniques for testing at high temperatures up to 427ºC (800ºF). The expertise of Professor K. L. Murty (our consultant from NCSU) in creep were very valuable in this task. Since, the SSM system operates in a closed loop with feedback control on both load and displacement measurements, indentation creep and stress-relaxation test techniques were developed and the creep/stress relaxation software programs were delivered with the system. An example of the work of Dr. Murty and Mr. Haggag is given in the paper “Characterization of Strain-Rate Sensitivity of Sn-5%Sb Solder Using ABI Testing” by K. L. Murty and Fahmy M. Haggag, Proceedings of Second International Conference on Microstructures and Mechanical Properties of Aging Materials II, TMS Annual Meeting, Las Vegas, February 1995, P.K. Liaw, R. Viswanathan, K.L. Murty, and E.P. Simonen, Eds, pp. 37-44. Additional results of this task are provided in Appendix B (final subcontract report from our consultant Prof. Murty of NCSU). Although automated ball indentation (ABI) testing at low temperatures was not solicited in Phase I of this project, we have successfully developed this new important capability in addition to the high temperature testing capability. The environmental chamber of the SSM system has a stainless steel lining, a solenoid valve for liquid nitrogen, and electric resistance heating elements. This allows testing at low and high temperatures. Low and high temperature fixtures were developed and used successfully in this task for both ABI and tensile testing conducted on the new Stress-Strain Microprobe (SSM) system (Fig. 9). The SSM system utilizes an automated ball indentation (ABI) technique which is nondestructive and provides localized direct measurement of the stress-strain curve at quasi-static strain rates at room temperature. In Phase II of this Small Business Innovation Research (SBIR) project, new testing and analytical procedures were successfully developed and evaluated for: (1) ABI testing at high strain rates, (2) innovative ABI testing at various temperatures from -129ºC/-250ºF to 288ºC/550ºF where all ABI-measured stress-strain curves showed excellent repeatability and agreement with those from miniature tensile specimens, (3) the indentation load versus depth data were used with appropriate critical fracture stress and strain models to determine Charpy impact energies and fracture toughness as a function of temperature. A brief summary of these breakthroughs is graphically illustrated on Figs. 10 and 11 (pages 2 and 3 of ATC’s new brochure of the SSM system). Eight (8) reactor pressure vessel (RPV) steels were procured from the Electric Power Research Institute (EPRI) and from Oak Ridge National Laboratory (ORNL). The archive materials were chosen to represent plates, forgings, and welds. The miniature tensile specimens were electric-discharge-machined from Charpy impact or fracture toughness specimens according to the drawing shown in Fig. 12. The automated ball indentation (ABI) tests were conducted on the end tabs of the miniature tensile specimens to provide one-to-one comparison of true-stress/true-plastic-strain curves from both conventional destructive tensile and nondestructive ABI tests. A photograph of a miniature tensile specimen with 2 ABI test locations and a 0.062-inch-diameter tungsten carbide indenter is shown in Fig. 13. An example of the true-stress/true-plastic-strain
6
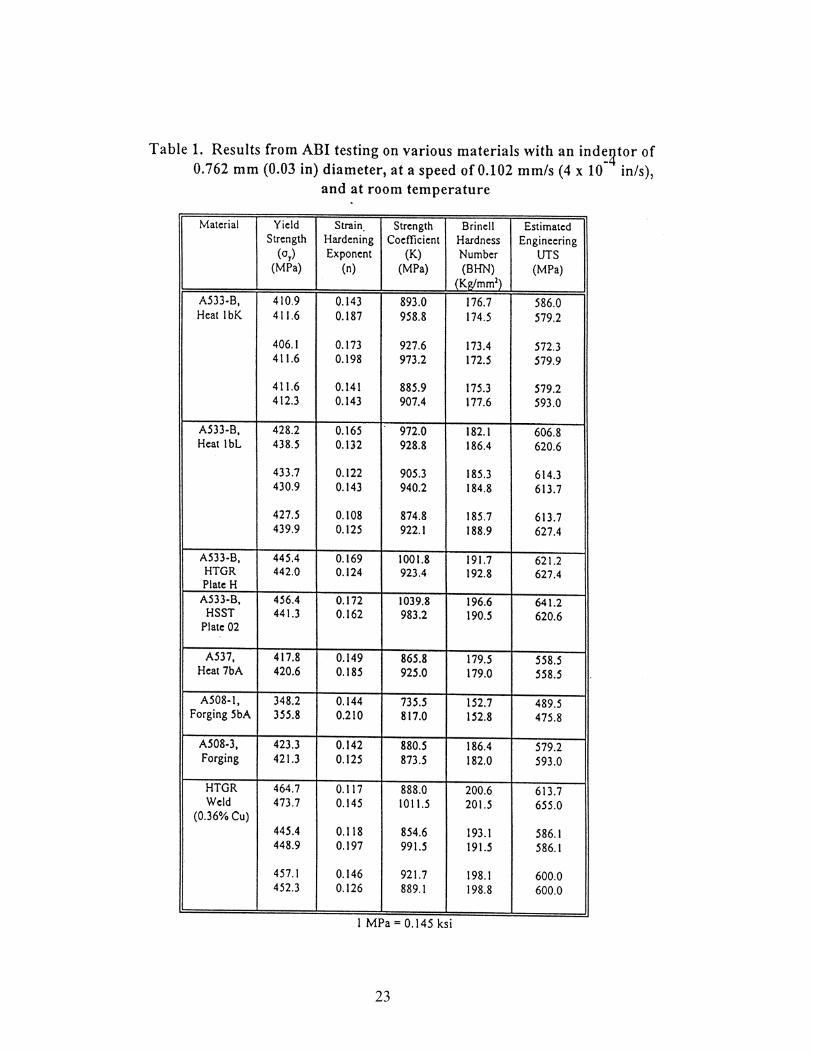
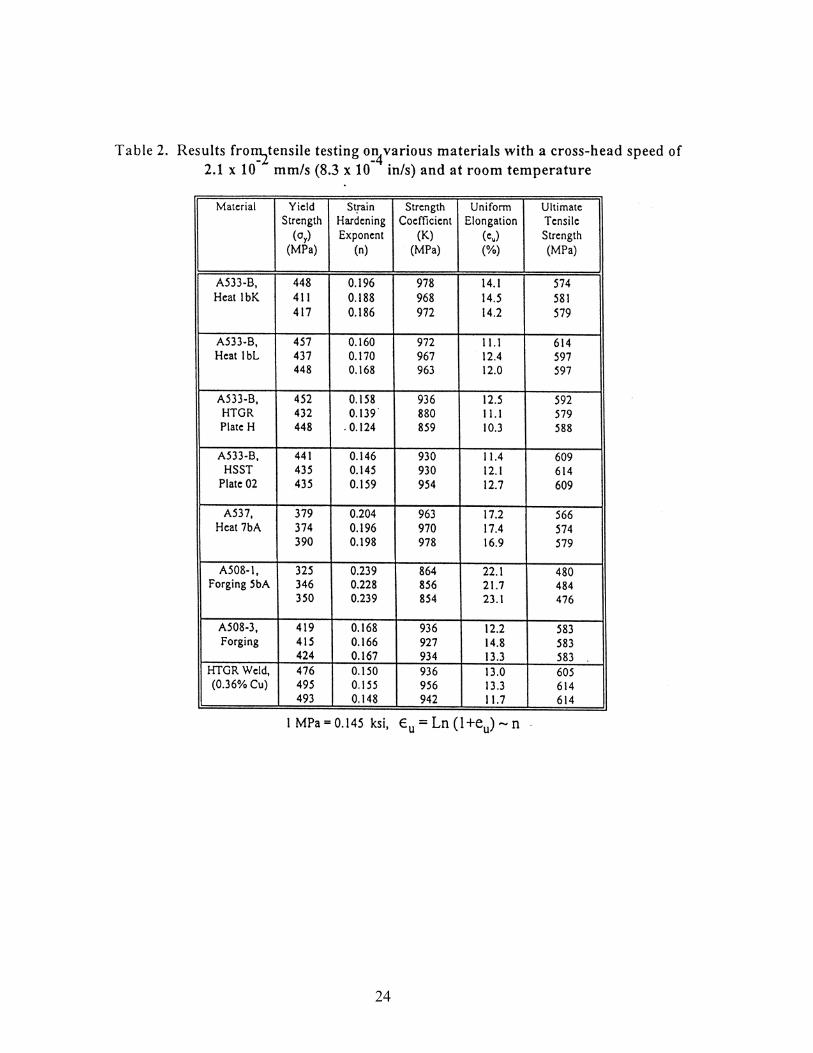
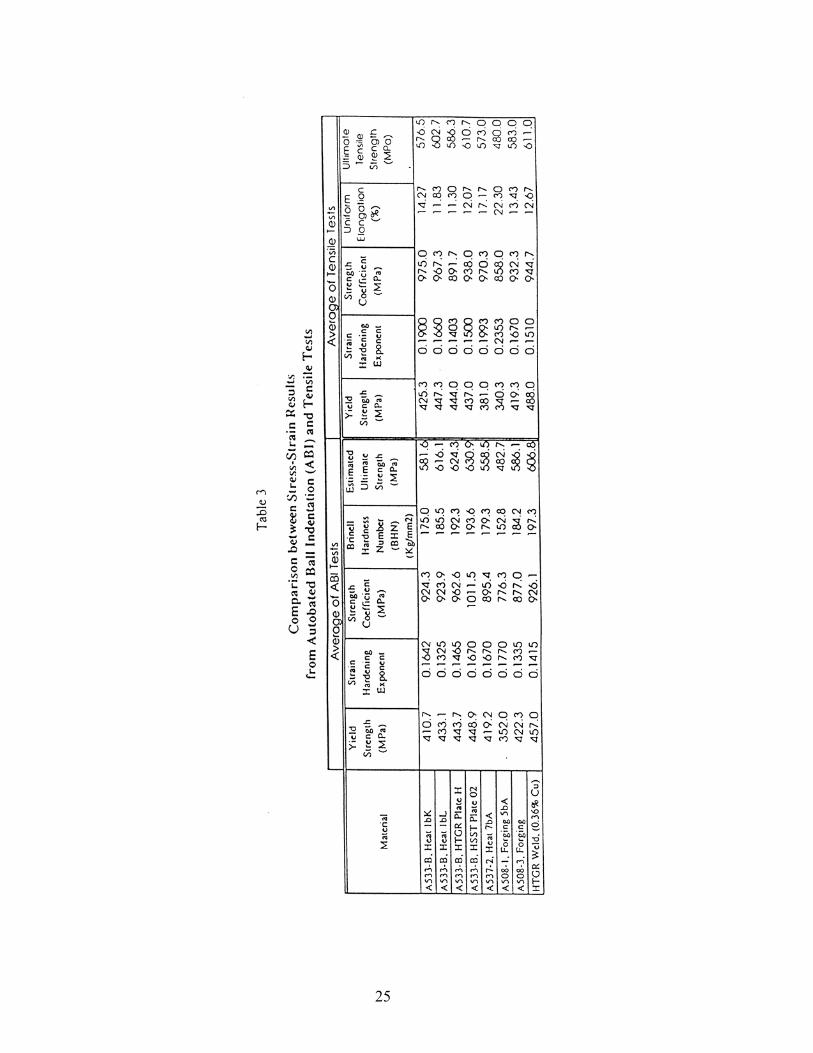
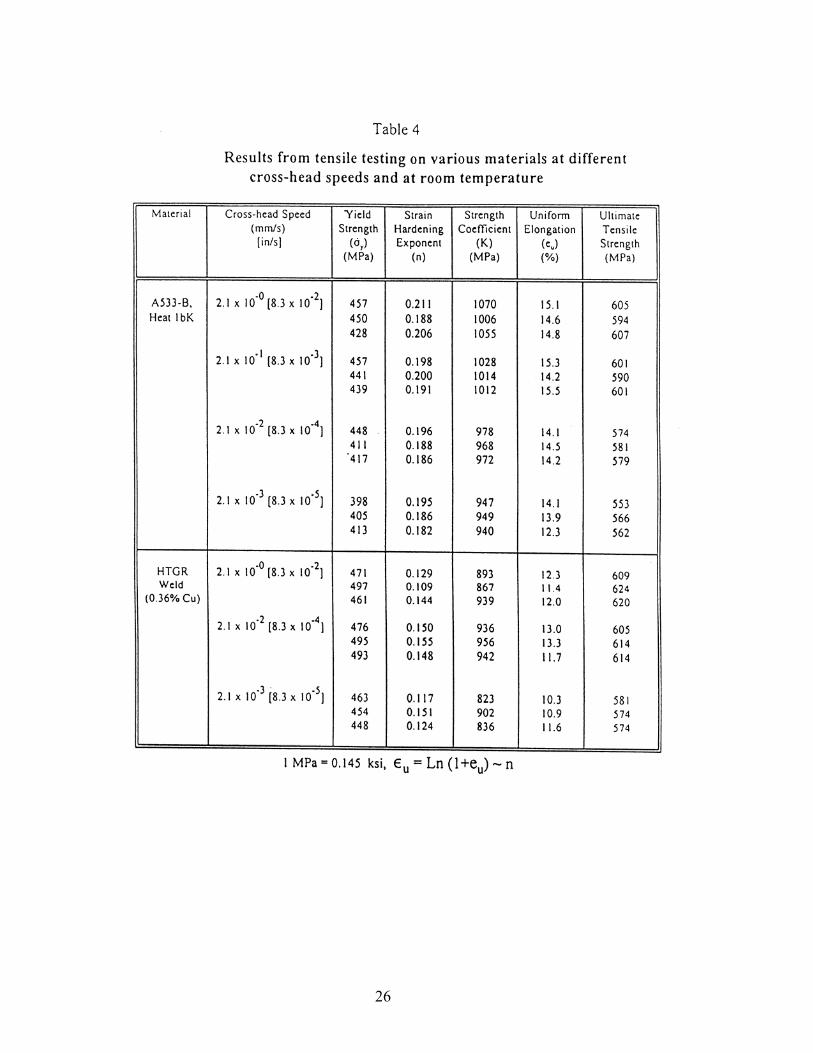
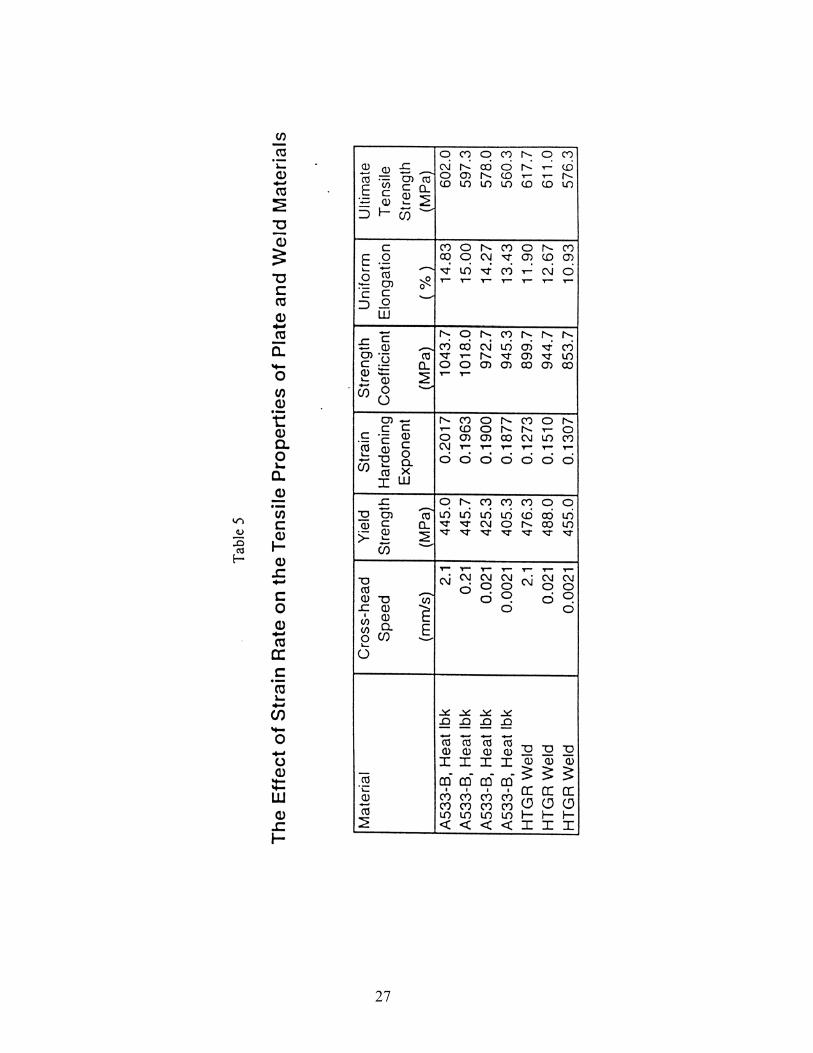
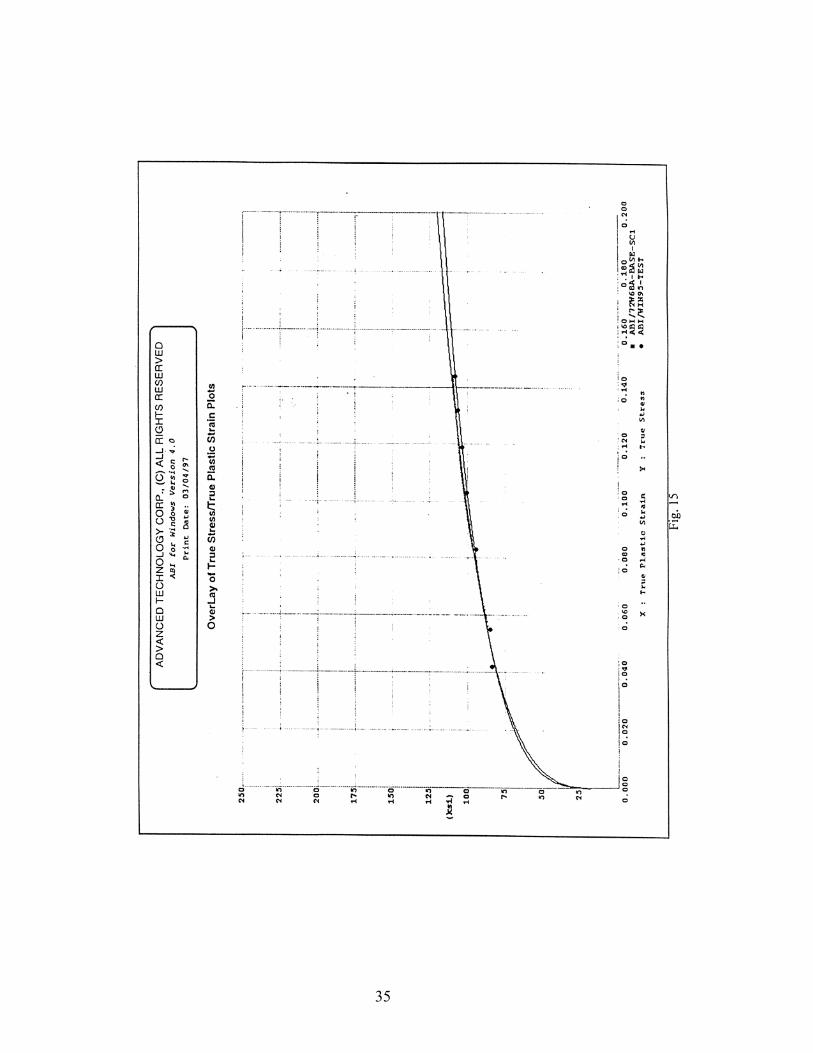
curve (measured from the ABI load-depth data) is shown in Fig. 14; in excellent agreement with the curve from destructive tensile test. Other indenter sizes of 0.030, 0.020, and 0.010 inch diameters were used in this work. The Stress-Strain Microprobe (SSM) system was equipped with an environmental chamber for both ABI and tensile testing at -250ºF to +550ºF. An engineering drawing of the load frame configured for laboratory testing with the environmental chamber and a positioning table for moving the specimen (e.g. one half of a Charpy specimen) inside the cool/heat chamber to different test positions is shown in Fig. 8 while a photograph of the SSM system and details of the chamber, X-Y positioning table and a video camera with zoom lens, is shown in Fig. 9. Two or three tensile tests and two to six ABI tests were conducted on each of the 8 RPV steels at room temperature at a strain rate of 0.001 s-1. The effect of strain rate was investigated for one heat of A533-B plate and one weld over three orders of magnitude of strain rate. The effect of strain rate at room temperature on both tensile and ABI results was very small or negligible. The single-cycle or multi-cycle ABI tests produced similar/identical results. Only one material (EPRI A533-B Heat 1bK) was tested at temperatures from -250ºF to +550ºF. The ABI test results were in excellent agreement with those from tensile tests and were used to determine the Charpy impact energy and fracture toughness from ABI tests and using the critical fracture stress and critical fracture strain models as explained later. Furthermore, the ABI tests at -200ºF showed a 20% elevation of the stress-strain curve with increasing strain rate by two orders of magnitude. The ABI new technique of single-cycle indentation produced excellent results as compared to those from the multi-cycle tests. The single-cycle ABI test involves indentation in a continuous fashion until the desired maximum depth/strain is reached without any intermediate partial unloadings (previously used to allow the subtraction of elastic indentation depth). Hence, the data analyses of the single-cycle ABI test use the continuous measurement of total indentation depth (i.e. elastic plus plastic depth) to calculate the total indentation chordal diameter. The values of the total chordal diameter at various indentation loads were within 2-5% of the plastic chordal indentation diameters. An example of the indentation load-depth curves from both single-cycle and multi-cycle ABI tests on A533-B RPV steel is shown in Fig. 15. The stress-strain curve from the multi-cycle (test No. ABI/WIN95-TEST, calculated from 7 unload cycles, solid circles in Fig. 15) is in excellent agreement with that from the several hundred data points of the single-cycle test (test No. ABI/72W68A-BASE-SC1). All the following ABI data presented later are from multi-cycle tests using either the 0.062 inch diameter or the 0.030 inch diameter indenters. The ABI and tensile test results at room temperature for the eight (8) RPV steel materials are summarized in Tables 1 and 2. Comparisons of the average test results from both ABI and tensile test techniques are shown in Table 3 and Figs. 16-19 (yield strength, strength coefficient, strain-hardening exponent, ultimate strength). The tables and figures demonstrate excellent agreement between stress-strain curves from ABI and tensile tests. Tensile test results on plate and weld materials at various strain rates are presented in Tables 4 and 5 (individual specimen results and average, respectively). Tables 4 and 5 show that the effect of strain rate (over 3 orders of magnitude) at room temperature on these two materials was very little or negligible.
7
New ABI Tests at Low and High Test Temperatures : This project demonstrated new ABI test capabilities with excellent agreement between stress-strain curves from ABI and tensile tests at temperatures from -250ºF/-157ºC to +550ºF/288ºC. Examples of the ABI and tensile results at -200ºF/-129ºC, room temperature (70ºF/21ºC), and +550ºF/288ºC are shown in Figs. 20-24. Increasing the ABI strain rate by two orders of magnitude at -200ºF increased the stress-strain curve by approximately 20% as shown in Fig. 25. The ABI test repeatability at all test temperatures was excellent. Examples of three (3) ABI test data and stress-strain curves at +550ºF/288ºC are shown in Figs. 26 and 27. Determination of Fracture Properties from Nondestructive ABI Tests The following correlation was used to estimate the initiation fracture toughness, KJIc, from the ABI-measured stress-strain data at room temperature and higher: KJIc = constant (k . d . n . σy)0.5
where d is the grain size of the test material, k is the strength coefficient, n is the strain-hardening exponent, and σy is the yield strength. The grain size can be determined from archive RPV materials. For A533-B EPRI Heat 1bK, d was assumed to be 25 μm. The value of the constant in the above fracture toughness equation was 170. For ABI tests at room temperature and at +550ºF, the following results were obtained:
ABI Test No. 1BK-RT-K2-2 (Room Temperature):
σy = 411.6 MPa, k = 972.9 MPa, n = 0.198
KJIc = constant (k . d . n . σy)0.5 = 239.3 MPa.m 0.5
This is in good agreement with the measured fracture toughness value of
240.7 MPa.m 0.5 (Ref.11).
ABI Test No. EBB-T31+550F (+550ºF): σy = 438.5 MPa, k = 902.6 MPa, n = 0.192 KJIc = constant (k . d . n . σy)0.5 = 234.3 MPa.m 0.5
This is in good agreement with the measured fracture toughness value of 205.5 MPa.m 0.5 (Ref.11). Also, using the miniature tensile test results, estimated fracture toughness values of 233.6 MPa.m0.5 and 225.3 MPa.m 0.5 are calculated for room temperature and +550ºF, respectively.
8
Indentation Energy to Fracture (IEF) : The indentation load versus depth curves from ABI tests at various test temperatures were used together with the critical fracture stress model (Ref. 12) to calculate Charpy impact energies at various temperatures. Although ABI tests in metallic RPV steels do not induce cracking because of ductility and material constraint underneath the indenter, we have developed a new parameter called Indentation Energy to Fracture (IEF). This new IEF parameter is related to the fracture toughness and the Charpy energy of the test material. The bases for the IEF are the following:
(a) Fracture toughness can be interpreted as the deformation capability of the material under a concentrated stress field,
(b) Indentation with a small ball indenter generates a concentrated stress (and strain) field near the contact of the indenter and the test surface. A notch or a crack also gives rise to a stress concentration. Hence, there is an analogy between the deformation due to indentation and the concentrated deformation due to a notch (or crack). The indentation stress field is mostly compressive. However, it is also assumed that monotonic tensile and compressive stress-strain curves are similar for these RPV steels (tensile and compression test results from ORNL demonstrated that for A533-B steel),
(c) The cleavage fracture stress in ferritic RPV steels is nearly independent of test temperature (Ref. 12).,
(d) It is assumed that the deformation energy due to the ball indentation up to a limit stress level (termed in this report as Indentation Energy to Fracture, IEF) is related to the Charpy impact energy or fracture toughness. The limit stress in automated ball indentation (ABI) tests is proportional to the fracture stress in a fracture toughness or a tensile test.
∫=fh
m dhhPIEF0
)(
Where 2
4dPPm
π=
Pm = mean indentation contact pressure, P = indentation load, h = indentation depth, hf = indentation depth when the maximum stress is equal to the fracture stress, d = chordal diameter of the indentation. Since the indentation load versus depth is almost linear; P = Sh, S = slope of the indentation load-depth curve
9
)(2 2hDhd −=
D = indenter diameter
)(fhD
DlnSIEF−
=π
Where “ln” is the natural logarithm.
The limit stress is defined by the indentation true stress at which the maximum stress under the indenter is equal to the fracture stress.
Calculation of the IEF at various ABI test temperatures for EPRI A533-B Heat 1bK :
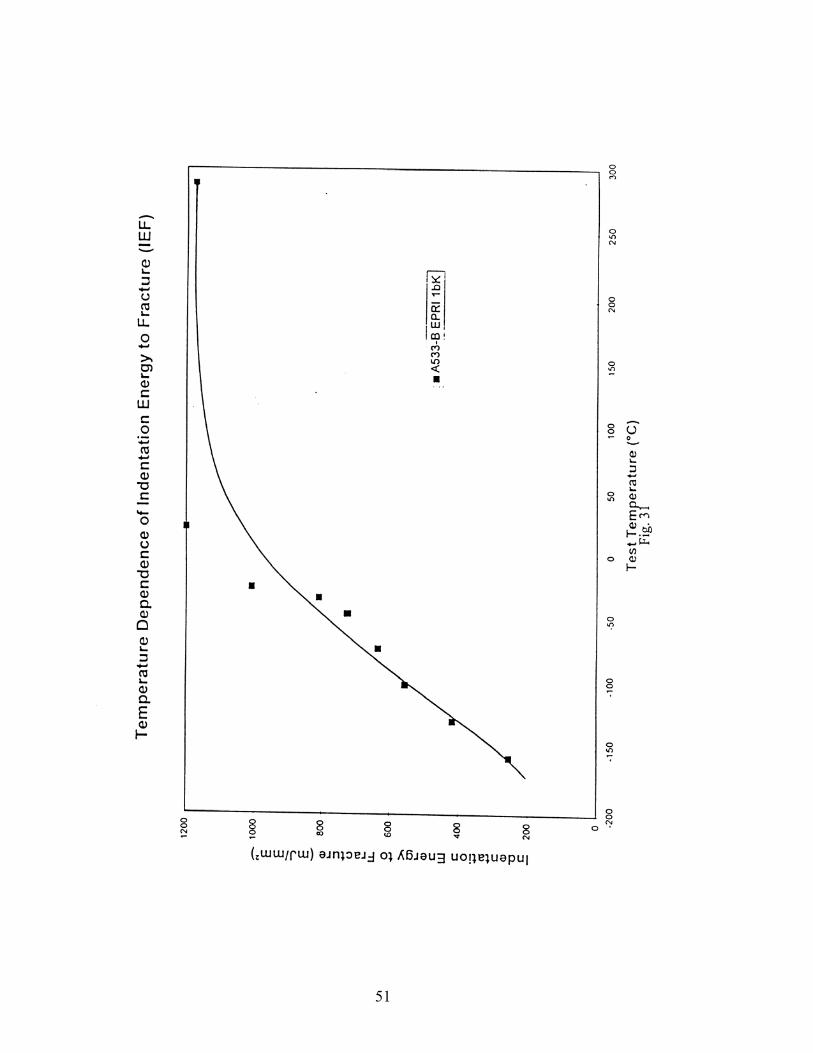
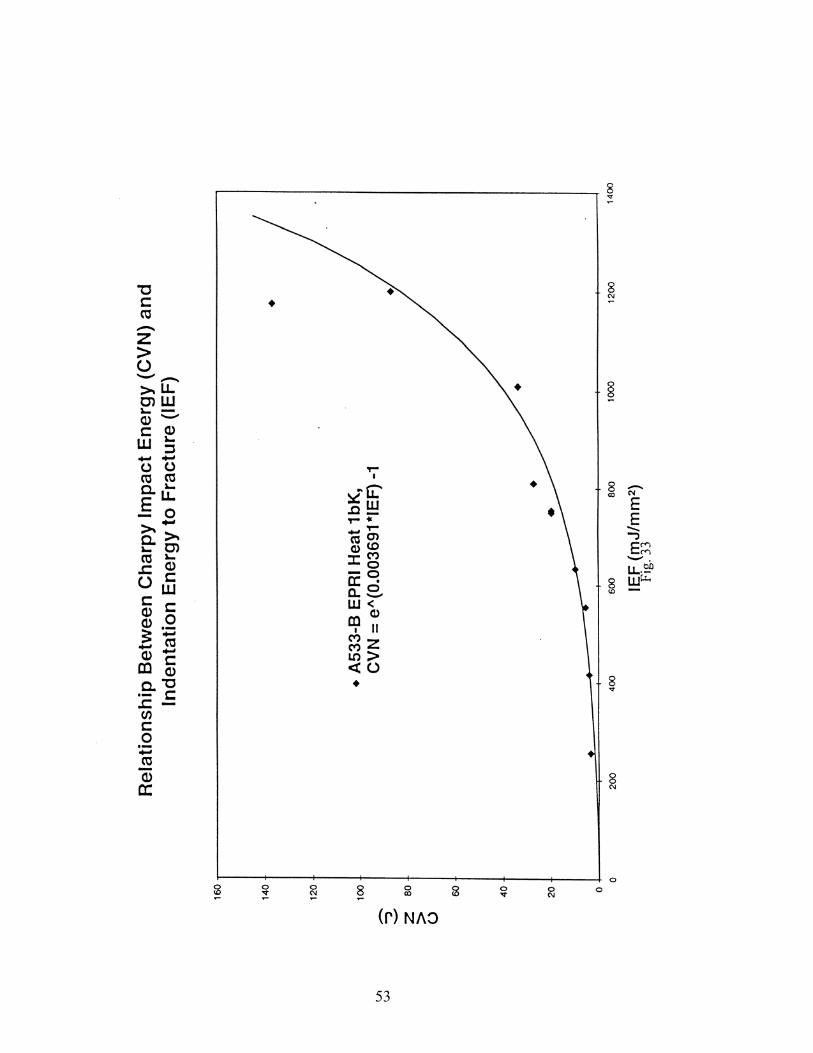
The ABI-measured True-Stress/True-Plastic-Strain curves at various test temperatures are shown in Fig. 28 where the curves are extrapolated to a strain of 2.0. A representative true stress at fracture stress of 800 MPa was assumed for this material [12]. It should be noticed that the area under the stress-strain curves (Fig. 28) up to the intersection of the representative stress (at the hypothetical indentation fracture limit) decreases with lower test temperatures, as expected from both Charpy impact and fracture toughness tests. The indentation depth at fracture stress (hf), is determined by interpolation or extrapolation (depending on test temperature) from the plot of true-stress versus indentation depth as shown in Figs. 29 and 30 for ABI test temperatures of -157ºC and -46ºC, respectively. These figures also show that the linear slope of indentation load-depth curves decreases with increasing test temperature and that the IEF increases with increasing test temperature. The effect of test temperature on the IEF for A533-B EPRI Heat 1bK is shown in Fig. 31. It is very clear from this figure that the newly ABI energy parameter (IEF) reveals the ductile-to-brittle transition of this material. The EPRI Charpy impact energy data for this material [11] is shown in Fig. 32. The correlation between the Charpy impact energy and the IEF is shown in Fig. 33. This figure shows excellent correlation between the Charpy impact energy and the IEF parameter up to room temperature. The data at upper shelf should not be analyzed using a critical fracture stress model since the fracture mechanism is ductile and not cleavage. The following correlation was used to determine the Charpy V-notch impact (CVN) energy at the upper shelf. (Kjc) = 20.5 (CVN)0.5 where CVN is the Charpy impact energy at the upper shelf. Applying this correlation at room temperature and at 550ºF (and using the estimated fracture toughness values calculated earlier in this task from ABI results at room temperature and at 550ºF), the resulting CVN energies of 136.3J and 130.6J are in agreement with the EPRI data of 137 J for the upper shelf (Ref. 11).
10
Similar results from ABI tests at various temperatures were obtained by our consultant Prof. K. L. Murty (North Carolina State University). Also, similar results of ABI and IEF were obtained by Dr. T. K. Byun (Korea Atomic Energy Research Institute, South Korea) on A508 Class 1 forging and on a Linde 80 weld. The Portable/In-Situ Stress-Strain Microprobe (SSM) system has received (October 1996) the 1996 R&D 100 award from the Research and Development Magazine as one of the 100 most technologically significant new products of the year. This award was for testing at room temperature to obtain stress-strain curves nondestructively on samples or structural components in the field. We might submit a new R&D 100 application for our latest breakthroughs of adding the low-to-high temperature capabilities and the development of a new fracture parameter (Indentation Energy to Fracture, IEF) which is correlated to static and dynamic fracture toughness and clearly depicts the ductile-to-brittle transition in carbon steels and other body centered cubic materials. In Phase III, additional tests should be conducted to refine the relationship between the fracture stress from fracture toughness or notched tensile specimens and the representative true-stress in ABI tests. Furthermore, a new IEF-index can be developed for the transition temperature (e.g. an IEF index of 800 mJ/mm² could be used instead of 41 J for Charpy impact tests). The new IEF index should help many industries (by using a more accurate IEF parameter from nondestructive ABI tests instead of using the Charpy test with its inherent large data scatter). The large test results from ABI and IEF on many RPV steels and their welds and other metallic materials should provide the foundation for a new ASTM standard for ABI testing procedures and its IEF analyses. Task 6 : Develop hardware and software for testing composites and fiber push-out. We have procured and delivered tungsten carbide indenters (having either a cylindrical tip or a spherical tip) with different diameters for use in fiber push-out experiments. We have designed and delivered a test fixture with capability for slot adjustment. This allows testing of composites with various fiber diameters. The Fiber Push Out software was written in LabView® language. The software provides a real-time load-displacement graph and allows data storage in ASCII format. Task 7 : The high-resolution specimen positioning system has been developed and verified. The repeatability of testing location on any sample is within 5 μm. The computer-controlled motorized X-Y positioning table, video camera and zoom lens were integrated with the SSM system with its cool/heat environmental chamber. The integration of all these SSM accessories/capabilities will allow multiple, accurate, and fast positioning of ABI tests at temperatures from -250ºF to 800ºF without the need to open the chamber (if manual positioning was to be used). The software program includes several options (e.g. video camera and indenter location calibration, movement tracking with “Undo” function, etc.). A photograph of the Navy’s SSM system with all the above capabilities is shown in Fig. 9.
11
Task 8 : Develop correlations between fatigue damage and associated changes in the stress-strain behavior (hardening or softening) of fatigue specimens. This task will was performed by both the University of Tennessee at Knoxville (UTK) and Advanced Technology Corporation (ATC). Fatigue specimens were cyclically fatigued at UTK to different damage levels where the tests were interrupted for nondestructive automated ball indentation testing of the gage section (using ATC’s SSM system) to monitor changes in key mechanical properties (e.g. yield strength, strain-hardening exponent, strength coefficient, etc.). This new task was not investigated in Phase I, hence, it deserves the additional details given below. Low Cycle Fatigue Damage Detection and Assessment : The assessment of fatigue damage in U.S. Navy aircraft is a key step in structural safety evaluations. Low-cycle fatigue damage changes the material flow properties (e.g. cyclic hardening and cyclic softening) and generates cracks leading to failure. The development of new, practical, reliable nondestructive testing and inspection (NDT/I) techniques and methodologies to both qualitatively and quantitatively assess the state of structural fatigue damage accrued and stored in the material itself is very desirable. Hence, there is a considerable benefit to verify the feasibility of using a novel stress-strain microprobe (SSM) methodology to quantitatively assess the state of fatigue damage in metallic Navy aircraft materials. The SSM utilizes an automated ball indentation (ABI) technique to nondestructively measure stress-strain behavior at very small surface areas of a component or a specimen. Although the ABI technique is nonintrusive/nondestructive, it is a state-of-the-art mechanical test which directly measures the current stress-strain behavior, of a specimen or a component quickly and economically. These features of the ABI methodology demonstrate its capability to detect and assess the fatigue damage accrued and stored in the material itself when the damage alters the stress-strain behavior of the fatigued material. Hence, a combined approach of SSM testing and newly-developed fatigue correlations will enable the detection and assessment of fatigue damage accumulated in the material, even before the initiation of cracks. Therefore, a test matrix of low-cycle fatigue and ABI tests was designed and applied to two Navy aircraft structural materials (coupon specimens) to develop new correlations between incremental fatigue damage and changes in the ABI-measured mechanical properties (e.g. yield strength, strain-hardening exponent, etc.). Ultimately, these correlations will be integrated with the results of ABI testing, periodically conducted on fatigued Navy aircraft components, to determine their safe remaining service life. A portable Stress-Strain Microprobe (SSM) system, which was developed by Advanced Technology Corporation (ATC), was used to provide an in-situ and substantially nondestructive capability for measuring a wide range of mechanical properties (e.g. yield strength, stress-strain curve, strain-hardening exponent, etc.) using its innovative Automated Ball Indentation (ABI) test technique. The ABI-measured stress-strain curves of Navy aircraft aluminum alloys (2024 and 7075) were compared with those from standard tensile test results. Moreover, a test matrix of fatigue and ABI tests was designed and applied to 2024 and 7074 aluminum materials to create new correlations between incremental fatigue damage and changes in the ABI-measured
12
key mechanical properties such as yield strength, stress-strain curve, and strain-hardening exponent. The developed correlations will allow the in-situ nondestructive periodic application of the ABI technique to monitor the status of fatigued aircraft systems and evaluate their structural integrity. The proposed integrated ABI-Test/fatigue-damage-correlation approach will improve the safety, increase the reliability, and avoid the premature decommissioning of Navy aircraft components. Some of the fatigue damage assessment studies include the dissection of decommissioned aircraft systems and machining of several fatigue specimens. Although the fatigue tests are very advantageous, they are destructive and expensive. Furthermore, the specimens from dissected components may not represent the status of other fatigued aircraft systems currently in service because they do not experience the same service conditions (different fatigue cycling mechanisms) over their lifetime. Moreover, local property gradients may exist due to component design or the use of welding and joining techniques. Since the destructive tests represent only the bulk changes in the mechanical properties of the tested material, the local changes (property gradients) may be missed out. Hence, new testing techniques and damage-assessment correlations should be developed to overcome these shortcomings. This task addressed these objectives and provided innovative capabilities to evaluate fatigued aircraft components. The ABI test is a new in-situ and substantially nondestructive technique which is being used to determine several key mechanical properties (yield strength, true-stress/true-plastic-strain curve, strain-hardening exponent, and an estimate of the local fracture toughness) of metallic materials [1-8]. The ABI test is based on controlled sequential indentation cycles on a polished metallic surface by a spherical indenter. The ABI cycles are performed at the same penetration location and each cycle consists of indentation, partial-unload, and reload sequences. The indentation load and its associated penetration depth increase from one cycle to the next until a user-specified depth is reached; then the load is completely removed. The test is fully automated where the computer and test controller are used in innovative ways to control the test as well as to analyze test data. The applied indentation loads and associated penetration depths are measured using a load cell and a spring-loaded linear variable differential transducer (LVDT). Task 8 Technical Objectives The objectives for Task 8 are: (1) establish excellent agreement between yield strength, flow properties (true-stress/true-plastic-strain curve), and strain-hardening exponent measured by both ABI and uniaxial tensile tests conducted on Navy aircraft materials, namely aluminum 2024-T4 and aluminum 7075-T6; (2) conduct: low-cycle fatigue tests to obtain different levels of fatigue damage, uniaxial tensile, and ABI tests on these aluminum materials, and (3) develop new correlations between the level of fatigue damage and the associated changes in ABI-measured key mechanical properties (e.g., yield strength, stress-strain curve, and strain-hardening exponent) for these aerospace alloys. Ultimately, the developed correlations will be used in-conjunction with field/in-situ ABI test results to assess fatigue damage, and to determine structural integrity and the safe remaining service life of Navy aircraft components. The proposed innovative integrated approach of in-situ ABI testing and the newly developed correlations will be used in Phase III to test components from decommissioned or
13
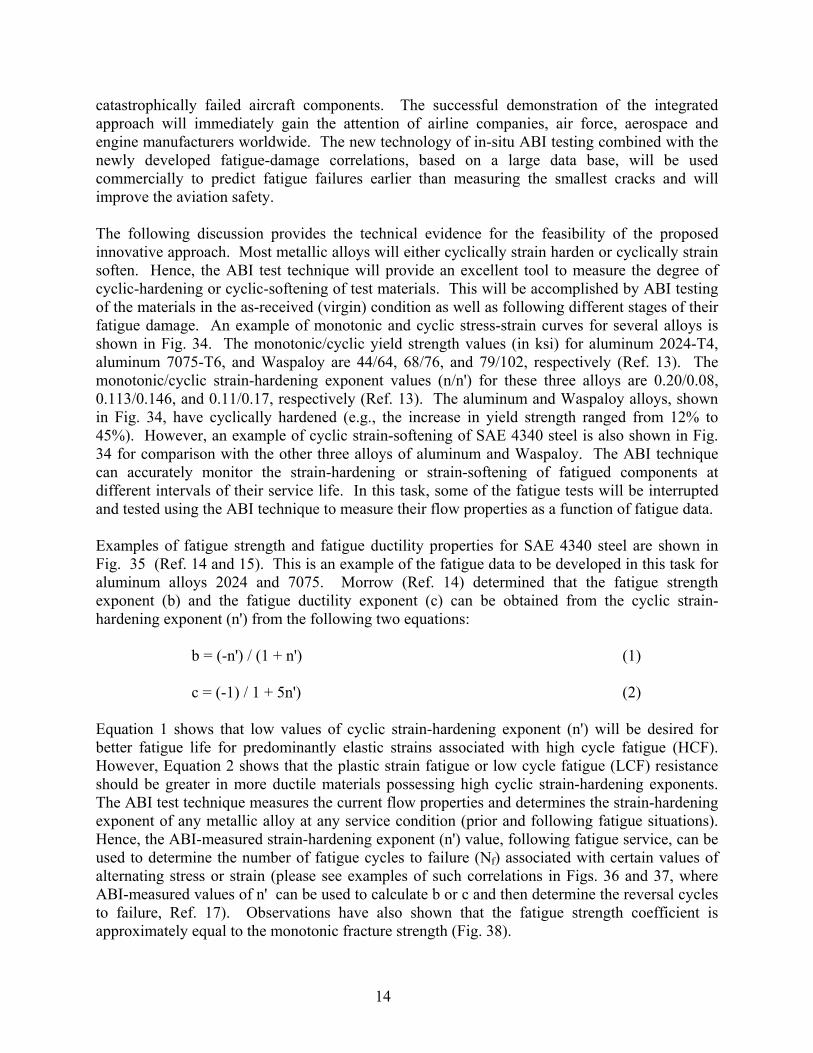
catastrophically failed aircraft components. The successful demonstration of the integrated approach will immediately gain the attention of airline companies, air force, aerospace and engine manufacturers worldwide. The new technology of in-situ ABI testing combined with the newly developed fatigue-damage correlations, based on a large data base, will be used commercially to predict fatigue failures earlier than measuring the smallest cracks and will improve the aviation safety. The following discussion provides the technical evidence for the feasibility of the proposed innovative approach. Most metallic alloys will either cyclically strain harden or cyclically strain soften. Hence, the ABI test technique will provide an excellent tool to measure the degree of cyclic-hardening or cyclic-softening of test materials. This will be accomplished by ABI testing of the materials in the as-received (virgin) condition as well as following different stages of their fatigue damage. An example of monotonic and cyclic stress-strain curves for several alloys is shown in Fig. 34. The monotonic/cyclic yield strength values (in ksi) for aluminum 2024-T4, aluminum 7075-T6, and Waspaloy are 44/64, 68/76, and 79/102, respectively (Ref. 13). The monotonic/cyclic strain-hardening exponent values (n/n') for these three alloys are 0.20/0.08, 0.113/0.146, and 0.11/0.17, respectively (Ref. 13). The aluminum and Waspaloy alloys, shown in Fig. 34, have cyclically hardened (e.g., the increase in yield strength ranged from 12% to 45%). However, an example of cyclic strain-softening of SAE 4340 steel is also shown in Fig. 34 for comparison with the other three alloys of aluminum and Waspaloy. The ABI technique can accurately monitor the strain-hardening or strain-softening of fatigued components at different intervals of their service life. In this task, some of the fatigue tests will be interrupted and tested using the ABI technique to measure their flow properties as a function of fatigue data. Examples of fatigue strength and fatigue ductility properties for SAE 4340 steel are shown in Fig. 35 (Ref. 14 and 15). This is an example of the fatigue data to be developed in this task for aluminum alloys 2024 and 7075. Morrow (Ref. 14) determined that the fatigue strength exponent (b) and the fatigue ductility exponent (c) can be obtained from the cyclic strain-hardening exponent (n') from the following two equations: b = (-n') / (1 + n') (1) c = (-1) / 1 + 5n') (2) Equation 1 shows that low values of cyclic strain-hardening exponent (n') will be desired for better fatigue life for predominantly elastic strains associated with high cycle fatigue (HCF). However, Equation 2 shows that the plastic strain fatigue or low cycle fatigue (LCF) resistance should be greater in more ductile materials possessing high cyclic strain-hardening exponents. The ABI test technique measures the current flow properties and determines the strain-hardening exponent of any metallic alloy at any service condition (prior and following fatigue situations). Hence, the ABI-measured strain-hardening exponent (n') value, following fatigue service, can be used to determine the number of fatigue cycles to failure (Nf) associated with certain values of alternating stress or strain (please see examples of such correlations in Figs. 36 and 37, where ABI-measured values of n' can be used to calculate b or c and then determine the reversal cycles to failure, Ref. 17). Observations have also shown that the fatigue strength coefficient is approximately equal to the monotonic fracture strength (Fig. 38).
14
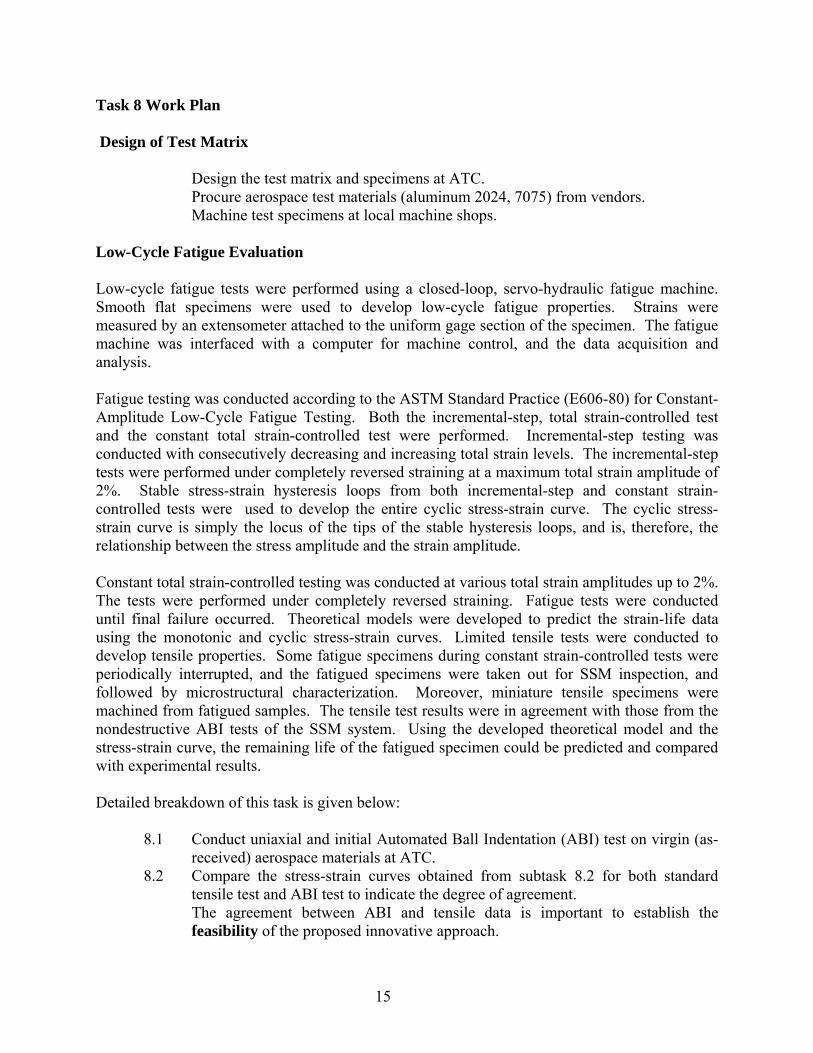
Task 8 Work Plan Design of Test Matrix Design the test matrix and specimens at ATC. Procure aerospace test materials (aluminum 2024, 7075) from vendors. Machine test specimens at local machine shops. Low-Cycle Fatigue Evaluation Low-cycle fatigue tests were performed using a closed-loop, servo-hydraulic fatigue machine. Smooth flat specimens were used to develop low-cycle fatigue properties. Strains were measured by an extensometer attached to the uniform gage section of the specimen. The fatigue machine was interfaced with a computer for machine control, and the data acquisition and analysis. Fatigue testing was conducted according to the ASTM Standard Practice (E606-80) for Constant-Amplitude Low-Cycle Fatigue Testing. Both the incremental-step, total strain-controlled test and the constant total strain-controlled test were performed. Incremental-step testing was conducted with consecutively decreasing and increasing total strain levels. The incremental-step tests were performed under completely reversed straining at a maximum total strain amplitude of 2%. Stable stress-strain hysteresis loops from both incremental-step and constant strain-controlled tests were used to develop the entire cyclic stress-strain curve. The cyclic stress-strain curve is simply the locus of the tips of the stable hysteresis loops, and is, therefore, the relationship between the stress amplitude and the strain amplitude. Constant total strain-controlled testing was conducted at various total strain amplitudes up to 2%. The tests were performed under completely reversed straining. Fatigue tests were conducted until final failure occurred. Theoretical models were developed to predict the strain-life data using the monotonic and cyclic stress-strain curves. Limited tensile tests were conducted to develop tensile properties. Some fatigue specimens during constant strain-controlled tests were periodically interrupted, and the fatigued specimens were taken out for SSM inspection, and followed by microstructural characterization. Moreover, miniature tensile specimens were machined from fatigued samples. The tensile test results were in agreement with those from the nondestructive ABI tests of the SSM system. Using the developed theoretical model and the stress-strain curve, the remaining life of the fatigued specimen could be predicted and compared with experimental results. Detailed breakdown of this task is given below: 8.1 Conduct uniaxial and initial Automated Ball Indentation (ABI) test on virgin (as-
received) aerospace materials at ATC. 8.2 Compare the stress-strain curves obtained from subtask 8.2 for both standard
tensile test and ABI test to indicate the degree of agreement. The agreement between ABI and tensile data is important to establish the feasibility of the proposed innovative approach.
15
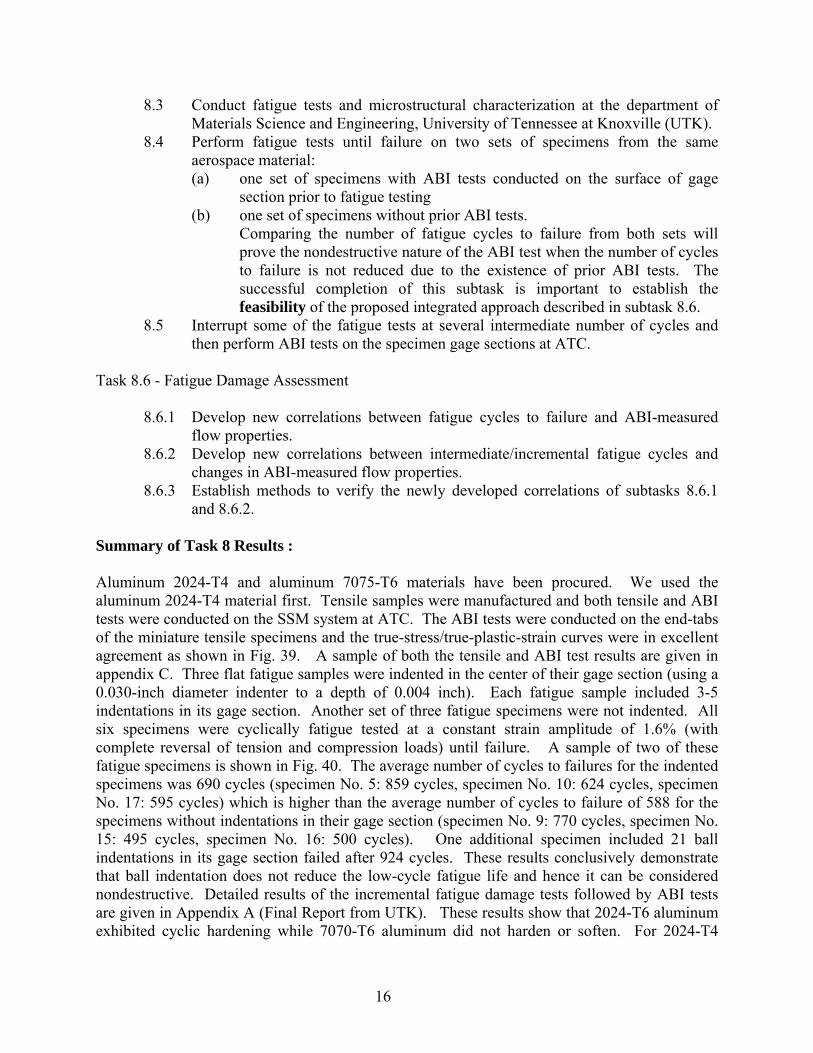
8.3 Conduct fatigue tests and microstructural characterization at the department of Materials Science and Engineering, University of Tennessee at Knoxville (UTK).
8.4 Perform fatigue tests until failure on two sets of specimens from the same aerospace material:
(a) one set of specimens with ABI tests conducted on the surface of gage section prior to fatigue testing
(b) one set of specimens without prior ABI tests. Comparing the number of fatigue cycles to failure from both sets will prove the nondestructive nature of the ABI test when the number of cycles to failure is not reduced due to the existence of prior ABI tests. The successful completion of this subtask is important to establish the feasibility of the proposed integrated approach described in subtask 8.6.
8.5 Interrupt some of the fatigue tests at several intermediate number of cycles and then perform ABI tests on the specimen gage sections at ATC.
Task 8.6 - Fatigue Damage Assessment 8.6.1 Develop new correlations between fatigue cycles to failure and ABI-measured
flow properties. 8.6.2 Develop new correlations between intermediate/incremental fatigue cycles and
changes in ABI-measured flow properties. 8.6.3 Establish methods to verify the newly developed correlations of subtasks 8.6.1
and 8.6.2. Summary of Task 8 Results : Aluminum 2024-T4 and aluminum 7075-T6 materials have been procured. We used the aluminum 2024-T4 material first. Tensile samples were manufactured and both tensile and ABI tests were conducted on the SSM system at ATC. The ABI tests were conducted on the end-tabs of the miniature tensile specimens and the true-stress/true-plastic-strain curves were in excellent agreement as shown in Fig. 39. A sample of both the tensile and ABI test results are given in appendix C. Three flat fatigue samples were indented in the center of their gage section (using a 0.030-inch diameter indenter to a depth of 0.004 inch). Each fatigue sample included 3-5 indentations in its gage section. Another set of three fatigue specimens were not indented. All six specimens were cyclically fatigue tested at a constant strain amplitude of 1.6% (with complete reversal of tension and compression loads) until failure. A sample of two of these fatigue specimens is shown in Fig. 40. The average number of cycles to failures for the indented specimens was 690 cycles (specimen No. 5: 859 cycles, specimen No. 10: 624 cycles, specimen No. 17: 595 cycles) which is higher than the average number of cycles to failure of 588 for the specimens without indentations in their gage section (specimen No. 9: 770 cycles, specimen No. 15: 495 cycles, specimen No. 16: 500 cycles). One additional specimen included 21 ball indentations in its gage section failed after 924 cycles. These results conclusively demonstrate that ball indentation does not reduce the low-cycle fatigue life and hence it can be considered nondestructive. Detailed results of the incremental fatigue damage tests followed by ABI tests are given in Appendix A (Final Report from UTK). These results show that 2024-T6 aluminum exhibited cyclic hardening while 7070-T6 aluminum did not harden or soften. For 2024-T4
16
aluminum, the changes in the yield strength with increased number of cycles were detected by both ABI and tensile tests. Finite element analysis of this alloy showed that both sample geometry and stress distribution in the gage section changed with accumulated low-cycle fatigue damage. Furthermore, Appendix A includes additional ABI and fatigue test results as well as several finite element analyses of predicting indentation load/depth curves and the cyclic stress-strain curves. Task 9 : Develop new application of the SSM system to detect and evaluate residual stresses in metallic materials. The residual stresses were simulated by applying known tensile stresses to flat specimens using a horizontal load frame. The indentation tests were conducted on the gage section of the flat specimens while the simulated residual stress is applied. Correlations were developed for two steel materials between tensile residual stress and indentation-measured stress-strain properties (e.g. yield strength). This task is very new and not a continuation of Phase I, hence, additional details are provided below. Current Methods for Measuring Residual Stresses : A brief review of the currently available nondestructive and semi-destructive techniques for measuring residual stresses and strains are given below. Other totally destructive methods, such as slicing and sectioning, have been applied, but are not within the scope of this discussion. X-ray techniques have been applied to measuring residual stresses and strains in metallic materials. Monochromatic X-rays are used to determine the distance between planes of atoms near the surface of the material. Residual stresses near the surface cause changes in the spacing between planes of atoms and these changes can theoretically be detected by diffraction methods. X-ray methods have the advantage of being truly nondestructive. Aside from the complexity and cumbersome nature of X-ray electronic equipment, the technique is limited to strain/stress measurements only over the first few microns of materials and can not give true indication of bulk (macroscopic) residual stresses. Additionally, because of its small sampling volume, X-ray stress analysis is sensitive to surface preparation conditions. Electro polishing is often required because cutting and grinding can produce high surface stresses which interfere with the measurement. Furthermore, X-ray methods are severely limited by material variables such as grain size, anisotropic grain properties, microstructure, and yielding of the material. X-ray methods are most successful with isotropic, body centered cubic fine grained materials. Although X-ray methods have been applied to austenitic and other face centered cubic materials, the results are suspect at best. Ultrasonic techniques are also nondestructive and have also been used but they suffer from many of the same problems as X-ray methods and have not achieved acceptance as a standardized test method for residual stress analysis. The American Society for Testing and Materials (ASTM) has established a standard test method (E 837-89) for determining residual stresses by the hole-drilling strain-gage (HDSG) method. The HDSG method involves attaching a three-element strain gage rosette to the structure, drilling a hole in the center of the rosette with a high speed drill, and measuring the relived strains as a function of drilling depth. The ratio of diameters of the strain gage rosette (DR) to the hole
17
which is drilled (Dh) should be between 2.5 and 3.4 and typical drill diameters are on the order of 0.0625 to 0.125 inches 1.6 - 3.2 mm). The hole is drilled to a total depth of 1.2 Dh and relieved strain measurements via the strain gage rosette are made at increments of 0.1 Dh. The measured relieved strains, εr, can be related back to the relieved principal stresses, σx and σy, through a series of semi-empirical equations. There are several drawbacks to the hole-drilling strain gage method. First, the technique is semi-destructive. The structure must be robust enough to allow the hole drilling without repair and/or failure. Weld repair of drilled hole may be possible but this may cause more harm than good by inducing more unknown residual stresses. Secondly, the hole-drilling technique is limited in its range of application. In particular, the ASTM standard specifies that the test method is applicable to cases (structures) where residual stresses do not vary significantly with depth from the surface and do not exceed one half of the yield strength. Furthermore, residual stresses due to welding and fabrication can, in some cases, exceed the yield strength of the material. Third, “portable” and potentially remotely operable hole drilling systems do not exist. The technique is limited primarily to flat or cylindrical and is not readily adaptable to general or non-symmetrical curved surfaces. In this task we will simulate tensile residual stresses by using a horizontal load frame to apply known values of tensile stresses to flat tensile specimens and perform ABI test while the tensile stress is applied. The stress-strain results (e.g. yield strength, strain-hardening exponent, strength coefficient, etc.) will be compared to those from ABI tests with no tensile stress applied. Calibration correlations between flow properties and simulated/applied tensile stresses will be developed for a high strength steel and possibly some aluminum alloys.
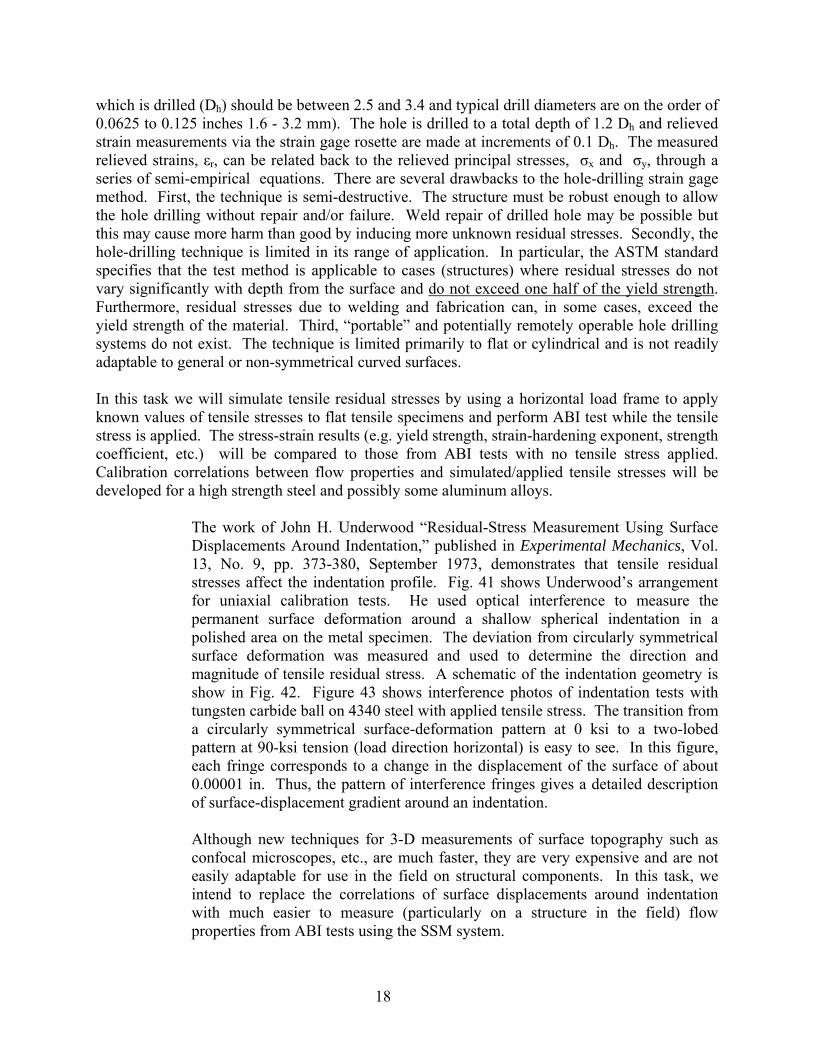
The work of John H. Underwood “Residual-Stress Measurement Using Surface Displacements Around Indentation,” published in Experimental Mechanics, Vol. 13, No. 9, pp. 373-380, September 1973, demonstrates that tensile residual stresses affect the indentation profile. Fig. 41 shows Underwood’s arrangement for uniaxial calibration tests. He used optical interference to measure the permanent surface deformation around a shallow spherical indentation in a polished area on the metal specimen. The deviation from circularly symmetrical surface deformation was measured and used to determine the direction and magnitude of tensile residual stress. A schematic of the indentation geometry is show in Fig. 42. Figure 43 shows interference photos of indentation tests with tungsten carbide ball on 4340 steel with applied tensile stress. The transition from a circularly symmetrical surface-deformation pattern at 0 ksi to a two-lobed pattern at 90-ksi tension (load direction horizontal) is easy to see. In this figure, each fringe corresponds to a change in the displacement of the surface of about 0.00001 in. Thus, the pattern of interference fringes gives a detailed description of surface-displacement gradient around an indentation.
Although new techniques for 3-D measurements of surface topography such as confocal microscopes, etc., are much faster, they are very expensive and are not easily adaptable for use in the field on structural components. In this task, we intend to replace the correlations of surface displacements around indentation with much easier to measure (particularly on a structure in the field) flow properties from ABI tests using the SSM system.
18
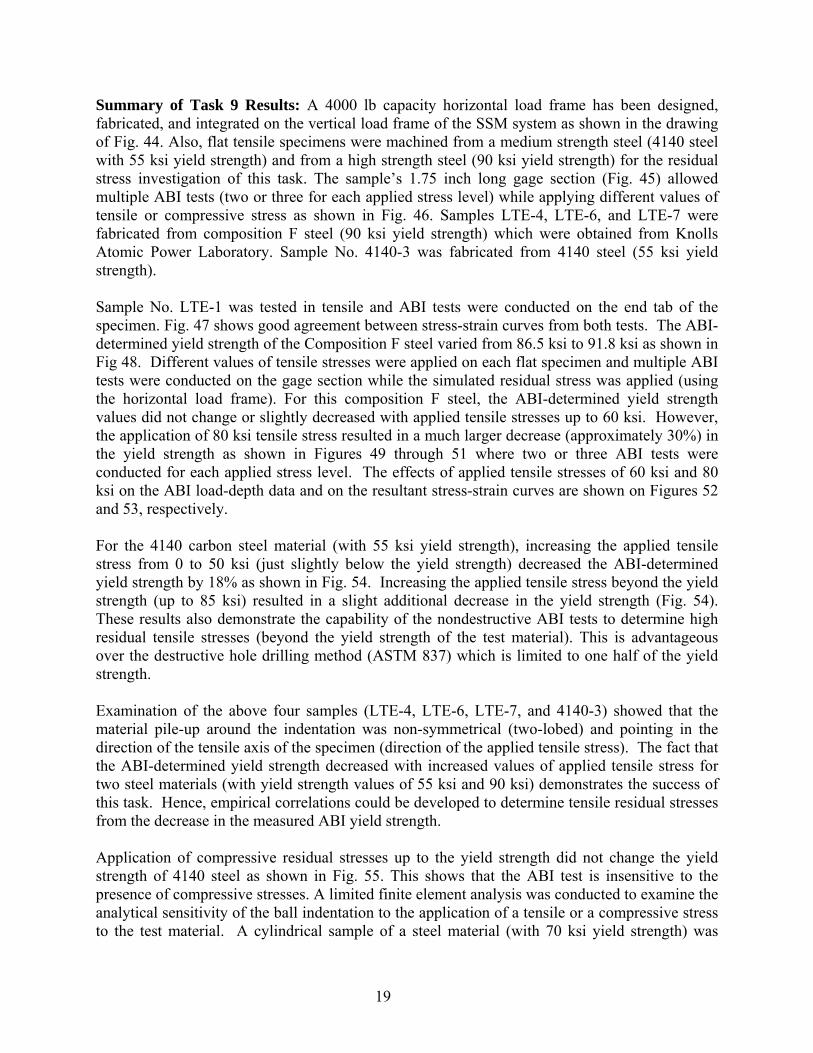
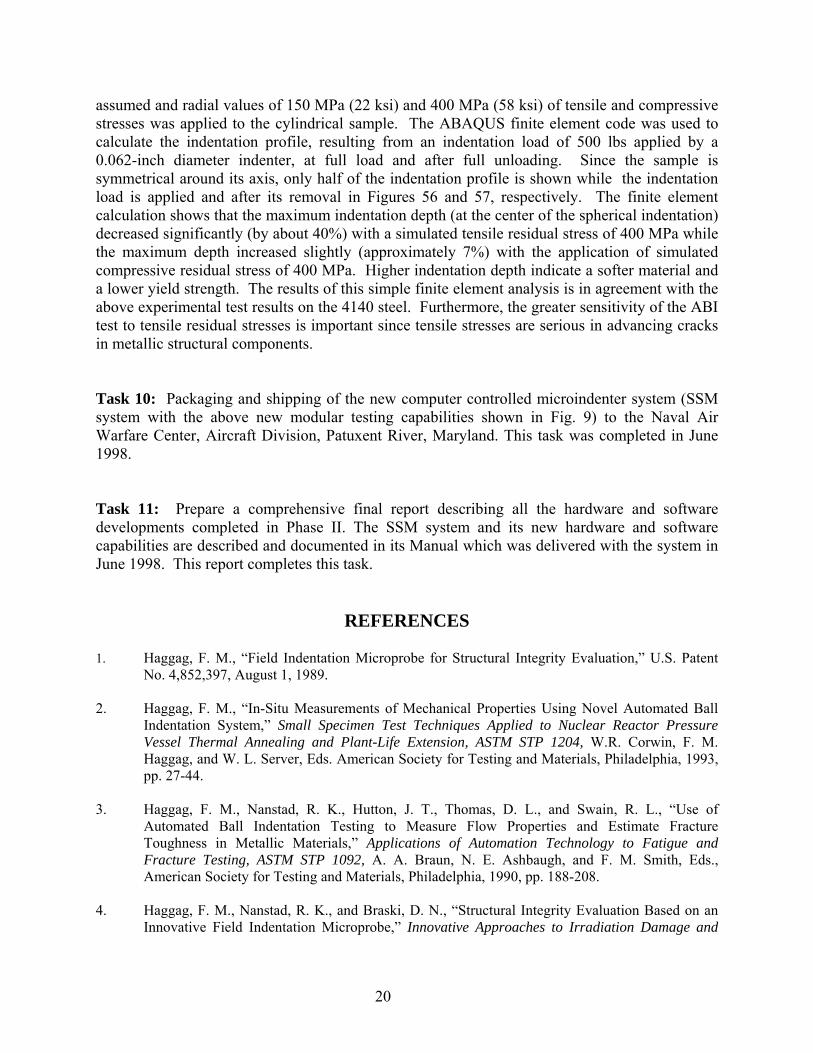
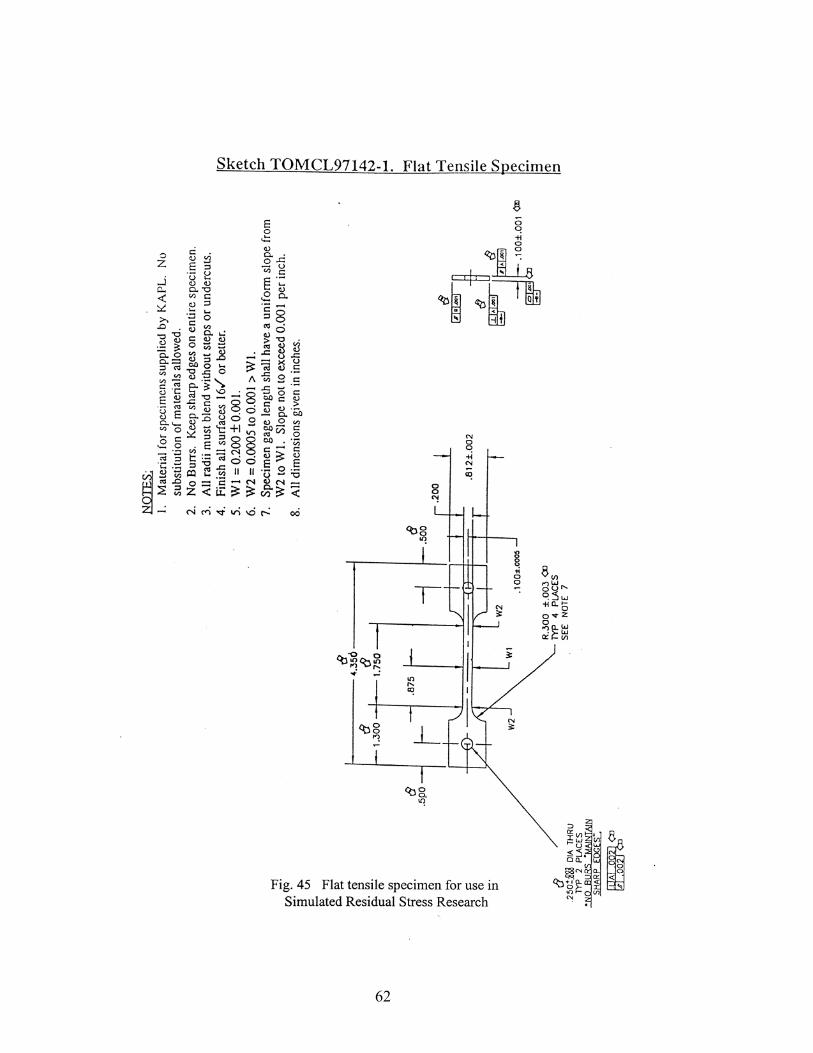
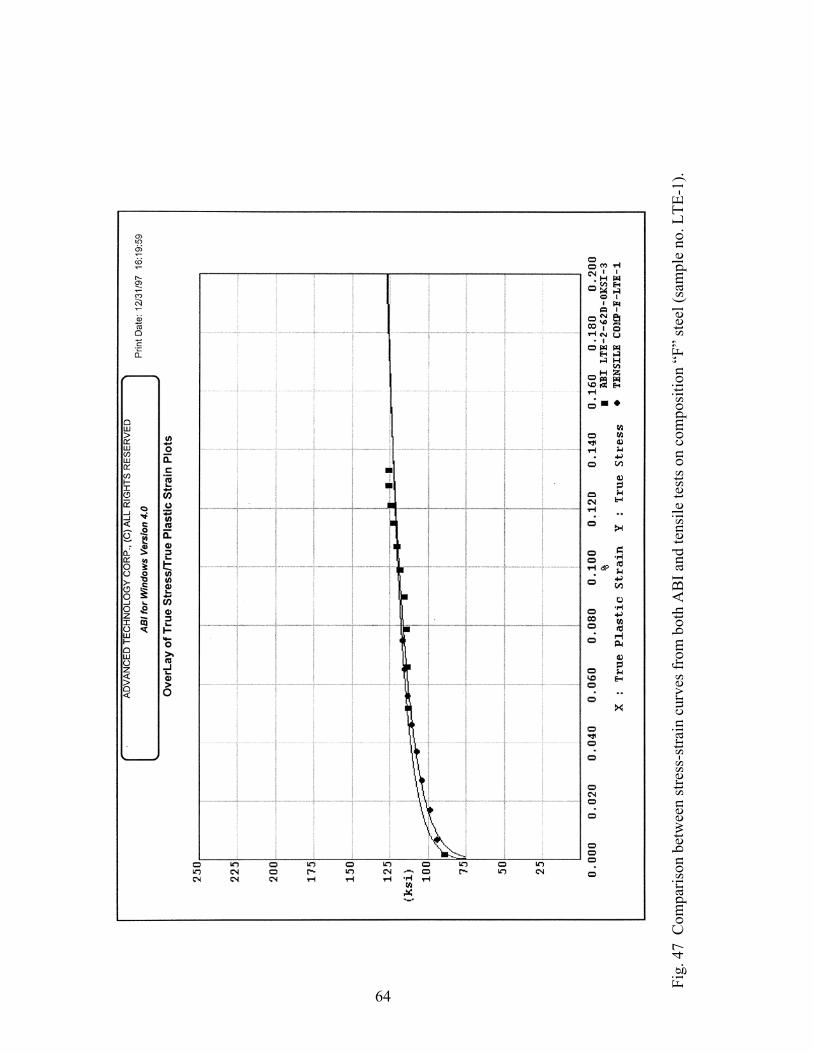
Summary of Task 9 Results: A 4000 lb capacity horizontal load frame has been designed, fabricated, and integrated on the vertical load frame of the SSM system as shown in the drawing of Fig. 44. Also, flat tensile specimens were machined from a medium strength steel (4140 steel with 55 ksi yield strength) and from a high strength steel (90 ksi yield strength) for the residual stress investigation of this task. The sample’s 1.75 inch long gage section (Fig. 45) allowed multiple ABI tests (two or three for each applied stress level) while applying different values of tensile or compressive stress as shown in Fig. 46. Samples LTE-4, LTE-6, and LTE-7 were fabricated from composition F steel (90 ksi yield strength) which were obtained from Knolls Atomic Power Laboratory. Sample No. 4140-3 was fabricated from 4140 steel (55 ksi yield strength). Sample No. LTE-1 was tested in tensile and ABI tests were conducted on the end tab of the specimen. Fig. 47 shows good agreement between stress-strain curves from both tests. The ABI-determined yield strength of the Composition F steel varied from 86.5 ksi to 91.8 ksi as shown in Fig 48. Different values of tensile stresses were applied on each flat specimen and multiple ABI tests were conducted on the gage section while the simulated residual stress was applied (using the horizontal load frame). For this composition F steel, the ABI-determined yield strength values did not change or slightly decreased with applied tensile stresses up to 60 ksi. However, the application of 80 ksi tensile stress resulted in a much larger decrease (approximately 30%) in the yield strength as shown in Figures 49 through 51 where two or three ABI tests were conducted for each applied stress level. The effects of applied tensile stresses of 60 ksi and 80 ksi on the ABI load-depth data and on the resultant stress-strain curves are shown on Figures 52 and 53, respectively. For the 4140 carbon steel material (with 55 ksi yield strength), increasing the applied tensile stress from 0 to 50 ksi (just slightly below the yield strength) decreased the ABI-determined yield strength by 18% as shown in Fig. 54. Increasing the applied tensile stress beyond the yield strength (up to 85 ksi) resulted in a slight additional decrease in the yield strength (Fig. 54). These results also demonstrate the capability of the nondestructive ABI tests to determine high residual tensile stresses (beyond the yield strength of the test material). This is advantageous over the destructive hole drilling method (ASTM 837) which is limited to one half of the yield strength. Examination of the above four samples (LTE-4, LTE-6, LTE-7, and 4140-3) showed that the material pile-up around the indentation was non-symmetrical (two-lobed) and pointing in the direction of the tensile axis of the specimen (direction of the applied tensile stress). The fact that the ABI-determined yield strength decreased with increased values of applied tensile stress for two steel materials (with yield strength values of 55 ksi and 90 ksi) demonstrates the success of this task. Hence, empirical correlations could be developed to determine tensile residual stresses from the decrease in the measured ABI yield strength. Application of compressive residual stresses up to the yield strength did not change the yield strength of 4140 steel as shown in Fig. 55. This shows that the ABI test is insensitive to the presence of compressive stresses. A limited finite element analysis was conducted to examine the analytical sensitivity of the ball indentation to the application of a tensile or a compressive stress to the test material. A cylindrical sample of a steel material (with 70 ksi yield strength) was
19
assumed and radial values of 150 MPa (22 ksi) and 400 MPa (58 ksi) of tensile and compressive stresses was applied to the cylindrical sample. The ABAQUS finite element code was used to calculate the indentation profile, resulting from an indentation load of 500 lbs applied by a 0.062-inch diameter indenter, at full load and after full unloading. Since the sample is symmetrical around its axis, only half of the indentation profile is shown while the indentation load is applied and after its removal in Figures 56 and 57, respectively. The finite element calculation shows that the maximum indentation depth (at the center of the spherical indentation) decreased significantly (by about 40%) with a simulated tensile residual stress of 400 MPa while the maximum depth increased slightly (approximately 7%) with the application of simulated compressive residual stress of 400 MPa. Higher indentation depth indicate a softer material and a lower yield strength. The results of this simple finite element analysis is in agreement with the above experimental test results on the 4140 steel. Furthermore, the greater sensitivity of the ABI test to tensile residual stresses is important since tensile stresses are serious in advancing cracks in metallic structural components. Task 10: Packaging and shipping of the new computer controlled microindenter system (SSM system with the above new modular testing capabilities shown in Fig. 9) to the Naval Air Warfare Center, Aircraft Division, Patuxent River, Maryland. This task was completed in June 1998. Task 11: Prepare a comprehensive final report describing all the hardware and software developments completed in Phase II. The SSM system and its new hardware and software capabilities are described and documented in its Manual which was delivered with the system in June 1998. This report completes this task.
REFERENCES 1. Haggag, F. M., “Field Indentation Microprobe for Structural Integrity Evaluation,” U.S. Patent
No. 4,852,397, August 1, 1989. 2. Haggag, F. M., “In-Situ Measurements of Mechanical Properties Using Novel Automated Ball
Indentation System,” Small Specimen Test Techniques Applied to Nuclear Reactor Pressure Vessel Thermal Annealing and Plant-Life Extension, ASTM STP 1204, W.R. Corwin, F. M. Haggag, and W. L. Server, Eds. American Society for Testing and Materials, Philadelphia, 1993, pp. 27-44.
3. Haggag, F. M., Nanstad, R. K., Hutton, J. T., Thomas, D. L., and Swain, R. L., “Use of
Automated Ball Indentation Testing to Measure Flow Properties and Estimate Fracture Toughness in Metallic Materials,” Applications of Automation Technology to Fatigue and Fracture Testing, ASTM STP 1092, A. A. Braun, N. E. Ashbaugh, and F. M. Smith, Eds., American Society for Testing and Materials, Philadelphia, 1990, pp. 188-208.
4. Haggag, F. M., Nanstad, R. K., and Braski, D. N., “Structural Integrity Evaluation Based on an
Innovative Field Indentation Microprobe,” Innovative Approaches to Irradiation Damage and
20
Failure Analysis, D. L. Marriott, T. R. Mager, and W. H. Bamford, Eds., PVP Vol. 170, American Society of Mechanical Engineers, New York, 1989, pp. 101-107.
5. Haggag, F. M. and Nanstad, R. K., “Estimating Fracture Toughness Using Tension or Ball
Indentation Tests and a Modified Critical Strain Model,” Innovative Approaches to Irradiation Damage and Failure Analysis, D. L. Marriott, T. R. Mager, and W. H. Bamford, Eds., PVP Vol. 170, American Society of Mechanical Engineers, New York, 1989, pp. 41-46.
6. Haggag, F. M., Wong, H., Alexander, D. J., and Nanstad, R. K., “ The Use of Field Indentation
Microprobe in Measuring Mechanical Properties of Welds,” Recent Trends in Welding Science and Technology, TWR’89, Proceedings of the 2nd International Conference on Trends in Welding Research, Gatlinburg, Tennessee, U.S.A., 14-18 May, 1989, pp. 843-849, 1990.
7. Haggag, F. M., “Application of Flow Properties Microprobe to Evaluate Gradients in Weldment
Properties,” International Trends in Welding Sciences and Technology, S. A. David and J. M. Vitek, Eds., ASM International, Metals Park, OH, 1993, pp. 629-635.
8. Haggag, F. M. and Bell, G. E. C., “Measurement of Yield Strength and Flow Properties in Spot
Welds and Their HAZs at Various Strain Rates,” International Trends in Welding Sciences and Technology, S. A. David and J. M. Vatic, Eds., ASM International, Metals Park, OH, 1993, pp. 637-642.
9. Druce, S. G., Gage, G., and Phaethon, W. J., “The Use of Miniature Specimen Techniques for the
Assessment of Materials Condition,” ASME P.P. -Vol. 252, 1993, pp. 58-59. 10. Haggag, Fahmy M., Wang, J. A., Sokolov, M. A., and Murty, K. L., “Use of Portable/In-Situ
Stress-Strain Microprobe System to Measure Stress-Strain Behavior and Damage in Metallic Materials and Structures,” Nontraditional Methods of Sensing Stress, Strain, and Damage in Materials and Structures, ASTM STP 1318, G. Lucas and D. Stubby, Eds., American Society for Testing and Materials, Philadelphia, 1996.
11. Server, W. L. and Oldfield, W., “Nuclear Pressure Vessel Steel Data Base,” EPRI Report NP-
933, 1978. 12. Ritchie, R. O., Server, W. L., and Woolworth, R. A., “Critical Fracture Stress and Fracture Strain
Models for Prediction of Lower and Upper Shelf Toughness in Nuclear Pressure Vessel Steels,” Met. Trans. A, 10A, 1979, pp. 1557-70.
13. Landgraf, R. W., Morrow, Jo Dean, Endo, T., and Mater, J., JMLSA, 4 (1) 1969, p. 176. 14. Morrow, Jo Dean, “International Friction, Damping and Cyclic Plasticity,” ASTM STP 378, 1965,
p. 45. 15. Smith, R. W., Hirschberg, M. H., and Manson, S. S., NASA TN D-1574, NASA, April 1963. 16. Landgraf, R. W., “Achievement of High Fatigue Resistance in Metals and Alloys,” ASTM STP-
467, 1970, p. 3. 17. Liaw, P. K., Saxena, A., and Perrin, J., “Life Extension Technology for Steam Pipe Systems: Part
I, Development of material Properties,” Engineering Fracture Mechanics, Vol. 45, No. 6, 1993, pp. 759-786.
21
22
23
24
25
26
27
****Proprietary Drawings, Figures 1 through 7, excluded from report****
Fig. 1 Stress-Strain Microprobe Main Assembly (SSM-1) for room temperature testing
Fig. 2
Stress-Strain Microprobe Tensile Test Assembly (SSM-2) for miniature testing
Fig. 3 Stress-Strain Microprobe X-Y Table Assembly (SSM-3) for specimen positioning
Fig. 4
Stress-Strain Microprobe Camera Assembly and Zoom Optics Lens (SSM-4)
Fig. 5 Stress-Strain Microprobe Heat/Cool Chamber Assembly for Testing at Low and High
Temperatures (notice that LVDT is mounted on a bracket outside chamber).
Fig. 6 Stress-Strain Microprobe Assembly (SSM-6) with all options installed (Heat/Cool
Chamber, X-Y Table, and Camera and Zoom Optics Lens).
Fig. 7 Block Diagram of the components of the New Computer Controlled Microindenter System
28
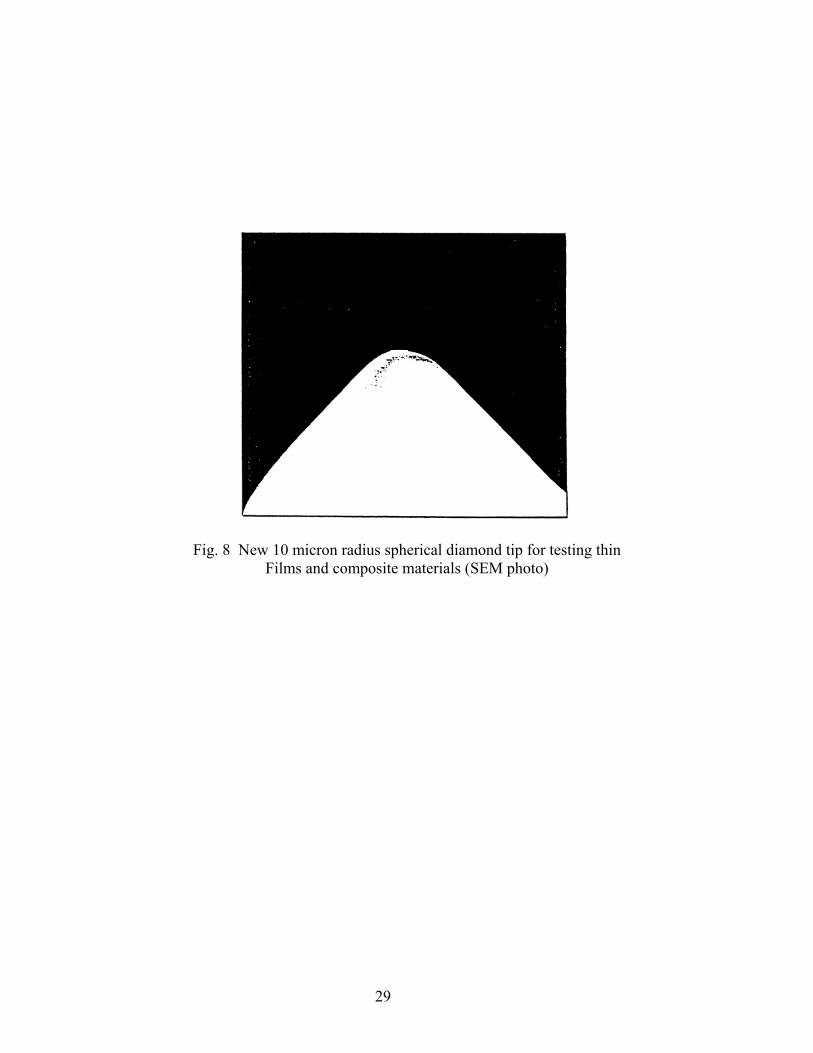
Fig. 8 New 10 micron radius spherical diamond tip for testing thin
Films and composite materials (SEM photo)
29
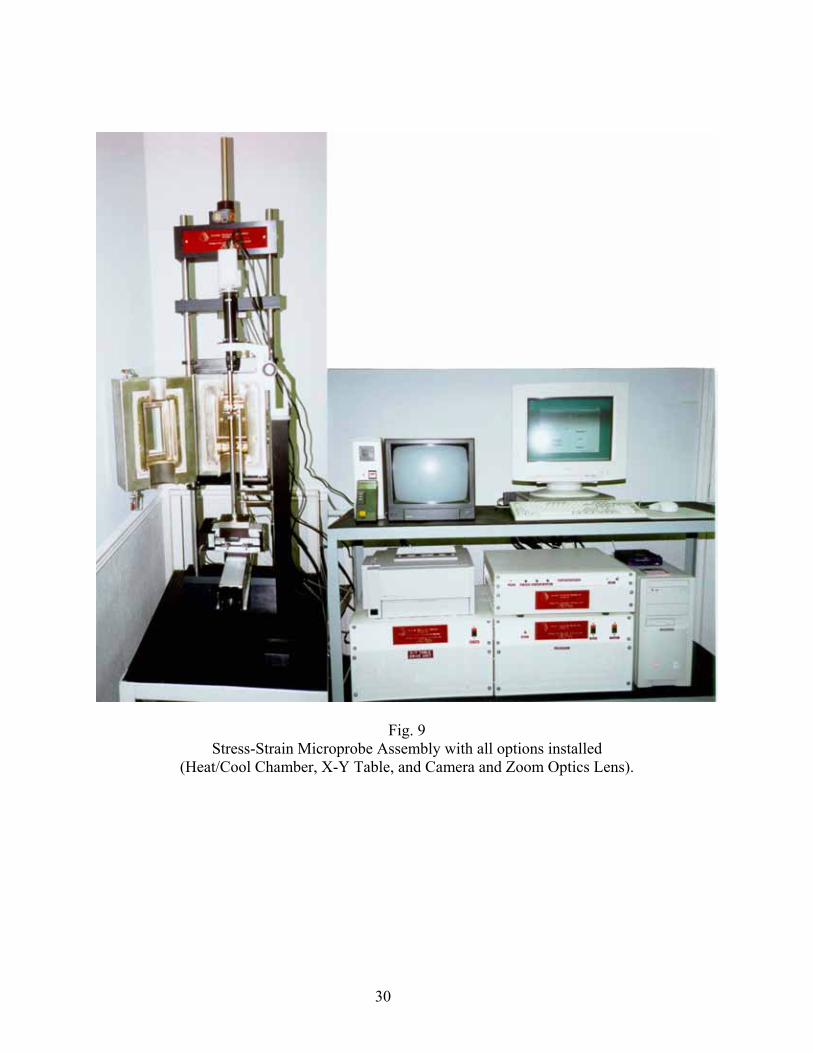
Fig. 9 Stress-Strain Microprobe Assembly with all options installed
(Heat/Cool Chamber, X-Y Table, and Camera and Zoom Optics Lens).
30
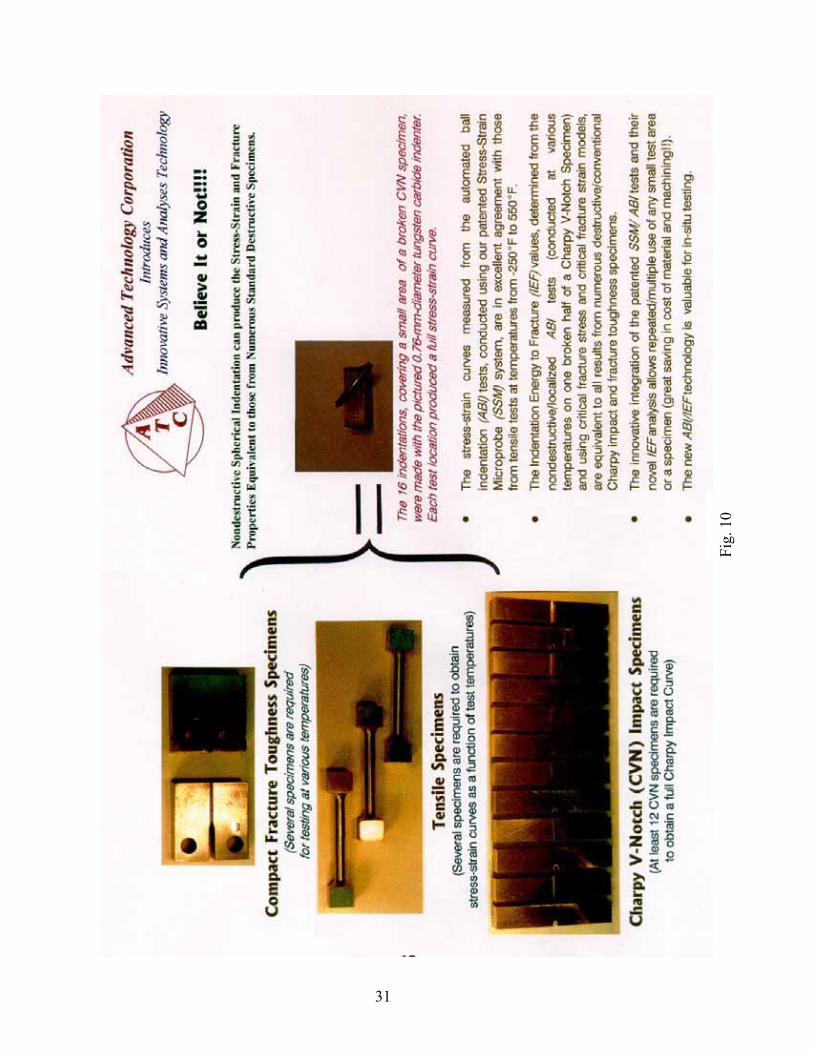
Fig.
10
31
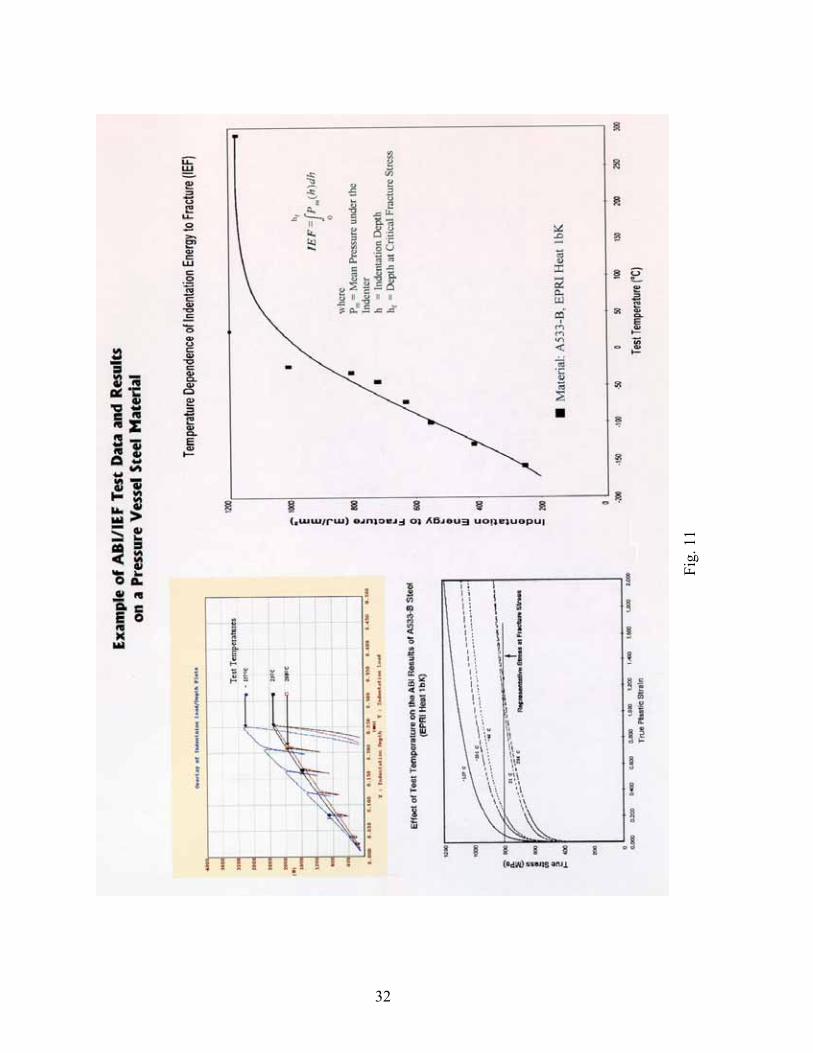
Fig.
11
32
Omitted Proprietary Drawing: Figure 12. Cad Drawing of miniature tensile specimen.
33
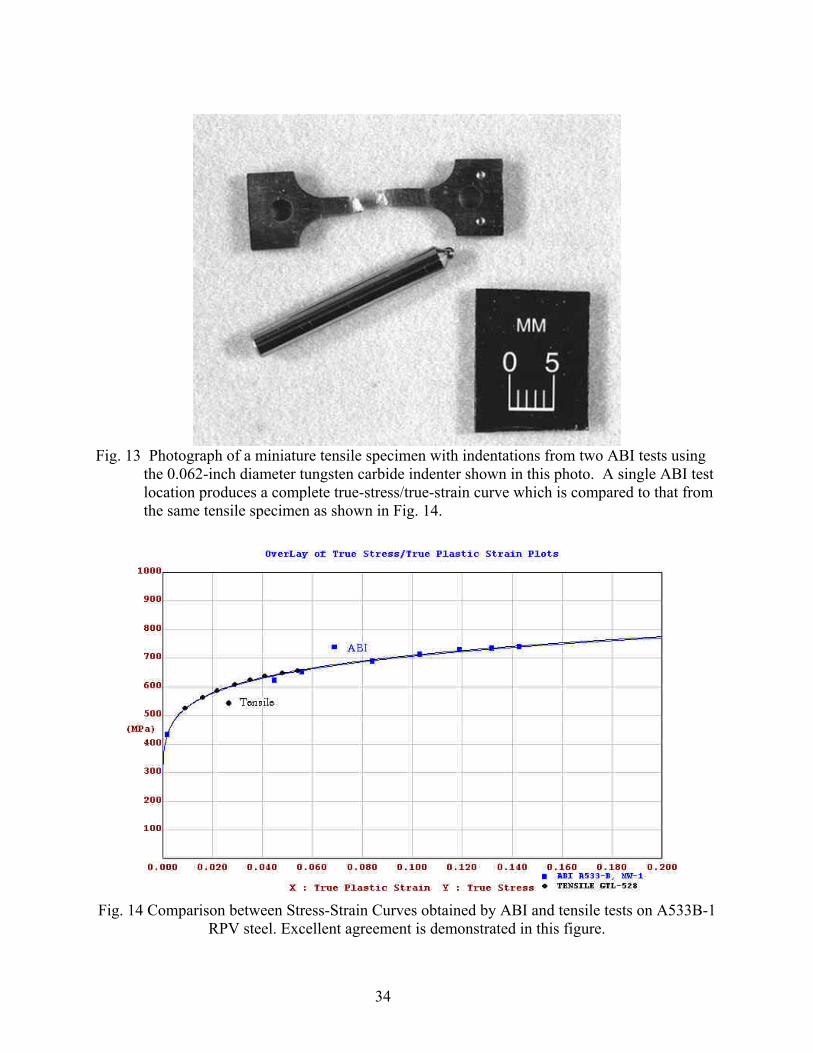
Fig. 13 Photograph of a miniature tensile specimen with indentations from two ABI tests using
the 0.062-inch diameter tungsten carbide indenter shown in this photo. A single ABI test location produces a complete true-stress/true-strain curve which is compared to that from the same tensile specimen as shown in Fig. 14.
Fig. 14 Comparison between Stress-Strain Curves obtained by ABI and tensile tests on A533B-1
RPV steel. Excellent agreement is demonstrated in this figure.
34
35
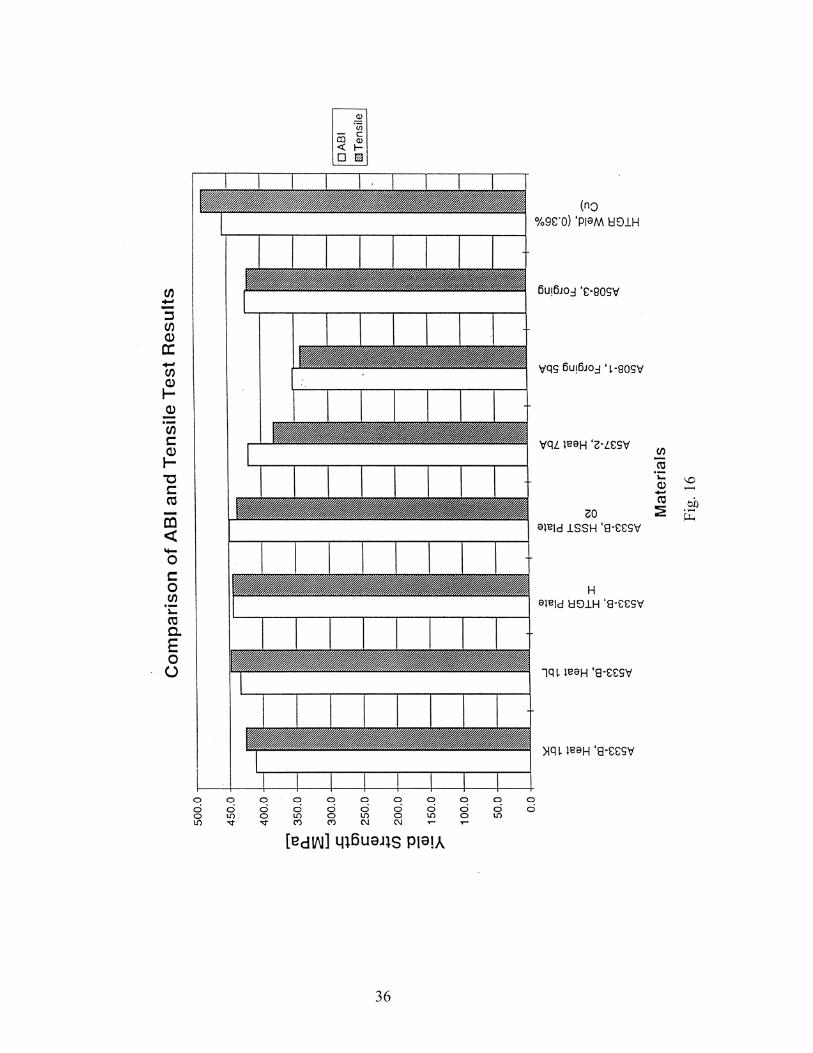
Fig.
16
36
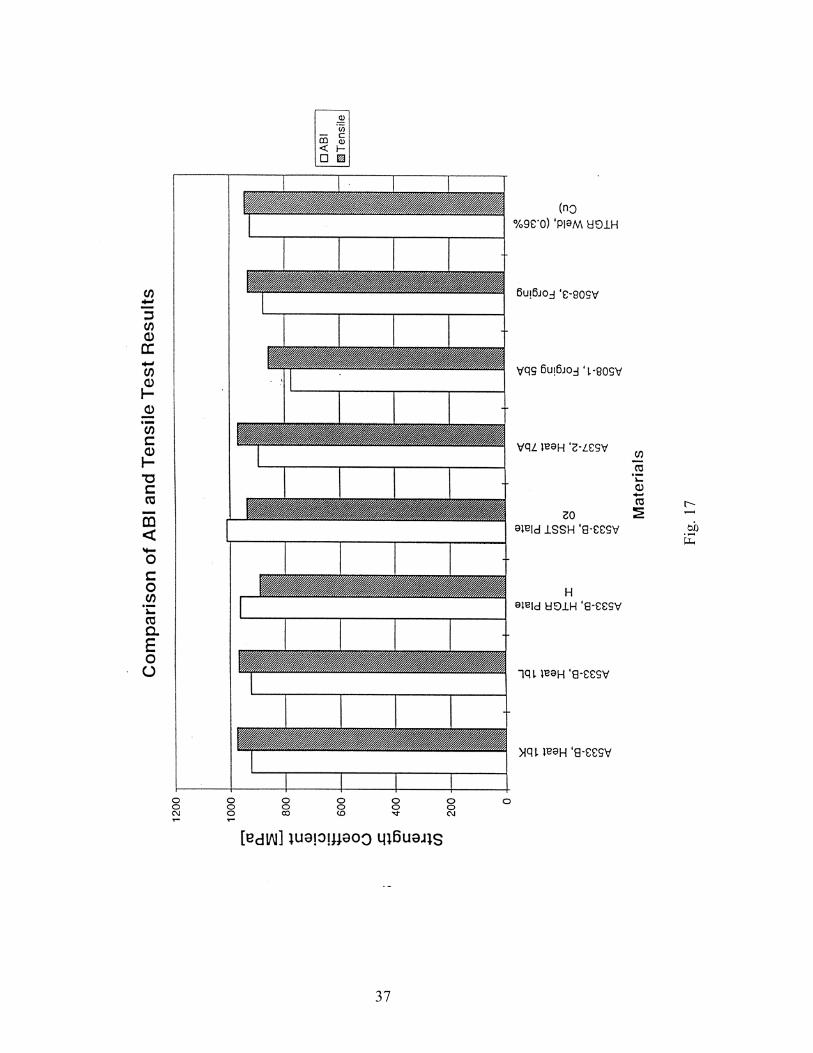
Fig.
17
37
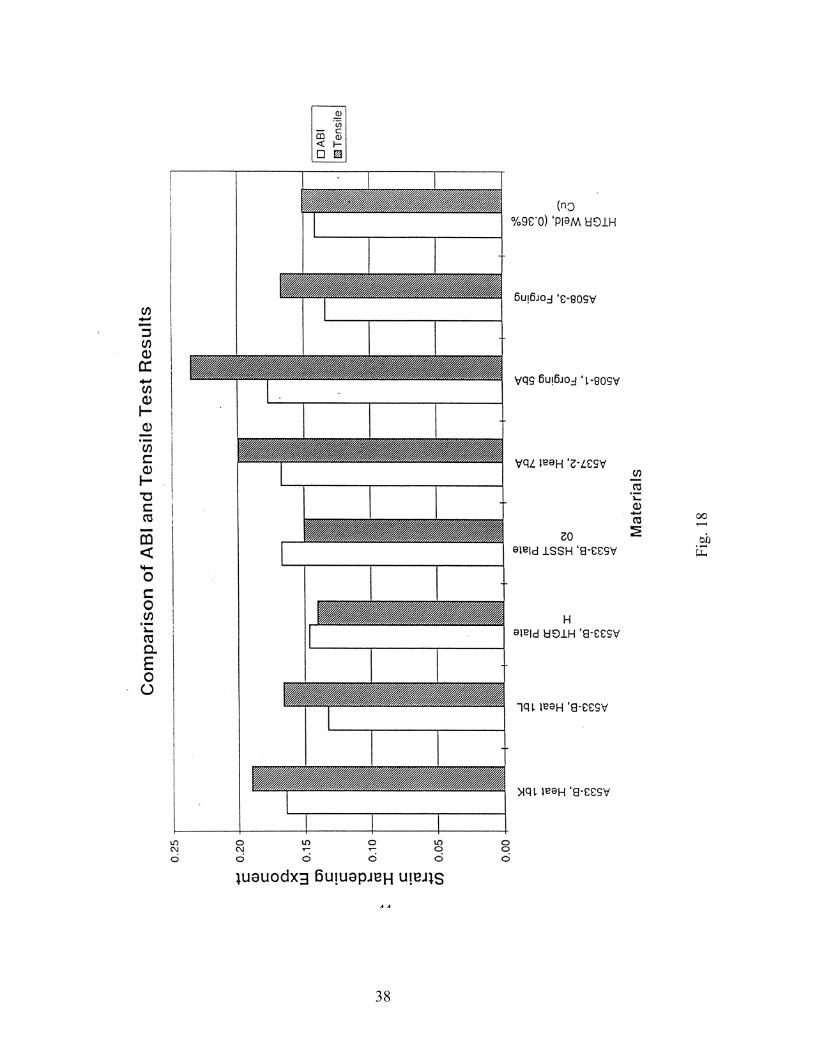
Fig.
18
38
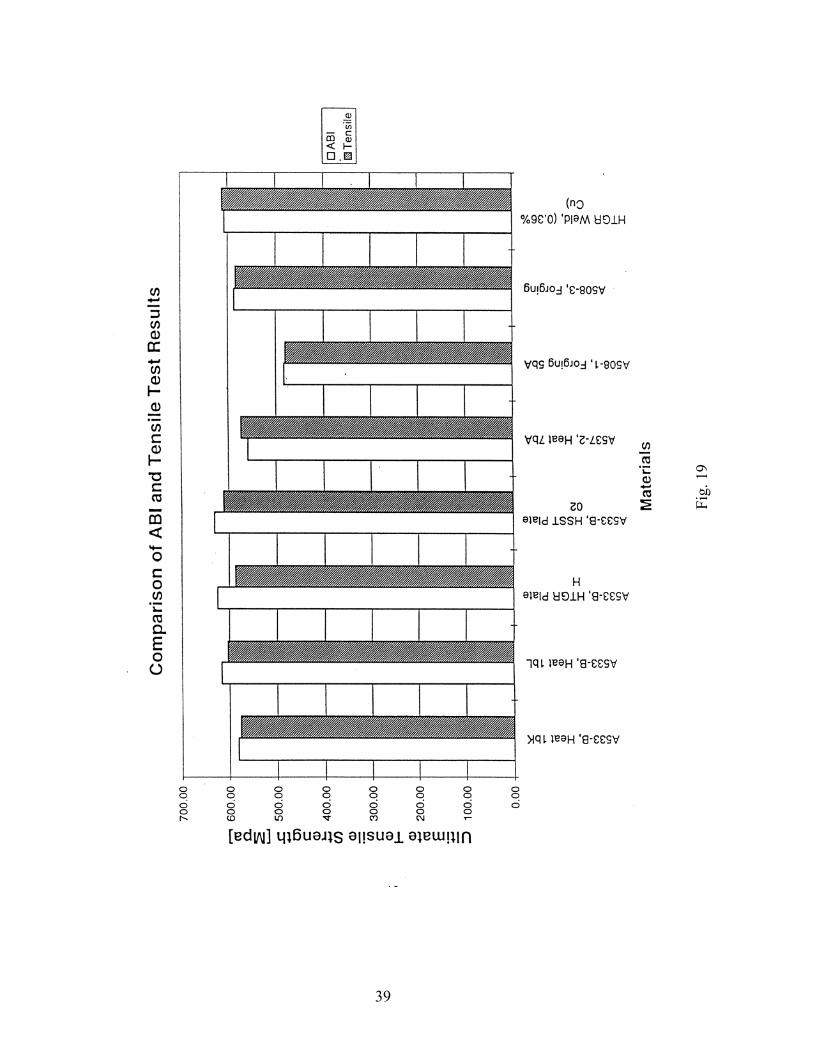
Fig.
19
39
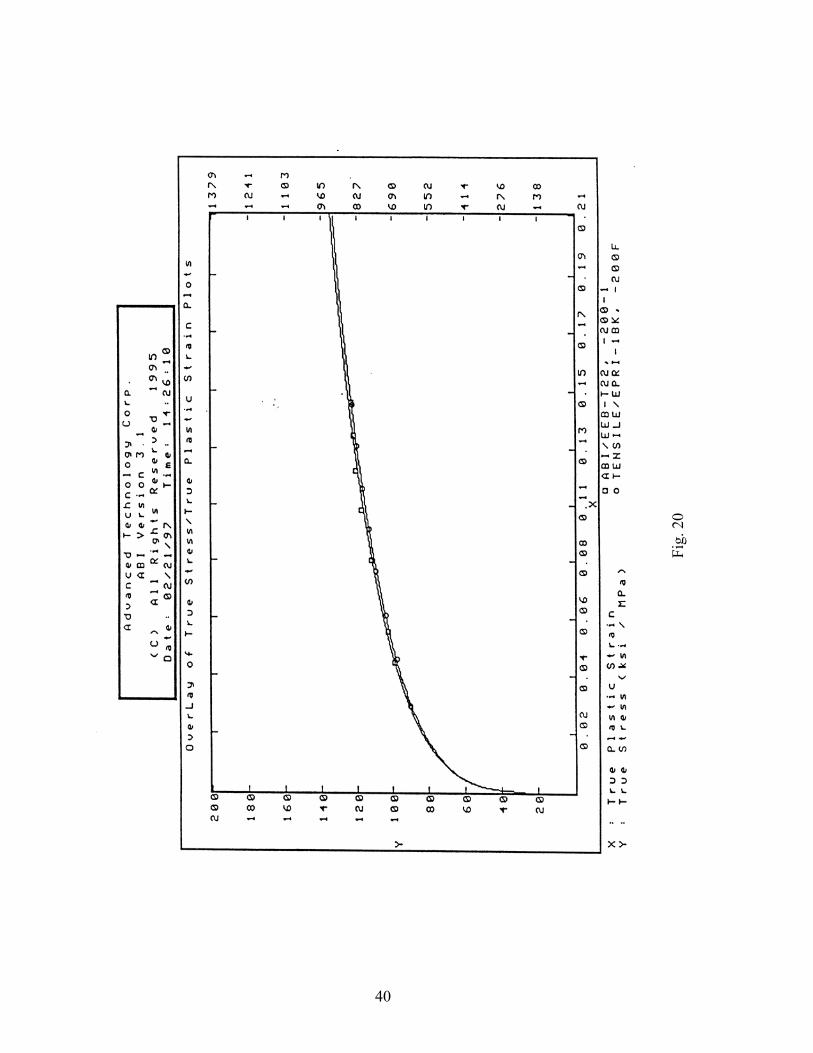
Fig.
20
40
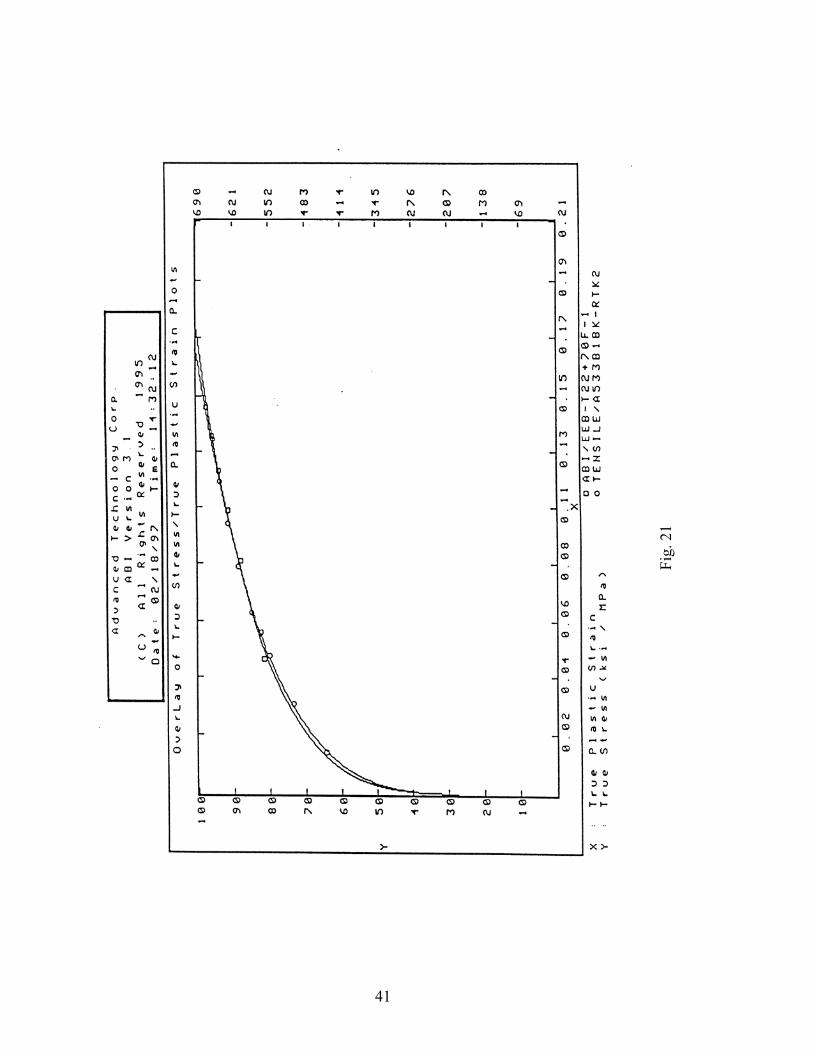
Fig.
21
41
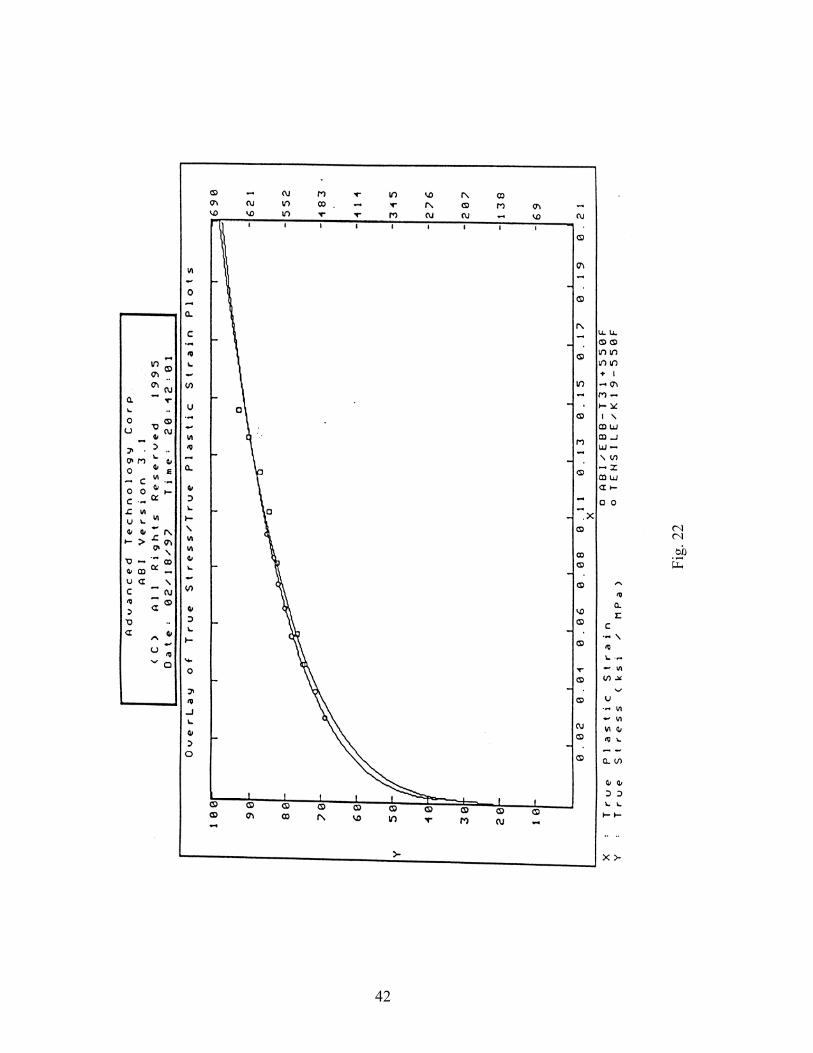
Fig.
22
42
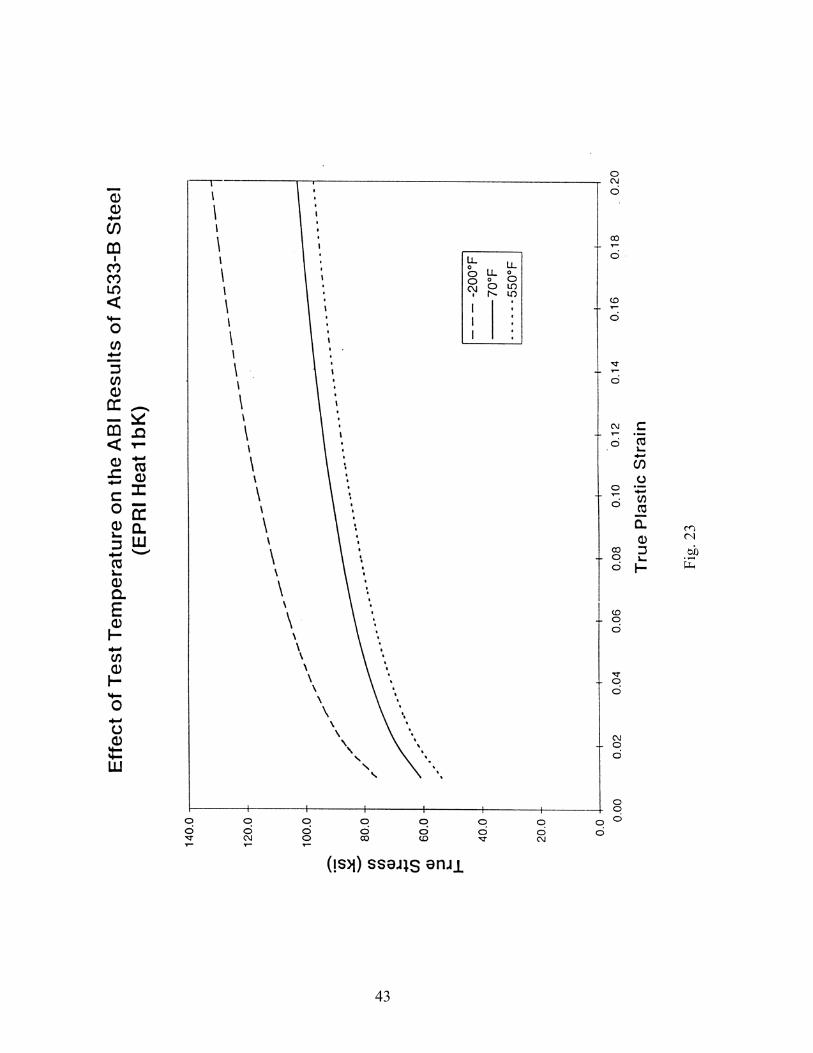
Fig.
23
43

Fig.
24
44
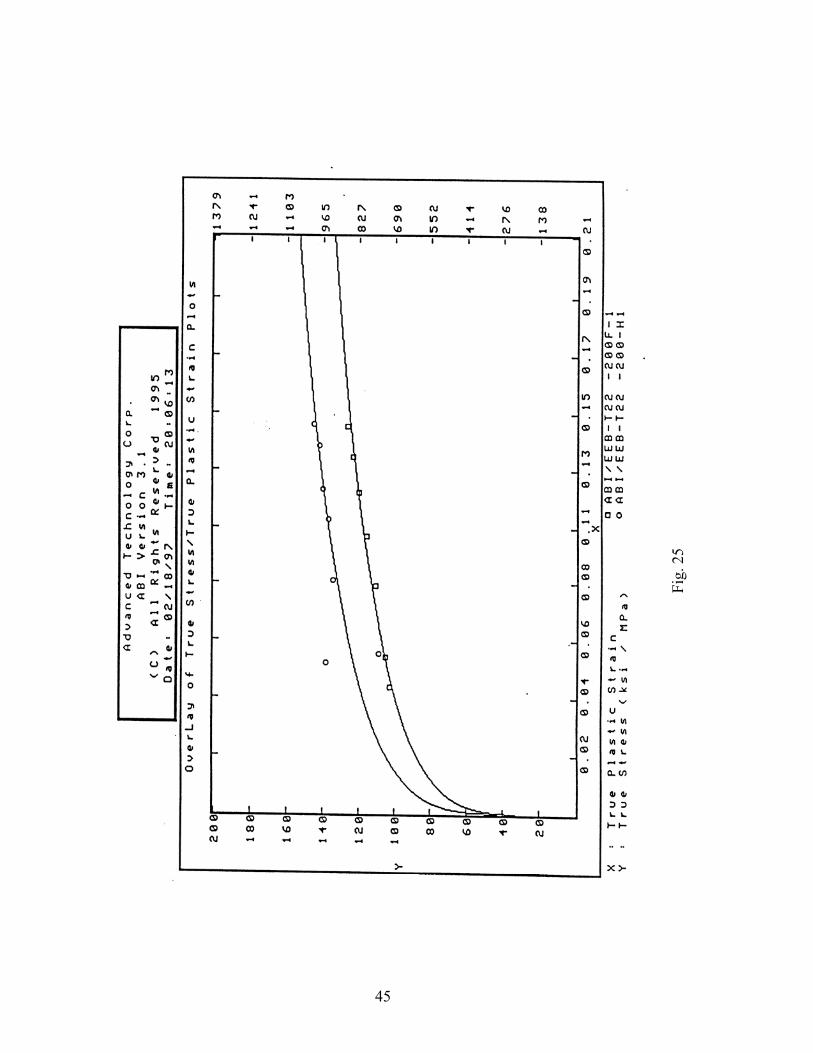
Fig.
25
45
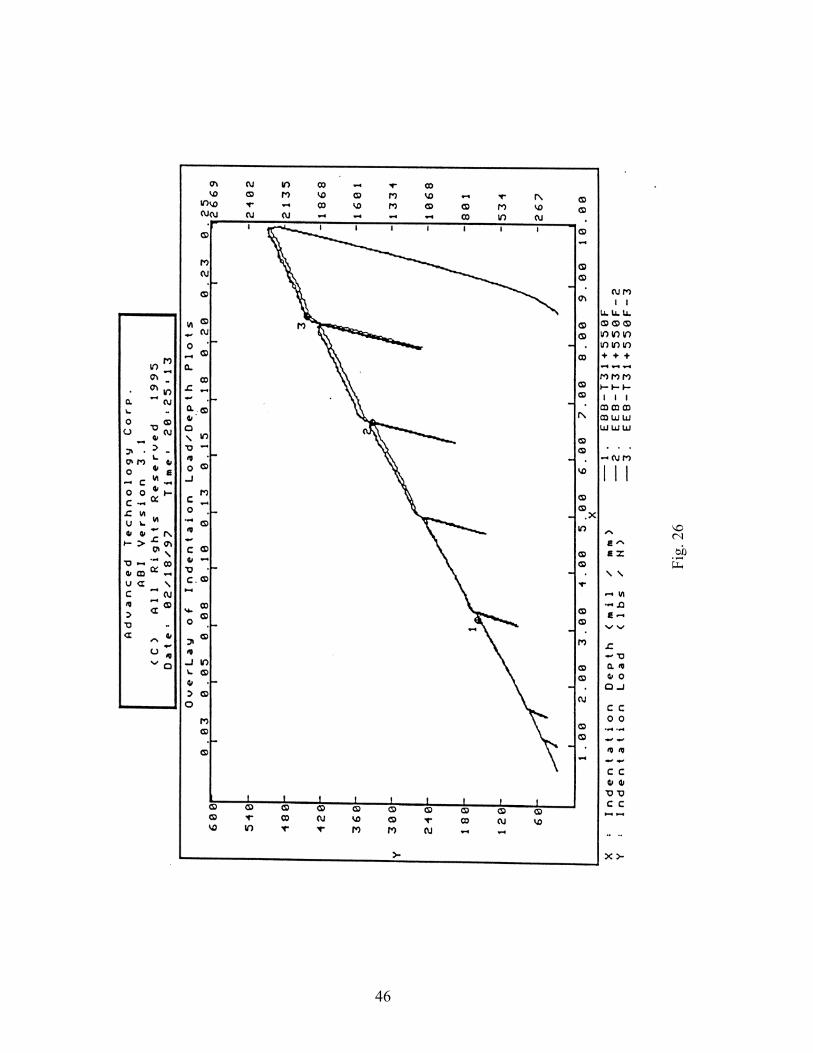
Fig.
26
46
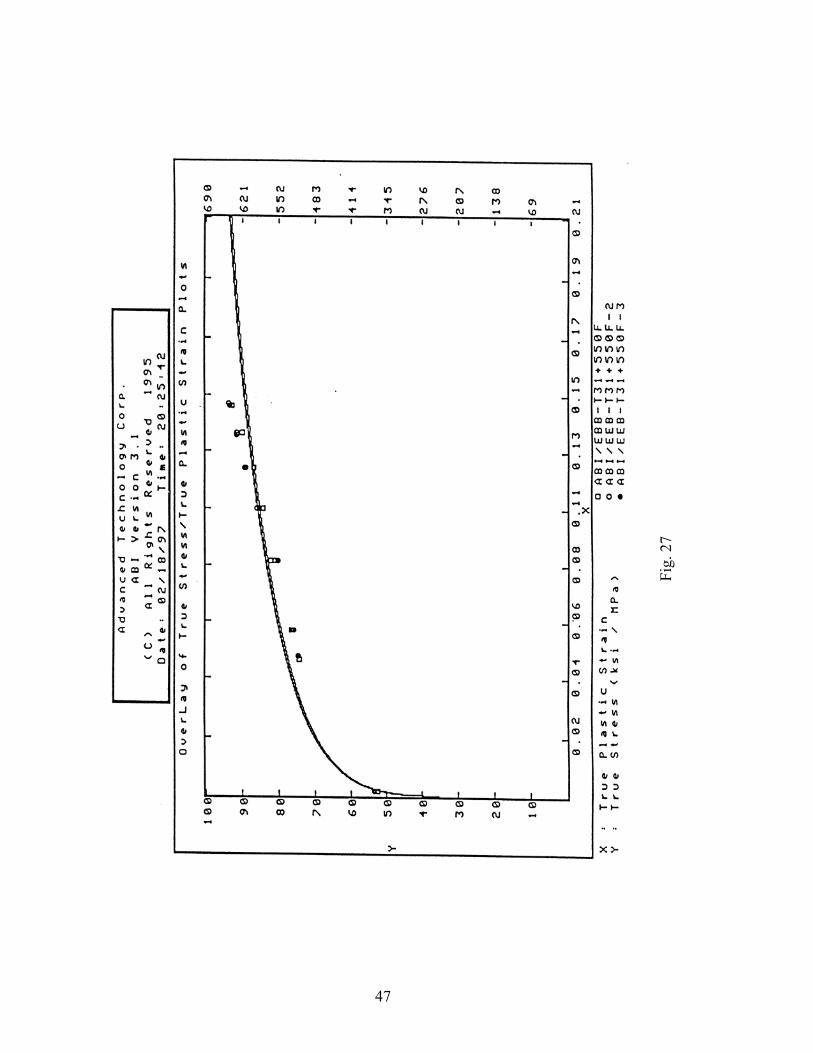
Fig.
27
47
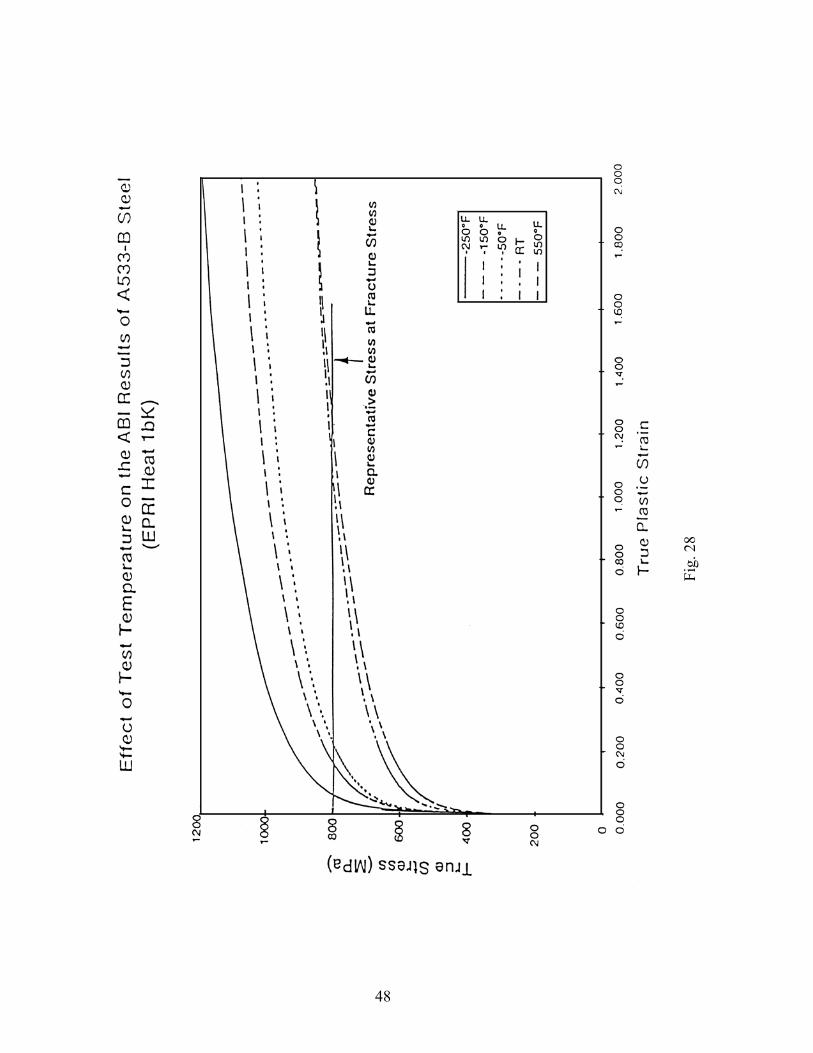
Fig.
28
48
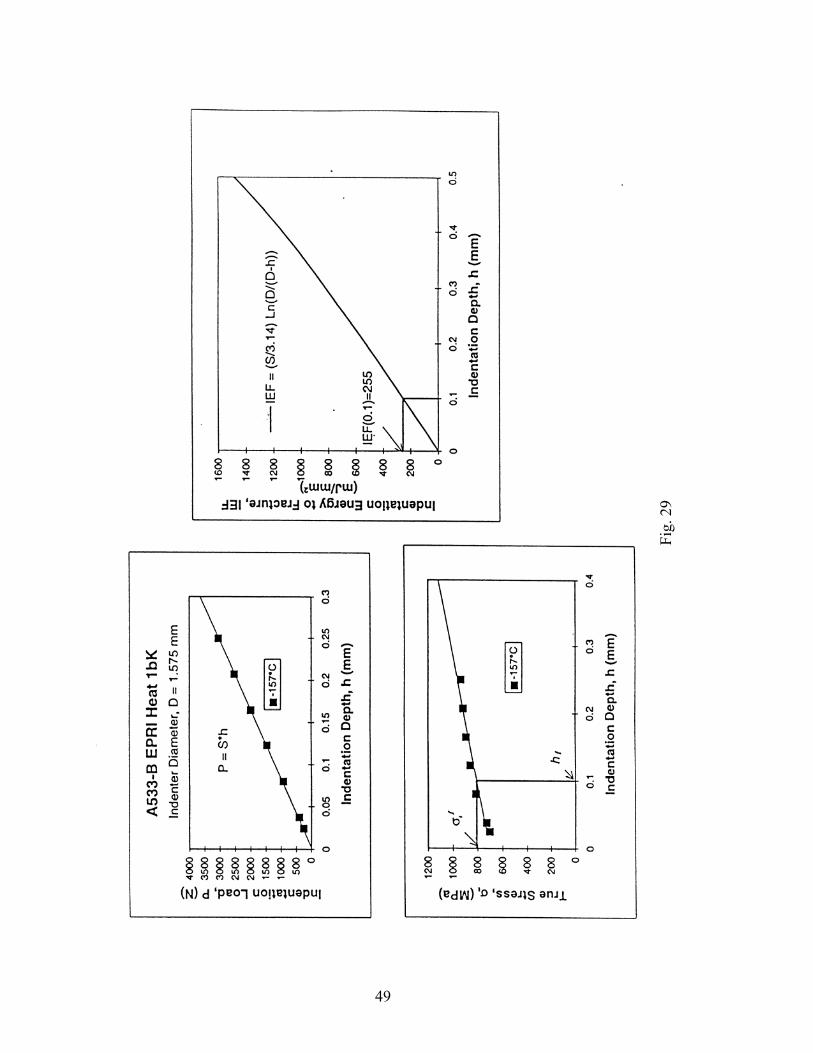
Fig.
29
49
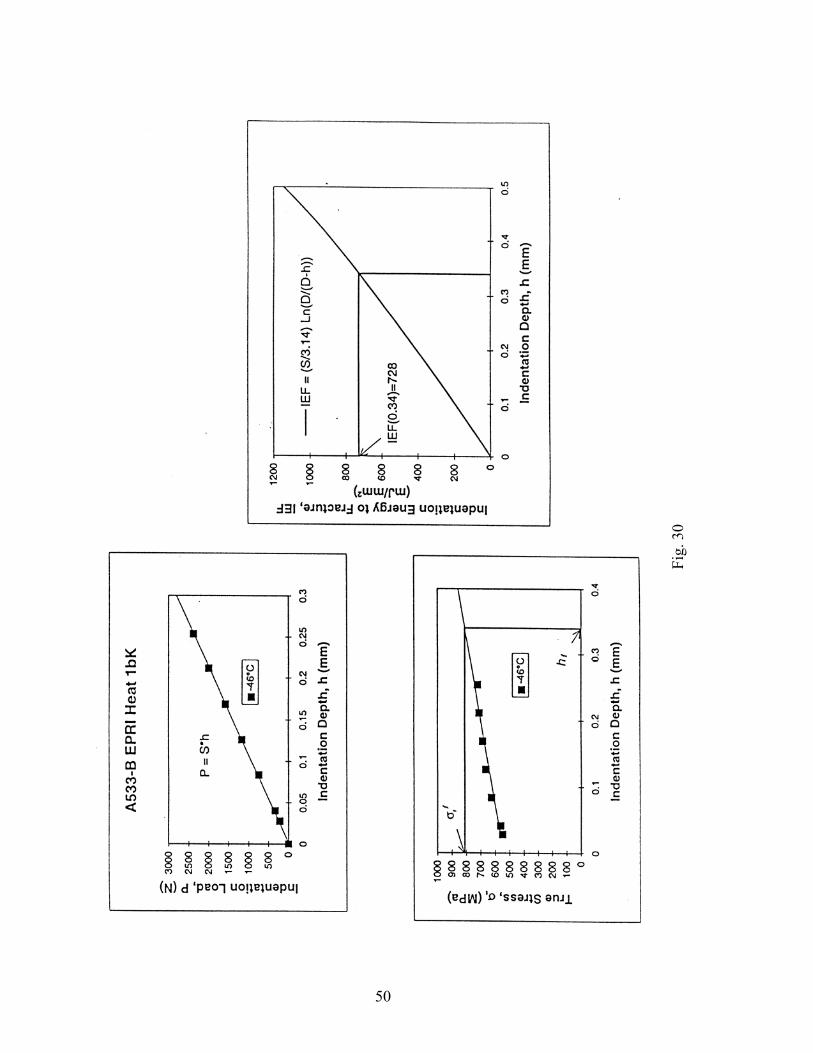
Fig.
30
50
51

Fig.
32
52
53
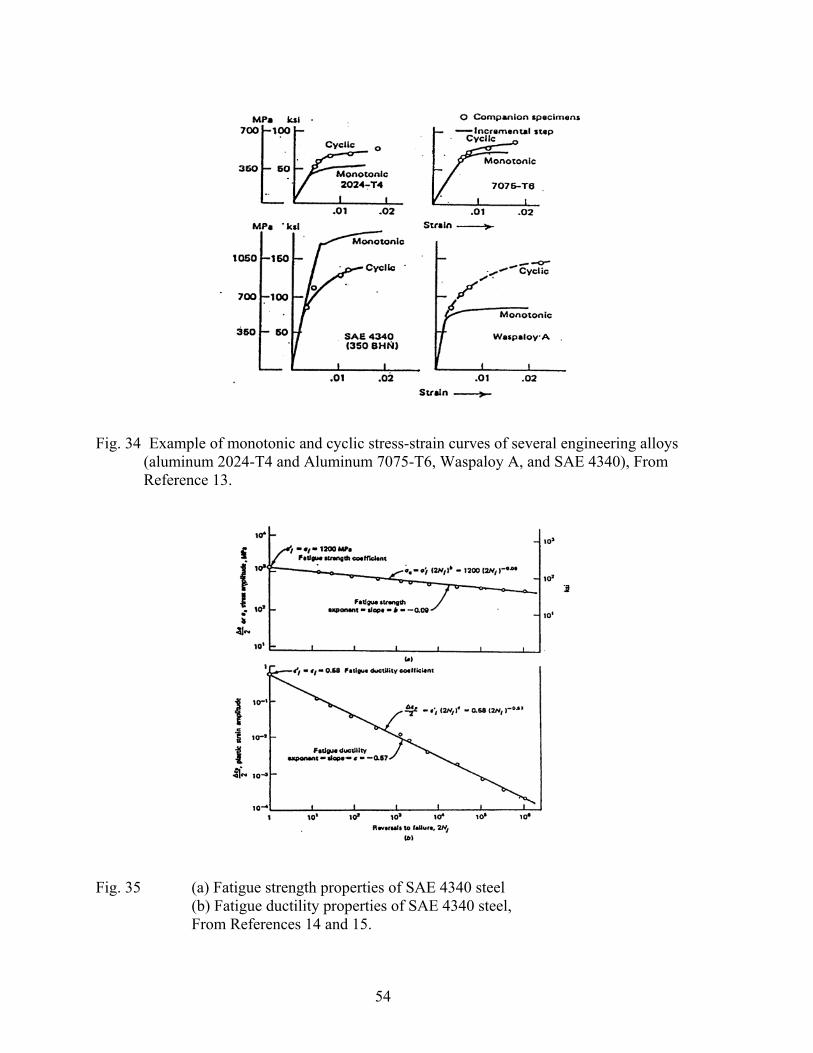
Fig. 34 Example of monotonic and cyclic stress-strain curves of several engineering alloys
(aluminum 2024-T4 and Aluminum 7075-T6, Waspaloy A, and SAE 4340), From Reference 13.
Fig. 35 (a) Fatigue strength properties of SAE 4340 steel (b) Fatigue ductility properties of SAE 4340 steel, From References 14 and 15.
54
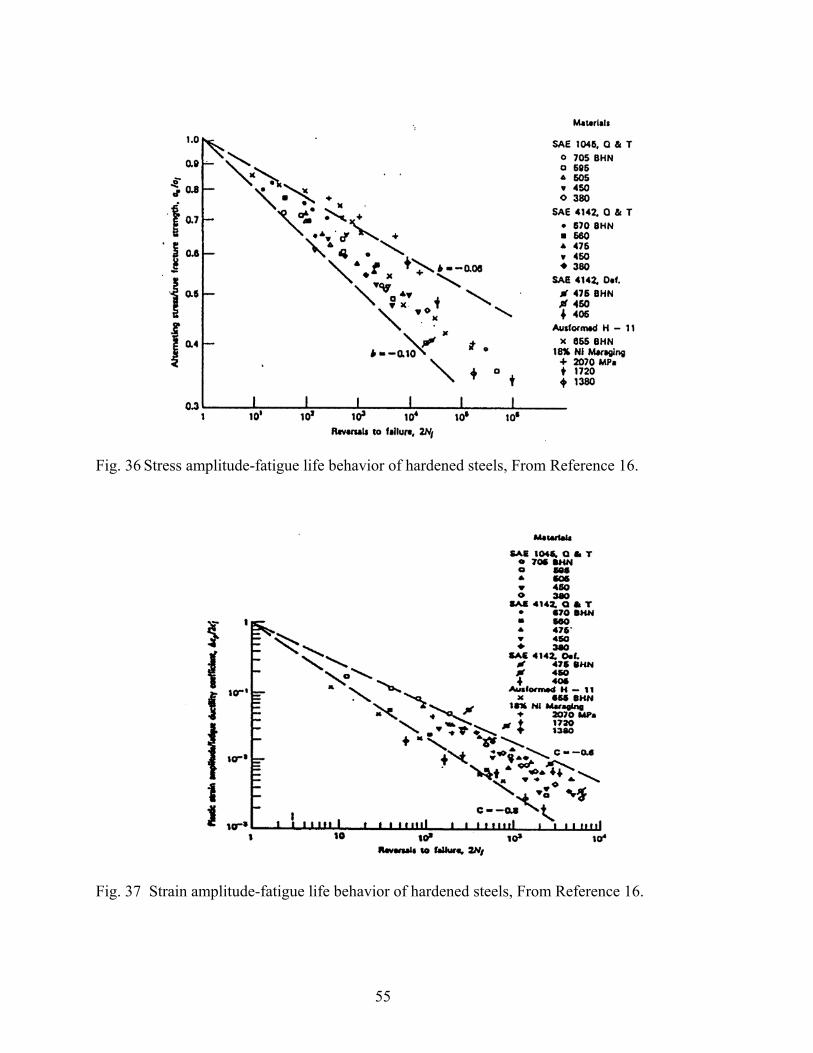
Fig. 36 Stress amplitude-fatigue life behavior of hardened steels, From Reference 16.
Fig. 37 Strain amplitude-fatigue life behavior of hardened steels, From Reference 16.
55
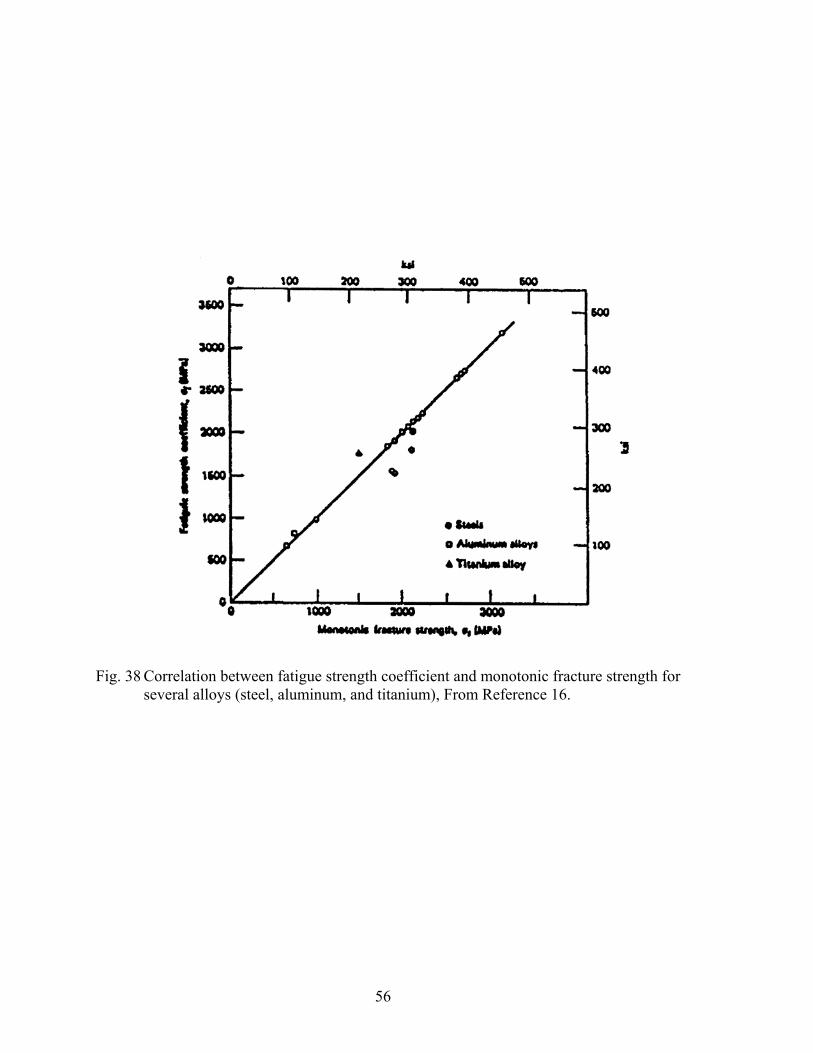
Fig. 38 Correlation between fatigue strength coefficient and monotonic fracture strength for
several alloys (steel, aluminum, and titanium), From Reference 16.
56
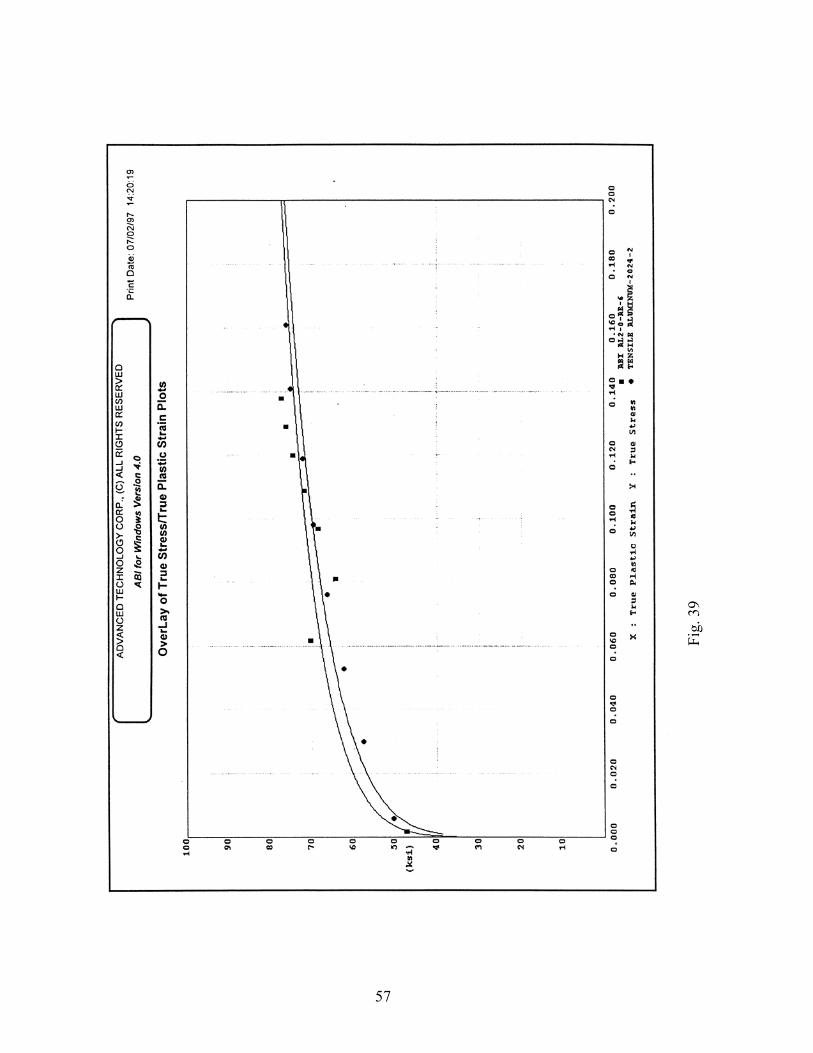
Fig.
39
57
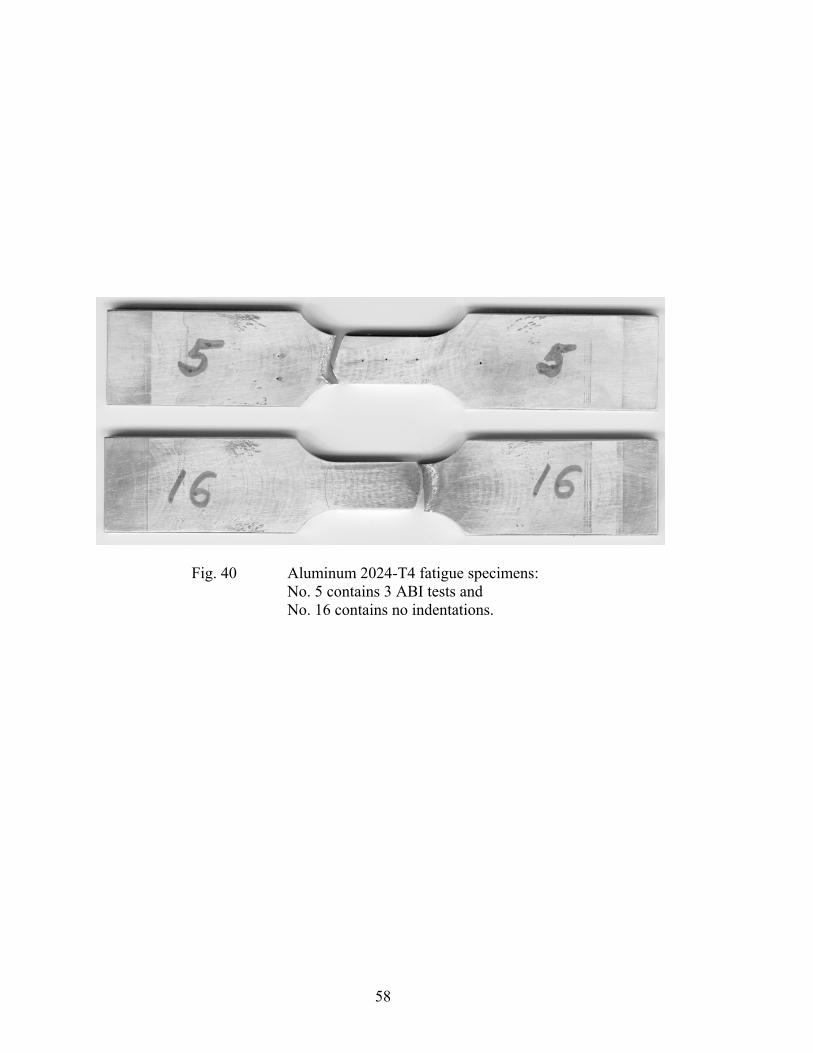
Fig. 40 Aluminum 2024-T4 fatigue specimens: No. 5 contains 3 ABI tests and No. 16 contains no indentations.
58
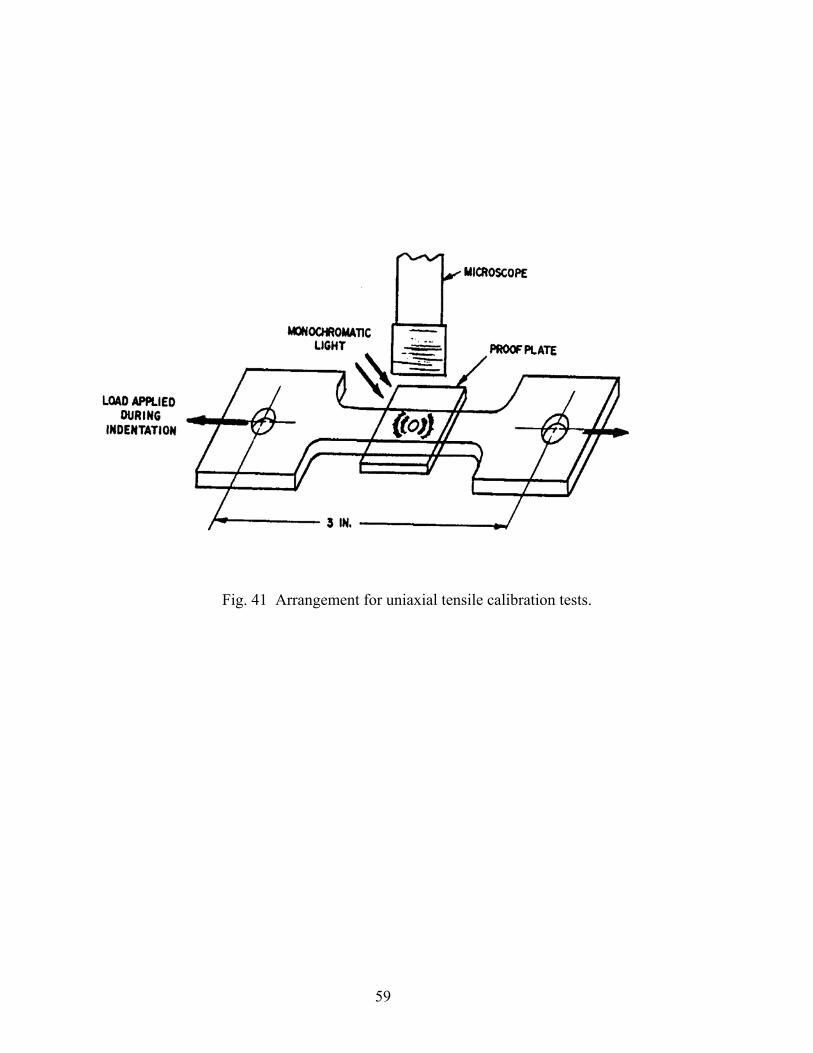
Fig. 41 Arrangement for uniaxial tensile calibration tests.
59
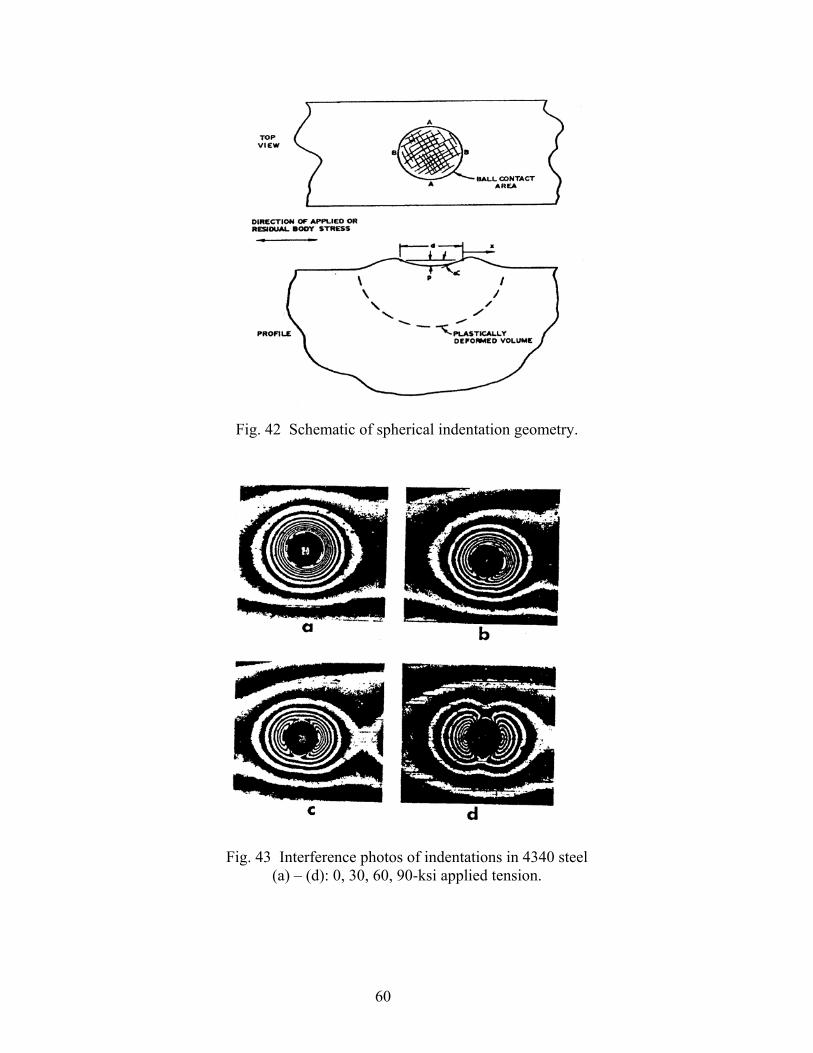
Fig. 42 Schematic of spherical indentation geometry.
Fig. 43 Interference photos of indentations in 4340 steel
(a) – (d): 0, 30, 60, 90-ksi applied tension.
60
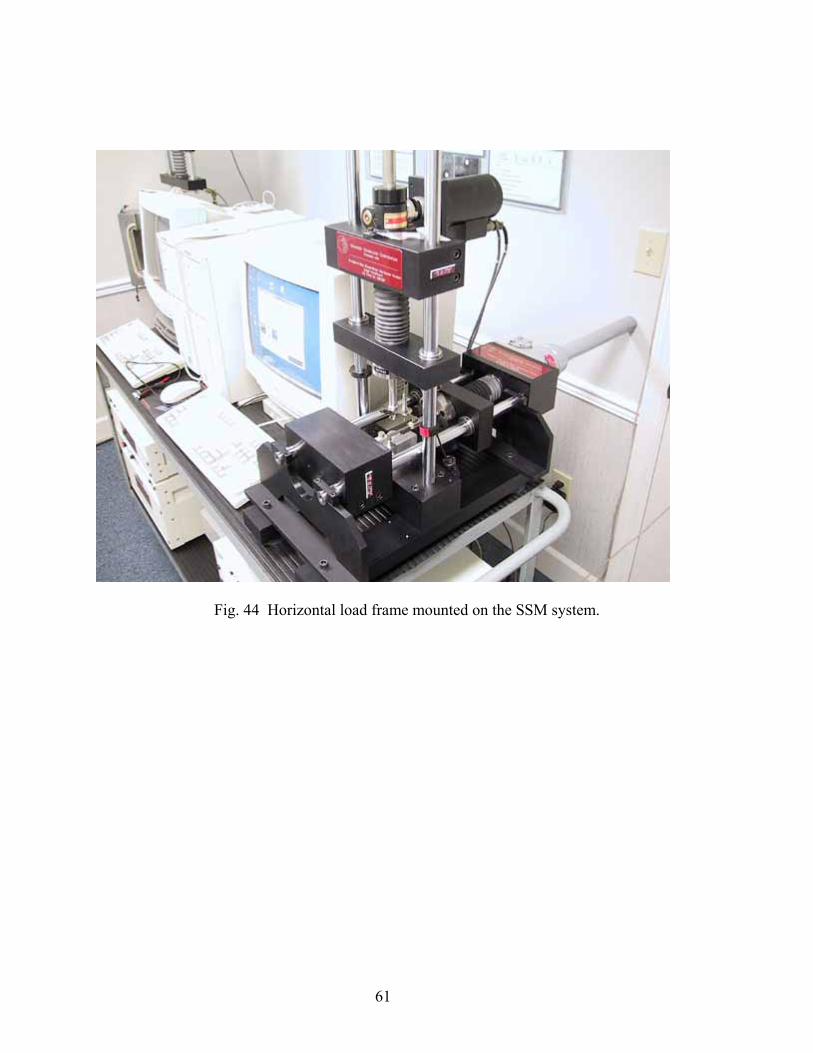
Fig. 44 Horizontal load frame mounted on the SSM system.
61
62
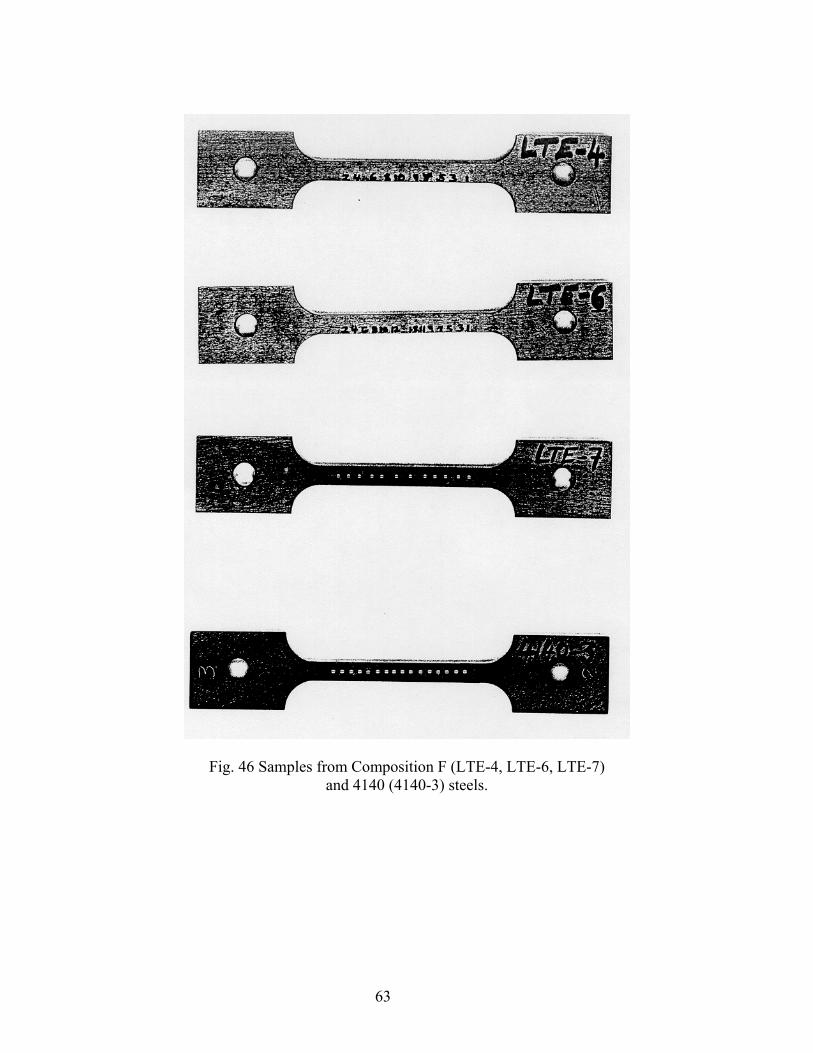
Fig. 46 Samples from Composition F (LTE-4, LTE-6, LTE-7) and 4140 (4140-3) steels.
63
64
Fig.
47
Com
paris
on b
etw
een
stre
ss-s
train
cur
ves f
rom
bot
h A
BI a
nd te
nsile
test
s on
com
posi
tion
“F”
stee
l (sa
mpl
e no
. LTE
-1).
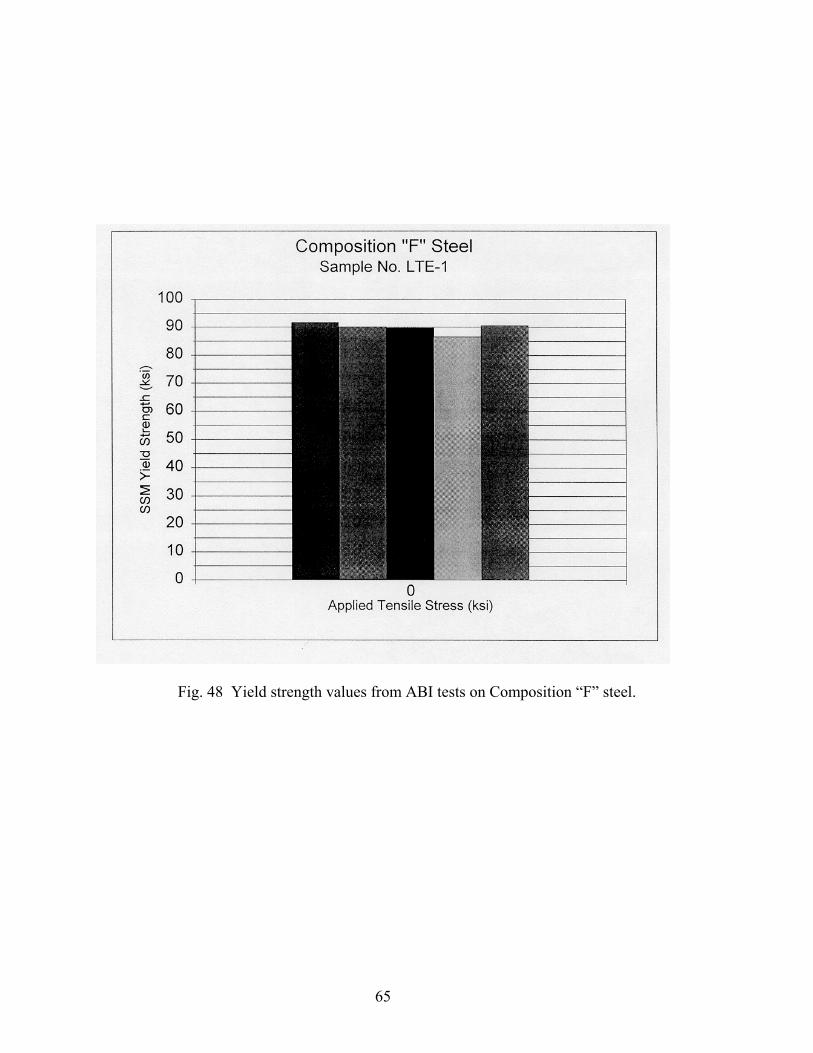
Fig. 48 Yield strength values from ABI tests on Composition “F” steel.
65
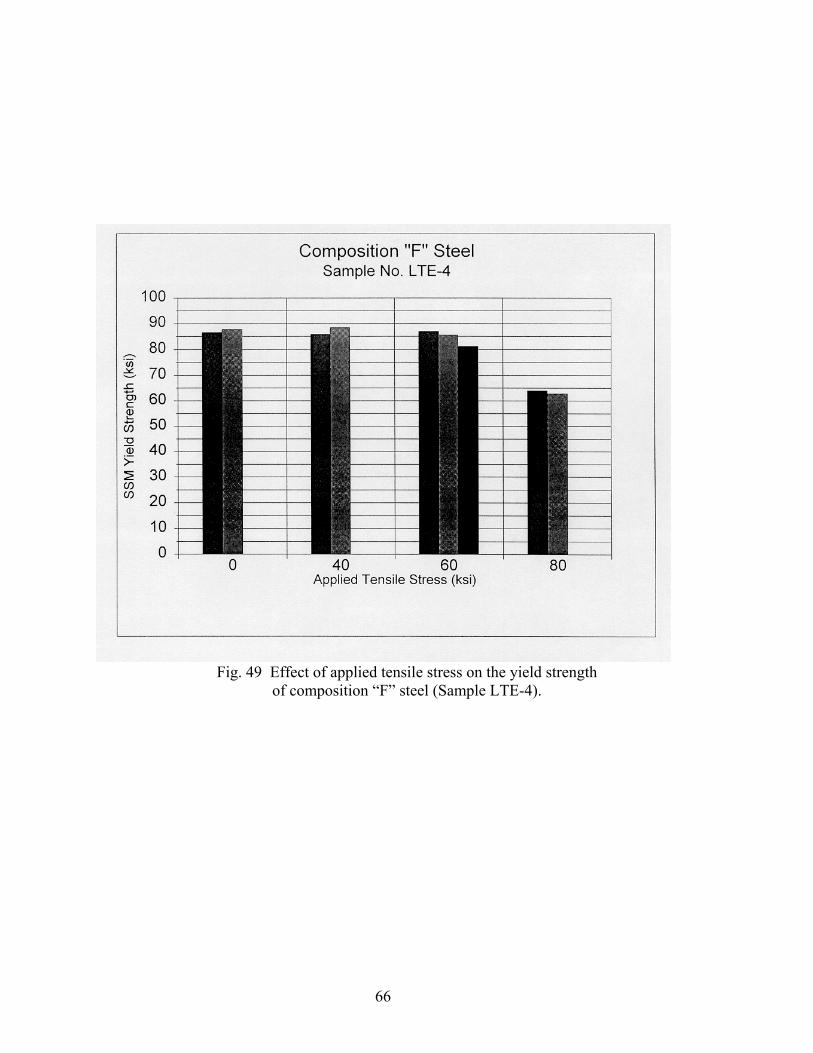
Fig. 49 Effect of applied tensile stress on the yield strength
of composition “F” steel (Sample LTE-4).
66
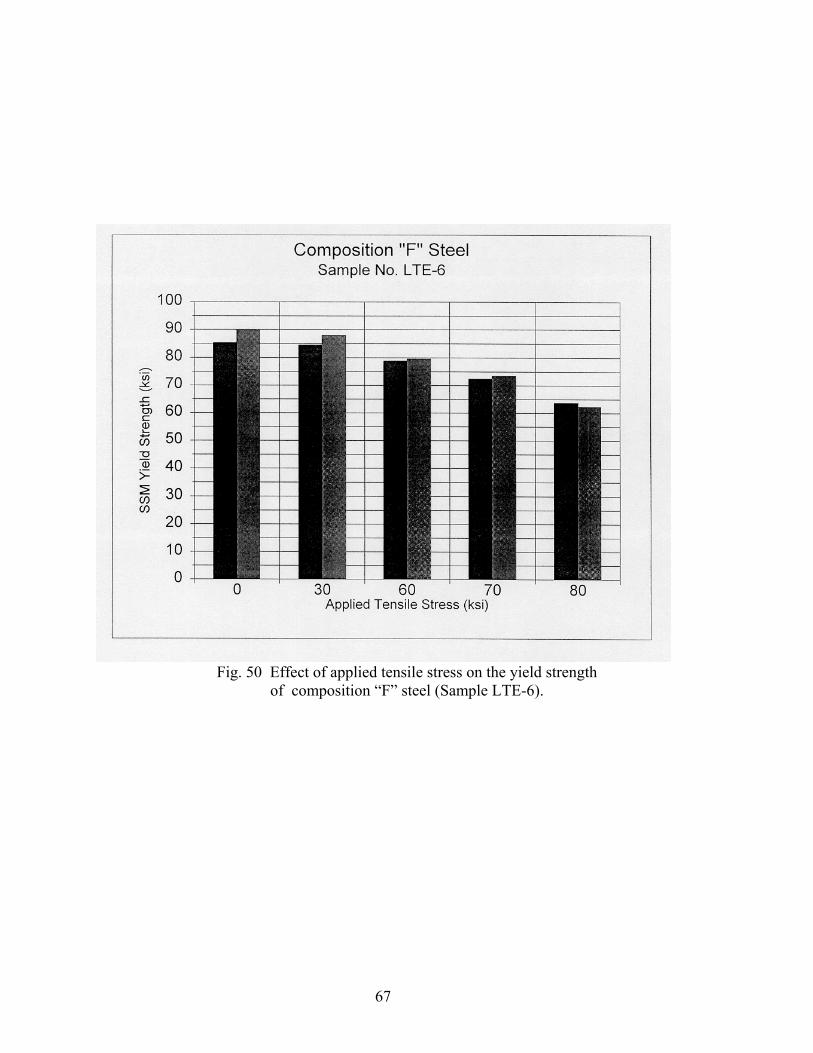
Fig. 50 Effect of applied tensile stress on the yield strength
of composition “F” steel (Sample LTE-6).
67
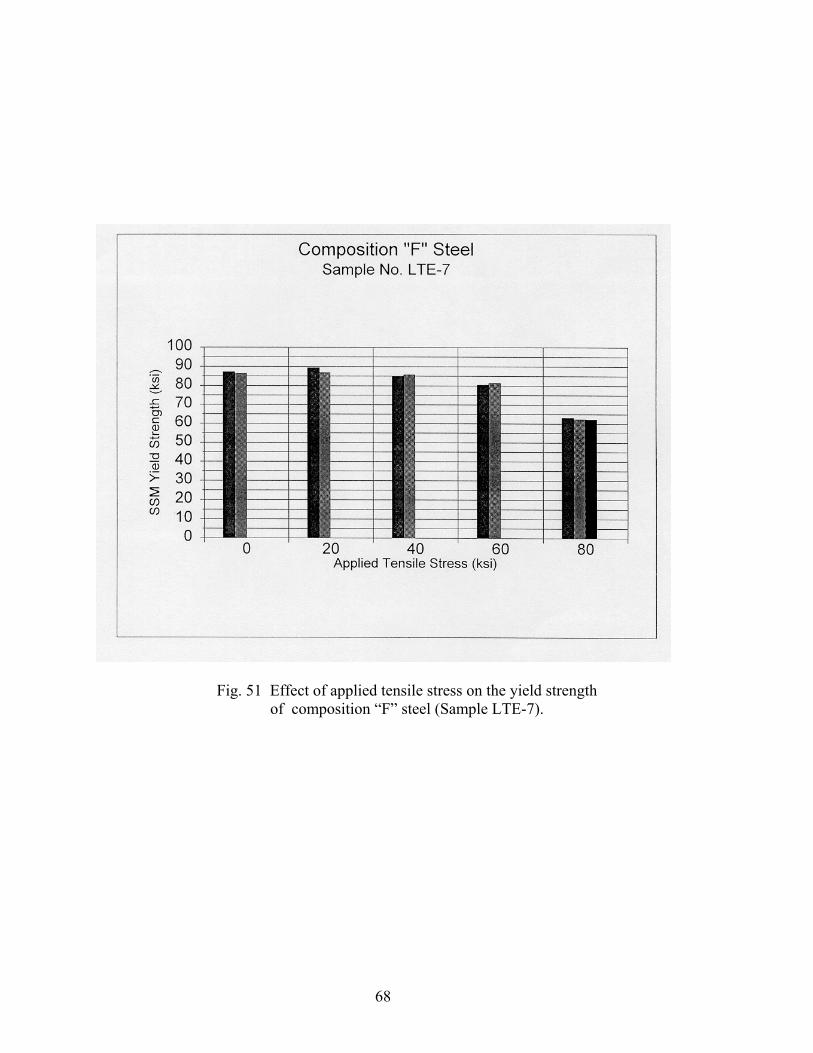
Fig. 51 Effect of applied tensile stress on the yield strength of composition “F” steel (Sample LTE-7).
68
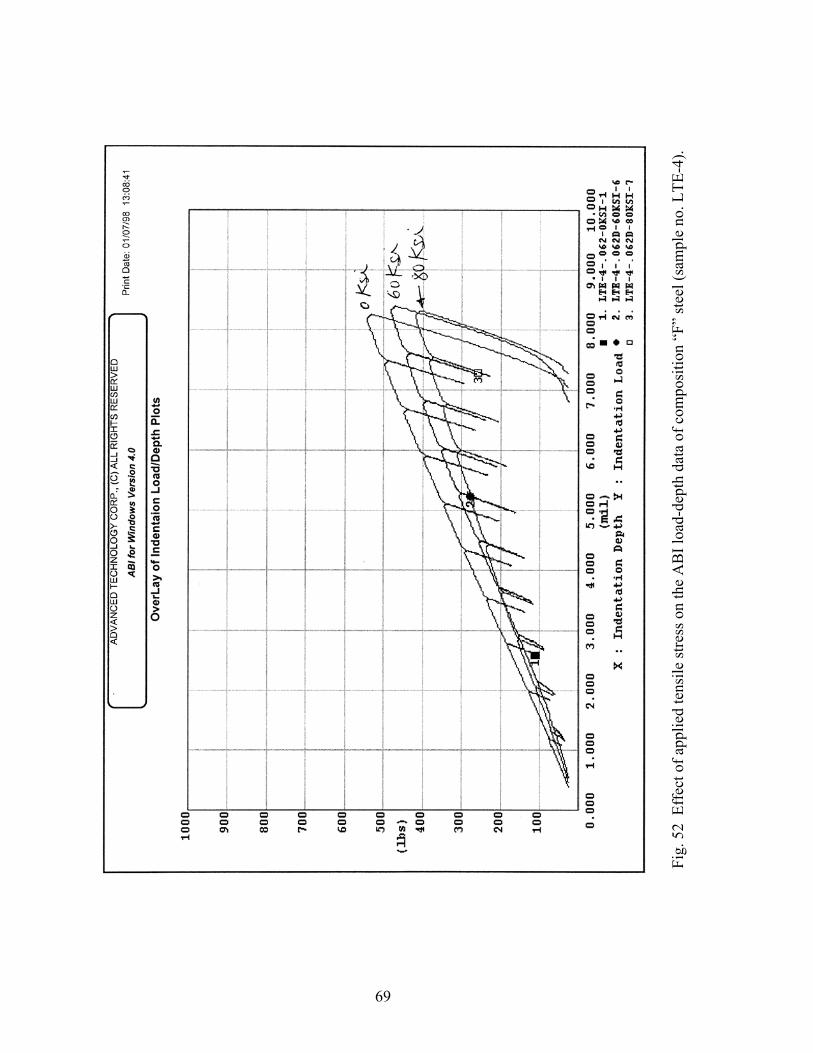
Fig.
52
Eff
ect o
f app
lied
tens
ile st
ress
on
the
AB
I loa
d-de
pth
data
of c
ompo
sitio
n “F
” st
eel (
sam
ple
no. L
TE-4
).
69
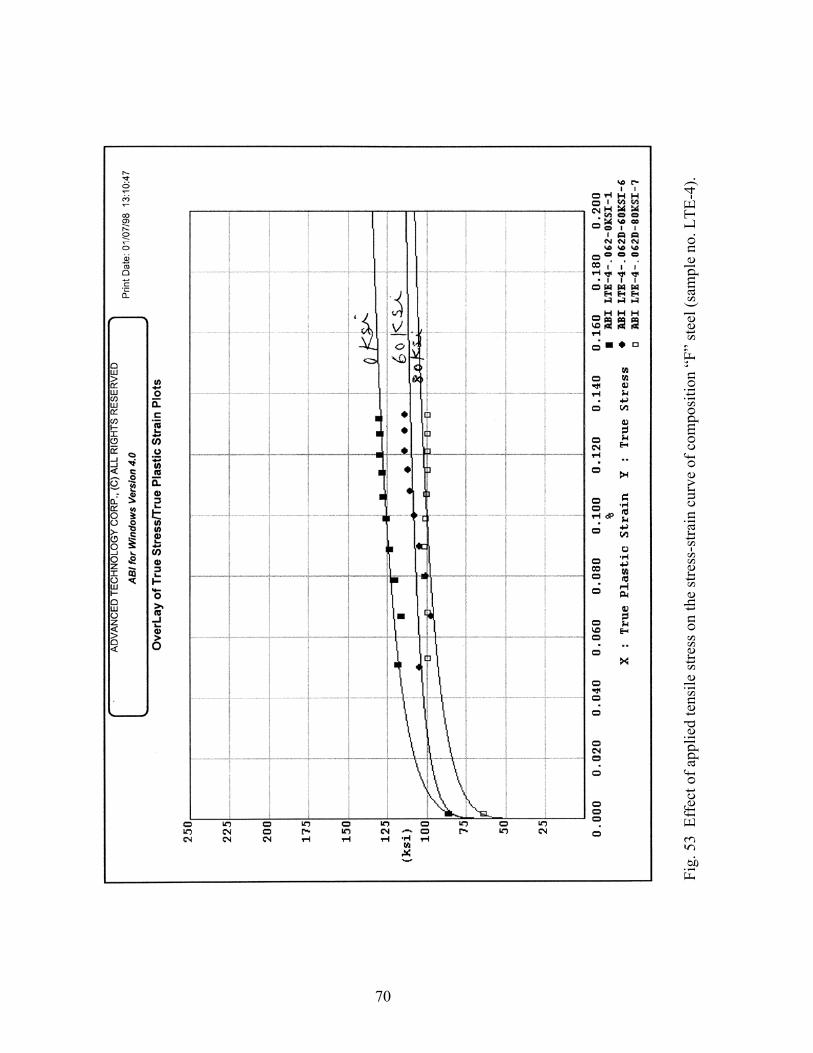
Fig.
53
Eff
ect o
f app
lied
tens
ile st
ress
on
the
stre
ss-s
train
cur
ve o
f com
posi
tion
“F”
stee
l (sa
mpl
e no
. LTE
-4).
70
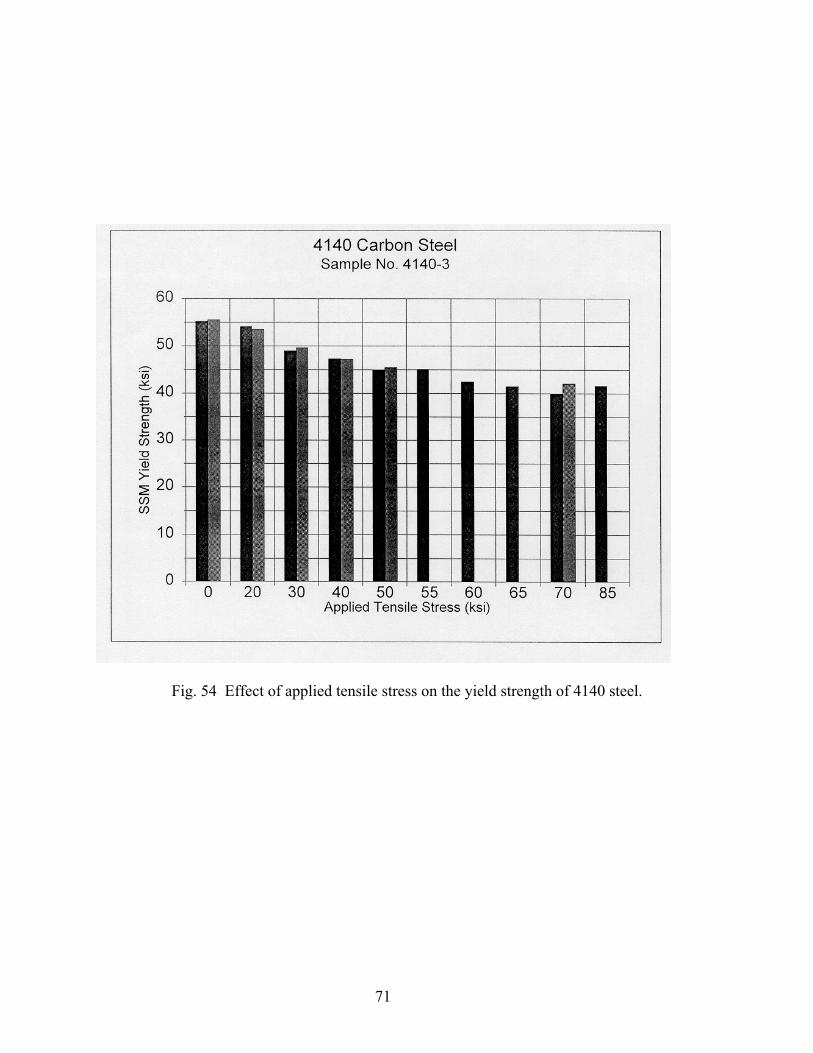
Fig. 54 Effect of applied tensile stress on the yield strength of 4140 steel.
71
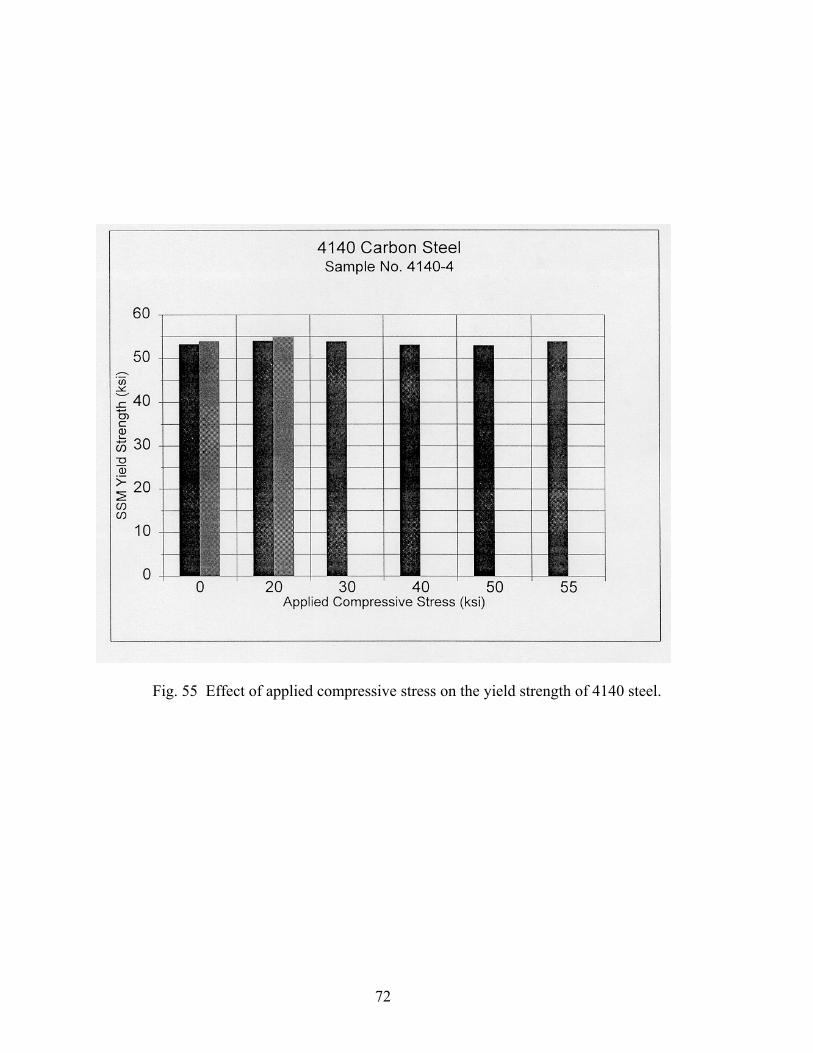
Fig. 55 Effect of applied compressive stress on the yield strength of 4140 steel.
72
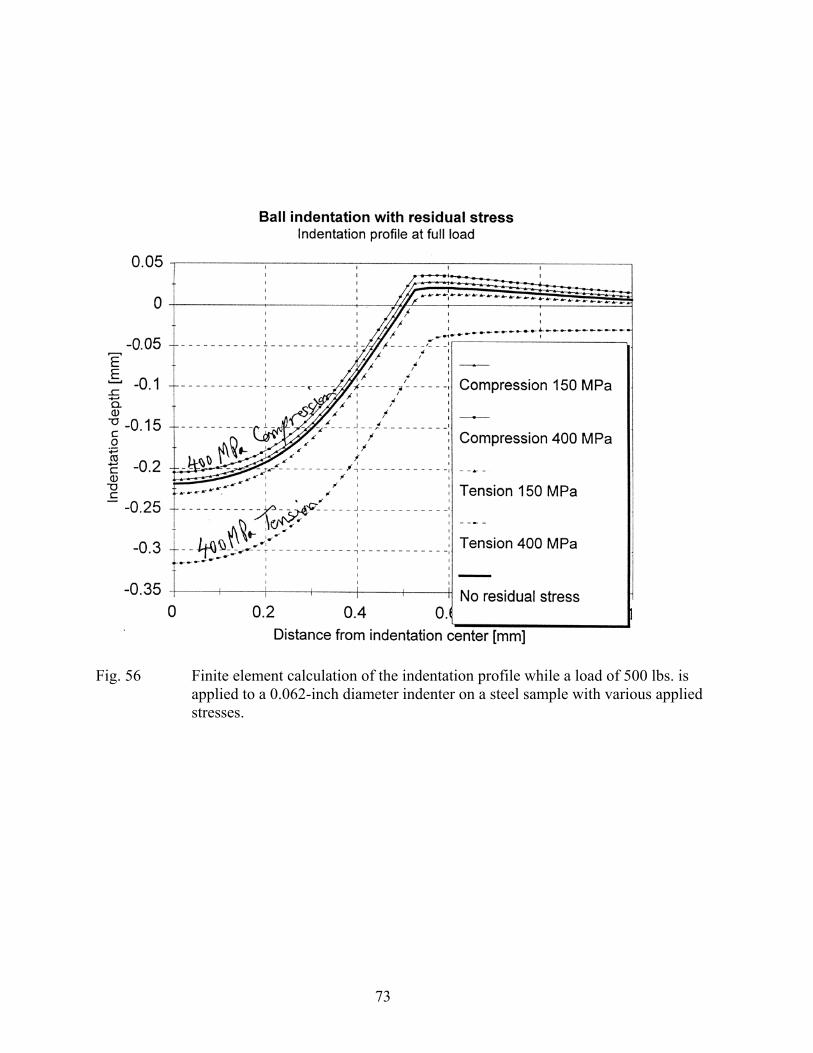
Fig. 56 Finite element calculation of the indentation profile while a load of 500 lbs. is
applied to a 0.062-inch diameter indenter on a steel sample with various applied stresses.
73
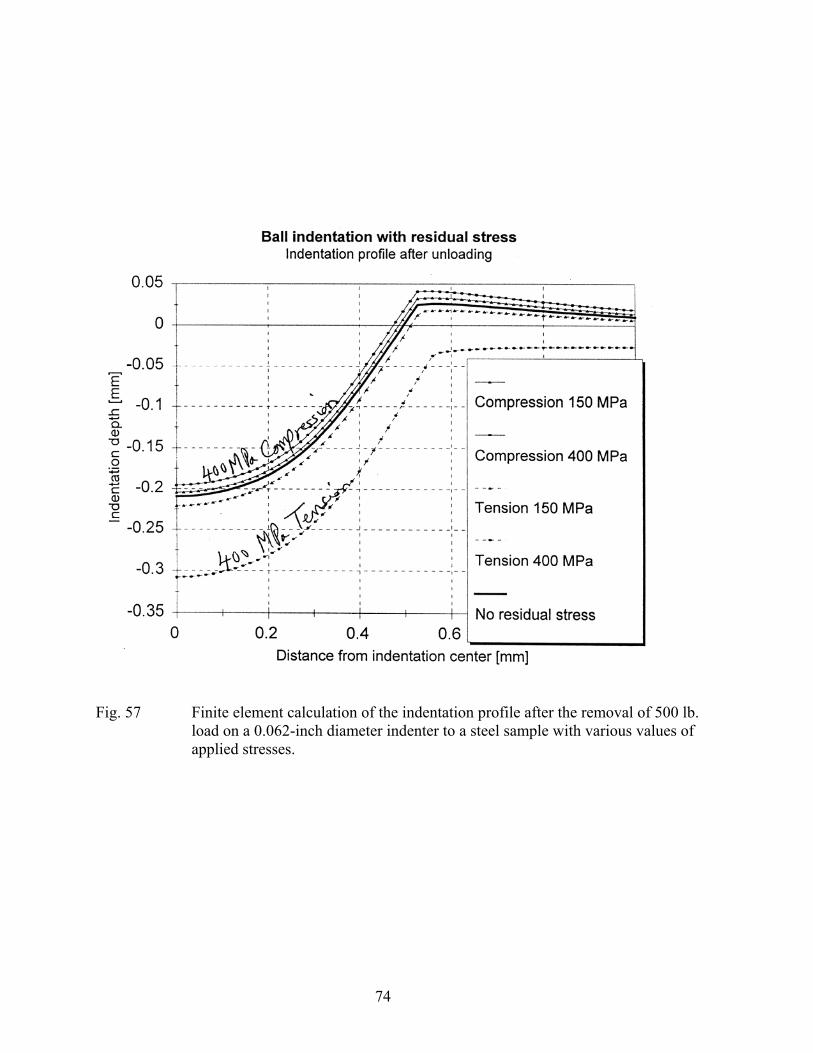
Fig. 57 Finite element calculation of the indentation profile after the removal of 500 lb.
load on a 0.062-inch diameter indenter to a steel sample with various values of applied stresses.
74