Embed Size (px)
Citation preview

APPROVED: Richard Fossey, Major Professor Jimmy Byrd, Committee Member Jon Young, Minor Professor Johnetta Hudson, Program Coordinator Mary McDonnell Harris, Interim Chair of the
Department of Teacher Education and Administration
M. Jean Keller, Dean of the College of Education
Sandra L. Terrell, Dean of the Robert B. Toulouse School of Graduate Studies
COMPUTER-ASSISTED INSTRUCTION IN LITERACY SKILLS FOR KINDERGARTEN
STUDENTS AND PERCEPTIONS OF ADMINISTRATORS AND TEACHERS
Susan Hatlestad Larson, BA, MEd
Dissertation Prepared for the Degree of
DOCTOR OF EDUCATION
UNIVERSITY OF NORTH TEXAS
May 2007

Larson, Susan Hatlestad, Computer-assisted instruction in literacy skills for
kindergarten students and perceptions of administrators and teachers. Doctor of
Education (Educational Administration), May 2007, 155 pp., 86 tables, references, 37
titles.
The perceptions of administrators and teachers of a computer-assisted
instructional program in literacy skills were collected by a survey. The survey
participants were kindergarten teachers and administrators from four elementary
schools in the same, fast-growing, suburban school district in Texas.
Literacy assessments were given to all kindergarten students in the district in the
fall, winter, and spring of the 2005-2006 school year. This study included a quasi-
experimental research design to determine if students using the computer-assisted
instructional program improved more on the district literacy assessments than students
who did not use the program. The treatment group members were the 449 kindergarten
students of the survey participants. The treatment group worked in The Imagination
Station program for a nine-week trial period. The control group members were 1385
kindergarten students from thirteen other schools in the same school district.
The study found that teachers and administrators perceived that their students’
improvement in literacy skills after using the program was good. The quasi-
experimental portion of the study found that there was a statistical difference between
the treatment and control groups on the composite literacy assessment score. The
group membership variable could explain 1.4% of the variance in the students’ literacy
assessment scores. Based on the small effect size, there was no practical difference
between the groups.

ii
Copyright 2007
by
Susan Hatlestad Larson

iii
TABLE OF CONTENTS
Page
LIST OF TABLES..........................................................................................................vi Chapter
1. INTRODUCTION ..................................................................................... 1 Purpose Background
Influence of External Factors Influence of Internal Factors
Problem Statement Research Questions Professional Significance
Why Study is Valuable Professional Value
Overview of Methodology Delimitations of the Study Definitions of Key Terms
2. REVIEW OF THE LITERATURE ........................................................... 16
Search Process Theoretical Literature and Conceptual Framework Empirical Research on Computer-Assisted Instruction
Support for Computer-Assisted Instruction Non-Support for Computer-Assisted Instruction
The Imagination Station Conclusions
3. METHODOLOGY .................................................................................. 42
The General Perspective The Research Context The Research Participants Instruments Used in Data Collection

iv
Survey Literacy Assessments
Procedures Used Data Analysis
Survey Literacy Assessments
Summary of Methodology 4. RESULTS .............................................................................................. 56
Survey Results Letter Identification Letter Sound Identification Concepts about Print Phonemic Awareness Diagnostic Reading Assessments Frequency of Use Student Reports and Books in Print User Friendliness Imagination Station Training and Computer Skills Demographics of Survey Participants
Literacy Assessment Results Univariate Results Bivariate Results Multivariate Results
5. SUMMARY .......................................................................................... 124
Survey and Descriptive Research Literacy Assessments Frequency of Sessions Use of Student Progress Reports and Print Copies of Books User Friendliness Imagination Station Training and Computer Skills Demographics of Survey Participants
Literacy Assessments and Quasi-Experimental Research

v
Recommendations for Further Research Length of Study Design of Descriptive Study Design of Quasi-Experimental Study
Conclusions APPENDICES ........................................................................................................... 144 REFERENCES.......................................................................................................... 153
vi
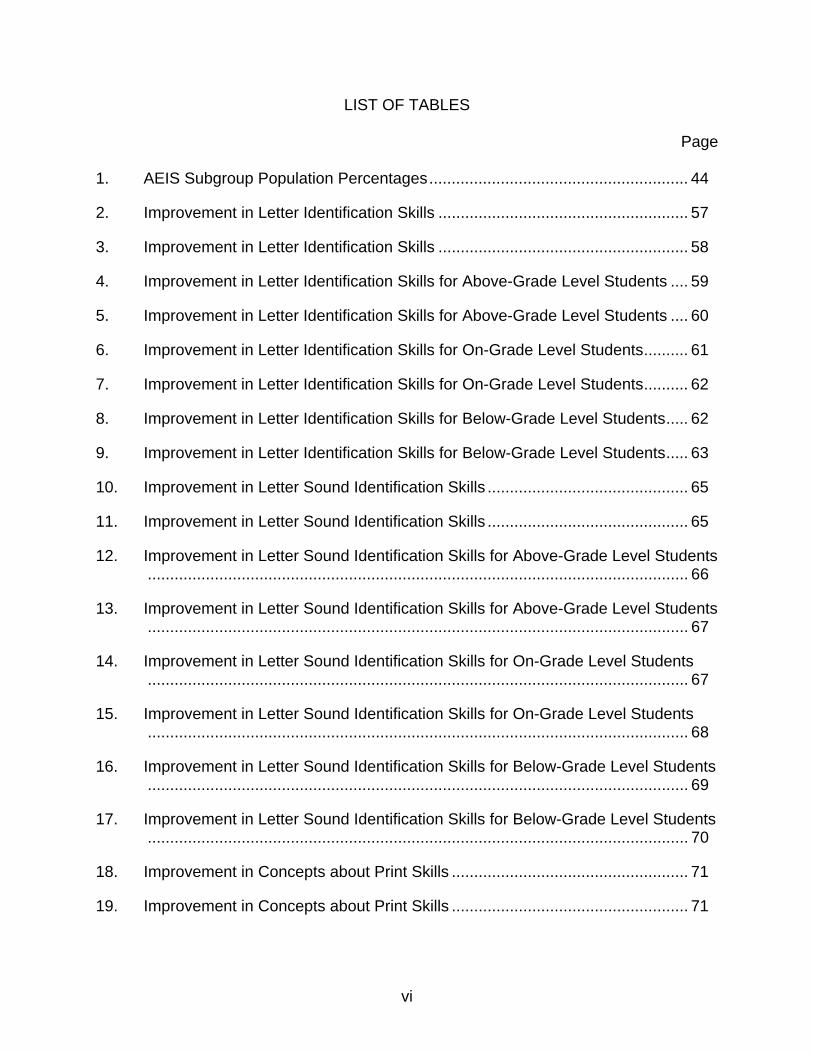
LIST OF TABLES
Page
1. AEIS Subgroup Population Percentages.......................................................... 44
2. Improvement in Letter Identification Skills ........................................................ 57
3. Improvement in Letter Identification Skills ........................................................ 58
4. Improvement in Letter Identification Skills for Above-Grade Level Students .... 59
5. Improvement in Letter Identification Skills for Above-Grade Level Students .... 60
6. Improvement in Letter Identification Skills for On-Grade Level Students.......... 61
7. Improvement in Letter Identification Skills for On-Grade Level Students.......... 62
8. Improvement in Letter Identification Skills for Below-Grade Level Students..... 62
9. Improvement in Letter Identification Skills for Below-Grade Level Students..... 63
10. Improvement in Letter Sound Identification Skills ............................................. 65
11. Improvement in Letter Sound Identification Skills ............................................. 65
12. Improvement in Letter Sound Identification Skills for Above-Grade Level Students......................................................................................................................... 66
13. Improvement in Letter Sound Identification Skills for Above-Grade Level Students......................................................................................................................... 67
14. Improvement in Letter Sound Identification Skills for On-Grade Level Students ......................................................................................................................... 67
15. Improvement in Letter Sound Identification Skills for On-Grade Level Students ......................................................................................................................... 68
16. Improvement in Letter Sound Identification Skills for Below-Grade Level Students......................................................................................................................... 69
17. Improvement in Letter Sound Identification Skills for Below-Grade Level Students......................................................................................................................... 70
18. Improvement in Concepts about Print Skills ..................................................... 71
19. Improvement in Concepts about Print Skills ..................................................... 71

vii
20. Improvement in Concepts about Print Skills for Above-Grade Level Students ......................................................................................................................... 72
21. Improvement in Concepts about Print Skills for Above-Grade Level Students ......................................................................................................................... 73
22. Improvement in Concepts about Print Skills for On-Grade Level Students ...... 73
23. Improvement in Concepts about Print Skills for On-Grade Level Students ...... 74
24. Improvement in Concepts about Print Skills for Below-Grade Level Students ......................................................................................................................... 75
25. Improvement in Concepts about Print Skills for Below-Grade Level Student ... 75
26. Improvement in Phonemic Awareness Skills .................................................... 76
27. Improvement in Phonemic Awareness Skills .................................................... 77
28. Improvement in Phonemic Awareness Skills for Above-Grade Level Students ......................................................................................................................... 78
29. Improvement in Phonemic Awareness Skills for Above-Grade Level Students ......................................................................................................................... 78
30. Improvement in Phonemic Awareness Skills for On-Grade Level Students ..... 79
31. Improvement in Phonemic Awareness Skills for On-Grade Level Students ..... 80
32. Improvement in Phonemic Awareness Skills for Below-Grade Level Students ......................................................................................................................... 80
33. Improvement in Phonemic Awareness Skills for Below-Grade Level Students ......................................................................................................................... 81
34. Improvement in Diagnostic Reading Assessments........................................... 82
35. Improvement in Diagnostic Reading Assessments........................................... 83
36. Improvement in Diagnostic Reading Assessments for Above-Grade Level Students ........................................................................................................... 83
37. Improvement in Diagnostic Reading Assessments for Above-Grade Level Students ........................................................................................................... 84
38. Improvement in Diagnostic Reading Assessments for On-Grade Level Students......................................................................................................................... 85

viii
39. Improvement in Diagnostic Reading Assessments for On-Grade Level Students......................................................................................................................... 86
40. Improvement in Diagnostic Reading Assessments for Below-Grade Level Students ........................................................................................................... 87
41. Improvement in Diagnostic Reading Assessments for Below-Grade Level Students ........................................................................................................... 87
42. Improvement in Literacy Skills of Students after Using The Imagination Station ......................................................................................................................... 88
43. Improvement in Literacy Skills of Students after Using The Imagination Station ......................................................................................................................... 89
44. Days per Week Students Used The Imagination Station.................................. 90
45. Days per Week Students Used The Imagination Station.................................. 91
46. Days per Week Above-Grade Level Students Used The Imagination Station ......................................................................................................................... 92
47. Days per Week Above-Grade Level Students Used The Imagination Station ......................................................................................................................... 93
48. Days per Week On-Grade Level Students Used The Imagination Station ....... 93
49. Days per Week On-Grade Level Students Used The Imagination Station ....... 94
50. Days per Week Below-Grade Level Students Used The Imagination Station ......................................................................................................................... 94
51. Days per Week Below-Grade Level Students Used The Imagination Station ......................................................................................................................... 95
52. Days per Week of Printing Student Reports ..................................................... 96
53. Days per Week of Printing Student Reports ..................................................... 97
54. Days per Week of Using Student Reports to Guide Instruction ........................ 98
55. Days per Week of Using Student Reports to Guide Instruction ........................ 98
56. Days per Week of Printing Books ..................................................................... 99
57. Days per Week of Printing Books ..................................................................... 99
58. Frequency of Using Books Printed from The Imagination Station .................. 100

ix
59. Frequency of Using Books Printed from The Imagination Station .................. 100
60. Amount of Time that Students Were Eager to Use The Imagination Station ....................................................................................................................... 101
61. Amount of Time that Students Were Eager to Use The Imagination Station ....................................................................................................................... 102
62. Independent Student Use of The Imagination Station .................................... 102
63. Independent Student Use of The Imagination Station .................................... 103
64. Teacher Ease of Use of The Imagination Station ........................................... 103
65. Teacher Ease of Use of The Imagination Station ........................................... 104
66. Imagination Station Training Was Beneficial .................................................. 105
67. Imagination Station Training Was Beneficial .................................................. 105
68. Sufficient Personal Computer Skills of Teacher to Use Program.................... 106
69. Sufficient Personal Computer Skills of Teacher to Use Program.................... 107
70. Sufficient Personal Computer Skills of Students to Use Program................... 107
71. Sufficient Personal Computer Skills of Students to Use Program................... 108
72. Participants Self Evaluation of Personal Computer Skills............................... 108
73. Participants Self Evaluation of Personal Computer Skills............................... 109
74. Evaluation of Students’ Personal Computer Skills.......................................... 110
75. Evaluation of Students’ Personal Computer Skills.......................................... 110
76. Participants from Each Pilot Program School ................................................. 111
77. Years of Teaching Experience........................................................................ 112
78. Age of Participants ......................................................................................... 113
79. Means of Average z Scores by School........................................................... 115
80. Means of Average z Score by Group.............................................................. 119
81. Within Subject Factors (Assessments) ........................................................... 120
82. Between-Subjects Factors (Treatment Group=1, Control Group=2)............... 120

x
83. Average z Score Means by Group.................................................................. 121
84. Estimated Marginal Means for Assessments.................................................. 122
85. Estimated Marginal Means for Groups ........................................................... 122
86. Between Subject Factors Test of Significance (Treatment and Control Groups)....................................................................................................................... 123
B1 Fall Literacy Assessments.............................................................................. 151
B2 Winter Literacy Assessments ......................................................................... 151
B3 Spring Literacy Assessments ......................................................................... 152
B4 Levene's Test of Equality of Error Variances.................................................. 152

1
CHAPTER 1
INTRODUCTION
Computer-assisted instruction (CAI) is being used to teach a variety of skills and
subjects within the school setting. This study utilized The Imagination Station® Internet-
based supplemental reading instruction and intervention program (Imagination Station,
Inc., Richardson TX, www1.istation.com). This is computer-assisted instructional
program, designed to teach literacy and reading skills to pre-kindergarten through third
grade students.
Purpose
One purpose of the study was to determine the perceptions of teachers and
administrators regarding the use of CAI to teach literacy skills to kindergarten students
who used The Imagination Station program. A second purpose of the study was to find
if there was significant improvement in literacy assessment scores for kindergarten
students who used CAI compared with students who did not use CAI. The third
purpose of the study was to compare teacher and administrator perceptions with the
students’ actual improvement in literacy and reading skills.
Background
Influence of External Factors
Instructional software is aggressively marketed and touted in advertisements as
being a means of increasing student achievement. Manufacturers promise remarkable
results when their instructional software is used in a school setting. Increased use of

2
technology in instruction is a growing trend in public schools. School administrators and
teachers need to have researched based information that will enable them to make
appropriate decisions about the use of (CAI). School personnel will want instructional
software that integrates best instructional practices with up to date technologies to
enable students to master learning objectives.
Best instructional practices in literacy and reading include (a) phonemic
awareness instruction, (b) phonics instruction, (c) fluency instruction, (d) vocabulary
instruction, and (e) text comprehension instruction (Armbruster, Lehr, and Osborn,
2001). The National Reading Panel (2000) found that guided oral reading is an
effective method of incorporating all of these best practices in reading instruction. The
panel also found that although increased independent, silent reading correlated with
higher reading achievement, there is not evidence to support that it is the cause of
higher reading achievement. Struggling readers need feedback to improve. Intuitively,
CAI programs that give students immediate feedback would be more helpful to
struggling readers than silent, sustained reading.
CAI cannot be evaluated independently from the instructional content within the
program and CAI is not a teaching method (The National Reading Panel, 2000).
Therefore, this study evaluated 1 software package to determine the opinions of
administrators and teachers about the effects of CAI on literacy skills and reading
achievement and how that program affected student achievement. Allington (2002)
states that “Good teachers, effective teachers, manage to produce better achievement
regardless of which curriculum materials, pedagogical approach, or reading program is

3
selected” (p. 1). However, in addition to a highly qualified teacher, a CAI program could
reinforce, supplement, and enhance direct instruction by the teacher.
Reading software packages are being developed that incorporate best
instructional practices in the reading field. It is important that these best instructional
practices are appropriately integrated with the computer application. Rings, 1994, found
that the CAI programs that successfully foster critical reading skills are those that
combine high levels of interactivity with encouraging the use of reading strategies most
often used by effective readers. Rings also identified the capacity to read in a real
context, as another aspect of CAI programs that contribute to the development of critical
reading skills. Some CAI programs include the capability to print hard copies of the
reading materials. Students are then able to bring home copies of what they are
reading in CAI so they can also read to their parents. At the same time, students can
use the hard copies of CAI materials to read directly to their teacher.
CAI is not meant to replace a reading teacher. CAI can provide the opportunity
for a student to work at his or her own pace. CAI is effective at providing practice in
skills in which a student may be weak. Some CAI software packages provide feedback
to the teacher in the form of reports on individual students. The reading teacher is then
able to focus on areas identified by the computer program in which the student needs
additional instruction or re-teaching. The ability to print hard copies of all reading
materials and have the opportunity to read in a real context is a major asset of The
Imagination Station software.
The scope and sequence of any instructional program is an essential element in
determining its success. Students must be able to build on previous knowledge and

4
skills as they move on to new objectives in a logical sequence. There are instructional
programs that have been developed that have a logical scope and sequence built into
the instruction. Ediger (1998) distinguished between logical and psychological
sequence. In a psychological sequence, a learner orders his or her own activities to
meet his or her own individual learning needs. A logical sequence is ordered by the
teacher, or curriculum document, to best meet the needs of the majority of students. A
CAI program that combines both a logical and psychological sequence would be
preferable to a program that consists of learning activities in lock-step order that must
be mastered before the student is allowed to move on to the next learning activity. The
Imagination Station is an internet-based, CAI program that allows for an individualized
approach to learning by creating varied and alternative pathways in the instructional
sequence. The inclusion of a psychological sequence, within the logical sequence
inherent in The Imagination Station, gives this CAI program the ability to individualize
student learning.
Influence of Internal Factors
Problems that surface in schools are the availability of computer software and
hardware to make CAI possible. Most educators acknowledge the current crisis in
school finance. Funding for computer hardware and software may be an issue over
which schools have little control.
How technology is utilized in instructional settings may be determined by the
friendliness of a particular software package toward teachers and students. Whether or
not an instructional program is purchased may depend on pricing and value. How
5
software is used, and if it is used at all, is determined by the teacher in the classroom or
computer lab.
The school culture and its support of technology will have a significant influence
on the success of CAI. The principal must support a program of computer-assisted
instruction in reading if it is to become a reality in a school. The principal may make
budgetary decisions in isolation for his or her campus. The school district’s leadership
must also be supportive of CAI by purchasing computer hardware and software for the
schools. The allocation of resources determines the feasibility of augmenting reading
instruction with computer software programs in reading.
In the district in which this study was carried out, Title I schools receive additional
funds for reading improvement. Resources beyond the standard per pupil allotment are
allocated to the schools with the most students needing remediation. With finite,
financial resources, district decision makers need evidence of the value of a particular
instructional reading software package before purchasing it.
Some research studies have found CAI did not improve reading achievement
(Nauss, 2002; Campbell, 2000; Ritchie, 1999). It is important to know if a CAI program
in reading has a positive, significant impact on the reading achievement of all students
or just on a subgroup of students. This knowledge would allow decision makers to
purchase the CAI program specifically for the students it would benefit. It would not be
cost effective to purchase a program for students who did not need it. Knowing the
profile of a student who would benefit from a particular CAI program may allow a school
district to target individual students who would benefit from remediation through CAI.
The profile of students who would benefit from CAI would allow an at-risk student to

6
receive enhanced instruction with a CAI program in reading, even if the student
attended a school where the majority of students would not benefit from such an
intervention.
Teachers may embrace CAI or may fear it. If the CAI were to replace reading
specialists at a lower cost, then those groups of teachers may oppose it. Classroom
teachers may tend to view CAI more favorably because it would allow them to
individualize instruction for the many students in their classroom. Classroom teachers
do not have the luxury of working individually with every student on a daily basis for
reading instruction. Students could receive individualized instruction from a CAI
program even on days the teacher was unable to reach every student.
Problem Statement
Do teachers and administrators perceive that computer-assisted instruction using
The Imagination Station reading software improves the literacy skills of kindergarten
students? The null hypothesis is that teachers and administrators perceive that
computer-assisted instruction using The Imagination Station reading software does not
improve the literacy skills of kindergarten students.
Is there significant improvement in the literacy achievement scores for
kindergarten students who used The Imagination Station reading software compared
with kindergarten students who did not use the program? The null hypothesis is that
there is no significant improvement in the literacy achievement scores for kindergarten
students who used The Imagination Station reading software compared with students
who did not use the program.

7
Are teacher and administrator perceptions of CAI indicative of the success of the
software? Included in the summary, which is found in Chapter 5 of the study, is a
comparison of the perceptions of administrators and teachers of computer-assisted
instruction, using The Imagination Station, to the actual change in literacy assessment
scores made by students who used The Imagination Station. The perceptions of the
educators who used CAI with The Imagination Station program will be evaluated to see
if they correspond to the actual results of the statistical analysis of the change scores of
the treatment group compared to the change scores of the control group. The study will
address 7 research questions.
Research Questions
1. Do teachers and administrators perceive that computer-assisted instruction,
using The Imagination Station, improves the letter identification skills of
kindergarten students?
2. Do teachers and administrators perceive that computer-assisted instruction,
using The Imagination Station, improves the letter sound skills of kindergarten
students?
3. Do teachers and administrators perceive that computer-assisted instruction,
using The Imagination Station, improves the concepts about print (C.A.P.) skills
of kindergarten students?
4. Do teachers and administrators perceive that computer-assisted instruction,
using The Imagination Station, improves the phonemic awareness skills of
kindergarten students?

8
5. Do teachers and administrators perceive that computer-assisted instruction,
using The Imagination Station, improves the diagnostic reading assessment
(DRA) score of kindergarten students?
6. Do teachers and administrators perceive that computer-assisted instruction,
using The Imagination Station, improves the overall literacy skills of kindergarten
students?
7. Is there a significant difference in the improvement in literacy assessment scores
of kindergarten students who used The Imagination Station compared to the
improvement in literacy assessment scores of kindergarten students who did not
use The Imagination Station?
Professional Significance
Why Study is Valuable
An instructional reading software program of interest to this author is produced
by i-station incorporated. The National Reading Panel (2000) found that success in
phonological awareness and letter knowledge are 2 of the best predictors of success in
early reading. The Imagination Station is a program of particular interest to this
researcher because it teaches important literacy skills, including phonological
awareness and letter knowledge. There are fees for the training, which is required of
the teachers who implement the program with their students. When compared to the
allotted amount of money per pupil for instruction, the cost of this instructional software
would first appear to be prohibitive. However, if the instructional software allows at-risk
students to significantly increase their reading achievement, then the program could

9
prove to be extremely cost effective. The cost of specialized reading instruction, such
as Reading Recovery and dyslexia therapy, is thousands of dollars per year for each
student that is served through these programs. The expense to a school district of
retaining a student for an extra year of instruction is also thousands of dollars. If The
Imagination Station prevents the need for retention or specialized reading instruction,
then it would be cost effective. If The Imagination Station does not significantly improve
literacy skills, then it is a needless expense.
Professional Value
Computer-assisted instruction allows those who have learning differences to
learn at an individual pace. This may allow the at-risk reader to make adequate
individual progress and catch up to his or her peers. The analysis of the effectiveness
of an instructional software program is a critical responsibility of school officials who
make budgetary decisions. This study provides guidance to those responsible for the
instruction of students in deciding if the educational value of this program justifies the
cost of the software and the training.
Overview of Methodology
During the 2005-2006 school year, there were 18 elementary schools in the
suburban school district in which this research study took place. Data from the literacy
assessments of all kindergarten students in each of the district’s 18 elementary schools
were collected and analyzed. Four of the 18 elementary campuses participated in a
pilot study of The Imagination Station software with their kindergarten students. The

10
portion of this research study that involved teacher and administrator perceptions of CAI
in literacy skills for kindergarten students was conducted in those 4 schools using a
survey as the data collection instrument. The administrators and teachers in the 4
schools who gave consent to be participants in the study had the use of The
Imagination Station with their kindergarten students for 10 weeks. The students utilized
The Imagination Station program at times when the whole class was not receiving direct
literacy instruction from the teacher. The students used the program during literacy
centers, rest time, and independent reading time while in the classroom. Teachers also
had the option of having all their students work in the program simultaneously in a
computer lab.
The participating teachers and administrators completed a survey on their
perceptions of the effects of The Imagination Station (IS) program on the literacy skills
of kindergarten students. The survey also elicited perceptions of the teachers and
administrators concerning the user friendliness of the program for students and
teachers. The survey assessed how teachers and administrators perceived the impact
of the IS program on the literacy skills of kindergarten students who were below grade
level, on grade level, and above grade level in their literacy skills. The study determined
if teachers and administrators perceived that The Imagination Station program was of
greater benefit to the students in a particular achievement subgroup.
All students in the district were given literacy assessments in the fall, mid-year,
and at the end of the year. The treatment with The Imagination Station occurred
between the mid-year and end of year assessments. Five of the literacy assessments
were given at the mid-year and at the end of the year. The mid-year assessments were
11
done before the treatment so they were used as the pre-test scores. The end of year
assessments were completed right after the treatment so they were used as the post-
test scores. The change scores were calculated by subtracting the pre-test scores from
the post-test scores. The change scores for these 5 assessments were used to
compare the improvement on the literacy assessments of the students from the 4
schools that used The Imagination Station program to the students attending 13 other
elementary schools in the same district that did not use the program.
One additional school in the same district, coded as School 18, used The
Imagination Station throughout the entire school year. Because students in School 18
had used the program for several months before the mid-year assessments, it was not
included in the comparison of change scores on the 5 literacy assessments. School 18
was also not included in the portion of the study that determined teacher and
administrator perceptions of CAI in literacy skills for kindergarten students.
In Chapter 5, teacher and administrator perceptions of CAI in literacy skills for
kindergarten students are discussed in light of the actual change scores on the 6
literacy assessments taken by both the treatment and control groups.
Delimitations of the Study
Since the study was carried out in elementary schools that were all in the same
district, the socio-economic status of the students may not vary widely. However, there
are differences in socio-economic levels within each school and between schools. All
the schools that used the program are located in a very fast-growing, suburban district.
The vast majority of the families are middle class. There is a difference in the

12
percentage of students receiving free and reduced lunch at each of the schools.
However, since the study involved a relatively homogeneous socio-economic group, the
findings may not be readily extrapolated to low-income schools. The vast majority of
the teacher and administrator participants in the study are Caucasian females. The
school district has an abundance of technology hardware and software. The findings of
the study may not be extrapolated to school situations where there are not computers
available for student use. The conclusions of the study may not be useful in districts
where teachers do not have adequate training in technology.
Definitions of Key Terms
• Alphabetic knowledge – the ability to recognize, name, and write letters (Texas
Education Agency (TEA), 1997).
• At-risk student – a student at risk of failing to master learning objectives for his or
her grade level.
• Comprehension – understanding the meaning of everything that is read,
including words, sentences, and stories. To get meaning from written text (TEA, 2000).
“Comprehension is the reason for reading. If readers can read the words but do not
understand what they are reading, they are not really reading” (Armbruster et al., 2001,
p.51). “Reading comprehension involves the ability to construct meaning from and to
respond to text, using background knowledge as well as printed information” (Au,
Carroll, Scheu, 1997, p. 5).
• Computer-assisted instruction – a system of educational instruction performed by
computer. Instruction that involves using computer software and hardware.

13
• Fluency – “The ability to read a text accurately and quickly” (Armbruster et al.,
2001, p.27). “The ability to read a text quickly, accurately, and with proper expression”
(National Reading Panel, 2000, p. 3-1).
• Grapheme – “The smallest part of written language that represents a phoneme in
the spelling of a word. A grapheme can be just 1 letter or several letters” (Armbruster et
al., 2001, p. 10).
• Integrated learning system – an ILS is a network, a combination of instruction
and management systems that runs on microcomputers connected to a larger computer
and offers a combination of drill and practice, tutorial, simulation, problem solving, and
tool courseware integrated into a total curriculum support package. It is capable of
maintaining detailed records on individual student assignments and performance data
and supplying printouts of this information to teachers
• Interactive - Students actively participate and interact with the computer
software. The interaction between the student and the program provides individualized
instruction, practice, feedback, and reinforcement.
• Likert scale - “Asks individuals to check their level of agreement (e.g., strongly
agree, agree, undecided, disagree, or strongly disagree) with various statements” (Gall,
Borg, Gall, 1996, p. 273).
• Literacy center - Literacy activities in which children participate independently, or
in small groups, that strengthen their literacy and reading skills.
• Logical sequence - Instructional sequence which is determined and pre-planned
by the teacher (Ediger, 1998).

14
• Onsets - Part of spoken language that is smaller than a syllable, but larger than
a phoneme. An onset is the initial consonant(s) sound of a syllable (Armbruster et al.,
2001).
• Oral vocabulary - “Words we use in speaking or recognize in listening”
(Armbruster et al., 2001, p.38).
• Per pupil spending - Amount of money spent per pupil for 1 school year of
education.
• Phonemes - “The smallest part of spoken language that makes a difference in
the meaning of words…Sometimes 1 phoneme is represented by more than 1 letter”
(Armbruster et al., 2001 p. 10).
• Phonemic awareness - A subcategory of phonological awareness involving the
identifying and manipulating of individual sounds in words. “The ability to notice, think
about, and work with the individual sounds in spoken words” (Armbruster et al., 2001, p.
8). The understanding that speech itself is composed of a series of individual sounds
and that spoken words can be segmented (Strickland, 1998). Learning how to divide
spoken words into individual sounds and blend spoken sounds into words (Texas
Education Agency, 1997)
• Phonics - “The understanding that there is a predictable relationships between
phonemes (the sounds of spoken language) and graphemes (the letters and spellings
that represent those sounds in written language)” (Armbruster et al., 2001, p. 10).
• Phonological awareness - “Phonological awareness is a broad term that
includes phonemic awareness. In addition to phonemes, phonological awareness
activities can involve work with rhymes, words, syllables, and onsets and rimes”

15
(Armbruster et al., 2001, p. 10). It encompasses awareness of rhyming, alliteration, and
intonation.
• Psychological sequence - Instructional sequence where the learner determines
and orders his or her own learning activities (Ediger, 1998).
• Reading vocabulary - “Words we recognize or use in print” (Armbruster et al.,
2001, p. 38).
• Rime - Part of spoken language that is smaller than a syllable, but larger than a
phoneme. A rime is the part of a syllable that contains the vowel and all that follows it
(Armbruster et al., 2001).
• Syllable - “A word part that contains a vowel or, in spoken language, a vowel
sound” (Armbruster et al., 2001, p. 10).
• Vocabulary - Words we must know to communicate effectively (Armbruster et
al., 2001).

16
CHAPTER 2
REVIEW OF THE LITERATURE
Several studies have attempted to determine if computer-assisted instruction
(CAI) in literacy skills and reading will increase the literacy and reading achievement of
students. This chapter will explain the search process in reviewing the literature on CAI
and then examine theoretical and empirical studies in the field.
Search Process
The following review was developed through a systematic search. “Computer-
assisted instruction” was the first broad search of the literature. Following that,
“computer-assisted instruction in reading” was the topic searched. “Reading instruction”
was the third broad topic searched. “Reading instruction with computers” was the fourth
topic used in the search process. Another attempt to find relative literature was made
using a limited search of “reading,” “kindergarten,” and “computer.” Most of the prior
research was found by searching digital dissertations since much of the research on this
topic has been in the last 10 years.
Theoretical Literature and Conceptual Framework
Several theories have been developed to explain how children acquire the ability
to read and read well. Allington (2002) states that good teaching is active modeling and
demonstration of the strategies used by good readers. He believes that more time-on-
task and greater use of open-ended conversation about what is read has positive
impact on reading achievement.

17
According to Rings (1994), Using constructivist-learning strategies in a computer
application exposes 3 facets of CAI that promote improvement in critical reading skills.
Rings identifies a high level of interactivity, the encouragement of using strategies that
have been proven to be effective for critical reading, and reading in a real context as 3
aspects of CAI that support the attainment of critical reading skills.
Another factor that determines the quality of reading instructional technology is
the scope and sequence inherent in the software. Ediger (1998) states that” learners
need to experience sequence or order in activities and experiences” (p. 138). Ediger
goes on to distinguish between a logical sequence, which is teacher determined, and a
psychological sequence in which the learner orders his or her own activities. Ediger
points out “Quality sequence guides students to relate new objectives to be achieved
with those already acquired” (p.140). The conclusion of Hall et al.’s review of 17 studies
of computer-assisted instruction for students with reading disabilities was that “those
CAI programs providing systematic instruction with effective correction procedures
contributed most to increasing reading skills” (p.7).
Empirical Research on Computer-Assisted Instruction
Support for Computer-Assisted Instruction
The results from a small-scale study on the Waterford Early Reading Program
(WERP) indicate that after a 12 week period, students’ reading achievement
significantly increased (Camacho, 2002). There were only 20 students from the same
first grade class in the study. The after-treatment assessment was made using the
Waterford Computer Adaptive Reading Test. The small sample size, lack of control

18
group, and the assessment by the same company that produced the instructional
software, are factors that might cause one to question the validity of the findings.
A previous study that examined the Waterford Early Reading Program used a
much larger sample size and a control group, which contributes to greater reliability of
the results. The study by Gingold (2000) examined the computer-based emergent
reading program and compared its impact on kindergartners’ recognition of alphabet
letters and understanding of concepts about print, to traditional classroom instruction.
The null hypothesis was rejected for both letter recognition and concepts about print.
There was a positive, significant difference in the kindergartners’ abilities to recognize
letters and understand print concepts when Waterford Early Reading Program was
used. There were 71 kindergarten students in the treatment group, which received the
CAI with Waterford Early Reading Program, and 68 kindergarten students in the control
group.
Dunn (2002) conducted a study to determine if the reading comprehension of at-
risk ninth grade students who used CAI would improve. Traditional reading instruction
with a control group was compared with computer-assisted reading instruction with an
experimental group. There were 78 students in the control group who did not receive
CAI and 63 students in the experimental group who received CAI. Dunn described this
as a small sample size. The subjects were not randomly assigned to the experimental
and control groups. ANOVA for repeated measures was used for the statistical
analysis, with the treatment and control groups as 1 factor and gender as a second
factor. “The Illinois School Report Card (1999) indicates that the racial and ethnic
background of the research site was 100% African-American” (p. 41). The experimental

19
group, which received the computer-assisted instruction treatment, used Scholastic’s
READ 180 program and the Autoskills Academy of Reading program. Dunn found that
both groups improved in reading comprehension from the pretest to the posttest.
However, the experimental group improved significantly more than the control group.
Dunn also found that female subjects improved more than male subjects in both the
experimental and control groups.
A study at the University of Minnesota compared the relationship between the
amount of time students received Chapter I supplemental reading instruction and
reading achievement gains. Three models of instructional service delivery were used.
The 3 models were (a) the supplemental teacher, (b) the educational assistant, and (c)
the computer-assisted instructional program. There was no significant relationship
between the amounts of time allocated for Chapter I supplemental reading instruction
and reading achievement gains, except in the case of the Chapter I supplemental
teacher service delivery model, where the relationship was significant and negative.
However, without using allocated time as a criterion, the computer-assisted instructional
program produced significant gains in reading achievement (Heath, 2000). Considering
that the supplemental teacher would be the most expensive service delivery model,
(assuming that computer hardware was already in place and was not part of the cost
factor), it is surprising that the supplemental teacher model showed negative
significance. What is not addressed in the study is the class size for the supplemental
teacher model and the quality of the teachers that were part of that service delivery
model.

20
Hall, Hughes, and Filbert (2000) researched the literature on CAI in reading with
learning disabled (LD) students. They evaluated the type of computer and reading
instruction used in 17 different studies. Hall et al. (2000) found that the CAI programs
which utilized effective teaching practices showed a significant difference favoring the
CAI treatment. Hall et al. established that students with learning disabilities in reading
did not get enough practice in reading and often practiced less than their peers who
were non-disabled. The challenge for teachers of students with learning disabilities in
reading is to provide more time on reading tasks that include focused instruction.
Students in 13 of the 17 studies analyzed by Hall et al. showed improvement when
using CAI in reading comprehension and decoding. None of the research authors in the
literature reviewed by Hall et al. (2000) recommended replacing focused reading
instruction by the teacher with CAI. The authors recommended using CAI in reading
applications with LD students, which supplemented and enhanced reading instruction
by the teacher. Hall et al. found that corrective feedback is more effective for LD
students than only notification if an answer was right or wrong.
One frustrating aspect of instructing students with learning disabilities in reading
is that they must make greater yearly progress than their non-disabled peers in order to
catch up. Rebar (2001) pointed out that these students often receive less instructional
time in reading than non-disabled students given resource restraints. Computer-
assisted instruction (CAI) is a way that these students may be able to catch up due to
the self-paced feature of CAI. Rebar’s study found that CAI produced as good or better
outcomes than traditional supplementary instruction.

21
Tincup (2003) also studied a group of students with reading disabilities. When
the group means of the CAI treatment group and the control group were compared, the
treatment group showed greater improvement in reading achievement than the control
group on 4 of 9 subtests. However, there was only 1 measure that showed a significant
difference between the treatment and control groups in their pretest minus posttest
scores. The treatment group demonstrated significantly more improvement in their
change scores than the control group on the WJ-R Basic Reading test. The study only
covered 4 weeks, with the 8 member treatment group receiving 4 half-hour sessions per
week. The control group also had 8 members. The small sample size makes it difficult
to use this study to make predictions about achievement in any other situation.
A slightly larger sample size was used in a study designed to investigate how
CAI affected reading fluency in second graders. The study by Ringenberg (2005)
compared the improvement in reading fluency of 33 students in 2, second grade
classrooms, who independently used computer-assisted and monitored reading
practice, to 32 students in 2 other second grade classrooms who used traditional,
unassisted, and unmonitored reading practice. The computer-assisted students were
able to choose whether the computer would pronounce certain words or read all the
words in an electronic book. The control group students read independently from print
copies of leveled little books. Leveled little books are created to practice reading skills
at a specific reading level. The little leveled books consist of 1, complete story per book
at a specific level of reading achievement. The first phase of the study lasted for 10
weeks. During a second, 10 week period, the group using print copies switched to the

22
computer-assisted instruction. The original computer-assisted group switched to
reading print copies independently without monitoring.
Ringenberg (2005) found that both groups made significantly more progress
during the computer-assisted intervention. The group that began with the computer-
assisted intervention continued to make progress during the second, 10 week period
when they were not monitored and used the print copies of leveled books. One of the
important distinctions made by Ringenberg’s study is that all ability groups made more
progress in reading fluency while receiving the computer-assisted reading intervention.
However, Ringenberg found that students in the high ability group made the least
amount of progress, while students in the low ability group made the most progress.
Michael Ringenberg designed the software used in the computer-assisted reading
practice.
Ringenberg (2005) found that the CAI group that received monitored reading
practice using a computer made more progress than the control group that read the little
leveled books independently. One possible explanation for this finding, apart from the
computer treatment itself, may be that the treatment group was monitored while
practicing reading on the computer. Perhaps another reason that the treatment group in
Ringenberg’s study made more progress than the control group is that they also
received immediate feedback from the computer on word pronunciations. Frequent and
immediate feedback to the learner is an important factor in learning. The National
Reading Panel (2000) found that students could become more fluent readers when they
receive monitoring or feedback from a teacher while repeatedly reading texts.

23
One of the interesting findings in Ringenberg’s study (2005) was that the control
group, which read the little leveled books independently, also made progress in reading
fluency. Using reading materials with texts on the reader’s instructional level that are
composed to target a specific reading skill may be the reason that both the treatment
and control groups made progress in their reading fluency. Heibert (2003) addresses
the characteristics of text used for fluency practice and discusses the texts available to
teachers that support improvements in fluency. Heibert also examines several studies
where texts for repeated reading differ. Heibert found that “When students have
opportunities to read texts in which high-frequency words and words with common and
consistent patterns account for large percentages of the unique words in text, their
fluency benefits” (p. 5).
Heibert (2003) also points out that “After the middle of grade one, literature
continues to dominate the materials that are used for reading instruction after the mid-
point of grade one” (p. 6). Heibert is speaking about the trend to use authentic literature
for reading instruction that was not written specifically to target a certain reading
achievement level. If leveled texts that target specific reading skills are the best way for
students to increase reading fluency and reading achievement, then using a literature
based approach to reading instruction may not be the best instructional strategy.
Heibert goes on to state, “The experiences with students in this study and other studies
suggest that difficult texts do little to support children who are slow readers in becoming
more fluent with the high-frequency words and the monosyllabic words that have
common, consistent patterns” (p. 15).

24
Heibert (2003) found that students reading texts specifically written for a certain
reading level had higher gains in fluency than students who read a literature anthology.
Heibert’s conclusions may help explain why even the control group in Ringenberg’s
study (2005) made progress in fluency while reading little leveled books. The little
leveled books were written specifically to target skills at the instructional level of the
learner. Heibert’s conclusions about the best texts for fluency instruction help explain
why CAI programs are often successful in assisting students to improve their reading
fluency. CAI programs can reinforce fluency and other reading skills at the instructional
level of each learner by using their specifically written texts that target certain reading
skills.
CAI was used in a study by Tozcu (1998) with 56 intermediate level students
studying English for the first time. Tozcu utilized the New Lexis program, which was
vocabulary software prepared by John McVicker to teach second language learners
high frequency words in English. The 56 subjects came from different language
backgrounds. “The data were analyzed using repeated measures ANOVAs using group
(treatment vs. control) and time (pretest vs. posttest) using group as the independent
variable with repeated measures on time” (p. 113). Although both groups increased in
vocabulary knowledge, the gains made by the treatment group were significantly greater
that the gains made by the control group.
In a narrow study by Adamson (1997), 14 students were used as subjects to test
the effects of software developed for the study called The Short-A Sound. 13 of the 14
students showed measurable reading gains, although there were no tests for statistical
significance or a control group that determined if the gains could have occurred without

25
the program. Adamson states, “Low readers relied more on the computer to learn to
read target words. Ten of the 13 students who showed gains had been identified as low
readers” (p. 99).
Another study by Nuno (2005) was also somewhat narrow in scope. Nuno
evaluated several software programs, including his own software program entitled Zoo
Phonics. Nuno tested his software in 2 kindergarten classes, which each had 30
students. Nuno states, “Zoo Phonics (Nuno, 1999) … was created to help limited
English speakers master the curriculum as they learn English” (p.1). The students in
classroom A received the treatment with Zoo Phonics over a 3 month period while the
students in classroom B received phonics instruction in the classroom. Nuno states,
“The results suggest that students who were exposed to Zoo Phonics gained more
knowledge of the sound and name of the letters than students that were given the
conventional phonics approach” (p. 16). Nuno used a T-test to determine a significant
difference between the treatment and control group. Since the study did not control for
teacher effects, it is difficult to know if the greater gains for the students in the treatment
classroom were due to a more effective teacher or the software program.
Non-Support for Computer-Assisted Instruction
Nauss (2002), Campbell (2000), and Ritchie (1999) all conducted studies that did
not find computer-assisted instruction to improve reading achievement. Ritchie’s case
study used 6 students, who were all from the same sixth grade classroom, to investigate
a CAI program called Reading Investigations (Computer Curriculum Corporation, 1993).
The students in Ritchie’s case study worked for 15 minutes in the CAI program for 6

26
weeks. The students were assessed for growth in reading achievement. The small
sample size prohibited the use of statistical analysis. Ritchie states, “…this CAI
program was not as effective overall since not all of the students made gains in reading
comprehension using this program” (p. 108).
Campbell (2002) studied whether CAI in reading using Computer Curriculum
Corporation’s SuccessMaker software program would affect critical thinking skills.
Campbell’s study included 525 fourth grade students and 537 fifth grade students from
13 different schools in the same school district. The students at 7 of the schools
received the CAI treatment for 10 to 20 minutes daily throughout the school year. The
students at the 6 other schools did not receive the CAI treatment using the
SuccessMaker curriculum software program. All students throughout the district in
grades 3 through 11 were assessed with the Stanford Achievement Test, 9th edition
(SAT9). Campbell states, “The Reading Comprehension subtest was used to measure
reading critical thinking skills” (p. 45). Campbell found “In the comparison of fifth grade
pairs, there were no significant differences for 3 of the 4 matched groups” (p. 60). In
fact, Campbell found that there was a negative significant difference between School 2
and School 6 in the study. Campbell found “the non-CAI school showing a gain and the
CAI school showing a decrease in the mean critical thinking score” (p. 61). In the same
study, Campbell assessed whether reading achievement was affected by the CAI
treatment. “A comparison of means for students in both fourth and fifth grade school
pairs showed no significant differences in reading achievement” (p. 61).
Campbell (2002) did determine that there were some significant differences in
the change in critical thinking skills as assessed by the SAT9 for some ability groups.

27
The ability groups were assigned according to the students’ scores on the 1998 OLSAT
School Ability Index (SAI). Campbell grouped students together by high, mid-range,
and low scores on the SAI. Students in the high ability groups in both the fourth and
fifth grades did not show more improvement using CAI than the students in the control
group. However, “Students in the fourth grade with mid-range and low SAI scores that
received CAI did show more improvement over students in the control group” (p. 61).
The findings were somewhat different for the fifth grade students. Only the mid-range
ability groups showed more improvement for the CAI treatment group than the control
group, which did not receive the CAI treatment.
Nauss’ study on the Waterford Early Reading Program (WERP) had different
findings than the other studies on WERP discussed in this paper. All the subjects in
Nauss’ study were first grade students in 25 classrooms in Hendry County, Florida.
Nauss found that first grade students in the 10 classrooms that used the WERP showed
no significant difference in comprehension on the Stanford 9 compared to first grade
students in the 15 classrooms who did not use-WERP. “Additionally, WERP students
showed no significant difference in reading performance on the STAR” (p.40). One
difference in the study by Nauss from those done by Gingold (2000) and Camacho
(2002) is that Nauss used an assessment that was independent from the instructional
program to determine reading achievement. When the Stanford 9 was used as the
post-assessment, as opposed to the Waterford Computer Adaptive Reading Test, no
significant increase in reading achievement was found for the treatment group.
Another study, which compared improvement in reading rate and reading
comprehension between a group using CAI in reading and a group using independent,

28
silent reading, found no significant difference in the composite means of the
comprehension and reading rate scores (Sorrell, 2003). The design of Sorrell’s study
was similar to the study by Ringenberg (2005). Although Sorrell had a smaller sample
size of only 12 students, she also used a counterbalanced treatment design. The
students read for 4 weeks under 1 condition and then switched to the other treatment.
The 12 students ranged in grade level from second to fifth grade and were all from the
same elementary school in a rural area. Sorrell had the students read Accelerated
Reader material using the Kurzweil 3000 program. Unlike Ringenberg, Sorrell found
that computerized presentation proved no more effective than traditional remedial
reading instruction for students who are identified as weak readers by their teachers.
The small sample size in this study may result in the unreliable statistical findings.
Sorrell (2003) cited several studies that found text written on a computer screen,
without speech synthesis, has no more or less impact on improving reading
comprehension than reading text written on paper. Teachers may perceive that text
printed on paper is superior to text alone on a computer screen because the paper copy
is more portable and easier to take home. Conversely, as technology has advanced,
computer screen text may be just as portable and easy to access at home as text
printed on paper. Sorrell’s study evaluated the difference in presentation of reading
materials in print versus presentation of reading materials on the computer screen. In
the study, neither the computer program for accessing the reading materials or the
independent reading of print materials provided sequenced instructional strategies
designed to increase reading achievement. The difference in the presentation of the
reading material pertained to only how the print was displayed. The computer program

29
offered the additional modality of pronouncing words for the reader, which the
independent reading of the printed materials did not provide. However, there was no
real difference in instructional strategy or sequence between the 2 treatments.
Perez (1998) studied a population of 790 elementary students in first through
sixth grade. The purpose was to determine the impact of several variables on
achievement in math and reading of ESOL and Non-ESOL students who used a
computer-based integrated learning system (ILS). The subjects in the study used the
ILS for 10 minutes a day in math and 10 minutes a day in reading, “The amount of time
students used the ILS for reading and math was the best single predictor of gains in
math and reading for both ESOL and Non-ESOL students” (p. 38). A study by Jarrell
(2000) produced confusing results. Females scored significantly better with unlimited
computer access, and significantly poorer with limited access. Males were the opposite.
The study included 120 sixth and 120 seventh grade students. Jarrell suggests further
research to explore the differences in achievement due to gender.
When researching the effects of CAI, the researcher must use an instructional
program. Studies to evaluate CAI are therefore also evaluating the particular program
that is used. Rehmann (2005) conducted research on the effect of Earobics Step 1 on
the phonological awareness skills of 66 kindergarten and first grade students from a
Title I elementary school. The students were randomly assigned to either an
experimental or control group. Pre-test measures determined that there were not
significant differences in phonological awareness in the experimental and control
groups. The experimental group received the intervention with Earobics Step 1 for 10
weeks in a computer lab while the control group remained in the classroom for

30
traditional instruction. After the 10 week period, the students were assessed for gains in
phonological awareness. After the first 10 week period, the students switched
treatments and the experimental group remained in the classroom, while the control
group received intervention with Earobics Step 1. Following the second, 10 week
period, the students were once again assessed.
Rehmann (2005) found that there were no statistically significant differences
between the experimental and control groups during either intervention period in their
gain scores for phonological awareness. Although both groups made progress in their
phonological awareness skills, the Earobics Step 1 software did not produce a
statistically significant difference in the improvement of phonological awareness skills.
Rehmann (2005) also conducted teacher interviews to gain a qualitative analysis
of the intervention. Teachers reported difficulty in monitoring and utilizing the program.
The teachers in Rehmann’s study also reported that some students had to be
supervised quite closely in the computer lab because they found it rewarding to give
incorrect responses due to the interesting graphic displays that were generated by the
program as feedback to the students. One teacher stated that the reports that could be
downloaded from the program on student progress were difficult to use and so she only
downloaded the reports once, instead of monthly as requested. Another teacher
reported that the data on the reports did not have any meaning.
Another study by Bauserman (2003), which also assessed the effects of CAI on
phonological awareness, used Level A in PLATO’s Beginning Reading for the Real
World software for the treatment group. Bauserman also studied the effectiveness of
this CAI program in increasing kindergarten students’ knowledge of print concepts and

31
reading comprehension. The kindergarten subjects in the study came from 2
elementary schools in the same large city school district. There were 4 kindergarten
classes in each school. All the subjects from the control group came from one school
and all the subjects from the experimental group came from the second school, which
had a reading grant to implement the PLATO technology. All non-special education
students had a permission letter sent home to participate in the study. The control
group school had 48 participants and the experimental group school had 60
participants.
The school district in Bauserman’s study had an unusual framework for their
kindergarten program. Parents of students could choose whether to send their child to
a full-time kindergarten program or a half-time kindergarten program. The 2 schools
had a different structure for their half-time programs. The control group school had a
traditional schedule of half-day kindergarten where the students attended Monday
through Friday, either in the morning or in the afternoon. The half-time kindergarten
schedule at the experimental group school had students attending 2 full days each
week and 1 half-day each week. Children in the half-time model outnumbered children
in the full-time model 59 to 49.
Bauserman’s CAI intervention took place over an 8 week period. The students in
the treatment group averaged 12 sessions on the computer program. Over the 8 week
intervention period, the average time spent on the program by the treatment group was
6 hours. The control and experimental groups were given pre-tests and post-tests to
determine their change scores on assessments for phonological awareness, concepts
about print, and reading comprehension.

32
Because the students in the treatment and control groups also had differences in
the type of kindergarten program they attended, Bauserman (2003) measured the effect
of the difference in kindergarten program. “Analysis of variance (ANOVA) for type of
kindergarten program were performed on change scores … Full-day programs were
found to be associated with statistically significant higher scores on several of the
assessment measures used: CAP, PAT, and WJPC” (p. 114). Since the type of
kindergarten program made a difference in the scores, Bauserman used the
independent variable of type of kindergarten program in the statistical analysis to
determine the effects of CAI. The statistical analysis “showed no significance for the
main effects of CAI or the type of kindergarten program on any of the assessment
instruments” (p. 121).
Although Bauserman (2003) found no significant main effect for CAI or for the
kind of kindergarten program, she determined that there was a significant result for 1
reading comprehension assessment. “The univariate results … showed significance for
the WJPC for the interaction of group and full-day program” (p. 123). Bauserman
states, “These results demonstrated children in full-day kindergarten programs with CAI
demonstrated the greatest gains of all other groups” (p. 123).
In addition to investigating the effects of CAI using the PLATO program on
phonological awareness, concepts about print, and reading comprehension, Bauserman
also asked teachers in the experimental school to give their opinions about CAI. “They
unanimously agreed that CAI was beneficial to students, especially low performing
students” (p. 136). However, the teachers in the study had reservations about CAI in
general and specific complaints about the PLATO program. Reservations centered
33
around the availability of a variety of CAI programs, the loss of class time when students
were using CAI, reliability problems and servers that were slow or not running.
Complaints about the PLATO program that teachers reported to Bauserman were
related to their perception that the program was not user friendly for kindergarten
students. Teachers reported that several layers of screens were needed to access the
program, which made it difficult for kindergarten students. “There were no verbal
instructions telling students how to navigate through these screens. For kindergarten
children, these steps were impossible to navigate, thus requiring the help of an adult” (p.
117).
A qualitative, 18 month study by Williams (1999) explored the use of Writing to
Read (IBM, 1986) by first grade students for learning to read and write. Williams found
that the perspective of teachers was that the use of Writing to Read (WTR) diminished
in importance over time.
Teachers reported that the repetitive nature of the software programs and the duration of each lesson were too difficult and fixed for young children to attend to every day. Teachers found ways to avoid putting themselves or their students through what they called mundane experiences in Computer. (Williams, 1999, p. 94)
The perspective of the teachers concerning the value of WTR diminished over a
period of time to the degree that 1 teacher in Williams’ study reported she discontinued
bringing her students to the lab to use WTR. Furthermore, the same teacher reported
that the students did not miss going to the lab. “She believed that her students had
experienced all that was available from the lab” (Williams, 1999, p. 93). Williams also
found that the teachers did not look for alternative ways to use the computers and the

34
software during the 18 months of the study. “Their option was to replace computer with
a classroom activity” (Williams, 1999, p. 95).
Williams (1999) also considered the children’s’ perspectives of CAI using WTR.
The study concluded that the findings from documentation of student experiences and
dialog with students “indicated increased competencies in computer literacies as much
or more than an increase in language literacy competencies” (p. 127). The students in
the study perceived the CAI using WTR as a workplace, experimentation, and reading
and writing. However, Williams found that “Students did not necessarily associate their
reading as part of the WTR activity” (p. 143). The students reported that they could do
what the computer said to do and could find ways to do other things. Rehmann (2005)
also found that students sometimes do not follow a CAI program correctly because the
graphics or sounds accompanying incorrect responses are rewarding to them. Williams
described the students’ use of the WTR program, stating, “They managed to find
numerous spaces in their work to experiment” (1999, p. 127).
Williams (1999) noted that because the WTR program often required one,
specific response from learners, the students’ reading and writing experiences were
geared only to finding the correct match. “Learning to read and write with a computer
application did not guarantee engagement with print language literacies” (Williams,
1999, p. 128). Williams makes a broad assumption that computer applications in
general do not provide learners adequate involvement with literacy. It would seem that
a more appropriate finding from this qualitative research would be that the WTR
program did not guarantee engagement with print language literacies. In further
describing CAI using the WTR program, Williams states, “Children could perceive

35
success in the lab in terms of their competence in computer literacy rather than in terms
of their competence as readers and writers” (1999, p. 128).
Williams discovered through qualitative research that the perspectives of the
teachers and students in the study differed from the official claims and purposes for
WTR. In the summary chapter of the study, Williams states, “Multiple perspectives
reinforced the fact that WTR in itself could not teach children to read and write” (1999,
p. 131). Williams discovered the importance of a learning sequence that is directed by
the learner. Ediger (1998) distinguished between a logical sequence and a
psychological sequence in instruction. A logical sequence is ordered by the teacher,
curriculum document, or CAI program to best meet the needs of the majority of
students. In a psychological sequence, a learner orders his or her own activities to
meet his or her own individual learning needs. Williams’ findings support the need for a
psychological sequence in the instructional framework of an effective CAI program.
Williams (1999) found that “In contrast to notions of a curriculum that shapes or controls
what is learned, student experiences in this study supported the premise that student
learning is situated and directed by an emic or insider perspective” (p. 131).
The Writing to Read (WTR) program may have lost favor with the teachers in the
study by Williams (1999) due to the fact students were forced to find a correct response
instead of being re-taught by the program when they chose an incorrect response. The
program used a logical sequence that was not dependent on student mastery of the
literacy concepts, but was rather driven by the student matching responses to
questions. As stated in Chapter 1, how software is used, and if it is used at all, is
determined by the teacher in the classroom or computer lab. “Teachers ultimately

36
determined the influence WTR would have in their instructional day over time.
Eventually they came to view the program as supplemental and even expendable”
(Williams, 1999, p. 131).
A research study to determine the effectiveness of CAI in reading using the Lexia
Phonics computer software program was conducted by Kutz (2005). Kutz utilized a
quantitative approach, using the Dynamic Indicators of Basic Literacy Skills (DIBELS)
as a pretest and posttest, to determine whether the program made a significant
difference in the reading achievement of kindergarten and first grade students over a 12
week period. “The pretest was administered during September, 2004. The posttest
was administered during December, 2004” (Kutz, 205, p. 56). All students in the study
were from the same suburban school district in southeaster Pennsylvania during the
2004-2005 school year. The majority of the subjects were Caucasian students from
middle-class families. The student participants were selected because their teachers
volunteered their class to take part in the study.
Kutz (2005) also incorporated a qualitative approach in the study, which revealed
the teachers’ opinions of the Lexia Phonics program. Due to the fact the teachers were
self-selected to use the Lexia Phonics software program with their students, it is
possible that the opinions expressed in the qualitative portion of the study may not be
accurately extrapolated to reflect the opinions of all kindergarten and first grade
teachers. The classroom teachers and instructional aides were “…trained to use the
Lexia Phonics computer program within a computer lab setting by the computer
technology teachers within the district” (Kutz, 2005, p. 55).

37
The kindergarten students in the study by Kutz (2005) included students from 3
full-day kindergarten classes in 3 elementary school buildings. The classes were split to
each include members of the treatment and control groups. The treatment group
included 29 kindergarten students and the control group was comprised of 26
kindergarten students. The treatment and control groups together included 18
kindergarten Title I students. The students in the treatment group used the Lexia
Phonics software program for 2, 30-minute sessions each week during the 12 week
study. The students in the control did not use the Lexia Phonics software program.
Considering the benefit of letter recognition for kindergarten students, Kutz
(2005) found no significant difference at the p < .05 level between the control group and
the treatment group. Concerning the benefit of initial sound fluency for kindergarten
students, Kutz found that there was no significant difference at the p < .05 level between
the control group and the treatment group. In summary, Kutz found that there was no
significant main effect of the Lexia Phonics software program on letter recognition or
initial sound fluency of kindergarten students, as measured by change scores on the
DIBELS, on either the treatment or control group.
The first grade students in the study by Kutz (2005) came from 3 first grade
classrooms in 2 elementary school buildings. The treatment group included 70 first
grade students and the control group was comprised of 68 first grade students. The
treatment and control groups together included 35 first grade, Title I students and 2 first
grade students from a self-contained, learning support classroom. The students in the
treatment group used the Lexia Phonics software program for 2, 30-minute sessions

38
each week during the 12 week study. The students in the control did not use the Lexia
Phonics software program.
The third research question in the study by Kutz (2005) addressed the benefit of
phoneme segmentation fluency for first grade students. The means of the pretest and
posttest did differ significantly from each other, indicating, “Lexia Phonics was beneficial
for phoneme segmentation fluency (PSF) in first grade students” (p. 69). However, the
control group also received benefit from the classroom instruction. “The Levene’s test
for Equality of Variances indicated variances for the control group and the treatment
group did differ significantly from each other” (Kutz, 205, p. 66). Using ANOVA, Kutz
found “that there was no significant main effect for the treatment group or the control
group” (2005, p. 66). Kutz also found that there was no significant main effect on the
benefit of nonsense word fluency for the treatment group or the control group.
The 3 kindergarten teachers who were interviewed in the qualitative portion of
the research study conducted by Kutz (2005) were generally pleased with the Lexia
Phonics program and had no specific complaints about it. One of the 3 kindergarten
teachers felt that students who were weaker in language arts would benefit from using
the program for a longer time. Two of the 3 kindergarten teachers “felt their classroom
instruction was just as beneficial or more beneficial for students than exposure to the
Lexia Phonics CAI” (p. 92). The 3 first grade teachers who were interviewed by Kutz
were also generally pleased with the Lexia Phonics program. The first grade teachers
all agreed that the program might be more motivational if it were more game-like when
practicing reading skills. Finally, student surveys indicated that the majority of both

39
kindergarten and first grade students felt the program helped them to learn reading
skills and that they enjoyed using Lexia Phonics.
The Imagination Station® Internet-based supplemental reading instruction and
intervention program (Imagination Station, Inc., Richardson TX, www1.istation.com) has
been utilized in several school districts throughout the United States. “The imagination
Station from istation.com delivers interactive, standards-based instruction to pre-K
through third grade students. Designed to augment classroom instruction, the program
continually assesses student performance, adapting the curriculum to individual learning
needs” (T & L Editors, 2003, p.1). Since the software has a high level of interactivity, it
meets the first criteria described by Rings as supporting the development of critical
reading. All the stories used in The Imagination Station software can be printed in a
hard copy for students. This fulfills another of Rings’ criteria for the support of critical
reading skills, which is that reading should have a “real context.” The instruction,
feedback, and re-teaching in the software is logical and sequential. The software
continually spirals students through reading objectives, providing additional time on a
particular objective for those who need it. The software systematically reviews
objectives to ensure mastery. Ediger, Hall, and other researchers would, therefore,
probably find that The Imagination Station is a vehicle for improving reading
achievement for all students, and particularly for students with reading disabilities.
The Florida Center for Reading Research (FCRR) (2006) prepared a report that
reviewed The Imagination Station. The FCRR reported on 2 studies conducted in the
2003-2004 school year that evaluated the effectiveness of The Imagination Station
program. In the first study, Shippenburg University collaborated with the Chambersburg

40
Area School District. In the fall, data on letter naming fluency, initial sound fluency,
phoneme segmentation fluency, and nonsense word fluency were collected on 550
kindergarten students using the Dynamic Indicators of Basic Early Literacy Skills
(DIBELS). Nine kindergarten classrooms with 180 students who were currently using
The Imagination Station were assigned to the treatment group. The control group
consisted of 384 kindergarten students who were not using The Imagination Station.
The experimental, treatment group made significant improvements relative to the control
group, p < .05. However, according to the Florida Center for Reading Research
(FCRR), the results cannot be interpreted to mean the program caused the entire
difference since the students were not randomly assigned to the control and
experimental groups.
The FCRR (2006) reported on a second study that was also carried out in the
2003-2004 school year in the Fort Worth Independent School District in Texas. The
FCRR states “The impact of The Imagination Station activities on student reading
achievement was assessed using an experimental design that compared test scores of
2 matched, randomly assigned groups of students: (a) The Imagination Station
students and (b) students in alternative interventions” (2006, p. 3). Assessment of
students revealed that The Imagination Station had a positive impact on the students’
basic reading skills. The FCRR reported that the percentage of students making gains
on the Texas Primary Reading Inventory (TPRI) was greater for The Imagination Station
students than those students in the alternative intervention group in all categories
except 1. “The Imagination Station group improved similarly to the alternative
intervention group from beginning to end of year scores for percentage of students who

41
met the comprehension criteria” (FCRR, p. 4). The students were also assessed with
Stanford 10 (SAT 10) reading scores. “During the first year of implementation, no
significant impact was observed on overall reading ability as measured by the SAT 10”
(FCRR, 2006, p. 4).
Conclusions
Further study is needed to assess the impact of CAI on literacy skills and reading
achievement. It is only possible to study one instructional software program at a time
because the effectiveness of CAI is dependent on the quality of instruction embedded
within each program. It is not possible to make general conclusion about the efficacy of
CAI without regard to the computer-assisted instructional program that is being used.
The quality of the instructional sequence, appropriate feedback, individualization of
instruction, and user friendliness are all factors that will affect the quality of a CAI
program and therefore also affect student learning while using CAI.
Teachers have generally indicated they believe CAI is most beneficial for low-
performing students. Studies that include large sample groups and are conducted for
longer periods will enhance the knowledge base in the area of the effect of CAI on
literacy skills and reading achievement. In the next chapter, the methods used to study
computer-assisted instruction in literacy skills for kindergarten students, using The
Imagination Station software, will be discussed.

42
CHAPTER 3
METHODOLOGY
In the previous chapter, prior studies on the effectiveness of computer-assisted
instruction in reading and literacy skills are analyzed and discussed. This chapter
explains the methods, which were used in carrying out this research. The study’s
perspective, context, participants, instruments for data collection, procedures, and
process of data analysis, and validity will be discussed. The factors jeopardizing
internal and external validity of the research are addressed. The methodology should
be capable of being reproduced in schools of similar size and socio-economic status.
This is assuming that hardware and software are readily available to make a similar
study possible.
The General Perspective
The general perspective of the research study is quantitative. The researcher
used a survey to determine the perceptions of teachers and administrators regarding
computer-assisted instruction (CAI) in reading and literacy skills for kindergarten
students. The survey is found in appendix A. The researcher assigned numerical
values to the data collected to allow for statistical analysis of the participants’
responses. The research type for this part of the study is descriptive research because
it reports the frequencies, averages, and percentages of responses in order to describe
the perceptions of the study participants (Glatthorn, 1998).
The researcher also compared the change in literacy assessment scores of
students who used The Imagination Station® Internet-based supplemental reading
43
instruction and intervention program (Imagination Station, Inc., Richardson TX,
www1.istation.com) to the scores of students who did not use the program. The
research type for this part of the study is quasi-experimental because students were not
randomly assigned to the treatment and control groups to determine if the software
made a significant difference in the literacy scores of the students (Glatthorn, 1998).
The Research Context
Alton, Bradley, Carsten, and Drew (fictitious names) are elementary schools in
the same, fast-growing, suburban district. The fictitious names correspond to school
numbers 1, 2, 3 and 4 in the data. The schools were in operation for 7 years, 5 years,
19 years, and 1 year, respectively. These schools had access to The Imagination
Station instructional program in reading for 10 weeks. Kindergarten teachers and
administrators in these 4 schools were participants in the portion of the research study
that used a survey to determine their perceptions of computer-assisted instruction in
literacy skills for kindergarten students.
Although this school district was considered a rural district 15 years ago, it is
located near a very large city in Texas. Due to population growth and shift, the district is
now considered suburban. All the elementary schools involved in the study served
students in kindergarten through fifth grade. During the 2005-2006 school year, in
which the study took place, there were 18 elementary schools in the district. Literacy
assessment data were obtained from all kindergarten students in each of the18
elementary schools in the district. School number 18 was eliminated from the study
because they used the program all year rather than just during the pilot test.

44
During the 2005-2006 school year, Alton enrolled about 807 students, Bradley
enrolled about 519 students, Carsten enrolled about 625 students, and Drew enrolled
about 837 students. The student populations are ethnically diverse with students from
several Asian, Hispanic, African American, Middle-Eastern, and European cultures.
Data were not collected concerning the ethnicity of individual students. However, Table
1 shows the percentage of students which belong to the subgroups recognized in the
Academic Excellence Indicator System (AEIS) report of the Texas Education Agency
(TEA) for the 2005-2006 school year.
Table 1
AEIS Subgroup Population Percentages
Alton Bradley Carsten Drew
African American 8.5% 20.2% 6.1% 16.2%
Hispanic 15.2% 23.3% 13.4% 14.3%
White 67.1% 51.0% 76.7% 60.3%
American Indian/Native Alaskan 0.4% 0.4% 0.8% 1.4%
Asian/Pacific Islander 8.9% 5.2% 3.0% 7.8%
Economically Disadvantaged 13.9% 32.6% 13.4% 12.3%
The 4 schools where teachers and administrators were research participants
varied on the percentage of students receiving free and reduced lunch. At Bradley
Elementary, a larger percentage of students received free or reduced lunch than at the
other 3 schools. Some of the apartments in the Bradley attendance zone were federally
subsidized. Each classroom, in all 4 schools, had 3 student computers as well as a

45
teacher computer. In addition, there were computer labs in each of the schools to which
all classrooms had access.
Principals who consented to be participants in the study had The Imagination
Station program provided for kindergarten students on their campus. Teachers who
consented to be participants in the study had The Imagination Station program provided
for the students in their classrooms.
The Research Participants
The research participants were kindergarten teachers and administrators from
the 4 elementary schools described in the research context. The administrators
included principals and assistant principals who gave consent to be participants. There
were 28 participants in the descriptive research portion of the study, which used a
survey developed by the researcher to capture the perceptions of teachers and
administrators of computer-assisted instruction in literacy skills for kindergarten
students. Demographics for the participants were collected from the survey. The
teachers and administrator participants were all females. The ethnicity of the teacher
and administrator survey participants was not included in the data. However, the vast
majority of the survey participants were Caucasian.
Instruments Used in Data Collection
Survey
The descriptive research portion of the study utilized a survey developed by the
researcher to obtain the perceptions of the administrators and teachers concerning the
46
effects of CAI using The Imagination Station program on the literacy skills of
kindergarten students. The purpose of the survey was to describe the perceptions of
teachers and administrators concerning the effect of The Imagination Station program
on the literacy skills of their kindergarten students. The survey was also designed to
determine if teachers and administrators perceived that The Imagination Station
program was more beneficial for students who were above grade level, at grade level,
or below grade level in their literacy skills.
The survey was divided into 4 sections of questions. Within each section,
questions were grouped together if they pertained to the same literacy skill. A pattern of
4 questions regarding improvement in a single aspect of literacy was used in the first 5
groups of questions on Section I of the survey. The first question in each group asked
about the participant’s perception of the improvement in the students’ skills in a
particular aspect of literacy. The second question in each group asked about the
participant’s perception of the improvement in skills that above-grade level students
made in that same aspect of literacy. The third question in each group asked about the
participant’s perception of the improvement in skills that on-grade level students’ made
in the same facet of literacy. The fourth and last question in each group asked about
the participant’s perception of the improvement in skills that below-grade level students
achieved in the particular literacy element being investigated. Participants rated their
impressions of their students’ improvement as excellent, good, fair, or no improvement.
The first 4 questions on the survey asked participants to describe their
perceptions of the improvement in their students’ letter identification skills after using
The Imagination Station. Questions 5 through 8 on the survey asked participants to

47
describe their perceptions of the improvement in their students’ letter sound skills after
using The Imagination Station. Questions 9 through 12 asked participants to describe
their perceptions of the improvement in their students’ concepts about print (CAP) skills
after using The Imagination Station. Questions 13 through 16 asked participants to
describe their perceptions of the improvement in their students’ phonemic awareness
skills after using The Imagination Station. Questions 17 through 20 asked participants
to describe their perceptions of the improvement in their students’ Diagnostic Reading
Assessment (DRA) after using The Imagination Station. Question 21 was a general,
summary question that asked participants to describe their perceptions of the
improvement in their students’ literacy skills after using The Imagination Station.
Participants rated their perceptions of improvement as excellent, good, fair, or no
improvement, which corresponded to the Likert scale of 4, 3, 2, and 1, respectively.
Section II of the survey was composed of Questions 22 through 29. The first
group of questions in Section II, numbered 22 through 25, related to how often students
used the program. The second group of questions in Section II, numbered 26 through
29, asked participants to describe how often they printed or used the reports and books
generated by the program. The last group of questions in Section II, numbered 30
through 32, asked participants about how frequently students were eager to use the
program, how frequently the students could use the program independently, and how
frequently the program was easy to use for the teacher. Participants rated their
perceptions of frequency as 4 to 5 days a week, 3 days a week, 1 to 2 days a week, or
0 days a week, which corresponded to the Likert scale of 4, 3, 2, and 1, respectively.

48
In Section III of the survey, the first group of questions, numbered 33 through 35,
asked participants to describe their agreement that the training they received was
beneficial, that their computer skills were sufficient to use the program effectively, and
that their students’ computer skills were sufficient use the program effectively.
Participants rated their perceptions as strongly agree, agree, agree somewhat, and do
not agree, which corresponded to the Likert scale of 4, 3, 2, and 1, respectively. The
second group of questions in Section III, numbered 36 and 37, asked participants to
rate their computer skills and their students’ computer skills as excellent, good, fair, or
poor, which corresponded to the Likert scale of 4, 3, 2, and 1, respectively.
In Section IV of the survey, Questions 38 through 42 were designed to gather
demographic information about the participants. The participants were asked their job
category, school, years of experience, gender, and age.
Literacy Assessments
The quasi-experimental portion of the research study utilized the district literacy
assessments, administered by all kindergarten teachers in the district, to collect data.
The teachers administered the district literacy assessments in the fall, winter, and
spring. The literacy assessments included (a) letter identification with a range of scores
from 0-54 (a and g are presented in 2 different fonts), (b) letter sound identification with
a range of scores from 0-26, (c) concepts about print (C.A.P.) with a range of scores
from 0-14, (d) phonemic awareness with a range of scores from 0-30, (e) listening
comprehension with a range of scores from 0-8, and (f) a diagnostic reading
assessment (DRA) with a range of scores from 0-44.

49
Procedures Used
The Assistant Superintendent for Curriculum and Instruction and the principals of
the 4 schools granted access to the educational sites. All teachers and administrators
were volunteers who gave informed consent to participate in the study. Participants
received a survey at the end of the school year, which included information about the
research study. The signature required on the survey indicated that the participant was
giving informed consent to take part in the research study. The survey used a 4 point
Likert scale to assess the perceptions of administrators and teachers of the
effectiveness of CAI using The Imagination Station program.
To increase the validity of the survey used to determine teacher and
administrator perceptions of CAI, the participants in the study came from 4 different
schools. All teachers in the district used computers for instruction in core subjects
throughout the year. There was no novelty effect of using CAI in this district, because
other CAI programs were already being used.
The company that developed and owns The Imagination Station provided the
software for the study. Company employees provided training for the study participants
on the use of the program. The participants voluntarily attended the training and were
able to receive 3 hours of staff development credit in technology if they completed the
training. Participants were able to choose between 2 training dates. The training was
provided for 3 hours after school at the Alton campus and the Carsten campus.
50
Data Analysis
Survey
For the descriptive portion of the study which used a survey to collect data,
descriptive statistics were used to describe and analyze the participant responses to the
survey. The data were displayed in a frequency distribution table. Both the percentage,
and actual number, of participants with the same answer were reported within the table.
Having the data displayed in the frequency distribution table allowed for a
preliminary description of the findings. The categories on the Likert scale were given
numerical values from 1 to 4. Computing quantitative measures of the distribution of
scores enhanced the description of the distribution (Hinkle, Wiersma, Jurs, 1998).
Measures of central tendency, including the mean, median, and mode, were calculated
for the responses of the participants on each question. Measures of variation, the
range, mean deviation, variance, and standard deviation, were calculated for the
responses of the participants on each question. Statistical analysis was performed
using the statistical package for the social sciences (SPSS) in order to analyze and
compare the responses of the participants.
Literacy Assessments
For the quasi-experimental portion of the study, the data from the district literacy
assessments were analyzed to determine if the treatment using The Imagination Station
made a significant difference in the literacy assessment scores of the treatment group.
Statistical analysis was performed using the statistical package for the social sciences

51
(SPSS) in order to analyze the differences in the treatment and control groups on the
district literacy assessments.
Univariate analysis was used to describe and summarize the means, standard
deviation, variation, and range of values for the average z scores on the literacy
assessments of the treatment and control groups. Bivariate analysis was used to create
correlation tables to further analyze the data. A repeated measures ANOVA was used
to compare the means of the average z scores on the literacy assessments for the
treatment and control groups of students.
Validity
Internal Validity
According to Campbell and Stanley (1963), internal validity means that the
researcher can conclude that the treatment made a difference in the specific
experiment, which was conducted. Campbell and Stanley (1963) identify 8 challenges
to internal validity which include (a) history, (b) maturation, (c) testing, (d)
instrumentation, (e) statistical regression, (f) biases, (g) experimental mortality, and (h)
selection-maturation interaction.
Campbell and Stanley (1963) define history as events that also took place during
the experimental treatment. In educational research where students are in different
schools with different teachers, it is impossible to control the other events that are taking
place during the treatment. It would be impossible to say with certainty that unknown
variables did not affect the results of the experiment. Students not only have different
experiences at school, but they also have a different history at home. One of the

52
schools in the treatment group of this study was a Title I school. Students in this school
may have experienced a different history both at school and at home than students in a
non-Title I school.
Maturation is defined by Campbell and Stanley (1963) as the processes that
occur as a result of the passage of time. It is impossible to say with certainty in
educational research that a treatment made the entire difference in a change when both
groups are maturing. This variable is particularly important when studying kindergarten
students, as in this research study. Kindergarten students enter school with varied
levels of maturity and grow in maturity throughout the year at varied rates as well.
Testing itself can affect the scores of the next test (Campbell and Stanley, 1963).
In this research study there were 3 sets of assessments given to each student. The
tests themselves and how they were administered may have affected the outcome of
the next set of assessments.
Instrumentation refers to the instrument that is used to measure the results of a
research study (Campbell and Stanley, 1963). In the descriptive portion of this research
study, the researcher developed the survey. The design did not allow for statistical
testing because the sample size turned out to be too small at 28 participants. There
were also too many questions in relationship to the number of participants who
completed the survey.
Statistical regression, as defined by Campbell and Stanley (1963) is “operating
where groups have been selected on the basis of their extreme scores (p. 5). In this
research study, it did not make a difference in the finding when outliers were excluded
from the data. Campbell and Stanley state that biases result from the selection of

53
comparison groups. This study of computer-assisted instruction using The Imagination
Station program had to rely on which schools and teachers volunteered to use the
program. The fact that there was not random assignment to the treatment and control
groups creates less reliability in the findings. One possible theory could be put forward
that the volunteers could have been from schools where the students were generally
below their peers in other schools in literacy skills, which would create differences in the
means of the control and treatment groups from the beginning.
Experimental mortality is the loss of subjects or participants during the course of
an experiment (Campbell and Stanley, 1963). In this research study, there were several
students who were present in the fall, but not in the spring or winter. There were also
several students who were present in the spring, but not in the fall or winter. Only the
students who were present for the entire year were included in the data. However, it is
impossible to say how the students who were lost from the data may have affected the
outcome of the experiment.
Campbell and Stanley (1963) define selection maturation interaction as when the
interaction of selection and maturation in multi-group, quasi-experimental designs
“might be mistaken for, the effect of the experimental variable” (p. 5). This is a threat to
internal validity in this research because of the non-random selection and the yearlong
maturation of the students. It would be difficult to say if the experimental treatment had
more effect than these 2 variables on the outcome of the experiment.
External Validity
Campbell and Stanley (1963) describe external validity as generalizability to

54
other populations. Campbell and Stanley also use the word, “representativeness” (p.5)
to describe external validity and define 4 threats to external validity.
The first threat to external validity described by Campbell and Stanley (1963) is
the reactive or interaction effect of testing. Whether subjects are sensitized or
desensitized to the experimental variable by the testing is a threat to external validity. In
this research study the interaction effect of testing is not a threat to external validity.
Both the control and treatment groups all were given the same tests at about the same
time. It is possible that individual subjects in the treatment group could have been
sensitized or desensitized by testing, but due to the large sample size, this was not a
concern for this study.
The interaction effects of selection biases and the experimental variable is
another threat to external validity identified by Campbell and Stanley (1963). This
research was conducted in an affluent school district. It may not be possible to repeat
the results in a district of differing economic status.
Campbell and Stanley (1963) also identified the reactive effects of experimental
arrangements as a threat to external validity. A well known experiment found that
workers in a factory increased production simply because they were being observed
and not because of the experimental condition. The experimental arrangement was not
a threat to external validity for this study. All students had access to computers,
whether they were in the control group or experimental group. There was no novelty
effect of the computer use itself, because all students in the district use computers on a
regular basis. Students in both the experimental and control groups were assessed
with the same instruments with the same frequency. In this research, there was not a

55
unique arrangement that would have caused the subjects to behave differently or score
differently on the literacy assessments.
The last threat to external validity identified by Campbell and Stanley (1963) was
multiple treatment interface. This could be considered a threat to the external validity of
this research because teachers used several literacy treatments in their literacy
instruction. The Imagination Station was a treatment that was unique to the treatment
group. However, it is not known what unique treatments both groups may have
received in addition to the computer-assisted instruction with this program.
Summary of the Methodology
The perspective of the research study is quantitative. Descriptive research and
quasi-experimental design were the 2 general research approaches, or types, that were
used for the study. The data collected from the survey were intended to describe the
perceptions of teachers and administrators regarding the use of computer-assisted
instruction, using The Imagination Station, to teach literacy skills to kindergarten
students. The data collected from the literacy assessment scores of kindergarten
students in the district were intended to evaluate the effectiveness of the software. In
the next chapter, the results of the study will be revealed.

56
CHAPTER 4
RESULTS
The results of this study were calculated and analyzed using the Statistics
Package for Social Sciences (SPSS).
Survey Results
The median and the mode are 2 measures of central tendency that are important
to the analysis of the research findings in this summarization. The mean is another
measure of central tendency that is used for comparisons of the responses to questions
that are closely related. The standard deviation, the variation, and the mathematical
mean of the participant responses are not practical means of describing the perceptions
of the participants. If half of the participants described the improvement in a facet of
their students’ literacy skills as excellent and the other half of the participants perceived
no improvement in those same skills, it would not be logical to assume that the
perception of the participants concerning the improvement of literacy skills in that
particular area was fair or good. For this reason, the mathematical mean was not often
used to help describe the participants’ perceptions about the level of improvement of
their students’ literacy skills after using The Imagination Station.
The means of the participant responses are used to underscore the participant’s
perceptions of the difference in improvement of skills for above-grade level, on-grade
level, and below-grade level students in a single area of literacy. The percentages of
participants that responded with the same selection on the Likert scale and the
frequency of responses at that level on the Likert scale are used to describe the

57
perceptions of the participants of the computer-assisted instruction delivered by The
Imagination Station on the improvement of their kindergarten students’ literacy skills.
Letter Identification
Question 1 of the survey asked the participants how they perceived the
improvement of their students’ skills in letter identification after using The Imagination
Station. Question 1 does not address whether the students were above, at, or below
grade level. Table 2 describes the Question 1 results.
Table 2
Improvement in Letter Identification Skills
N
Valid Missing Mean Median Mode
27 1 2.85 3.00 3
Analysis of the data in Table 2 revealed that the median and the mode of the
participant responses were both 3, which indicated the participants generally perceived
that their students’ improvement in letter identification skills after using The Imagination
Station was good. Table 3 further quantified the response to Question 1 by showing
37% of the participants responded with a 3 on the Likert scale. An additional 33.3% of
the participants responded with a 4 on the Likert scale. Ten of the participants rated the
improvement in letter identification skills of their students as good and 9 participants
rated the improvement in letter identification skills of their students as excellent. The
percentage of participants who responded with either a 3 or 4 on the Likert scale was

58
70.3%, which indicated a large majority of participants perceived their students’
improvement in letter identification skills after using The Imagination Station to be good
or excellent.
Table 3
Improvement in Letter Identification Skills
Likert Scale Response Frequency Percent
1 None 5 18.5
2 Fair 3 11.1
3 Good 10 37.0
4 Excellent 9 33.3
Note: One participant did not answer this question. Percent based on responses received.
Question 2 of the survey asked the participants how they perceived the
improvement of their above-grade level students’ skills in letter identification after using
The Imagination Station. Table 4 describes the Question 2 results. Analysis of the data
in Table 4 revealed that the median was a 2 on the Likert scale, which indicated a
perception of fair improvement for above-grade level students in letter identification
skills. The mode was a 1 on the Likert scale, which indicated a perception of no
improvement for above-grade level students in letter identification skills. The mean was
2.26, which was closer to the median than the mode. If both the median and the mean

59
were taken into consideration, it would indicate that the participants perceived fair
improvement in their above-grade level students’ letter identification skills.
Table 4
Improvement in Letter Identification Skills for Above-Grade Level Students
N
Valid Missing Mean Median Mode
27 1 2.26 2.00 1
Table 5 further quantified the response to Question 2 and showed that although
44.4% of participants perceived no improvement in letter identification skills for their
above-grade level students, 48.1% perceived good or excellent improvement in letter
identification skills for their above-grade level students. Only 7.4% of participants
perceived fair improvement in their above-grade level students’ letter identification skills,
which was the median response. The participants were polarized in their perceptions of
the improvement of their above-grade level students in letter identification skills after
they used The Imagination Station.
The mean response of the participants on Question 2 was 2.26, which was less
than the mean response of the participants on Question 1, which was 2.85. This
difference might suggest that participants perceived that students who were already
above grade level improved less in their letter identification skills than did all students in
general. The perception that the letter identification skills of above-grade level students
did not improve as much as the letter identification skills of on-grade level and below-
grade level students will be explored at greater length in the summary in Chapter 5.

60
Table 5
Improvement in Letter Identification Skills for Above-Grade Level Students
Likert Scale Response Frequency Percent
1 None 12 44.4
2 Fair 2 7.4
3 Good 7 25.9
4 Excellent 6 22.2
Note: One participant did not answer this question. Percent based on responses received.
Question 3 of the survey asked the participants how they perceived the
improvement of their on-grade level students’ skills in letter identification after using The
Imagination Station. Table 6 describes the Question 3 results. Table 6 revealed that
the median was a 3 on the Likert scale, which would indicate a perception of good
improvement. However, there were multiple modes of 1, 2, and 3 on the Likert scale for
Question 3, which indicated that the participants did not agree about their perception of
the improvement of on-grade level students in letter identification skills after using The
Imagination Station. Seven participants each chose the Likert scale response of 2, 3,
and 4. Six participants choose the Likert scale response of 1. Although the median
response was a 3 on the Likert scale, the even distribution of the participants’
responses leaves only the mean as a reliable measure of central tendency for this
particular question. The mean was response was 2.56, which indicated a perception of

61
between fair and good improvement in letter identification skills for on-grade level
students.
Table 6
Improvement in Letter Identification Skills for On-Grade Level Students
N
Valid Missing Mean Median Mode
27 1 2.56 3.00 2(a)
Note: (a) Multiple modes exist. The smallest value is shown.
Table 7 further quantified the response to Question 3 by showing that slightly
less than 50% of the participants responded with a 1 or 2 on the Likert scale and slightly
more than 50% of participants responded with a 3 or 4 on the Likert scale. Table 7
contributed to the conclusion that there was little agreement among the participants
about the improvement of letter identification skills for on-grade level students by
showing the percentages of participants choosing each response was nearly equal.
The multiple modes indicated that the median was not as reliable of a measure of
central tendency for the responses to this question as it was for other questions. The
mean of 2.56 provided a mathematical average to describe the participants’ perceptions
of their on-grade level students’ improvement in letter identification skills. As stated
previously, the mean is not always a logical way to describe participant responses.
However, the mean of 2.56 might imply that the participants perceived the improvement
of their on-grade level students in letter identification skills to be greater than the

62
improvement of their above-grade level students in the same skills, where the mean
was only 2.26.
Table 7
Improvement in Letter Identification Skills for On-Grade Level Students
Likert Scale Response Frequency Percent
1 None 6 22.2
2 Fair 7 25.9
3 Good 7 25.9
4 Excellent 7 25.9
Note: One participant did not answer this question. Percent based on responses received.
Question 4 of the survey asked the participants how they perceived the
improvement of their below-grade level students’ skills in letter identification after using
The Imagination Station. Table 8 describes the Question 4 results.
Table 8
Improvement in Letter Identification Skills for Below-Grade Level Students
N
Valid Missing Mean Median Mode
27 1 3.19 3.00 3

63
Analysis of the data in Table 8 revealed that the median and the mode were both
3 on the Likert scale, which indicated the participants perceived good improvement on
letter identification skills for below-grade level students. The mean of the participant
responses was 3.19, which was slightly higher than either the median or the mode.
Table 9 further quantified the response to Question 4 by showing that 85.1% pf
the participants responded with a 3 or 4 on the Likert scale, which indicated the
participants perceived good or excellent improvement on letter identification skills for
below-grade level students. The percentage of participants that chose a 4 on the Likert
scale was 40.7%, which indicated a perception of excellent improvement in letter
identification skills for below-grade level students.
Table 9
Improvement in Letter Identification Skills for Below-Grade Level Students
Likert Scale Response Frequency Percent
1 None 2 7.4
2 Fair 2 7.4
3 Good 12 44.4
4 Excellent 11 40.7
Note: One participant did not answer this question. Percent based on responses received.
The mean of the participant responses for Question 4 was 3.19, which was
slightly higher than either the median or the mode. The mean of 3.19 standing al1

64
would indicate the perception of participants was that below-grade level students had
better than good improvement in letter identification skills after using The Imagination
Station. However, the mean is more properly used to compare the participant
responses for above-grade level, on-grade level, and below-grade level students. The
means for the 3 groups were 2.26, 2.56, and 3.19 respectively.
The mean results for the leveled groups indicated that participants perceived
greater improvement in letter identification skills for below-grade level students than the
other 2 groups. The mean results also indicated that the participants perceived greater
improvement in letter identification skills for on-grade level students than above-grade
level students. The perception of improvement of skills appeared to be inversely related
to the relative grade level of the student. Participants perceived that students already
achieving at above grade level improved the least and those students already achieving
below grade level improved the most after using The Imagination Station.
Letter Sound Identification
Question 5 of the survey asked the participants how they perceived the
improvement of their students’ skills in letter sound identification after using The
Imagination Station. Question 5 does not address whether the students were above,
on, or below grade level. Table 10 describes the Question 5 results. Table 10 revealed
that the median and the mode were both 3 on the Likert scale, which indicated a
perception of good improvement. The mean was 2.96, which is mathematically very
close to the median and the mode. Because all 3 measures of central tendency are

65
nearly equal, it can be stated with some reliability that the participants’ perception of the
improvement of their students’ skills in letter sound identification was good.
Table 10
Improvement in Letter Sound Identification Skills
N
Valid Missing Mean Median Mode
26 2 2.96 3.00 3
Table 11 further quantified the response to Question 5 by showing 80.7% of the
participants responded with a 3 or 4 on the Likert scale, which indicated a perception of
good to excellent improvement in letter sound identification skills for all students.
Table 11
Improvement in Letter Sound Identification Skills
Likert Scale Response Frequency Percent
1 None 3 11.5
2 Fair 2 7.7
3 Good 14 53.8
4 Excellent 7 26.9
Note: Two participants did not answer this question. Percent based on responses received.
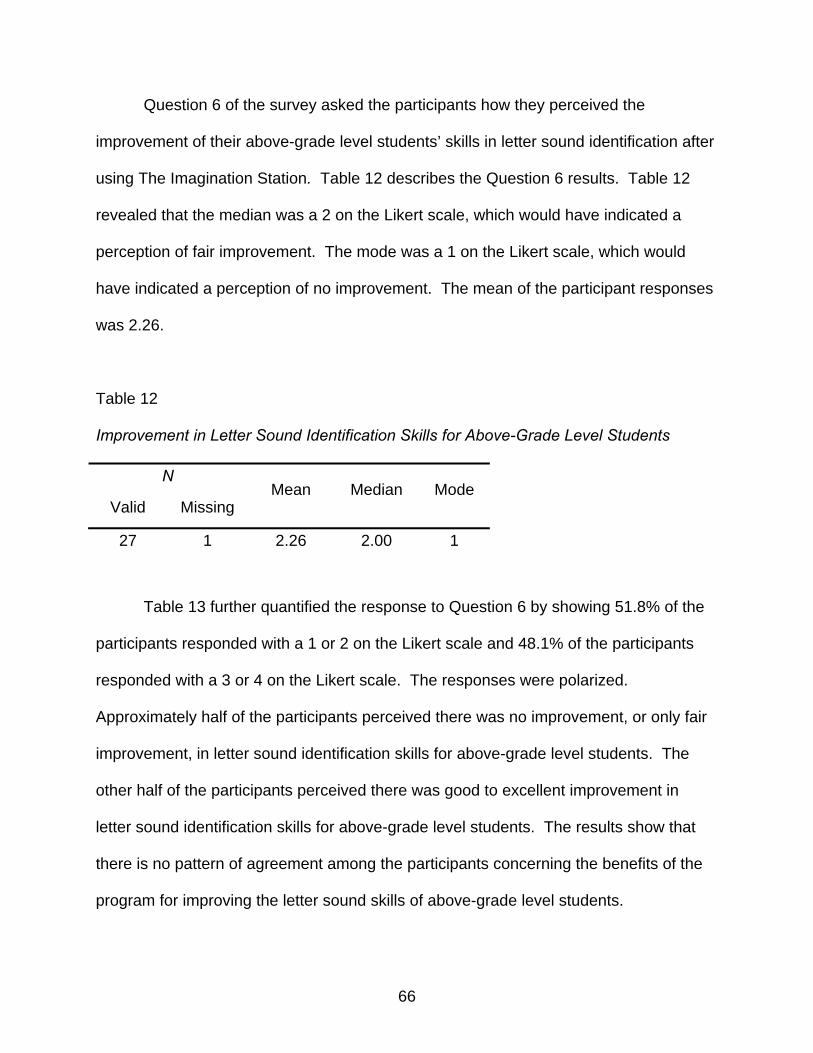
66
Question 6 of the survey asked the participants how they perceived the
improvement of their above-grade level students’ skills in letter sound identification after
using The Imagination Station. Table 12 describes the Question 6 results. Table 12
revealed that the median was a 2 on the Likert scale, which would have indicated a
perception of fair improvement. The mode was a 1 on the Likert scale, which would
have indicated a perception of no improvement. The mean of the participant responses
was 2.26.
Table 12
Improvement in Letter Sound Identification Skills for Above-Grade Level Students
N
Valid Missing Mean Median Mode
27 1 2.26 2.00 1
Table 13 further quantified the response to Question 6 by showing 51.8% of the
participants responded with a 1 or 2 on the Likert scale and 48.1% of the participants
responded with a 3 or 4 on the Likert scale. The responses were polarized.
Approximately half of the participants perceived there was no improvement, or only fair
improvement, in letter sound identification skills for above-grade level students. The
other half of the participants perceived there was good to excellent improvement in
letter sound identification skills for above-grade level students. The results show that
there is no pattern of agreement among the participants concerning the benefits of the
program for improving the letter sound skills of above-grade level students.

67
Table 13
Improvement in Letter Sound Identification Skills for Above-Grade Level Students
Likert Scale Response Frequency Percent
1 None 10 37.0
2 Fair 4 14.8
3 Good 9 33.3
4 Excellent 4 14.8
Note: One participant did not answer this question. Percent based on responses received.
Question 7 of the survey asked participants how they perceived the improvement
of their on-grade level students’ skills in letter sound identification after using The
Imagination Station. Table 14 revealed that the median and the mode were both a 3 on
the Likert scale, which indicated a perception of good improvement.
Table 14
Improvement in Letter Sound Identification Skills for On-Grade Level Students
N
Valid Missing Mean Median Mode
27 1 2.74 3.00 3
Table 15 further quantified the response to Question 7 by showing 59.2% of the
participants responded with a 3 or 4 on the Likert scale, which indicated that over half of

68
the participants perceived the improvement in letter sound identification skills for on-
grade level students to be good or excellent.
Table 15
Improvement in Letter Sound Identification Skills for On-Grade Level Students
Likert Scale Response Frequency Percent
1 None 3 11.1
2 Fair 8 29.6
3 Good 9 33.3
4 Excellent 7 25.9
Note: One participant did not answer this question. Percent based on responses received.
The mean of the responses for Question 7 was 2.74, which indicated that
participants may have perceived more improvement in letter sound identification skills
for their on-grade level students than they did for the above-grade level students where
the mean response was only 2.26.
Question 8 of the survey asked the participants how they perceived the
improvement of their below-grade level students’ skills in letter sound identification after
using The Imagination Station. Table 16 describes the Question 8 results. Table 16
revealed that the median and the mode were both a 3 on the Likert scale, which
indicated a perception of good improvement. The mean of the participant responses
was 3.04, which gave an additional level of confidence that the perception of the

69
participants was that there was good improvement in their below-grade level students’
letter sound identification skills after using The Imagination Station.
Table 16
Improvement in Letter Sound Identification Skills for Below-Grade Level Students
N
Valid Missing Mean Median Mode
26 2 3.04 3.00 3
Table 17 further quantified the response to Question 8 by showing 80.8%
of participants responded with a 3 or 4 on the Likert scale, which indicated a perception
of good or excellent improvement in letter identification skills for below-grade level
students.
The mean of the participant responses was 3.04, which indicated that the
participants perceived the improvement in below-grade level students’ letter sound skills
to be good. Comparison of the means for above-grade level, on-grade level, and
below-grade level students, which were 2.26, 2.74, and 3.04 respectively, indicated that
teachers and administrators perceived that improvement in letter sound identification
skills, after using The Imagination Station, increased inversely with the present learning
level of the student.
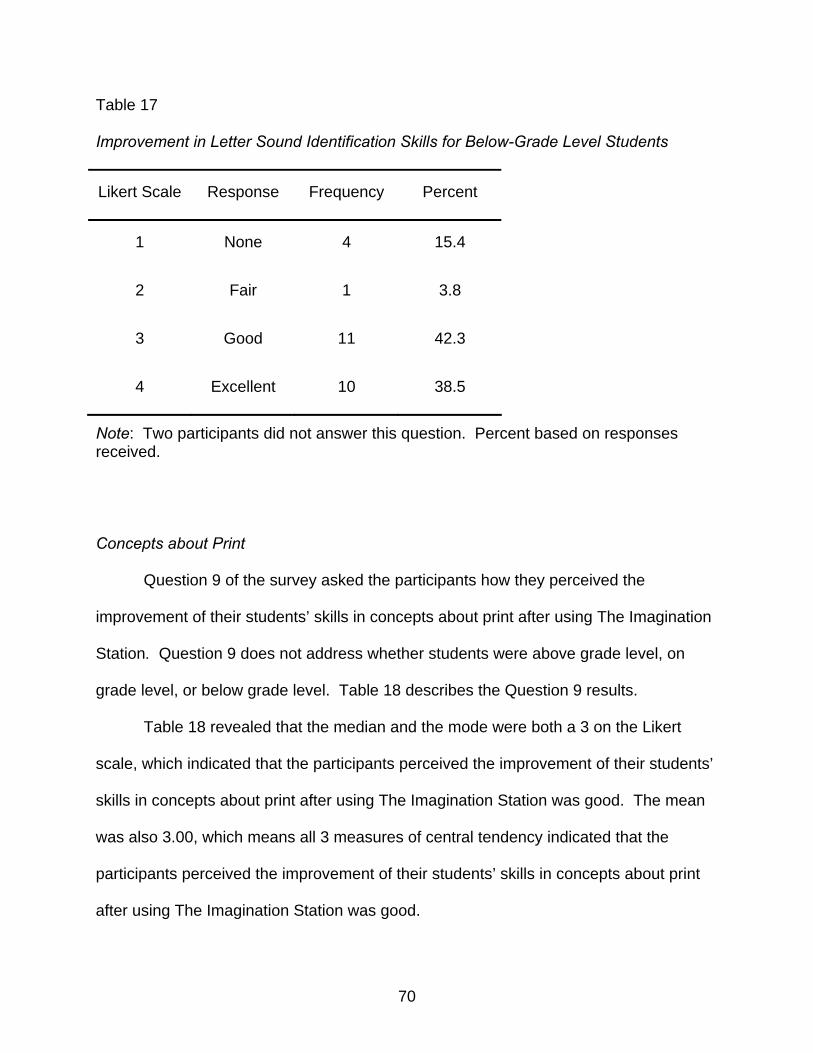
70
Table 17
Improvement in Letter Sound Identification Skills for Below-Grade Level Students
Likert Scale Response Frequency Percent
1 None 4 15.4
2 Fair 1 3.8
3 Good 11 42.3
4 Excellent 10 38.5
Note: Two participants did not answer this question. Percent based on responses received.
Concepts about Print
Question 9 of the survey asked the participants how they perceived the
improvement of their students’ skills in concepts about print after using The Imagination
Station. Question 9 does not address whether students were above grade level, on
grade level, or below grade level. Table 18 describes the Question 9 results.
Table 18 revealed that the median and the mode were both a 3 on the Likert
scale, which indicated that the participants perceived the improvement of their students’
skills in concepts about print after using The Imagination Station was good. The mean
was also 3.00, which means all 3 measures of central tendency indicated that the
participants perceived the improvement of their students’ skills in concepts about print
after using The Imagination Station was good.
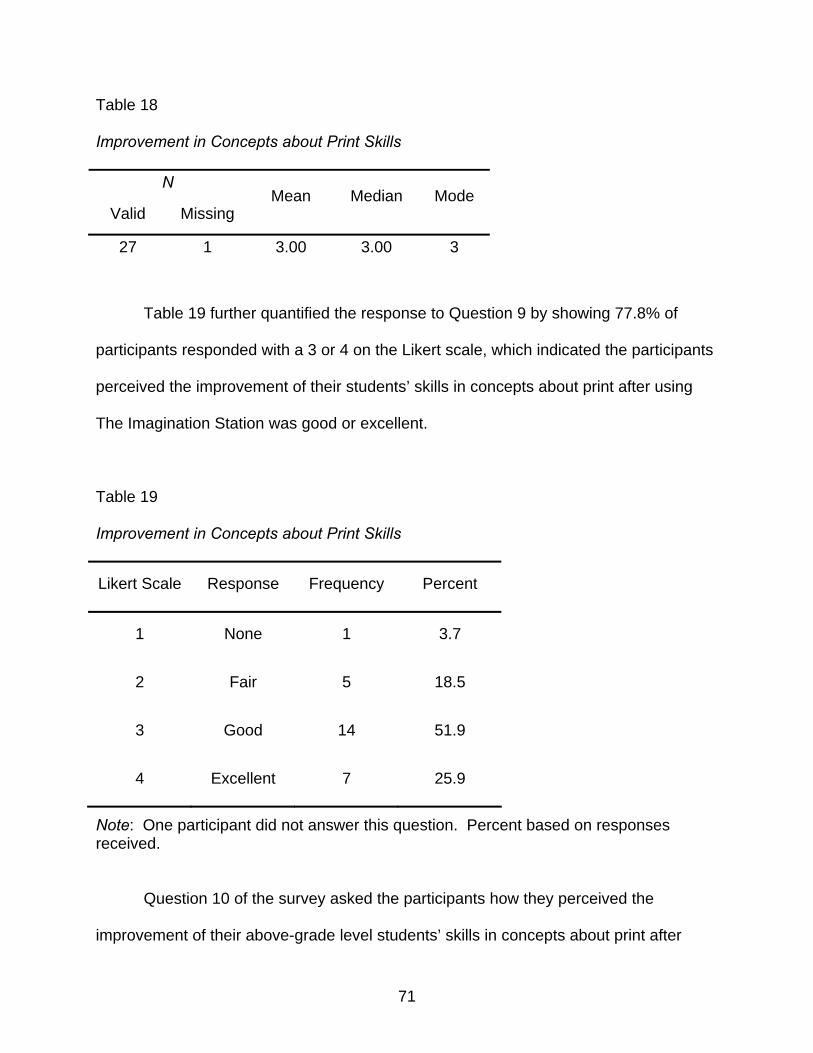
71
Table 18
Improvement in Concepts about Print Skills
N
Valid Missing Mean Median Mode
27 1 3.00 3.00 3
Table 19 further quantified the response to Question 9 by showing 77.8% of
participants responded with a 3 or 4 on the Likert scale, which indicated the participants
perceived the improvement of their students’ skills in concepts about print after using
The Imagination Station was good or excellent.
Table 19
Improvement in Concepts about Print Skills
Likert Scale Response Frequency Percent
1 None 1 3.7
2 Fair 5 18.5
3 Good 14 51.9
4 Excellent 7 25.9
Note: One participant did not answer this question. Percent based on responses received.
Question 10 of the survey asked the participants how they perceived the
improvement of their above-grade level students’ skills in concepts about print after

72
using The Imagination Station. Table 20 describes the Question 10 results. Table 20
revealed that the median and the mode were both a 3 on the Likert scale, which
indicated the participants perceived the improvement of their above-grade level
students’ skills in concepts about print was good. The mean of the participant
responses was 2.52.
Table 20
Improvement in Concepts about Print Skills for Above-Grade Level Students
N
Valid Missing Mean Median Mode
27 1 2.52 3.00 3
Table 21 further quantified the response to Question 10 by showing 40.7% of
participants responded with a 3 on the Likert scale, which indicated those participants
perceived the improvement of their above-grade level students’ skills in concepts about
print was good after using The Imagination Station. 66.6% of the participants
responded with either a 2 or 3 on the Likert scale, which indicated a majority of
participants perceived that the improvement of their above-grade level students’ skills in
concepts about print was fair or good after using the program. 44.4% of participants
responded with a 1 or 2 on the Likert scale, which indicates that many participants
perceived no improvement or fair improvement on this skill for above-grade level
students. The responses were somewhat evenly distributed when compared to
responses for many of the other questions.

73
Table 21
Improvement in Concepts about Print Skills for Above-Grade Level Students
Likert Scale Response Frequency Percent
1 None 5 18.5
2 Fair 7 25.9
3 Good 11 40.7
4 Excellent 4 14.8
Note: One participant did not answer this question. Percent based on responses received.
Question 11 of the survey asked the participants how they perceived the
improvement of their on-grade level students’ skills in concepts about print after using
The Imagination Station. Table 22 describes the Question 11 results. Table 22
revealed that the median and the mode were both a 3 on the Likert scale, which
indicates the participants perceived good improvement in this skill for on-grade level
students. The mean of the participant responses was 2.70.
Table 22
Improvement in Concepts about Print Skills for On-Grade Level Students
N
Valid Missing Mean Median Mode
27 1 2.81 3.00 3

74
Table 23 further quantified the response to Question 11 by showing 44.4% of
participants responded with a 3 on the Likert scale, which indicated that group of
participants perceived good improvement in their on-grade level students’ skills in
concepts about print. 92.5% of participants responded with a 2, 3, or 4 on the Likert
scale, which indicated the large majority of participants perceived fair, good or excellent
improvement in their on-grade level students’ skills in concepts about print.
Table 23
Improvement in Concepts about Print Skills for On-Grade Level Students
Likert Scale Response Frequency Percent
1 None 2 7.4
2 Fair 7 25.9
3 Good 12 44.4
4 Excellent 6 22.2
Note: One participant did not answer this question. Percent based on responses received.
Question 12 of the survey asked the participants how they perceived the
improvement of their below-grade level students’ skills in concepts about print after
using The Imagination Station. Table 24 describes the Question 12 results. Table 24
revealed that the median and the mode were both a 3 on the Likert scale, which
indicated that the participants perceived good improvement in their below-grade level
students’ skills in concepts about print.

75
Table 24
Improvement in Concepts about Print Skills for Below-Grade Level Students
N
Valid Missing Mean Median Mode
27 1 3.15 3.00 3
Table 25 further quantified the response to Question 12 by showing 85.1% of
participants responded with a 3 or 4 on the Likert scale, which indicated a large majority
of participants perceived that improvement in their below-grade level students’ skills in
concepts about print was good or excellent. The mean of the responses was 3.15.
Table 25
Improvement in Concepts about Print Skills for Below-Grade Level Student
Likert Scale Response Frequency Percent
1 None 3 11.1
2 Fair 1 3.7
3 Good 12 44.4
4 Excellent 11 40.7
Note: One participant did not answer this question. Percent based on responses received.
The mean of the participant responses was 3.15, which strengthened the
conclusion that the participants perceived the improvement in below-grade level

76
students’ concepts about print skills to be good. Comparison of the means for above-
grade level, on-grade level, and below-grade level students, which were 2.52, 2.70, and
3.15 respectively, indicated that teachers and administrators perceived that
improvement in concepts about print skills, after using The Imagination Station,
increased inversely with the present learning level of the student.
Phonemic Awareness
Question 13 of the survey asked participants how they perceived the
improvement of their students’ skills in phonemic awareness after using The
Imagination Station. Question 13 does not address whether students were above, on,
or below grade level. Table 26 describes the Question 13 results. Table 26 revealed
that the median and the mode were both a 3 on the Likert scale, which indicated the
participants perceived that their students’ improvement in phonemic awareness skills
after using The Imagination Station was good. The mean response was a 3.08, which
gave additional confidence that the median and the mode were accurate measures of
central tendency for this question.
Table 26
Improvement in Phonemic Awareness Skills
N
Valid Missing Mean Median Mode
26 2 3.08 3.00 3

77
Table 27 further quantified the response to Question 13 by showing 53.8% of
participants responded with a 3 on the Likert scale, which indicated the majority of
participants perceived that their students’ improvement in phonemic awareness was
good. Table 27 showed that 84.6% of the participants responded with a 3 or 4 on the
Likert scale, which indicates a large majority of participants perceived that their
students’ improvement in phonemic awareness skills after using The Imagination
Station was good to excellent.
Table 27
Improvement in Phonemic Awareness Skills
Likert Scale Response Frequency Percent
1 None 2 7.7
2 Fair 2 7.7
3 Good 14 53.8
4 Excellent 8 30.8
Note: Two participants did not answer this question. Percent based on responses received.
Question 14 of the survey asked the participants how they perceived the
improvement of their above-grade level students’ skills in phonemic awareness after
using The Imagination Station. Table 28 describes the Question 14 results. Table 28
revealed that the median and mode were both a 3 on the Likert scale, which indicated

78
the participants perceived that the improvement of their above-grade level students’
skills in phonemic awareness was good.
Table 28
Improvement in Phonemic Awareness Skills for Above-Grade Level Students
N
Valid Missing Mean Median Mode
27 1 2.41 3.00 3
Table 29 further quantified the response to Question 14 by showing 59.2% of the
participants responded with a 2 or 3 on the Likert scale, which indicated the majority of
participants perceived that the improvement of their above-grade level students’ skills in
phonemic awareness was fair or good.
Table 29
Improvement in Phonemic Awareness Skills for Above-Grade Level Students
Likert Scale Response Frequency Percent
1 None 7 25.9
2 Fair 6 22.2
3 Good 10 37.0
4 Excellent 4 14.8
Note: One participant did not answer this question. Percent based on responses received.

79
Question 15 of the survey asked the participants how they perceived the
improvement of their on-grade level students’ skills in phonemic awareness after using
The Imagination Station. Table 30 describes the Question 15 results. Table 30
revealed that the median and the mode were both a 3 on the Likert scale, which
indicated participants perceived that the improvement in their on-grade level students’
skills in phonemic awareness was good.
Table 30
Improvement in Phonemic Awareness Skills for On-Grade Level Students
N
Valid Missing Mean Median Mode
27 1 2.78 3.00 3
Table 31 further quantified the response to Question 15 by showing 40.7% of
participants responded with a 3 on the Likert scale, which indicated the participants
perceived the improvement in their on-grade level students’ phonemic awareness skills
was good. 92.5% of participants responded with a 2, 3, or 4 on the Likert scale, which
indicated the vast majority of the participants perceived the improvement in their on-
grade level students’ phonemic awareness skills ranged from fair to excellent. The
mean of the participant responses was 2.78. Compared with the mean response of
2.41 for above-grade level students, it appeared that participants perceived that on-
grade level students showed slightly more improvement in their phonemic awareness
skills after using The Imagination Station than their above-grade level peers.

80
Table 31
Improvement in Phonemic Awareness Skills for On-Grade Level Students
Likert Scale Response Frequency Percent
1 None 2 7.4
2 Fair 8 29.6
3 Good 11 40.7
4 Excellent 6 22.2
Note: One participant did not answer this question. Percent based on responses received.
Question 16 of the survey asked the participants how they perceived the
improvement of their below-grade level students’ skills in phonemic awareness after
using The Imagination Station. Table 32 describes the Question 16 results. Table 32
revealed that the median and the mode were both a 3 on the Likert scale, which
indicated the participants perceived the improvement as good.
Table 32
Improvement in Phonemic Awareness Skills for Below-Grade Level Students
N
Valid Missing Mean Median Mode
27 1 3.11 3.00 3

81
Table 33 further quantifies the response to Question 16 by showing 48.1%
participants responded with a 3 on the Likert scale, which indicates nearly half of the
participants perceived that the improvement of their below-grade level students in
phonemic awareness skills was good. 85.1% of the participants responded with a 3 or
4 on the Likert scale, which indicated that a large majority of participants perceived the
improvement of their below-grade level students’ skills in phonemic awareness to be
good or excellent.
Table 33
Improvement in Phonemic Awareness Skills for Below-Grade Level Students
Likert Scale Response Frequency Percent
1 None 3 11.1
2 Fair 1 3.7
3 Good 13 48.1
4 Excellent 10 37.0
Note: One participant did not answer this question. Percent based on responses received.
The mean of the participant responses was 3.11, which strengthened the
conclusion that the participants perceived the improvement in below-grade level
students’ phonemic skills to be good to excellent. Comparison of the means for above-
grade level, on-grade level, and below-grade level students, which were 2.41, 2.78, and
3.11 respectively, indicated that teachers and administrators perceived that

82
improvement in phonemic awareness skills, after using The Imagination Station,
increased inversely with the present learning level of the student.
Diagnostic Reading Assessments
Question 17 of the survey asked the participants how they perceived the
improvement of their students’ reading skills, as measured by the Diagnostic Reading
Assessment (DRA), after using The Imagination Station. Question 17 does not address
whether students were above, on, or below grade level. Table 34 describes the
Question 17 results. Table 34 revealed that the median and the mode were both a 3 on
the Likert scale, which indicated the participants perceived their student’s improvement
in reading skills after using The Imagination Station to be good. The Mean response
was 2.89, which is close in value to the other 2 measures of central tendency.
Table 34
Improvement in Diagnostic Reading Assessments
N
Valid Missing Mean Median Mode
27 1 2.89 3.00 3
Table 35 further quantified the response to Question 17 by showing 48.1% of the
participants responded with a 3 on the Likert scale, which indicated that nearly half of
the participants perceived the improvement of their students’ skills in reading as good.
74% of participants perceived the improvement of their students’ skills in reading ad
good or excellent.

83
Table 35
Improvement in Diagnostic Reading Assessments
Likert Scale Response Frequency Percent
1 None 3 11.1
2 Fair 4 14.8
3 Good 13 48.1
4 Excellent 7 25.9
Note: One participant did not answer this question. Percent based on responses received.
Question 18 of the survey asked the participants how they perceived the
improvement of their above-grade level students’ reading skills, as measured by the
Diagnostic Reading Assessment (DRA), after using The Imagination Station. Table 36
describes the Question 18 results. Table 36 revealed that the median and the mode
were both a 3 on the Likert scale, which indicates the participants generally perceived
the improvement of their above-grade level students in reading skills as good.
Table 36
Improvement in Diagnostic Reading Assessments for Above-Grade Level Students
N
Valid Missing Mean Median Mode
27 1 2.48 3.00 3

84
Table 37 further quantified the response to Question 18 by showing 40.7% of
participants responded with a 3 on the Likert scale, which represented a perception of
good improvement in reading skills for students who were already above grade level.
The participant responses for Question 18 were fairly scattered, so no meaningful
conclusion can be drawn regarding the participants’ perception of the improvement of
their above-grade level students’ skills in reading after using The Imagination Station.
The mean of the participant responses was only 2.48, which demonstrates the
participants perceived that the improvement in reading skills for students who were
already above grade level was between fair and good after using the program.
Table 37
Improvement in Diagnostic Reading Assessments for Above-Grade Level Students
Likert Scale Response Frequency Percent
1 None 6 22.2
2 Fair 6 22.2
3 Good 11 40.7
4 Excellent 4 14.8
Note: One participant did not answer this question. Percent based on responses received.
Question 19 of the survey asked the participants how they perceived the
improvement of their on-grade level students’ reading skills, as measured by the
Diagnostic Reading Assessment (DRA), after using The Imagination Station. Table 38
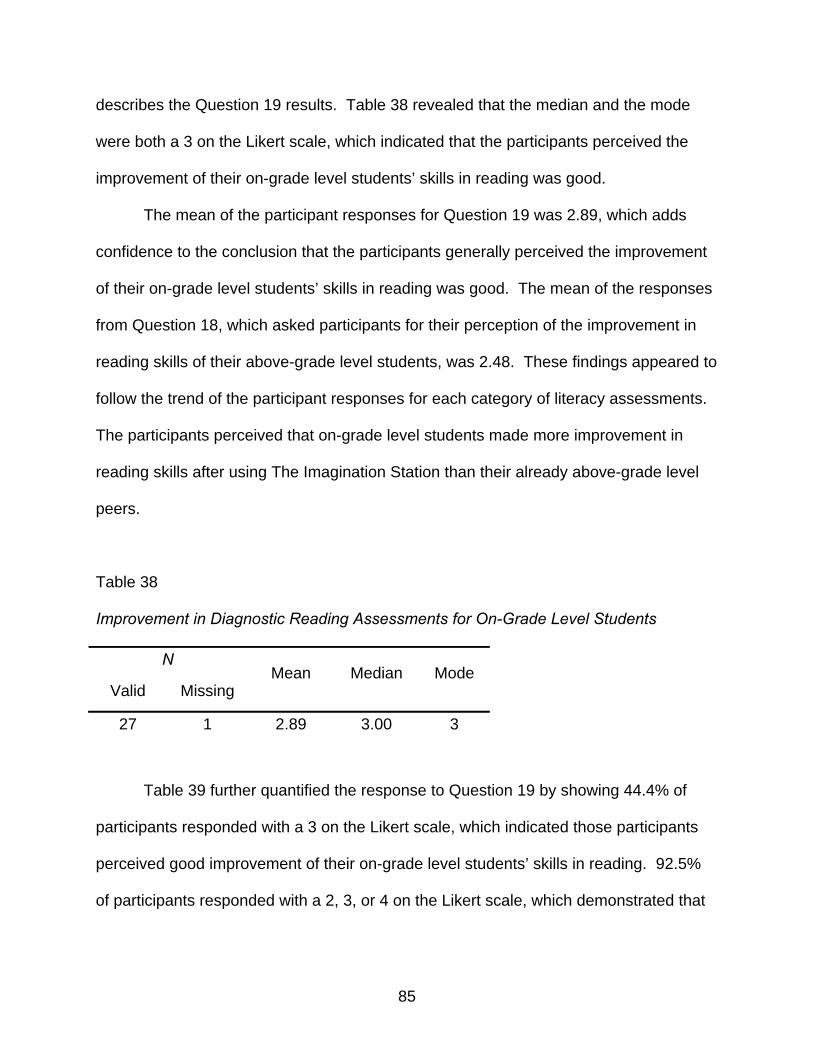
85
describes the Question 19 results. Table 38 revealed that the median and the mode
were both a 3 on the Likert scale, which indicated that the participants perceived the
improvement of their on-grade level students’ skills in reading was good.
The mean of the participant responses for Question 19 was 2.89, which adds
confidence to the conclusion that the participants generally perceived the improvement
of their on-grade level students’ skills in reading was good. The mean of the responses
from Question 18, which asked participants for their perception of the improvement in
reading skills of their above-grade level students, was 2.48. These findings appeared to
follow the trend of the participant responses for each category of literacy assessments.
The participants perceived that on-grade level students made more improvement in
reading skills after using The Imagination Station than their already above-grade level
peers.
Table 38
Improvement in Diagnostic Reading Assessments for On-Grade Level Students
N
Valid Missing Mean Median Mode
27 1 2.89 3.00 3
Table 39 further quantified the response to Question 19 by showing 44.4% of
participants responded with a 3 on the Likert scale, which indicated those participants
perceived good improvement of their on-grade level students’ skills in reading. 92.5%
of participants responded with a 2, 3, or 4 on the Likert scale, which demonstrated that

86
a large majority of participants perceived the improvement of their on-grade level
students’ skills in reading ranged from fair to excellent.
Table 39
Improvement in Diagnostic Reading Assessments for On-Grade Level Students
Likert Scale Response Frequency Percent
1 None 2 7.4
2 Fair 6 22.2
3 Good 12 44.4
4 Excellent 7 25.9
Note: One participant did not answer this question. Percent based on responses received.
Question 20 of the survey asked the participants how they perceived the
improvement of their below-grade level students’ reading skills, as measured by the
Diagnostic Reading Assessment (DRA), after using The Imagination Station. Table 40
describes the Question 20 results. Table 40 revealed that the median and the mode
were both a 3 on the Likert scale, which indicated the participants perceived the
improvement of their below-grade level students’ skills in reading after using The
Imagination Station was good. The mean for the participant responses to Question 20
was 3.07, which corroborates that the median and the mode were meaningful measures
of central tendency.

87
Table 40
Improvement in Diagnostic Reading Assessments for Below-Grade Level Students
N
Valid Missing Mean Median Mode
27 1 3.07 3.00 3
Table 41 further quantified the response to Question 20 by showing 44.4% of
participants responded with a 3 on the Likert scale, which corresponds to the perception
of the participants that the improvement of their below-grade level students’ skills in
reading was good. 81.4% of participants responded with a 3 or 4 on the Likert scale,
which means a large majority of participants perceived good or excellent improvement
in their below-grade level students’ reading skills after using The Imagination Station.
Table 41
Improvement in Diagnostic Reading Assessments for Below-Grade Level Students
Likert Scale Response Frequency Percent
1 None 3 11.1
2 Fair 2 7.4
3 Good 12 44.4
4 Excellent 10 37.0
Note: One participant did not answer this question. Percent based on responses received.

88
Question 21 of the survey asked the participants how they perceived the
improvement of their students’ skills in literacy after using The Imagination Station.
This question provided a measure of the overall perception of teachers and
administrators of their students’ improvement in all of the literacy skills combined. This
question did not differentiate between above-grade level, on-grade level, or below-grade
level students.
Table 42 describes the Question 21 results. Table 42 revealed that the median
and the mode were both a 3 on the Likert scale, which indicated the participants
perceived their students’ improvement in literacy and reading skills after using The
Imagination Station was good. The mean of the participant responses was 3.07, which
gives further confidence that the perception of the participants was that the
improvement of all their students’ skills in literacy was good after using The Imagination
Station.
Table 42
Improvement in Literacy Skills of Students after Using The Imagination Station
N
Valid Missing Mean Median Mode
27 1 3.07 3.00 3
Table 43 further quantified the response to Question 21 by showing 44.4% of
participants responded with a 3 on the Likert scale, which indicated a perception of
good improvement. 77.7% of participants responded with a 3 or 4 on the Likert scale,

89
which indicated that a large majority of participants perceived the improvement of their
students’ skills in literacy after using The Imagination Station was good or excellent.
Table 43
Improvement in Literacy Skills of Students after Using The Imagination Station
Likert Scale Response Frequency Percent
1 None 1 3.7
2 Fair 5 18.5
3 Good 12 44.4
4 Excellent 9 33.3
Note: One participant did not answer this question. Percent based on responses received.
Question 21 asked participants for a general perception of all students’
improvement on all literacy assessments. The mean of the participant responses for
Question 21 was 3.07. This mean is closest to the mean for the participant responses
regarding below-grade level students on all the literacy assessments. The participants
consistently perceived greater improvement for below-grade level students than for on-
grade level students, or above-grade level students, for each individual literacy
assessment. In Chapter 5, possible reasons for the closeness of the mean for the
perceived improvement of all students and the mean for the perceived improvement of
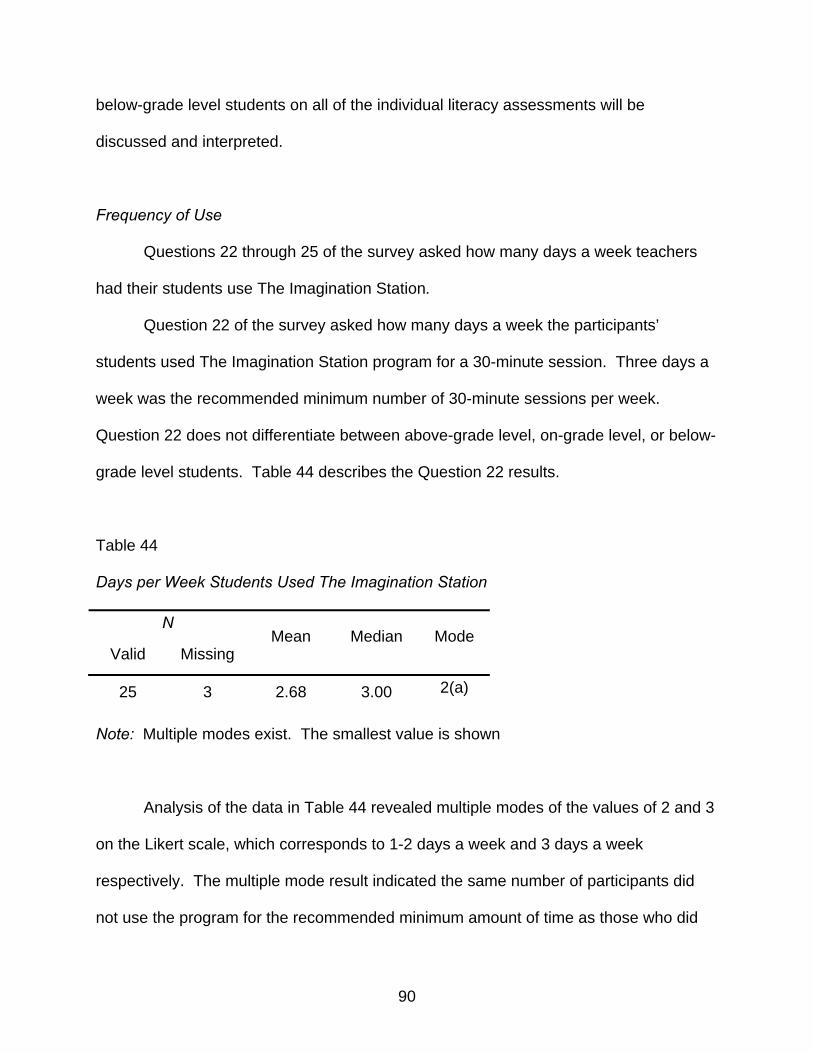
90
below-grade level students on all of the individual literacy assessments will be
discussed and interpreted.
Frequency of Use
Questions 22 through 25 of the survey asked how many days a week teachers
had their students use The Imagination Station.
Question 22 of the survey asked how many days a week the participants’
students used The Imagination Station program for a 30-minute session. Three days a
week was the recommended minimum number of 30-minute sessions per week.
Question 22 does not differentiate between above-grade level, on-grade level, or below-
grade level students. Table 44 describes the Question 22 results.
Table 44
Days per Week Students Used The Imagination Station
N
Valid Missing Mean Median Mode
25 3 2.68 3.00 2(a)
Note: Multiple modes exist. The smallest value is shown
Analysis of the data in Table 44 revealed multiple modes of the values of 2 and 3
on the Likert scale, which corresponds to 1-2 days a week and 3 days a week
respectively. The multiple mode result indicated the same number of participants did
not use the program for the recommended minimum amount of time as those who did

91
use the program 3 days a week. The median score was a 3 on the Likert scale, which
indicated 3 days a week.
Table 45 further quantifies the response to Question 22 by showing there were
no participants who chose a 1 on the Likert scale, which means that all participants had
their students use the program for at least 1, 30-minute a week. Table 45 also revealed
that only 12% of participants used The Imagination Station with their students 4 or 5
days a week. Only 44% of participants used the program for the recommended
minimum of 3 days a week. Another 44% of participants only used The Imagination
Station program with their students 1 or 2 days a week during the pilot study period.
Table 45
Days per Week Students Used The Imagination Station
Likert Scale Response Frequency Percent
1 0 Days 0 0.0
2 1-2 Days 11 44.0
3 3 Days 11 44.0
4 4-5 Days 3 12.0
Note: Three participants did not answer this question. Percent based on responses received.
Question 23 of the survey asked how many days a week the participant’s above-
grade level students used The Imagination Station program for a 30-minute session.
Table 46 describes the Question 23 results.

92
Table 46
Days per Week Above-Grade Level Students Used The Imagination Station
N
Valid Missing Mean Median Mode
24 4 2.63 2.50 2
Analysis of the data in Table 46 revealed that the mode was a 2 on the Likert
scale, which indicated that participants perceived that their above-grade level students
used the program only 1-2 days a week. The median was a 2.50 on the Likert scale,
which indicated that half of the treatment group’s above-grade level students used the
program less than the recommended minimum 3, 30-minute sessions per week. The
mean of the participant responses was 2.63, which also confirms that less than the
mathematical average of the above-grade level students used the program for the
recommended 3, 30-minute sessions per week.
Table 47 further quantified the response to Question 23 by showing that 50% of
participants responded with a 2 on the Likert scale, which indicated only 1-2 days of use
per week. Another 50% of the participants responded with a 3 or 4 on the Likert scale,
which indicated only half of the above-grade level students used the program for at least
the recommenced minimum sessions per week.

93
Table 47
Days per Week Above-Grade Level Students Used The Imagination Station
Likert Scale Response Frequency Percent
1 0 Days 0 0.0
2 1-2 Days 12 50.0
3 3 Days 9 37.5
4 4-5 Days 3 12.5
Note: Four participants did not answer this question. Percent based on responses received.
Question 24 of the survey asked how many days a week the participants’ on-
grade level students used The Imagination Station program for a 30-minute session.
Table 48 describes the Question 24 results.
Table 48
Days per Week On-Grade Level Students Used The Imagination Station
N
Valid Missing Mean Median Mode
24 4 2.71 3.00 3
Table 48 revealed that the median and mode were both a 3 on the Likert scale,
which indicated the participants perceived their on-grade level students used the
program for the recommended minimum of 3, 30-minute sessions per week. Table 49

94
showed that 41.7% of participants did not use the program with their on-grade level
students for the recommended minimum amount per week.
Table 49
Days per Week On-Grade Level Students Used The Imagination Station
Likert Scale Response Frequency Percent
1 0 Days 0 0.0
2 1-2 Days 10 41.7
3 3 Days 11 45.8
4 4-5 Days 3 12.5
Note: Four participants did not answer this question. Percent based on responses received.
Question 25 of the survey asked how many days a week the participant’s below-
grade level students used The Imagination Station program for a 30-minute session.
Table 50 describes the Question 25 results.
Table 50
Days per Week Below-Grade Level Students Used The Imagination Station
N
Valid Missing Mean Median Mode
25 3 3.08 3.00 3

95
Analysis of the data in Table 50 revealed that the median and mode were both a
3 on the Likert scale, which indicated the participants perceived that their below-grade
level students used the program for the recommended 3, 30-minutes sessions per
week. Table 51 further quantified the response to Question 25 by showing 44% of
participants perceived that their below-grade level students used the program for the
recommended minimum of 3, 30-minute sessions per week. 76% of participants
perceived that their below-grade level students used the program at least the
recommended amount of time of 3, 30-minutes sessions per week.
Table 51
Days per Week Below-Grade Level Students Used The Imagination Station
Likert Scale Response Frequency Percent
1 0 Days 0 0.0
2 1-2 Days 6 24.0
3 3 Days 11 44.0
4 4-5 Days 8 32.0
Note: Three participants did not answer this question. Percent based on responses received.
The means of the participant responses indicating how many days a week their
above-grade level, on-grade level, and below-grade level students used The
Imagination Station program for a 30-minute session were 2.63, 2.71, and 3.08
respectively. Comparison of the means for above-grade level, on-grade level, and

96
below-grade level student use of the program indicated that teachers and administrators
perceived that days per week of using the program increased inversely with the present
learning level of the student.
Student Reports and Books in Print
Questions 26 through 29 of the survey asked participants how often they used
the student reports and printed books generated by The Imagination Station program.
Question 26 of the survey asked the participants how many days per week they printed
individual student reports. Table 52 describes the Question 26 results.
Table 52
Days per Week of Printing Student Reports
N
Valid Missing Mean Median Mode
23 5 1.57 2.00 1(a)
Note: Multiple modes exist. The smallest value is shown
Analysis of the data in Table 52 revealed that the median response was a 2 on
the Likert scale, which indicated the participants printed individual student progress
reports 1-2 days a week. However, multiple modes existed with the same number of
participants responding with a 1 and 2 on the Likert scale, which indicated just as many
participants did not print any reports as those who printed them only 1-2 days a week.
The mean of the participant responses was 1.57.

97
Table 53 further quantified the response to Question 26 by showing 47.8% pf
participants never printed any student reports and another 47,8% pf the participants
only printed the reports 1-2 days a week. Five participants who did not answer this
question are likely administrators who were not as likely to print student reports, as the
teacher participants would be, since they could use them to guide instruction.
Table 53
Days per Week of Printing Student Reports
Likert Scale Response Frequency Percent
1 0 Days 11 47.8
2 1-2 Days 11 47.8
3 3 Days 1 4.3
4 4-5 Days 0 0.0
Note: Five participants did not answer this question. Percent based on responses received.
Question 27 of the survey asked the participants how many days per week they
used the individual student reports generated by The Imagination Station program to
facilitate instruction during guided reading. Table 54 revealed that the mode of the
participant responses was a 1 on the Likert scale, which indicated that participants
never used the student reports. The 5 participants who did not answer this question
were likely administrators who were not as likely to use student reports to facilitate

98
instruction in guided reading, as the teacher participants would be, since the teachers
would be the ones doing the guiding reading instruction.
Table 54
Days per Week of Using Student Reports to Guide Instruction
N
Valid Missing Mean Median Mode
23 5 1.74 2.00 1
Table 55 further quantified the response to Question 27 by showing 47.8% of
participants never used student reports to guide instruction.
Table 55
Days per Week of Using Student Reports to Guide Instruction
Likert Scale Response Frequency Percent
1 0 Days 11 47.8
2 1-2 Days 8 34.8
3 3 Days 3 13.0
4 4-5 Days 1 4.3
Note: Five participants did not answer this question. Percent based on responses received.

99
Question 28 of the survey asked the participants how many days per week they
printed books generated by The Imagination Station program. Table 56 describes the
Question 28 results.
Table 56
Days per Week of Printing Books
N
Valid Missing Mean Median Mode
24 4 1.25 1.00 1
Table 56 revealed that the median and mode were both a 1 on the Likert scale.
Table 57 further quantified the response to Question 28 by showing that 79.2% never
printed leveled books from the program.
Table 57
Days per Week of Printing Books
Likert Scale Response Frequency Percent
1 0 Days 19 79.2
2 1-2 Days 4 16.7
3 3 Days 1 4.2
4 4-5 Days 0 0.0
Note: Four participants did not answer this question. Percent based on responses received.

100
Question 29 of the survey asked participants how many days per week they used
the books they printed from The Imagination Station program. Table 58 describes the
Question 29 results.
Table 58
Frequency of Using Books Printed from The Imagination Station
N
Valid Missing Mean Median Mode
24 4 1.33 1.00 1
Table 59 further quantified the response to Question 29 by showing 79.2% of
participants never used a leveled book generated by The Imagination station. This
corresponds to the 79.2% of participants who never printed a book from the program.
Table 59
Frequency of Using Books Printed from The Imagination Station
Likert Scale Response Frequency Percent
1 0 Days 19 79.2
2 1-2 Days 3 12.5
3 3 Days 1 4.2
4 4-5 Days 1 4.2
Note: Four participants did not answer this question. Percent based on responses received.

101
User Friendliness
Questions 30 through 32 of the survey were concerned with whether or not the
program was user friendly for both the student and the teacher. Question 30 of the
survey asked participants how often students eager to use The Imagination Station.
The choices were always, most of the time, some of the time, and never. Table 60
describes the Question 30 results. Table 60 revealed that the median and the mode
were both a 4 on the Likert scale, which indicated that the students were always eager
to use The Imagination Station program. The mean of the participant responses was
3.50, which validates that the perception of the participants that the students were close
to being always eager to use The Imagination Station computer-assisted instructional
program in reading.
Table 60
Amount of Time that Students Were Eager to Use The Imagination Station
N
Valid Missing Mean Median Mode
26 2 3.50 4.00 4
Table 61 further quantified the response to Question 30 by showing 61.5% of
participants responded with a 4 on the Likert scale, which indicated the students were
always eager to use The Imagination Station program. 88.4% of participants responded
with a 3 or 4 on the Likert scale, which indicated a large majority of participants
perceived that their students were always eager to use the program or eager to use the
program most of the time.

102
Table 61
Amount of Time that Students Were Eager to Use The Imagination Station
Likert Scale Response Frequency Percent
1 Never 0 0.0
2 Some 3 11.5
3 Most 7 26.9
4 Always 16 61.5
Note: Two participants did not answer this question. Percent based on responses
Question 31 of the survey asked the participants how often the students were
able to use The Imagination Station program independently after being trained. Table
62 describes the Question 31 results.
Table 62
Independent Student Use of The Imagination Station
N
Valid Missing Mean Median Mode
26 2 3.54 4.00 4
Analysis of the data in Table 62 revealed that the median and the mode were
both a 4 on the Likert scale, which indicated that students were always able to use the
program independently after initial training. Table 63 showed that 96.2% of participants

103
responded that students were able to use the program independently after initial training
most of the time or all of time.
Table 63
Independent Student Use of The Imagination Station
Likert Scale Response Frequency Percent
1 Never 0 0.0
2 Some 1 3.8
3 Most 10 38.5
4 Always 15 57.7
Note: Two participants did not answer this question. Percent based on responses
Question 32 of the survey asked the participants how often The Imagination
Station program was easy to use for the teachers. Table 64 describes the Question 32
results.
Table 64
Teacher Ease of Use of The Imagination Station
N
Valid Missing Mean Median Mode
26 2 3.65 4.00 4
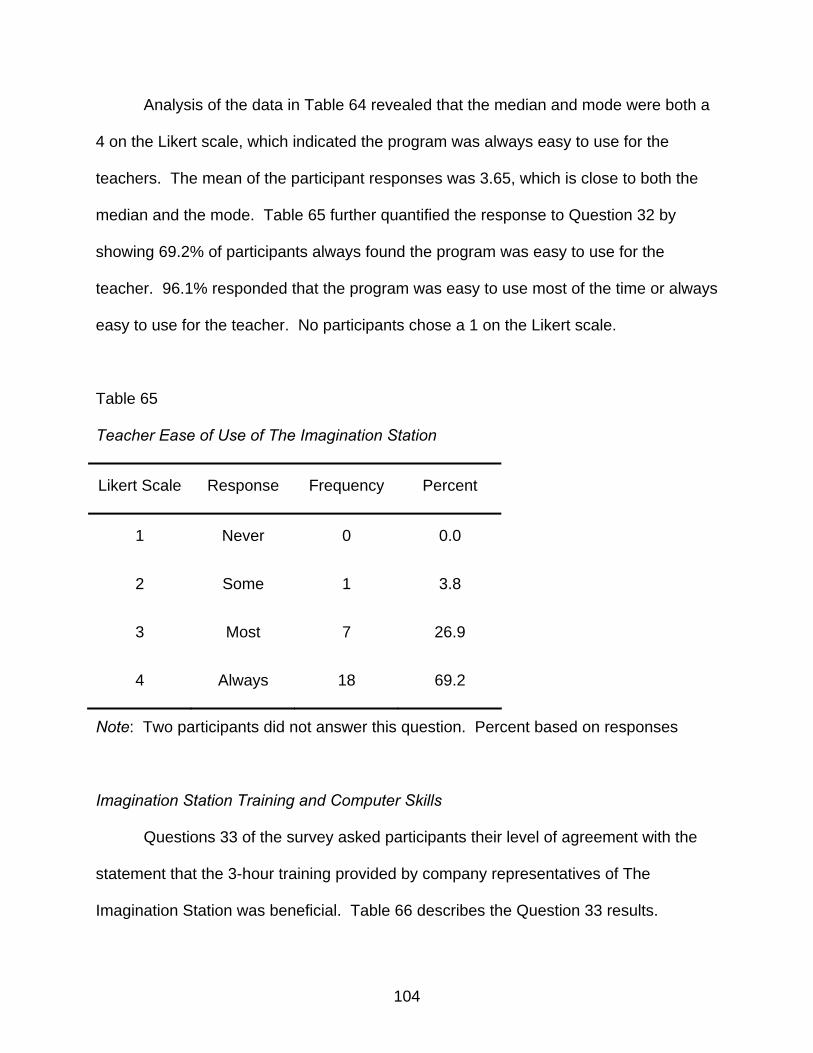
104
Analysis of the data in Table 64 revealed that the median and mode were both a
4 on the Likert scale, which indicated the program was always easy to use for the
teachers. The mean of the participant responses was 3.65, which is close to both the
median and the mode. Table 65 further quantified the response to Question 32 by
showing 69.2% of participants always found the program was easy to use for the
teacher. 96.1% responded that the program was easy to use most of the time or always
easy to use for the teacher. No participants chose a 1 on the Likert scale.
Table 65
Teacher Ease of Use of The Imagination Station
Likert Scale Response Frequency Percent
1 Never 0 0.0
2 Some 1 3.8
3 Most 7 26.9
4 Always 18 69.2
Note: Two participants did not answer this question. Percent based on responses
Imagination Station Training and Computer Skills
Questions 33 of the survey asked participants their level of agreement with the
statement that the 3-hour training provided by company representatives of The
Imagination Station was beneficial. Table 66 describes the Question 33 results.

105
Table 66
Imagination Station Training Was Beneficial
N
Valid Missing Mean Median Mode
28 0 3.50 4.00 4
Analysis of the data in Table 66 revealed that the median and mode were both 4
on the Likert scale, which indicates the participants strongly agreed that the training was
beneficial. The mean of the participant responses was 3.50. Table 67 further quantified
the response to Question 33 by showing 67.9% of participants strongly agreed that the
training was beneficial. A large majority of participants, 89.3%, responded agreed or
strongly agreed that the training was beneficial.
Table 67
Imagination Station Training Was Beneficial
Likert Scale Response Frequency Percent
1 Do Not Agree 2 7.1
2 Agree Somewhat 1 3.6
3 Agree 6 21.4
4 Strongly Agree 19 67.9

106
Question 34 of the survey asked the participants their level of agreement with the
statement that their computer skills were sufficient to use The Imagination Station
program effectively. Table 68 describes the Question 34 results.
Table 68
Sufficient Personal Computer Skills of Teacher to Use Program
N
Valid Missing Mean Median Mode
28 0 3.71 4.00 4
Analysis of the data in Table 68 revealed that the median and mode were both 4
on the Likert scale, which indicated that the participants strongly agreed that their
personal computer skills were sufficient to use the program effectively. The mean of the
participant responses was 3.71, which is mathematically close to both the median and
the mode.
Table 69 further quantified the response to Question 34 by showing 75% of
participants strongly agreed that their personal computer skills were sufficient to use the
program effectively. A majority of 96.4% of participants agreed or strongly agreed that
their personal computer skills were sufficient to use the program effectively. Only 1
participant agreed somewhat that her personal computer skills were sufficient to use the
program effectively. All participants agreed at some level that their computer skills were
sufficient to use the program effectively. The vast majority strongly agreed that their
personal computer skills were sufficient to use the program effectively.

107
Table 69
Sufficient Personal Computer Skills of Teacher to Use Program
Likert Scale Response Frequency Percent
1 Do Not Agree 0 0.0
2 Agree Somewhat 1 3.6
3 Agree 6 21.4
4 Strongly Agree 21 75.0
Question 35 of the survey asked the participants their level of agreement with the
statement that their students’ computer skills were sufficient to use The Imagination
Station program effectively. Table 70 describes the Question 35 results.
Table 70
Sufficient Personal Computer Skills of Students to Use Program
N
Valid Missing Mean Median Mode
28 0 3.50 4.00 4
Analysis of the data in Table 70 revealed that the median and mode were both 4
on the Likert scale, which indicated that the participants perceived that their students’
computer skills were sufficient to use the program effectively. The mean of the
participant responses was 3.50. Table 71 further quantified the response to Question

108
35 by showing 57.1% of participants strongly agreed that their students’ computer skills
were sufficient to use the program effectively. A large majority, which consisted of
96.4% of participants, agreed or strongly agreed that their students’ computer skills
were sufficient to use the program effectively.
Table 71
Sufficient Personal Computer Skills of Students to Use Program
Likert Scale Response Frequency Percent
1 Do Not Agree 1 3.6
2 Agree Somewhat 0 0.0
3 Agree 6 21.4
4 Strongly Agree 21 75.0
Question 36 of the survey asked the participants to rate their personal computer
skills as poor, fair, good, or excellent. Table 72 describes the Question 36 results.
Table 72
Participants Self Evaluation of Personal Computer Skills
N
Valid Missing Mean Median Mode
28 0 3.39 3.00 3

109
Analysis of the data in Table 72 revealed that the median and the mode were
both a 3 on the Likert scale, which indicated that participants rated their personal
computer skills as good. The mean of the participant responses was 3.39. Table 73
further quantified the response to Question 36 by showing 53.6% of participants rated
their personal computer skills as good. That is in comparison to 96.4%% of the
participants who agreed or strongly agreed that their personal computer skills were
sufficient to use The Imagination Station program effectively. This comparison implies
that the program is quite user friendly for the teachers and administrators.
Table 73
Participants Self Evaluation of Personal Computer Skills
Likert Scale Response Frequency Percent
1 Poor 0 0.0
2 Fair 1 3.6
3 Good 15 53.6
4 Excellent 12 42.9
Question 37 of the survey asked the participants to rate their students’ personal
computer skills as poor, fair, good, or excellent. Table 74 describes the Question 37
results. Analysis of the data in Table 74 revealed that the median and the mode were
both a 3 on the Likert scale, which indicated that the participants perceived the students’
personal computer skills were good. The mean of the participant responses was 3.11.

110
Table 74
Evaluation of Students’ Personal Computer Skills
N
Valid Missing Mean Median Mode
28 0 3.11 3.00 3
Table 75 further quantified the response to Question 37 by showing 67.9% of
participants perceived the students’ personal computer skills as good and 89.3% of
participants perceived the students’ personal computer skills as good or excellent.
Table 75
Evaluation of Students’ Personal Computer Skills
Likert Scale Response Frequency Percent
1 Poor 0 0.0
2 Fair 3 10.7
3 Good 19 67.9
4 Excellent 6 21.4
Demographics of Survey Participants
Section V of the survey asked participants demographic questions. Question 38
determined that there were 23 teachers and 5 administrators among the 28 participants
in the survey. Question 39 determined the number of participants from each of the 4

111
schools conducting the pilot study of The Imagination Station program. Table 76
describes the Question 39 results with the distribution of participants among the 4
schools.
Table 76
Participants from Each Pilot Program School
Likert Scale Response Frequency Percent
1 Alton School #1 9 32.1
2 Bradley School #2 3 10.7
3 Carsten School #3 7 25.0
4 Drew School #4 9 32.1
Question 40 of the survey asked participants to identify their years of teaching
experience. There were 5 categories on the Likert scale for Question 40. The mode
response of the participants was a 4 on the Likert scale, representing 11-20 years of
experience. However, the median score was a 3 on the Likert scale, representing 6-10
years of experience. Table 77 describes the percentages of participants in each
category of teaching experience.

112
Table 77
Years of Teaching Experience
Likert Scale Response Frequency Percent
1 1-2 5 17.9
2 2-5 6 21.4
3 6-10 4 14.3
4 11-20 8 28.6
5 > 20 5 17.9
Question 41 of the survey asked the participants their gender. All 28 participants
in the survey were female. Question 42, the last question in the survey, asked the
participants their age. Table 78 describes the frequency of participants in each of the
age ranges. The mode is a Likert scale score of 1, which represents ages 22 to 30.
46.4% of participants fall within this age range. The median is a 2 on the Likert scale,
which represents ages 31-35. The percentage of participants who are age 35 and less
is 57.1%. The percentage of participants who are age 40 and less is 67.8%.

113
Table 78
Age of Participants
Likert Scale Response Frequency Percent
1 22-30 13 46.4
2 31-35 3 10.7
3 36-40 3 10.7
4 41-45 2 7.1
5 46-55 5 17.9
6 > 55 2 7.1
In Chapter 5, there is further summary and interpretation of the survey results.
The descriptive statistics presented in Chapter 4 will be used to compare the
perceptions of teachers and administrators of computer-assisted instruction using The
Imagination Station program to the results of the literacy assessments. The small
sample size of survey participants does not allow for further statistical analysis of the
survey results.
Literacy Assessment Results
In the quasi-experimental research portion of the study, the differences in the
means of the average z scores on the literacy assessments of the treatment and control

114
groups were considered statistically significant if the probability of the difference
occurring by chance was less than 5% (p < 0.05).
An analysis of the assessment scores in the fall, winter, and spring found that the
individual scores were highly correlated. Because the assessments were found to be
testing the same construct, they were combined for analysis. Each student’s fall literacy
assessment scores were combined to create 1 fall literacy score for that student. Each
student’s winter literacy assessment scores were combined to create 1 winter literacy
score for that student. Each student’s spring literacy assessment scores were
combined to create 1 spring literacy score for that student. The means of the raw
scores were calculated. The z scores were calculated from the raw data. The means of
the z scores were then calculated and used for statistical analysis.
Univariate Results
Descriptive statistics for the raw data of the fall, winter, and spring assessments
are included in Tables B1, B2 and B3 which are found in the Appendix B. The z scores
were calculated from the means of the fall, winter and spring assessments. Table B4,
found in Appendix B, is Levene’s test of equality of error variance for the z fall mean, the
z winter mean, and the z spring mean values.
The means of the average z scores by school were calculated and are shown in
Table 79. There were 1834 students included in the data.

115
Table 79
Means of Average z Scores by School
School z_Fall_Mean z_Winter_Mean z_Spring_Mean
Mean .0370979 .2490703 .0709749
N 125 125 125 1
Std. Deviation .67722186 .60776283 .39173600
Mean -.4894911 -.4710615 -.3982551
N 79 79 79 2
Std. Deviation .78895885 1.12932577 .59123767
Mean -.1277852 -.0914520 -.2422941
N 86 86 86 3
Std. Deviation .69170984 .68852402 .48084227
Mean -.2157881 -.0110704 -.1316292
N 159 159 159 4
Std. Deviation .68787381 .64095184 .37667579
Mean -.1666378 .1700859 .4356567
N 99 99 99 5
Std. Deviation .65947441 .56769671 .33593863
(table continues)

116
Table 79 (continued).
School z_Fall_Mean z_Winter_Mean z_Spring_Mean
Mean .0571234 -.1851806 .2745720
N 153 153 153 6
Std. Deviation .83066850 .76918801 .40090552
Mean .5855489 .1913889 .4516857
N 112 112 112 7
Std. Deviation .75658409 .71263869 .40476886
Mean .0136973 .1307284 .0246890
N 121 121 121 8
Std. Deviation .57184778 .54260834 .31951430
Mean .1563595 .2443860 .0006951
N 115 115 115 9
Std. Deviation .50834160 .45237957 .30195342
Mean -.1591890 -.3104704 -.1879456
N 80 80 80 10
Std. Deviation .67488811 .86401686 .44973513
(table continues)

117
Table 79 (continued).
School z_Fall_Mean z_Winter_Mean z_Spring_Mean
Mean -.0667074 -.0757446 -.0794096
N 106 106 106 11
Std. Deviation .67275428 .69534374 .41844632
Mean -.0810716 -.0613544 -.0415026
N 91 91 91 12
Std. Deviation .56881929 .58565741 .36142824
Mean .1119786 -.1008237 -.1556131
N 68 68 68 13
Std. Deviation .69800587 .88468130 .69138014
Mean .0182254 -.0690828 -.1189351
N 126 126 126 14
Std. Deviation .56248069 .60439081 .28672582
Mean .1658373 .2543102 .0499788
N 128 128 128 15
Std. Deviation .58921562 .49627334 .41907477
Mean .1023890 .0404066 -.0820413
N 86 86 86 16
Std. Deviation .55178734 .55971238 .35333521
(table continues)

118
Table 79 (continued).
School z_Fall_Mean z_Winter_Mean z_Spring_Mean
Mean -.1214217 -.1720034 -.2147908
N 100 100 100 17
Std. Deviation .67468622 .78181823 .56102368
Mean -.0006825 .0016221 -.0002703
N 1834 1834 1834 Total
Std. Deviation .69395515 .70562589 .46946553
The means of the average z score by group were calculated and are shown in
Table 80. The means for the treatment group were lower for each administration of
literacy assessments.

119
Table 80
Means of Average z Score by Group
Group z_Fall_Mean z_Winter_Mean z_Spring_Mean
Mean -.1766868 -.0349780 -.1433333
N 449 449 449 1
Std. Deviation .72386529 .78484656 .47270097
Mean .0563760 .0134874 .0461090
N 1385 1385 1385 2
Std. Deviation .67445290 .67784288 .45910548
Mean -.0006825 .0016221 -.0002703
N 1834 1834 1834 Total
Std. Deviation .69395515 .70562589 .46946553
Bivariate Results
Pearson correlations showed that the z scores for the individual literacy
assessments were correlated. Based on the z score correlations, the z scores for the
fall, winter, and spring assessments were combined to create an average z score for
statistical analysis of the fall, winter, and spring literacy assessments.

120
Multivariate Results
The general linear model for the 3 assessments was used with repeated
measures ANOVA to compare the average z score means of the fall, winter, and spring
assessments. Repeated measures ANOVA was also used to compare the average z
score means of the treatment group to the average z score means of the control group.
Table 81 shows the within subject factors for the dependent variables.
Table 81
Within Subject Factors (Assessments)
Assessment Dependent Variable
1 z_Fall_Mean
2 z_Winter_Mean
3 z_Spring_Mean
Table 82 shows the between subject factors of the groups.
Table 82
Between-Subjects Factors (Treatment Group=1, Control Group=2)
N
1 449 Group
2 1385

121
Table 83 shows the average z score means by treatment and control group. The
number 1 identifies the treatment group and the number 2 identifies the control group.
Table 83
Average z Score Means by Group
Group Mean Std. Deviation N
1 -.1766868 .72386529 449
2 .0563760 .67445290 1385z_Fall_Mean
Total -.0006825 .69395515 1834
1 -.0349780 .78484656 449
2 .0134874 .67784288 1385z_Winter_Mean
Total .0016221 .70562589 1834
1 -.1433333 .47270097 449
2 .0461090 .45910548 1385z_Spring_Mean
Total -.0002703 .46946553 1834
There is a 95% level of confidence that interval shown in Table 84 contains the
mean for the literacy assessments.

122
Table 84
Estimated Marginal Means for Assessments
95% Confidence Interval Mean Std. Error
Lower Bound Upper Bound
-.040 .015 -.070 -.010
There is a 95% level of confidence that intervals shown in Table 85 contain the
means for the treatment and control groups. Group 1 is the treatment group. Group 2
is the control group.
Table 85
Estimated Marginal Means for Groups
95% Confidence Interval Group Mean Std. Error
Lower Bound Upper Bound
1 -.118 .027 -.170 -.066
2 .039 .015 .009 .068
Table 86 indicates that there is a significant difference between the treatment
and control groups on the composite literacy assessment score:
F (1, 1832) = 26.374, p = 3.112 x 10⁻⁷. Therefore, the null hypothesis that there is no
difference between the treatment and control groups on the composite literacy
assessment score is rejected statistically.

123
Table 86
Between Subject Factors Test of Significance (Treatment and Control Groups)
SS df MS F Sig.
Contrast 8.357 1 8.357 26.374 .000
Error 580.484 1832 .317
Note: The F tests the effect of Group. This test is based on the linearly independent
pairwise comparisons among the estimated marginal means.
*p < .05. **p < .001.
There is statistical difference between the treatment and control groups on the
composite literacy assessment score. However, there is not a practical difference
between the treatment and control groups on the literacy assessments when effect size
is considered. The effect size was calculated and the value of η2 was .014. The effect
size indicates that the group membership variable could explain 1.4% of the variance in
the students’ literacy assessment scores. Based on Cohen (1988) this would be a small
effect.
The survey results and the statistical analysis of the literacy assessment scores
of the control and treatment groups will be interpreted in Chapter 5.

124
CHAPTER 5
SUMMARY
In the previous chapter, the results of the data analysis for the survey and the
literacy assessments were presented and discussed. In Chapter 5, the results are
interpreted and recommendations are made for future research.
Survey and Descriptive Research
Literacy Assessments
Gingold (2002) found that computer-assisted instruction made a positive,
significant difference in kindergartner’s abilities to recognize alphabet letters when
compared with traditional classroom instruction in reading. Participants whose students
participated in the pilot study of The Imagination Station® Internet-based supplemental
reading instruction and intervention program (Imagination Station, Inc., Richardson TX,
www1.istation.com) perceived that the program had a more positive impact on the
improvement of letter identification skills of below-grade level students than it did on the
improvement of letter identification skills of on-grade level and above-grade level
students. Participants generally perceived that improvement in letter identification skills,
after using The Imagination Station, increased inversely with the present learning level
of the student. The participants perceived that students who were already above grade
level did not show as much improvement in their letter identification skills as their on-
grade level and below-grade level peers.
Kutz (2005) found that there was no significant main effect of the Lexia Phonics
software program on letter recognition or initial sound fluency of kindergarten students,

125
as measured by change scores on the DIBELS, on either the treatment or control group.
Participants in this study perceived that The Imagination Station program had a more
positive impact on the improvement of letter sound identification skills of below-grade
level students than it did on the improvement of letter sound identification skills of on-
grade level and above-grade level students. Participants generally perceived that
improvement in letter sound identification skills, after using The Imagination Station,
increased inversely with the present learning level of the student. The participants
perceived that students who were already above grade level did not show as much
improvement in their letter sound identification skills as their on-grade level and below-
grade level peers.
Gingold (2002) found that computer-assisted instruction made a positive,
significant difference in kindergartner’s abilities to understand print concepts, when
compared with traditional classroom instruction in reading. Participants perceived that
The Imagination Station program had a more positive impact on the improvement of
concepts about print skills of below-grade level students than it did on the improvement
of concepts about print skills of on-grade level and above-grade level students.
Participants generally perceived that improvement in concepts about print skills, after
using The Imagination Station, increased inversely with the present learning level of the
student. The participants perceived that students who were already above grade level
did not show as much improvement in their concepts about print skills as their on-grade
level and below-grade level peers.
Participants perceived that The Imagination Station program had a more positive
impact on the improvement of phonemic awareness skills of below-grade level students

126
than it did on the improvement of phonemic awareness skills of on-grade level and
above-grade level students. Participants generally perceived that improvement in
phonemic awareness skills, after using The Imagination Station, increased inversely
with the present learning level of the student. The participants perceived that students
who were already above grade level did not show as much improvement in their
phonemic awareness skills as their on-grade level and below-grade level peers.
Rehmann (2005) conducted research on the effect of the computer-assisted
instructional program, Earobics Step 1, and found that there were no statistically
significant differences between the experimental and control groups in their gain scores
for phonological awareness. However, both groups made progress in their phonological
awareness skills.
The Diagnostic Reading Assessment (DRA) was used to assess kindergarten
students’ reading skills. Participants perceived that The Imagination Station program
had a more positive impact on the improvement of the reading skills of below-grade
level students than it did on the improvement of reading skills of on-grade level and
above-grade level students. Participants generally perceived that improvement in
reading skills, after using The Imagination Station, increased inversely with the present
learning level of the student. The participants perceived that students who were already
above grade level did not show as much improvement in their reading skills as their on-
grade level and below-grade level peers.
Bauserman (2003) studied the effectiveness of Level A in PLATO’S Beginning
Reading for the Real World software in increasing kindergarten students’ knowledge of
print concepts and reading comprehension. Bauserman’s computer-assisted instruction

127
treatment took place over an 8 week period. This is similar to the time interval for the
pilot study of The Imagination Station. Bauserman found no significant main effect for
computer-assisted instruction or the type of kindergarten program. However,
Bauserman determined that kindergarten students in full-day kindergarten programs
with computer-assisted instruction demonstrated greater gains than all other groups.
The participants perceived the overall improvement in literacy skills for all
students as good. Participants rated the improvement in literacy skills for all students
nearly the same as they rated the improvement in each literacy skill for their below-
grade level students. This finding may indicate that participants were thinking most
about their below-grade level students when they responded to the question about the
level of improvement for all students.
In a research study by Ringenberg (2005), 33 second grade students in the
treatment group used computer-assisted and monitored reading practice while 32
second grade students in the control group used unmonitored reading practice from
print versions of the same little, leveled books. After 10 weeks the group that originally
used print copies switched to the computer-assisted instruction and the group that used
the computer-assisted instruction switched to the print copies. Ringenberg found that
both groups made significantly more progress during the computer-assisted phase. An
important finding in Ringenberg’s study is that students in the high ability group made
the least amount of progress, while students in the low ability group made the most
progress.
Campbell (2002) conducted a study throughout the school year in which students
at 7 schools received computer-assisted instruction in reading for 10 to 20 minutes a

128
day and students at 6 other schools did not receive the treatment. Campbell found no
significant differences in the reading achievement of fourth and fifth grade students in
either group. However, Campbell did determine that there were some significant
differences between the treatment and control groups in the change in critical thinking
skills for some ability groups. Campbell grouped students by high, mid-range, and low
scores on the 1998 OLSAT School Ability Index. High ability students in the treatment
group in both fourth and fifth grades did not show more improvement using computer-
assisted instruction than the students in the control group. However, mid-range and low
ability students in the treatment group did show more improvement than students in the
control group. Campbell’s findings correspond to the perception of the participants in
this study that below-grade level students made more progress in their literacy skills
using computer-assisted instruction than above-grade level students made using
computer-assisted instruction.
The participants in this study consistently perceived greater improvement for
below-grade level students than for on-grade level students or above-grade level
students on each individual literacy assessment. This perception also correlates with
Ringenberg’s finding that students in the low ability group made the most progress
during computer-assisted instruction in reading. The participants’ perceptions in this
study also agreed with Ringenberg’s finding that students in the high ability group made
the least amount of progress during computer-assisted instruction in reading. However,
the participants in this study generally perceived that even their above-grade level
students did improve somewhat in their literacy skills after using The Imagination
Station.

129
Frequency of Sessions
The pilot study of The Imagination Station at the 4 schools in the treatment group
was only 8 to 10 weeks long. A large percentage of the participants did not use the
program with their students for the recommended minimum amount of time per week,
which was 3, 30-minute sessions. Allington (2002) states that more time spent on
reading has a positive impact on reading achievement. Perez (1998) reported in his
study that, “The amount of time students used the ILS for reading and math was the
best single predictor of gains in math and reading for both ESOL and Non-ESOL
students” (p.38). With 44% of the participants in this study only using The Imagination
Station with their students for one or two 30-minute sessions a week, it would be
unlikely that the program would make a significant difference in the literacy assessment
results of the treatment group students. Besides the fact that many students in the
treatment group used the program less than the recommended minimum number of
sessions per week, the pilot study of the program lasted only 2 months. These
combined factors may have prevented a positive effect on treatment group large
enough to detect. Even if the students had all used the program for the recommended
three 30-minute sessions per week, the pilot study may not have been long enough to
show a larger effect size.
Questions 23 through 25 differentiated whether above-grade level, on-grade
level, or below-grade level students used the program more often. Participants
revealed that the number of days they had their leveled students use the program,
positively correlated with their perception of which students improved the most as a
result of using the program. Participants perceived that their below-grade level students

130
used The Imagination Station program most often and the participants also perceived
that their below-grade level students made the most improvement after using the
program.
Half of the above-grade level students only used the program 1 or 2 days a week
during the treatment period, which was less than the recommended minimum time on
task for success of the program. It is worth noting that participants perceived their
above-grade level students did not make as much improvement after using The
Imagination Station as their on-grade level and below-grade level students. Time on
task is a factor for success in academic pursuits. It is not surprising that the participants
perceived that the above-grade level students made less improvement than the on-
grade level students and the below-grade level students since the above-grade level
students did not have the opportunity to use the program as often as students in the
other 2 sub groups.
The on-grade level students used the program more often than the above-grade
level students. However, less than half of the on-grade level students used the program
for the recommended minimum of 3 days a week for 30-minute sessions. Participants
perceived that their on-grade level students made more improvement than their above-
grade level students after using The Imagination Station. This could be explained by
the fact that the on-grade level students used the program more often than the above-
grade level students. However, 41.7% of the on-grade level students only used the
program 1 or 2 days a week, which was less than the recommended minimum time
needed for adequate results from the program.

131
The below-grade level students were reported to have used the program much
more often than the other 2 groups. A large majority of the below-grade level students
used the program for 3 to 5 days a week. The below-grade level students used the
program more often than the on-grade level and above-grade level students. The
below-grade level group of students was perceived by the participants to make the most
progress on all literacy assessments after using The Imagination Station. The
perception of improvement is positively correlated to the amount of time the students
worked in The Imagination Station program.
Use of Student Progress Reports and Print Copies of Books
The Imagination Station is capable of generating progress reports for students
that identify areas of weakness and mastery. The program also generated lesson plans
that could be used to tutor students in the reported areas of weakness. In addition,
teachers were able to print hard copies of all the leveled books that were part of the
program. The little, leveled books within the program were all written to target specific
objectives in reading. Heibert (2003) found that students reading texts specifically
written for a certain reading level had higher gains in fluency than students who read a
literature anthology.
Nearly half of the participants never printed an individual student report.
Teachers are able to use the reports generated by The Imagination Station program to
determine areas of weakness and guide instruction. With such a large percentage of
participants not printing any reports, it is obvious that nearly half of the teachers did not
utilize the program to guide instruction.

132
The same percentage of participants who reported they never printed any
student reports also reported never using the student reports generated by The
Imagination Station to facilitate instruction during guided reading. Only 34.8% of
participants reported that they used student reports to guide instruction 1 or 2 days a
week.
A large percentage of the participants never printed a hard copy of a book
generated by the program for students to read. The same percentage of participants
never used a printed book from the program with their students. Rings (1994) identified
reading in a real context as an important facet in the development of effective critical
reading skills. Using print versions of the leveled books built into the teaching sequence
of the program would have provided students with more opportunities for reading in a
real context. Students could have read aloud to the teacher or their parents from these
books. The treatment group students could have had the opportunity to read the print
versions of the leveled books from the program several times to increase their reading
fluency. Sorrell (2003) cited several studies that found text written on a computer
screen, without speech synthesis, has no more or less impact on improving reading
comprehension than reading text written on paper.
It was surprising to the researcher that so many participants did not take
advantage of reproducing free, leveled books for their students to read. The fact that
program features such as student reports and print copies of leveled books were not
fully utilized by the participants in the pilot study of The Imagination Station might
explain why the treatment group of students did not make better progress than the
control group of students.

133
User Friendliness
A computer-assisted instructional program that students are eager to use is likely
to be highly successful when the instructional objectives are well sequenced and
researched based. The participants overwhelmingly perceived that their students were
eager to use the program given that 61.5% of participants perceived that their students
were always eager to use the program and that 88.4% of participants perceived that
their students were eager to use the program most of the time or always.
Another important characteristic of an effective computer-assisted instructional
program is that students are able to use the program independently. Nearly all of the
participants perceived that their students were able to use The Imagination Station
independently most of the time or always. Because students could easily navigate the
program, teachers were free to conduct guiding reading groups with some students
while other students used the computer-assisted instruction. The implication of these
findings is that the students had the ability to engage successfully with the program due
to its user-friendliness. This is in contrast to the findings of a qualitative study by
Williams (1999). Teachers reported that the Writing to Read (WRT) program was
repetitive and the durations of the fixed lessons were too long. The WRT program often
required 1 specific response from the student before he or she could continue. On the
contrary, The Imagination Station is web-based and the lessons evolve with the
student’s abilities in literacy. The student is able to progress at his or her own pace
because of the various pathways built into the program which allow a psychological
sequence as well as a logical sequence of instruction.

134
However user-friendly a computer-assisted program might be for students, if it is
to be used in the classroom, it must also be user-friendly for the teacher. The vast
majority of participants perceived that The Imagination Station was always easy to use
or easy to use most of the time.
Imagination Station Training and Computer Skills
The success of the implementation of a computer-assisted instructional program
is dependent on many factors, including the training of the teachers. Representatives
from i-station.com provided 3-hour training for all participants. Close to 90% of
participants agreed or strongly agreed that the training was beneficial for learning to use
the program.
Both students and teachers must have some prerequisite computer skills to
navigate a computer-assisted instructional program. Nearly all of participants agreed or
strongly agreed that their personal computer skills were sufficient to use the program
effectively. Nearly all of the participants also agreed or strongly agreed that their
students’ computer skills were sufficient to use the program effectively. It would be
difficult to replicate this study in school districts that did not provide the abundance of
technology training that the research site district provided.
Only 53.6% of participants rated their personal computer skills as good. In
contrast, 96.4%% of the participants agreed or strongly agreed that their personal
computer skills were sufficient to use The Imagination Station program effectively. This
comparison implies that the program is quite user friendly for the teachers and
administrators.

135
The participants strongly agreed that their students’ computer skills were
sufficient to use the program effectively while they rated their students’ overall personal
computer skills only as good. This finding indicates that The Imagination Station is user
friendly because with good, but not excellent, computer skills, the students could
productively use the program.
Demographics of Survey Participants
The participants in the survey consisted of 23 teachers and 5 administrators.
The 4 schools that conducted a pilot program of computer-assisted instruction in
reading using The Imagination Station for 10 weeks are numbers 1 through 4 in the
quasi-experimental research data and the students in these 4 schools are the members
of the treatment group. Although demographics for race or ethnicity were not collected
by the survey, the researcher confirms that the vast majority, if not all, of the participants
in the survey were Caucasian females.
Literacy Assessments and Quasi-Experimental Research
The results of the descriptive portion of this study, which utilized a survey,
revealed areas that affected the reliability of the quasi-experimental portion of the study.
The pilot study of the computer-assisted instructional program consisted of only 8 to 10
weeks. This may not have been long enough to detect a positive treatment effect large
enough to measure. Individual teachers did not all use the program the same number
of days per week with their students. Several participants did not take advantage of the
program’s peripherals such as student reports and print copies of books. These

136
differences in the application of the program create difficulties in making comparisons
between the treatment and control groups.
Literacy Assessments
As in this study, Dunn (2002) used ANOVA for repeated measures for statistical
analysis to compare a treatment group that received computer-assisted instruction in
reading to a control group that received traditional reading instruction. Dunn’s study
measured improvement in reading comprehension. As in this study, Dunn did not
randomly assign students to the experimental and control groups. Dunn found that the
treatment group who received computer-assisted instruction in reading improved
significantly more than the control group in reading comprehension.
Contrary to the research Dunn (2002) conducted, the control group in this study
performed statistically better on the composite literacy assessment than the treatment
group. This finding may be due to beginning differences between the groups. The
treatment group started with a lower mean z score than the control group and had a
lower mean z score for each of the 3 assessment factors. However, the effect of group
was small so the fact that the control group in this study performed better than the
treatment group on the literacy assessments has little practical significance.
Recommendations for Further Research
Length of Study
The researcher recommends a study that lasts the entire kindergarten year using
The Imagination Station. There were limitations on the length of this study because the

137
program was only available for a trial period from i-station.com. That trial period was 45
days, or approximately 9 weeks. If the treatment group for the entire school year had
used the program, the results would have greater reliability. As stated in Chapter 1, it is
not possible to measure the effectiveness of computer-assisted technology apart from
the individual computer-assisted instructional program being used. The instructional
objectives in a computer-assisted instructional program, as well as the instructional
sequence inherent in the program, will greatly affect the learning of the students.
Rings (1994), described 3 components of computer-assisted instruction that
promote improvement in critical reading skills. The 3 critical components are a high
level of interactivity, the encouragement of using strategies that have been proven to be
effective for critical reading, and reading in a real context. The Imagination Station
incorporates all of these components identified by Rings that are needed to improve
critical reading skills.
The scope and sequence of instruction affects the quality of a computer-assisted
instructional program in reading. Ediger (1998) pointed out that quality sequence in
activities and experiences were necessary for learners to relate new learning to what
they had already learned. Ediger distinguished between a logical sequence, which is
teacher decided by the teacher or software program, and a psychological sequence
where the learner orders his or her own activities. The Imagination Station has a logical
sequence of instruction developed by reading specialists. The Imagination Station also
has what Ediger would call a psychological sequence. Students are routed individually
to the objectives they are ready to begin. Students also are routinely routed to re-
teaching in literacy objectives where they need more reinforcement. The capability of

138
individualization and what Ediger calls a psychological sequence of instruction are
powerful instructional advantages of The Imagination Station program in addition to the
logical instructional sequence inherent in the software.
Design of Descriptive Study
The design of the descriptive portion of the study utilizing the survey did not lend
itself to statistical analysis. The survey developed by the researcher had too many
questions for the number of participants who responded to the survey. The number of
participants was limited by the population of kindergarten teachers and administrators at
the 4 schools in the pilot study of The Imagination Station. Some members of this
limited population chose not to respond to the survey. School 2 in the data, with the
fictional name of Bradley, had a lower response rate than the other schools in the study.
The descriptive study asked participants their perception of how often their
students used the program. The Imagination Station program keeps track of how many
sessions each student has, the duration of the sessions, and how many weeks he or
she use the program. A recommendation for future research would be to use the data
from the program to determine how often the survey participants’ students used the
program, rather than asking them what their perception was. The usage data could
then be compared to the students’ improvement in literacy skills. The results of this kind
of study could determine the optimal length of use of the program for various student
sub groups.

139
Design of Quasi-Experimental Research
The design of the quasi-experimental portion of the study was influenced by the
access granted to the study site. It was determined that the instructional software would
need to be offered to all students in a classroom to avoid parent concerns. Statistical
results would have been more reliable if the researcher could have split each classroom
into a treatment and control group. This would have required parent and student
consent. That design was not permitted in this setting. Since the school itself engaged
in the pilot study of the program, and all students were able to benefit from the use of
The Imagination Station for 45 days, there was no requirement for the researcher to
gain consent from parents.
The design limitations resulted in all the kindergarten students in the 4 pilot
program schools to be the treatment group and all the kindergarten students in 13 other
schools in the district to be the control group. Because there was not random
assignment to the treatment and control groups, the experimental results are not
reliable. School 2 in the treatment group had a larger economically disadvantaged
population than all the other schools. This may have caused the data to be skewed.
Future research should also be conducted to determine how the teacher and campus
influences the group effects.
The quasi-experimental portion of this research study had a large sample size, a
control group, and assessments that were not produced or administered by the
company who owned the program. This is in contrast to a study by Camacho (2002).
In Camacho’s study, there were only 20 students from the same first grade class. The
small sample size, lack of control group, and the assessment by the same company that

140
produced the instructional software, are factors that would affect the validity of
Camacho’s results.
The researcher recommends further study of The Imagination Station that uses
random assignment within each classroom to a treatment and control group. It is
recommended that the study include several schools in districts of various income levels
so that the study has greater external validity.
In addition, the researcher recommends, as in this study, that the assessments
used to determine the literacy outcomes not be produced or administered by the
company that owns the software. This will eliminate concerns of bias in the research.
Nauss (2002) did a study using the Waterford Early Reading Program (WERP) and
found that first grade students in 10 classrooms that used the WERP showed no
significant difference in comprehension on the Stanford 9 compared to first grade
students in the 15 classrooms who did not use WERP. One difference in the study
using WERP by Nauss from those done by Gingold (2000) and Camacho (2002) is that
Nauss used an assessment that was independent from the instructional program to
determine the change in reading achievement.
A final recommendation for the quasi-experimental portion of the study is that it
be started at the beginning of a school year. Several survey participants wrote in a
comment on their survey that they believed the program would have had a greater
impact at the beginning of the school year than during the last 10 weeks of the school
year.

141
Conclusions
Research at the University of Minnesota by Heath (2000) compared the
relationship between the amount of time students received Chapter I supplemental
reading instruction and reading achievement gains. The 3 models of instructional
delivery that were used included (a) the supplemental teacher, (b) the educational
assistant, and (c) the computer-assisted instructional program. There was no significant
relationship between the amounts of time allocated for Chapter I supplemental reading
instruction and reading achievement gains, except in the case of the Chapter I
supplemental teacher service delivery model, where the relationship was significant and
negative. This finding appears to contradict the idea that more time-on-task has
positive impact on reading achievement Allington (2002).
Without using allocated time as a criterion, the computer-assisted instructional
program in Heath’s study produced significant gains in reading achievement (Heath,
2000). Considering that the supplemental teacher would be the most expensive service
delivery model, (assuming that computer hardware is already in place), it is surprising
that this model of instruction showed negative significance. What is not addressed in
the study is the class size for the supplemental teacher model and the quality of the
teachers that were part of that service delivery model.
This researcher draws on the research of Heath (2000) to make a point about
computer-assisted instruction in literacy skills for kindergarten students. The quality of
the classroom teacher and the quality of the teacher’s instruction are possibly the most
influential factors in the success of students in learning literacy skills. In Heath’s study
in a Chapter I school, the computer-assisted program was more successful than the

142
supplementary teacher or supplementary aide. It is possible that the quality of the
supplemental teacher or the classroom instructional program was not as good as the
quality of the computer-assisted instructional program.
The study conducted by this researcher was carried out in an affluent school
district with superior instructional support for teachers. This district has no problem
recruiting exceptional teachers. This research setting may not have adequately
demonstrated the effects of the computer-assisted program, which was used because
the students were already receiving superior instruction. Further research needs to be
conducted in more economically diverse districts using random assignment to treatment
and control groups with at least a full school year for the treatment.
It is the researcher’s opinion that 1 of the reasons the treatment group did not
improve more than the control group is that the quality of the classroom instruction
given by the teachers in both groups was excellent. If the experiment had been carried
out in a district where the economic status of the students was not as high or the quality
of instructional delivery was not as good, the computer-assisted instruction may have
had a greater positive effect.
Williams (1999) discovered through qualitative research that the perspectives of
teachers and students in his study differed from the official claims and purposes for the
Writing to Read program. In the descriptive research portion of this study, the
perspective of teachers and administrators was that students made good improvement
in their literacy skills after using The Imagination Station. The quasi-experimental
research portion of this study, which analyzed the literacy assessment scores of the
treatment and control groups, did not show that there was a practical difference

143
between the treatment and control groups on the composite literacy assessment scores.
The teacher and administrator perceptions that the program had a positive effect on the
improvement in students literacy scores was not born out by the analysis of the
treatment and control groups’ literacy scores. However, both the treatment and control
groups did improve in their literacy scores. If The Imagination Station had been used
for a longer period of time it is possible that the treatment group would have shown
greater improvement in their literacy scores than the control group.

144
APPENDIX A
SURVEY

145
By completing this survey, I acknowledge that I am giving informed consent to be a participant in a research study to determine the perceptions of teachers and administrators regarding computer-assisted instruction, using The Imagination Station, to teach literacy skills to kindergarten students. I acknowledge that The Imagination Station has been used with my students, for at least the last two months. This study does not involve any reasonably foreseeable risks. The approximate amount of time a potential participant will be involved in the survey is 30 minutes. I understand all my personally identifiable information will be kept confidential and secure in a locked file in the researcher’s home. The researcher is a graduate student in the Educational Administration Department at the University of North Texas. If you have any questions about this research project, please call Susan Larson at 972-517-1717 or Dr. T. Colette Smith, UNT Department of Teacher Education and Administration, at 940-565-2835. This study has been approved by the University of North Texas Institutional Review Board (IRB). If you have any questions about your rights as a research participant, you may contact the UNT IRB at 940-565-3940. I understand that participation is voluntary and that refusal to participate will involve no penalty or loss of benefits or rights. ____________________________________________________ ____________________________________ Signature of Participant Date
I. The purpose of this first group of questions is to determine your perceptions of computer-assisted instruction, using The Imagination Station program, to teach literacy/reading skills to your kindergarten students. Each general question, which applies to all students in your classroom, is followed by three questions that target students in your classroom who are above, on, or below grade level in their literacy/reading skills. Please put an X in the category that best describes your perception.
Excellent Good Fair No Improvement
1
Describe your perception of the improvement in your students’ letter identification skills after using the program.
2
Describe your perception of the improvement in your above grade level students’ letter identification skills after using the program.
3
Describe your perception of the improvement in your on grade level students’ letter identification skills after using the program.
4
Describe your perception of the improvement in your below grade level students’ letter identification skills after using the program.

146
Excellent Good Fair No Improvement
5
Describe your perception of the improvement in your students’ letter sound skills after using the program.
6
Describe your perception of the improvement in your above grade level students’ letter sound skills after using the program.
7
Describe your perception of the improvement in your on grade level students’ letter sound skills after using the program.
8
Describe your perception of the improvement in your below grade level students’ letter sound skills after using the program.
9
Describe your perception of the improvement in your students’ concepts about print (C.A.P.) skills after using the program.
10
Describe your perception of the improvement in your above grade level students’ concepts about print (C.A.P.) skills after using the program.
11
Describe your perception of the improvement in your on grade level students’ concepts about print (C.A.P.) skills after using the program.
12
Describe your perception of the improvement in your below grade level students’ concepts about print (C.A.P.) skills after using the program.
13
Describe your perception of the improvement in your students’ phonemic awareness skills after using the program.
14
Describe your perception of the improvement in your above grade level students’ phonemic awareness skills after using the program.
15
Describe your perception of the improvement in your on grade level students’ phonemic awareness skills after using the program.
16
Describe your perception of the improvement in your below grade level students’ phonemic awareness skills after using the program.

147
Excellent Good Fair No Improvement
17
Describe your perception of the improvement in your students’ Diagnostic Reading Assessment (DRA) level after using the program.
18
Describe your perception of the improvement in your above grade level students’ DRA level after using the program.
19
Describe your perception of the improvement in your on grade level students’ DRA level after using the program.
20
Describe your perception of the improvement in your below grade level students’ DRA level after using the program.
21 Describe your perception of the improvement in your students’ literacy skills after using Imagination Station.
II. The purpose of this second group of questions is to determine how you used The Imagination Station
with your students. The first four questions concern the number of days per week your students used the program. The next four questions concern how you utilized the program. The last two questions concern your perception of user friendliness.
4-5 Days a Week
3 Days a Week
1-2 Days a Week
0 Days a Week
22 Students used the Imagination Station program for 30 minutes
23 Above grade level students used the Imagination Station program for 30 minutes
24 On grade level students used the Imagination Station program for 30 minutes
25 Below grade level students used the Imagination Station program for 30 minutes
26 How often did you print individual student reports?
27 How often did you use the individual student reports for data to facilitate instruction during guided reading?
28 How often did you print books from the program for students?
29 How often did you use the printed books with students?

148
Always Most of the
Time Some-of the
Time Never
30 The students were eager to use Imagination Station.
31 The students were able to use the program independently after initial training.
32 The program was easy to use for the teacher.
III. The purpose of this third group of questions is to determine your perception of the training needed to
use Imagination Station.
Strongly Agree
Agree
Agree
Somewhat
Do Not Agree
33 The three-hour training session by a company representative was beneficial for learning to use the program.
34 My personal computer skills are sufficient to use the program effectively.
35 The students’ computer skills are sufficient to use the program effectively.
Excellent Good Fair Poor
36 My personal computer skills are
37 The students’ personal computer skills are

149
IV. The purpose of this last group of questions is to determine the demographic information of the study
participants. All personally identifiable information will be kept secure and confidential.
38. My present job position is: _____Teacher _____Principal _____Assistant Principal _____Technology Facilitator or Specialist
39. I am employed at the following school campus: _____Anderson _____Bright _____Rogers _____Ashley _____Christie
40. Years of experience in education, including present year: _____1-2 years _____2-5 years _____6-10 years _____11-20 years _____Over 20 years
41. What is your gender? _____Female _____Male
42. What is your age?
22-30_____ 31-35_____ 36-40_____ 41-45_____ 46-55_____ Over 55_____ Thank you for your participation in this academic research study. For your convenience a stamped, addressed, return-envelope is included with this survey. Please return this survey by May 26, 2006, to Susan Larson at the address above.

150
APPENDIX B
SUPPLEMENTAL TABLES

151
Table B1
Fall Literacy Assessments
N Minimum Maximum Mean Std. Deviation Skewness Kurtosis
Statistic Std. Error Statistic Std.
Error Letter ID-F 1835 0 54 42.91 12.527 -1.763 .057 2.247 .114
Letter Sounds-
F 1835 0 26 16.89 8.523 -.693 .057 -.863 .114
CAP-F 1835 0 30 11.39 4.848 1.329 .057 3.975 .114 PAPI-F 1835 0 30 16.60 9.107 -.289 .057 -1.028 .114 DRA-F 1835 0 14 2.69 3.535 1.668 .057 1.965 .114 Valid N
(listwise) 1835
Table B2
Winter Literacy Assessments
N Minimum Maximum Mean Std. Deviation Skewness Kurtosis
Statistic Std.
Error Statistic Std. Error
Letter ID-W 1835 0 54 50.15 5.771 -5.037 .057 29.263 .114 Letter
Sounds-W 1835 0 26 23.82 4.396 -3.132 .057 11.081 .114
PAPI-W 1835 0 30 25.69 5.489 -1.521 .057 2.172 .114 DRA-W 1827 0 44 5.50 5.592 2.730 .057 9.361 .114
Listening Comp.-W 1835 0 8 5.66 1.661 -.599 .057 .141 .114
Valid N (listwise) 1827

152
Table B3
Spring Literacy Assessments
N Minimum Maximum Mean Std. Deviation Skewness Kurtosis
Statistic Std.
Error Statistic Std. Error
Letter ID-S 1835 9 54 51.76 2.350 -11.168 .057 159.982 .114 Letter
Sounds-S 1835 0 26 25.44 2.179 -6.445 .057 50.616 .114
CAP-S 1835 1 30 16.66 6.232 1.491 .057 .559 .114 PAPI-S 1834 0 44 25.08 8.867 -1.554 .057 .999 .114 DRA-S 1831 0 44 9.03 6.967 2.007 .057 4.702 .114
Listening Comp.-S 1823 1 14 8.26 3.035 .846 .057 -.090 .115
Valid N (listwise) 1819
Table B4
Levene's Test of Equality of Error Variances
F df1 df2 Sig.
z_Fall_Mean 7.515 1 1832 .006
z_Winter_Mean 7.746 1 1832 .005
z_Spring_Mean .262 1 1832 .609
Note: Tests the null hypothesis that the error variance of the dependent variable is
equal across groups.

153
REFERENCES
Adamson, R. D. (1997). A study to determine the efficacy of a computer program designed to help students increase their ability to decode three-letter, short-A, consonant-vowel-consonant (C-V-C) words (Doctoral dissertation, University of New Mexico, 1997). Dissertation Abstracts International, 58, 2156.
Allington, R. L. (2002). What I’ve learned about effective reading instruction from a decade of studying exemplary elementary classroom teachers. Phi Delta Kappan, 83, 740-747.
Armbruster, B. B., Lehr, E., & Osborn, J. (2001). Put reading first: The research building blocks for teaching children to read. Kindergarten through grade 3. Washington, DC: National Institute for Literacy.
Au, K. H., Carroll, J. H., & Scheu, J. A. (1997). Balanced literacy instruction: A teacher's resource book. Norwood, MA: Christopher-Gordon. (Original work published 1997)
Bauserman, K. L. (2003). Phonological awareness and print concepts: Analysis of skill acquisition by kindergarten children utilizing computer-assisted-instruction (Doctoral dissertation, Ball State University, 2003). Dissertation Abstracts International, 64, 1531.
Camacho, M. A. (2002). The effects of Waterford Early Reading Program on reading achievement of first-grade students. Masters Abstracts International, 40 (05), 1114. (UMI No. 1408133)
Campbell, D. T., & Stanley, J. C. (1963). Experimental and quasi-experimental designs for research (4th ed.). Chicago, IL: Rand McNally & Company.)
Campbell, J. P. (2000). A comparison of computerized and traditional instruction in the area of elementary reading (Doctoral dissertation, University of Alabama, 2000). Dissertation Abstracts International, 61, 952.
Cohen, J. (1988). Statistical power analysis for the behavioral sciences (6th ed.). Hinsdale, NJ: Lawrence Erlbaum Associates.
Dunn, C. (2002). An investigation of the effects of computer-assisted reading instruction versus traditional reading instruction on selected high school freshman. Dissertation Abstracts International, 62 (09), 3002A. (UMI No. 3027824)
Ediger, M. (1998). Issues and technology use in reading instruction. Reading Improvement, 35(3), 137-144.
Gall, M. D., Borg, W. R., & Joyce, G. P. (1996). Educational research (6th ed.). White Plains, NY: Longman. (Original work published 1963)

154
Gingold, C. (2000). A comparison of the impact of a computer-based program with the impact of traditional instructional methods on emergent reading skills of prekindergartners. Dissertation Abstracts International, 61, (03), 874A. (UMI No. 9965265)
Glatthorn, A. A. (1998). Writing the winning dissertation. Thousand Oaks, CA: Corwin Press.
Hall, T. E., Hughes, C. A., & Filbert, M. (2000). Computer-assisted instruction in reading for students with learning disabilities: A research synthesis. Education & Treatment of Children, 23(2), 173-193.
Heath, S. (2000). Chapter 1 students: How the amount of time spent in a Chapter 1 supplemental reading program affects reading achievement. Dissertation Abstracts International, 61 (03), 831A. (UMI No. 9966206)
Heibert, E. H. (2003). The role of text in developing fluency: A comparison of two interventions. Manuscript submitted for publication.
Hinkle, D. E., Wiersma, W., & Jurs, S. G. (1998). Applied statistics for the behavioral sciences (4th ed.). Boston, MA: Houghton Mifflin. (Original work published 1998)
Jarrell, D. K. (2000). The effects of computer access on reading achievement. Dissertation Abstracts International, 61, (05), 1807A. (UMI No. 9973362)
Kutz, D. A. (2005). The use of the Lexia Phonics computer software program for children in kindergarten and first grade. Dissertation Abstracts International, 66, (03), 938A. (UMI No. 3167340)
National Reading Panel. (2000). Report of the National Reading Panel: Teaching children to read. Bethesda, MD: National Institute of Child Health and Human Development.
Nauss, D. A. (2002). The effects of a supplemental computerized reading program on the comprehension of first-grade readers in rural south Florida. Dissertation Abstracts International, 63 (05), 1769A. (UMI No. 3054602)
Nuno, J. A. (2005). Is computer-assisted instruction an effective tool in the reading-writing classroom? Masters Abstracts International, 43, (05), 1549. (UMI No. 1430844)
Perez, K. J. (1999). Predictors of achievement in math and reading by elementary ESOL and non-ESOL students using a computer-based integrated learning system. Dissertation Abstracts International, 59, (07), 2354A. (UMI No, 9838849)
Rebar, M. W. (2001). An investigation of early reading response fluency (Doctoral dissertation, University of Oregon, 2001). Dissertation Abstracts International, 62, 2078.

155
Rehmann, R. (2005). The effect of Earobics TM Step 1, Software on student acquisition of phonological awareness skills. Dissertation Abstracts International, 66, (07), 2533A. (UMI No. 3181124)
Ringenberg, M. L. (2005). Developing reading fluency with computer-assisted reading practice. Dissertation Abstracts International, 66, (03), 894A. (UMI No. 3169870)
Rings, S. (1994, February 25). The role of computer technology in teaching critical reading. Retrieved November 1, 2004, from http://zircon.mcli.dist.maricopa.edu/critR/index.html
Ritchie, K. G. (1999). An exploratory case study of the implementation of 1 computer-assisted instruction program in reading. Masters Abstracts International, 38, (03), 530. (UMI No. 1183728)
Sorrell, C. A. (2003). Reading rate and comprehension as a function of presentation mode (computerized vs. traditional) and processing speed (Doctoral dissertation, The University of Tennessee, 2003). Dissertation Abstracts International, 65, 107.
Strickland, D. S. (1998). Teaching phonics today. Newark, DE: International Reading Association.
T&L Editors (Ed.). (2003). Early reading software. Technology & Learning, 23 (11), 1-3.
Texas Education Agency. (2000). Comprehension instruction. Austin, TX
Texas Education Agency. (1997). Beginning reading instruction: Components and features of a research-based reading program. Austin, TX
Tincup, M. J. (2003). Evaluating the effects of a computer-based phonological processing intervention on phonological processing and reading achievement: A pilot study (Doctoral dissertation, University of Northern Colorado, 2003). Dissertation Abstracts International, 64, 845.
Tozcu, A. (1998). The effect of teaching sight vocabulary with computer-assisted instruction on vocabulary gain, decrease in reaction time for frequent word recognition, and reading comprehension. Dissertation Abstracts International, 59, (04), 1144A. (UMI No. 9829340)
Williams, K. L. (1999). When computers teach reading and writing: A matter of teacher and first grade student perspectives. Dissertation Abstracts International, 60, (08), 2789A. (UMI No. 9942934)


![Innovative Methods Computer Assisted Instruction [ CAI ]](https://img.pdfslide.us/doc/110x75/56812db6550346895d92e888/innovative-methods-computer-assisted-instruction-cai-.jpg)