Embed Size (px)
Citation preview

COMPREHENSIVE
Excel Tutorial 10
Performing What-If Analyses
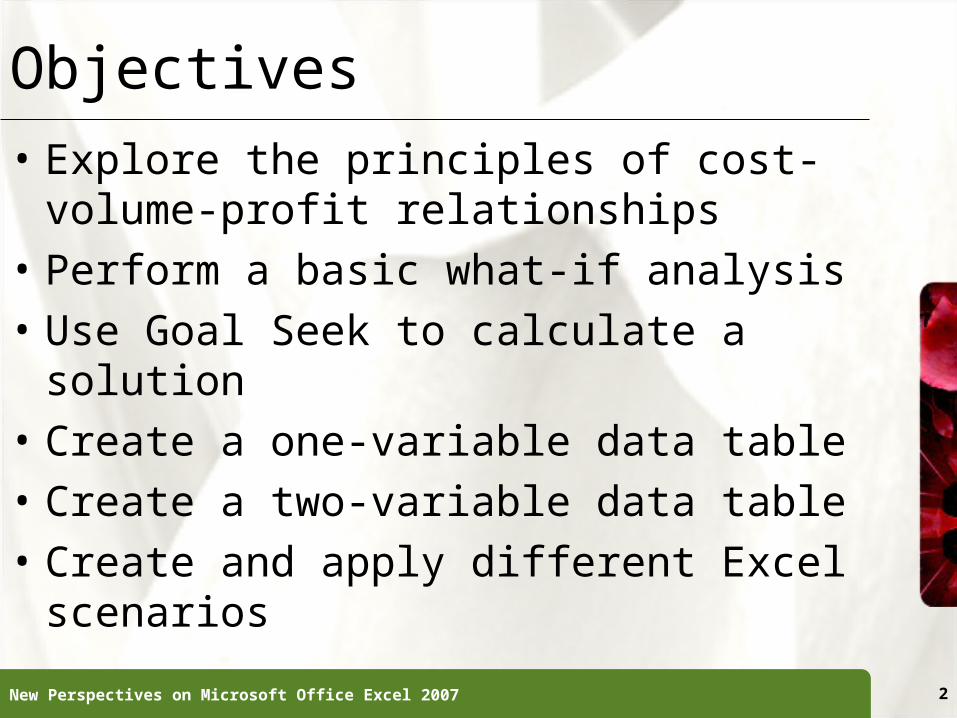
XPXPObjectives• Explore the principles of cost-volume-profit
relationships• Perform a basic what-if analysis• Use Goal Seek to calculate a solution• Create a one-variable data table• Create a two-variable data table• Create and apply different Excel scenarios
New Perspectives on Microsoft Office Excel 2007 2
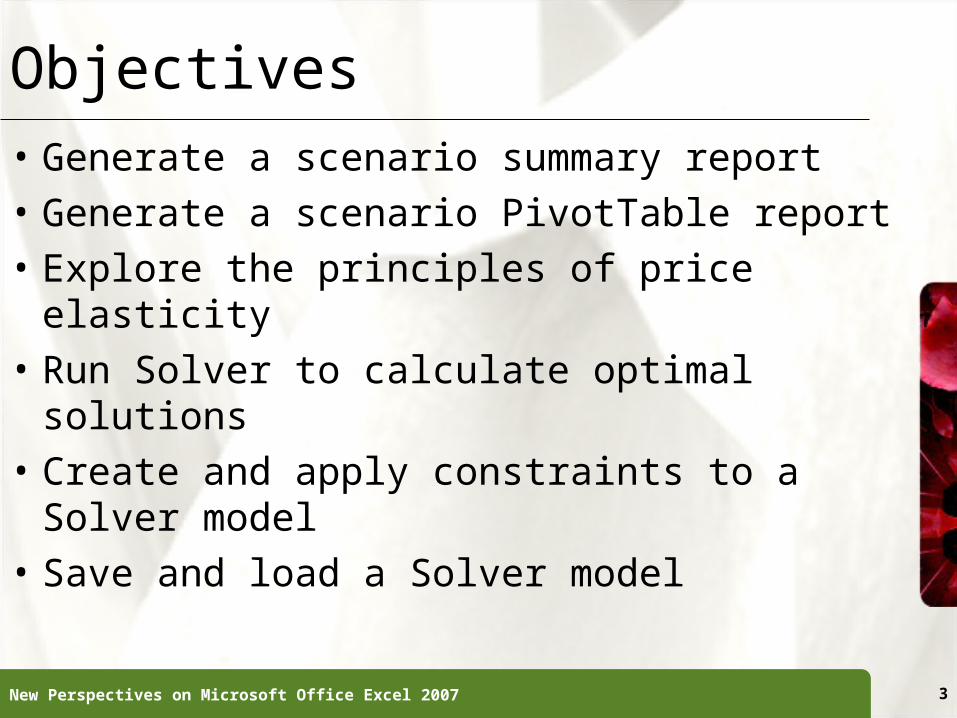
XPXPObjectives• Generate a scenario summary report• Generate a scenario PivotTable report• Explore the principles of price elasticity• Run Solver to calculate optimal solutions• Create and apply constraints to a Solver model• Save and load a Solver model
New Perspectives on Microsoft Office Excel 2007 3
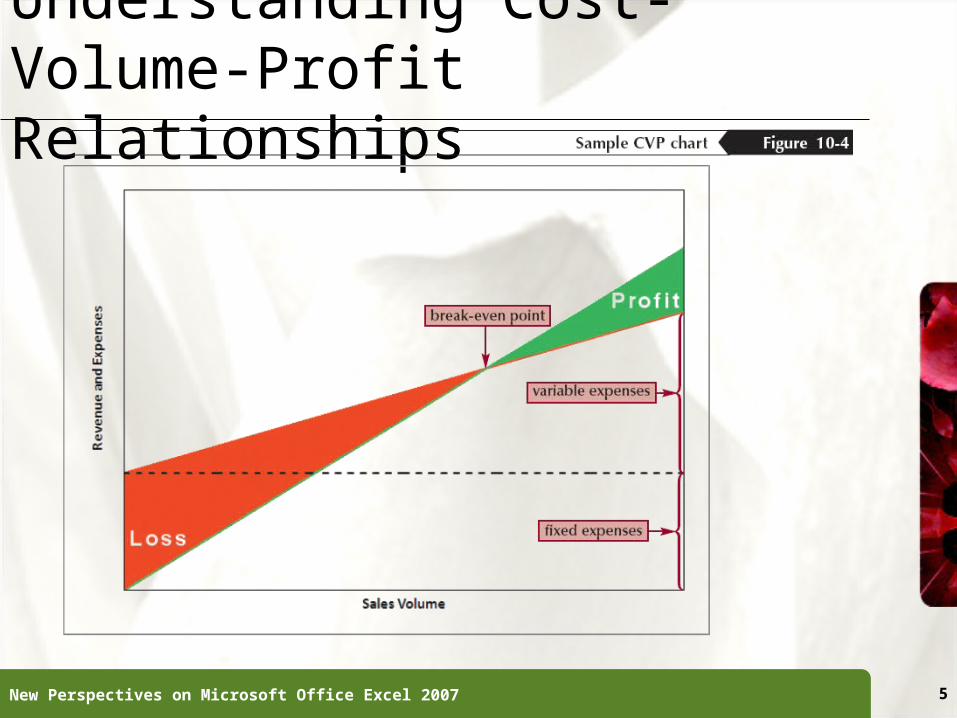
XPXPUnderstanding Cost-Volume-Profit Relationships• Cost-volume-profit (CVP) analysis expresses the
relationship between a company’s expenses, its volume of business, and the resulting profit or net income
• Variable expenses change in proportion to the amount of business a company does
• A fixed expense is an expense that must be paid regardless of sales volume
• A variable expense is part variable and part fixed• The point where revenue equals expenses is called the
break-even point– Break-even analysis
New Perspectives on Microsoft Office Excel 2007 4
XPXPUnderstanding Cost-Volume-Profit Relationships
New Perspectives on Microsoft Office Excel 2007 5
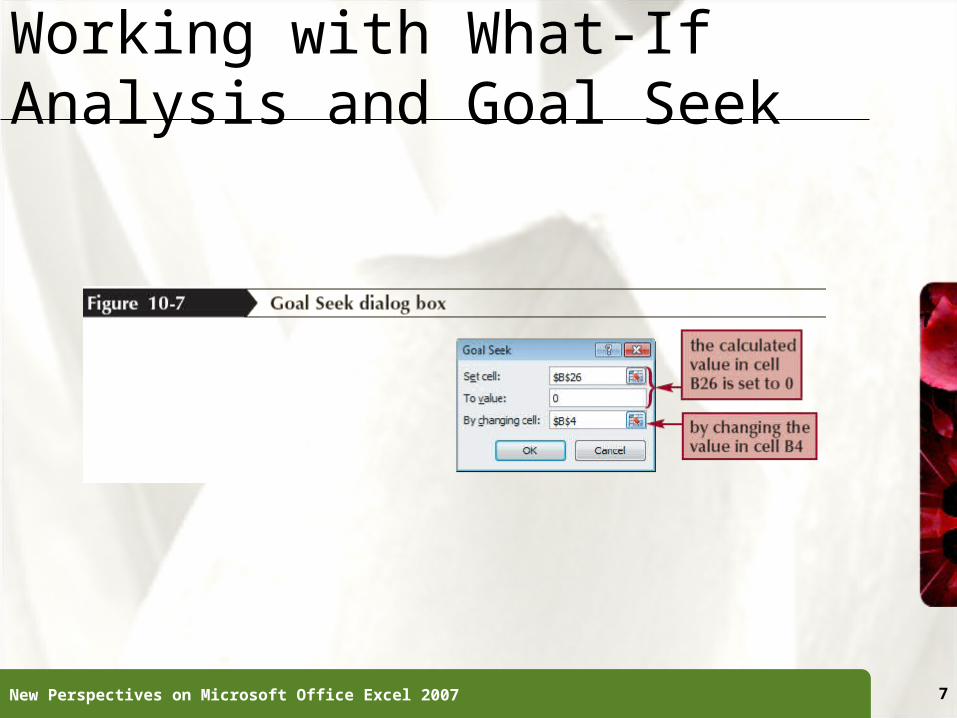
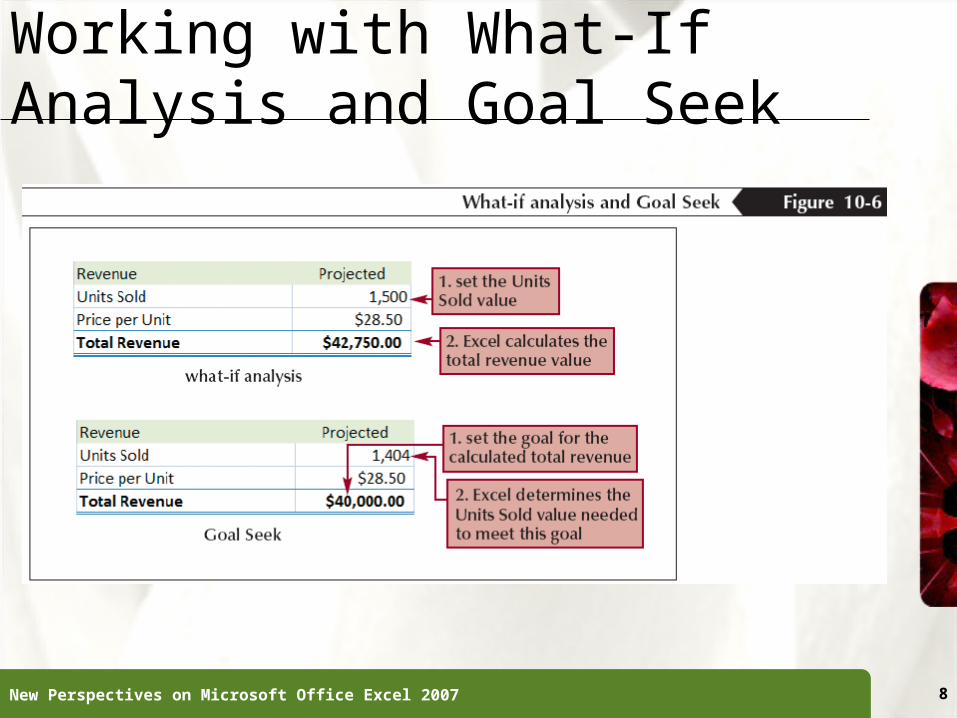
XPXPWorking with What-If Analysis and Goal SeekTo perform what-if analysis:
– Change the value of a worksheet cell (the input cell)– Observe its impact on one or more calculated cells (the result
cells)
To perform Goal Seek:– In the Data Tools group on the Data tab, click the What-If
Analysis button, and then click Goal Seek– In the Set cell box, select the result cell, and then, in the To
value box, specify its value (goal)– In the By changing cell box, specify the input cell– Click the OK button. The value of the input cell changes to set
the value of the result cell
New Perspectives on Microsoft Office Excel 2007 6
XPXPWorking with What-If Analysis and Goal Seek
New Perspectives on Microsoft Office Excel 2007 7
XPXPWorking with What-If Analysis and Goal Seek
New Perspectives on Microsoft Office Excel 2007 8
XPXPWorking with One-Variable Data Tables• A data table organizes the results of several what-if
analyses within a single table• Insert a formula that references the input cell in the
upper-left cell of the table• Insert input values in either the first row or first column
of the table• For input values in the first row, insert formulas
referencing result cells in the table’s first column; for input values in the first column, insert formulas referencing result cells in the table’s first row
New Perspectives on Microsoft Office Excel 2007 9
XPXPWorking with One-Variable Data Tables• Select the table (excluding any row or column
headings). In the Data Tools group on the Data tab, click the What-If Analysis button, and then click Data Table
• If the input values are in the first row, enter the cell reference to the input cell in the Row input cell box; if the input values are in the first column, enter the cell reference to the input cell in the Column input cell box
• Click the OK buttonNew Perspectives on Microsoft Office Excel 2007 10
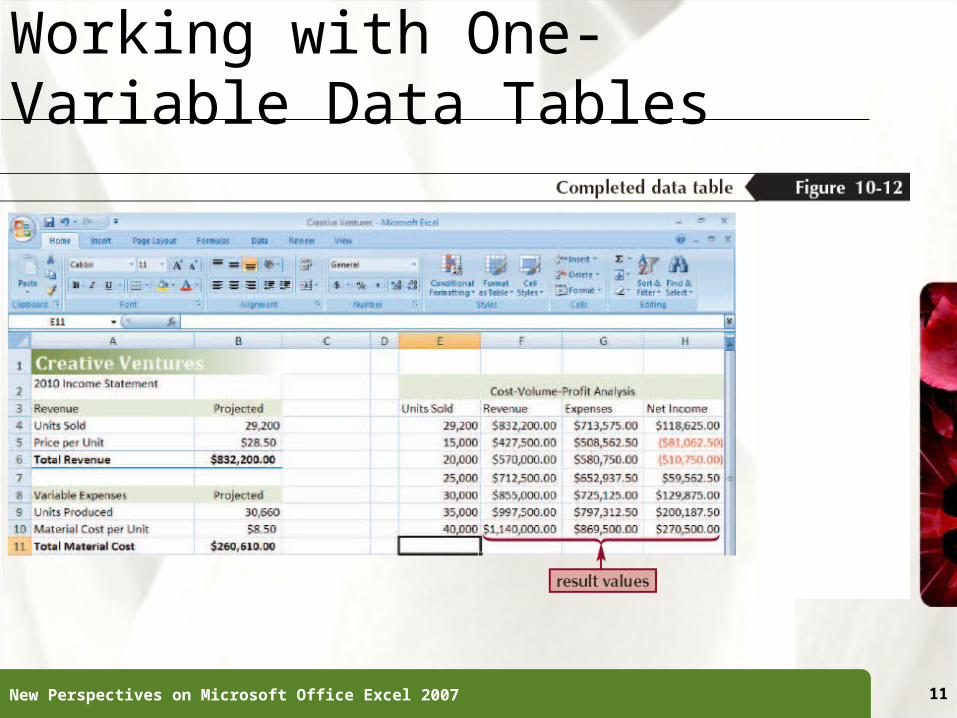
XPXPWorking with One-Variable Data Tables
New Perspectives on Microsoft Office Excel 2007 11
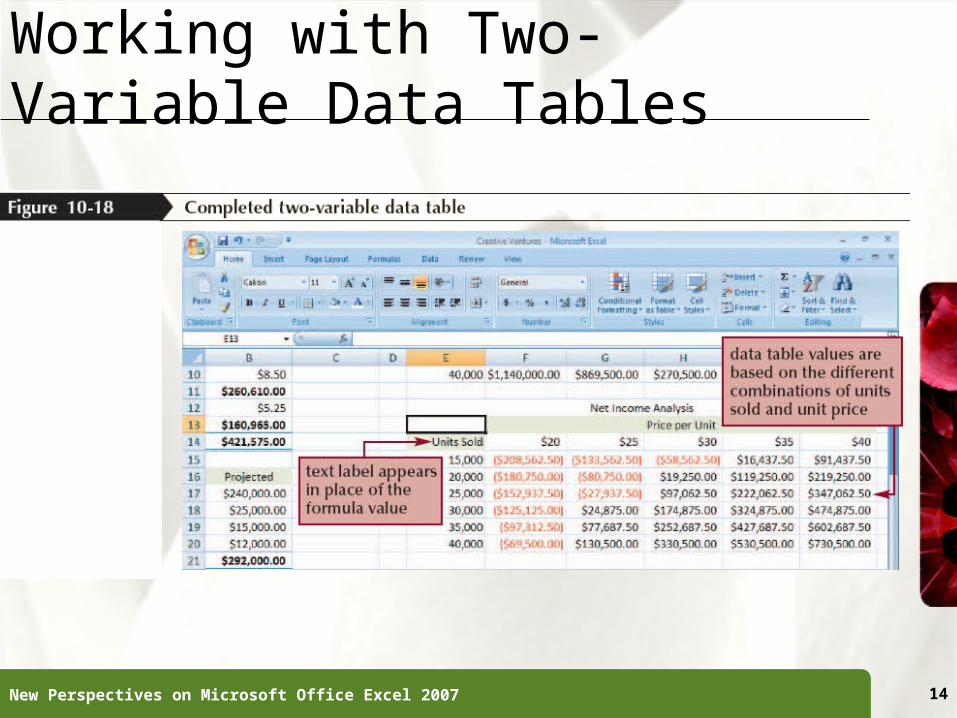
XPXPWorking with Two-Variable Data Tables• A two-variable data table uses two input cells, but
unlike a one variable data table, only the value of a single result cell can be displayed
• Insert a formula that references the result cell in the upper-left cell of the table
• Insert input values in the first row and first column of the table
• Select the table (excluding any row or column headings)• In the Data Tools group on the Data tab, click the What-
If Analysis button, and then click Data Table
New Perspectives on Microsoft Office Excel 2007 12
XPXPWorking with Two-Variable Data Tables• Enter the cell reference corresponding to the
input values in the first row in the Row input cell box; enter the cell reference to the input values in the first column in the Column input cell box
• Click the OK button
New Perspectives on Microsoft Office Excel 2007 13
XPXPWorking with Two-Variable Data Tables
New Perspectives on Microsoft Office Excel 2007 14
XPXPUsing Scenario Manager• Scenario Manager enables you to create as
many scenarios as you want, easily switching between the different scenarios to display the results of several what-if analyses
• Enter the data values in the worksheet for the scenario
• In the Data Tools group on the Data tab, click the What-If Analysis button, and then click Scenario Manager
New Perspectives on Microsoft Office Excel 2007 15
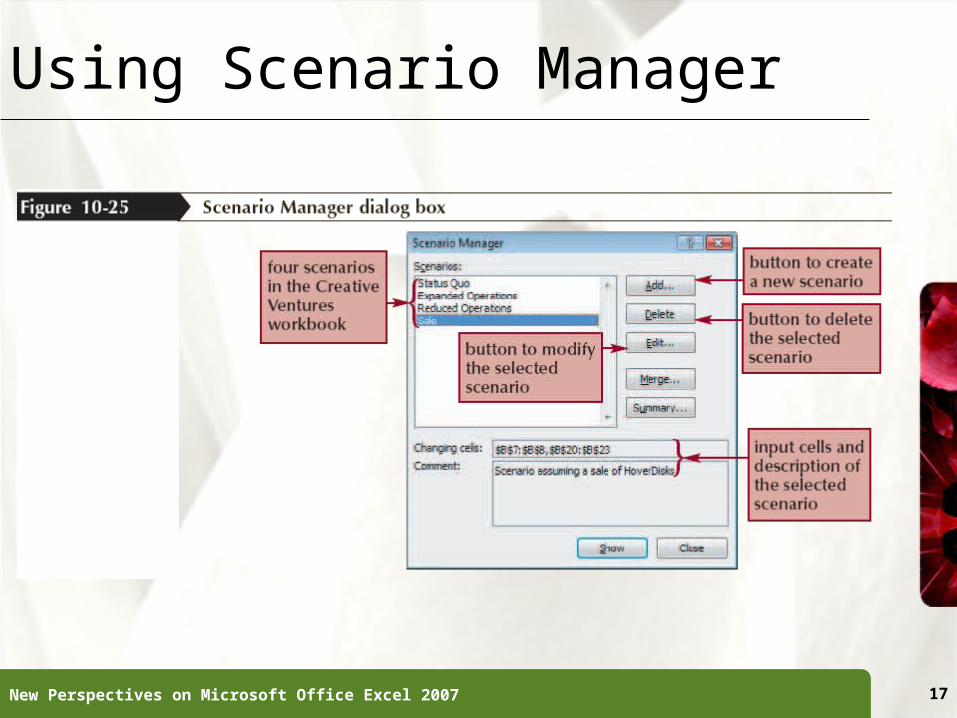
XPXPUsing Scenario Manager• Click the Add button in the Scenario Manager dialog box• In the Scenario name box, type a name for the scenario• In the Changing cells box, specify the input or changing
cells• Click the OK button• In the Scenario Values dialog box, specify values for
each of the input cells, clicking the Add button after each
• Click the OK button
New Perspectives on Microsoft Office Excel 2007 16
XPXPUsing Scenario Manager
New Perspectives on Microsoft Office Excel 2007 17
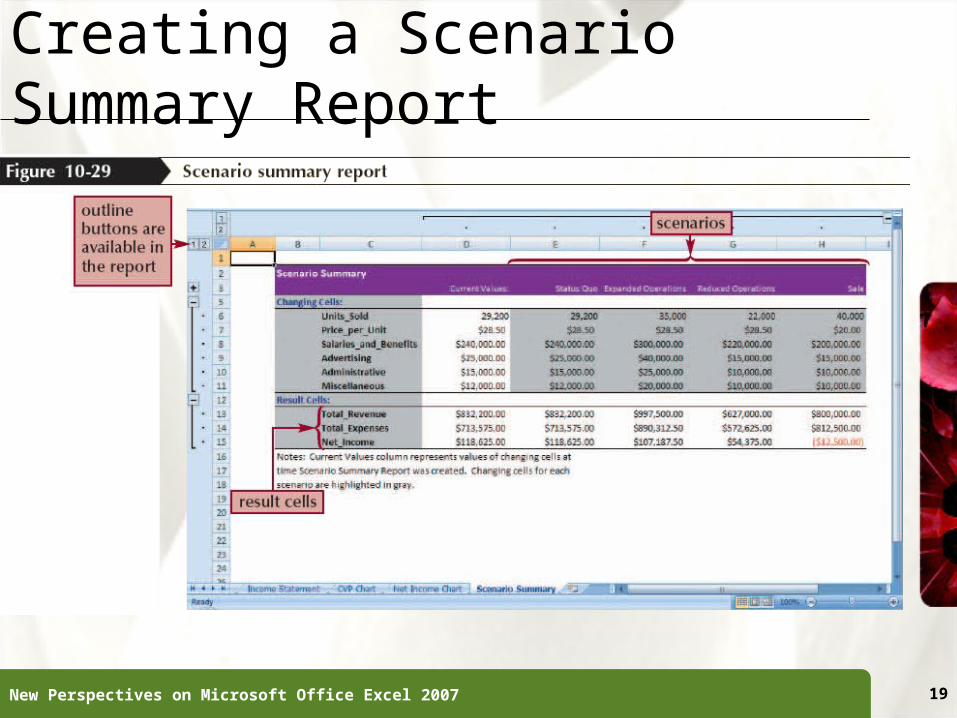
XPXPCreating a Scenario Summary Report• A scenario summary report lists the values for the
changing cells and result cells under each scenario• In the Data Tools group on the Data tab, click the What-If
Analysis button, and then click Scenario Manager• Click the Summary button• Click the Scenario summary option button to create a
scenario summary report (or click the Scenario PivotTable report option to create a PivotTable describing the scenarios)
• Select the results cells to display in the report• Click the OK button
New Perspectives on Microsoft Office Excel 2007 18
XPXPCreating a Scenario Summary Report
New Perspectives on Microsoft Office Excel 2007 19

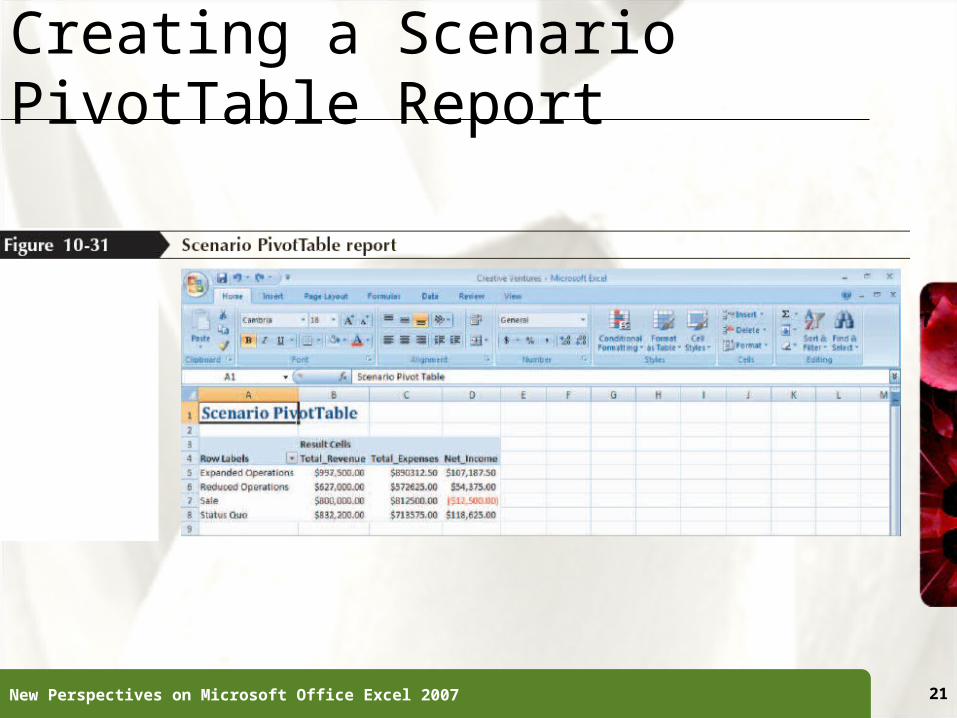
XPXPCreating a Scenario PivotTable Report• A Scenario PivotTable report displays the results
from each scenario as a pivot field in a PivotTable• In the Data Tools group on the Data tab, click the
What-If Analysis button, and then click Scenario Manager
• Click the Summary button, and then click the Scenario PivotTable report option button
• Click the OK button
New Perspectives on Microsoft Office Excel 2007 20
XPXPCreating a Scenario PivotTable Report
New Perspectives on Microsoft Office Excel 2007 21
XPXPUnderstanding Price Elasticity of Demand
New Perspectives on Microsoft Office Excel 2007 22

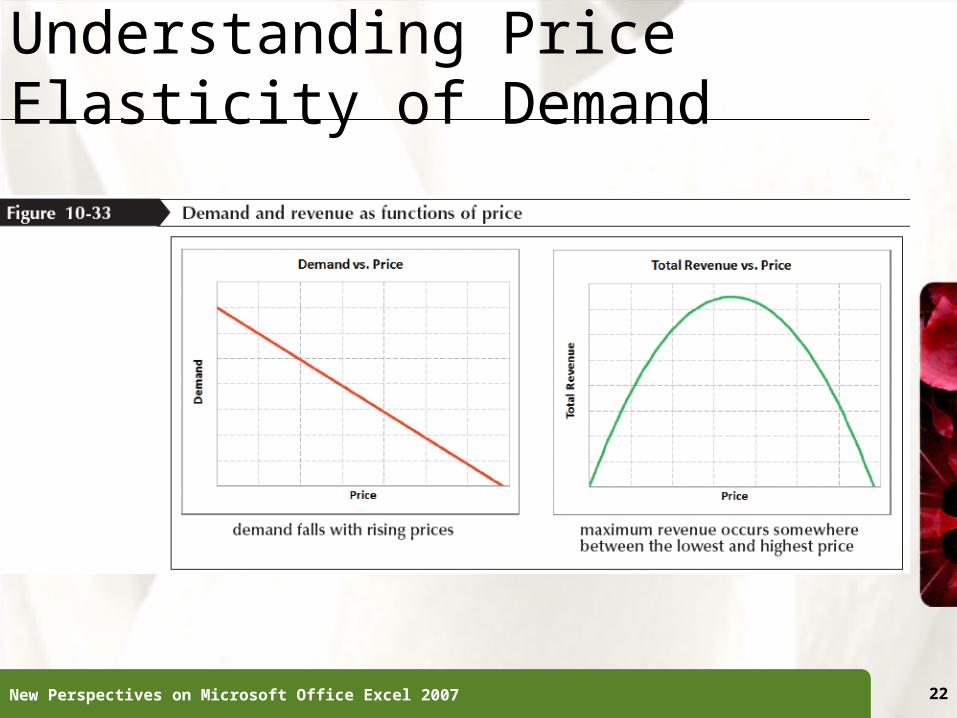
XPXPUnderstanding Price Elasticity of Demand• The effect that price has on demand is called the
price elasticity of demand– Relatively inelastic– Perfectly inelastic– Relatively elastic– Perfectly elastic– Unit elastic
New Perspectives on Microsoft Office Excel 2007 23
XPXPFinding an Optimal Solution Using Solver• Solver is a program that searches for the optimal solution of a
problem involving several variables• Check whether Solver is already installed and activated. If it is,
Solver will appear in Analysis group on the Data tab• Click the Office Button, and then click the Excel Options button• Click Add-Ins in the left pane, and then click the arrow next to the
Manage box and click Excel Add-ins• Click the Go button to open the Add-Ins dialog box• Click the Solver Add-in check box, and then click the OK button.
Follow the remaining prompts to install Solver, if it is not already installed
New Perspectives on Microsoft Office Excel 2007 24
XPXPSetting Solver Parameters• In the Analysis group on the Data tab, click the
Solver button• In the Set Target Cell box, specify the target cell• Click the Max, Min, or Value of option buttons to
maximize, minimize, or set the target cell to a specified value
• In the By Changing Cells input box, specify the changing cells
New Perspectives on Microsoft Office Excel 2007 25
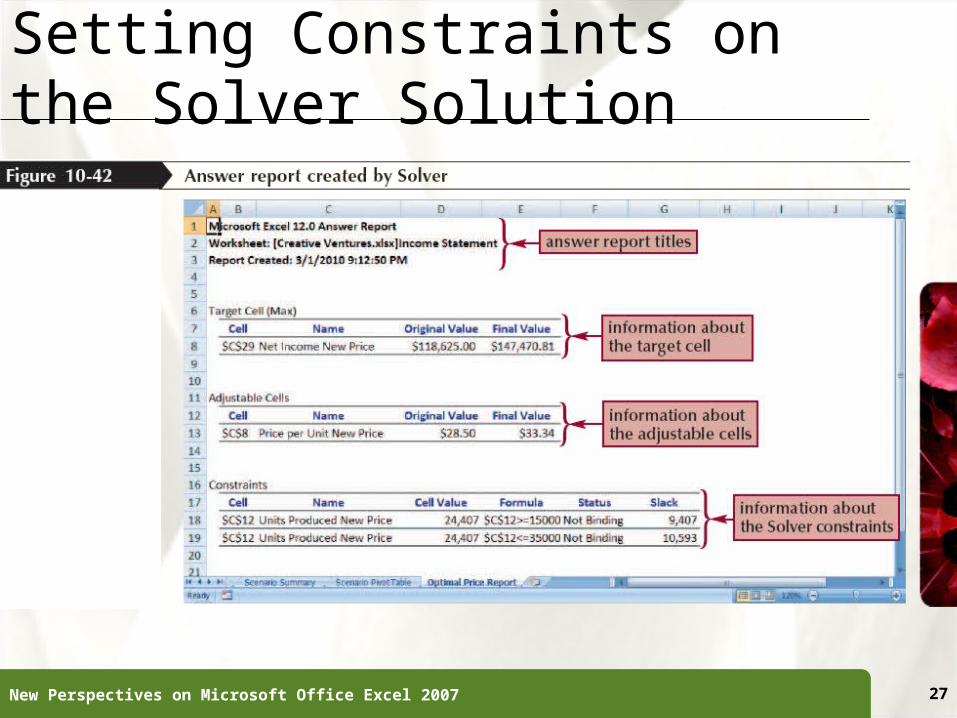
XPXPSetting Constraints on the Solver Solution• In the Solver Parameters dialog box, click the Add
button• Enter the cell reference of the cell or cells containing the
constraint• Specify the nature of the constraint (<=, =, >=, int, or
bin)• Enter the constraint value in the Constraint box• Click the OK button to add the constraint and return to
the Solver dialog box• Repeat for each constraint you want to add
New Perspectives on Microsoft Office Excel 2007 26
XPXPSetting Constraints on the Solver Solution
New Perspectives on Microsoft Office Excel 2007 27
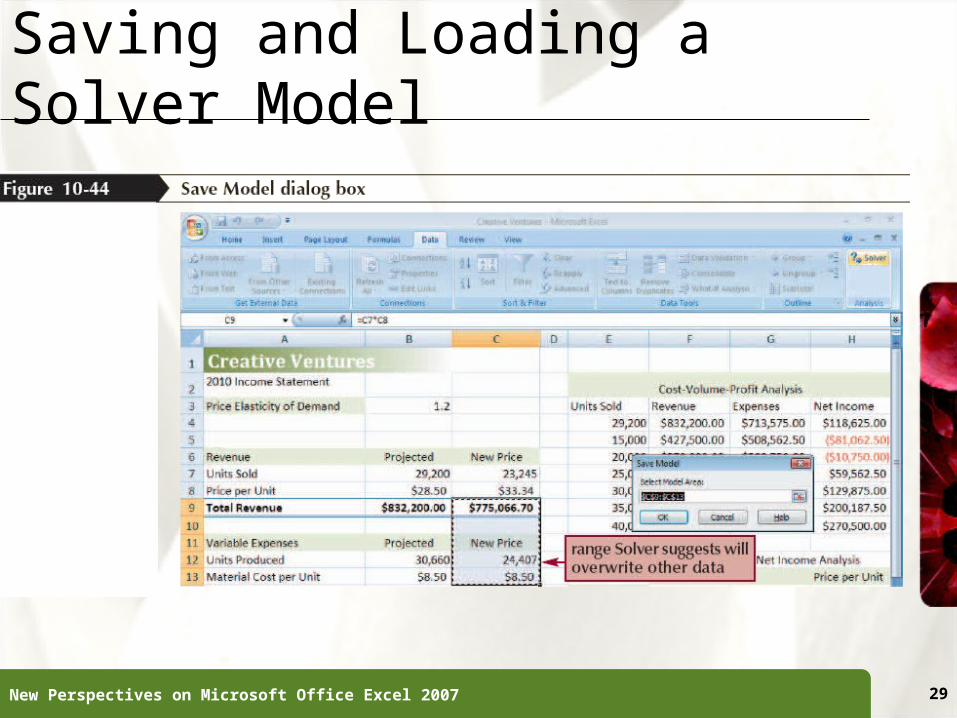
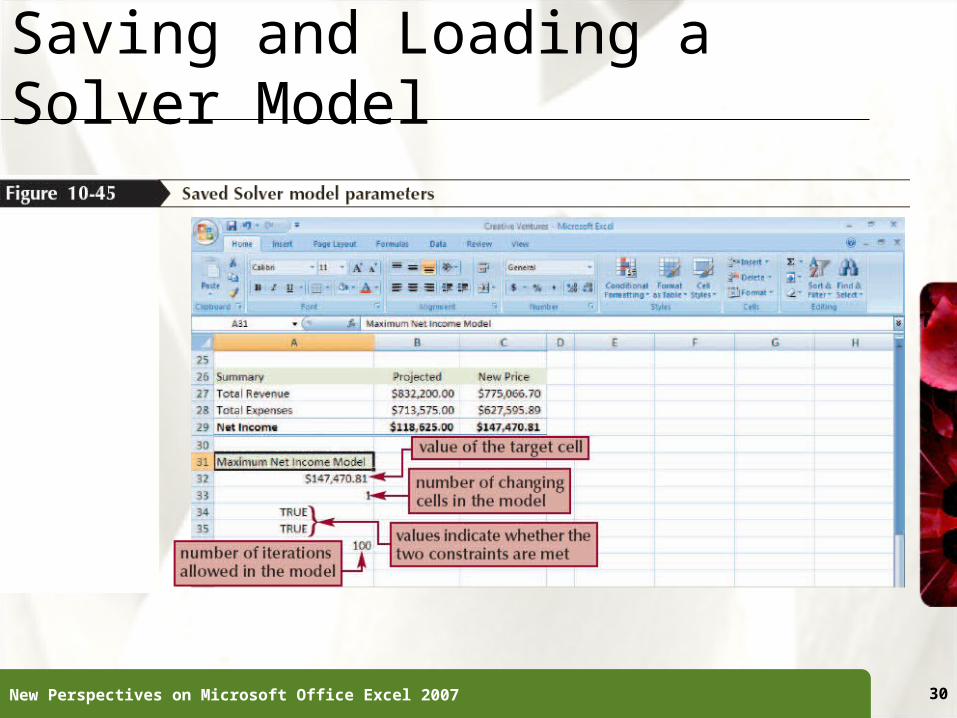
XPXPSaving and Loading a Solver Model• To save a Solver model:– Open the Solver dialog box– Click the Options button and then click the Save Model button– Select the range to contain the parameters of the Solver
model, and then click the OK button
• To load a Solver model:– Open the Solver dialog box– Click the Options button and then click the Load Model button– Select the range within the current worksheet containing the
Solver parameters, and then click the OK button
New Perspectives on Microsoft Office Excel 2007 28
XPXPSaving and Loading a Solver Model
New Perspectives on Microsoft Office Excel 2007 29
XPXPSaving and Loading a Solver Model
New Perspectives on Microsoft Office Excel 2007 30


![Final Presentation 07 - Pennsylvania State University€¦ · [PRESENTATION OUTLINE] Project Overview Introduction to Analyses Arena Stage Occupancy Type: Performing Arts Center Size:](https://img.pdfslide.us/doc/110x75/5ed3505a04a6033a2f091410/final-presentation-07-pennsylvania-state-university-presentation-outline-project.jpg)